Embed Size (px)
Citation preview

This journal is c the Owner Societies 2013 Phys. Chem. Chem. Phys., 2013, 15, 8583--8588 8583
Cite this: Phys. Chem.Chem.Phys.,2013,15, 8583
Pair distribution function (PDF) analysis of mesoporousa-Fe2O3 and Cr2O3†
Adrian H. Hillz*a and Mattia Allietayb
We have measured atomic pair distribution functions of novel mesoporous metal oxides, a-Fe2O3 and
Cr2O3. These have an ordered pore mosaic as well as crystalline structure within the pore walls, making
them an interesting class of materials to characterise. Comparison of ‘‘bulk’’ and mesoporous data sets
has allowed an estimate of long range structural coherence to be derived; E125 Å and E290 Å for
a-Fe2O3 and Cr2O3 respectively. Further ‘‘box-car’’ analysis has shown that above E40 Å both
mesoporous samples deviate greatly from their bulk counterparts. This is attributed to the pores of the
mesoporous structure creating voids in the pair-correlations, disrupting long range order.
1 Introduction
Ordered mesoporous transition metal oxides with highly crys-talline walls have generated a wide range of research interestinto potential applications, e.g. solar energy harvesting, energystorage, and heterogeneous catalysis.1–4 Recent studies showthat the crystallinity of mesoporous metal oxides has signifi-cant impact on their magnetic or electrochemical properties.Therefore, structural characterisation is a critical step toexplore the properties of mesoporous transition metal oxides.Depending upon the nature of the pore network present, theoverall structure of these materials can be very exotic, leading todifficulties in structural analysis. Typical structural characteri-sation techniques allow us to determine surface areas and poresizes (BET and BJH analysis of physisorption studies), porousnetwork unit cell sizes (small angle X-ray scattering), localcrystallographic structure within pore walls (selected areaelectron diffraction), and an average long-range crystallographicstructure (if crystalline) across many porous network unit cells(wide angle X-ray diffraction). The information acquired fromthese analysis techniques gives us a basic understanding of howthe material functions at both atomic and meso scales, howeverfurther information on what is going on in the material in therange between local and long range structure is essential to
furthering our knowledge of what makes a useful mesoporousmaterial and how it interacts as a guest to host species.
Diffraction patterns of crystalline mesoporous structures, as ofnano-materials, generally show broadened peaks and a high back-ground due to diffuse scattering. In conventional powder diffractionanalysis, such as the Rietveld method, only the Bragg reflections areconsidered and an arbitrary background function is applied toimprove the match between the observed and calculated profiles.In this context, only the average structural information can beobtained as well as some guesstimate from the broadening of thepeaks to relative particle sizes and/or correlation lengths.
To study further the mid and local range ordering in thesematerials it is essential to look at the information that is actuallypresent in the diffuse scattering visually hidden in many cases bythe excessive peak broadening and complex background modula-tion. Total scattering methods, such as the pair distribution func-tion (PDF), have been successfully applied to analyse the diffusescattering from nanomaterials5 as well as from domains and defectstructure in crystalline functional materials.6 The PDF methodallows the analysis of the Bragg and diffuse scattering simulta-neously, providing structural information at different spatial scales.In this context, the structure of the material is studied in terms ofthe distances between atoms, and since no periodicity is assumed,both the long range structure and the local deviations with respectto this average structure can be explored. In this paper, we presentPDF analyses of two crystalline mesoporous sesquioxides, a-Fe2O3
(hematite) and Cr2O3 (eskolaite). These materials have previouslybeen extensively studied by a wide variety of techniques andreported in earlier publications.7–11 However, one of the key ques-tions not answered satisfactorily is: how does the imposition ofmesoporous structure alter the long range crystallographic (andconsequently magnetic) properties? Estimates of structural
a European Synchrotron Radiation Facility, 6 rue Jules Horowitz, BP 220,
Grenoble Cedex 9, France. E-mail: [email protected] Dip. Chimica Fisica ed Elettrochimica, Universita degli studi di Milano,
v. C. Golgi, 19, 20133 Milano, Italy. E-mail: [email protected]
† Electronic supplementary information (ESI) available: Rietveld refinements.See DOI: 10.1039/c3cp44322a‡ Present address: Johnson Matthey Technology Centre, Savannah, GA, USA.§ Present address: Specialchimica s.a.s, Merate, Lecco, Italy.
Received 3rd December 2012,Accepted 16th April 2013
DOI: 10.1039/c3cp44322a
www.rsc.org/pccp
PCCP
PAPER
Publ
ishe
d on
17
Apr
il 20
13. D
ownl
oade
d by
Bro
wn
Uni
vers
ity o
n 28
/10/
2014
03:
46:3
8.
View Article OnlineView Journal | View Issue

8584 Phys. Chem. Chem. Phys., 2013, 15, 8583--8588 This journal is c the Owner Societies 2013
coherence lengths have been limited to approximations usingreciprocal space method, such as the Scherrer equation, which haswell documented caveats and limitations. Here, we show (withcomparison to ‘‘bulk’’ material) that the PDF technique is able toprovide information on the coherence lengths in mesoporousmaterials revealing details far beyond the structural correlationsprobed by conventional XRD. This is achieved by projecting the‘‘bulk’’ reference data onto the mesoporous data with advancedmanipulating software, and minimising the differences betweenthem, yielding information on the nature of the mesoporousmaterial. In addition, we can study differences between the ‘‘bulk’’and mesoporous samples over specific real-space ranges, probingthe nature of the materials when the presence of voids betweenatom pairs due to the mesoporous structure can be considered.These disruptions alter the long range order at higher values ofinteratomic distances and provide an explanation to observedlimited structural coherence.
1.1 Materials
Both mesoporous heamtite and eskolaite were prepared by usingKIT-6, a hard mesoporous silica12 as a templating agent forinfused TM(NO3)3�9H2O (TM = Fe or Cr). After infusion, the targetoxides were obtained by simple thermal decomposition of thenitrates followed by dissolution of the host silica template ineither NaOH or HF, effectively using the pore structure of the KIT-6 as a template for the wall structure of the mesoporous metaloxide (an inverse mesoprous material). Both the iron8 and chro-mium9 oxides (Fig. 1) exhibit mesoporous properties with longrange crystallographic and magnetic order confirmed by neutronpowder diffraction.10,11 Non-porous ‘‘bulk’’ counterparts obtainedcommercially were also used as direct comparisons in this study.
2 Experimental
All data were collected on the high resolution powder diffractionbeamline ID31 at the European Synchrotron Radiation Facility(ESRF). ID31 is a highly suitable instrument for PDF analysis asthe use of analyser crystals before the detectors greatly reduces thebackground signal, enabling patterns with high signal-to-noise andsignal-to-background ratios to be achieved. For reliable PDFanaylsis it is necessary to collect data over as large a reciprocal
space (Q) as possible, therefore moderately hard incident X-rayenergies/low wavelengths were used (l = 0.35422(2) Å for a-Fe2O3
and l = 0.39998(5) Å for Cr2O3), compressing Q over a smaller 2yrange. Data collection involed scanning at higher 2y values forlonger to account for the X-ray form factors of the elements present.Samples were held in 0.9 mm borosilicate capillaries and rotatedon the axis of the diffractometer to reduce any preferred orientationeffects. All measurements were carried out at room temperature.
2.1 Data reduction
As both the mesoporous samples are crystalline, Rietveld and PDFanalysis were performed to compare refined crystallographic para-meters between the two methods. For the Rietveld analysis datawere binned in steps of 0.0031 2y. Rietveld analyses were performedusing TOPAS 4.2 from Bruxer AXS. For total scattering analysis, datawere initially binned in steps of 0.011 2y and then processed usingthe PDFgetX2 program14 to obtain the S(Q) and G(r) profiles. Specificcorrections to the data were as follows: to get I coh(Q) the raw I(Q)data were smoothed to improve the signal-to-noise ratio especially athigh Q and corrected for background scattering, attenuation in thesample, multiple and Compton scattering. At high Q the Comptonscattering was removed by calculating the Compton profile with ananalytical formula while in the middle-low Q region the Comptonscattering correction was applied by multiplying the calculatedCompton profile with a detector window cut-off function. Thecorrected I coh(Q) were converted to total scattering function S(Q)according to relation in eqn (1). G(r) functions were obtained fromS(Q) via a sine Fourier transformation (eqn (2)), where r is theinteratomic distance and Qmax the reciprocal space cut-off. The totalreduced structure factors, S(Q) of the a-Fe2O3 samples are shown inFig. 2. Reciprocal space cut-offs of Q = 26 �1 and Q = 25 �1 wereused for the a-Fe2O3 and Cr2O3 reductions respectively.
SðQÞ � 1 ¼I coh � f 2ðQÞ
� �h f ðQÞi2
(1)
GðrÞ ¼ 2
p
Z Qmax
Q¼0Q½SðQÞ � 1� sinðQrÞdQ (2)
Fig. 1 Transmission electron micrograph (a) and high resolution transmissionelectron micrograph (b) of the mesoporous Cr2O3.13 The scale bars are 20 nm and5 nm respectively.
Fig. 2 Total reduced structure factor for the a-Fe2O3 samples, showing the bulk(upper) and mesoporous (lower) data. The bulk data have been offset on theordinate for clarity.
Paper PCCP
Publ
ishe
d on
17
Apr
il 20
13. D
ownl
oade
d by
Bro
wn
Uni
vers
ity o
n 28
/10/
2014
03:
46:3
8.
View Article Online

This journal is c the Owner Societies 2013 Phys. Chem. Chem. Phys., 2013, 15, 8583--8588 8585
Once suitable G(r) profiles were achieved they were usedto refine real-space models against, using the PDFfit2 enginein the PDFgui program.15 The program assesses the degreeof accuracy of the refinement by the following agreementfactor:
Rw ¼P
wi Gexpi � G calc
i
� �2Pwi G
expið Þ2
" #0:5(3)
3 Results and discussion3.1 Rietveld refinement
Both the bulk and mesoporous a-Fe2O3 and Cr2O3 data wereused to refine models against using the rhombohedral spacegroup R%3c (hexagonal axes). Refined crystallographic para-meters are shown in Table 1.16 Plots of the Rietveld fits areavailable in the ESI† (Fig. S1).
3.2 Mesoporous structure coherence
In Fig. 3 we compare the PDF for the bulk and the mesopourosmaterials of a-Fe2O3 and Cr2O3 respectively. In the PDF, eachpositive G(r) peak gives the probability of finding two atomsseparated by a distance r averaged over all pairs of atoms in thesample, i.e. atomic coordination sphere. As in the bulk sample,the mesoporous PDF shows sharp peaks but the intensity ofG(r) decays to zero much more rapidly with increasing r. This isconsistent with the limited length of structural coherence (LSC)in the mesoporous sample. An estimation of LSC can becalculated by assuming that the LSC is due, e.g., to nanometricparticle size or local structural disorder, giving rise to a decay ofthe G(r) function. In this context, we decided to further studythe differences between the bulk and mesoporous PDFs bymanipulating the bulk PDF data to match the mesoporous datathrough the PDFmorph program.17
Within the program we have set Qdamp = 0.01 �1 to accountfor the Q-resolution of ID31 and allowed a radius functionto refine. This radius simulates PDF dampening due to LSC(e.g. caused by spherical size effects), with units as the inputabscissa. The manipulation attenuates the bulk PDF (eqn (4))with a spherical envelope function (eqn (5), as defined byMasadeh et al.18), effectively dampening the PDF, and providinga diameter, d.
G(r,d)s = G(r) f (r,d) (4)
f ðr; dÞ ¼ 1� 3r
2dþ 1
2
r
d
� �3� Yðd � rÞ (5)
Although we know the mesoporous structure is not sphericalthis still gives us an estimate of the average LSC in themesoporous samples and is a first attempt at understanding
Table 1 Refined parameters from Rietveld analysis. R factors are not back-ground corrected
Bulk a-Fe2O3 Meso a-Fe2O3 Bulk Cr2O3 Meso Cr2O3
a/Å 5.03795(7) 5.03712(14) 4.96119(1) 4.96038(4)c/Å 13.7664(2) 13.7671(4) 13.59956(3) 13.60082(13)V/Å3 302.593(10) 302.508(19) 289.8862(10) 289.819(5)z (Fe,Cr) 0.35520(1) 0.35501(2) 0.34740(1) 0.34706(2)x (O) 0.30946(14) 0.30793(18) 0.30594(10) 0.30891(18)Uiso (TM)/Å2 0.00297(3) 0.00417(5) 0.002392(14) 0.00254(3)Uiso (O)/Å2 0.00295(13) 0.00300(18) 0.00311(6) 0.00295(12)Rp/% 4.964 5.173 6.705 9.039Rwp/% 6.606 6.579 8.353 9.570Rexp/% 4.411 5.439 5.766 5.876w2 1.498 1.210 1.449 1.629
Fig. 3 Manipulation of the bulk PDF data (green line) to match (red line) the mesoporous PDF (blue circles) for (a) a-Fe2O3 and (b) Cr2O3. The difference between themanipulated bulk data and the mesoporous data is shown below (magenta line). The manipulations carried out are described in the text.
PCCP Paper
Publ
ishe
d on
17
Apr
il 20
13. D
ownl
oade
d by
Bro
wn
Uni
vers
ity o
n 28
/10/
2014
03:
46:3
8.
View Article Online

8586 Phys. Chem. Chem. Phys., 2013, 15, 8583--8588 This journal is c the Owner Societies 2013
how the morphology of the mesoporous structure alters thePDF. The resulting manipulations (Fig. 3) give an average LSCof E125 Å and E290 Å for a-Fe2O3 and Cr2O3 respectively. Anattempt at measuring the crystallographic correlation length inthe mesoporous a-Fe2O3 sample, derived from integral peakbreadths using neutron powder diffraction measurements wascalculated to be E150 Å.10 Bearing in mind the limitations ofthe models used in both cases, the agreement between the twotechniques is entirely satisfactory.
The differences in the calculated LSCs between the meso-porous a-Fe2O3 and Cr2O3 can possibly be explained by thenature of the wall structure in the materials. The originalmesoporous templating agent (KIT-6) consists of two indepen-dent pore networks (bimodal pore structure). During the syn-thesis of the mesoporous metal oxides, it is possible for onlyone pore network to be filled, giving rise to a lower surface areaand larger pore size.19 This is the particular case of themesoporous Cr2O3 sample,9 whereas both networks were filledin the case of a-Fe2O3.8 For the single network filled Cr2O3, thewalls within a crystallite of the porous material are structurallycoherent, whereas for a-Fe2O3 the two independent filled net-works are not necessarily coherent with each-other. This wouldreduce the structural coherence in the a-Fe2O3 sample com-pared to the sample.
3.3 G(r) modelling
For the G(r) analysis of the bulk and mesoporous samples,crystallographic values refined using the Rietveld method wereused as starting models in PDFgui. Fig. 4 shows the G(r) relatedto bulk and mesoporous a-Fe2O3 samples in the 1.2 Å r r r 30 Årange as an example. Second fits were performed by contractingthe average model to real space range 1.2 Å r r r 6 Å. By usingthe average rhombohedral model we refined the G(r) and in
Tables 2 and 3 we report the refined structural parameters forthe two r regimes. Moreover, to exclude the contribution of otherphases to G(r) functions, combinations of the main phase andother iron–chromium phases were modeled in PDFgui. Noimprovement of fits were observed. Good agreement betweenthe Rietveld refinement and PDF results are generally obtainedfor both a-Fe2O3 and Cr2O3 samples indicating that theaverage structure describes very well the mesoporous materialsup to E30 Å.
Conversely, as shown in Fig. 5, by taking the difference ofthe observed PDFs (G(r)bulk � G(r)meso) in a very large r range,1.2 Å r r r 100 Å, the quality of agreement between the PDFsrapidly decreases suggesting that the bulk and mesoporousPDFs are similar only up to a given r value.
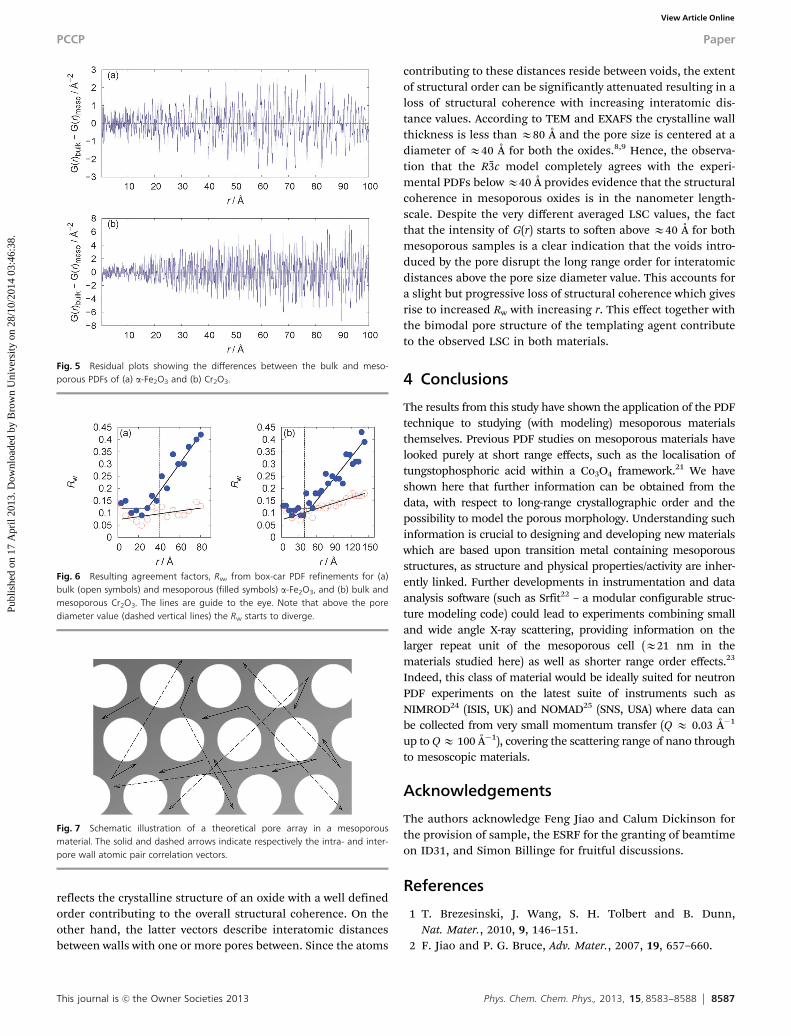
To analyse further this feature, we performed ‘‘box-cars’’PDF refinements over 5 Å ranges by shifting the refinementcentroid to higher r in 5 Å steps in selected r range. In Fig. 6, theresulting Rw’s from the box-car refinements are plotted as afunction of r for bulk and mesoporous a-Fe2O3 and Cr2O3. Forbulk samples the Rw factor smoothly increases with increasingr because of the fall-off in G(r) intensity.20 Conversely formesoporous samples the Rw rapidly increases as the box movesabove 40 Å. In particular, at high values of interatomic dis-tances, the G(r) intensity is progressive damped, and withincreasing r the PDF peaks are smeared out in a length scalewell below the estimated LSC for mesoporous a-Fe2O3 andCr2O3. This could be due to the nature of different interatomicvector types present in the mesoporous oxides.
Fig. 7 shows a schematic illustration of a theoretical porearray in a mesopouous material where two types of interatomicvectors are reported: the intra-wall and the inter-wall vectors.The former type of vector is defined within the pore wall and
Fig. 4 Observed (points) and calculated (continuous line) pair distributionfunctions obtained for bulk (a) and mesoporous (b) a-Fe2O3. The residual plotsare also shown offset below.
Table 2 Refined parameters from the PDF fit to the a-Fe2O3 samples using ashort and long r range
1.2 Å r r r 30 Å 1.2 Å r r r 6 Å
Bulk Meso Bulk Meso
a/Å 5.03680(6) 5.0365(1) 5.0414(7) 5.042(1)c/Å 13.7626(3) 13.7614(6) 13.81(6) 13.72(1)z (Fe) 0.3552(1) 0.3557(3) 0.35583(5) 0.35657(7)x (O) 0.3052(1) 0.3046(3) 0.3086(2) 0.3066(3)Uiso (Fe)/Å2 0.00370(1) 0.00372(2) 0.00451(5) 0.0043(1)Uiso (O)/Å2 0.00928(6) 0.0088(1) 0.0127(3) 0.0061(3)Rw 0.102 0.144 0.130 0.144
Table 3 Refined parameters from the PDF fit to the Cr2O3 samples using a shortand long r range
1.2 Å r r r 30 Å 1.2 Å r r r 6 Å
Bulk Meso Bulk Meso
a/Å 4.9601(1) 4.9586(2) 4.963(2) 4.962(2)c/Å 13.5967(7) 13.5931(7) 13.616(7) 13.604(7)z (Cr) 0.34750(4) 0.34741(4) 0.3469(1) 0.3471(1)x (O) 0.3051(3) 0.3070(3) 0.3073(9) 0.3074(7)Uiso (Cr)/Å2 0.00221(3) 0.00225(3) 0.00188(7) 0.00228(8)Uiso (O)/Å2 0.0071(1) 0.0068(1) 0.0053(3) 0.0055(3)Rw 0.098 0.117 0.120 0.133
Paper PCCP
Publ
ishe
d on
17
Apr
il 20
13. D
ownl
oade
d by
Bro
wn
Uni
vers
ity o
n 28
/10/
2014
03:
46:3
8.
View Article Online
This journal is c the Owner Societies 2013 Phys. Chem. Chem. Phys., 2013, 15, 8583--8588 8587
reflects the crystalline structure of an oxide with a well definedorder contributing to the overall structural coherence. On theother hand, the latter vectors describe interatomic distancesbetween walls with one or more pores between. Since the atoms
contributing to these distances reside between voids, the extentof structural order can be significantly attenuated resulting in aloss of structural coherence with increasing interatomic dis-tance values. According to TEM and EXAFS the crystalline wallthickness is less than E80 Å and the pore size is centered at adiameter of E40 Å for both the oxides.8,9 Hence, the observa-tion that the R%3c model completely agrees with the experi-mental PDFs below E40 Å provides evidence that the structuralcoherence in mesoporous oxides is in the nanometer length-scale. Despite the very different averaged LSC values, the factthat the intensity of G(r) starts to soften above E40 Å for bothmesoporous samples is a clear indication that the voids intro-duced by the pore disrupt the long range order for interatomicdistances above the pore size diameter value. This accounts fora slight but progressive loss of structural coherence which givesrise to increased Rw with increasing r. This effect together withthe bimodal pore structure of the templating agent contributeto the observed LSC in both materials.
4 Conclusions
The results from this study have shown the application of the PDFtechnique to studying (with modeling) mesoporous materialsthemselves. Previous PDF studies on mesoporous materials havelooked purely at short range effects, such as the localisation oftungstophosphoric acid within a Co3O4 framework.21 We haveshown here that further information can be obtained from thedata, with respect to long-range crystallographic order and thepossibility to model the porous morphology. Understanding suchinformation is crucial to designing and developing new materialswhich are based upon transition metal containing mesoporousstructures, as structure and physical properties/activity are inher-ently linked. Further developments in instrumentation and dataanalysis software (such as Srfit22 – a modular configurable struc-ture modeling code) could lead to experiments combining smalland wide angle X-ray scattering, providing information on thelarger repeat unit of the mesoporous cell (E21 nm in thematerials studied here) as well as shorter range order effects.23
Indeed, this class of material would be ideally suited for neutronPDF experiments on the latest suite of instruments such asNIMROD24 (ISIS, UK) and NOMAD25 (SNS, USA) where data canbe collected from very small momentum transfer (Q E 0.03 �1
up to Q E 100 �1), covering the scattering range of nano throughto mesoscopic materials.
Acknowledgements
The authors acknowledge Feng Jiao and Calum Dickinson forthe provision of sample, the ESRF for the granting of beamtimeon ID31, and Simon Billinge for fruitful discussions.
References
1 T. Brezesinski, J. Wang, S. H. Tolbert and B. Dunn,Nat. Mater., 2010, 9, 146–151.
2 F. Jiao and P. G. Bruce, Adv. Mater., 2007, 19, 657–660.
Fig. 5 Residual plots showing the differences between the bulk and meso-porous PDFs of (a) a-Fe2O3 and (b) Cr2O3.
Fig. 6 Resulting agreement factors, Rw, from box-car PDF refinements for (a)bulk (open symbols) and mesoporous (filled symbols) a-Fe2O3, and (b) bulk andmesoporous Cr2O3. The lines are guide to the eye. Note that above the porediameter value (dashed vertical lines) the Rw starts to diverge.
Fig. 7 Schematic illustration of a theoretical pore array in a mesoporousmaterial. The solid and dashed arrows indicate respectively the intra- and inter-pore wall atomic pair correlation vectors.
PCCP Paper
Publ
ishe
d on
17
Apr
il 20
13. D
ownl
oade
d by
Bro
wn
Uni
vers
ity o
n 28
/10/
2014
03:
46:3
8.
View Article Online

8588 Phys. Chem. Chem. Phys., 2013, 15, 8583--8588 This journal is c the Owner Societies 2013
3 Y. Ren, Z. Ma, L. Qian, S. Dai, H. He and P. G. Bruce, Catal.Lett., 2009, 131, 146–154.
4 K. Sivula, R. Zboril, F. Le Formal, R. Robert, A. Weidenkaff,J. Tucek, J. Frydrych and M. Gratzel, J. Am. Chem. Soc., 2010,132, 7436–7444.
5 S. J. L. Billinge, Z. Kristallogr., 2004, 219, 117–121.6 T. Egami and S. J. L. Billinge, Underneath the Bragg peaks.
Structural analysis of complex materials, Pergamon Press,Amsterdam, The Netherlands, 2003.
7 K. Jiao, B. Zhang, B. Yue, Y. Ren, S. Liu, S. Yan,C. Dickinson, W. Zhou and H. He, Chem. Commun., 2005,5618.
8 F. Jiao, A. Harrison, J. C. Jumas, A. V. Chadwick,W. Kockelmann and P. G. Bruce, J. Am. Chem. Soc., 2006,128, 5468–5474.
9 C. Dickinson, W. Z. Zhou, R. P. Hodgkins, Y. F. Shi,D. Y. Zhao and H. Y. He, Chem. Mater., 2006, 18, 3088–3095.
10 A. H. Hill, F. Jiao, P. G. Bruce, A. Harrison, W. Kockelmannand C. Ritter, Chem. Mater., 2008, 20, 4891–4899.
11 A. H. Hill, A. Harrison, C. Dickinson, W. Z. Zhou andW. Kockelmann, Microporous Mesoporous Mater., 2010,130, 280–286.
12 F. Kleitz, S. H. Choi and R. Ryoo, Chem. Commun., 2003,2136–2137.
13 Reprinted from Microporous and Mesoporous Materials, 130,Hill et al., Crystallographic and magnetic studies of meso-porous eskolaite, Cr2O3, 280–286, Copyright (2010), withpermission from Elsevier.
14 X. Qiu, J. W. Thompson and S. J. L. Billinge, J. Appl. Crystal-logr., 2004, 37, 678.
15 C. L. Farrow, P. Juhas, J. W. Liu, D. Bryndin, E. S. Bozin,J. Bloch, T. Proffen and S. J. L. Billinge, J. Phys.: Condens.Matter, 2007, 19, 335219.
16 Rietveld analysis performed for the range 3.51 r 2y r 901and 31 r 2y r 1301 for a-Fe2O3 and Cr2O3 respectivelyusing a linear 3 point background convoluted with apseudo-Voigt function to model a low angle backgroundhump in the diffraction pattern. A small zero point errorwas refined. The peak shape was refined using a full Voigtfunction, with a refined axial divergence. Refined crystallo-graphic parameters were a, c, Fe(Cr) z (Wykoff c), O x(Wykoff a), and isotropic temperature parameters for thetwo sites (beq = 8p2Uiso).
17 P. Juhas, C. L. Farrow, J. W. Liu, D. Bryndin, E. S. Bozin,W. Zhou and S. J. L. Billinge, DiffPy library – Python packagesfor diffraction analysis, To be published.
18 A. S. Masadeh, E. S. Bozin, C. L. Farrow, G. Paglia,P. Juhas, S. J. L. Billinge, A. Karkamkar and M. G.Kanatzidis, Phys. Rev. B: Condens. Matter Mater. Phys.,2007, 76, 115413.
19 F. Jiao, A. H. Hill, A. Harrison, A. Berko, A. V. Chadwick andP. G. Bruce, J. Am. Chem. Soc., 2008, 130, 5262–5266.
20 X. Qiu, E. S. Bozin, P. Juhas, T. Proffen and S. J. L. Billinge,J. Appl. Crystallogr., 2004, 37, 110–116.
21 G. S. Armatas, A. P. Katsoulidis, D. E. Petrakis, P. J. Pomonisand M. G. Kanatzidis, Chem. Mater., 2010, 22, 5739–5746.
22 http://www.diffpy.org/doc/srfit/intro.html.23 P. J. Chupas, K. W. Chapman, H. Chen and C. P. Grey, Catal.
Today, 2009, 145, 213–219.24 D. T. Bowron, A. K. Soper, K. Jones, S. Ansell, S. Birch,
J. Norris, L. Perrott, D. Riedel, N. J. Rhodes, S. R. Wakefield,A. Botti, M.-A. Ricci, F. Grazzi and M. Zoppi, Rev. Sci.Intstrum., 2010, 81, 033905.
25 J. Neuefeind, M. Feygenson, J. Carruth, R. Hoffmann andK. K. Chipley, Nucl. Instrum. Methods Phys. Res., Sect. B,2012, 287, 68–75.
Paper PCCP
Publ
ishe
d on
17
Apr
il 20
13. D
ownl
oade
d by
Bro
wn
Uni
vers
ity o
n 28
/10/
2014
03:
46:3
8.
View Article Online


![FULL PAPER Mn .... Mater. Pellicer 2013.pdf · mesoporous oxides (e.g., TM-oxides) also show ferromagnetic or ferrimagnetic behavior at room temperature. [11 ] Nanocasting of Mesoporous](https://img.pdfslide.tips/doc/110x75/5f07e58e7e708231d41f4d20/full-paper-mn-mater-pellicer-2013pdf-mesoporous-oxides-eg-tm-oxides.jpg)