Embed Size (px)
Citation preview
Paper ID SP0878
Uppaal Stratego for Intelligent Traffic Lights ?
Andreas Berre Eriksen1, Chao Huang1, Jan Kildebogaard2, Harry Lahrmann3,Kim G. Larsen1, Marco Muniz1, and Jakob Haahr Taankvist1
1 {andreasb,chaohuang,kgl,muniz,jht}@cs.aau.dk, Aalborg University2 [email protected], AF Infrastructure Planning A/S
3 [email protected], Aalborg University
12th ITS European Congress, Strasbourg, France, 19-22 June 2017
Abstract. Modern traffic lights use information from induction loops and to some extend radarinformation. Recent developments in radar technology has made it possible to obtain more detailedinformation relevant to the control mechanism of the traffic light. Unfortunately much of the currentcontrollers do not profit from this additional information. Using this information could minimizewaiting times and energy waste.
Uppaal Stratego is a tool that combines machine learning and model checking techniques tosynthesize near optimal control strategies. The tool has been applied successfully to several casestudies e.g. battery optimization in satellites, safe and optimal cruise control and optimal floorheating controlling.
In this work we use Uppaal Stratego as an on-line controller for a signalised intersection. Ourcontroller reads the current data from the radar sensors and effectively uses it to learn a near optimalcontroller at each control step. Our experiments report considerable reduction in the waiting times.
Keywords: traffic lights, model checking, machine learning, optimization.
1 Introduction
Traditionally, traffic signal control strategies are based on loop detectors embedded in the roadsurface. The loop detectors give a precise location of vehicles passing or occupying the loops,but the prediction of the vehicle dynamics is limited by the detector locations.
The corresponding control strategies are discrete event-based with incremental extensions ofgreen times supplemented with a number of specific decision rules. Despite the development ofnew computer based signal controllers there has been little development in the field of controlstrategies. With the most recent development in radar detection systems, radar detectors arefeasible for road traffic detection. One radar detector, placed appropriately, can replace allthe detector loops in one intersection approach. It can monitor the approach continuously andgive a full account of all vehicles approaching the junction. This would allow for a continuousmodelling of traffic into the junction and for a control approach based on realistic vehicle arrivalprediction.
The Danish Congestion Commission calls in its recent report [8] for improved traffic signalcontrol in order to reduce congestion, travel time and energy consumption. This project hasbeen formulated to contribute to a more efficient utilisation of the existing infrastructure byimproving traffic signal control.
? This work was supported by the Danish center for Data-Intensive Cyber-Physical Systems (DiCyPS)http://www.dicyps.dk

2 Uppaal Stratego for Intelligent Traffic Lights
Aim The aim of this paper is to improve traffic management and control in order to reducecongestion, energy consumption and CO2 emissions. In this paper specifically to develop anefficient traffic signal control strategy that takes advantage of the continuous traffic monitoringmade available by radar detectors. The purpose of the strategy is to optimize the total trafficflow in the junction, i.e. to reduce the total delay and queue length.
In fact, the method and tool we use for synthesizing control strategies allows for makingtrade-off between these various optimization criteria.
2 Preliminaies
2.1 Uppaal Stratego
Uppaal Stratego [2,3] is a branch of the Uppaal [1] family of software tools. Uppaal Strat-ego can be used to learn strategies for complex systems, in this case controlling the lights in acrossing. In Fig. 1 we see an example of a Uppaal Stratego model, a Timed Game Automata.We model a car approaching a town, the driver can choose to go around the town or throughit. In the town there is a signal controlled crossing. If the driver is lucky the light will be green,and if he is unlucky the light will be red.
In the model the circles denote states and the arrows denote transitions between the states.In the first state Start the driver can choose weather to go through the town or around it.As the driver makes this choice the transitions are solid arrows. If he chooses to go around thetown the time it will take will be chosen from a uniform distribution between 20 and 25, thedriver cannot affect this, thus the transitions are dashed. If the driver chooses to go throughthe town there is p chance that the lights are green and 1− p chance they will be red. We thensee in the model that the time to reach Goal are again chosen from uniform distributions; 5 to10 for Green and 15 to 60 for Red.
Clearly the drivers choice depends on the value of p, we will consider p1 = 34 and p2 = 1
4 .If we let the driver choose uniformly random we can use Uppaal Stratego to estimate theexpected time to reach Goal. For p1 this is 18.8 and for p2 it is 26.3. However the driver shouldnot choose randomly, we therefore use Uppaal Stratego to learn a strategy which minimizesthe time to reach Goal. For the scenario with p1 Uppaal Stratego learns to go through thetown as the probability of green is high, this leads to an expected time to Goal of 15.0. Onthe other hand if we have p2 Uppaal Stratego learns to go around the town leading to anexpected time to Goal of 22.5.
Fig. 1: Example of Uppaal Stratego model, a Timed Game Automata, modeling a car passing a town.
The example in Fig. 1 is quite simple, and it is easy to compute the optimal strategy man-ually. However with more states and more decisions to be made it quickly becomes impossible

Uppaal Stratego for Intelligent Traffic Lights 3
manually to compute a strategy. It is then possible to use Uppaal Stratego to learn oneinstead.
Uppaal Stratego has already been used for several case studies. In one case study it wasused to learn a controller for adaptive cruise control [7]. In the case study there was two cars,the front car controlled by the environment and the ego car controlled by the controller. Wehere used another feature of Uppaal Stratego to find the set of actions which were safe inthe sense that it would be impossible to hit the other car no matter how the other car drove.After doing that we learned a strategy which made ego stay as close as possible to the frontcar, but without ever crashing into it.
In another case study Uppaal Stratego was used to learn strategies for controlling thefloor heating in a real house [6]. Several techniques were developed to be able to deal with thecomplexity of a real house. The project resulted in an up to almost 60% improvement in thedistance from the target temperatures. For this case study a full tool chain all the way fromUppaal Stratego to the relays in the house has been build, enabling Uppaal Stratego tocontrol the physical floor heating system in the house.
2.2 Simulation of Urban MObility - SUMO
SUMO [4] is an open source tool which allows to model and simulate traffic systems. It providesa number of supporting tools which allow for visualization, network transformation, waitingtime calculations, traffic light performance, etc. SUMO provides features for modelling a vastnumber of scenarios and possibilities to inter-operate with other tools. There is also a wideactive community which offer support.
In this work we mainly use the following SUMO components. Road networks which allowto model the relevant part of the map, roads lanes and intersections. Vehicles which allowto realisticaly model the traffic demand [5]. Traffic lights which allow to model a signalizedintersection. Induction loops which indicate if a car is on the given detector. Area detectorswhich indicate the number of cars moving or jammed in an area. Area detectors allow us tosimulate radars. Traci a software interface that gives access to objects in the running simulation.We use induction loop and area detector information to improve the control of a given trafficlight. Netconvert which allows to import maps from open street maps. In Section 4, we will useSUMO and the above features to model a real crossing from the Køge municipality in Denmark.
3 Case Study
3.1 Description of the intersection
Figure 2 shows the intersection with the two directions A and B. In direction A there is aseparate left turn lane and a combined lane for right turn and the straight ahead direction. Indirection B there is at combined lane for all three directions. Figure 2 also shows where theloops are placed and the radar area. In direction A crossing loops are placed at distances, 70and 120 meters from the stop line (a crossing loop is a loop which detects when a car hits theline which the loops cover). In direction B there is a crossing loop 70 meters from the stop lineand a 15 meter long presence loop behind the stop line. (a presence loop is a loop that detectswhen there are cars in the area the loop covers)
3.2 Traffic
To make the simulation as simple as possible, we will only consider passenger cars. Figure 3shows the MAX traffic in a one hour (peak hour) scenario. We also have two more scenarios:MID traffic = 60% of traffic in max traffic and LOW traffic = 30% of traffic in max traffic. Thefigures in the Max traffic scenarios are close to the capacity of the intersection and gives with

4 Uppaal Stratego for Intelligent Traffic Lights
Fig. 2: Intersection between Nylandsvej and Værkstedvej at Køge municipality. Layout of loops and radar area.
Fig. 3: Peak hour “MAX” traffic per direction.
Uppaal Stratego for Intelligent Traffic Lights 5
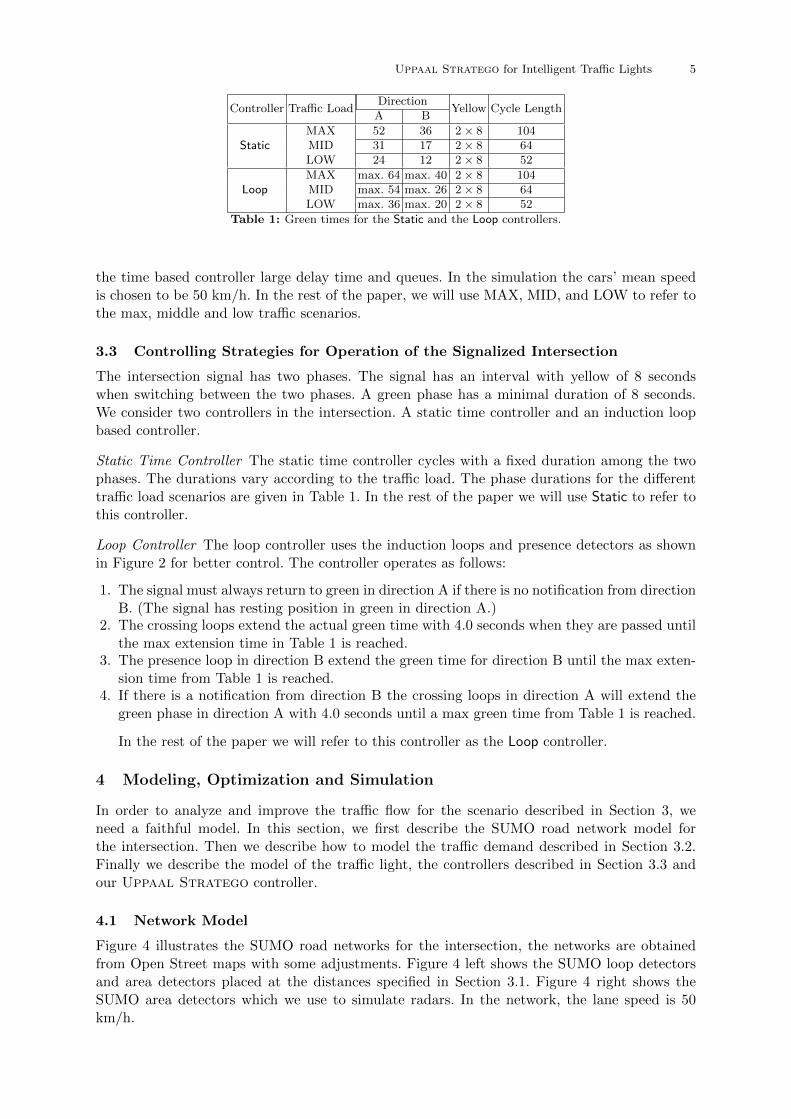
Controller Traffic LoadDirection
Yellow Cycle LengthA B
StaticMAX 52 36 2× 8 104MID 31 17 2× 8 64LOW 24 12 2× 8 52
LoopMAX max. 64 max. 40 2× 8 104MID max. 54 max. 26 2× 8 64LOW max. 36 max. 20 2× 8 52
Table 1: Green times for the Static and the Loop controllers.
the time based controller large delay time and queues. In the simulation the cars’ mean speedis chosen to be 50 km/h. In the rest of the paper, we will use MAX, MID, and LOW to refer tothe max, middle and low traffic scenarios.
3.3 Controlling Strategies for Operation of the Signalized Intersection
The intersection signal has two phases. The signal has an interval with yellow of 8 secondswhen switching between the two phases. A green phase has a minimal duration of 8 seconds.We consider two controllers in the intersection. A static time controller and an induction loopbased controller.
Static Time Controller The static time controller cycles with a fixed duration among the twophases. The durations vary according to the traffic load. The phase durations for the differenttraffic load scenarios are given in Table 1. In the rest of the paper we will use Static to refer tothis controller.
Loop Controller The loop controller uses the induction loops and presence detectors as shownin Figure 2 for better control. The controller operates as follows:
1. The signal must always return to green in direction A if there is no notification from directionB. (The signal has resting position in green in direction A.)
2. The crossing loops extend the actual green time with 4.0 seconds when they are passed untilthe max extension time in Table 1 is reached.
3. The presence loop in direction B extend the green time for direction B until the max exten-sion time from Table 1 is reached.
4. If there is a notification from direction B the crossing loops in direction A will extend thegreen phase in direction A with 4.0 seconds until a max green time from Table 1 is reached.
In the rest of the paper we will refer to this controller as the Loop controller.
4 Modeling, Optimization and Simulation
In order to analyze and improve the traffic flow for the scenario described in Section 3, weneed a faithful model. In this section, we first describe the SUMO road network model forthe intersection. Then we describe how to model the traffic demand described in Section 3.2.Finally we describe the model of the traffic light, the controllers described in Section 3.3 andour Uppaal Stratego controller.
4.1 Network Model
Figure 4 illustrates the SUMO road networks for the intersection, the networks are obtainedfrom Open Street maps with some adjustments. Figure 4 left shows the SUMO loop detectorsand area detectors placed at the distances specified in Section 3.1. Figure 4 right shows theSUMO area detectors which we use to simulate radars. In the network, the lane speed is 50km/h.

6 Uppaal Stratego for Intelligent Traffic Lights
loop detector
area detector
A1
A2
B1
B2
area detector
A1
A2
B1
B2
Fig. 4: Left) SUMO model for the loop controller. Right) SUMO model for the Uppaal Stratego controller,the length of the area detectors coincide with the radars from the real crossing in Køge.
4.2 Traffic Demand Model
Section 3.2 describes different traffic load scenarios. In our SUMO model we generate the trafficdemand with vehicles, routes and probability distributions on the routes.
Vehicles SUMO allows to define a number of vehicle types, every type with different attributese.g. acceleration, max speed, etc. An attribute sigma indicates the driver’s imperfection [5]. Asmentioned in Section 3.2 we only consider passenger cars these have acceleration 0.8m/s2, de-celeration 4.5m/s2, length 5m and max speed 50km/h. Apart from that we define the minimumdistance between the cars to be 2.5m and sigma to be 0.5.
Routes For every leg of the intersection e.g. A1, B2, there are 3 possible directions, this gives atotal of 12 possible directions. For every direction we define a SUMO route. In the simulationvehicles are assigned to routes.
Load Figure 2 right shows the max traffic load for all possible directions. For every directionwe model the traffic load using the following Poisson distribution:
P (k cars in an hour) =λk · e−λ
k!
Where λ is the average number of cars per hour for a given direction. In the case of the MID andLOW load scenarios we multiply λ by 60% or 30% respectively. To generate the correspondingSUMO route file, we sample by repeated Bernoulli trials.
4.3 Controller Models
The intersection connects lanes to a total of 12 directions. The traffic light then consists of 12signals, one for each direction. Different signal configurations are grouped in phases, the signalstate of a phase is encoded by a string. There are two main green phases one where A1,A2are green encoded as “rrrGGgrrrGGg”, and the other one where B1,B2 are green encoded by“GGgrrrGGgrrr”. In the string, “G” represents priority green. We now describe our models forthe Static and the Loop given in Section 3.3 as well as our Uppaal Stratego model.
Static Controller The XML below describes the static controller for the MAX load scenario.We have one definition for every scenario MAX, MID and LOW, where the times of the greenphases correspond to the ones in Table 1.

Uppaal Stratego for Intelligent Traffic Lights 7
Fig. 5: Uppaal Stratego Controller for green phase and yellow phase.
Algorithm 1 High level algorithm for the Uppaal Stratego controller
1: Every 5 seconds read areal detector data from SUMO2: if Traffic Light in green phase then3: Use Uppaal Stratego Figure 5 left – to learn whether extend green phase or go to yellow4: else if Traffic Light in yellow phase then5: Run Uppaal Stratego Figure 5 right – to learn which direction should have the next green phase6: end if
<tlLogic id="1693132977" type="static" programID="max" offset="0">
<phase duration="52" state="rrrGGgrrrGGg"/>
<phase duration="4" state="rrryyyrrryyy"/>
<phase duration="4" state="rrrrrrrrrrrr"/>
<phase duration="36" state="GGgrrrGGgrrr"/>
<phase duration="4" state="yyyrrryyyrrr"/>
<phase duration="4" state="rrrrrrrrrrrr"/>
</tlLogic>
Loop Controller We have implemented the Loop controller from Section 3.3 in SUMO usingTraci and Python. The implementation is straight forward from the description. However, itis important to describe how the extension of green times are implemented. To implement thetime extension we use a counter count which starts at the minimal green time i.e. 8 secondsand decreases by 1 at every simulation step. If a loop detector is activated we set the value ofthe counter as follows: count := max(count, 4.0). Note that if we implement the extension ascount := count + 4.0, and if 10 cars come in quick succession count will reach values above 30.Using max allows a extension which is just sufficient for cars to reach the next loop or the stopline.
Uppaal Stratego Controller This controller integrates SUMO and Uppaal Stratego usingTraci, the controller will read the status of the traffic light and data from the areal detectorsevery 5 to 8 seconds. Then it will update the Uppaal Stratego model with the new sensordata.
Uppaal Stratego will then learn a strategy for its internal model (not in SUMO) and usethat to identify the best phases. The controller will then indicate the next phase for the trafficlight. Algorithm 1 describes the overall behavior of the controller. Figure 5 left (right) showsthe Uppaal Stratego model for the green (yellow) phases.
The models use a number of features from Uppaal and are rather advanced. We will brieflygive a general idea on how the model for the green phase Figure 5 left works. Uppaal will
8 Uppaal Stratego for Intelligent Traffic Lights
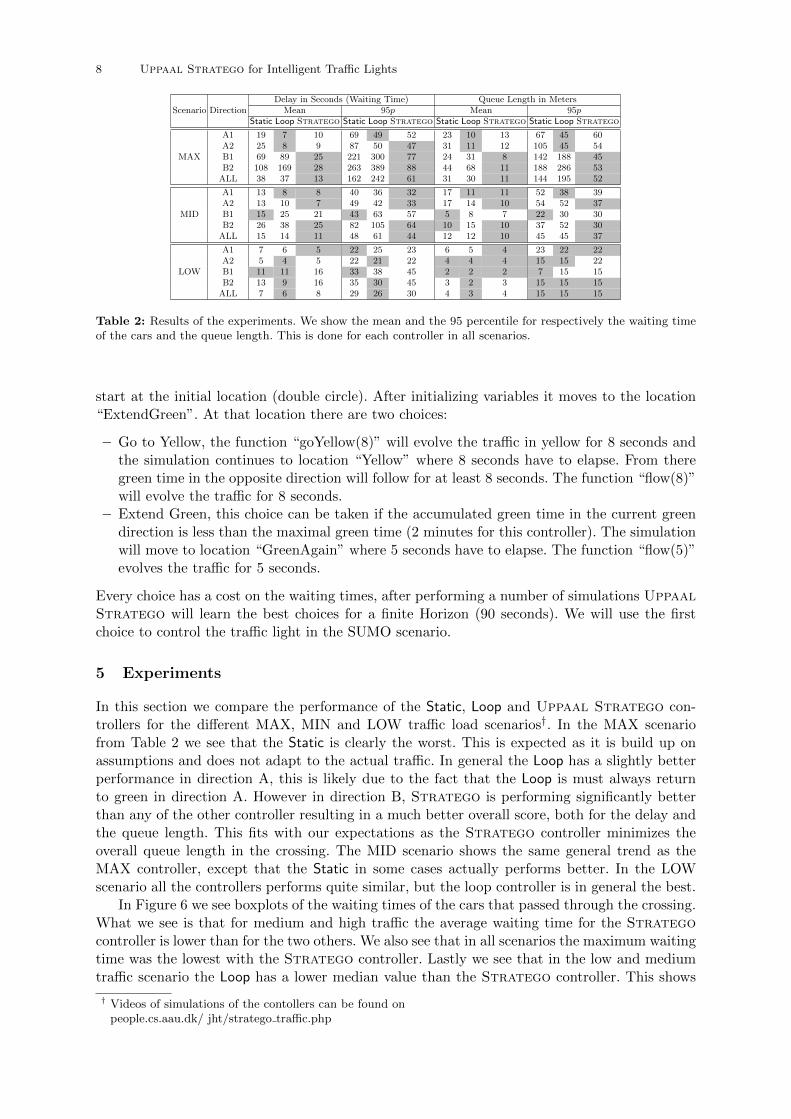
Scenario DirectionDelay in Seconds (Waiting Time) Queue Length in Meters
Mean 95p Mean 95pStatic Loop Stratego Static Loop Stratego Static Loop Stratego Static Loop Stratego
MAX
A1 19 7 10 69 49 52 23 10 13 67 45 60A2 25 8 9 87 50 47 31 11 12 105 45 54B1 69 89 25 221 300 77 24 31 8 142 188 45B2 108 169 28 263 389 88 44 68 11 188 286 53
ALL 38 37 13 162 242 61 31 30 11 144 195 52
MID
A1 13 8 8 40 36 32 17 11 11 52 38 39A2 13 10 7 49 42 33 17 14 10 54 52 37B1 15 25 21 43 63 57 5 8 7 22 30 30B2 26 38 25 82 105 64 10 15 10 37 52 30
ALL 15 14 11 48 61 44 12 12 10 45 45 37
LOW
A1 7 6 5 22 25 23 6 5 4 23 22 22A2 5 4 5 22 21 22 4 4 4 15 15 22B1 11 11 16 33 38 45 2 2 2 7 15 15B2 13 9 16 35 30 45 3 2 3 15 15 15
ALL 7 6 8 29 26 30 4 3 4 15 15 15
Table 2: Results of the experiments. We show the mean and the 95 percentile for respectively the waiting timeof the cars and the queue length. This is done for each controller in all scenarios.
start at the initial location (double circle). After initializing variables it moves to the location“ExtendGreen”. At that location there are two choices:
– Go to Yellow, the function “goYellow(8)” will evolve the traffic in yellow for 8 seconds andthe simulation continues to location “Yellow” where 8 seconds have to elapse. From theregreen time in the opposite direction will follow for at least 8 seconds. The function “flow(8)”will evolve the traffic for 8 seconds.
– Extend Green, this choice can be taken if the accumulated green time in the current greendirection is less than the maximal green time (2 minutes for this controller). The simulationwill move to location “GreenAgain” where 5 seconds have to elapse. The function “flow(5)”evolves the traffic for 5 seconds.
Every choice has a cost on the waiting times, after performing a number of simulations UppaalStratego will learn the best choices for a finite Horizon (90 seconds). We will use the firstchoice to control the traffic light in the SUMO scenario.
5 Experiments
In this section we compare the performance of the Static, Loop and Uppaal Stratego con-trollers for the different MAX, MIN and LOW traffic load scenarios†. In the MAX scenariofrom Table 2 we see that the Static is clearly the worst. This is expected as it is build up onassumptions and does not adapt to the actual traffic. In general the Loop has a slightly betterperformance in direction A, this is likely due to the fact that the Loop is must always returnto green in direction A. However in direction B, Stratego is performing significantly betterthan any of the other controller resulting in a much better overall score, both for the delay andthe queue length. This fits with our expectations as the Stratego controller minimizes theoverall queue length in the crossing. The MID scenario shows the same general trend as theMAX controller, except that the Static in some cases actually performs better. In the LOWscenario all the controllers performs quite similar, but the loop controller is in general the best.
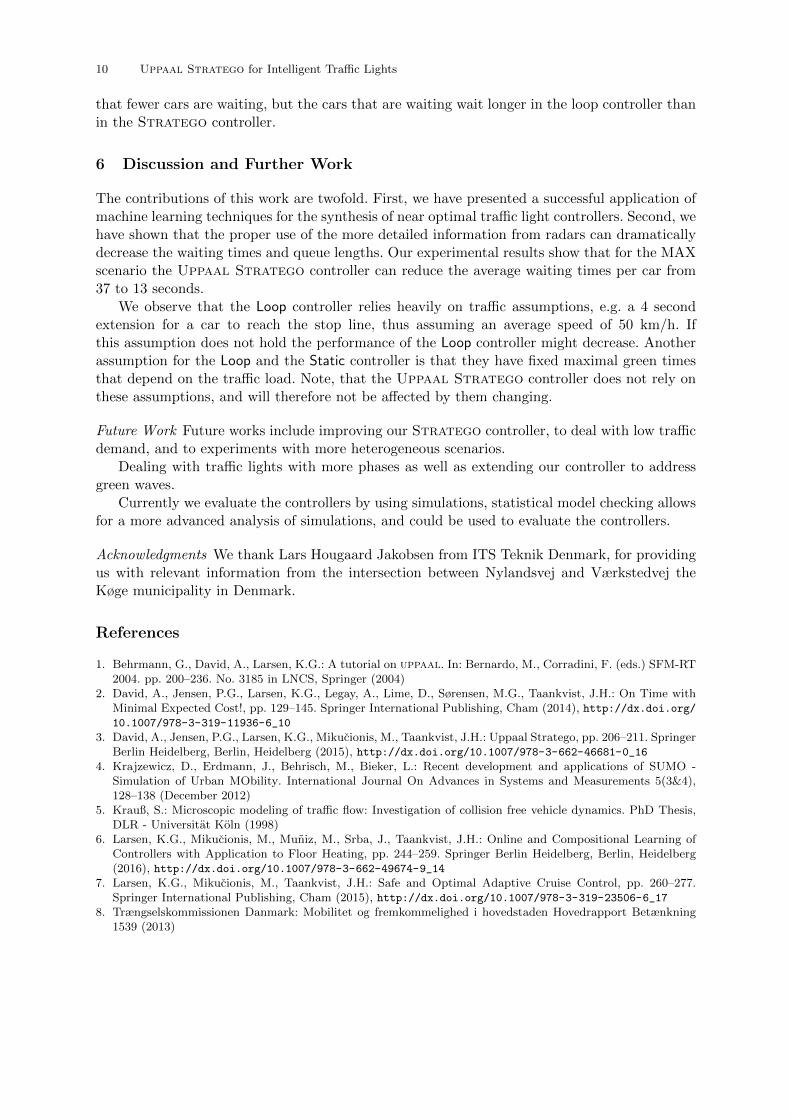
In Figure 6 we see boxplots of the waiting times of the cars that passed through the crossing.What we see is that for medium and high traffic the average waiting time for the Strategocontroller is lower than for the two others. We also see that in all scenarios the maximum waitingtime was the lowest with the Stratego controller. Lastly we see that in the low and mediumtraffic scenario the Loop has a lower median value than the Stratego controller. This shows
† Videos of simulations of the contollers can be found onpeople.cs.aau.dk/ jht/stratego traffic.php

Uppaal Stratego for Intelligent Traffic Lights 9
0 100 200 300 400"Waiting time in seconds"
stratego
loop
static
0 25 50 75 100 125 150 175"Waiting time in seconds"
stratego
loop
static
0 20 40 60 80"Waiting time in seconds"
stratego
loop
static
Fig. 6: Waiting time for the different controllers, in the scenarios MAX, MID and MIN respectively. The solidline represent the median and the dashed line represent the mean.
10 Uppaal Stratego for Intelligent Traffic Lights
that fewer cars are waiting, but the cars that are waiting wait longer in the loop controller thanin the Stratego controller.
6 Discussion and Further Work
The contributions of this work are twofold. First, we have presented a successful application ofmachine learning techniques for the synthesis of near optimal traffic light controllers. Second, wehave shown that the proper use of the more detailed information from radars can dramaticallydecrease the waiting times and queue lengths. Our experimental results show that for the MAXscenario the Uppaal Stratego controller can reduce the average waiting times per car from37 to 13 seconds.
We observe that the Loop controller relies heavily on traffic assumptions, e.g. a 4 secondextension for a car to reach the stop line, thus assuming an average speed of 50 km/h. Ifthis assumption does not hold the performance of the Loop controller might decrease. Anotherassumption for the Loop and the Static controller is that they have fixed maximal green timesthat depend on the traffic load. Note, that the Uppaal Stratego controller does not rely onthese assumptions, and will therefore not be affected by them changing.
Future Work Future works include improving our Stratego controller, to deal with low trafficdemand, and to experiments with more heterogeneous scenarios.
Dealing with traffic lights with more phases as well as extending our controller to addressgreen waves.
Currently we evaluate the controllers by using simulations, statistical model checking allowsfor a more advanced analysis of simulations, and could be used to evaluate the controllers.
Acknowledgments We thank Lars Hougaard Jakobsen from ITS Teknik Denmark, for providingus with relevant information from the intersection between Nylandsvej and Værkstedvej theKøge municipality in Denmark.
References
1. Behrmann, G., David, A., Larsen, K.G.: A tutorial on uppaal. In: Bernardo, M., Corradini, F. (eds.) SFM-RT2004. pp. 200–236. No. 3185 in LNCS, Springer (2004)
2. David, A., Jensen, P.G., Larsen, K.G., Legay, A., Lime, D., Sørensen, M.G., Taankvist, J.H.: On Time withMinimal Expected Cost!, pp. 129–145. Springer International Publishing, Cham (2014), http://dx.doi.org/10.1007/978-3-319-11936-6_10
3. David, A., Jensen, P.G., Larsen, K.G., Mikucionis, M., Taankvist, J.H.: Uppaal Stratego, pp. 206–211. SpringerBerlin Heidelberg, Berlin, Heidelberg (2015), http://dx.doi.org/10.1007/978-3-662-46681-0_16
4. Krajzewicz, D., Erdmann, J., Behrisch, M., Bieker, L.: Recent development and applications of SUMO -Simulation of Urban MObility. International Journal On Advances in Systems and Measurements 5(3&4),128–138 (December 2012)
5. Krauß, S.: Microscopic modeling of traffic flow: Investigation of collision free vehicle dynamics. PhD Thesis,DLR - Universitat Koln (1998)
6. Larsen, K.G., Mikucionis, M., Muniz, M., Srba, J., Taankvist, J.H.: Online and Compositional Learning ofControllers with Application to Floor Heating, pp. 244–259. Springer Berlin Heidelberg, Berlin, Heidelberg(2016), http://dx.doi.org/10.1007/978-3-662-49674-9_14
7. Larsen, K.G., Mikucionis, M., Taankvist, J.H.: Safe and Optimal Adaptive Cruise Control, pp. 260–277.Springer International Publishing, Cham (2015), http://dx.doi.org/10.1007/978-3-319-23506-6_17
8. Trængselskommissionen Danmark: Mobilitet og fremkommelighed i hovedstaden Hovedrapport Betænkning1539 (2013)