Embed Size (px)
Citation preview
1
Parking Utilization Study Fall Semester 2010
Submitted by Kathryn Lantz Office of Facilities Planning
October 12, 2010
2
Table of Contents
Parking Utilization Study – Fall 2010 ……………………………………………………………….. 3 Overview & Summary Results…………………………………………………………….. 3 Methodology ……………………………………………………………………………………….. 5 Results …………………………………………………………………………………………………. 7 Parking Permits…………………………………………………………………………………….. 11 Findings and Observations ………………………………………………………………….. 11 Appendix A – Enrollment History …………………………………………………………….……… 12 Appendix B – Number of Student Spaces by Lot Number ……………………………….. 12 Appendix C – Utilization Rate Using Park & Ride lot……………….……………………….. 13
3
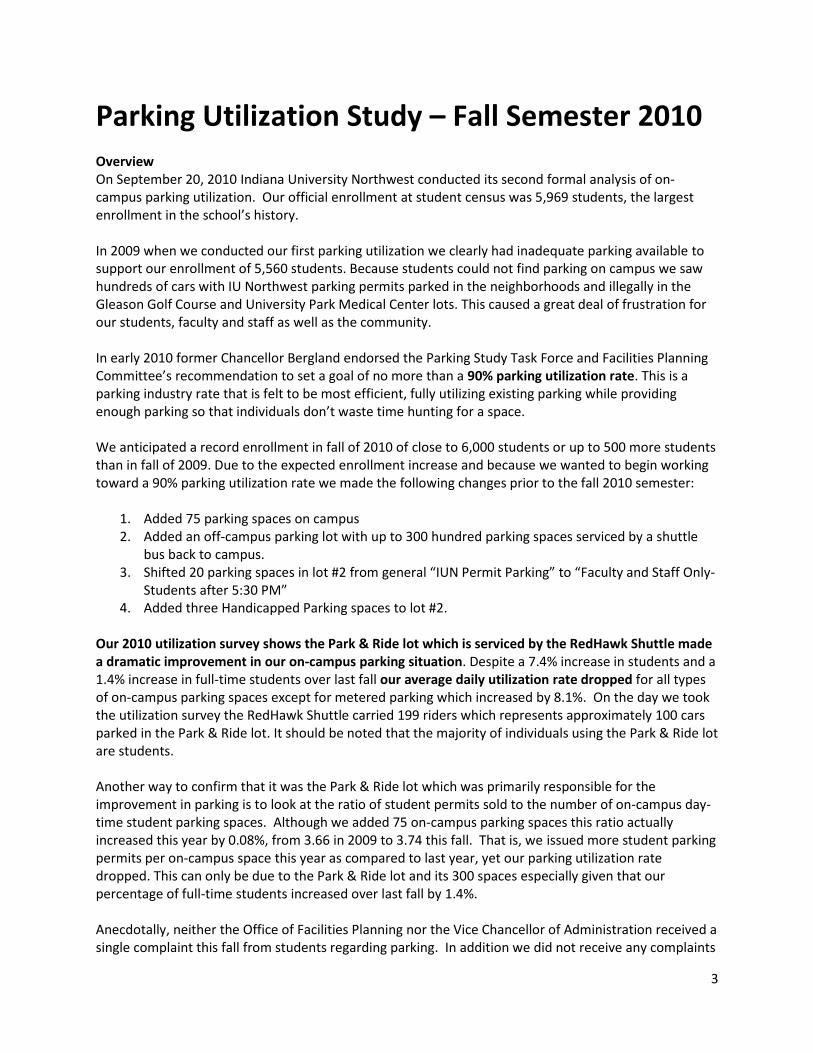
Parking Utilization Study – Fall Semester 2010 Overview On September 20, 2010 Indiana University Northwest conducted its second formal analysis of on-campus parking utilization. Our official enrollment at student census was 5,969 students, the largest enrollment in the school’s history. In 2009 when we conducted our first parking utilization we clearly had inadequate parking available to support our enrollment of 5,560 students. Because students could not find parking on campus we saw hundreds of cars with IU Northwest parking permits parked in the neighborhoods and illegally in the Gleason Golf Course and University Park Medical Center lots. This caused a great deal of frustration for our students, faculty and staff as well as the community. In early 2010 former Chancellor Bergland endorsed the Parking Study Task Force and Facilities Planning Committee’s recommendation to set a goal of no more than a 90% parking utilization rate. This is a parking industry rate that is felt to be most efficient, fully utilizing existing parking while providing enough parking so that individuals don’t waste time hunting for a space. We anticipated a record enrollment in fall of 2010 of close to 6,000 students or up to 500 more students than in fall of 2009. Due to the expected enrollment increase and because we wanted to begin working toward a 90% parking utilization rate we made the following changes prior to the fall 2010 semester:
1. Added 75 parking spaces on campus 2. Added an off-campus parking lot with up to 300 hundred parking spaces serviced by a shuttle
bus back to campus. 3. Shifted 20 parking spaces in lot #2 from general “IUN Permit Parking” to “Faculty and Staff Only-
Students after 5:30 PM” 4. Added three Handicapped Parking spaces to lot #2.
Our 2010 utilization survey shows the Park & Ride lot which is serviced by the RedHawk Shuttle made a dramatic improvement in our on-campus parking situation. Despite a 7.4% increase in students and a 1.4% increase in full-time students over last fall our average daily utilization rate dropped for all types of on-campus parking spaces except for metered parking which increased by 8.1%. On the day we took the utilization survey the RedHawk Shuttle carried 199 riders which represents approximately 100 cars parked in the Park & Ride lot. It should be noted that the majority of individuals using the Park & Ride lot are students. Another way to confirm that it was the Park & Ride lot which was primarily responsible for the improvement in parking is to look at the ratio of student permits sold to the number of on-campus day-time student parking spaces. Although we added 75 on-campus parking spaces this ratio actually increased this year by 0.08%, from 3.66 in 2009 to 3.74 this fall. That is, we issued more student parking permits per on-campus space this year as compared to last year, yet our parking utilization rate dropped. This can only be due to the Park & Ride lot and its 300 spaces especially given that our percentage of full-time students increased over last fall by 1.4%. Anecdotally, neither the Office of Facilities Planning nor the Vice Chancellor of Administration received a single complaint this fall from students regarding parking. In addition we did not receive any complaints
4
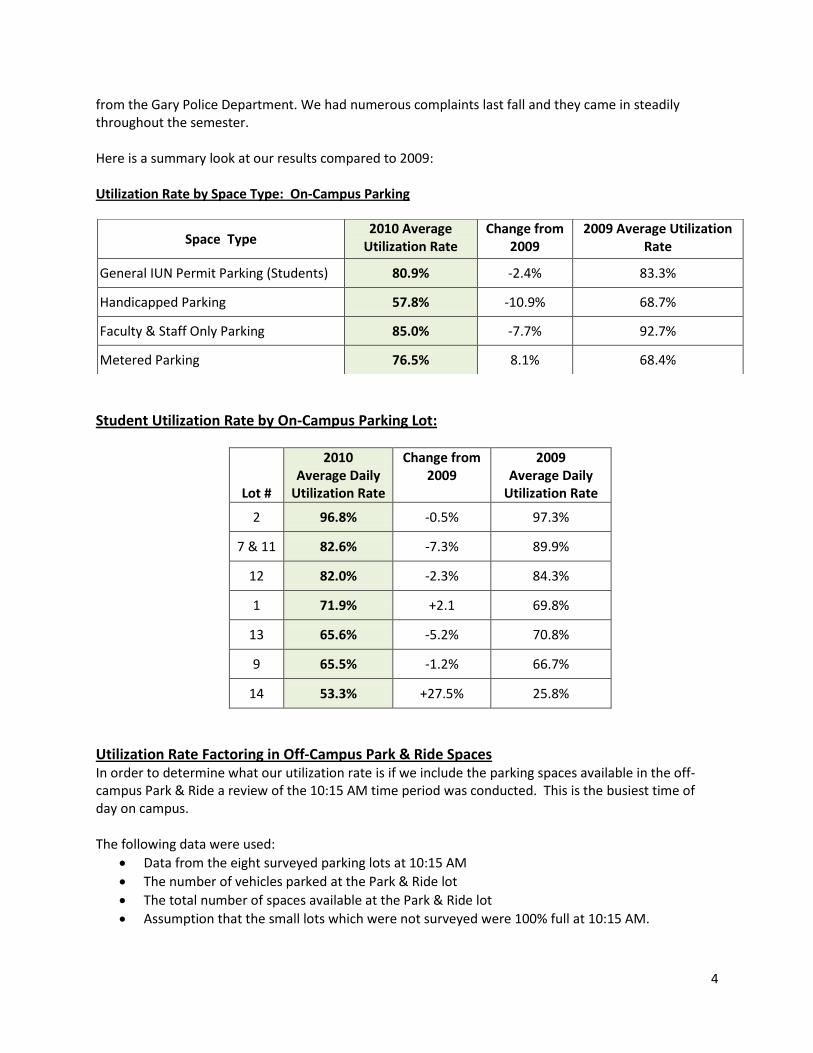
from the Gary Police Department. We had numerous complaints last fall and they came in steadily throughout the semester. Here is a summary look at our results compared to 2009: Utilization Rate by Space Type: On-Campus Parking
Student Utilization Rate by On-Campus Parking Lot:
Lot #
2010 Average Daily
Utilization Rate
Change from 2009
2009 Average Daily
Utilization Rate
2 96.8% -0.5% 97.3%
7 & 11 82.6% -7.3% 89.9%
12 82.0% -2.3% 84.3%
1 71.9% +2.1 69.8%
13 65.6% -5.2% 70.8%
9 65.5% -1.2% 66.7%
14 53.3% +27.5% 25.8%
Utilization Rate Factoring in Off-Campus Park & Ride Spaces In order to determine what our utilization rate is if we include the parking spaces available in the off-campus Park & Ride a review of the 10:15 AM time period was conducted. This is the busiest time of day on campus. The following data were used:
Data from the eight surveyed parking lots at 10:15 AM
The number of vehicles parked at the Park & Ride lot
The total number of spaces available at the Park & Ride lot
Assumption that the small lots which were not surveyed were 100% full at 10:15 AM.
Space Type 2010 Average
Utilization Rate Change from
2009 2009 Average Utilization
Rate
General IUN Permit Parking (Students) 80.9% -2.4% 83.3%
Handicapped Parking 57.8% -10.9% 68.7%
Faculty & Staff Only Parking 85.0% -7.7% 92.7%
Metered Parking 76.5% 8.1% 68.4%
5
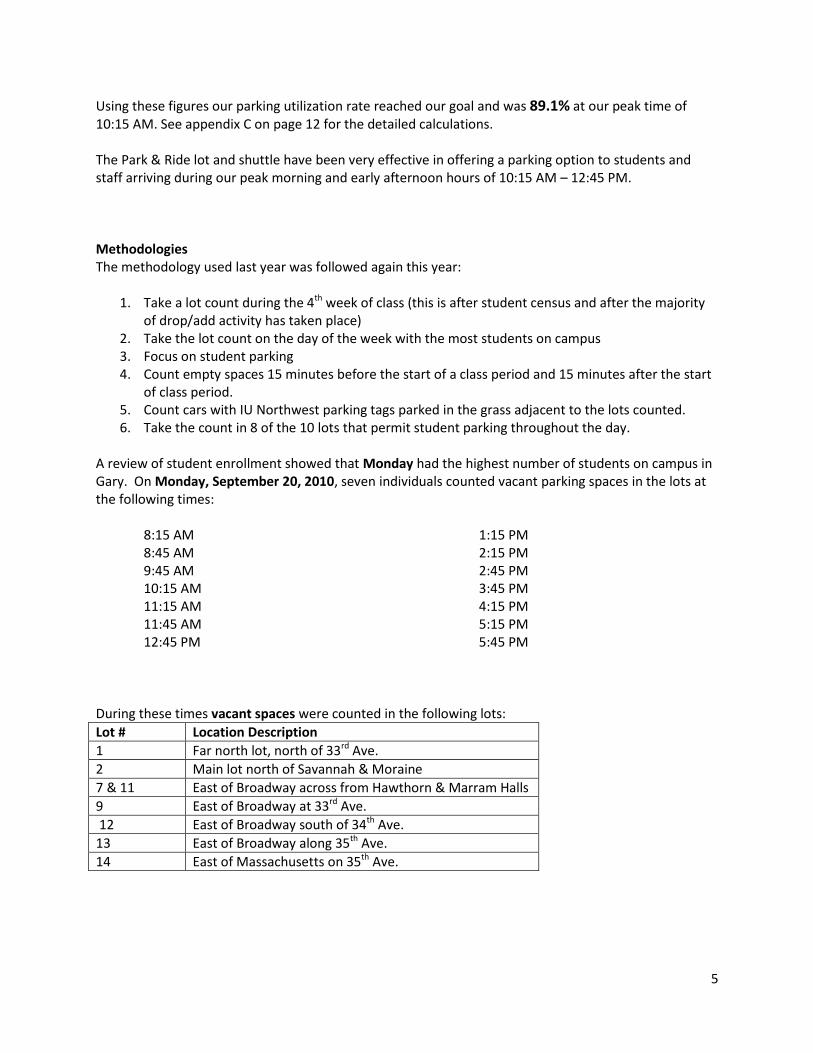
Using these figures our parking utilization rate reached our goal and was 89.1% at our peak time of 10:15 AM. See appendix C on page 12 for the detailed calculations. The Park & Ride lot and shuttle have been very effective in offering a parking option to students and staff arriving during our peak morning and early afternoon hours of 10:15 AM – 12:45 PM. Methodologies The methodology used last year was followed again this year:
1. Take a lot count during the 4th week of class (this is after student census and after the majority of drop/add activity has taken place)
2. Take the lot count on the day of the week with the most students on campus 3. Focus on student parking 4. Count empty spaces 15 minutes before the start of a class period and 15 minutes after the start
of class period. 5. Count cars with IU Northwest parking tags parked in the grass adjacent to the lots counted. 6. Take the count in 8 of the 10 lots that permit student parking throughout the day.
A review of student enrollment showed that Monday had the highest number of students on campus in Gary. On Monday, September 20, 2010, seven individuals counted vacant parking spaces in the lots at the following times:
8:15 AM 8:45 AM 9:45 AM 10:15 AM 11:15 AM 11:45 AM 12:45 PM
1:15 PM 2:15 PM 2:45 PM 3:45 PM 4:15 PM 5:15 PM 5:45 PM
During these times vacant spaces were counted in the following lots:
Lot # Location Description
1 Far north lot, north of 33rd Ave.
2 Main lot north of Savannah & Moraine
7 & 11 East of Broadway across from Hawthorn & Marram Halls
9 East of Broadway at 33rd Ave.
12 East of Broadway south of 34th Ave.
13 East of Broadway along 35th Ave.
14 East of Massachusetts on 35th Ave.
6
Due to manpower constraints we did not conduct a count in the following on-campus lots: 3, 4, 5, 6, 8, 15 or Dena’s. All spaces in lots 5, 15 and Dena’s are IUN Permit Parking available to students. Lots 3, 4 and 8 are faculty & Staff only lots. Details for these lots can be found in appendix C The individuals who conducted the study were: Sherri Clark, Mikalynn Murray, Ann Fritz, Kathryn Lantz, Patty Woosley, Joe Romeo and Ieshala Taylor. IU Northwest’s Physical Plant assisted by lending the team their Kubota vehicles for a second year in a row. The results of the lot counts appear on the following pages.
7
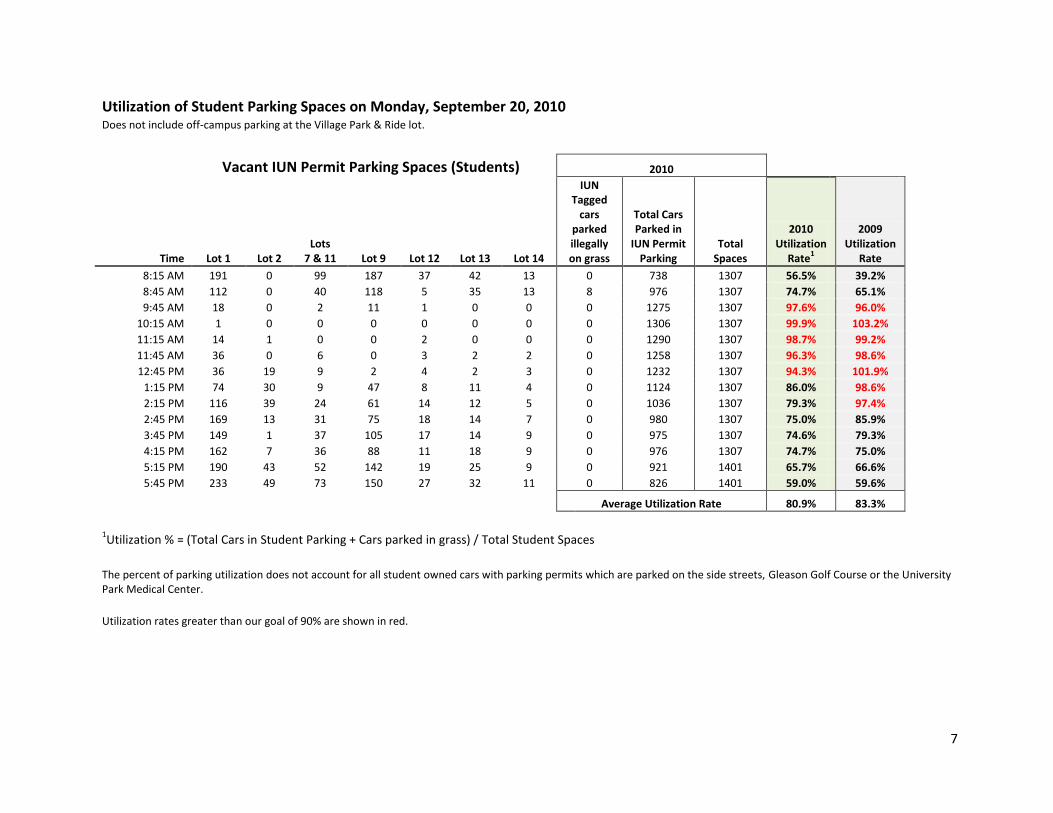
Utilization of Student Parking Spaces on Monday, September 20, 2010 Does not include off-campus parking at the Village Park & Ride lot.
Vacant IUN Permit Parking Spaces (Students) 2010
Time Lot 1 Lot 2 Lots
7 & 11 Lot 9 Lot 12 Lot 13 Lot 14
IUN Tagged
cars parked illegally on grass
Total Cars Parked in
IUN Permit Parking
Total Spaces
2010 Utilization
Rate1
2009 Utilization
Rate 8:15 AM 191 0 99 187 37 42 13 0 738 1307 56.5% 39.2% 8:45 AM 112 0 40 118 5 35 13 8 976 1307 74.7% 65.1% 9:45 AM 18 0 2 11 1 0 0 0 1275 1307 97.6% 96.0% 10:15 AM 1 0 0 0 0 0 0 0 1306 1307 99.9% 103.2% 11:15 AM 14 1 0 0 2 0 0 0 1290 1307 98.7% 99.2% 11:45 AM 36 0 6 0 3 2 2 0 1258 1307 96.3% 98.6% 12:45 PM 36 19 9 2 4 2 3 0 1232 1307 94.3% 101.9% 1:15 PM 74 30 9 47 8 11 4 0 1124 1307 86.0% 98.6% 2:15 PM 116 39 24 61 14 12 5 0 1036 1307 79.3% 97.4% 2:45 PM 169 13 31 75 18 14 7 0 980 1307 75.0% 85.9% 3:45 PM 149 1 37 105 17 14 9 0 975 1307 74.6% 79.3% 4:15 PM 162 7 36 88 11 18 9 0 976 1307 74.7% 75.0% 5:15 PM 190 43 52 142 19 25 9 0 921 1401 65.7% 66.6% 5:45 PM 233 49 73 150 27 32 11 0 826 1401 59.0% 59.6%
Average Utilization Rate 80.9% 83.3%
1Utilization % = (Total Cars in Student Parking + Cars parked in grass) / Total Student Spaces
The percent of parking utilization does not account for all student owned cars with parking permits which are parked on the side streets, Gleason Golf Course or the University Park Medical Center.
Utilization rates greater than our goal of 90% are shown in red.
8
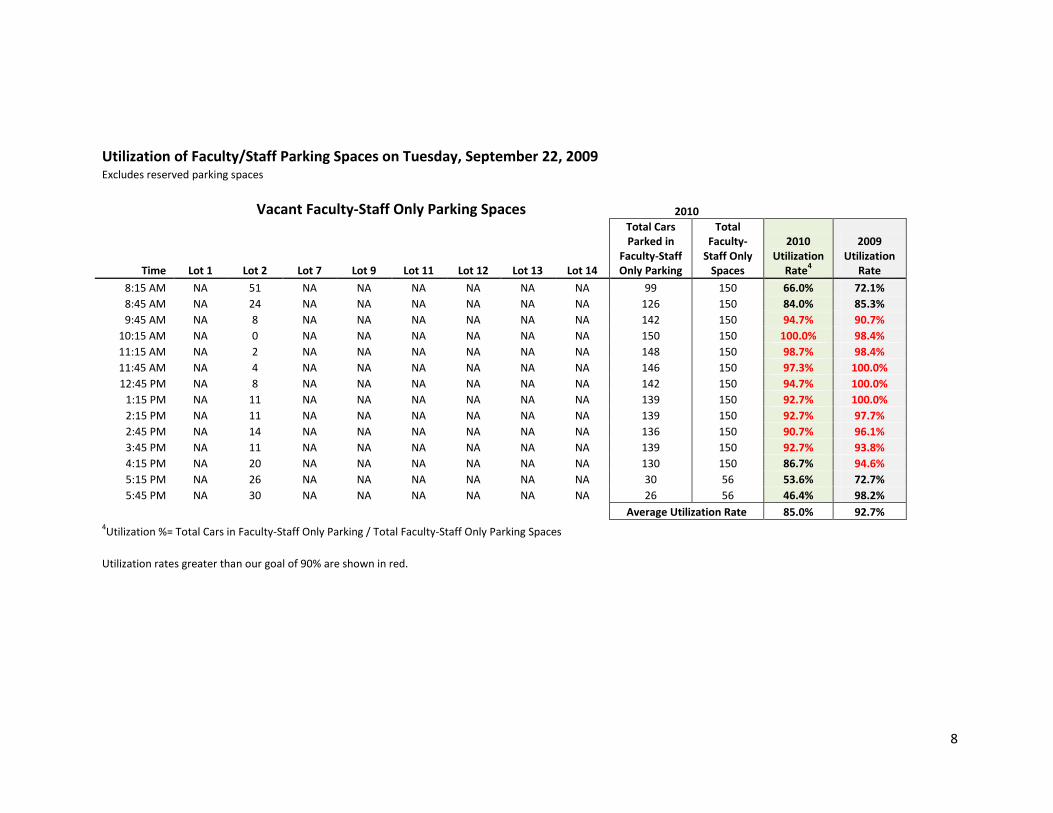
Utilization of Faculty/Staff Parking Spaces on Tuesday, September 22, 2009 Excludes reserved parking spaces
Vacant Faculty-Staff Only Parking Spaces 2010
Time Lot 1 Lot 2 Lot 7 Lot 9 Lot 11 Lot 12 Lot 13 Lot 14
Total Cars Parked in
Faculty-Staff Only Parking
Total Faculty-
Staff Only Spaces
2010 Utilization
Rate4
2009 Utilization
Rate 8:15 AM NA 51 NA NA NA NA NA NA 99 150 66.0% 72.1% 8:45 AM NA 24 NA NA NA NA NA NA 126 150 84.0% 85.3% 9:45 AM NA 8 NA NA NA NA NA NA 142 150 94.7% 90.7% 10:15 AM NA 0 NA NA NA NA NA NA 150 150 100.0% 98.4% 11:15 AM NA 2 NA NA NA NA NA NA 148 150 98.7% 98.4% 11:45 AM NA 4 NA NA NA NA NA NA 146 150 97.3% 100.0% 12:45 PM NA 8 NA NA NA NA NA NA 142 150 94.7% 100.0% 1:15 PM NA 11 NA NA NA NA NA NA 139 150 92.7% 100.0% 2:15 PM NA 11 NA NA NA NA NA NA 139 150 92.7% 97.7% 2:45 PM NA 14 NA NA NA NA NA NA 136 150 90.7% 96.1% 3:45 PM NA 11 NA NA NA NA NA NA 139 150 92.7% 93.8% 4:15 PM NA 20 NA NA NA NA NA NA 130 150 86.7% 94.6% 5:15 PM NA 26 NA NA NA NA NA NA 30 56 53.6% 72.7% 5:45 PM NA 30 NA NA NA NA NA NA 26 56 46.4% 98.2%
Average Utilization Rate 85.0% 92.7%
4Utilization %= Total Cars in Faculty-Staff Only Parking / Total Faculty-Staff Only Parking Spaces
Utilization rates greater than our goal of 90% are shown in red.
9
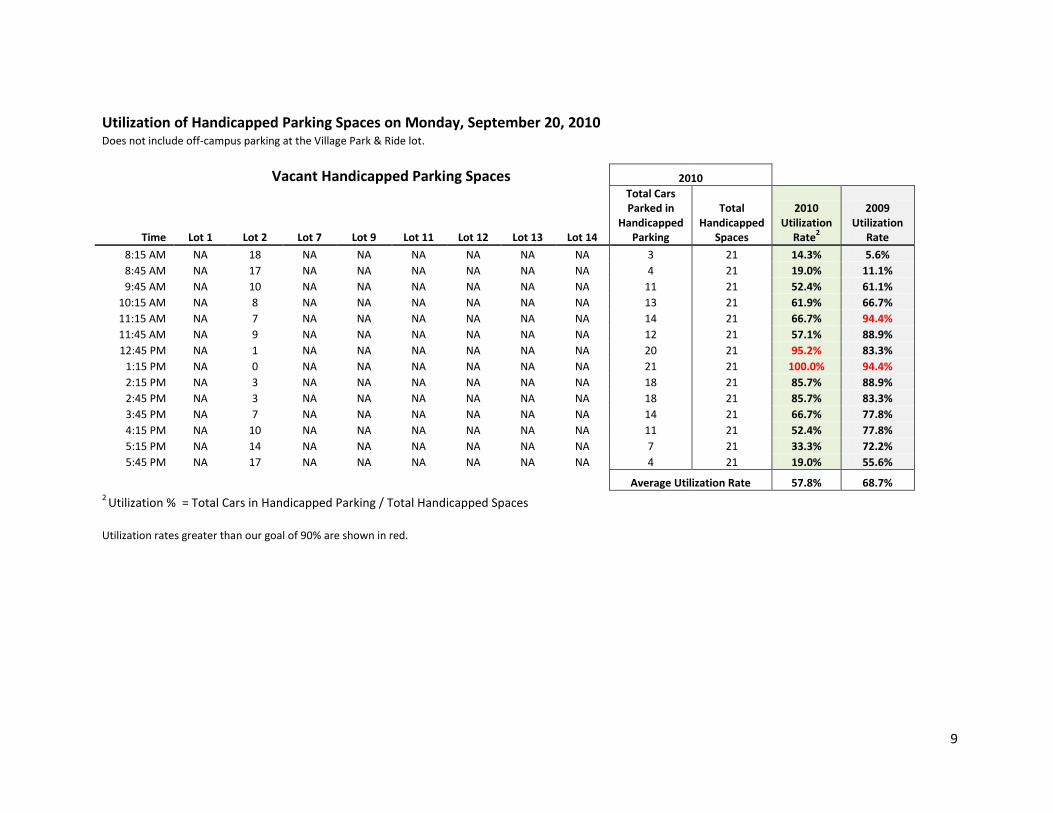
Utilization of Handicapped Parking Spaces on Monday, September 20, 2010 Does not include off-campus parking at the Village Park & Ride lot.
Vacant Handicapped Parking Spaces 2010
Time Lot 1 Lot 2 Lot 7 Lot 9 Lot 11 Lot 12 Lot 13 Lot 14
Total Cars Parked in
Handicapped Parking
Total Handicapped
Spaces
2010 Utilization
Rate2
2009 Utilization
Rate 8:15 AM NA 18 NA NA NA NA NA NA 3 21 14.3% 5.6% 8:45 AM NA 17 NA NA NA NA NA NA 4 21 19.0% 11.1% 9:45 AM NA 10 NA NA NA NA NA NA 11 21 52.4% 61.1% 10:15 AM NA 8 NA NA NA NA NA NA 13 21 61.9% 66.7% 11:15 AM NA 7 NA NA NA NA NA NA 14 21 66.7% 94.4% 11:45 AM NA 9 NA NA NA NA NA NA 12 21 57.1% 88.9% 12:45 PM NA 1 NA NA NA NA NA NA 20 21 95.2% 83.3% 1:15 PM NA 0 NA NA NA NA NA NA 21 21 100.0% 94.4% 2:15 PM NA 3 NA NA NA NA NA NA 18 21 85.7% 88.9% 2:45 PM NA 3 NA NA NA NA NA NA 18 21 85.7% 83.3% 3:45 PM NA 7 NA NA NA NA NA NA 14 21 66.7% 77.8% 4:15 PM NA 10 NA NA NA NA NA NA 11 21 52.4% 77.8% 5:15 PM NA 14 NA NA NA NA NA NA 7 21 33.3% 72.2% 5:45 PM NA 17 NA NA NA NA NA NA 4 21 19.0% 55.6%
Average Utilization Rate 57.8% 68.7%
2 Utilization % = Total Cars in Handicapped Parking / Total Handicapped Spaces
Utilization rates greater than our goal of 90% are shown in red.
10
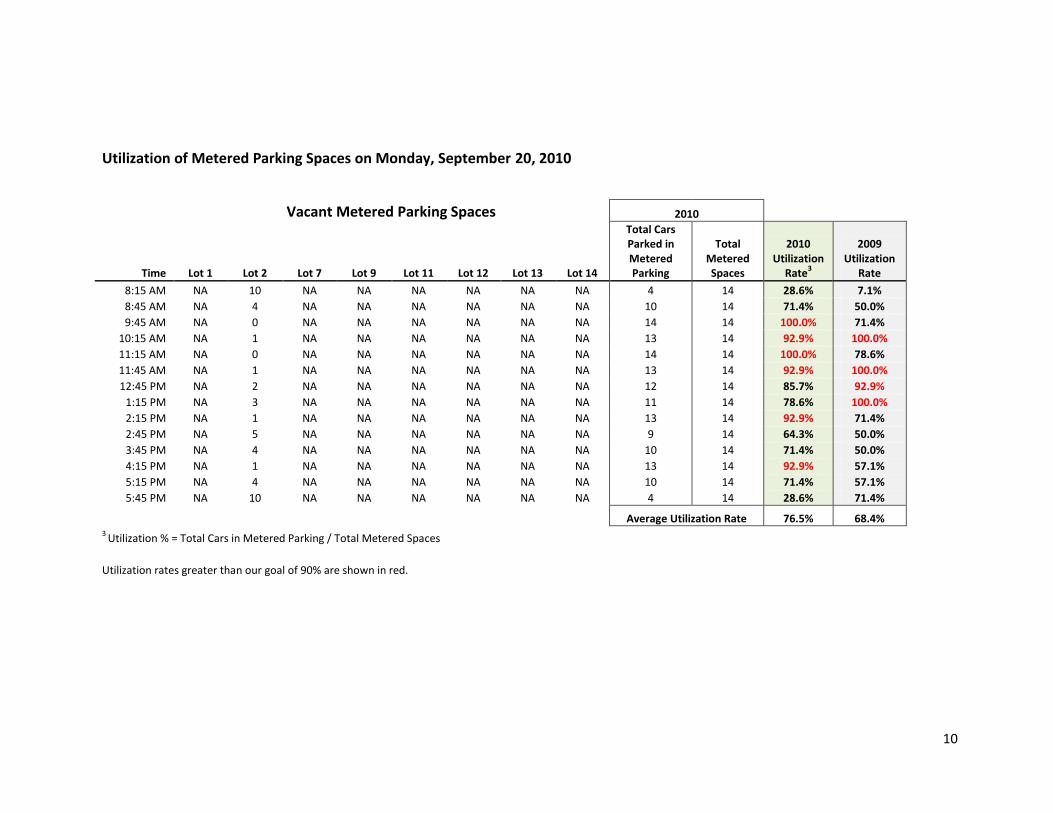
Utilization of Metered Parking Spaces on Monday, September 20, 2010
Vacant Metered Parking Spaces 2010
Time Lot 1 Lot 2 Lot 7 Lot 9 Lot 11 Lot 12 Lot 13 Lot 14
Total Cars Parked in Metered Parking
Total Metered Spaces
2010 Utilization
Rate3
2009 Utilization
Rate
8:15 AM NA 10 NA NA NA NA NA NA 4 14 28.6% 7.1%
8:45 AM NA 4 NA NA NA NA NA NA 10 14 71.4% 50.0%
9:45 AM NA 0 NA NA NA NA NA NA 14 14 100.0% 71.4%
10:15 AM NA 1 NA NA NA NA NA NA 13 14 92.9% 100.0%
11:15 AM NA 0 NA NA NA NA NA NA 14 14 100.0% 78.6%
11:45 AM NA 1 NA NA NA NA NA NA 13 14 92.9% 100.0%
12:45 PM NA 2 NA NA NA NA NA NA 12 14 85.7% 92.9%
1:15 PM NA 3 NA NA NA NA NA NA 11 14 78.6% 100.0%
2:15 PM NA 1 NA NA NA NA NA NA 13 14 92.9% 71.4%
2:45 PM NA 5 NA NA NA NA NA NA 9 14 64.3% 50.0%
3:45 PM NA 4 NA NA NA NA NA NA 10 14 71.4% 50.0%
4:15 PM NA 1 NA NA NA NA NA NA 13 14 92.9% 57.1%
5:15 PM NA 4 NA NA NA NA NA NA 10 14 71.4% 57.1%
5:45 PM NA 10 NA NA NA NA NA NA 4 14 28.6% 71.4%
Average Utilization Rate 76.5% 68.4%
3 Utilization % = Total Cars in Metered Parking / Total Metered Spaces
Utilization rates greater than our goal of 90% are shown in red.
11
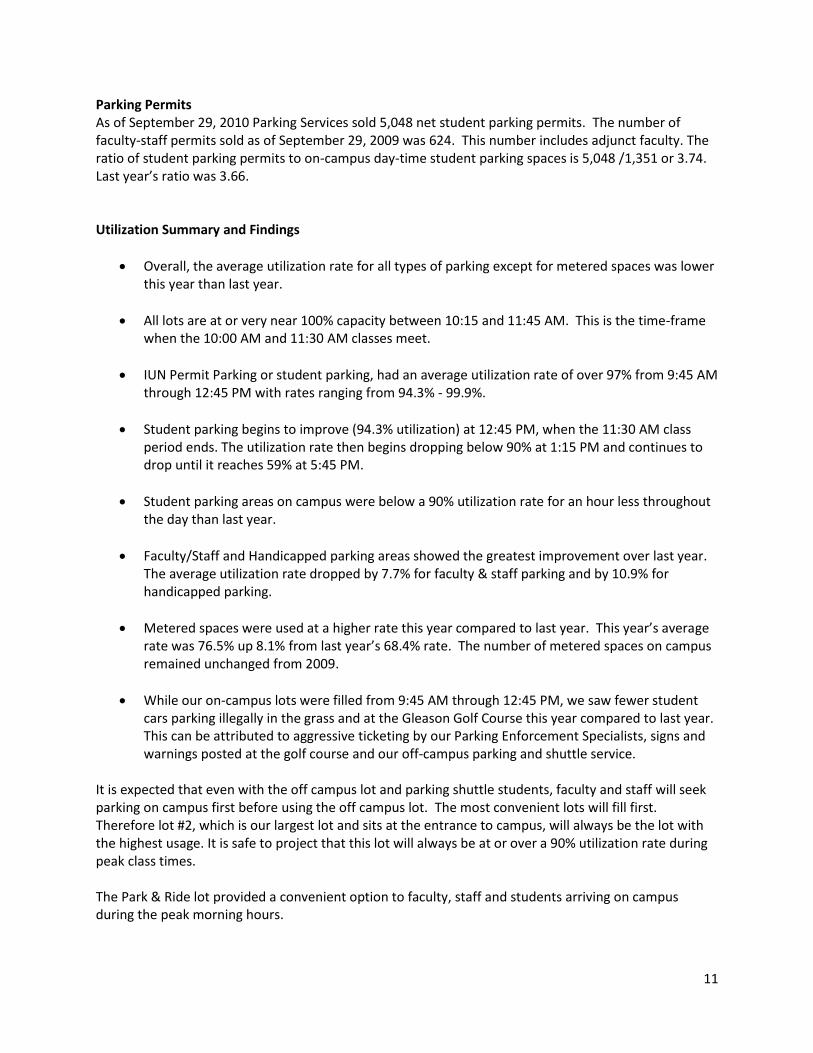
Parking Permits As of September 29, 2010 Parking Services sold 5,048 net student parking permits. The number of faculty-staff permits sold as of September 29, 2009 was 624. This number includes adjunct faculty. The ratio of student parking permits to on-campus day-time student parking spaces is 5,048 /1,351 or 3.74. Last year’s ratio was 3.66. Utilization Summary and Findings
Overall, the average utilization rate for all types of parking except for metered spaces was lower this year than last year.
All lots are at or very near 100% capacity between 10:15 and 11:45 AM. This is the time-frame when the 10:00 AM and 11:30 AM classes meet.
IUN Permit Parking or student parking, had an average utilization rate of over 97% from 9:45 AM through 12:45 PM with rates ranging from 94.3% - 99.9%.
Student parking begins to improve (94.3% utilization) at 12:45 PM, when the 11:30 AM class period ends. The utilization rate then begins dropping below 90% at 1:15 PM and continues to drop until it reaches 59% at 5:45 PM.
Student parking areas on campus were below a 90% utilization rate for an hour less throughout the day than last year.
Faculty/Staff and Handicapped parking areas showed the greatest improvement over last year. The average utilization rate dropped by 7.7% for faculty & staff parking and by 10.9% for handicapped parking.
Metered spaces were used at a higher rate this year compared to last year. This year’s average rate was 76.5% up 8.1% from last year’s 68.4% rate. The number of metered spaces on campus remained unchanged from 2009.
While our on-campus lots were filled from 9:45 AM through 12:45 PM, we saw fewer student cars parking illegally in the grass and at the Gleason Golf Course this year compared to last year. This can be attributed to aggressive ticketing by our Parking Enforcement Specialists, signs and warnings posted at the golf course and our off-campus parking and shuttle service.
It is expected that even with the off campus lot and parking shuttle students, faculty and staff will seek parking on campus first before using the off campus lot. The most convenient lots will fill first. Therefore lot #2, which is our largest lot and sits at the entrance to campus, will always be the lot with the highest usage. It is safe to project that this lot will always be at or over a 90% utilization rate during peak class times. The Park & Ride lot provided a convenient option to faculty, staff and students arriving on campus during the peak morning hours.
12
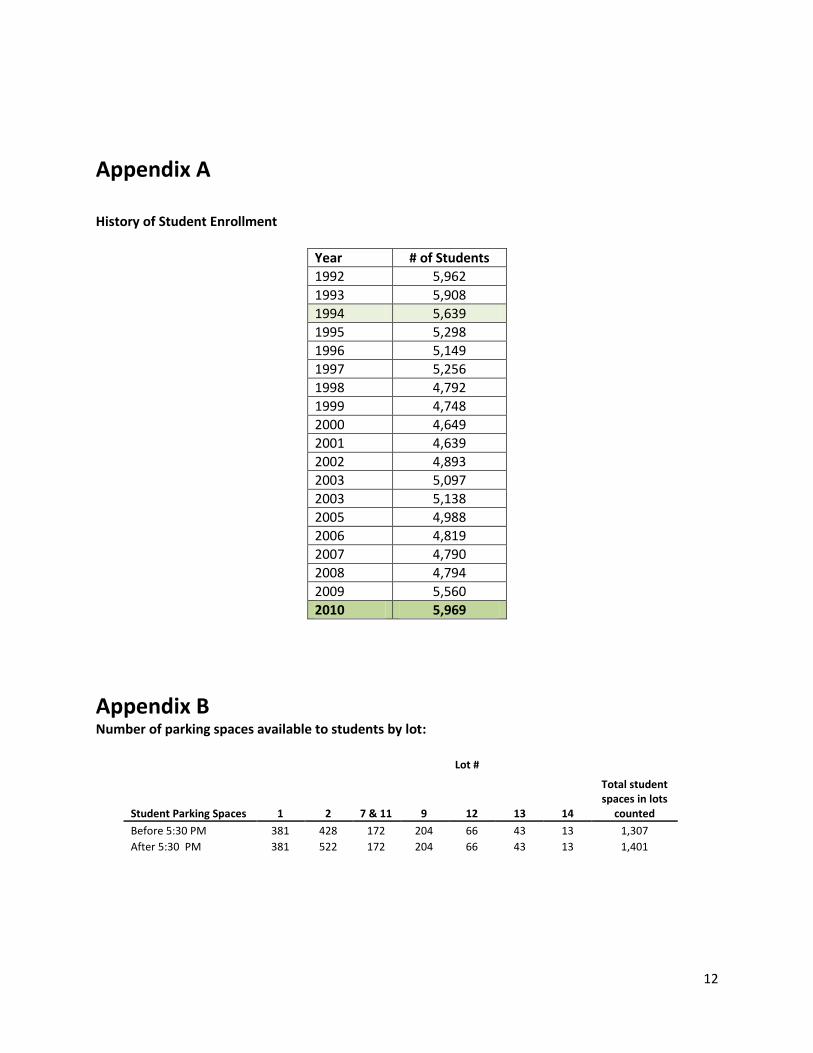
Appendix A History of Student Enrollment
Year # of Students
1992 5,962
1993 5,908
1994 5,639
1995 5,298
1996 5,149
1997 5,256
1998 4,792
1999 4,748
2000 4,649
2001 4,639
2002 4,893
2003 5,097
2003 5,138
2005 4,988
2006 4,819
2007 4,790
2008 4,794
2009 5,560
2010 5,969
Appendix B Number of parking spaces available to students by lot:
Lot #
Student Parking Spaces 1 2 7 & 11 9 12 13 14
Total student spaces in lots
counted
Before 5:30 PM 381 428 172 204 66 43 13 1,307
After 5:30 PM 381 522 172 204 66 43 13 1,401
13
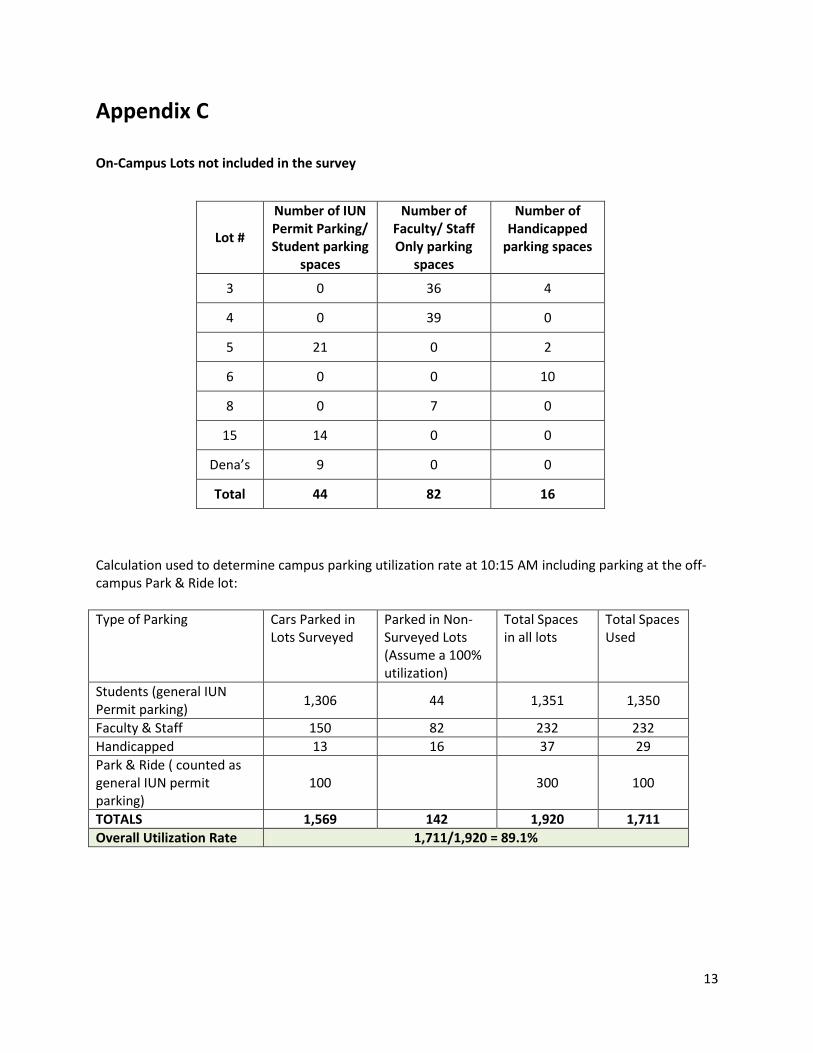
Appendix C On-Campus Lots not included in the survey
Lot #
Number of IUN Permit Parking/ Student parking
spaces
Number of Faculty/ Staff Only parking
spaces
Number of Handicapped
parking spaces
3 0 36 4
4 0 39 0
5 21 0 2
6 0 0 10
8 0 7 0
15 14 0 0
Dena’s 9 0 0
Total 44 82 16
Calculation used to determine campus parking utilization rate at 10:15 AM including parking at the off-campus Park & Ride lot:
Type of Parking Cars Parked in Lots Surveyed
Parked in Non-Surveyed Lots (Assume a 100% utilization)
Total Spaces in all lots
Total Spaces Used
Students (general IUN Permit parking)
1,306 44 1,351 1,350
Faculty & Staff 150 82 232 232
Handicapped 13 16 37 29
Park & Ride ( counted as general IUN permit parking)
100 300 100
TOTALS 1,569 142 1,920 1,711
Overall Utilization Rate 1,711/1,920 = 89.1%