Embed Size (px)
Citation preview
Université d’Avignon et des Pays de Vaucluse
Ecole doctorale 536 « Sciences et Agrosciences »
THESE
Présentée pour l’obtention du grade de
Docteur de l’Université d’Avignon et des Pays de Vaucluse
Restauration de marais temporaires et de pelouses méso-xériques à
partir d’anciennes rizières : Rôle respectif des filtres dans
l'assemblage des communautés
Temporary wetland and meso-xeric grassland restoration on former
ricefields: Respective role of filters in community assembly
Isabelle MULLER
Soutenance prévue le 6 décembre 2013 devant le jury composé de :
Anne BONIS Chargée de recherches, H.D.R. Rapporteur Université de Rennes
Sharon COLLINGE Professeur Rapporteur University of Colorado-Boulder
Armin BISCHOFF Professeur Examinateur Université d’Avignon et des Pays de Vaucluse
Gudrun BORNETTE Directeur de Recherche CNRS Examinateur Université de Lyon
Elise BUISSON Maître de conférences, H.D.R. Directrice de thèse Université d’Avignon et des Pays de Vaucluse
François MESLEARD Directeur de recherche, Tour du Valat Directeur de thèse Professeur associé Université d’Avignon et des Pays de Vaucluse
Thèse préparée au sein de L’Institut Méditerranéen de Biodiversité et d’Ecologie et de la Tour du Valat


A ceux qui sont nés durant ces trois ans,
En particulier,
Hugo et son frère, Norah, Thibaut, et Alba.


Remerciements
Toute ma gratitude va à mes deux directeurs de thèse, Elise Buisson et François Mesléard. Je
remercie François pour avoir toujours été présent dans mon cheminement intellectuel et
personnel, pour avoir corrigé pleinement ce manuscrit, et pour tous tes commentaires qui
ajoutaient de la couleur à la correction. Je ne partagerai ici que les plus drôles: « A virer ces
formulations de teenager », « Cette phrase est comme les montres de Dali, c’est du très mou »,
« Là tu sautes comme un cheveux dans l’assiette de soupe de mon grand-père, qui n’en avait pas
beaucoup… des cheveux », « anglais à chier », « bon ça ne mange pas de pain, mais tu ne gagnes
pas non plus le concours de celui qui fait pipi le plus loin de l’école du quartier avec ça ». Je
remercie Elise pour toute cette énergie que tu arrives à déployer, toujours avec le sourire, tu as su
calmer mes inquiétudes, tu as trouvé des solutions à tous les problèmes et tu m’as encouragée.
Au delà de ton sens de l’organisation, tes qualités humaines font que c’est un plaisir de travailler
avec toi. Merci à vous deux, à votre complémentarité, à votre engagement dans l’encadrement de
cette thèse et à la liberté que vous m’avez accordée, me laissant prendre des chemins tout en me
guidant.
Merci à tous les membres du jury Anne Bonis, Sharon Collinge, Armin Bischoff et Gudrun Bornette, pour avoir accepté cette lecture. En espérant avoir suscité votre intérêt pour ce travail.
Les travaux de cette thèse n’auraient pas pu être réalisés sans financements de la Région
PACA pour l’attribution de ma bourse de thèse ; l’Université d’Avignon et des Pays de Vaucluse
ainsi que le CIES Provence, l’Institut Universitaire de Technologie et sa direction, le département
Génie Biologique, la chef de département Aline Le Menn pour m’avoir permis d’être moniteur
pendant trois années. Je profite de l'occasion pour saluer l’indulgence des étudiants ! Merci à
l’Institut Méditerranéen de Biodiversité et d’Ecologie marine et continentale et Thierry Dutoit
pour m’avoir accueillie au sein de son équipe de recherche. Merci à la Tour du Valat et ses
directeurs, qui m’ont accueillie dans leurs locaux, m’ont fait profiter d’un cadre de travail
extraordinaire et ont contribué au bon fonctionnement de cette thèse.
Le projet du Cassaïre a mobilisé des nombreux acteurs et financeurs que je tiens à remercier.
Tout d’abord, merci à l’équipe des Marais du Vigueirat, et à son directeur, Jean-Laurent Lucchesi,
pour leur beau marais et leurs belles initiatives. Aux gardes toujours disponibles pour remettre en
eau, sortir les moutons, arrêter l’eau, rentrer les moutons et toutes les autres demandes
saugrenues !
Je souhaite particulièrement remercier Grégoire Massez qui, malgré les petites moqueries !,
m’a consacré du temps et de l’énergie et avec qui il était toujours agréable de passer un moment
et de parler de l’avancée des travaux ou d’autres sujets ! Et je m’excuse une dernière fois pour la
barrière.
Le Conservatoire du Littoral et des Rivages lacustres, l’Agence de l’Eau, le Conseil Régional
Provence-Alpes-Côte-d’Azur, le Conseil Général des Bouches-du-Rhône, l’Office National de la
Chasse et de la Faune Sauvage, et la Fédération départementale des chasseurs des Bouches-du-
Rhône ont financé ce projet de restauration.
Merci à la Mairie d’Arles, le Parc Naturel Régional de Camargue, le CEFE-CNRS et le CPIE
Rhône-Pays d’Arles, participants du comité de pilotage du projet du Cassaïre. Je remercie

particulièrement l’association de chasse de Mas Thibert pour la motopompe et pour leur
implication dans ce projet participatif, en espérant qu’un jour, un canard soit chassé sur le
Cassaïre.
Je remercie également l’Entreprise Masini qui a réalisé les travaux, Michel Allemand,
Président de l’ASA de remembrement de Mas Thibert, qui a permis les premières mises en eau du
marais, et les éleveurs Hadrien et Bernard Poujol, pour leurs bêtes.
Merci à Loic Willm, Nicole Yavercovski, Lenka Brousset, Daniel Pavon et Nathalie Patry. La
mise en œuvre de ce travail a été permise par vos compétences, motivations et conseils. Une
mention spéciale pour Nicole pour sa connaissance sans faille, sa disponibilité et sa douceur.
A mes trois stagiaires, Julie Chenot, Johan Friry et Benoit Lime. Vous avez amplement
contribué à ces travaux de thèse et avez fait un travail remarquable, je vous en remercie et vous
souhaite de belles expériences.
A Aline Waterkeyn pour avoir suscité mon intérêt sur les invertébrés et à Hector Rodriguez
pour nous avoir suivies dans cette aventure, pour s’être investi dans l’échantillonnage et pour
m’avoir fait partager ses connaissances. Promis ça sera publié !
Jean-Baptiste Mouronval m’a accompagné tout au long de cette thèse. Ton exigence et ta
perspicacité ont permis d’affiner mes propos. J’ai eu plaisir à partager avec toi ces journées de
terrain et ces réflexions diverses et variées.
Je remercie les participants de mon comité de thèse, Thierry Dutoit, Claire Lavigne, Patrick
Grillas et Emmanuel Corcket, qui ont su apporté du recul et de nouveaux points de vue pour cette
thèse. Je remercie particulièrement Patrick pour ton intérêt sur le sujet et nos échanges
enrichissants. Malgré ton emploi du temps, tu as toujours été présent et à l’écoute, ouvert,
curieux et critique.
Le rire, nous dit le dictionnaire, est un comportement réflexe, exprimant généralement un
sentiment de gaieté, de joie ou d'amusement, qui se manifeste par un enchaînement de petites
expirations saccadées accompagnées d'une vocalisation inarticulée plus ou moins bruyante. Aux
rires alors, qui sont si profitables dans une vie, et à ceux avec qui on les partage. De l’IUT à la Tour
du Valat, de la pause café du matin à la sortie compost, du covoiturage au repas de midi, des
trajets à vélo aux pauses café de l’aprem’, j’ai été entourée de collègues avec qui il faisait bon rire,
et pas seulement. Merci à Renaud avec qui, en dépit de nos divergences, les discussions
scientifiques et autres, les randos post-colloques et les fous rires, m’ont pleinement enrichi.
A Solène, pour son soutien et pour le shopping, à Teddy, Adeline, Swanni et payou Jeff,
malgré qu’on soit une petite équipe, on n’a pas à se plaindre à Avignon !
A Thomas mon compagnon de cueillette de mûres, remplissage de bouteille, pause midi et
tant d’autres choses. Au bureau de Damien, Antony et Elvin, où on y découvre des sites militants,
la biologie du Chamaeleo chamaeleon, et le nouvel instrument de musique de Milla. A Olivier qui
s’obstine à me parler de ses sangliers et à Antoine qui me divertit en mettant du diesel dans une
essence. Et à tous les autres, dont les rires résonnent toujours au labo.
Et parce qu’on est plus fort quand on est une équipe, merci Flo et Anne-So pour avoir formé
cette belle équipe. Flo, tu nous as soutenu, accompagné tard le soir au boulot, et fait rire
jusqu’aux larmes. Ne t’inquiète pas pour mon avenir, un jour tu auras du fromage de chèvre à l’œil

! Anne-Sophie, on ne se rend pas compte la chance que c’est d’avoir quelqu’un qui « rigoule » à la
blague « je change les o en ou » ! T’es une vrai bandidas, ne l’oublie jamais !
Trois ans de thèse, c'est aussi 3 ans de vie, de joie, de folie. On grandit, on peste, on voyage,
on connait des petits et des grands bonheurs, des peurs, on regarde des photos à Arles, des
pièces de théâtre à Avignon, on va marcher dans les Ecrins, à Venasque, à Bugarach, sur le GR20,
on risque sa vie face à des avalanches et des taureaux, on mange un quart de vache, on rencontre
un amoureux, on relit nos mails parce qu’on se trouve drôle, on fait des couscous trop bons, on
achète pour 100 € de moutardes à Dijon, on est jamais trop bon, on mange plein de pastels, on
rêve de s’acheter une maison à Aullène, face aux Dentelles, ou juste un terrain avec une piscine
naturelle, on rentre dans un parking réservé au 1.5 m avec un camion de 2 m, on se fait surprendre
rue Mijeanne, on est les années 90 tous les mois de novembre, on a le syndrome du 26 août, on
devient sceptique devant un cube Maggi, on dort avec le chat Bonjouk, on a la chance de voir le
ciel se déchainer, on se déchaine d’ailleurs sur les pistes de danse jusqu’a ce que le jour se lève, on
perd son pantalon, on a peur de dormir seule dans le van, on mime la mer à boire et on boit la
Méditerranée, on est la colloc du cœur, on dit Merci à Nikki pour ses pizzas, on participe à la Tchek
aventure, on va compter les Chamois dans les Baronnies, on fait des bains de minuit, on va
devenir témoin, on voit naître pleins de bébés, les copains qui se casent, la Tatie qui pose les
mêmes questions, les parents qui vont à la retraite, la vie en somme…on devient sage, on devient
fou, on veut du changement, de la stabilité, et puis on a tant d'autres souvenirs qui s’effacent.
A tous ces gens qui m’accompagnent sur le chemin joyeux, chaotique et fou, de la vie : Aux
Camarguais, Joce et Maggy, Thomas, Clémence, Gwen, Cyril, Fred, Elsa ; aux guyanaises, Marie-
Laure, Amandine, Sidonie, aux copines de fac, Anaïs, Laurence et Flo, aux copines de prépa,
Antony, Sophie, Delphine, aux strasbourgeoises, Cam et Auré, aux avignonnais de l’INRA, Céline,
Myriam et Carole, à ceux de la rue Saint Guillaume, Chacha, O2, FloFlo, Haï, Amar, Renaud, aux
papés de toujours Simon et Vincent. A Baptiste, qui m’a appris à aimer la poésie, le jazz et avec qui
mes soucis de thèse se résolvent et se dissolvent. A mes parents, qui m’ont donné ce que l’on
peut donner de mieux à ses enfants : le goût de l’indépendance tout en maintenant ce sentiment
de protection inébranlable et la passion pour la Terre, et à ma belle grande sœur Caroline, même
si dans la famille, point de flatterie.
Et puis on se rend compte qu’il est impossible de mettre les gens dans des cases, et que les
collègues deviennent des amis et qu’ils ont tout à fait leur place ici. Alors merci à eux, pour ces
trois ans de belle vie.

Table des matières
Introduction Générale ................................................................................................................ 1
I.1. Contexte général : le déclin de la biodiversité ....................................................... 2
I.2. Objectifs et organisation de la thèse ..................................................................... 3
I.3. L’écologie de la restauration .................................................................................. 6
I.3.1. Son origine ........................................................................................................ 6
I.3.2. Définition et objectifs ...................................................................................... 7
I.3.3. L’écologie de la restauration en lien avec d’autres disciplines ..................... 9
I.4. L’écologie des communautés ................................................................................ 10
I.4.1. Les communautés végétales .......................................................................... 10
I.4.2. La succession .................................................................................................. 10
I.4.3. Perturbations, stress et résilience ................................................................. 11
I.4.4. Théories d’assemblage des communautés ................................................... 13
I.4.5. Des théories d’écologie à la pratique de la restauration écologique .......... 17
I.5. Evaluation de la réussite d’une restauration ........................................................ 18
I.5.1. Les indicateurs ................................................................................................. 18
I.5.2. L’approche communauté végétale ................................................................ 19
I.5.3. Prise en compte d’autres compartiments de l’écosystème ........................ 20
I.6. Caractéristiques de la Camargue .......................................................................... 20
I.6.1. Contexte géographique et géologique permettant une diversité de milieux
................................................................................................................................. 20
I.6.2. Un delta : son histoire et sa dynamique en lien avec une diversité d’acteurs
.................................................................................................................................. 21
Transition to Chapter 1 ............................................................................................................ 23
Chapter 1 - Presentation of the Cassaïre restoration project and goals .............................. 25
1.1. Defining reference ecosystem .............................................................................. 26
1.2. The Cassaïre project .............................................................................................. 27
1.2.1. Restoration project at the Cassaïre site ........................................................ 27
1.2.2. Reference ecosystems of the Cassaïre site .................................................. 32
1.2.2.1. Mediterranean temporary wetland ....................................................... 32
1.2.2.2. Mediterranean meso-xeric grassland ................................................... 33

1.2.2.3. Reference choice and landscape importance in restoration .............. 34
1.3. Ecological History of the Cassaïre site ................................................................. 35
1.3.1. Aims and methods ......................................................................................... 35
1.3.2. Results ............................................................................................................ 36
1.3.3. Confirmation of our reference ecosystems ................................................. 40
1.4. Restoration vs. novel ecosystem: Why restore and how do we justify
restoration? ................................................................................................................... 41
1.4.1. Restored ecosystem vs. novel ecosystem..................................................... 41
1.4.2. Restoration on arable land ............................................................................ 41
Transition to Chapter 2 ........................................................................................................... 43
Chapter 2 - Regional pool species: relative contribution of seed bank, seed rain, and
extant vegetation in aquatic and terrestrial ecosystem ............................................. 45
2.1. Introduction........................................................................................................... 46
2.2. Materials and Methods ........................................................................................ 50
2.2.1. Study site ........................................................................................................ 50
2.2.2. Abiotic conditions for restoration ................................................................ 52
2.2.3. Vegetation monitoring.................................................................................. 52
2.2.4. Soil seed bank................................................................................................ 53
2.2.5. Seed rain ........................................................................................................ 54
2.2.6. Data analysis .................................................................................................. 55
2.3. Results ................................................................................................................... 56
2.3.1. Restoration potential from the regional species pool ................................ 56
2.3.2. Soil seed bank ................................................................................................ 58
2.3.3. Seed rain ......................................................................................................... 61
2.3.4. Relationships between soil seed bank and seed rain (sticky traps +
windsock traps) in terrestrial conditions .............................................................. 62
2.3.5. Relationships among soil seed bank and seed rain (filter and windsock
traps) in aquatic condition ..................................................................................... 64
2.4. Discussion ............................................................................................................. 67
2.4.1. Soil seed bank and seed rain ......................................................................... 67
2.4.2. Spontaneous vegetation development ....................................................... 69

2.4.3. Mediterranean oligotrophic grassland vs. temporary wetland ecosystem
restoration .............................................................................................................. 70
2.4.4. Perspective of vegetation restoration ......................................................... 71
Transition to Chapter 3 ........................................................................................................... 74
Chapter 3 – Creation of Mediterranean temporary wetland using soil transfer ................. 77
Section 3.1: Temporary wetland restoration after rice cultivation: is soil transfer
required for aquatic plant colonization? ............................................................................ 79
3.1.1. Introduction ........................................................................................................ 80
3.1.2. Materials and methods ...................................................................................... 82
3.1.2.1. Study site ..................................................................................................... 82
3.1.2.2. Donor sites .................................................................................................. 83
3.1.2.3. Block experiments and soil transfer .......................................................... 84
3.1.2.4. Vegetation monitoring ............................................................................... 85
3.1.2.5. Soil nutrients ............................................................................................... 87
3.1.2.6. Data analysis ............................................................................................... 87
3.1.3. Results ................................................................................................................ 88
3.1.3.1. Soil nutrients ............................................................................................... 88
3.1.3.2. Effect of soil transfer on aquatic vegetation ............................................ 90
3.1.3.3. Effect of soil transfer on the different species categories ...................... 92
3.1.4. Discussion ........................................................................................................... 93
3.1.4.1. Soil properties ............................................................................................. 93
3.1.4.2. Natural colonization ................................................................................... 95
3.1.4.3. Effect of soil transfer on the aquatic plant community ........................... 96
3.1.4.4. Other benefits of soil transfer ................................................................... 97
3.1.4.5. Restoration perspectives and the importance of time and monitoring . 98
Section 3.2: Effectiveness of soil transfer in restoring Mediterranean temporary
wetland invertebrate communities................................................................................... 101
3.2.1. Introduction ....................................................................................................... 102
3.2.2. Methods ........................................................................................................... 104
3.2.2.1. Study site ................................................................................................... 104
3.2.2.2. Experimental design and soil transfer ..................................................... 105
3.2.2.3. Zooplankton and macroinvertebrates sampling .................................... 106

3.2.2.4. Data analysis ............................................................................................. 108
3.2.2.4.1. Effect of soil transfer on community composition ......................... 108
3.2.2.4.2. Comparison with natural temporary wetlands .............................. 109
3.2.3. Results ............................................................................................................... 110
3.2.3.1. Effect of soil transfer on zooplankton community composition ........... 110
3.2.3.2. Effect of soil transfer on macroinvertebrates community composition 112
3.2.3.3. Comparison with natural temporary wetlands ....................................... 114
3.2.4. Discussion ......................................................................................................... 115
3.2.4.1. Effect of soil transfer on invertebrate communities ............................... 115
3.2.4.2. Implication for restoration: choose of indicators success ..................... 118
Transition to Chapter 4 .......................................................................................................... 120
T.4.1. Difference between invertebrate and plant colonization ......................... 120
T.4.2. Plant material choice for grassland restoration .........................................121
Chapter 4 - Effect of topsoil removal and plant material transfer on vegetation
development in created Mediterranean meso-xeric grasslands ............................... 123
4.1. Introduction ......................................................................................................... 124
4.2. Materials and methods ....................................................................................... 126
4.2.1. Study site ...................................................................................................... 127
4.2.2. Plant material gathering .............................................................................. 128
4.2.3. Restoration treatments ............................................................................... 131
4.2.4. Plant material content ................................................................................. 131
4.2.5. Vegetation monitoring ................................................................................ 132
4.2.6. Cassaïre seed bank sampling ...................................................................... 133
4.2.7. Data analysis ................................................................................................. 133
4.3. Results .................................................................................................................. 135
4.3.1. Effects of topsoil removal on soil nutrients ................................................ 135
4.3.2. Effects of topsoil removal on seeds germinating from the seed bank
(greenhouse) ......................................................................................................... 135
4.3.3. Effects of topsoil removal on spontaneous vegetation development:
comparing transects on no transfer slopes ......................................................... 137
4.3.4. Seed content in plant material (greenhouse) ............................................ 138

4.3.5. Effects of plant material transfer on vegetation development: comparing
no transfer slopes and transfer slopes ................................................................. 139
4.3.6. Effects of topsoil removal on plant material transfer: comparing transects
on transfer slopes .................................................................................................. 141
4.4. Discussion ............................................................................................................ 143
4.4.1. Effects of plant material transfer ................................................................ 143
4.4.2. Effects of topsoil removal .......................................................................... 146
Transition to Discussion ........................................................................................................ 149
TD.1. Effect of introduction design on the temporary wetland ......................... 149
TD.2. Effect of introduction design and density on the meso-xeric grassland .. 151
TD.3. Improvement of diversity in restoration experiment with keystone species
................................................................................................................................ 152
Discussion Générale ............................................................................................................... 155
D.1. Connaissances acquises en écologie des communautés et en écologie de la
restauration ................................................................................................................ 157
D.1.1. Les mécanismes déterminant les communautés végétales ...................... 157
D.1.2. Effets de priorité dans les communautés végétales .................................. 161
D.1.3. Les objectifs de restauration sont-ils atteints ? .......................................... 163
D.2. Différentes réponses dans la dynamique végétale .......................................... 164
D.2.1. Différence entre les communautés aquatiques et les communautés
terrestres ............................................................................................................... 164
D.2.2. Différence entre restauration en mésocosme et à plus large échelle ..... 165
D.3. De l’écologie de la restauration à la restauration écologique : propositions et
recommandations ..................................................................................................... 166
D.3.1. Matériel végétal transféré .......................................................................... 166
D.3.2. Superficie d’ensemencement ..................................................................... 167
D.3.3. Effets de priorité......................................................................................... 169
D.3.4. Intégration de l’ensemble de l’écosystème dans l’évaluation de la
restauration ............................................................................................................ 171
D.4. Perspectives de recherche sur le site du Cassaïre ............................................ 173
D.4.1. Filtre biotique ............................................................................................... 173
D.4.2. Effets de priorité ......................................................................................... 173
D.4.3. Approche services écosystémique dans l’évaluation ............................... 174

D.5. La place de la restauration écologique dans la société .................................... 175
Bibliographie ........................................................................................................................... 178
Annexes ................................................................................................................................. 205
Annexe 1: New synthetic indicators to assess community resilience and
restoration success. Ecological indicators. Jaunatre et al., 2013b. .................... 206
Annexe 2: Espèces présentes dans la banque de grains du Cassaïre, les pelouses
meso-xériques de reference, le materiel vegetal transféré, les mésocosmes
transférés et les mésocosmes témoins. Les espèces cibles sont indiquées en
gras. ........................................................................................................................ 216
Annexe 3: Article sur le Cassaïre. Le Figaro. Juin 2012 ......................................... 219
Annexe 4: Article sur le Cassaïre. Journal du CNRS, Ingénieuse écologie. ........ 220
Résumé .................................................................................................................................. 224
Abstract ................................................................................................................................. 224

Table des Tableaux
Table 1.1: Documentary sources and archives for the various dates ................................... 36
Table 2.1: Species present in seed bank, seed rain, and extant vegetation in terrestrial and
aquatic conditions. Target species are in bold type in the table. ........................ 57
Table 2.2: Correlations (Spearman r, with correlation test of significance, and n= number
of species) between the frequency of seeds (in the soil seed bank and the seed
rain (sticky traps + windsock traps)) and frequency of species recorded in the
vegetation at the three depths (NS: non-significant; *: p<0.05; **: p<0.01). ..... 64
Table 3.1.1: Species occurring in blocks, in donor sites and target hydrophyte species. .... 86
Table 4.1: Mean and standard errors of nutrient contents for the surface soil (0-10 cm) of
the reference grassland and of the Cassaïre site and for the soil at 40 cm deep
at the Cassaïre site (40-60 cm). Df are the degrees of freedom, χ² and p are the
chi² value and p-value of Kruskal-Wallis tests. Values on a line with the same
letter are not significantly different according to pairwise Wilcoxon multiple
comparisons with Holm p adjustment. ................................................................ 135
Tableau D.1: Principaux résultats en écologie des communautés, en écologie de la
restauration et en restauration écologique. Les perspectives de recherche sont
indiquées en italique. ............................................................................................. 172

Table des Figures
Figure I.1 : Schéma général d’organisation de la thèse ........................................................... 4
Figure I.2 : Modèle général illustrant les différents termes de restauration, dans un
graphique à trois dimensions : temps, complexité ou fonction de l’écosystème de
référence, complexité ou fonction d’un autre écosystème. La troisième dimension
est représentée par les pointillés. Modifiée de Aronson et al. (1993) et Buisson
(2011). ................................................................................................................................ 8
Figure I.3 : Relations entre l’écologie théorique, l’écologie de la restauration et la
restauration écologique. Modifiée d’après Falk et al. (2006) et Jaunatre (2012). ...... 10
Figure I.4 : Représentation conceptuelle de la résistance (A) et de la résilience (B)........... 12
Figure I.5: Le modèle de filtre de l’assemblage des communautés. Les trois filtres sont
représentés par les cases grises : la dispersion, le filtre abiotique et le filtre biotique.
Les flèches grises représentent les espèces, capables ou non, de passer les filtres.
Les boucles de rétroaction entre les filtres sont représentées par les flèches noires.
Les disques « R » représentent les différents niveaux potentiels d’intervention de la
restauration. Modifiée d’après Lortie et al. (2004) et Jaunatre (2012). ...................... 14
Figure I.6 : Modèle de transition d’un écosystème entre différents états de fonctionnalité,
illustrant la présence de trois types de seuil : un premier contrôlé par les limitations
biotiques, un second contrôlé par les limitations de la dispersion, et un troisième
contrôlé par les interactions biotiques (modifié de Whisenant 1999). Des exemples
de méthodes utilisées en restauration pour dépasser les seuils à l’installation de la
communauté de référence (i.e. écosystème intact) sont inscrits en parenthèse et en
italique. ............................................................................................................................ 18
Figure 1.7: Les différents secteurs de la Camargue. Le point rouge représente le domaine
du Cassaïre. ..................................................................................................................... 21
Figure T1.1: Location of Chapter 1 in the general thesis organization .................................. 23
Figure 1.1: The different areas of the Camargue and the location of the Cassaïre site (red
dot) in the Plan du Bourg area. The Durance river, the Rhône, and the Crau area, are
also shown. Figure adapted from the official Regional Park of the Camargue area
map. ................................................................................................................................ 28
Figure 1.2: Habitat map of the Cassaïre site, with a majority of fallow land (in black) and
remaining relictual natural habitats (the meso-xeric grasslands in white, the dunes in
light grey and the salt marshes in dark grey). .............................................................. 29

Figure 1.3: Conceptual organization chart of the project design. Figure modified from
Miller and Hobbs (2007). ................................................................................................ 31
Figure 1.4: Distribution of the Mediterranean temporary wetlands (in black) in Camargue
area and location of the Cassaïre site. The grey shading indicates the other wetland
types in the Camargue area. ......................................................................................... 33
Figure 1.5: Distribution of the Mediterranean meso-xeric grasslands (in black) in Camargue
area and location of the Cassaïre site. The grey shading indicates the other wetland
types in the Camargue area. ......................................................................................... 34
Figure 1.6: Extract from County written description, Statistiques des Bouches-du-Rhône
(1821) ............................................................................................................................... 37
Figure 1.7: Provence map (Louis Cundier) indicating the former branch of the Rhône along
the Crau area (1640). The Cassaïre site is located with red dot. ................................. 37
Figure 1.8: Rhône mouth map (JB Bourgignon) indicating fluvial dunes (1706). The
Cassaïre site is indicated by the red dot. ...................................................................... 38
Figure 1.9: Napoleonic land registry of the Cassaïre site delimited in red (1823). ............... 38
Figure 1.10: Extract from the press surrounding the sale of the Cassaïre site (1896). ........ 39
Figure 1.11: Example of digitized aerial images showing the natural habitat (in green) and
the arable habitat (in shaded orange) from 1947 and 1974. ....................................... 39
Figure 1.12: Evolution of % area in natural habitats (grey lines) and cultivated land (black
lines) in the Cassaïre site between 1944 and 1998. Data collected from the analysis
of digitized aerial images. .............................................................................................. 40
Figure 2.1: Sampling design of seed bank, seed rain, and extant vegetation for terrestrial
and aquatic blocks and illustration of the different study questions. ......................... 51
Figure 2.2: Mean and standard errors of A) seedling number in soil seed bank per liter and
B) species richness in soil seed bank per liter of the Cassaïre site in terrestrial
(shaded bars, n=48 plots) and aquatic (white bars, n=48 plots) conditions. The t of
Student and the W of Wilcoxon tests performed are shown above the bars (***:
p<0.001). ......................................................................................................................... 59
Figure 2.3: Mean and standard errors of A) seedling number per soil liter in the soil seed
bank, B) species richness per soil liter in the soil seed bank at the Cassaïre site in (I)
terrestrial conditions, at 0 to 5 cm deep (shaded black bars, n = 12 plots), 5 to 20 cm
deep (shaded dark grey bars, n = 12 plots), 20 to 40 cm deep (shaded light grey bars,
n = 12 plots) and in 40 to 60 cm deep (shaded white bars, n=12 plots) and in (II)
aquatic conditions, at 0 to 5 cm deep (black bars, n = 12 plots), 5 to 20 cm deep (dark
grey bars, n = 12 plots), 20 to 40 cm deep (light grey bars, n = 12 plots), and 40 to 60
cm deep (white bars, n=12 plots). The F of ANOVA or the χ² of Kruskal–Wallis tests
performed are shown above the bars (**: p<0.01; ***: p < 0.001), bars showing the
same letters do not have any significant differences according to Tukey tests or to
pairwise Wilcoxon multiple comparisons with Holm p adjustment. .......................... 60
Figure 2.4: Ordination plot of the Correspondence Analysis based on seed density per cm²
of species (20 plots × 39 species) in windsock traps (black, 8 plots) and sticky traps
(grey, 12 plots). In the interest of clarity, only the 7 species with the higher
contributions to axis are shown. .................................................................................. 62
Figure 2.5: Ordination plot of the Correspondence Analysis based on species
presence/absence (60 plots × 64 species) on extant vegetation (black, 12 plots), soil
seed bank (dark grey, 36 plots), and seed rain (sticky traps + windsock traps, light
grey, 12 plots). In the interest of clarity, only the 29 species with the higher
contributions to axes are shown. ................................................................................. 63
Figure 2.6: Mean and standard errors of Sorensen similarity index based on species
presence/absence between extant vegetation and soil seed bank (dark grey, 36
plots), between extant vegetation and seed rain (sticky traps + windsock traps, light
gray, 12 plots) and between soil seed bank and seed rain (white, 36 plots) at the
three different depths. The F of ANOVA or the χ² of Kruskal–Wallis tests performed
are shown above the bars (NS: non-significant; *: p<0.05; **: p<0.01), bars showing
the same letters do not have any significant differences according to Tukey tests. 65
Figure 2.7: Ordination plot of the Correspondence Analysis based on species
presence/absence in at least 2 samples (26 plots × 18 species) on extant vegetation
(black, 4 plots), soil seed bank (dark grey, 3 plots) and seed rain (filter traps +
windsock traps, light grey, 19 plots). ............................................................................ 66
Figure 2.8: Mean and standard errors of Sorensen similarity indices, based on species
presence/absence, between extant vegetation and soil seed bank (dark grey, 12
plots), between extant vegetation and seed rain (light gray, 76 plots), and between
soil seed bank and seed rain (white, 57 plots). The W of Wilcoxon test performed
are shown above the bars (***: p<0.001). ................................................................... 67
Figure T3.1: Location the Chapter 3.1 and Chapter 3.2 in the general thesis organization . 74
Figure 3.1.1: Location of the Cassaïre site (in black) and of the five donor sites (grey circle).
The light grey shading indicates the wetlands of the Camargue area (A). Side view of
one soil transfer block (B). Experimental design of restoration treatments at

Cassaïre site (C). C = control blocks and ST = soil transfer blocks (black rectangle
indicates the soil transfer). ............................................................................................ 83
Figure 3.1.2: Mean values ± standard errors of total Carbon (C), total Nitrogen (N), Organic
Matter (OM), Phosphorus (P2O5), pH and Conductivity in the surface soil of the
donor sites (black bars, n=5), in the surface soil of the Cassaïre site (current soil
surface; white bars, n=5) and in the deeper soil (40-60 cm deep) of the Cassaïre site
(future soil surface; grey bars, n=5). Df are the degrees of freedom. The F of ANOVA
or the X² of Kruskal-Wallis tests are shown above the bars (***: p<0.001, **: p<0.01),
bars showing common letters do not have any significant differences according to
Tukey post-hoc tests or pairwise multiple comparisons with Bonferroni p
adjustment. .................................................................................................................... 89
Figure 3.1.3: Ordination plot of the Principal Component Analysis based on soil nutrient
contents (15 samples × 6 variables) of surface soil of the donor sites (black, 5 plots),
of surface soil of the Cassaïre site (current soil surface; light grey, 5 plots), and of
deeper soil (40-60 cm deep) of the Cassaïre site (future soil surface; dark grey, 5
plots). Ellipses are centred on the barycentre and their forms are weighted by the
distribution of all points corresponding to the same treatment (surface donor,
surface soil, deeper soil). ............................................................................................... 90
Figure 3.1.4: Mean and standard errors of species richness (8 m²) (A), total cover of
aquatic vegetation (%) (B) and Bray-Curtis similarity index on aquatic vegetation (C)
between donor sites and i) donor sites (black bars, n=5 plots), ii) soil transfer blocks
(grey bars, n=4 plots) and iii) control blocks (white bars, n=4 plots). Df are the
degrees of freedom. The F of ANOVA performed are shown above the bars (***:
p<0.001), bars showing common letters do not have any significant differences
according to Tukey post hoc tests. ................................................................................ 91
Figure 3.1.5: Ordination plot of the Correspondence Analysis of species abundances (13
plots × 28 species) on donor sites (dark, 5 plots), transfer blocks (dark grey, 4 plots)
and control blocks (light grey, 4 plots). Ellipses are centred on the barycentre and
their forms are weighted by the distribution of all points corresponding to the same
treatment (donor sites, transfer blocks, control blocks). ........................................... 92
Figure 3.1.6: Mean and standard errors in species number of the different species
categories in 8 m² plots: the target hydrophyte species (A), the ricefield hydrophyte
weeds (B) and the filamentous algae (C) for donor sites (black bars, n=5 plots), soil
transfer blocks (grey bars, n=4 plots) and control blocks (white bars, n=4 plots). Df
are the degrees of freedom. The F of ANOVA or the X² of Kruskal-Wallis test
performed are shown above the bars (***: p<0.001, **: p<0.01), bars showing
common letters do not have any significant differences according to Tukey post-hoc
tests or pairwise multiple comparisons with Bonferroni p adjustment. .................... 93

Figure 3.2.1: Locations of the Cassaïre site (in black) and the five donor sites (grey circle).
The light grey shading indicates the wetlands of the Camargue area (A). Side view of
one soil transfer block (B). Experimental design of restoration treatments at the
Cassaïre site (C). C = control blocks and T = transfer blocks (black rectangle indicates
the soil transfer). .......................................................................................................... 105
Figure 3.2.2: Mean and standard errors of dissolved oxygen (A), conductivity (B), and
temperature (C) in control blocks (white, n=4) and in soil transfer blocks (grey bars,
n=4). The t of Student test performed are shown above the bars (NS: non
significant). .................................................................................................................... 107
Figure 3.2.3: Ordination plot of the Correspondence analysis based on the zooplankton
composition in soil transfer blocks (dark grey, n=4) and in control blocks (light grey,
n=4). Ellipses are centered on the barycenter and their forms are weighted by
distribution of all points corresponding to the same treatment. .............................. 110
Figure 3.2.4: Mean and standard errors of total zooplankton abundance (A) total
macroinvertebrate abundance (B) and proportional abundance of non-aerial taxa
(C) in control blocks (white, n=4) and soil transfer blocks (grey bars, n=4). The t of
Student test performed are shown above the bars (NS: non significant, *: p<0.05).
........................................................................................................................................ 111
Figure 3.2.5: Mean and standard errors of abundance of copepods (A), ostracods (B) and
Lacophilus (C) in control blocks (white, n=4) and soil transfer blocks (grey bars,
n=4). The t of Student test performed are shown above the bars (*: p<0.05, ***:
p<0.001). .........................................................................................................................112
Figure 3.2.6: Ordination plot of the correspondence analysis based on the
macroinvertebrate composition in soil transfer blocks (filled circles, grey, n=4) and
in control blocks (open circles, white, n=4). Ellipses are centered on the barycenter
and their forms are weighted by the distribution of all points corresponding to the
same treatment. In the interest of clarity, only the 27 taxa with the higher
contributions to axes are shown. ................................................................................ 113
Figure 3.2.7: Mean and standard errors of the percentage of the different functional
feeding guilds in the control blocks (white, n=4) and in the soil transfer blocks (grey
bars, n=4). The t of Student tests or the W of the Wilcoxon tests performed are
shown above the bars (NS: non significant). .............................................................. 114
Figure 3.2.8: Mean and standard errors of Jaccard similarity index between the natural
community and the control blocks (white, n=4) and the soil transfer blocks (grey
bars, n=4). The t of Student tests performed are shown above the bars (NS: non
significant). .................................................................................................................... 115

Figure T4.1 : Location of Chapter 4 in the general thesis organization ............................... 120
Figure 4.1: Location of the Cassaïre site (in black) and of the meso-xeric grassland
corresponding to the reference grassland (in black). The grey shading indicates the
wetlands of the Camargue area. .................................................................................. 127
Figure 4.2: Experimental design of A) one group of blocks (five in total), B) side view of
one block with the two monitoring transects and C) the top view of one block with
transfer slope, the 30 × 30 cm monitoring plots are shown. The grey color shows
zone where plant material was spread. ...................................................................... 129
Figure 4.3: A) Ordination plot of the Correspondence Analysis based on species
abundances (18 plots × 47 species) on the reference grassland grouped by years,
2007 to 2012. Ellipses are centered on the barycentre and their forms are weighted
by the distribution of all points corresponding to the same year. B) Mean and
standard errors of species richness (1600 cm²) of the reference grassland in 2007 to
2012. C) Mean and standard errors of total cover of vegetation on 1600 cm² (%) of
the reference grassland in 2007 to 2012. The χ² and p-value of Kruskal-Wallis tests
performed are shown above the bars (NS: non-significant). In the interests of
clarity, only the 23 species with the higher contributions to axis are shown. .......... 130
Figure 4.4: Mean and standard errors of A) seedling number of soil seed bank per liter and
B) species richness of soil seed bank per liter of the Cassaïre site without topsoil
removal (0 to 5 cm deep, black bars, n=12 plots), with 5 cm removal depth (5 to 20
cm deep, grey bars, corresponding to the transect 1, n=12 plots) and with 20 cm
removal depth (20 to 40 cm deep, white bars, corresponding to the transect 2, n=12
plots). The F of ANOVA performed are shown above the bars (**: p<0.01), bars
showing the same letters do not have any significant differences according to Tukey
tests. .............................................................................................................................. 136
Figure 4.5: Mean and standard errors of A) species richness (900 cm²), B) Jaccard
similarity index and C) target species richness (900 cm²) for the reference grassland
in 2010 (black bars, n=20 plots), plant material (dark grey, n=3 plots), transfer slopes
in 2011 (light grey bars, n=30 plots), transfer slopes in 2012 (light grey bars,
n=30plots), transfer slopes in 2013 (light grey bars, n=30plots), no transfer slopes in
2011 (white bars, n=30 plots), no transfer slopes in 2012 (white bars, n=30 plots) and
no transfer slopes in 2013 (white bars, n=30plots). Df are the degrees of freedom.
The F of ANOVA or the χ ² of Kruskal-Wallis tests performed are shown above the
bars (***: p<0.001), bars showing the same letters do not have any significant
differences according Tukey test or to pairwise Wilcoxon multiple comparisons with
Holm p adjustment. ...................................................................................................... 138

Figure 4.6: Mean and standard errors of A) species richness (900 cm²), B) target species
richness (900 cm²) and C) total cover of vegetation on 900 cm² (%) for the transect 1
(T1) of transfer slopes in 2011 (grey bars, n=15 plots), in 2012 (grey bars, n=15 plots),
in 2013 (grey bars, n=15 plots), for the transect 2 (T2) of transfer slopes in 2011
(shaded grey bars, n=15 plots), in 2012 (shaded grey bars, n=15 plots), in 2013
(shaded grey bars, n=15 plots), for the transect 1 (T1) of no transfer slopes in 2011
(white bars, n=15 plots), in 2012 (white bars, n=15 plots), in 2013 (white bars, n=15
plots), for the transect 2 (T2) of no transfer slopes in 2011 (shaded white bars, n=15
plots), in 2012 (shaded white bars, n=15 plots), in 2013 (shaded white bars, n=15
plots). Df are the degrees of freedom. The χ² of Kruskal-Wallis tests performed are
shown above the bars (***: p<0.001). Within each treatment to compare transects,
asterisks indicate significant differences according to pairwise Wilcoxon multiple
comparisons with Holm p adjustment (*: p<0.05 and NS: p>0.05). .......................... 141
Figure 4.7: A) Ordination plot of the Correspondence Analysis based on species
presence/absence of the 28 species present in at least 3 plots (83 plots × 94 species)
on reference grassland (dark, 20 plots), plant material (dark grey, 3 plots), transfer
slopes in 2013 (grey, 30 plots) and no transfer slopes in 2013 (light grey, 30 plots).
Dark lines represent the succession of vegetation from 2011 to 2012 (1st to 2nd year),
and from 2012 to 2013 (2nd to 3rd year), for transfer slope and no transfer slope,
according to the position of their barycenter. In the interests of clarity, only the 50
species with the higher contributions to axis are shown. ......................................... 142
Figure TD.1 : The four experimental introduction design tested in large scale for the
temporary wetland. The grey shading indicates the soil inoculation in the plots. ... 150
Figure TD.2 : Mean and standard errors of species richness (A) and target species number
(B) for control (white bars, n=5 plots), 100% soil inoculation (grey bars, n= 5 plots),
1/3 inoculate in 1 strip (large shaded grey bars, n= 5 plots) and 1/3 inoculate in 2 strips
(tight shaded grey bars, n= 5 plots). The F of ANOVA tests are shown above the bars
(*** : p<0.001), different letters above bars indicate significant differences
according to Tukey post-hoc tests. .............................................................................. 150
Figure TD.3 : The seven treatments tested at the operational scale for grassland. The grey
shading indicates the plant material inoculation in the plots (dark grey: high
density ; light grey: low density). The red squares indicate the permanent quadrats
used to survey vegetation. ........................................................................................... 151
Figure TD.4 : Mean and standard errors of species richness (A) and target species number
(B) for control (white bars, n=4 plots), 100% plant material inoculation (dark grey
bars, n= 4 plots), 1/2 inoculate in 1 strip (large shaded dark grey bars, n= 4 plots) and
1/2 inoculate in 2 strips(tight shaded dark grey bars, n= 4 plots) in high density and
100% soil inoculation (light grey bars, n= 4 plots), 1/2 inoculate in 1 strip (large shaded

light grey bars, n= 4 plots) and 1/2 inoculate in 2 strips (tight shaded light grey bars,
n= 4 plots) in low density in June 2012. The F of ANOVA test are shown above the
bars (*** : p<0.001), different letters above bars indicate significant differences
according to Tukey post-hoc tests. .............................................................................. 152
Figure TD.5 : Mean and standars errors of species richness with the presence (grey bars)
or with the absence (white bars) of Brachypodium distachyon (A), Hedypnois
cretica (B) and Scorpiurus muricatus (C). The F of ANOVA test are shown above the
bars (*** : p<0.001), different letters above bars indicate significant differences
according to Tukey post-hoc tests. Same results were observed with the number of
target species in the absence or the presence of these three species. .................... 153
Figure D.1 : Schéma général d’organisation de thèse et principaux résultats acquis. ....... 156
Figure D.2 : Principaux résultats des actions de restauration acquis dans le chapitre 2,
chapitre 3.1, chapitre 3.2 et chapitre 4 replacés dans le modèle de filtre de
l’assemblage des communautés. ................................................................................. 161
Figure D.3: Photographie d’une agrégation de Trifolium resupinatum L., Brachypodium
distachyon (L.)P.Beauv, Filago pygmaea L., Parapholis filiformis (Roth) C.E.Hubb.
autour de Scorpiurus muricatus L. ............................................................................... 163
Figure D.4: Photographie du marais restauré à large échelle avec la présence d’algue
filamenteuse Cladophora vagabunda (L.) Hoek sur toute la surface du plan d’eau et
d’une renoncule peltée Ranunculus peltatus Schrank, qui pourrait être utilisée pour
diminuer la présence de Cladophora vagabunda (L.) Hoek. ...................................... 170

Introduction
1
Introduction Générale

Introduction
2
I.1. Contexte général : le déclin de la biodiversité
La conversion des habitats naturels en zones agricoles, urbanisées ou industrielles,
constitue l’un des impacts majeurs de l’Homme sur les écosystèmes. On estime
qu’environ 43% de la surface de la Terre ont déjà été directement transformés (Barnosky
et al. 2012) et jusqu’à plus de 80% dans les pays industrialisés européens (Primack et al.
2012). En addition des conséquences sociales et esthétiques (Ehrlich and Ehrlich 1992;
Meffe and Carroll 1997), les changements subis ont modifié les biens et les services
fournis par ces écosystèmes transformés, et constituent une menace pour la biodiversité
(Millennium Ecosystem Assessment 2005).
Différents niveaux d’organisation caractérisent la biodiversité : génétique, spécifique,
écosystémique (Hunter and Gibbs 2006), dont l’importance pour le fonctionnement des
écosystèmes (Hooper et al. 2005) et donc pour le maintien des usages et à terme la survie
des civilisations est aujourd’hui largement partagée (Millennium Ecosystem Assessment
2005). Ce déclin généralisé de la biodiversité, par effets directs des activités anthropiques
(destruction et fragmentation des habitats, extermination d’espèces et introduction
d’espèces invasives), et par effets indirects à travers le changement climatique (Vitousek
et al. 1997), est aujourd’hui considéré par son ampleur comme la sixième crise écologique
majeure qu’a connue la biodiversité (Barnosky et al. 2012).
Face à la dégradation croissante des écosystèmes (Rands et al. 2010), la restauration
écologique apparaît comme une réponse prometteuse (Wilson 1992; Clewell and Aronson
2006; Clewell and Aronson 2007). Cette discipline largement mobilisée pour la
conservation (Gauthier-Clerc et al. 2013) est ainsi présentée comme l’une des trois
principales actions (gestion, protection, restauration) susceptibles d’enrayer la perte de
la biodiversité (Conférence de Nagoya, COP 10, octobre 2010). Parmi les objectifs du
nouveau plan stratégique pour la biodiversité défini lors de la conférence des Parties
durant la Convention sur la diversité biologique, figure celui de restaurer 15 % des
écosystèmes dégradés d’ici 2020 (Convention on Biological Diversity 2011). Pour répondre
à cet objectif, l’acquisition de connaissances solides en écologie de la restauration
apparaît indispensable.

Introduction
3
C’est dans ce contexte que s’inscrit cette thèse, qui via les mécanismes d’assemblage
des communautés, teste des moyens de restauration de deux écosystèmes typiques de
Camargue après abandon cultural.
I.2. Objectifs et organisation de la thèse
L’objectif général de cette thèse est, pour deux écosystèmes méditerranéens (marais
temporaires et pelouses meso-xériques) ayant été soumis à de fortes perturbations
anthropiques, (1) de mettre en évidence les principaux mécanismes concourant à
l’installation d'une communauté végétale, (2) de tester, pour ces deux écosystèmes, des
techniques de restauration et d'en évaluer les conséquences pour les communautés
végétales mais aussi pour d'autres compartiments de l'écosystème, notamment les
communautés d'invertébrés aquatiques.
Les principales questions abordées dans cette thèse, développée en 4 chapitres,
sont (Figure I.1):
- Comment définir les écosystèmes de référence? (Chapitre 1)
- La restauration des conditions abiotiques permet-elle à la dynamique de la
végétation de tendre vers les communautés de référence? (Chapitre 2)
- En addition de la restauration abiotique, l’apport de matériel végétal permet-il de
restaurer la communauté végétale du milieu aquatique de référence? (Chapitre 3.1)
- La communauté d’invertébrés répond-t-elle différemment de la communauté
végétale à une opération de restauration? (Chapitre 3.2)
- En addition de la restauration abiotique, l’apport de matériel végétal permet-il de
restaurer la communauté végétale du milieu terrestre de référence? (Chapitre 4)
La première étape dans un projet de restauration est de définir un écosystème de
référence que l’on souhaite obtenir ou approcher. Il peut être défini à partir de références
historiques, d’enjeux de conservation ou de services écosystémiques recherchés pour le
futur écosystème à restaurer. Cette étape permet de poser les objectifs de restauration,
de guider les processus de cette restauration et, in fine, d’en évaluer le succès (Society for
Ecological Restoration 2004; Clewell and Aronson 2007; Miller and Hobbs 2007). Le

Introduction
4
chapitre 1 présente la démarche à l’origine du projet de restauration, le site d’étude, ainsi
que les bouleversements qu’a connus celui-ci en relation avec ceux qui ont marqué la
Camargue au cours des trois derniers siècles. Cette première partie s’attache à définir les
écosystèmes de référence et préciser les enjeux de conservation liés à ces écosystèmes,
ainsi que le projet participatif dans lequel s'insère ce projet de restauration.
Ecosystèmes de référence
Ecosystème dégradé
Le transfert de foin permet-il de restaurer les communautés terrestres?
Chapitre 4
Le transfert de sol permet-il de restaurer les communautés
d’invertébrés?
Chapitre 3.2
La restauration des conditions abiotiques est-
elle suffisante?
Chapitre 2
Quel est l’écosystème de référence?
Chapitre 1
Le transfert de sol permet-il de restaurer les
communautés aquatiques?
Chapitre 3.1
Figure I.1: Schéma général d’organisation de la thèse
La restauration des écosystèmes dégradés, en particulier après l'abandon de
l’agriculture intensive, est considérée comme un contexte opportun pour étudier
l’assemblage des communautés (Temperton et al. 2004; Cramer et al. 2008; Prach and

Introduction
5
Walker 2011). Les modèles théoriques d’assemblage des communautés végétales
considèrent que le pool régional des espèces (i.e. espèces disponibles au niveau régional)
est soumis à trois filtres : la dispersion des espèces, les contraintes abiotiques, et les
relations biotiques (Keddy 1992; Lortie et al. 2004; Guisan and Rahbek 2011). Déterminer le
rôle de chaque filtre aide à déterminer les choix dans les traitements à appliquer en terme
de restauration (Hobbs and Norton 2004). Après avoir rétabli les conditions abiotiques
favorables aux espèces de la communauté de référence (manipulation du filtre abiotique,
Prach and Hobbs 2008), l’étude du pool régional d’espèces permet de déterminer la
composition potentielle de la communauté. La succession spontanée après la mise en
place de conditions abiotiques proches de celles de nos écosystèmes de référence en
utilisant l’étrépage de sol est l’objet du chapitre 2. Les résultats permettent d’évaluer la
nécessité de forcer la succession végétale vers nos communautés de références.
Quand la succession spontanée ne peut conduire à la communauté végétale
de l’écosystème de référence ou s’en approcher (l’écosystème n’est pas sur la bonne
trajectoire), une restauration écologique active doit être mise en œuvre (Manchester et
al. 1999; Prach and Pysek 2001; Bischoff 2002; Török et al. 2011b). Il s’agit alors de
déterminer (1) Comment cette restauration active peut-elle être mise en œuvre ? et (2)
Comment les autres compartiments de l’écosystème répondent à cette restauration de la
communauté végétale ? Dans les chapitre 3.1 et chapitre 4 sont testées des techniques de
restauration efficaces (en terme d’assemblage des communautés) et applicables (i.e.
économiquement acceptable à large échelle) en manipulant notamment le filtre de la
dispersion. Le chapitre 3.1 concerne la restauration des marais temporaires après
abandon d’une culture intensive (riziculture) par l’étrépage de sol et établissement du
régime hydrique combiné au transfert de sol collecté dans des sites de référence. Le
chapitre 4 concerne lui la restauration des pelouses méso-xériques en combinant
étrépage et transfert de foin. Le chapitre 3.2 s’intéresse à la restauration d’un autre
compartiment de l’écosystème après le transfert de sol: les communautés d’invertébrés
aquatiques; il est l’occasion de discuter les critères d’évaluation du succès de restauration
le plus souvent basés sur la flore.
Les études des chapitre 2, chapitre 3 et chapitre 4 ont été conduites en mésocosmes
mis en place sur le site d’étude (appelés blocks dans la suite du manuscrit).

Introduction
6
La discussion expose les résultats préliminaires de restauration de nos deux
communautés à large échelle menée en parallèle de l’étude sur les mésocosmes. De
nouvelles perspectives et outils dans la restauration à large échelle sont proposés pour
expliquer l'assemblage des communautés notamment en confrontant la théorie
déterministe, utilisée dans ce travail, aux théories neutres. Les différents chapitres
permettent de comparer les potentialités respectives de la manipulation de filtres d'un
milieu aquatique à celle d’un milieu terrestre et la colonisation d'une communauté
végétale et d’une communauté d'invertébrés. Enfin sont exposées quelques réflexions
d’ordre plus général que soulève l'écologie de la restauration, dans le contexte actuel de
perte des milieux naturels et agricoles et de marchandisation de la biodiversité.
La suite de l’introduction générale est consacrée aux concepts et théories
scientifiques abordés dans cette thèse ainsi qu’à une présentation du delta du Rhône.
I.3. L’écologie de la restauration
I.3.1. Son origine
La restauration écologique est le processus qui assiste le rétablissement d’un
écosystème qui a été dégradé, endommagé ou détruit (Society for Ecological Restoration
2004). Aldo Leopold, à l’origine du premier projet de restauration documenté dans les
années 1930 aux Etats-Unis (Jordan and Gilpin 1987) visant à rétablir l’état antérieur des
prairies du Wisconsin, appelait ses pairs à devenir des « médecins » de la Terre (Zedler
1999). L’émergence des différentes lois aux Etats-Unis (Loi sur la protection de l’eau: the
Clean Water Act de 1972; Loi sur les espèces en danger: the Endangered Species Act de
1973 ; la loi sur la réhabilitation et contrôle de la surface minière : Surface Mining Control
and reclamation Act de 1977 ; et la loi de zéro perte nette des zones humides : Wetland No
Net Loss Act de 1989) a largement contribué au développement de la discipline. En
France, l’expression restauration a été employée dès 1860 par le service Restauration des
terrains de montagnes dont l’activité principale était de reforester les zones dégradées
par le pâturage pour lutter contre l’érosion (Combes 1989). Ce n’est qu’à partir de la loi
relative à la Protection de la Nature de 1976 et de son décret d’application de 2012, qui
impose à tous les projets d’aménagement des études d’impacts et la séquence Eviter-

Introduction
7
Réduire-Compenser, et de la mise en place en 1995, du programme national de recherche
« Recréer la nature. Réhabilitation, restauration et création d’écosystèmes » que la
restauration écologique connaît un véritable essor en France. Aujourd’hui, de nombreux
projets de restauration sont mis en œuvre (e.g. différentes syntheses sur des projets de
restauration: Walker et al. 2004; Palmer et al. 2005; Benayas et al. 2009; Kiehl et al. 2010;
Török et al. 2011b). L’écologie de la restauration, discipline scientifique qui développe et
teste un corpus de théories écologiques concernant la restauration d’écosystèmes
dégradés (Palmer et al. 1997), fait logiquement évoluer les connaissances théoriques
(Bradshaw 1987) et permet d’affiner la pratique de la restauration écologique, en
proposant des modèles, des concepts et des outils.
I.3.2. Définition et objectifs
La restauration a souvent été énoncée et perçue comme un ensemble d’actions
permettant le rétablissement d’un état antérieur souhaité, qualifié d’initial. Cependant, au
fil des expériences, avec le constat d’une quasi impossibilité à rétablir une parfaite
réplique du passé (Clewell and Aronson 2007), une vision élargie de la restauration
écologique s’est développée; elle fait aujourd’hui plus ou moins consensus (Figure I.2). En
fonction des objectifs poursuivis, différents termes qualifient les actions de restauration
(Society for Ecological Restoration 2004).
La restauration sensu stricto est le rétablissement de tous les attributs de
l’écosystème de référence, incluant notamment la richesse spécifique, la composition, la
structure et la fonction, elle se base donc sur une approche holistique considérant
l’ensemble des compartiments, fonctions et services de l’écosystème.
La réhabilitation quant-à-elle se focalise uniquement sur le rétablissement de certains
compartiments, fonctions et/ou services, sans par exemple viser le retour de toutes les
espèces indigènes (Aronson et al. 1993; Clewell and Aronson 2007). La restauration sensu
stricto et la réhabilitation se focalisent toutes les deux sur un écosystème historique
préexistant. La réclamation, la mitigation, la création ou la réaffectation, à l’inverse de la
restauration et de la réhabilitation, visent l’obtention d’un écosystème choisi sans qu’il y
ait référence à un écosystème passé. La réclamation et la mitigation sont souvent
utilisées dans le contexte industriel afin de répondre à des objectifs et des fonctions
utilitaristes (e.g. stabilisation d’un terrain par re-végétalisation) ou à compenser des

Introduction
8
milieux détruits (e.g. création de zones humides dans le contexte de banque de
‘’mitigation’’ aux Etats-Unis). La création et la réaffectation transforment un écosystème
afin de générer de nouveaux usages de type économique, sociétal ou conservatoire
(Society for Ecological Restoration 2004). Dans la suite du manuscrit, le terme
restauration sera utilisé dans son acceptation la plus large.
Ecosystème de référence
Ecosystème dégradé
Temps
Co
mp
lex
ité
ou
fo
nct
ion
d
e l’
éco
syst
èm
e
Autre complexité ou fonction
Pas de résilience
RESTAURATION RÉUSSITETrajectoire de l’écosystème de référence
De
tru
it o
u e
nd
om
mag
é p
ar le
s ac
tivi
tés
hu
mai
ne
s
Résilience naturelle
Etat alternatif
REHABILITATION
Echec de la restauration
RECLAMATION, MITIGATION, CREATION, REAFFECTATION
Restauration active
Gestion appropriée
Figure I.2 : Modèle général illustrant les différents termes de restauration, dans un graphique à
trois dimensions : temps, complexité ou fonction de l’écosystème de référence, complexité ou
fonction d’un autre écosystème. La troisième dimension est représentée par les pointillés.
Modifiée de Aronson et al. (1993) et Buisson (2011).
Quel que soit l’objectif visé, la restauration doit prendre en compte la dynamique
temporelle des écosystèmes, leur éventuelle résilience à des perturbations et leur
tolérance au stress (Figure I.2). Les objectifs correspondent donc souvent à une
trajectoire de référence (Aronson et al. 1993) elle-même dynamique par les mécanismes

Introduction
9
de succession (Aronson and Floc’h 1996; Clewell and Aronson 2007). L’écosystème à
restaurer doit être positionné sur la trajectoire successionnelle de référence, avec pour
objectif d’obtenir ou de s’approcher de l’écosystème de référence. L’écologie des
communautés, au travers des mécanismes de succession, est de ce fait une discipline
largement utilisée en écologie de la restauration (Palmer et al. 1997).
I.3.3. L’écologie de la restauration en lien avec d’autres disciplines
Les projets de restauration se basant principalement sur les communautés végétales
(Prach and Hobbs 2008), l’écologie des communautés est, comme nous venons de
l’évoquer, essentielle à l’écologie de la restauration. La restauration écologique utilisant
la manipulation des communautés végétales, une bonne connaissance des facteurs
déterminant la dynamique et la structuration des communautés et de leurs rôles
respectifs, est nécessaire pour définir les moyens à mettre en œuvre afin de piloter la
succession vers l’état de référence et ainsi mener à bien des opérations de restauration
(Figure I.3, Palmer et al. 1997; Keesing and Wratten 1998; Young et al. 2001; Temperton et
al. 2004; Zedler 2005; Falk et al. 2006; Hobbs and Cramer 2007; Cristofoli and Mahy 2010).
La restauration écologique est considéré comme un contexte écologique opportun
pour tester des hypothèses (i.e. test à l’acide); les projets de restauration peuvent ainsi
substantiellement contribuer à l’avancement des théories fondamentales en écologie
(Figure I.3, Bradshaw 1987; Keesing and Wratten 1998).
En complément de l’écologie des communautés, de nombreux domaines de
l’écologie peuvent être explorés via la restauration (e.g. les réseaux trophiques, le
fonctionnement des écosystèmes, la paléoécologie, les changements climatiques,
l’écologie historique, l’écologie du paysage, etc. Young et al. 2005; Falk et al. 2006), et de
nombreux champs autre que l’écologie des communautés végétales peuvent être
mobilisés en écologie de la restauration (e.g. dynamique des populations, écologie des
communautés d’invertébrés etc.). Une nouvelle discipline récemment apparu en écologie
de la restauration est la philosophie de l’environnement, qui apporte d’autres outils de
réflexion (e.g. éthique, esthétique, sociétale) à la démarche de la restauration écologique
et aux choix de l’écosystème de référence (Light 2009; Maskit 2009; Maris 2010).

Introduction
10
Ecologie théoriqueQuelles sont les connaissances en
écologie des communautés?
Ecologie de la restaurationQuelles connaissances doivent-
être utilisées?
Restauration écologiqueComment appliquer ses
connaissances?
Optimiser la pratique de la restauration
Tester des méthodes de restauration
Valider les théories via des expériences
in situ et ex situ
Modéliser l’assemblage des
communautés
Tester des théories à l’échelle d’un
écosystème
Prédire l’assemblage des
communautés
Figure I.3 : Relations entre l’écologie théorique, l’écologie de la restauration et la restauration
écologique. Modifiée d’après Falk et al. (2006) et Jaunatre (2012).
I.4. L’écologie des communautés
I.4.1. Les communautés végétales
L’écologie des communautés étudie l’assemblage des espèces en terme de diversité,
d’abondance et de composition dans une communauté ainsi que les processus et
mécanismes de structuration à l’origine de ces assemblages (Vellend 2010). Parmi
l’ensemble des définitions d’une communauté (Clements 1916; Gleason 1926; Clements
1936), « l’ensemble des individus de diverses espèces qui interagissent les unes avec les
autres et avec les caractéristiques physiques de leur habitat » (Krebs 1972) synthétise les
différentes approches du concept de communauté.
I.4.2. La succession
La succession végétale est décrite comme un changement progressif de la
composition de la communauté dans le temps (Walker and Del Moral 2003). La
succession primaire correspond à la colonisation d’un substrat vierge (e.g. coulée de lave,
création d’île, Walker and Del Moral 2003) alors que la succession secondaire se
développe sur un substrat préexistant, en présence d’une banque de graines et de

Introduction
11
nutriments déjà dans le sol (e.g. rétablissement de la végétation après perturbation de
feu ou abandon agricole, Mesléard et al. 1991; Mesléard and Lepart 1991; Hobbs and
Cramer 2007).
Le premier modèle de succession (Clements 1916) décrit un mécanisme déterministe,
où la communauté se développe d’un stade initial jusqu’à un stade climacique. Ce modèle,
par ailleurs largement contesté, n’étant pas universellement applicable (Connell and
Slatyer 1977) d’autres modèles fondés notamment sur l’importance de la stochasticité ont
émergé. Les perturbations et tout événement stochastique introduisent de
l’imprévisibilité dans le déroulement de la succession et les mécanismes de structuration
de la communauté (Gleason 1926; Levin 1989; Young et al. 2001). Le modèle des états
alternatifs stables (Sutherland 1974), intermédiaire entre le modèle déterministe et le
modèle stochastique, sous-tend que les communautés, bien que structurées, sont
susceptibles de se développer en de nombreux états alternatifs en raison de la part de
hasard inhérente à tous les écosystèmes. Le développement de la communauté et sa
succession sont ainsi expliqués à travers ces trois différents modèles qui permettent de
prédire la trajectoire des communautés.
I.4.3. Perturbations, stress et résilience
Une perturbation, qu’elle soit naturelle ou le plus couramment anthropique, est un
événement discret dans le temps qui modifie plus ou moins profondément la structure
des écosystèmes, des communautés et des populations (White and Pickett 1985), fait
varier les ressources disponibles et l’habitat physique, et bouleverse les relations de
compétition (White and Jentsch 2001). La distinction entre perturbation et stress peut
dans certaines situations poser problème, puisqu’un même événement peut être
considéré comme stress ou perturbation selon l’échelle d’observation (Pickett et al.
1989). Un événement est considéré comme perturbation quand le seuil de tolérance d’un
organisme pour un facteur donné est dépassé aboutissant à la mort ou au moins à une
perte significative de biomasse (Grime 1977; Sousa 1984). L’effet d’une perturbation
dépend donc de sa taille, de son intensité, de sa durée et de sa fréquence (Sousa 1984).
La perturbation peut être soit exogène: l’événement provient de l’extérieur du système
(e.g. exploitation minière) ; ou bien peut être considérée comme endogène : l'événement

Introduction
12
de perturbation provient de l'intérieur du système ou du développement de la succession
(e.g. une chute de l'arbre sénescent). Dans le cas d’un événement endogène continu
(perturbation endogène non discrète, intrinsèque à l’écosystème) avec lequel
l’écosystème évolue (e.g. pâturage), il pourra donc également être considéré comme un
stress (McIntyre and Hobbs 1999).
Les notions de résilience et de résistance mesurent les impacts de la perturbation sur
un écosystème ainsi que sa réponse. La résistance est définie par Mitchell et al. (2000)
comme la capacité d’un écosystème à supporter une perturbation ou le niveau maximal
de la perturbation que l’écosystème peut supporter sans changement significatif (Figure
I.4.A.). La résilience est définie par Hirst et al. (2003) comme la capacité d’un écosystème
à retourner à l’état précédant la perturbation (Figure I.4.B.).
Cap
acit
é
fon
ctio
nn
elle
Temps
Perturbation
Forte résistance
Faible résistance C
apac
ité
fo
nct
ion
ne
lle
Temps
Perturbation
Forte résilience
Faible résilience
Pas de résilience
A. Résistance B. Résilience
Figure I.4 : Représentation conceptuelle de la résistance (A) et de la résilience (B).
Les perturbations sont généralement considérées comme un facteur d’augmentation
ou de maintien de la diversité; pour un milieu donné la richesse maximale est attendue
pour un régime moyen de perturbation, empêchant ainsi les phénomènes d’exclusion
d’espèces (Connell 1978). Cette théorie des perturbations intermédiaires est en partie
controversée par des résultats empiriques et théoriques (Mackey and Currie 2001; Fox
2012). Malgré l’absence d’un modèle général, il est tout de même reconnu que les
perturbations jouent un rôle majeur dans les mécanismes de succession des
communautés végétales, et qu’elles doivent être identifiées lors de projets de
restauration écologique. Le pâturage et l’assec, abordés dans cette thèse, sont

Introduction
13
considérés comme des perturbations (Gibson and Brown 1992; Bonis 1998; Brock et al.
2003).
Le pâturage, en supprimant de la biomasse et en créant des microsites, peut modifier
les interactions, limiter les effets de la compétition et favoriser le recrutement de
nouvelles espèces ou individus (Lepš 1999; Bakker et al. 2006; Myers and Harms 2009).
L’assec associé à une zone humide temporaire est un mécanisme puissant pour maintenir
la diversité des espèces dans les communautés, en favorisant la coexistence d'un grand
nombre d’espèces, via l’accumulation de stades de dormances d’espèces différents (Chesson and Warner 1981; Bonis et al. 1995; Chesson 2000).
De nombreux projets de restauration écologique concernent d’anciennes parcelles
agricoles (Van der Putten et al. 2000; Hobbs and Cramer 2007; Prach et al. 2007; Cramer
et al. 2008; Török et al. 2011b; Jírová et al. 2012). La mise en culture est aussi considérée
comme une perturbation, mais à l’inverse des deux perturbations précédentes, les
communautés végétales sont rarement adaptées aux impacts de l’agriculture après
abandon: le labour et les amendements. L’absence de banque de graines des
communautés avant culture (Hutchings and Booth 1996; Bossuyt and Honnay 2009) et
des densités élevées d’espèces plus compétitrices, favorisées par les fertilisants (Marrs
2002; Standish et al. 2008) ont généralement un impact durable sur les communautés
végétales.
I.4.4. Théories d’assemblage des communautés
Afin d’identifier les processus qui influencent la succession, des modèles
d’assemblage des communautés ont été décrits. Le principal modèle utilisé est celui des
filtres, proposé initialement pour les communautés d’invertébrés et de poissons
(Southwood 1977; Poff 1997), puis modifié pour les communautés végétales (Keddy 1992;
Fattorini and Halle 2004; Lortie et al. 2004; Guisan and Rahbek 2011). Ce modèle inclut un
pool régional d’espèces, contraint par trois filtres (Figure I.5): le filtre de la dispersion, le
filtre abiotique et le filtre biotique, qui sélectionnent les espèces de la communauté
finale. Le filtre de la dispersion est souvent décrit comme un processus régional alors que
les conditions abiotiques et les interactions biotiques sont considérées comme des
processus internes (White and Jentsch 2004).

Introduction
14
Pool régional d’espèces
Communauté végétale
DispersionEspèce capable d’atteindre le site
Filtre abiotiqueEspèce tolérante aux conditions
environnementales du site
Filtre biotiqueIntraspécifique, interspécifique et avec d’autres
organismes
R
R
R
Figure I.5: Le modèle de filtre de l’assemblage des communautés. Les trois filtres sont représentés
par les cases grises : la dispersion, le filtre abiotique et le filtre biotique. Les flèches grises
représentent les espèces, capables ou non, de passer les filtres. Les boucles de rétroaction entre
les filtres sont représentées par les flèches noires. Les disques « R » représentent les différents
niveaux potentiels d’intervention de la restauration. Modifiée d’après Lortie et al. (2004) et
Jaunatre (2012).
Le premier filtre est assuré par la dispersion : les espèces doivent être capables
d’atteindre la communauté via le pool d’espèces externes (i.e. les espèces présentes dans
le paysage qui se dispersent via la pluie de graines) ou via le pool d’espèces internes (i.e.
les espèces présentes sur le site sous forme de banque de graines ou végétation établie).
Les différents moyens de dispersion confèrent des capacités de dispersion spatio-
temporelles variables selon les espèces leur permettant de franchir avec plus ou moins de
succès le filtre de la dispersion.

Introduction
15
Les conditions abiotiques opèrent un second filtre: les espèces doivent tolérer les
conditions environnementales. L’ensemble des conditions physico-chimiques permettant
à une espèce d’exister est localisé dans la niche écologique fondamentale (Grinnell 1917),
prenant en compte les conditions nécessaires pour la germination, l’établissement et la
reproduction de l’espèce (Grubb 1977).
Lorsqu’une espèce du pool régional parvient à franchir le filtre de la dispersion et
n’est pas contraint par le filtre abiotique, son devenir dans la communauté est déterminé
par le filtre biotique, i.e. les interactions avec les individus de la même espèce
(intraspécifique) ou d’autres espèces (interspécifique), ou avec d’autres organismes au
sein de l’écosystème (e.g. les herbivores). Les interactions peuvent avoir un effet négatif
(e.g. compétition) ou positif (e.g. facilitation) sur l’installation et/ou la croissance des
individus (Callaway and Walker 1997; Bruno et al. 2003). La compétition naît de la
concurrence entre individus ou espèces pour une même ressource limitée (e.g. eau,
lumière, nutriments, espace, pollinisateurs ; Naeem et al. 1999), entraînant une
modification, pour l’ensemble ou une partie des individus ou espèces, de la survie, la
croissance et/ou la reproduction (Grime 1973). La facilitation, au contraire, par
l’amélioration d’un ou plusieurs facteurs du milieu, augmente la survie, la croissance et/ou
de la reproduction d’un individu ou d’une espèce permettant son installation et/ou son
maintien au sein d’une communauté (Connell and Slatyer 1977; Glenn-Lewin et al. 1992).
La compétition a longtemps été considérée comme l’interaction majeur dans
l’assemblage des communautés, pour autant les interactions positives jouent également
un rôle significatif (Maestre and Cortina 2004; Callaway 2007; Brooker et al. 2008).
Les communautés évoluant au fils du temps, les filtres sont dynamiques et
dépendants entre eux (boucle de retroaction: Figure I.5, Fattorini and Halle 2004).
L’identification des rôles respectifs des filtres et leur manipulation lors d’opérations
de restauration (Figure I.5) permettent de faciliter la colonisation des espèces cibles. La
dispersion (et la limitation en recrutement de graines) a ainsi souvent été identifiée
comme un facteur plus important dans l’assemblage des communautés que les processus
internes (e.g. prédation, compétition, facilitation ; Niering and Goodwin 1974; Palmer et
al. 1996; Turnbull et al. 2000; Mouquet et al. 2004; Clark et al. 2007). Les modèles de

Introduction
16
dispersion divergent, en considérant la sélection des espèces au sein de la communauté
comme stochastique (le modèle de loterie ; Chesson and Warner 1981; Chesson 1991) ou
au contraire en privilégiant les capacités de dispersions des espèces et la distance à
parcourir pour atteindre la communauté donnée (modèle de la biogéographie insulaire ;
MacArthur and Wilson 1967). Les processus internes interviennent alors dans un second
temps et sont largement tributaire de la dispersion. Des études récentes montrent
cependant que les processus internes peuvent très largement déterminer la composition
de la communauté, la présence ou l’absence de certaines espèces pouvant être attribuées
aux interactions biotiques et non à la dispersion (Mouquet et al. 2004; Münzbergová and
Herben 2005; Myers and Harms 2009; Klimkowska et al. 2010b). La hiérarchisation de
l’importance des filtres dans l’assemblage des communautés dépend donc du contexte,
les filtres étant dynamiques, ils interviennent d’autre part avec différentes intensités aux
différents stades de développement de la communauté végétale (Keddy 1992; Hobbs and
Norton 2004).
Le concept de filtre exprime une vision déterministe des mécanismes de
structuration des communautés végétales, dans laquelle le résultat est hautement
prévisible et les mécanismes de succession manipulables, permettant d’atteindre la
communauté de référence (Luken 1990). Récemment, les partisans des théories neutres
ont mis l’accent sur l’importance des facteurs stochastiques et historiques, préconisant
une approche plus complexe de l’assemblage des communautés (Chase 2003; Chave
2004; Tilman 2004; Hubbell 2005; Chase 2007; Jabot et al. 2008). La composition d’une
communauté peut en effet être fortement influencée par des facteurs historiques (Drake
1990; Chase 2003) et des communautés sur des sites présentant de fortes similitudes
peuvent diverger à la suite d’événements différents. C’est par exemple le cas des effets
de priorités dans lesquels l’ordre de colonisation des espèces influence la composition de
la communauté finale (Drake 1990; Trowbridge 2007; Kardol et al. 2013) et où la
stochasticité joue un rôle prépondérant dans la séquence d’arrivée des espèces (i.e.
notamment la première arrivée). Ces deux types de modèles (déterministe vs.
stochastique) considérés conjointement sont des outils précieux en restauration (Suding
et al. 2004; Collinge and Ray 2009; Török et al. 2011b; Fukami and Nakajima 2011), car ils
permettent notamment l’intérêt de manipuler le filtre de la dispersion.

Introduction
17
I.4.5. Des théories d’écologie à la pratique de la restauration écologique
Le défi de la restauration des communautés végétales est de comprendre et
d'exploiter les mécanismes de la succession écologique à tous les stades de
développement, en accélérant, complétant ou contournant les processus de colonisation
naturels (Keesing and Wratten 1998). Les filtres dans le contexte de la restauration
peuvent être assimilés à des leviers (Figure I.6, Whisenant 1999), manipulés pour franchir
des seuils et atteindre la trajectoire de référence. Ces trois leviers de restauration ont
ainsi été utilisés en restauration: dispersion (Kiehl et al. 2010), filtre abiotique (Bobbink et
al. 1998; Verhagen et al. 2001) ou filtre biotique (Padilla and Pugnaire 2006; Pywell et al.
2007; Collinge and Ray 2009).
Un panel d’actions diverses peut être utilisé pour modifier la trajectoire de la
communauté (Figure I.6). L’introduction de propagules d’espèces cibles permet de
contrecarrer le filtre de la dispersion. Néanmoins les introductions de propagules doivent
se faire après restauration des conditions abiotiques, afin d’éviter des phénomènes
similaires aux effets de masse spatiale (Spatial mass effect: une espèce peut se trouver
dans un habitat défavorable, où elle ne peut se régénérer, en raison d'un flux de
propagules d'une source existante dans un habitat favorable à proximité; Shmida and
Ellner 1985; Zonneveld 1995; Zelenỳ et al. 2010) où les propagules ou individus transférés
ne rencontrent pas des conditions abiotiques favorables. Les premières interventions
d’un projet de restauration doivent donc viser à se rapprocher des conditions abiotiques
de l’écosystème de référence (e.g. restauration du régime hydrique, réduction des excès
de nutriments dans le sol, etc.). Favoriser le développement d’espèces structurantes peut
aussi faciliter et améliorer la colonisation par des espèces cibles (i.e. utilisation des effets
de priorités; Tirado and Pugnaire 2005; Trowbridge 2007; Collinge and Ray 2009; Kardol et
al. 2013).
Dans cette thèse, le chapitre 2 concerne cette manipulation du filtre abiotique sur les
communautés végétales, les chapitre 3.1 et chapitre 4 traitent de l’effet de la
manipulation du filtre de la dispersion en addition de la manipulation du filtre abiotique,
par l’introduction des espèces des communautés végétales de référence selon deux
méthodes, le transfert de foin et le transfert de sol. Le chapitre 3.2 concerne l’effet du
transfert de sol sur les communautés d’invertébrés aquatiques.

Introduction
18
Seuil contrôlé par les interactions biotiques
Seuil contrôlé par les limitations de la dispersion
Seuil contrôlé par les limitations abiotiques
Etat de l’écosystème
Nécessite des manipulations des
conditions abiotiques
(e.g. étrépage de sol, amélioration de la
topographie, importation de substrat)
Nécessite des manipulations de la
dispersion
(e.g. transfert de sol, transfert de foin, mise en
place de corridors)
Nécessite des manipulations des relations biotiques
(e.g. pâturage pour limiter la compétition, semis d’espèces nurses pour favoriser la facilitation,
retrait des espèces invasives)
Fonctionnalité
DégradéIntact
Non fonctionnel
Totalementfonctionnel
Figure I.6: Modèle de transition d’un écosystème entre différents états de fonctionnalité,
illustrant la présence de trois types de seuil : un premier contrôlé par les limitations biotiques, un
second contrôlé par les limitations de la dispersion, et un troisième contrôlé par les interactions
biotiques (modifié de Whisenant 1999). Des exemples de méthodes utilisées en restauration pour
dépasser les seuils à l’installation de la communauté de référence (i.e. écosystème intact) sont
inscrits en parenthèse et en italique.
I.5. Evaluation de la réussite d’une restauration
I.5.1. Les indicateurs
La restauration écologique vise à restaurer l’écosystème dans son intégrité et
cherche donc à rétablir la biodiversité et l’ensemble des fonctions de l’écosystème. Cette
restauration de l’ensemble des compartiments et fonctions dépend entre autre, des
mécanismes successionnels, son succès ne peut être appréhendé qu’à moyen ou long
terme nécessitant la définition d’indicateurs précis, la mise en place et la poursuite de leur
suivi. Le choix des indicateurs est fonction des objectifs fixés; ils permettront une

Introduction
19
approche d’autant plus globale qu’ils intègreront un maximum de compartiments de la
diversité biologique (Choi 2007; Cristofoli and Mahy 2010). Cependant, les budgets
consacrés aux suivis sont très généralement sous estimés voire inexistants (Cristofoli and
Mahy 2010). Développer des mesures faciles à réaliser et peu coûteuses correspond donc
à une démarche particulièrement pertinente. Ces mesures privilégient souvent les
communautés végétales, qui sont généralement un compartiment visé dans les projets
de restauration et qui ont un rôle structurant des écosystèmes. Classiquement,
l’évaluation d’une restauration repose sur une approche espèce (e.g espèces en danger,
espèces patrimoniales) mais n’apporte qu’une information restreinte par rapport aux
divers compartiments de l’écosystème. Ainsi se focaliser sur la globalité de la
communauté végétale semble un choix plus judicieux, même la prise en compte de la
communauté ne suffit pas à caractériser la globalité de l’écosystème.
I.5.2. L’approche communauté végétale
La richesse spécifique est l’un des indicateurs les plus couramment utilisé susceptible
d’exprimer certaines fonctionnalités de l’écosystème, dans la mesure où une richesse
spécifique plus élevée faciliterait le bon fonctionnement et la stabilité des écosystèmes
(Ehrenfeld and Toth 1997; Hooper et al. 2005; Tilman et al. 2006), leur permettant de
répondre aux perturbations et d’éviter les invasions (May 1973; Hobbs et al. 1995; Tilman
1997). Néanmoins la pertinence de cet indicateur paraît discutable si l’on considère le rôle
joué par les espèces clés ou ingénieurs (Brown 1995; Jones and Lawton 1995; Stone 1995;
Naeem et al. 1996; Grime 1998; Bakker et al. 2000 ; abordées en Discussion avec les effets
de priorités), et la richesse spécifique ne peut être le seul critère de restauration pris en
compte dans un projet de restauration (Ilmonen et al. 2013). Ainsi, au lieu d’être
considérée dans son ensemble (nombre total d’espèces), la richesse spécifique peut être
décomposée en espèces cibles présentes dans les communautés de référence et espèces
non cibles, complétées par divers indices, notamment de similarité avec les communautés
de référence (i.e. indice de Sorensen, indice de Bray-Curtis). Ces différents indicateurs ont
ainsi été utilisés afin d’évaluer les techniques de restauration mises en place (chapitre 3.1
et chapitre 4). Afin de mettre en avant les espèces sous ou sur-représentées dans les
communautés restaurées, nous avons testé deux nouveaux indicateurs,

Introduction
20
complémentaires, (Jaunatre et al. 2013b, Annexe 1) prenant en compte la diversité, la
composition et la structure de la communauté par rapport à la communauté de
référence.
I.5.3. Prise en compte d’autres compartiments de l’écosystème
La prise en compte de divers compartiments de l’écosystème permet une approche
globale de l’évaluation de la restauration. Les communautés animales étant le plus
souvent liées aux à la nature et la structure des communautés végétales (Luken 1990;
Duelli and Obrist 2003), la faune est potentiellement un indicateur de la qualité de et du
niveau de restauration de l’écosystème (Palmer et al. 1996; Kiehl and Wagner 2006;
Cristescu et al. 2013). L’intégration d’une composante faunistique réalisée dans le chapitre
3.2 permet de considérer certaines fonctions du système, peu ou non prise en compte en
prenant des critères exclusivement végétaux.
I.6. Caractéristiques de la Camargue
I.6.1. Contexte géographique et géologique permettant une diversité de milieux
La Camargue, situé au Sud de la France (Figure I.7) est une vaste plaine alluviale de
150 000 hectares. Le delta du Rhône est le plus grand de l’Europe de l’Ouest, limité à l’Est
par la plaine de la Crau et à l’ouest par la costière du Gard. Les deux bras du Rhône
compartimentent la Camargue en trois secteurs : le secteur occidental ou « Petite
Camargue », le secteur central ou « Grande Camargue » et le secteur oriental ou « Plan du
Bourg » (Figure I.7). D’un point de vue géomorphologique et biologique, ces trois
secteurs forment un même ensemble. La Camargue est le résultat du combat permanent
entre les eaux du Rhône chargées d’alluvions et la mer Méditerranée. La formation du
delta du Rhône et sa perpétuelle évolution au cours des siècles ont façonné un paysage
spécifique, caractérisé par l’absence de relief important. Cependant, les micro-variations
de ce relief, liées à la complexité des dépôts salés ou doux, engendrent des changements
importants dans le régime de l’eau et du sel, qui induisent l’imbrication des milieux
naturels, composés en « mosaïque ». Cette mosaïque d’habitats, conditionnée par l’eau, le
sel et la topographie, est à l’origine du grand intérêt de la Camargue en ce qui concerne la

Introduction
21
faune et la flore. A cela, il faut ajouter l’influence du climat méditerranéen, notamment
une évapotranspiration importante (liée à de forts vents et des températures élevées,
1200mm/an, Heurteaux 1970) et une faible pluviométrie (550m/an, Heurteaux 1976), qui
agit de façon sensible sur l’évolution du paysage et de l’habitat.
Les différents secteurs du delta du Rhône
Camargue gardoiseGrande Camargue Plan du Bourg
Figure 1.7: Les différents secteurs de la Camargue. Le point rouge représente le domaine du
Cassaïre.
I.6.2. Un delta : son histoire et sa dynamique en lien avec une diversité d’acteurs
Les activités humaines en Camargue, qui ont connu de profonds changements, se
sont fortement accrues au 19ème siècle, le développement des machines et des énergies
vapeurs puis fossiles facilitant le développement des activités et de leurs impacts sur le
milieu naturel. L’endiguement et la maîtrise du débit du Rhône dès la première moitié du
19ème siècle, font de son delta un espace fortement artificialisé. La Camargue est un
hydrosystème complexe (Chauvelon et al. 2003), où l’eau douce du Rhône est pompée
dans la plaine deltaïque via un réseau de canaux d'irrigation pour dessaler les champs à
des fins agricoles (principalement pour la culture du riz inondé) et pour la gestion des
marais. Outre la culture du riz, l’industrie et le tourisme ont conduit depuis la seconde

Introduction
22
guerre mondiale à une perte de 40 000 hectares d’espaces naturels (Tamisier 1991).
Malgré toutes ces activités, la Camargue abrite une grande biodiversité, dont 75 espèces
de poissons, 10 espèces d'amphibiens, 15 espèces de reptiles, 400 espèces d’oiseaux et
plus de 1000 espèces végétales, dont de nombreuses espèces endémiques et menacées
(Tour du Valat 2000). D’actuels changements d’occupation du sol peuvent être des
opportunités pour restaurer des écosystèmes dégradés par les activités agricoles. C’est
notamment le cas du domaine du Cassaïre, situé à l’est du grand Rhône (Figure I.7), projet
participatif de restauration présenté dans le Chapitre 1.

Transition to Chapter 1
23
Transition to Chapter 1
The first objective of a restoration project is to determine the reference ecosystem,
which describes what the ecosystem should be like after restoration (Clewell and
Aronson 2007). The choices of restoration objectives are determined by historical
considerations, ecological values, social acceptance, economics and political constraints
(Bullock et al. 2011). Our reference ecosystem, based on social participatory project,
ecological values and historical ecology, is determined and discussed in Chapter 1.
Ecosystèmes de référence
Ecosystème dégradé
Le transfert de foin permet-il de restaurer les
communautés terrestres?
Chapitre 4
Le transfert de sol permet-il de restaurer les
communautés d’invertébrés?
Chapitre 3.2
La restauration des conditions abiotiques est-elle
suffisante?
Chapitre 2
Quel est l’écosystème de référence?
Chapitre 1
Le transfert de sol permet-il de restaurer les
communautés aquatiques?
Chapitre 3.1
Figure T1.1: Location of Chapter 1 in the general thesis organization
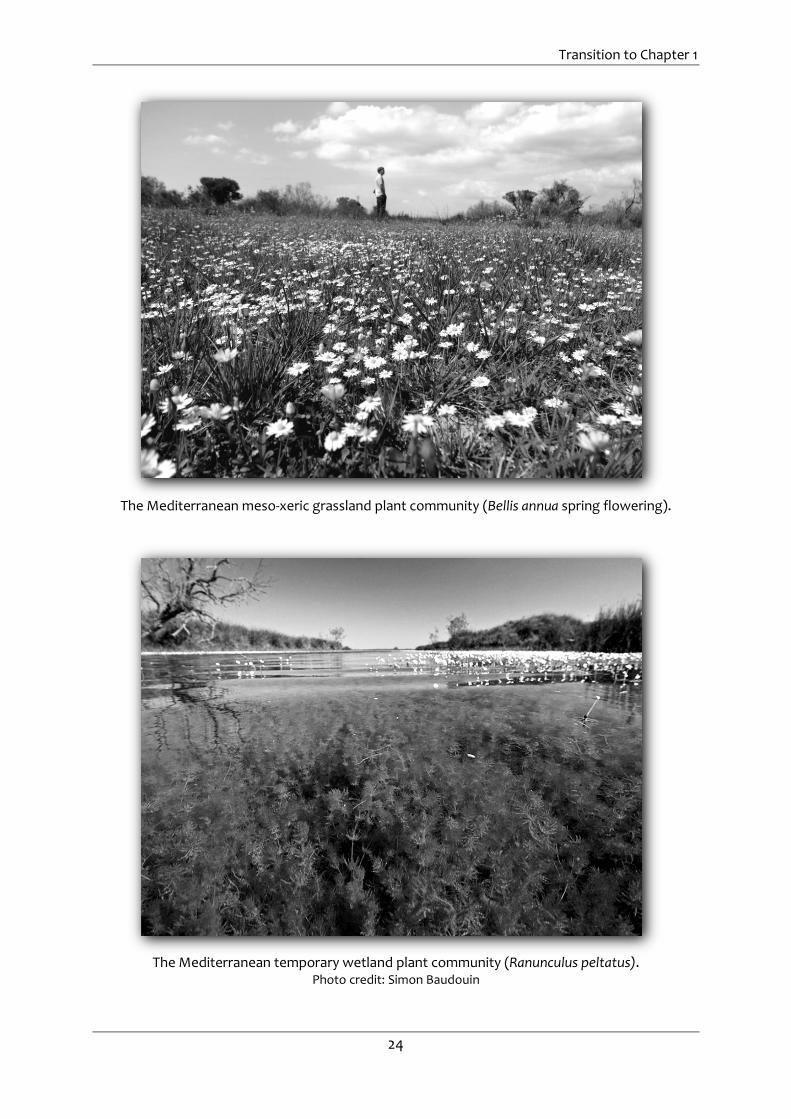
Transition to Chapter 1
24
The Mediterranean meso-xeric grassland plant community (Bellis annua spring flowering).
The Mediterranean temporary wetland plant community (Ranunculus peltatus). Photo credit: Simon Baudouin

Chapter 1: The Cassaïre restoration project
25
Chapter 1 - Presentation of the Cassaïre
restoration project and goals
With the collaboration of Johan Friry
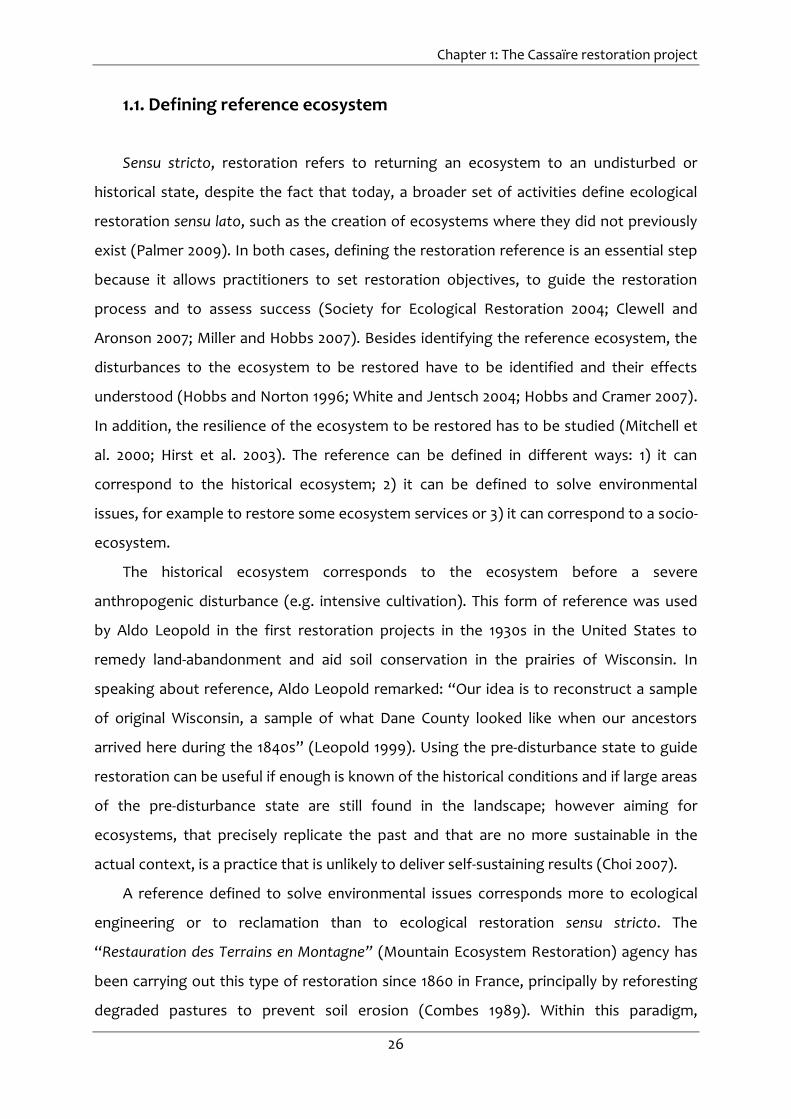
Chapter 1: The Cassaïre restoration project
26
1.1. Defining reference ecosystem
Sensu stricto, restoration refers to returning an ecosystem to an undisturbed or
historical state, despite the fact that today, a broader set of activities define ecological
restoration sensu lato, such as the creation of ecosystems where they did not previously
exist (Palmer 2009). In both cases, defining the restoration reference is an essential step
because it allows practitioners to set restoration objectives, to guide the restoration
process and to assess success (Society for Ecological Restoration 2004; Clewell and
Aronson 2007; Miller and Hobbs 2007). Besides identifying the reference ecosystem, the
disturbances to the ecosystem to be restored have to be identified and their effects
understood (Hobbs and Norton 1996; White and Jentsch 2004; Hobbs and Cramer 2007).
In addition, the resilience of the ecosystem to be restored has to be studied (Mitchell et
al. 2000; Hirst et al. 2003). The reference can be defined in different ways: 1) it can
correspond to the historical ecosystem; 2) it can be defined to solve environmental
issues, for example to restore some ecosystem services or 3) it can correspond to a socio-
ecosystem.
The historical ecosystem corresponds to the ecosystem before a severe
anthropogenic disturbance (e.g. intensive cultivation). This form of reference was used
by Aldo Leopold in the first restoration projects in the 1930s in the United States to
remedy land-abandonment and aid soil conservation in the prairies of Wisconsin. In
speaking about reference, Aldo Leopold remarked: “Our idea is to reconstruct a sample
of original Wisconsin, a sample of what Dane County looked like when our ancestors
arrived here during the 1840s” (Leopold 1999). Using the pre-disturbance state to guide
restoration can be useful if enough is known of the historical conditions and if large areas
of the pre-disturbance state are still found in the landscape; however aiming for
ecosystems, that precisely replicate the past and that are no more sustainable in the
actual context, is a practice that is unlikely to deliver self-sustaining results (Choi 2007).
A reference defined to solve environmental issues corresponds more to ecological
engineering or to reclamation than to ecological restoration sensu stricto. The
“Restauration des Terrains en Montagne” (Mountain Ecosystem Restoration) agency has
been carrying out this type of restoration since 1860 in France, principally by reforesting
degraded pastures to prevent soil erosion (Combes 1989). Within this paradigm,

Chapter 1: The Cassaïre restoration project
27
ecological values (e.g. species or habitat with conservation value, biodiversity, or
potential habitat for rare, endemic and/or threatened species) are taken less into account
and serve as a means to solving technical problems related to human activities.
When historical ecosystems are difficult to define or when using them is unrealistic in
a context of climate changes and fragmented landscapes (Millar and Brubaker 2006),
another reference ecosystem must be defined (Jackson and Hobbs 2009). Recently,
reference ecosystems have been determined with regard to both ecological values and
social issues (Choi 2007; Clewell and Aronson 2007; Moreno-Mateos and Comin 2010).
These socio-ecosystems consist of a collective construction of integrated, complex and
adaptive systems, coupling nature and human societies, with the Human considered as an
active component of the ecosystem, and with an integrated approach to human-nature
interactions. Under these conditions, the final choice of reference is unavoidably
subjective and arbitrary (Choi 2004), but it leads to public acceptance and a higher
probability of restoration success (Gobster and Hull 2000). While ecological constraints
define what is possible and financial constraints determine what is realistic, social
constraints determine whether a given restoration project is acceptable (Miller and
Hobbs 2007) and whether it matches local social needs. In such reference ecosystems,
successful restoration must be predicated on the communication of project goals and
benefits to humans, and on consultations along with open dialogue to evaluate public
understanding, acceptance, and support (Miller and Hobbs 2007).
1.2. The Cassaïre project
1.2.1. Restoration project at the Cassaïre site
In a delta as modified by human activity as the Camargue area, where local
stakeholders are deeply involved in the management of the environment, reflections
around a socio-ecosystem for a restoration project make sense. Moreover, on such a
basis, defining a natural state is not straightforward and may not even be appropriate: is
the natural state the condition that existed before cultivation or is it the condition that
would exist in the absence of all human influences (e.g containment of the Rhône river)?
Considering a reference ecosystem based on conservation objectives linked with the

Chapter 1: The Cassaïre restoration project
28
current landscape and local demand seems to be the best way to have a successful
restoration project. This is the case with the Cassaïre restoration project located east of
the Camargue area (43°31’N, 4°44’’E, Plan du Bourg, Rhône delta, Southern France, Figure
1.1).
The different areas of the Camargue
Camargue gardoiseGrande Camargue Plan du Bourg Cassaïre site
Crau area
La Durance
Figure 1.1: The different areas of the Camargue and the location of the Cassaïre site (red dot) in
the Plan du Bourg area. The Durance river, the Rhône, and the Crau area, are also shown. Figure
adapted from the official Regional Park of the Camargue area map.
Covering more than 70 hectares, the Cassaïre site is composed of a mosaic of
habitats, a majority of fallow land which have been heavily transformed by humans
through cultivation-related activities (such as leveling, grading, drainage, irrigation, and
amendment). The remaining relic natural habitats (comprising a grand total of less than 7
hectares) correspond to the following three priority habitats according to the Natura
2000 Network of the European Union Habitat Directive (European Commission 1992):
fluvial dunes linked to Rhône sand deposit, meso-xeric grasslands on the highest parts of
the site, and salt marshes on the lower parts (Figure 1.2).

Chapter 1: The Cassaïre restoration project
29
Habitat of the Cassaïre siteFallow landSalt marshesFluvial dunesMeso-xeric grasslands
Figure 1.2: Habitat map of the Cassaïre site, with a majority of fallow land (in black) and remaining
relictual natural habitats (the meso-xeric grasslands in white, the dunes in light grey and the salt
marshes in dark grey).
In 2004, after farming cessation, the site was acquired by Conservatoire du Littoral et
des Rivages lacustres (a state conservancy agency) and its management was entrusted to
an NGO “Les Amis des Marais du Vigueirat”, which now administrates the surrounding
National Nature Reserve “les Marais du Vigueirat”. Although the entire project was
completely financed by L’Agence de l’Eau (the Water Agency), Conseil Régional
Provence-Alpes-Côte-d’Azur (the Regional Council), and Conseil Général des Bouches-du-
Rhône (the Departmental Council), all design and implementation decisions were taken
collectively by a steering committee composed of the following stakeholders:
1) Environmental managers: the National Reserve managers of Les Amis des Marais
du Vigueirat (NGO which administrates the National Nature Reserve), the Parc
Naturel Régional de Camargue (the Natural Regional Park of the Camargue), and
the Office National de la Chasse et de la Faune Sauvage (the National Office for
Hunting and Wildlife).

Chapter 1: The Cassaïre restoration project
30
2) Project managers and funders: Le Conservatoire du Littoral et des Rivages
lacustres (a state conservancy agency), L’Agence de l’Eau (the Water Agency), Le
Conseil Régional Provence-Alpes-Côte-d’Azur (the Regional Council), and Le
Conseil Général des Bouches-du-Rhône (the Departmental Council).
3) Local stakeholders: The hunting association of Mas Thibert hamlet and the
Departmental hunting federation
4) Scientists, experts, and researchers from the Tour du Valat (Research center dor
conservation of Mediterranean wetlands), and the Mediterranean Institute of
Biodiversity and Ecology (IMBE).
Even when the various stakeholders did not share the same expectations, the various
meetings and steering committees resulted in a consensus. It was ultimately decided that
the restoration project be developed for sustainable and harmonious development in
connection with the neighboring hamlet hunters. The objective of this project is twofold:
creating, for conservation value, complementary habitats from those present on the
Vigueirat National Nature Reserve, and achieving this while allowing some hunting
activity to continue as negotiated with local community stakeholders. Indeed, in the
Camargue area, traditional rural activities, especially hunting, are important. Creating a
wetland would increase the size of the available hunting ground for town hunters, who
do not currently have much. Moreover, it would induce a close collaboration between
nature reserve managers and hunters who have drastically different ways of managing
wetland hydrology (hunters keep standing water in summer to attract waterfowl, leading
to hydrological functioning in contrast to Mediterranean temporary wetlands, whose
management has resulted in severe consequences for biodiversity see also 1.2.2.1
Mediterranean temporary wetland). Because funding for a project can depend on its level
of public acceptance (Miller and Hobbs 2007), local participation is an essential ingredient
for project success. The conflicts and compatibilities of the Cassaïre restoration project
objectives were carefully considered, and the project now stands out as a shining
example of co-management that properly takes into account local acceptance, projected
benefit, social, financial, and ecological goals and constraints (Figure 1.3).

Chapter 1: The Cassaïre restoration project
31
Social constraintsWhat is acceptable?
Hunting ground
Hunting associationDepartmental hunting federation
Ecological constraintsWhat is possible?
Landscape contextConservation value
Amis des Marais du VigueiratTour du Valat
IMBEPNR Camargue
ONCFS
Financial constraintsWhat is realistic?
Budget
Conservatoire du LittoralAgence de L’eauConseil RégionalConseil Général
Acceptance
Reflexion on the reference ecosystem
of the restoration project
Develop restoration treatments with a good cost/result
compromise
Figure 1.3: Conceptual organization chart of the project design. Figure modified from Miller and
Hobbs (2007).
As determined by Donadieu (2002), the reference selection process needs to address
the following four questions: 1) From whom to restore?, 2) What to restore?, 3) How to
restore? and 4) How to evaluate the long-term success of the operation?
For the Cassaïre site, the answers to these questions were: 1) for biodiversity and for
the hunters, 2) a Mediterranean temporary wetland with high conservation value and
suitable for hunting activities, 3) by using advanced engineering techniques, and 4) by
using the notion of target species. Indeed, even though the facilitation of hunting
activities was a major objective, the primary aim was to create natural habitats similar to
the high conservation value habitats found in Camargue, and complementary to those of
the Vigueirat National Nature Reserve. The notion of target species is thereby directly
linked to the concept of reference ecosystems. These species are the species present in
the reference and are usually contrasted with non-target species which are species
absent from the reference. A reduction in the number of non-target species accompanied
by an increase in the number of target species can be an objective and an indicator of

Chapter 1: The Cassaïre restoration project
32
success in a restoration project (used in Chapter 2, Chapter 3 and Chapter 4), though it
must be used with caution (Davis et al. 2011). A index was thereby developed using target
and non-target abundances, indicating whether the target community objective was
reached (Annexe 1, Jaunatre et al. 2013b). Because the restoration project incorporated
local stakeholders, other evaluation guidelines, which include social components, could
be used as success indicators (such as the support of local stakeholders, hunting tables,
and ecosystem services) and are proposed in the General Discussion.
1.2.2. Reference ecosystems of the Cassaïre site
1.2.2.1. Mediterranean temporary wetland
Mediterranean temporary wetlands are depressions, characterized by variable
floodings (concentrated in autumn, winter and spring) and a summer dry-out (Grillas et al.
2004). They represent one of the most remarkable Mediterranean habitats, comprising a
high plant diversity with many annual species, some of which are rare and endangered.
These plants are well adapted to the Mediterranean climate because, by being annual
they, are able make it through the dry summer and take advantage of the short favorable
periods for reproduction. Examples include Zannichellia obtusifolia Talavera & al.,
Callitriche lenisulca Clavaud or Tolypella hispanica C.F.O. Nordstedt ex T.F.Allen (Grillas and
Duncan 1986; Grillas et al. 2004). Grazing helps to keep the habitat open and to aerate the
soil by trampling. These habitats have lost their identity with the work of hydraulic
facilities (containment and supply of fresh water) and have been subjected in recent
decades to degradation and drastic area reduction due to agriculture, industry,
recreational activities, and hunting (Hollis 1992; Grillas et al. 2004), making this type of
habitat rare (Figure 1.4). Indeed, one of the main causes of degradation in Mediterranean
temporary wetlands is water management in support of hunting activities in which water
levels are maintained in summer, to attract waterfowl, and this has gradually favored
perennial and cosmopolitan species over plant communities that are restricted to
temporary wetlands (Tamisier and Grillas 1994; Aznar et al. 2003). The artificial addition of
freshwater in summer is contrary to the natural functioning of wetlands and leads to
conflicts and strong contention between conservationists and hunters, a recurrent issue

Chapter 1: The Cassaïre restoration project
33
that has been demonstrated yet again in a recent county hunting journal article that is
critical of nature reserve managers (Chauvet 2012).
Figure 1.4: Distribution of the Mediterranean temporary wetlands (in black) in Camargue area and
location of the Cassaïre site. The grey shading indicates the other wetland types in the Camargue
area.
1.2.2.2. Mediterranean meso-xeric grassland
Mediterranean temporary wetlands are found in a mosaic together with many other
habitats, including Mediterranean meso-xeric grasslands. It was therefore decided that a
topography favorable to meso-xeric grasslands be created in addition to the depressions
needed for temporary wetland restoration. A convenient way of simultaneously restoring
both habitats is to use the soil that is removed, in creating the depressions, for
establishing restored grassland. Meso-xeric grassland is already present on the Cassaïre
site as relics of natural habitats (Figure 1.2). Such grassland is found on never-flooded old
eroded dune relief (fluvial or marine) that is less subject to the influence of salt than
lower areas. This habitat has the highest plant richness in the Camargue area (Molinier
and Tallon 1970; Braun-Blanquet 1973), composed in high proportion of annual species,
such as Brachypodium distachyon (L.) P. Beauv., Galium murale (L.) All., or Scorpiurus

Chapter 1: The Cassaïre restoration project
34
muricatus L.. These grasslands are traditionally managed by extensive on-and-off
livestock grazing throughout the year, keeping habitats open, and enhancing biodiversity
(Mesléard et al. 1991). Having gone from around 4000 hectares initially (Tamisier and
Grillas 1994) to less than 2000 highly fragmented hectares today, they are also the most
threatened habitat in the Camargue area (Figure 1.5). This is essentially the result of
topological flattening of dune relief due to cultivation expansion.
Figure 1.5: Distribution of the Mediterranean meso-xeric grasslands (in black) in Camargue area
and location of the Cassaïre site. The grey shading indicates the other wetland types in the
Camargue area.
1.2.2.3. Reference choice and landscape importance in restoration
The choice of these two reference ecosystems appears logical considering their
contribution to regional biodiversity. Temporary wetlands and meso-xeric grasslands are
rare, adapted to Mediterranean climate, seriously endangered and enjoy a high species
richness. The dry phases in temporary wetlands are often considered as a disturbance
(Bonis 1998) on a par with grazing in meso-xeric grasslands (Mesléard et al. 2011). The
disturbance regimes of both ecosystems should be understood so that they can be re-

Chapter 1: The Cassaïre restoration project
35
established on the restored ecosystems, because they can create environmental
heterogeneity and can affect community structure, diversity, and biotic interactions
(Menninger et al. 2006).
Moreover, these two reference ecosystems are potentially achievable restoration
targets because patches of these ecosystems remain in the Camargue area and close to
the Cassaïre site (Figure 1.4 and Figure 1.5). Indeed, reference ecosystems must be
sustainable in the future (Choi et al. 2008). A landscape-scale approach can have notable
implications for restoration (1) by providing better guidance for selecting reference sites
and establishing project goals, and (2) by suggesting spatial configurations of restored
elements appropriate for facilitating recruitment of flora and fauna, with intact regional
ecosystems playing the role of propagule sources for colonizing restored areas (Cairns
1993; Bell et al. 1997; Bornette et al. 1998; Zedler 2000b; Prach et al. 2001b; del Moral et al.
2005; Moreno-Mateos and Comin 2010; Shackelford et al. 2013). The restored site can
therefore have a strong influence on the relictual landscape responsible for exchanges of
propagules to support a viable community, maintain biodiversity, contribute to regional
dynamics, increase connectivity (Hilty et al. 2006), decrease extinction debts (Smallwood
2001; Piqueray et al. 2011), have an important role within a metacommunity context
(Turnbull et al. 2000), and to potentially play the role of keystone community in
fragmented landscape (Mouquet et al. 2013).
Chapter 2, Chapter 3, and Chapter 4 also address the importance of the landscape in
plant colonization processes and community development, the distance to the nearest
intact regional pool of target communities can determine whether or not species must be
manually introduced to the restored site.
1.3. Ecological History of the Cassaïre site
1.3.1. Aims and methods
Ecological history is a tool that can be used to identify and characterize suitable
targets for ecological restoration (Swetnam et al. 1999; Jackson and Hobbs 2009).
Ecological history helps to define the state of the original ecosystem, the natural state of
the landscape, and the dynamics of ecosystems. It also serves to assess the nature,

Chapter 1: The Cassaïre restoration project
36
duration, and intensity of disturbances (e.g. grazing suppression, cultural eutrophication,
or river containment). Even when the historical state cannot be reached, historical
information for a given site can be very useful in restoration planning (Swetnam et al.
1999).
To identify the history of the Cassaïre site in the grander context of the Plan du Bourg
(Figure 1.1), its ecological history was assessed by searching historical documentary
archives, old maps, written descriptions, aerial images from 1640 to 1974 (Table 1.1), and
by interviewing local stakeholders familiar with the period between 1946 and 2004.
Table 1.1: Documentary sources and archives for the various dates
Date Documentary sources1640 Provence map
1706 Rhone mouth map
1770 - 1778 Cassini map
1811 - 1829 County written description
1823 - 1828 Napoleonic land registry
1830 - 1901 Land registry
1896 Article about the sale of the Cassaïre site
1944 US Army aerial images
1947 - 1998 IGN aerial images
1946 - 2004 Interviews of the former farmer
1.3.2. Results
Today, the Plan du Bourg area is separated from the Grande Camargue by the Grand
Rhône, which is one of the branches of the Rhône river (Figure 1.1). Conversely, a
geological study demonstrated that Plan du Bourg belongs to the Camargue area (Figure
1.6). The 1640 map of Provence indicates that prior to the containment of the Rhône, a
branch of the Rhône formerly ran along the Crau area (Figure 1.7) to the east of the Plan
du Bourg (Figure 1.1). The floodwaters of the Rhône and Durance rivers formed a
permanent stream, the Duransole (Colin 1904), that flowed freely through the Plan du
Bourg. No written descriptions of the vegetation were found for this period, however, it
is known that significant amounts of water and associated sediment inputs limited the
local salinity and allowed the development non-halophilous riparian vegetation and fluvial
dunes.

Chapter 1: The Cassaïre restoration project
37
Figure 1.6: Extract from County written description, Statistiques des Bouches-du-Rhône (1821)
Water levels have been managed since the 14th century (de Villeneuve-Bargemon
1826) to reduce the hostility of the wetland areas and to dry out the Plan du Bourg,
leading to the formation of Viguierat wetlands (currently the Viguierat National Nature
Reserve) neighboring the Cassaïre site. This regional drying-out is inseparable from the
Grand Rhône containment.
Figure 1.7: Provence map (Louis Cundier) indicating the former branch of the Rhône along the
Crau area (1640). The Cassaïre site is located with red dot.

Chapter 1: The Cassaïre restoration project
38
Maps from 1706 and 1770 indicate that the Cassaïre site once presented brush,
wetlands and fluvial dunes (Figure 1.8), the latter having a relic distribution still present
today on the site (Figure 1.2).
Figure 1.8: Rhône mouth map (JB Bourgignon) indicating fluvial dunes (1706). The Cassaïre site is
indicated by the red dot.
The first specific indications of the Cassaïre site appear in the Napoleonic land
registry (1823, Figure 1.9), indicating that the Cassaïre site was mainly composed of
brackish marsh and flooded grassland, where grazing was common, and of small areas of
vineyard and other cultivation.
Figure 1.9: Napoleonic land registry of the Cassaïre site delimited in red (1823).

Chapter 1: The Cassaïre restoration project
39
An extract from the press surrounding the sale of the site (Figure 1.10) indicates the
presence of vineyards and other cultivation, gardens, and grassland.
Figure 1.10: Extract from the press surrounding the sale of the Cassaïre site (1896).
By digitizing and analyzing aerial images from 1947 to 1998 (e.g. Figure 1.11), we
detected a drastic reduction in natural habitat (from 69% to 8% of the total area, all of
which corresponds to the actual relic natural habitats, Figure 1.2) in favor of cultivation
(from 31% to 92%, Figure 1.12).
A.1947 B. 1974 Natural habitat Arable habitat
Figure 1.11: Example of digitized aerial images showing the natural habitat (in green) and the
arable habitat (in shaded orange) from 1947 and 1974.

Chapter 1: The Cassaïre restoration project
40
The site was leveled during several decades for arable land. Wheat, sunflower,
sorghum, corn, and rice (for desalinating parcels) were cultivated. Grazing was applied in
autumn and winter on cultivated alfalfa or on natural grassland. In 1976, modernization of
agricultural materials and practices led to a reduction in the total number of parcels, and
topographic level homogenization of the remaining parcels was performed. In 2004, the
site was mainly used for rice cultivation, with a few parcels reserved for wheat.
1950 1960 1970 1980 1990 2000
02
04
06
08
01
00
Years
% o
f to
tal are
a
Figure 1.12: Evolution of % area in natural habitats (grey lines) and cultivated land (black lines) in
the Cassaïre site between 1944 and 1998. Data collected from the analysis of digitized aerial
images.
1.3.3. Confirmation of our reference ecosystems
The ecological history of the site reveals deep human imprints on ecosystems and
ensures that historical restoration targets (the state prior to human impacts) cannot be
reached, because they are associated with hydraulic functioning (flooding of the Rhône
and Durance) that no longer exists. The specific history of the site also reinforces our
choice of socio-ecosystems because it serves to ensure the actual maintenance of
ecological goods and services (Choi et al. 2008; Jackson and Hobbs 2009; Davis et al.
2011). Clearly, the history of the Cassaïre area is a good illustration of the immortal words
of Goethe: “Nature is ever shaping new forms: what is, has never yet been; what has
been, comes not again” (Huxley 1869).

Chapter 1: The Cassaïre restoration project
41
1.4. Restoration vs. novel ecosystem: Why restore and how do we justify
restoration?
1.4.1. Restored ecosystem vs. novel ecosystem
Most ecosystems degraded by agricultural and industrial exploitation are now seen
as "novel ecosystems" (Hobbs et al. 2006). Novel ecosystems are ecosystems that differ
in composition and/or function from present and past systems and are a product of
changing species distributions, invasive species, environmental alteration, climate
change, and land use change (Harris et al. 2006; Hobbs et al. 2006). Dynamics trajectories
of these novel ecosystems are multiple, and for some of them, may lead to ecosystems
just as interesting as those that existed prior to human destruction (Schnitzler and Génot
2012). Some authors (Hobbs et al. 2006; Hobbs et al. 2009) have suggested that these
novel ecosystems must be to the point of requiring significant attention before
restoration is applied. However, a recent meta-analysis conducted over 89 ecological
restoration projects concluded that restored ecosystems provide more biodiversity and
ecosystem services than degraded ecosystems prior to restoration (Benayas et al. 2009).
1.4.2. Restoration on arable land
In the present context, in which the destruction of arable land continues to increase
(Morel and Jean 2010) and where numerous groups fighting for access to arable land
continue to emerge (e.g. Reclaim the fields, Zone à Défendre against the construction of
the future airport of Notre-Dame-des-Landes, LEOpart against the construction of the
Liaison Est-Ouest in Avignon), the opportunity and the motivation to restore natural
ecosystems on arable land must be called into question. Moreover, as with all human
activities, restoration must be equally subject to ethical analysis and justification (Katz
2000).
Some arguments can be given to support the restoration of Le Cassaïre site. First, the
former owners had no successors and Le Conservatoire du Littoral et des Rivages
Lacustres was the only potential purchaser to show any interest in acquiring the site.
Unlike the high-production agricultural holdings in the Camargue area (latifundia system,

Chapter 1: The Cassaïre restoration project
42
Mathevet 2004), the site of Cassaïre is a small holding with low agricultural value, and
whose reliance on agricultural subsidies provided the primary basis for economic survival.
Moreover, by creating a location suitable for livestock grazing, the restored ecosystem
presents a new agricultural opportunity, while simultaneously offering new services, such
as hunting. Finally, although it would be ethically, financially, and ecologically undesirable
to do so, the entire restoration operation could be completely reversed if arable land was
needed later, and this is something that cannot be said for former agricultural land that
has been filled in with concrete.

Transition to Chapter 2
43
Transition to Chapter 2
After defining the main objective of the project restoration of the Cassaïre in Chapter 1
(i.e. the reference ecosystems), Chapter 2 examines the plant community dynamics after
the restoration of abiotic conditions.
Ecosystèmes de référence
Ecosystème dégradé
Le transfert de foin permet-il de restaurer les
communautés terrestres?
Chapitre 4
Le transfert de sol permet-il de restaurer les
communautés d’invertébrés?
Chapitre 3.2
La restauration des conditions abiotiques est-elle
suffisante?
Chapitre 2
Quel est l’écosystème de référence?
Chapitre 1
Le transfert de sol permet-il de restaurer les
communautés aquatiques?
Chapitre 3.1
Figure T2.1: Location of Chapter 2 in the general thesis organization
The study of the initial state (T0; Willm et al. 2011) is a crucial to evaluate the potential
of the degraded ecosystem. This study revealed a low species richness and a relatively
homogeneous species composition on former agricultural fields, with the dominance of
two meadow species Lolium perenne L. and Trifolium repens L.. No ecological values can
be expected for this ecosystem even in the long term as the practices of rice cultivation
led to a totally homogenization of the topography and the improvement of abiotic
conditions is require to try to achieve our 2 reference communities, dealt in Chapter 2.

Transition to Chapter 2
44
Seed rain trap with windsock at 1.90 m high. In foreground an experimental block filled with water.
Soil cores to analyze the Cassaïre soil seed bank.

45
Chapter 2 - Regional pool species: relative
contribution of seed bank, seed rain, and
extant vegetation in aquatic and terrestrial
ecosystem
Isabelle Muller, François Mesléard, Julie Chenot & Elise Buisson

Chapter 2: Regional pool species
46
2.1. Introduction
Ecological restoration and ecological creation, as implemented on areas of former
arable land, are used to promote a more diverse plant community, and they have recently
become a part of general conservation practice (Millennium Ecosystem Assessment
2005). Creation (restoration sensu lato) is the establishment of a community on a site
where all traces of its previous existence have been largely, or totally, removed
(Anderson 1995). It differs from restoration sensu stricto which consists of managing
existing resources to return the habitat to a desirable state (Society for Ecological
Restoration 2004). In both cases, the objective is to establish a reference community that
complies with conservation targets (e.g. target vegetation, target species, etc.). Although
many restoration scientists equate restoration with accelerating succession towards the
reference community (Zedler 2000a), the use of natural revegetation processes for
restoration, a process known as the spontaneous succession approach or the passive
restoration approach, has not been sufficiently explored. Such methods should always be
carried out before resorting to labor-intensive operations (Mitsch and Wilson 1996; Zedler
2000a; Prach et al. 2001b; Prach and Hobbs 2008). Bradshaw (1996) recommends using
the spontaneous succession approach wherever possible, because it is relatively
inexpensive, saves time and effort, can be used on a large scale, and is likely to be self
sustaining, generally because processes involved originate from nature. Investigating
natural revegetation and colonization processes is therefore important because it can
provide necessary information for restoration ecology (Bobbink and Willems 1993; Prach
et al. 2001b; Prach and Hobbs 2008; Török et al. 2009). Indeed, determining seed
availability and characteristics (i.e. target, unwanted, or alien) should help to predict
future plant composition, allowing restoration practitioners to make educated decisions
and implement appropriate measures.
Plant community succession is driven by many factors, but ultimately, the regional
species pool is the primary determinant of community composition (Keddy 1992;
Strykstra et al. 1998; Zobel et al. 1998; Lortie et al. 2004). The regional species pool has
two origins: external, and internal to the community in question. The external species
pool is composed of species found in the landscape surrounding the site that must be
brought into the site. It is therefore dependent on species’ dispersal capacities and on

Chapter 2: Regional pool species
47
their distance to the site. The internal species pool is composed of species already
present on site, in the soil seed bank, or in the extant vegetation (Fattorini and Halle
2004). Evaluating the potential for spontaneous succession requires the determination of
the availability of propagules dispersed to the site (i.e. seed rain), of propagules stored in
the soil (i.e. soil seed bank), and of propagules coming from extant vegetation (Strykstra
et al. 1998; Zobel et al. 1998). More than identifying the future plant composition and the
potential limitations of restoration success, evaluating the potential of spontaneous
succession provides an ideal experimental setting i) to test the theory of community
assembly (i.e. acid test, Bradshaw 1996), and ii) to identify the contribution of each pool
(i.e. soil seed bank and seed rain) to regeneration and, by extension, to the plant
community.
Seed banks provide information on past vegetation, land-use history (Adams and
Steigerwalt 2011; Török et al. 2011a), and regeneration potential (Hopfensperger 2007).
Seed rain is generated via two distinct mechanisms: short-distance dispersal,
corresponding to the auto-regeneration capacity of the extant vegetation through local
seed production, and long-distance dispersal, which is typically rare but crucial to
population spread (Soons et al. 2004; Soons and Ozinga 2005; Trakhtenbrot et al. 2005;
Nathan 2006) and to plant community modification. In practice, most dispersing events
occur relatively at short distances away from the source (Trakhtenbrot et al. 2005). Seed
rain characterization often requires intense work, as it relies on a large network of traps
with different configurations in order to be able to characterize the different dispersal
processes (Greene and Johnson 1996; Chabrerie and Alard 2005).
Grassland and wetland ecosystem restoration commonly aims at both introducing
target species and recovering ecosystem functions. The main difference between these
two types of ecosystem is that unlike grasslands, wetlands exhibit structure and
functioning that is strongly regulated by hydrological conditions (Grillas 1990; Zedler
2000b). The highly specific conditions of periodic flooding often make the trajectories of
wetland ecosystems very predictable (Mesléard et al. 1991) when compared to more
open and fluctuating systems such as grassland. Moreover, in wetland ecosystems, some
propagules are small in size compared to terrestrial ones and are therefore more easily
dispersed (Bradshaw 1996). Several studies have shown that long distance dispersals are

Chapter 2: Regional pool species
48
rare events in terrestrial situations (Harper 1977; Willson 1993) and are probably more
prevalent in wetland systems (Kinlan and Gaines 2003; Kinlan et al. 2005).
Contrasting results have been reported with the spontaneous succession
approach. In terrestrial situations, even though some studies have shown a high degree
of re-establishment from the regional species pool in grassland restoration (Gibson and
Brown 1992; Etienne et al. 1998; Matus et al. 2003), numerous other studies have found a
relatively low potential to recover through a long-term seed bank or through long-
distance seed rain (Graham and Hutchings 1988; Bakker et al. 1996; Hutchings and Booth
1996; Kalamees and Zobel 2002; Donath et al. 2003; Buisson et al. 2006a). Identically
contrasting results have been reported in aquatic situations, with some studies showing
successful passive restoration (Valk et al. 1992; Galatowitsch and Valk 1996; Elmarsdottir
et al. 2003; Leck 2003; Combroux and Bornette 2004; De Steven et al. 2006) and others
not, while indicating a lack of native species in the seed bank and seed rain (Kettenring
and Galatowitsch 2011; Beas et al. 2013).
The limitations of plant recolonization through spontaneous succession can be
explained by: (1) the fragmented landscape context, which is not favorable to species
dispersion, and which impacts the seed rain (Ash et al. 1994); (2) the effect of the
agricultural disturbance, which often may involve fertilization and ploughing, each of
which can have a lasting and direct impact on the soil seed bank and plant community
(Gibson and Brown 1992; Clements et al. 1996); (3) the influence of stronger recolonizers
coming from a disturbed landscape or from disturbed plant communities: these can
prevent the establishment of native plant communities in terrestrial (Prach et al. 2001b)
and aquatic systems (Kettenring and Galatowitsch 2011); and (4) the ability of target
species that have short-lived seeds (Römermann et al. 2005; Buisson et al. 2006a;
Rowarth et al. 2007) or limited dispersal abilities (Buisson et al. 2006a; Kettenring and
Galatowitsch 2011) to disperse and to establish a persistent seed bank.
In addition to availability of seeds, which either originate from seed rain or from
soil seed bank, site limitation, corresponding to inappropriate site conditions, may also
hamper the re-establishment of vegetation. Indeed, plant community assembly depends
strongly on abiotic processes (Galatowitsch and Valk 1996; Lepš 1999; Bischoff 2002;
Hobbs and Norton 2004; Kiehl et al. 2010; Bornette and Puijalon 2011), and the long term

Chapter 2: Regional pool species
49
success of a restoration project depends on the suitability of the abiotic conditions. If
such conditions are drastically altered and are adverse to the target vegetation, their
restoration will have to precede spontaneous succession (Prach et al. 2001b).
In the Mediterranean basin, temporary wetlands and meso-xeric grasslands are
two of the priority habitats listed by the Natura 2000 Network of the European Union
Habitats directive (European Commission 1992). They both have been greatly impacted by
agriculture expansion. Rice cultivation has been especially onerous because of its leveling
requirement and its need for fertilization, which have respectively eliminated variations in
topography and trophic levels. In Mediterranean temporary wetlands, the hydrological
regime appears to be one of the main factors controlling the plant community (Grillas
1990), whereas the nutrient level appears to strongly affect oligotrophic grassland
communities adapted to nutrient-poor soils (Lepš 1999; Kiehl et al. 2010). To restore
favorable abiotic conditions for these two ecosystems in former ricefields, topsoil can be
removed, leading to i) the creation of depressions, which allows the restoration of
wetland hydrological conditions, ii) a reduction of nutrient levels, favoring the
development species adapted to low-nutrient conditions (Marrs 2002), and iii) the
removal of the topsoil seed bank, which is often dominated by ruderal species (Davy
2008; Török et al. 2011a).
This chapter aims to assess the regional species pool and the potential for
spontaneous succession in terrestrial and aquatic communities on former ricefields after
topsoil removal (corresponding to the abiotic conditions restoration). In other words, we
make an attempt at answering the following general question: can the restoration of
abiotic conditions (assuming that abiotic condition are restored with topsoil removal for
grassland and topsoil removal and hydrological regime for wetland) in terrestrial and
aquatic communities be sufficient to establish target species, and are the two
communities different from a restoration standpoint? To address this question, we
studied experimentally the species present in the seed bank, seed rain, and extant
vegetation at 4 different topsoil removal depths. The results of these studies were used
to plan management strategies appropriate for creating temporary wetlands and meso-
xeric grasslands in the aftermath of rice cultivation. Seed banks were studied in terrestrial
and aquatic conditions to test the potentiality for terrestrial and aquatic ecosystem

Chapter 2: Regional pool species
50
restoration. Seed rain was evaluated using three methods, one characterizing long
distance dispersion, another characterizing the auto-regeneration capacity of vegetation
through local seed production, and a final method characterizing hydrochory transport.
By restoring (or at least by improving) abiotic conditions, and allowing spontaneous
succession to occur, we were able to investigate the following four questions: (1) What
can be expected from the soil seed bank, the seed rain, and extant vegetation i.e. the
proportion of alien and target species in the regional species pool. We hypothesized a
low number of species and of individuals of target species in the regional species pool
after ricefield disturbance; (2) What are the impacts of abiotic conditions restoration on
soil seed bank and seed rain i.e. determine the composition of soil seed bank and seed
rain at different depths. We hypothesized that the seed rain continues to supply new
recruitments at all depths (i.e. same contribution of seed rain at all depths) while there
would be a decrease in density of seeds and in species richness in the seed bank with
depth in terrestrial and aquatic conditions; (3) To what extent soil seed bank and seed
rain influence the extant vegetation i.e. determine the similarity between extant
vegetation, soil seed bank and seed rain between the different depths. We hypothesized
that with increasing topsoil removal depth, the influence of the soil seed bank decreases
and thus the influence of the seed rain proportionally increases; and (4) Is there
difference between temporary wetland and meso-xeric grassland ecosystem restoration
on former ricefields? We hypothesized that it is easier to restore abiotic conditions for
wetland ecosystem (abiotic filters are easier to control in wetland ecosystem than in
grassland ecosystem), that seed dispersal is less limited in wetland ecosystem (because
seeds are generally smaller and because hydrochory play an additional role) therefore
making them easier to restore using spontaneous succession.
2.2. Materials and Methods
2.2.1. Study site
The experiment was conducted at the Cassaïre site (c. 43°31’ N, 4°44’ E, 3 m maximum
elevation) located east of the Camargue area (Rhône delta, Southern France). The climate
is typically Mediterranean, characterized by an annual average temperature of 15°C, an
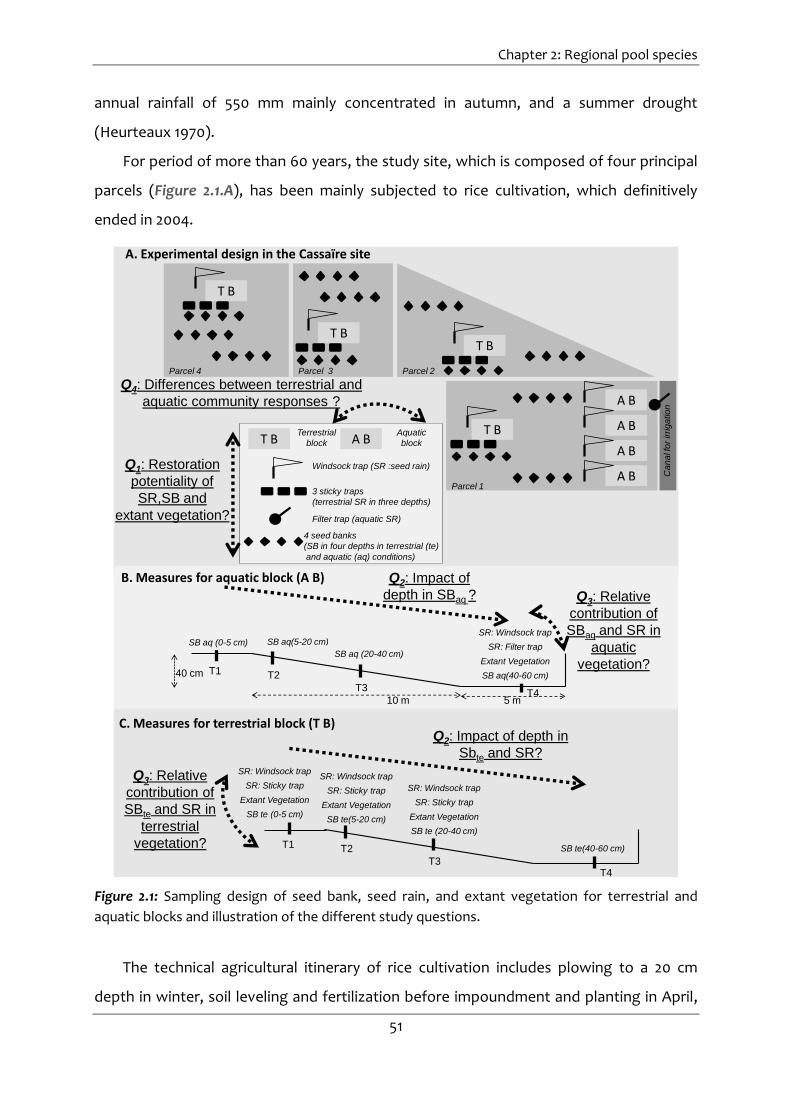
Chapter 2: Regional pool species
51
annual rainfall of 550 mm mainly concentrated in autumn, and a summer drought
(Heurteaux 1970).
For period of more than 60 years, the study site, which is composed of four principal
parcels (Figure 2.1.A), has been mainly subjected to rice cultivation, which definitively
ended in 2004.
SR: Windsock trap
SR: Sticky trap
Extant Vegetation
SB te (0-5 cm)
T1 T2
T3T4
SR: Windsock trap
SR: Sticky trap
Extant Vegetation
SB te(5-20 cm)
SR: Windsock trap
SR: Sticky trap
Extant Vegetation
SB te (20-40 cm)
SB te(40-60 cm)
C. Measures for terrestrial block (T B)Q2: Impact of depth in
Sbte and SR?
Q3: Relative
contribution of
SBte and SR in
terrestrial
vegetation?
T BT B
A B
A B
A B
A B
T B
T B
Parcel 4 Parcel 3 Parcel 2
Parcel 1
Ca
na
l fo
r irrig
atio
n
A. Experimental design in the Cassaïre site
5 m
40 cm
10 mT4
SR: Windsock trap
SR: Filter trap
Extant Vegetation
SB aq(40-60 cm)
B. Measures for aquatic block (A B)
T1 T2
T3
SB aq(5-20 cm)
SB aq (20-40 cm)
SB aq (0-5 cm)
Q2: Impact of
depth in SBaq ? Q3: Relative
contribution of
SBaq and SR in
aquatic
vegetation?
T BTerrestrial
block A BAquatic
block
Windsock trap (SR :seed rain)
3 sticky traps
(terrestrial SR in three depths)
Filter trap (aquatic SR)
4 seed banks
(SB in four depths in terrestrial (te)
and aquatic (aq) conditions)
Q1: Restoration
potentiality of
SR,SB and
extant vegetation?
Q4: Differences between terrestrial and
aquatic community responses ?
Figure 2.1: Sampling design of seed bank, seed rain, and extant vegetation for terrestrial and
aquatic blocks and illustration of the different study questions.
The technical agricultural itinerary of rice cultivation includes plowing to a 20 cm
depth in winter, soil leveling and fertilization before impoundment and planting in April,

Chapter 2: Regional pool species
52
and finally harvesting in September (Marnotte et al. 2006). Recurrent leveling led to the
complete elimination of the natural topography.
Mediterranean temporary wetlands are characterized by winter and spring flooding,
the durations of which vary greatly from year to year, and by a complete drying-out in the
summer (Grillas et al. 2004). Plant communities in these wetlands are mainly driven by the
hydroperiod, water depth, and salinity (Grillas 1990). Mediterranean meso-xeric
grasslands are characterized by a high proportion of annuals (Molinier and Tallon 1970;
Braun-Blanquet 1973), are managed by traditional extensive on-and-off livestock grazing
(Mesléard et al. 2011), and are associated with nutrient-poor soils.
2.2.2. Abiotic conditions for restoration
Eight mesocosms, henceforth referred to as blocks, were dug out with a gentle slope
(15 m long × 5 m wide × 40 cm deep; Figure 2.1.B). Four blocks were randomly selected
(one on each parcel; Figure 2.1.A) for use in terrestrial vegetation monitoring (Figure
2.1.B). The four remaining blocks were set up along an irrigation canal and used for
aquatic vegetation monitoring (Figure 2.1.B). A pump maintained a constant 20 cm water
level in those four blocks from January 2012 (four months after classical temporary
wetland conditions but allowing even so the germination of vernal species germination in
March) to the end of May 2012, simulating hydrological conditions of temporary
wetlands. To mimic the effects of grazing that reference grasslands are typically subject
to, we mowed and exported the cuttings around the terrestrial blocks in January 2012.
2.2.3. Vegetation monitoring
Vegetation monitoring in the four terrestrial blocks was carried out along three
permanent transects on each block (Figure 2.1.B and Figure 2.1.C): one at the top of the
block (transect 1 (T1), corresponding to the vegetation without topsoil removal), one at 1
m from the top of the slope (transect 2 (T2), corresponding to 5 cm of topsoil removal),
and one at 6 m from the top, or the middle of the slope (transect 3 (T3), corresponding to
20 cm of topsoil removal).

Chapter 2: Regional pool species
53
The vegetation survey was carried out using one 30 × 30 cm permanent plot
subdivided into nine 10 × 10 cm cells. The plot was positioned at the middle of each
transect, corresponding to the middle of the block. In May 2012, the presence/absence of
all species was recorded in each cell, obtaining abundance data for each species.
In aquatic blocks, vegetation monitoring was carried out only along one transect at
12.5 m from the top of the block, which is the bottom of the block (transect 4 (T4),
corresponding to 40 cm of topsoil removal; (Figure 2.1.B and Figure 2.1.C)), using a 4 × 2 m
plot. In each plot, we estimated the % cover of each species. Plots were monitored in May
2012.
2.2.4. Soil seed bank
In order to determine the influence of topsoil removal on the soil seed bank and the
potential role of buried seeds in the succession, we collected 12 soil samples (three on
each parcel, randomly selected; Figure 2.1.A) i) from the surface (0 to 5 cm deep,
corresponding to the first transect), ii) from 5 to 20 cm deep (corresponding to the
second transect), iii) from 20 to 40 cm deep (corresponding to the third transect) and iv)
from 40 to 60 deep (corresponding to transect 4). For each sample composed of 3
pooled sub-samples, 1 L total of soil was taken in January 2011. The soil seed bank was
evaluated using the method of seedling emergence with sample concentration (Ter
Heerdt et al. 1996). Each sample was cleaned with water and passed through a 200-
micron sieve in order to separate the seeds from the clay before spreading them on 30 x
20 cm trays filled with a 50%/50% mix of organic matter and vermiculite, coated 100-
micron medical gauze, which was intended to prevent the seeds from sinking into the
substrate. In order to have both terrestrial and aquatic seed bank species, we used two
germination conditions. First, terrestrial conditions were applied: trays were watered
regularly to provide moist soil during the ten-month germination period. Germinated
seedlings were identified, counted, and removed every week to avoid potential
competition. Unidentifiable plants were transferred to pots and allowed to grow so that
their identities could be established later. After this, samples were stored at 4°C for two
months, before the aquatic conditions were applied. Trays were then placed in a
submerged setting (in 10 cm of standing water) for six months. Germinated seedlings

Chapter 2: Regional pool species
54
were identified as explained previously. For both the aquatic and terrestrial studies, trays
filled with the same substrate and coated with medical gauze were set up as controls,
principally to rule out the possibility of spontaneous germination from the organic matter
or from accidental seed rain in the greenhouse.
2.2.5. Seed rain
In order to provide a reliable estimate of the seed rain, we used three types of seed
traps, each optimized for a different seed dispersal process (Chabrerie and Alard 2005).
On each block, one windsock trap was placed for 7 months (from July to September 2011
and from March to July 2012, to cover the main seed production season, Figure 2.1.A). On
each terrestrial block, three sticky traps were placed close to the ground during same 7-
month period (Figure 2.1.A). For the four aquatic blocks we addressed a single filter trap,
placed during the inundation period from January to May 2012 (Figure 2.1.A). All seed
traps were associated with a vegetation sample and a soil seed bank sample in order to
assess their similarity.
The sticky traps were constructed from 20 x 30 cm pieces of clear Plexiglas plate
coated with clear sticky grease and held in place on the ground with metal poles (our
traps are similar to those used in Rand 2000; Chabrerie and Alard 2005; Kettenring and
Galatowitsch 2011). The sticky traps were placed on transects 1 (to sample seed rain at the
surface), 2 (at 5 cm of topsoil removal), and 3 (at 20 cm of topsoil removal), close to the
sample vegetation in each block (three seed rain samples per terrestrial block) (Figure
2.1.A). Because of the potential for inundation by rainfall, no sticky traps were placed on
transect 4 on the terrestrial block, and none were placed to the aquatic blocks (where
filter traps were used instead). The characteristics of the sticky traps were chosen to
record the auto-regeneration capacity of extant vegetation through local seed
production. Over the sample period, exposed sticky traps were swapped out for fresh
ones on a monthly basis. Seeds were extracted from sticky traps by scraping the seeds
from the traps. Then the seeds were identified under a binocular microscope by
comparison with a reference collection of the extant vegetation seeds from the study
site.

Chapter 2: Regional pool species
55
The windsock trap consisted of a 25 cm diameter, 1.20 m long windsock affixed to a
1.5 m high wooden post. Seeds were collected in a 100 µm-mesh filter gauze bag stapled
to the base of each windsock. One windsock trap was placed at the top of each block,
close to the vegetation sample and the sticky trap of transect 1, with the assumption that
the seed rain should be identical for all transects. Indeed, the characteristics of the
windsock trap were chosen to record principally anemochorous species and long-
dispersal events. The bags were replaced every month from July to September 2011 and
from March to July 2012, and the seeds were identified in the same way as for sticky traps.
The filter trap consisted of filtering the water from the irrigation channel used to fill
the aquatic blocks. Once a month, during the inundation period from January to May
2012, we filtered the water for 30 minutes through a 100-µm mesh, and repeated this
process three times. The characteristics of the filter trap were chosen to collect
hydrochorous species, and seeds from this trap were identified in the same way as for the
other two traps.
Because the sampling area was not the same for the windsocks and the sticky traps,
we divided the number of collected seeds per the surface area sampled (600 cm² for the
sticky trap and 491 cm² for the windsock trap), to facilitate data comparison between the
two types of trap. Monthly samples from each trap were summed to obtain an effective
annual seed rain.
2.2.6. Data analysis
Question 1 (restoration potential) and question 4 (differences between terrestrial
and aquatic community responses) are qualitative, and therefore answerable without
using any statistical analyses.
Question 2 (Impact of depth), for which we studied the effect of abiotic conditions
on soil seed bank and seed rain, led to a comparison of species richness and density
among the different depths. This was done using ANOVA when parametric assumptions
were justified, and using Kruskal-Wallis, when data were not normally distributed,
followed by Tukey tests (Sokal and Rohlf 1995) or pairwise Wilcoxon comparisons with a
p-value adjustment according to Holm’s method (Holm 1979). We compared species
richness and densities of the seed bank between the two germination conditions with

Chapter 2: Regional pool species
56
Student-t tests, when parametric assumptions were valid, or with Wilcoxon tests, when
data were not normally distributed. We also ran a Correspondence Analysis (CA;
Greenacre 1984), based on seed density per cm², for species collected in the windsock
and sticky traps.
Question 3 (relative contribution of seed bank and seed rain in vegetation), for which
we measure similarity between the extant vegetation, soil seed bank, and seed rain, we
associated a seed bank and a seed rain sample with each extant vegetation sample. For
aquatic blocks, only the soil seed bank from parcel 4 was used in our similarity evaluation.
We ran one Correspondence Analysis based on the presence/absence of species on
terrestrial extant vegetation (terrestrial blocks), terrestrial soil seed bank, and terrestrial
seed rain (sticky traps + windsock traps). We also ran a similar CA on the aquatic extant
vegetation (aquatic blocks), the aquatic soil seed bank, and the aquatic seed rain (filter
traps + windsock traps). For each pool (seed bank, seed rain, and extant vegetation),
species abundances were converted to species frequencies (species frequency = the
number of seeds of a given species, or the number of abundances of a given species / the
total number of seeds in the compartment, or the total number of abundances × 100). For
terrestrial blocks at all three depths, the correlation in species frequency between seed
bank and extant vegetation and between seed rain and extant vegetation were analyzed
using Spearman rank correlation coefficients. For aquatic blocks, the correlations were
analyzed using Pearson correlation coefficient. The Sorensen similarity index was used to
measure the species similarity between seed bank and extant vegetation, between seed
rain and extant vegetation, between seed rain and seed bank in aquatic blocks, and
among the three depths in terrestrial blocks. The comparisons among the Sorensen
indices were made using ANOVA for those cases where parametric assumptions were
justified, and Kruskal-Wallis, when the data were not normally distributed.
2.3. Results
2.3.1. Restoration potential from the regional species pool
In total, 64 species were recorded in the regional species pool (extant vegetation,
seed bank, and seed rain, Table 2.1).

Chapter 2: Regional pool species
57
Table 2.1: Species present in seed bank, seed rain, and extant vegetation in terrestrial and aquatic
conditions. Target species are in bold type in the table. Terrestrial condition Aquatic condition
Seed bank Extant vegetation seed rain Seed bank Extant vegetation seed rainAmaranthus sp ×Ammannia coccinea ×Lysimachia arvensis × × ×Arundi donax ×Aster squamatus × × ×Avena barbata × ×Bolboschoenus maritimus × ×Brachypodium distachyon ×Bromus hordeaceus × ×Bromus madritensis × ×Bromus rubens ×Bromus sterilis × ×Carex divisa × ×Carex sp × ×Centaurium spicatum ×Chara braunii ×Chara vulgaris × × ×Chenopodium album × ×Chladophora vagabunda ×Cirsium arvense × ×Conyza sumatrensis × ×Cyperus difformis × ×Cyperus eragrostis ×Cyperus fuscus ×Daucus carota ×Echinochloa sp ×Epilobium tetragonum ×Erigeron canadense ×Heteranthera reniformis ×Holcus lanatus × × × ×Hordeum marinum × ×Hordeum murinum × ×Juncus articulatus × × ×Joncus bufonius × ×Lactuca saligna ×Lactuca seriola × × ×Lamiaceae sp × ×Lindernia dubia × × ×Lolium perenne ×Lolium rigidum × × ×Lotus tenuis × × ×Lycopus europaeus ×Lythrum hyssopifolia ×Medicago lupulina × × ×Medicago polymorpha ×Melilotus indicus ×Paspalum distichum × ×Phragmites australis ×Picris echioïdes × × × ×Picris hieracioides × ×Picris pauciflora ×Plantago coronopus × ×Plantago lanceolata × × ×Plantago major × × ×Poa annua × ×Poa trivialis × × × × ×Polygonum aviculare × × ×Polygonum lapathifolium ×Polypogon bellardii × × ×Polygonum persicaria × ×Populus alba ×Pulicaria dysenterica ×Rumex crispus × × × ×Salix fragilis ×Samolus valerandi ×Schoenoplectus mucronatus ×Schoenoplectus supinus × ×Sonchus arvensis ×Sonchus asper ×Sonchus oleraceus × × × ×Tamarix sp ×Trifolium campestre ×Trifolium repens × × ×Typha laxmanii × ×

Chapter 2: Regional pool species
58
Only nine target species of meso-xeric grasslands were recorded, five in the seed rain
(both in windsock and sticky traps; Brachypodium distachyon (L.), P.Beauv., Bromus
hordeaceus L., Bromus madritensis L., Carex divisa Huds. and Hordeum marinum Huds.),
and five in the terrestrial soil seed bank (at the 4 depths; Carex divisa Huds., Centaurium
spicatum (L.) Fritsch ex Janch., Medicago polymorpha L., Plantago coronopus L. and
Trifolium campestre Schreb.), although each of these exhibited a low frequency (less than
3%).
Four of these target species were also recorded in the extant vegetation (three were
also present in the seed rain: Bromus hordeaceus L., Bromus madritensis L. and Hordeum
marinum Huds., and one was present in the seed bank: Plantago coronopus L.). No
temporary wetlands target species were found in the seed rain as captured by the filter
traps or in the aquatic soil seed bank. In contrast, several of the exotic species were
found in the seed bank and in the seed rain (in both terrestrial and aquatic conditions),
considered as invasive for France (Conservatoire Botanique National Méditerranée 2012),
such as Arundo donax L. or Symphyotrichum subulatum var. squamatum (Spreng.)
S.D.Sundb., or exotic ricefield weeds, such as Heterenthera reniformis Ruiz & Pav.,
Ammannia × coccinea Rottb. or Lindernia dubia (L.) Pennell (Marnotte et al. 2006;
Mouronval and Baudouin 2010).
2.3.2. Soil seed bank
In total, 7159 individuals germinated from the soil seed bank representing a total of
49 species. The terrestrial seedling emergence experiment allowed us to identify a total
of 5639 seedlings representing 41 species, and the aquatic experiment resulted in a total
of 1520 seedlings, representing 17 identified species, with 8 species exclusive to the
aquatic condition, mainly belonging to the charophyte division. The number of seedlings
(Figure 2.2.A) and of species richness (Figure 2.2.B) in the soil seed bank was significantly
higher in the terrestrial conditions (117.5±13.4 for number of seedlings; 13.1±0.6 for species
richness) than in the aquatic ones (31.7±4.7 for number of seedlings; 3.5±0.3 for species
richness).
Soil seed bank density and species richness changed with depth in both aquatic and
terrestrial conditions (Figure 2.3). The number of seedlings in the soil seed bank declined
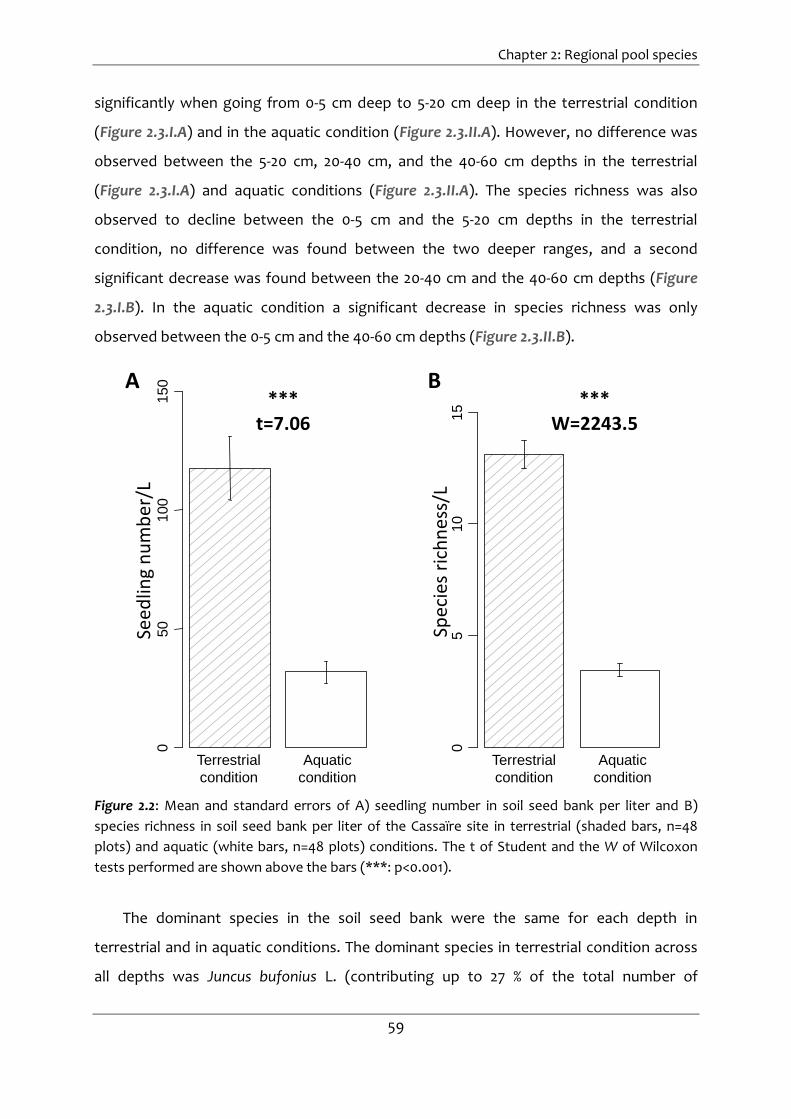
Chapter 2: Regional pool species
59
significantly when going from 0-5 cm deep to 5-20 cm deep in the terrestrial condition
(Figure 2.3.I.A) and in the aquatic condition (Figure 2.3.II.A). However, no difference was
observed between the 5-20 cm, 20-40 cm, and the 40-60 cm depths in the terrestrial
(Figure 2.3.I.A) and aquatic conditions (Figure 2.3.II.A). The species richness was also
observed to decline between the 0-5 cm and the 5-20 cm depths in the terrestrial
condition, no difference was found between the two deeper ranges, and a second
significant decrease was found between the 20-40 cm and the 40-60 cm depths (Figure
2.3.I.B). In the aquatic condition a significant decrease in species richness was only
observed between the 0-5 cm and the 40-60 cm depths (Figure 2.3.II.B).
050
100
150
05
10
15
Terrestrial
condition
Aquatic
condition
Seed
ling
nu
mb
er/L
***t=7.06
Spec
ies
rich
nes
s/L
***W=2243.5
A B
Terrestrial
condition
Aquatic
condition
Figure 2.2: Mean and standard errors of A) seedling number in soil seed bank per liter and B)
species richness in soil seed bank per liter of the Cassaïre site in terrestrial (shaded bars, n=48
plots) and aquatic (white bars, n=48 plots) conditions. The t of Student and the W of Wilcoxon
tests performed are shown above the bars (***: p<0.001).
The dominant species in the soil seed bank were the same for each depth in
terrestrial and in aquatic conditions. The dominant species in terrestrial condition across
all depths was Juncus bufonius L. (contributing up to 27 % of the total number of
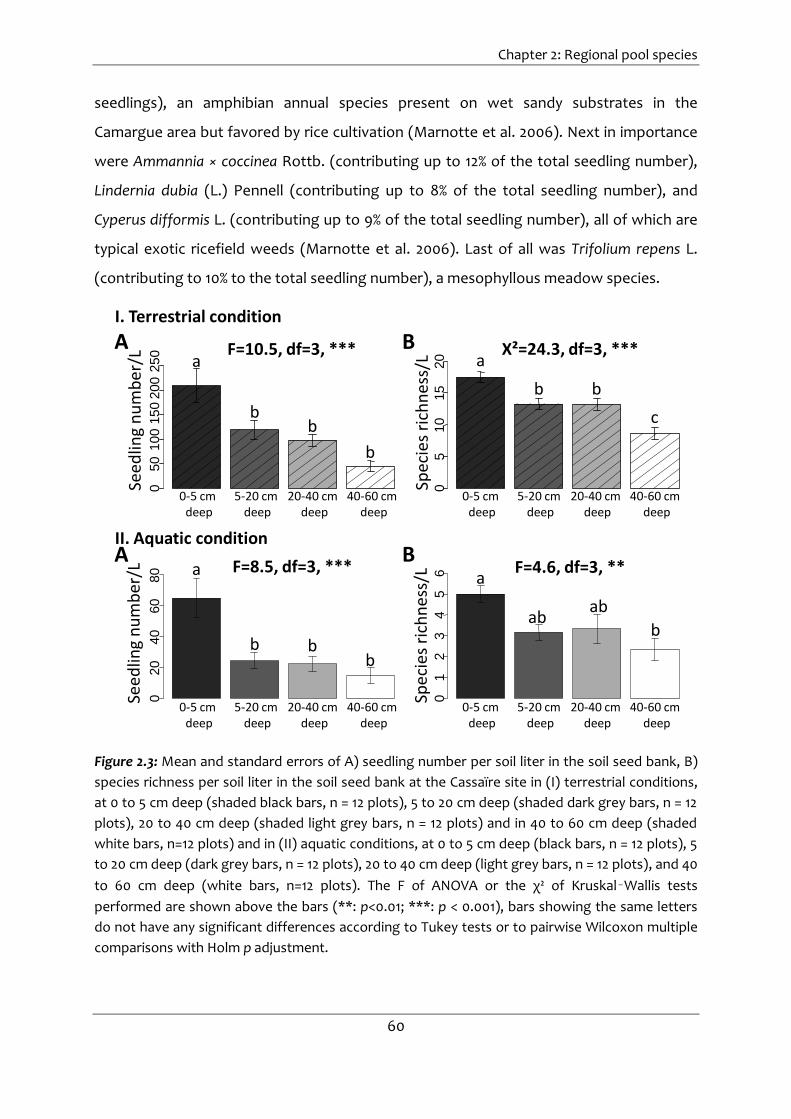
Chapter 2: Regional pool species
60
seedlings), an amphibian annual species present on wet sandy substrates in the
Camargue area but favored by rice cultivation (Marnotte et al. 2006). Next in importance
were Ammannia × coccinea Rottb. (contributing up to 12% of the total seedling number),
Lindernia dubia (L.) Pennell (contributing up to 8% of the total seedling number), and
Cyperus difformis L. (contributing up to 9% of the total seedling number), all of which are
typical exotic ricefield weeds (Marnotte et al. 2006). Last of all was Trifolium repens L.
(contributing to 10% to the total seedling number), a mesophyllous meadow species.
050
100
150
200
250
05
10
15
20
020
40
60
80
01
23
45
6
Seed
ling
nu
mb
er/L
Spec
ies
rich
nes
s/L
A B
5-20 cmdeep
20-40 cm deep
40-60 cm deep
0-5 cmdeep
5-20 cmdeep
20-40 cm deep
40-60 cm deep
0-5 cmdeep
5-20 cmdeep
20-40 cm deep
40-60 cm deep
0-5 cmdeep
5-20 cmdeep
20-40 cm deep
40-60 cm deep
0-5 cmdeep
Seed
ling
nu
mb
er/L
Spec
ies
rich
nes
s/L
A B
F=10.5, df=3, ***
I. Terrestrial condition
II. Aquatic condition
a
bb
b
F=8.5, df=3, *** F=4.6, df=3, **
X²=24.3, df=3, ***
a
b bb
a
b b
c
a
abab
b
Figure 2.3: Mean and standard errors of A) seedling number per soil liter in the soil seed bank, B)
species richness per soil liter in the soil seed bank at the Cassaïre site in (I) terrestrial conditions,
at 0 to 5 cm deep (shaded black bars, n = 12 plots), 5 to 20 cm deep (shaded dark grey bars, n = 12
plots), 20 to 40 cm deep (shaded light grey bars, n = 12 plots) and in 40 to 60 cm deep (shaded
white bars, n=12 plots) and in (II) aquatic conditions, at 0 to 5 cm deep (black bars, n = 12 plots), 5
to 20 cm deep (dark grey bars, n = 12 plots), 20 to 40 cm deep (light grey bars, n = 12 plots), and 40
to 60 cm deep (white bars, n=12 plots). The F of ANOVA or the χ² of Kruskal–Wallis tests
performed are shown above the bars (**: p<0.01; ***: p < 0.001), bars showing the same letters
do not have any significant differences according to Tukey tests or to pairwise Wilcoxon multiple
comparisons with Holm p adjustment.

Chapter 2: Regional pool species
61
In aquatic conditions, the most dominant species across depths were Juncus
articulatus var. articulates (contributing up to 29 % of the total seedling number),
Schoenoplectus supinus (L.) Palla (contributing up to 28 % of the total seedling number);
these are two other exotics typical ricefield weeds (Marnotte et al. 2006), Lindernia dubia
(L.) Pennell (contributing up to 12% of the total seedling number), Cyperus difformis L.
(contributing up to 10% of the total seedling number), and Chara vulgaris L. (contributing
up to 7% of the total seedling number), a banal algae enhanced by rice water
management (Mouronval and Baudouin 2010).
2.3.3. Seed rain
Forty-four species among the 3259 seeds collected were identified in the seed rain
(by windsock, sticky, and filter traps). We recorded 10.3±3.7 species per sticky trap on
average (in total, 31 species were recorded by sticky trap), 10.0±1.2 species per windsock
trap (in total 23 species were recorded by windsock) and only 0.86±0.2 species per filter
trap. Only five species were recorded in total in the filter traps (Carex sp., Chara vulgaris L.,
Heterenthera reniformis Ruiz & Pav., Lycopus europaeus L. and Schoenoplectus mucronatus
(L.) Palla).
Differences in composition were observed between the two terrestrial traps (Figure
2.4): the first axis of the CA (18.2%) discriminated the sticky traps capturing Polygonum
aviculare L., Polygonum bellardii All., Holcus lanatus L., and Lolium rigidum Gaudin from the
windsock traps capturing Picris pauciflora Willd, Cirsium arvense (L.) Scop., Lactuca serriola
L., and Arundo donax L..
No differences in seed density were identified (0.5±10.2 seeds/cm² for transect 1;
0.2±0.05 seeds/cm² for transect 2; 0.3±0.1 seeds/cm² for transect 3; F=0.5, df=2, p=0.6) and
species richness (10.3±2.6 species for transect 1; 11.8±1.3 species for transect 2; 9.0±1.7
species for transect 3; F=0.5, df=2, p=0.6) in sticky traps at the different depths.
The dominant species in the sticky traps were the same at each depth: Lolium rigidum
Gaudin (contributing up to 24% of the total seedling number), Polygonum aviculare L.
(contributing up to 16% of the total seedling number), Lactuca serriola L. (contributing up
to 11% of the total seedling number). In the windsock traps, the most dominant species
were also Lactuca serriola L. (9%) and Arundo donax L. (9%).

Chapter 2: Regional pool species
62
Lactuca serriola
Sticky
trap
Holcus lanatus
Lolium rigidum
Polygonum aviculare
Polygonum bellardii
Windsock
trap
Arundo donax
Cirsium arvense
Picris pauciflora
Axis 2 = 15.6%
Axis 1 = 18.2%
Figure 2.4: Ordination plot of the Correspondence Analysis based on seed density per cm² of
species (20 plots × 39 species) in windsock traps (black, 8 plots) and sticky traps (grey, 12 plots). In
the interest of clarity, only the 7 species with the higher contributions to axis are shown.
2.3.4. Relationships between soil seed bank and seed rain (sticky traps + windsock traps)
in terrestrial conditions
Of the 29 species (Table 2.1) recorded in the extant vegetation, 12 were recorded in
both the soil seed bank in terrestrial condition and in the terrestrial seed rain (sticky traps
+ windsock traps), 11 were recorded only in the seed rain, 3 were recorded only in the soil
seed bank, and 2 species were recorded only in the extant vegetation, and were absent
from the seed bank and the seed rain (Lolium perenne L. and Lactuca saligna L.).
Of the 41 species recorded in the terrestrial soil seed bank, 21 were exclusively found
in the seed bank and corresponded mainly to hygrophyte or amphibian species (e.g.
Juncus articulatus var. articulates, Cyperus difformis L., Ammannia × coccinea Rottb.,
Lindernia dubia (L.) Pennell, Typha laxmannii Lepech) and required particular conditions to
germinate. Of the 38 species recorded in the terrestrial seed rain, 10 were found only in
the seed rain and corresponded to long distance dispersal species recorded only in the
windsock collecting seed with anemochorous dispersal mechanism (e.g. Arundo donax L.

Chapter 2: Regional pool species
63
and Picris pauciflora Willd.), or to grassland target species (Brachypodium distachyon (L.)
P.Beauv. and Bromus rubens L.).
The first axis of the CA (17.2%, Figure 2.5) discriminated the composition of the seed
bank from that of the seed rain, with an intermediate position for the extant vegetation.
In the surface, the vegetation composition showed a higher correlation with the
composition of seed bank than with that of seed rain (Table 2.2). The Spearman
correlation coefficient was 0.379 (with p<0.01) between the extant vegetation and the
seed bank at the surface (transect 1) indicating that species with a higher frequency in the
seed bank were likely to be found in the extant vegetation.
Axis 2 = 7.4%
Axis 1 = 17.2%
Seed
bank
Seed
rain
Extant
vegetation
Ammannia χ coccinea
Arundo donax
Avena barbata
Bromus hordeaceus
Bromus madritensis
Bromus rubens
Carex divisa
Cyperus difformis
Cyperus fuscus
Holcus lanatus
Hordeum marinum
Hordeum murinum
Juncus bufonius
Lactuca serriola
Lindernia dubiaLolium rigidum
Picris echoïdes
Picris hieracioïdes
Samolus valerandi
Schoenoplectus supinus
Sonchus arvense
Sonchus asper
Trifolium repens
Brachypodium distachyon
Bromus sterilis
Cirsium arvense
Plantago lancealata
Poa trivialis
Sonchus oleraceus
Figure 2.5: Ordination plot of the Correspondence Analysis based on species presence/absence
(60 plots × 64 species) on extant vegetation (black, 12 plots), soil seed bank (dark grey, 36 plots),
and seed rain (sticky traps + windsock traps, light grey, 12 plots). In the interest of clarity, only the
29 species with the higher contributions to axes are shown.
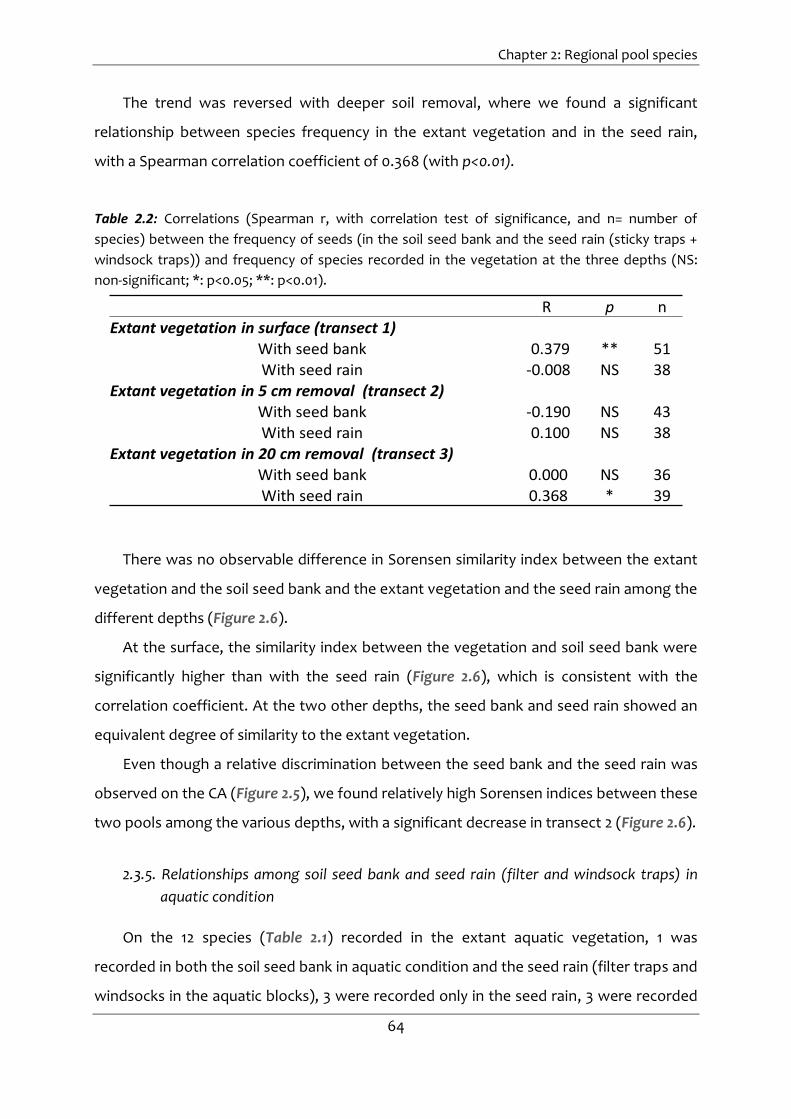
Chapter 2: Regional pool species
64
The trend was reversed with deeper soil removal, where we found a significant
relationship between species frequency in the extant vegetation and in the seed rain,
with a Spearman correlation coefficient of 0.368 (with p<0.01).
Table 2.2: Correlations (Spearman r, with correlation test of significance, and n= number of
species) between the frequency of seeds (in the soil seed bank and the seed rain (sticky traps +
windsock traps)) and frequency of species recorded in the vegetation at the three depths (NS:
non-significant; *: p<0.05; **: p<0.01).
R p nExtant vegetation in surface (transect 1)
With seed bank 0.379 ** 51
With seed rain -0.008 NS 38
Extant vegetation in 5 cm removal (transect 2) With seed bank -0.190 NS 43With seed rain 0.100 NS 38
Extant vegetation in 20 cm removal (transect 3)
With seed bank 0.000 NS 36
With seed rain 0.368 * 39
There was no observable difference in Sorensen similarity index between the extant
vegetation and the soil seed bank and the extant vegetation and the seed rain among the
different depths (Figure 2.6).
At the surface, the similarity index between the vegetation and soil seed bank were
significantly higher than with the seed rain (Figure 2.6), which is consistent with the
correlation coefficient. At the two other depths, the seed bank and seed rain showed an
equivalent degree of similarity to the extant vegetation.
Even though a relative discrimination between the seed bank and the seed rain was
observed on the CA (Figure 2.5), we found relatively high Sorensen indices between these
two pools among the various depths, with a significant decrease in transect 2 (Figure 2.6).
2.3.5. Relationships among soil seed bank and seed rain (filter and windsock traps) in
aquatic condition
On the 12 species (Table 2.1) recorded in the extant aquatic vegetation, 1 was
recorded in both the soil seed bank in aquatic condition and the seed rain (filter traps and
windsocks in the aquatic blocks), 3 were recorded only in the seed rain, 3 were recorded

Chapter 2: Regional pool species
65
only in the soil seed bank, and 5 species were only recorded in the extant vegetation, 2
out the 5 were absent from the seed bank and the seed rain of the aquatic blocks (parcel
4) but present in the other parcels and 3 species totally absent from the two other pools
of the site (Cladophora vagabunda (L.) Hoek, Phragmites australis (Cav.) Steud. and
Populus alba L.).
0.0
0.2
0.4
0.6
0.8
1.0 Χ²=18.2, df=5, ** F=5.6, df=2, **
* NS NS a abb
Seed bank
vs.
Vegetation
Surface,
transect 1
Seed rain
vs.
Vegetation
Seed bank
vs.
Vegetation
5 cm removal,
transect 2
Seed rain
vs.
Vegetation
Seed bank
vs.
Vegetation
20 cm removal,
transect 3
Seed rain
vs.
Vegetation transect
3
transect
1
transect
2
Seed rain vs. Seed bank
Sore
nse
n s
imila
tiry
ind
ex
Figure 2.6: Mean and standard errors of Sorensen similarity index based on species
presence/absence between extant vegetation and soil seed bank (dark grey, 36 plots), between
extant vegetation and seed rain (sticky traps + windsock traps, light gray, 12 plots) and between
soil seed bank and seed rain (white, 36 plots) at the three different depths. The F of ANOVA or the
χ² of Kruskal–Wallis tests performed are shown above the bars (NS: non-significant; *: p<0.05; **:
p<0.01), bars showing the same letters do not have any significant differences according to Tukey
tests.
Of the 7 species recorded in the soil seed bank in aquatic condition for the aquatic
block (parcel 4), 3 were exclusive to this pool, corresponding mainly to hydrophyte or
amphibian species (Chara braunii C.C. Gmelin, Cyperus difformis L. and Schoenoplectus
supinus (L.) Palla) requiring particular conditions to germinate. Out of the 14 species
recorded in the aquatic seed rain (filter traps + windsock traps), 10 were found only in
seed rain and corresponded either to terrestrial species recorded in the windsocks (e.g.

Chapter 2: Regional pool species
66
Lolium rigidum Gaudin), or to species from the filter traps requiring particular hydrological
conditions (e.g. Lycopus europaeus L.).
The second axis of the CA (24.9%, Figure 2.7) showed the intermediate position of the
extant vegetation between the seed bank and the seed rain. The species frequency in the
vegetation was significantly influenced by the species frequency in both the seed bank
and the seed rain. The Pearson correlation coefficient was 0.66 (with p<0.001) between
the vegetation and the seed bank and the Spearman correlation coefficient was 0.75
(with p<0.001) between the vegetation and the seed rain.
Bolboschoenus maritimus
Carex sp
Chara vulgaris
Cirsium arvense
Heteranthera reniformis
Holcus lanatus
Juncus articulatus
Lindernia dubia
Lactuca seriolaLamiaceae sp
Lolium rigidum
Lycopus europaeus
Picris echioïdes
Plantago lanceolata
Poa trivialis
Sonchus oleraceus
Phragmites australisRumex crispus
Seed
rain
Seed
bank
Extant
vegetation
Axis 2 = 24.9%
Axis 1 = 25.9%
Figure 2.7: Ordination plot of the Correspondence Analysis based on species presence/absence in
at least 2 samples (26 plots × 18 species) on extant vegetation (black, 4 plots), soil seed bank
(dark grey, 3 plots) and seed rain (filter traps + windsock traps, light grey, 19 plots).
The Sorensen similarity indices confirmed that a strong link exists among the
vegetation and the two pools. The index between the seed bank and the extant
vegetation was significantly lower than it was between the other pair (Figure 2.8).

Chapter 2: Regional pool species
67
0.0
0.2
0.4
0.6
0.8
1.0
W=18.0 ***
Seed bank
vs.
Vegetation
Seed rain
vs.
Vegetation
Seed rain
vs.
Seed bank
Sore
nse
n s
imila
tiry
ind
ex
Figure 2.8: Mean and standard errors of Sorensen similarity indices, based on species
presence/absence, between extant vegetation and soil seed bank (dark grey, 12 plots), between
extant vegetation and seed rain (light gray, 76 plots), and between soil seed bank and seed rain
(white, 57 plots). The W of Wilcoxon test performed are shown above the bars (***: p<0.001).
2.4. Discussion
2.4.1. Soil seed bank and seed rain
The soil seed bank mainly consisted of exotic ricefield weeds (e.g. Ammannia ×
coccinea Rottb., Heterenthera reniformis Ruiz & Pav., Lindernia dubia (L.) Pennell.), banal
ricefield weeds (e.g. Chara vulgaris L., Pulicaria dysenterica (L.) Bernh., Schoenoplectus
supinus (L.) Palla), ruderal and nitrophilous species (Polygonum aviculare L., Rumex crispus
L., Sonchus oleraceus L.), or meadow species (Lysimachia arvensis (L.) U.Manns & Anderb.,
Plantago major L., Poa trivialis L., Trifolium repens L.), all of which are holdovers from the
arable disturbance (deep ploughing regimes, irrigation, and fertilization). These species
are known to persist in seed banks in the long term (> 5 years) (Thompson et al. 1997) and
may accumulate to high densities in the seed bank (Grime 1979). Topsoil removal of at

Chapter 2: Regional pool species
68
least 5 cm appeared to significantly reduce the densities of these seeds. However, no
differences were observed between the two deeper (20 cm and 40 cm removal) soil
layers. This vertical homogenization of the seed bank densities can be explained by rice
cultivation practices, which include a 20 cm deep ploughing. The five target grassland
species found in the soil seed bank corresponded to only 1.5 % of the total seedling
number. Most soil seed bank studies on degraded sites agree that few species dominate
and that typical target species are generally poorly represented (Bakker et al. 1996;
Hutchings and Booth 1996; Prach et al. 2001b; Khater et al. 2003; Pywell et al. 2003;
Römermann et al. 2005; Buisson et al. 2006b; Török et al. 2011). In our case, we find that
seeds of Mediterranean oligotrophic grassland or Mediterranean temporary wetland
show an insignificant role in the spontaneous succession processes.
The same conclusion can be drawn for the seed rain; as we found in the terrestrial
seed traps, the seed rain is dominated by the same meadow and ruderal species. The five
target grassland species found in the seed rain correspond to only 0.8 % of the total seed
number. The absence of a difference in seed density and species richness in seed rain
sticky traps among the various topsoil removal depths indicates a constant local seed
production by the extant vegetation. The discrimination observed between the
windsocks and the sticky traps can be explained by the dispersal modes of species.
Indeed, species found exclusively in the windsock traps (8 species) corresponded mainly
to anemochorous species (e.g. Picris pauciflora Willd, Cirsium arvense (L.) Scop., and
Arundo donax L.),while species found only in the sticky traps (17 species) were
barochorous (e.g. Lolium rigidum Gaudin, and Polygonum aviculare L.) and zoochorous
(e.g., Polygonum bellardii All. and Holcus lanatus L) (Stevens 1932). No seeds of the target
species can be expected to disperse by hydrochory: the water from the irrigation canal
was found to contain only very low numbers of unwanted species, which implies that
grassland species and wetland species probably disperse weakly and that the landscape is
not favorable to long dispersal mechanisms.
This quasi-absence of target species on site and in the regional species pool can
compromise the trajectory of community recovery and of restoration goals by slowing
down succession and preventing the establishment of target species (Prach et al. 2001a;
Suding et al. 2004). Indeed, four of the target species (out of 28 species in total i.e. 14% of

Chapter 2: Regional pool species
69
the total species richness) were recorded on the extant vegetation contributing only 7%
of the total abundance. A low density of target species in the seed bank and seed rain can
explain the weak contribution to extant vegetation, but unfavorable abiotic conditions
could also be playing a role. Topsoil removal only improves abiotic conditions in terms of
nutrient availability.
2.4.2. Spontaneous vegetation development
Almost all species recorded in the extant vegetation (in terrestrial or aquatic blocks)
emerged from either the seed bank, the seed rain, or both. There were only five species
absent from the seed bank and seed rain: Lolium perenne L. and Phragmites australis
(Cav.) Steud., which are perennial species, Lactuca saligna L., a biennial species,
Cladophora vagabunda (L.) Hoek, a green filamentous algae whose dispersal is mediated
by less than 100 µm-diameter spores (not captured with our methodology), and Populus
alba L., an anemochorous species. This absence of species in seed rain and seed bank can
therefore be explained by plant strategy (the probability of seed detection is smaller for
perennial or biennial species) and by methodological bias in trapping seeds.
Information concerning species absent from the extant vegetation and present in
seed rain is crucial to seed availability and plant succession. Moreover, one of the effects
of topsoil removal is to create bare unsaturated soil allowing a better recruitment of
seeds (Greene and Johnson 1989). Also, long-distance dispersal mechanisms, despite the
fact that they are rare events, may sometimes play an important role in plant community
assembly (Soons et al. 2004; Soons and Ozinga 2005). In our study, no target species with
long dispersal mechanisms were identified. The 13 species absent from the extant
vegetation and present in the seed rain are either anemochorous species, which
propagate via long dispersal mechanisms and do not meet the required conditions to
grow, or hydrochorous species, which require spring inundation to germinate (e.g.
Heterenthera reniformis Ruiz & Pav.). Our vegetation monitoring did not cover the global
extant vegetation. Concerning the 22 species absent from the extant vegetation but
present in soil seed bank, germination requirements and conditions for their growth were
not being met (e.g. hydrophyte species).
Chapter 2: Regional pool species
70
We observed a high Sorensen similarity index between the extant vegetation and the
seed bank and the extant vegetation and the seed rain. In the terrestrial blocks, the
similarity index between the extant vegetation and the seed bank was significantly higher
than it was between the extant vegetation and the seed rain (at least on the surface). The
exact opposite was true of the aquatic blocks. The extant vegetation was influenced both
by the seed bank than by the seed rain, but it was also a contributor to the seed bank and
seed rain through short-distance dispersal mechanisms, and this led to a high similarity
index between the seed bank and seed rain in both aquatic and terrestrial conditions.
However, while the aquatic blocks exhibited high correlation coefficients between the
extant vegetation and both seed rain and seed bank, the terrestrial blocks showed
significantly more correlation between the extant vegetation and the seed bank in the
surface and in the deeper-layer between the extant vegetation and seed rain. Our
hypotheses that the seed rain influences the vegetation more strongly when soil is
removed from deeper depths, and that the seed bank contributes more to recruitment in
the upper layers, were supported. Topsoil removal appears to reverse the effect of seed
bank and seed rain on vegetation. By successfully removing half of the seed bank and
offering unsaturated sites, soil removal allows seed rain to play a more important role in
vegetation. Topsoil removal offers a greater opportunity for long-distance dispersal
events and plant community changes.
2.4.3. Mediterranean oligotrophic grassland vs. temporary wetland ecosystem
restoration
In wetland ecosystems, abiotic filters are easier to control by water management
than they are in terrestrial grasslands. From this it follows that the abiotic conditions in
aquatic ecosystems are easier to restore, and that they lend themselves to better
predictions of the community and to more complete plant restorations. As Zedler (2000)
correctly stated, “it takes more than water to restore a wetland;” nevertheless, the
hydrological filter has an important selective effect and only aquatic species can survive in
such an environment. This does not mean that with wetland ecosystems, spontaneous
succession process will always be successful. Rather, it indicates that it would potentially
be easier to restore Mediterranean temporary wetland than Mediterranean oligotrophic
Chapter 2: Regional pool species
71
grassland in the wake of the same type of agricultural disturbance. Indeed, restoring
oligotrophic grassland communities on degraded sites having a nutrient-enriched soil and
a seed bank dominated by ruderal species makes the establishment of nutrient-poor, low-
competitive, and stress-tolerant species more complicated. Even though topsoil removal
does decrease soil nutrients (Chapter 3 and Chapter 4) and seed density in the soil seed
bank, it does not result in the restoration of the abiotic conditions of oligotrophic
grassland, and the community is more subject to negative biotic interactions because
grassland target species have to compete with dominant ruderal and common meadow
species coming from the site’s agricultural past (Kiehl et al. 2006).
Prach and Hobbs (2008) confirm this by advocating the use of spontaneous
succession only when environmental site conditions are not very extreme and easy to
restore. They attest that the probability of attaining a target stage by spontaneous
succession decreases toward both ends of the productivity–stress gradient, whereas
technical measures increase it.
2.4.4. Perspective of vegetation restoration
Dispersal is crucial for metapopulation dynamics, re-colonization of sites, and
establishment of new populations. The environmental conditions of a site represent an
important variable determining the rate and direction of vegetation colonization, but at
the same time, suitable abiotic conditions do not necessarily guarantee the successful
restoration of an ecosystem. Dispersal may be the limiting factor for plant colonization
and re-establishment. Thus, the landscape matrix (Prach and Pysek 2001) and connectivity
(Bedford 1996; Bornette et al. 1998) can strongly influence the type of succession.
Řehounková and Prach (2007) showed that landscape factors can explain more
vegetation variability than do local site factors. A fragmented landscape creates dispersal
limitations by increasing the distance between populations, until it becomes greater than
the dispersal ability of the species, with the end result that the long-term survival of the
species is threatened unless dispersal ability can be re-established (Trakhtenbrot et al.
2005). The preference for spontaneous succession is generally more manifest when the
site to be restored is surrounded by the undisturbed target ecosystem (Prach and Pysek
2001; Suding et al. 2004; Prach and Hobbs 2008). A more isolated site has less of a chance

Chapter 2: Regional pool species
72
to be colonized by target species and may be colonized by stronger recolonizers capable
of preventing the establishment of diverse native plant communities (Prach et al. 2001b).
In this study, not all types of dispersion were recorded. Indeed, the importance of
seed dispersal by large animals, something we have not considered, has been described
elsewhere (Fischer et al. 1996). Livestock can act as excellent vector for dispersing the
seeds of grassland species, and a fraction of Mediterranean oligotrophic species are
known to be epizoochorous (Stevens 1932). The same conclusion can be drawn for
Mediterranean temporary wetland species, in which zoochorous dispersal by waterbirds
plays a major role in colonization (Figuerola and Green 2002a; Brochet et al. 2010a). All of
these facts suggest that our seed rain study may have underestimated the number and
effect of real plant dispersal mechanisms. Moreover, a variety of different traps was used
in estimating seed rain. However, because the sampling pressure was different between
the windsocks and the sticky traps, the species richness estimates provided by the sticky
traps were biased as a result of the sticky traps’ larger sampling area. The bias was
evident even when we attempted to consider areal density (seeds per cm²). In addition to
the differing sampling pressures, the soil seed bank was recorded using the seedling
emergence method, which only counts viable seeds, while seed rain was estimated by the
total number of seeds with no consideration of viability. But, the question of seed viability
is much more important for the soil seed bank, in which a variety of seed ages are mixed,
than in seed rain, which is essentially a sample of only recent production in which seeds
are in better condition overall.
In the end, the extant vegetation, seed rain, and soil seed bank results suggest clearly
that our ability to restore the grassland or wetland plant community on abandoned fields
using a passive restoration approach is largely ineffective. The regional pool species is not
a potential source of recruits from the target species, so active restoration is advisable for
wetland (Chapter 3.1) and grassland ecosystems (chapter 4). Indeed, seed addition using
hay transfer (e.g. Hölzel and Otte 2003; Klimkowska et al. 2010b) or soil transfer (Valk et
al. 1992; Brown and Bedford 1997) have been shown to be effective measures for
overcoming this apparent limitation of grassland or wetland ecosystems. Our result
suggests that seed rain is more important for the plant community at the deeper depths,

Chapter 2: Regional pool species
73
indicating that transfer, simulating seed rain, combined with topsoil removal, can be
useful for changing a plant community.
Community assembly may be a function not only of dispersal processes, but also of
local interactions among species post-recruitment. Indeed, early community
development is strongly influenced by seed availability, and in the later stages of
vegetation development, the role of internal community processes increases (Lepš 1999;
Hobbs and Norton 2004; Standish et al. 2008; Baer et al. 2009). Performing active
restoration in the early stages of vegetation development may produce better results,
because communities are less influenced by biotic interactions, and species are more able
to establish in unsaturated sites as the present study suggests.

Transition to Chapter 3
74
Transition to Chapter 3
In Chapter 2, we show that even after the restoration of abiotic conditions,
spontaneous succession is unlikely to lead to Mediterranean meso-xeric grassland and
temporary wetland ecosystems. Species introduction is therefore needed to try to
recover ecosystems (Hölzel et al. 2012). If we manipulate the abiotic and the dispersal
filter, can we restore the plant community? Are responses to species introduction
different between the aquatic and the terrestrial ecosystem? Does a positive response to
plant community also reveal positive responses in another compartment? These
questions are tackled in chapter 3 and Chapter 4, involving the same small-scale
experiment than in the chapter 2, where restoration techniques were used, and were
different components were monitored.
Ecosystèmes de référence
Ecosystème dégradé
Le transfert de foin permet-il de restaurer les
communautés terrestres?
Chapitre 4
Le transfert de sol permet-il de restaurer les
communautés d’invertébrés?
Chapitre 3.2
La restauration des conditions abiotiques est-elle
suffisante?
Chapitre 2
Quel est l’écosystème de référence?
Chapitre 1
Le transfert de sol permet-il de restaurer les
communautés aquatiques?
Chapitre 3.1
Figure T3.1: Location the Chapter 3.1 and Chapter 3.2 in the general thesis organization

Transition to Chapter 3
75

Transition to Chapter 3
76
Soil collecting in a temporary wetland during the summer.
Aquatic invertebrates sampling in an experimental block.
Aquatic vegetation monitoring after soil transfer in an experimental block
(Ranunculus peltatus).

Chapter 3: Creation of Mediterranean temporary wetland
77
Chapter 3 – Creation of Mediterranean
temporary wetland using soil transfer

Chapter 3.1: Aquatic plant of Mediterranean temporary wetland
78

Chapter 3.1: Aquatic plant of Mediterranean temporary wetland
79
Section 3.1: Temporary wetland restoration after rice
cultivation: is soil transfer required for aquatic plant
colonization?
Isabelle Muller, Elise Buisson, Jean-Baptiste Mouronval, François Mesléard
Accepted in Knowledge and Management of Aquatic Ecosystems on July, 23th 2013
Chapter 3.1: Aquatic plant of Mediterranean temporary wetland
80
3.1.1. Introduction
The remaining global extent of wetlands is estimated to be over 1.2 million square
kilometers. During the twentieth century, in North America, Europe, and Australia more
than 50% of certain types of wetlands were destroyed (Millennium Ecosystem
Assessment 2005). Due to this wetland loss, many countries have implemented specific
regulations to protect wetlands (e.g. the US “clean water act” of 1972 (McMahon Jr 1972)
or the European Water Framework Directive of 2000 (European Commission 2000)).
These regulations include restoration and conservation of water integrity by limiting
pollution and maintaining the overall integrity of wetlands. Indeed, wetlands provide
multiple ecosystem services, such as water purification and waste water treatment,
regulation of hydrological flow, climate and erosion, primary production, and biodiversity
conservation (Zedler and Kercher 2005; Millennium Ecosystem Assessment 2005).
Therefore, in recent decades, wetland restoration (Society for Ecological Restoration
2004) has received increased attention (Zhang et al. 2010).
In the Mediterranean Basin, wetlands have been greatly impacted because they are
particularly productive systems which were converted for agriculture and tourism (Hollis
1992). The remaining wetlands are of important ecological, social and economic values
(Grillas et al. 2004). Natural temporary wetlands of the region are characterized by winter
and spring flooding, with durations that greatly vary from year to year, and by a complete
drying-out in summer (Grillas et al. 2004). They represent one of the most remarkable
Mediterranean habitats, comprising a high plant diversity of particularly annuals species
(some of which are rare and endangered) adapted to the specific climate (i.e. necessity to
be annual species to support the dry summer with short favorable periods for
reproduction), such as Zannichellia obtusifolia Talavera & al, Callitriche lenisulca Clavaud or
Tolypella hispanica T.F. Allen (Grillas and Duncan 1986; Grillas et al. 2004). During the 20th
century, temporary wetlands were subject to degradation and drastic area reduction in
the Mediterranean region due to agriculture, industry, recreational activities, and hunting
(Hollis 1992; Grillas et al. 2004). One of the main causes of the degradation of
Mediterranean temporary wetlands is the water management for hunting activities that
maintains the water level in spring and/or in summer and that has led to a decline of plant
communities that are restricted to temporary wetlands along with an increase in

Chapter 3.1: Aquatic plant of Mediterranean temporary wetland
81
perennial and cosmopolitan species (Tamisier and Grillas 1994; Aznar et al. 2003).
Mediterranean temporary wetlands are thus considered a priority habitat (code 3170)
according to the Natura 2000 Network of the European Union Habitats directive
(European Commission 1992). Wetland restoration (Society for Ecological Restoration
2004) is urgently needed to stop the loss of this habitat type. In order to restore a
wetland, two strategies can be adopted to establish plant communities: i) one based on
spontaneous succession with recruitment from residual seed bank or from seed dispersal,
or ii) active restoration which requires propagule introduction.
Spontaneous colonization may provide satisfying results in terms of plant
composition and may also promote wetland “self-design” capacity as a response to
hydrological conditions (Mitsch et al. 1998; Prach et al. 2001a). If the appropriate
environmental conditions, mainly consisting of flooding regimes, water depth, and
salinity, are restored (Grillas 1990), vegetation can rapidly establish from the residual seed
bank (Leck 2003; De Steven et al. 2006). Short distance dispersal (Reinartz and Warne
1993), long distance endozoochorous (Zedler and Black 1992; Figuerola et al. 2002;
Brochet et al. 2010b), and ectozoochorous (Figuerola and Green 2002b) dispersal may
also contribute to spontaneous colonization. Active revegetation methods may not be
needed if sources populations of desired seeds are available nearby and if physical
barriers do not hamper dispersal (Moreno-Mateos and Comin 2010).
Vegetation recovery is often limited by a low density and a high distance of seed
sources (Bischoff 2002). Several studies have demonstrated dispersal limitation despite
the proximity of natural temporary wetlands (Galatowitsch and Valk 1996; Collinge and
Ray 2009). Moreover, the site to be restored may be isolated from the network of
wetlands (Reinartz and Warne 1993; McKinstry and Anderson 2005) or may have been
submitted to a long cultivation period (Prach et al. 2001b), which often limits re-
colonization. In such cases, active restoration, including reestablishment of dispersal
vectors, is needed to restore plant communities (Bischoff 2002). Community
translocation involves the removal of the full species assemblage of a site and the
establishment of a functioning community at a new receptor site (Bullock 1998). Transfer
of bulk soil is such a community translocation method. It is often used in wetland
restoration and has already shown promising results: the imported soils contribute

Chapter 3.1: Aquatic plant of Mediterranean temporary wetland
82
considerably to species richness and native wetland species establishment, indicating
that soil transfer may enhance the success of wetland restoration projects compared to
natural colonization (Reinartz and Warne 1993; Balcombe et al. 2005a; Nishihiro et al.
2006). Moreover, this technique could be the most efficient method for transferring a
large number of temporary wetland plant species that have a short life cycle but can
produce large quantities of seeds and rapidly form a large seed bank (Mouronval and
Baudouin 2010).
In the present study we investigate the benefits of soil transfer when compared to
spontaneous succession in temporary wetland restoration of former ricefields. Before
testing spontaneous colonization vs. active revegetation, physical manipulations need to
be included, e.g. hydrological and topography restoration, in particular if environmental
conditions are not appropriate. This is often the case if the wetland has been destroyed
for cultivation, resulting in strong modifications of the former topography and of the
inundation periods. Only after restoration of abiotic conditions, the potential of
spontaneous colonization can be evaluated. We thus used experimental on-site wetland
blocks to address the following questions: (1) is spontaneous succession sufficient to
restore typical Mediterranean wetlands on former ricefields? (i.e. what can we expect
from the seed bank of former ricefields considered as wetland?); (2) does soil transfer
accelerate the colonization of target species and does it increase species richness and the
abundance of wetland plants?; (3) is soil transfer required if the site to be restored is
close to natural wetlands?
3.1.2. Materials and methods
3.1.2.1. Study site
The experiments were conducted at the Cassaïre site (c. 43°31’ N, 4°44’ E, 3 meter
maximum elevation) located east of the Camargue area (Rhône delta, Southern France,
Figure 3.1.1.A) with an average substrate salinity of 0.22 g/L. The climate is typically
Mediterranean, characterized by an annual average temperature of 15°C, an annual
rainfall of 550 mm mainly concentrated in autumn, and a summer drought. The site has
been submitted to recurrent leveling for rice cultivation since the 1940s, eliminating the

Chapter 3.1: Aquatic plant of Mediterranean temporary wetland
83
natural topography. Cultivation definitively stopped in 2004. On the old Cassini map
dating from the eighteenth century, the site was marked as a wetland, and the final aim
of the restoration project is to create 35 hectares of Mediterranean temporary wetlands
with native aquatic flora including the rare and endangered species found nearby in the
Camargue area. The objective of the present study was to identify methods that may also
used in large scale restoration projects. The experiments were set up in 2011.
A
Can
al fo
r ir
riga
tio
n
C
B
40 cm
5 m 10 m
On each donor site
we monitored eight 1 m² plots = 8 m²
2 m
ST
C
C
C
C
ST
ST
ST
On each block
we monitored 8 m²
Soil transfer from donor sites to each ST block
10 L from each donor site = 50 L
Figure 3.1.1: Location of the Cassaïre site (in black) and of the five donor sites (grey circle). The
light grey shading indicates the wetlands of the Camargue area (A). Side view of one soil transfer
block (B). Experimental design of restoration treatments at Cassaïre site (C). C = control blocks
and ST = soil transfer blocks (black rectangle indicates the soil transfer).
3.1.2.2. Donor sites
In order to maximize the number of locally adapted aquatic plant species at the
Cassaïre site, we selected five temporary wetlands as donor sites in the surroundings
(between 1 and 6 km, Figure 3.1.1.A) resulting in an inventory of plant communities and
abiotic conditions of all the temporary wetlands of the Camargue area. The
environmental conditions of these five donor wetlands corresponded to the range of

Chapter 3.1: Aquatic plant of Mediterranean temporary wetland
84
expected environmental conditions at the Cassaïre site after the creation of the
temporary wetland: i.e. having a flooding period from September to June only, a
maximum water depth of 40 cm, and a salinity below 6 g/L. Not all the target hydrophyte
species were found in a single donor wetland but the five donor sites together represent
the regional target hydrophyte species pool quite well. We attempted to select the most
appropriate species to the different abiotic filters in the Cassaïre site driven by the
environmental conditions of our recreated wetland. Indeed, plant communities of
temporary Mediterranean wetlands vary with salinity, hydroperiod, depth, so we
maximized the pool of species, allowing the most suitable species to grow in the
environmental conditions of the Cassaïre site.
In March and May of 2011 (representing vernal and late season vegetation; (Grillas et
al. 2004), we analyzed the vegetation in each of the five donor sites. In each site, we
placed eight 1 m2 plots covering the full humidity gradient. In each plot, we recorded the
total percent cover of aquatic vegetation and the cover of each species using a modified
Braun-Blanquet scale (Braun-Blanquet et al. 1952): 0.5 for species covering less than 1%, 1
for species covering between 1% and 5% of the plot, 2 between 5% and 25%, 3 between 25%
and 50%, 4 between 50% and 75% and the coefficient 5 for species covering more than 75%
of the plot. In August 2011, during the dry period when all plants are dormant as seeds in
the seed bank, we collected per donor site 45 × 45 cm to a depth of 3 cm soil samples in
each plot (eight soil samples in total per donor site), resulting approximately in a total of
40 L of soil per donor site. Our assumption was that these collected soils would contain
the seeds of the species recorded in the plots a few months earlier. We pooled the 8
samples of each donor site to one bulk sample using a cement mixer and we stored them
under dry until the transfer to the Cassaïre site.
3.1.2.3. Block experiments and soil transfer
To simulate the suitable environmental conditions of a Mediterranean temporary
wetland, eight blocks with a gentle slope were dug out (15 m long × 5 m large × 40 cm
deep; Figure 3.1.1.B) along a canal that was used for irrigation. Four blocks were used to
test soil transfer. The four other blocks were used as control to monitor spontaneous
vegetation establishment. The position of treatments was randomized (Figure 3.1.1.C). We

Chapter 3.1: Aquatic plant of Mediterranean temporary wetland
85
pooled 10 L samples from each of the five sites and we spread this 50 L of soil on a 4 × 2 m
plot at the bottom of each transfer block (Figure 3.1.1.B). A pump maintained a constant
20 cm water level from the day after the transfer in January 2012 (inundation beginning
four months after classical temporary wetland conditions but allowing even so the vernal
species germination in March) to the end of May 2012. Mid-May to mid-June corresponds
roughly to the local dry out of temporary wetlands.
3.1.2.4. Vegetation monitoring
Our aim was to compare soil transfer with control plots in term of similarity to the
donor sites. Vegetation monitoring was carried out in May 2012 (four months after the
transfer), when most species show their biomass peak. For each of the block 4 m × 2 m
plot (8 m²; Figure 3.1.1.C), we estimated the total cover of aquatic vegetation (%) and the
cover of each species using the same method as for the donor sites of the previous year.
Area of the donor site vegetation analyses was adjusted to that of the block plots (8 m²)
by pooling the eight 1 m² plots of each donor site.
Among all plant species occurring in the experiment (Table 3.1.1), we assigned aquatic
species to one of the following categories:
1. Target hydrophyte species: Present at donor sites according to the classification of
temporary wetlands (Grillas and Duncan 1986), corresponding to the native or typical
flora of the temporary wetlands of the Camargue area, adapted to the Mediterranean
climate, with protection status and threatened by some types of water management,
such as fresh water production in the summer (Callitriche sp., Callitriche truncate Guss.,
Chara aspera C.L. Willdenow, Chara canescens A. Langangen, Chara globularis J.L. Thuiller,
Ranunculus peltatus Schrank, Ranunculus trichophyllus Chaix, Tolypella glomerata
(Desvaux) Leonhardi, Tolypella hispanica T.F. Allen, Zannichellia obtusifolia Talavera & al
and Zannichellia pedicellata Wahlenb. & Rosèn).
2. Ricefield hydrophyte weeds: Present with rice cultivation (Marnotte et al. 2006).
Ricefield weeds are often exotic species introduced by rice cultivation (Lindernia dubia
(L.) Pennel) but can also correspond to banal algae enhanced by rice water management
(Chara vulgaris L.), and therefore associated with eutrophic and flooded summer

Chapter 3.1: Aquatic plant of Mediterranean temporary wetland
86
wetlands. These widespread algae may occur in the reference ecosystems, but cannot be
considered as target hydrophyte species.
3. Green filamentous algae: Occurring in temporary wetlands at high temperatures
and high nutrient levels (Cladophora vagabunda (L.) Hoeck and Spirogyra sp.)
Table 3.1.1: Species occurring in blocks, in donor sites and target hydrophyte species.
Species recorded in blocksSpecies presentin donor sites
Aquatic targetspecies
Atriplex hastata ×Bolboschoenus maritimus ×
Callitriche sp. × ×Callitriche truncata × ×
Carex divisaChara aspera × ×
Chara canescens × ×Chara globularis × ×
Chara hispida ×Chara vulgaris ×
Cladophora vagabunda ×Crypsis aculeata ×Juncus maritimus ×Lindernia dubia
Phragmites australis ×Poa trivialis
Potamogeton pectinatus ×Ranunculus peltatus × ×
Ranunculus trichophyllus × ×Rumex crispus
Scirpus littoralis ×Sonchus oleraceus
Spirogyra sp.Tolypella glomerata × ×Tolypella hispanica × ×
Typha laxmaniiZannichellia obtusifolia × ×Zannichellia pedicellata × ×
All the target hydrophyte species and ricefield hydrophyte weeds are annual species,
produce large quantities of seeds that survive several years and are very resistant to
drought (Marnotte et al. 2006; Mouronval and Baudouin 2010). However, for some
Characeae (Chara globularis and Chara vulgaris) as well as the two ranunculus (Ranunculus

Chapter 3.1: Aquatic plant of Mediterranean temporary wetland
87
peltatus and Ranunculus trichophyllus), plants can be annual or perennial. The
Mediterranean climate with temporary wetlands selects the annual nature of these
species, perennials do not tolerate the summer dry season.
3.1.2.5. Soil nutrients
To compare soil conditions between the Cassaïre and the donor sites, the following
soil properties were measured by the soil analysis laboratory of the INRA (The French
National Institute for Agricultural Research, Aras, France): organic matter, total C, total N,
P2O5, pH and conductivity. Before setting up the block experiment, five soil samples,
composed of one liter of soil, were taken from the surface (0-10 cm) and from 40-60 cm
depth (corresponding to the digging depth of the block i.e. the new soil surface). In each
sample, three sub-samples were taken at random and subsequently pooled for analysis.
The same method was applied to the five donor sites (one sample from the surface (0-10
cm) comprising three sub-samples per donor site) to obtain a reference for the soil
nutrient status in the target communities. Samples were dried and sieved (to 200 µm).
3.1.2.6. Data analysis
We used different factorial and multivariate analyses to compare transfer and control
blocks with donor sites. Contrary to the position of soil transfer and control within the
block experiment, the position of donor sites and Cassaïre site is not randomized. We still
include donor sites and block treatments in the same models because we are convinced
that environmental conditions are very similar and that we can use donor sites to
characterize the target community of restoration.
In order to compare soil data between the donor sites and the Cassaïre site, and to
assess the habitat suitability of the Cassaïre site, we performed a Principal Component
Analysis on soil nutrient contents (15 samples × 6 variables).
To analyze differences between control and soil transfer, we used nonparametric
multivariate analysis of variance (nonparametric MANOVA) (Anderson 2001). We used
Bray-Curtis similarity index (Raup and Crick 1979) with 999 permutations based on species
coefficient cover to compare the species composition. We also performed a
Correspondence Analysis (CA) on the vegetation data of the donor sites, of the transfer

Chapter 3.1: Aquatic plant of Mediterranean temporary wetland
88
blocks, and of the control blocks (13 plots × 28 species). In order to characterize the
success of the soil transfer, we calculated the Bray-Curtis similarity index. For each plot
surveyed in a block, the mean Bray-Curtis index between this plot and the 5 plots
surveyed in donor sites (one per donor site corresponding to an average of the eight 1 m²
plots per donor site) was calculated. In order to assess donor site variability, we
compared the plot of each donor site to that of the other donor sites, obtaining also a
mean Bray-Curtis similarity index for donor sites.
We compared the means of the soil nutrient variables, the species richness, the total
cover of aquatic vegetation, the means of the Bray-Curtis index and the plant species
categories (i.e. target hydrophyte species, ricefield hydrophyte weeds and green
filamentous algae) between soil transfer, control and donor sites using a one-way analysis
of variance (ANOVA), followed by Tukey post-hoc tests (Sokal and Rohlf 1995) if the data
met the assumptions of ANOVA. If data did not comply with assumptions, we performed
Kruskal-Wallis and pairwise Wilcoxon tests with a p-value adjustment according to the
simple Bonferroni method, in which the p-values are multiplied by the number of
comparisons.
All tests were performed using R 2.12.0 (R Development Core Team 2010) with a
p=0.05 threshold using “ade4” package (Dray et al. 2007) and “vegan” package (Oksanen
et al. 2008).
3.1.3. Results
3.1.3.1. Soil nutrients
The soil found at a depth of 40-60 cm on the Cassaïre site became surface soil in the
redesigned wetland topography (future soil surface), and it differed from the existing
surface soil in Cassaïre and from that of the donor sites (Figure 3.1.2). P2O5 content was
significantly higher in the Cassaïre current surface soil, while pH was significantly higher in
Cassaïre deep soil layer. The other nutrients, organic matter, total C, total N, and
conductivity were significantly higher in the donor site soils.

Chapter 3.1: Aquatic plant of Mediterranean temporary wetland
89
C (g.kg-1) **
X²=12.5, df=20
10
20
30
40
50
60
N (g.kg-1 ) **
X²=12.5, df=2
01
23
45
6
OM (g.kg-1) **
X²=12.5, df=2
020
40
60
80
100
P2O5 (g.kg-1) ***
F=18.7, df=2
0.0
00.0
20.0
40.0
60.0
80.1
0
pH ***
F=69.2 , df=2
02
46
810
Conductivity (mS.cm-1) **
X²=10.2, df=2
02
46
810
Surface
Cassaïre
Deeper
Cassaïre
a
b
c
a
b
c
a
b
c
aa
b
a a
b
a ab
Surface
Cassaïre
Deeper
Cassaïre
Surface
Cassaïre
Deeper
Cassaïre
Surface
Donor
Surface
Cassaïre
Deeper
Cassaïre
Surface
Cassaïre
Deeper
Cassaïre
Surface
Cassaïre
Deeper
Cassaïre
Surface
Donor
Surface
Donor
Surface
Donor
Surface
Donor
Surface
Donor
Figure 3.1.2: Mean values ± standard errors of total Carbon (C), total Nitrogen (N), Organic Matter
(OM), Phosphorus (P2O5), pH and Conductivity in the surface soil of the donor sites (black bars,
n=5), in the surface soil of the Cassaïre site (current soil surface; white bars, n=5) and in the
deeper soil (40-60 cm deep) of the Cassaïre site (future soil surface; grey bars, n=5). Df are the
degrees of freedom. The F of ANOVA or the X² of Kruskal-Wallis tests are shown above the bars
(***: p<0.001, **: p<0.01), bars showing common letters do not have any significant differences
according to Tukey post-hoc tests or pairwise multiple comparisons with Bonferroni p
adjustment.
Organic matter, total C and total N clearly distinguished the soils from the donor sites
from those of the Cassaïre along the first axis (73.2%; with an eigenvalue of 5.13 for a total
represented of 7) of the PCA (Figure 3.1.3). The second axis (18.0%; with an eigenvalue of
1.26 for a total represented of 7) discriminates the deeper Cassaïre soil from surface

Chapter 3.1: Aquatic plant of Mediterranean temporary wetland
90
Cassaïre soil, and clearly delineates their respective differences in phosphorus and pH
(Figure 3.1.2 and Figure 3.1.3).
Surface
DonorDeeper
Cassaïre
Surface
Cassaïre
C
N
OM
pH
P2O5
Conductivity
Axis 2 = 18.0%
Axis 1 = 73.2%
Figure 3.1.3: Ordination plot of the Principal Component Analysis based on soil nutrient contents
(15 samples × 6 variables) of surface soil of the donor sites (black, 5 plots), of surface soil of the
Cassaïre site (current soil surface; light grey, 5 plots), and of deeper soil (40-60 cm deep) of the
Cassaïre site (future soil surface; dark grey, 5 plots). Ellipses are centred on the barycentre and
their forms are weighted by the distribution of all points corresponding to the same treatment
(surface donor, surface soil, deeper soil).
3.1.3.2. Effect of soil transfer on aquatic vegetation
Plant species richness significantly increased with soil transfer (16.0±2.0) relative to
the control (6.3±2.1) and ended up being comparable to that of the donor sites (14.0±2.8)

Chapter 3.1: Aquatic plant of Mediterranean temporary wetland
91
(Figure 3.1.4.A). The aquatic vegetation cover was significantly lower in the control blocks
(3.5±2.2%) than in the soil transfer blocks (96.8±4.5%) (Figure 3.1.4.B). The aquatic
vegetation cover in the latter and at the donor sites (78.8±16.4) was not significantly
different (Figure 3.1.4.B). The Bray-Curtis similarity index was significantly higher in the
soil transfer blocks than in the control and approached the values of the donor sites
(Figure 3.1.4.C).
05
10
15
20
02
04
06
08
01
00
12
0
0.0
0.2
0.4
0.6
0.8
1.0
Specie
srich
ness
(8 m
²)
Tota
l cover
of
aquatic v
egeta
tion (
%)
Bra
y-C
urt
is s
imila
rity
in
dex
A B C***
F=19.0, df=2
***
F=71.9, df=2
***
F=86.1, df=2
Donor
sitesTransfer Control Donor
sitesTransfer Control Donor
sitesTransfer Control
a
a
b
a
a
b
aa
b
Figure 3.1.4: Mean and standard errors of species richness (8 m²) (A), total cover of aquatic
vegetation (%) (B) and Bray-Curtis similarity index on aquatic vegetation (C) between donor sites
and i) donor sites (black bars, n=5 plots), ii) soil transfer blocks (grey bars, n=4 plots) and iii)
control blocks (white bars, n=4 plots). Df are the degrees of freedom. The F of ANOVA performed
are shown above the bars (***: p<0.001), bars showing common letters do not have any
significant differences according to Tukey post hoc tests.
The first axis of the CA (41.2%; with an eigenvalue of 0.61 for a total represented of
1.48) discriminated the control blocks from the two other communities: donor sites and
soil transfer blocks (Figure 3.1.5); control blocks were composed of Rumex crispus, Poa
trivialis and the exotic species Lindernia dubia. The species composition of the transfer
blocks was very similar to that of the donor sites that were characterized by target
hydrophyte species, such as Chara aspera, Ranunculus peltatus and Tolypella glomerata.
These results were confirmed by the nonparametric MANOVA, showing that the soil

Chapter 3.1: Aquatic plant of Mediterranean temporary wetland
92
transfer treatment did significantly affect plant community composition between control
and transfer blocks (dF=1, F= 11.98, p=0.024).
Donor
sites
Transfer
blocks Control
blocks
Atriplex hastata
Bolboschoenus maritimus
Callitriche sp.
Callitriche truncata
Carex divisa Chara aspera Chara canescens
Chara globularis
Chara hispida
Chara vulgaris
Cladophora vagabunda
Crypsis aculeata
Juncus maritimus
Lindernia dubia
Phragmites australis
Poa trivialis
Potamogeton pectinatus
Ranunculus trichophyllus
Rumex crispus
Scirpus littoralis
Sonchus oleraceus
Spirogyra sp.
Tolypella glomerata Tolypella hispanica Zannichellia obtusifolia Zannichellia pedicellata
Ranunculus peltatus
Typha laxmanii
Axis 2 = 14.7%
Axis 1 = 41.2%
Figure 3.1.5: Ordination plot of the Correspondence Analysis of species abundances (13 plots × 28
species) on donor sites (dark, 5 plots), transfer blocks (dark grey, 4 plots) and control blocks (light
grey, 4 plots). Ellipses are centred on the barycentre and their forms are weighted by the
distribution of all points corresponding to the same treatment (donor sites, transfer blocks,
control blocks).
3.1.3.3. Effect of soil transfer on the different species categories
Active restoration significantly increased the number of target species recorded in
the first months after the flooding: compared with the donor sites, the transfer blocks
had a significantly higher number of the target species (9.8±1.0 versus 7.8±1.3), which

Chapter 3.1: Aquatic plant of Mediterranean temporary wetland
93
were totally absent from the control blocks (Figure 3.1.6.A). Ricefield hydrophyte weeds
were present in all control blocks but absent from the transfer blocks and from the donor
sites (Figure 3.1.6.B). We found significantly more filamentous algae in the soil transfer
blocks than in the control blocks and at the donor sites (Figure 3.1.6.C).
02
46
81
012
0.0
0.5
1.0
1.5
2.0
2.5
0.0
0.5
1.0
1.5
2.0
2.5
Ricefield hydrophyte weeds
X²=12.0, df=2, **Target hydrophyte species
F=113.3, df=2, ***
Filamentous algae
F=17.9, df=2, ***
A B C
a
b
c a a
b
a
a
b
Donor
sitesTransfer Control
Specie
srichness
(8 m
²)
Specie
srichness
(8 m
²)
Specie
s ric
hness (
8 m
²)
Donor
sitesTransfer Control Donor
sitesTransfer Control
Figure 3.1.6: Mean and standard errors in species number of the different species categories in 8
m² plots: the target hydrophyte species (A), the ricefield hydrophyte weeds (B) and the
filamentous algae (C) for donor sites (black bars, n=5 plots), soil transfer blocks (grey bars, n=4
plots) and control blocks (white bars, n=4 plots). Df are the degrees of freedom. The F of ANOVA
or the X² of Kruskal-Wallis test performed are shown above the bars (***: p<0.001, **: p<0.01),
bars showing common letters do not have any significant differences according to Tukey post-hoc
tests or pairwise multiple comparisons with Bonferroni p adjustment.
3.1.4. Discussion
3.1.4.1. Soil properties
Abiotic conditions can adversely affect the success of plant community transfer,
particularly when they are very different from those of the donor ecosystem (Bullock
1998; Dawe et al. 2000). In coastal wetlands, such as the Camargue area, plant
communities are mainly driven by the hydroperiod, water depth, and salinity (Grillas 1990)

Chapter 3.1: Aquatic plant of Mediterranean temporary wetland
94
but soil nutrient conditions also play an important role by directly affecting plant growth
(Zedler 2000b). Obtaining soil characteristics close to those of the reference ecosystem is
a major objective in restoration projects (Zedler 2000b), in order to establish suitable
conditions for target species recolonization (Marrs 2002). In our study, the nutrient
concentrations considered were higher at donor sites except for phosphorus, which was
higher at the site to be restored. The fertilizer use during cultivation may explain the
results because the restoration period following abandonment was quite short for
depletion of fertilizer residues. Indeed, organic matter and nutrient concentrations are
often higher in the reference wetlands (Galatowitsch and Valk 1996; Zedler 2000b),
except for phosphorus, which is strongly related to previous fertilizer use. On one hand
soil transfer appears to be a good way to increase organic matter and nutrients
concentrations, on the other hand it may also favor the establishment of filamentous
algae (Burkholder 2009), that we found more abundantly in the transfer blocks than in
the control. The higher pH in the deeper soil that became the surface soil of the blocks
did not seem to affect the plant germination probably because it still remained within the
pH range appropriate for basophilous plants (i.e. 7.5 to 9; (Wilde 1954).
Upper soil layers of former agricultural lands contain high levels of nutrient favoring
most of the ruderal species of the seed bank, and increasing competition (Marrs 2002).
The topsoil removal to construct blocks (which will also be removed at the scale of the
site to restore the wetland) reduced significantly the content of phosphorus, organic
matter, total C and total N, and also to the reduction of unwanted plant species by
reducing the seed bank (Chapter 2). However, the role of nutrients is probably time
limited. If for terrestrial oligotrophic community restoration, soil conditions play an
important role for success (Chapter 4), requiring nutrient poor site conditions because
non-target species from the seed bank can “hijack” the succession, in wetland
ecosystem, hydrology seems to play a determining role on plant communities which can
buffer the effects of soil conditions, by eliminating species that are not adapted to
summer drought or to winter flooding. However high nutrient levels may lead to a spread
of filamentous algae, that may prevent the installation of temporary wetland
communities (Hosper 1998).

Chapter 3.1: Aquatic plant of Mediterranean temporary wetland
95
3.1.4.2. Natural colonization
Many of the naturally colonizing species which established in the control blocks in the
five first months were abundant in the seed bank of the area (seed bank sampling using
the seedling emergence with sample concentration method, Chapter 2). Rumex crispus,
Poa trivialis, and Sonchus oleraceus, as well as the aquatic species Lindernia dubia and
Chara vulgaris, were the main species found in the control blocks. Lindernia dubia, a
common exotic species of ricefields and Chara vulgaris, a cosmopolitan algae had been
favored by water management during rice cultivation (i.e. summer inundation), are
typical ricefield weeds occurring in seed bank (Marnotte et al. 2006) and reflecting land
use history of the area. Nevertheless, their abundance will decrease as summer drought
does often not allow to finish their life cycle (they flower in early summer). Ruderal and
meadow species should also rapidly disappear after several flooding periods. The
Mediterranean hydrology should play a major role as a filter to eliminate species that are
not adapted to summer drought (ricefield weeds) or to winter flooding (ruderals and
terrestrials species).
Five months after the creation of the blocks, most plant species established from the
seed bank of the control blocks. Aquatic plants may establish from the seed bank (Leck
2003; De Steven et al. 2006) but also by seed deposition through water dispersal (Mitsch
et al. 1998), waterbirds (Figuerola et al. 2002; Figuerola and Green 2002b; Brochet et al.
2010b), vertebrates (Zedler and Black 1992), or wind dispersal (Reinartz and Warne 1993).
However, these mechanisms of colonization are not efficient, because dispersal is slow
and sometimes unlikely (Moreno-Mateos and Comin 2010). In our study, no target species
were found in the control blocks. The time span is too short to evaluate the potential of
natural colonization from the external seed pool. Although rice cultivation dominates the
surrounding landscape, natural temporary wetlands still occur within distance of less than
1 km and dispersal by waterbirds, a major dispersal vector (Brochet et al. 2010b), seems to
be possible. However, the size of our blocks may have been too small to be attractive for
waterbirds. This weak attractiveness will be overcome when the 35 hectare wetland will
be restored, as it will be more attractive for waterbirds (Pirot et al. 1984); zoochorous
processes will then be playing their role in the dispersion of aquatic species.

Chapter 3.1: Aquatic plant of Mediterranean temporary wetland
96
Spontaneous succession alone has been shown to allow the restoration of plant
communities and active restoration is not necessary if target species occur at the site or if
sites are connected to propagule sources (Dawe et al. 2000). However, sites situated in
agricultural landscapes or with a long history of cultivation, such as the Cassaïre area,
often show a weak ability to restore passively due to the lack of target species in the seed
banks and/or few target seed sources (Galatowitsch and Valk 1996; De Steven et al. 2006;
Collinge and Ray 2009). Moreover, on abandoned croplands, ruderal species may
predominate, slowing down succession and preventing the establishment of target
species (Prach et al. 2001a). In such cases, soil transfer may be an efficient method to
accelerate succession.
3.1.4.3. Effect of soil transfer on the aquatic plant community
Soil transfer increased the total species richness and allowed the establishment of
all the aquatic target species. The plant composition of the transfer blocks was close to
that of the donor sites. The differences in soil nutrients between the donor sites and the
transfer blocks did not prevent germination of the aquatic species that were transferred
with the soil in the blocks.
In grassland ecosystems, Jaunatre et al. (2012) showed an increase in the non-target
species after soil transfer compared with the reference grassland, resulting from soil
disturbance induced by the transfer itself. Bullock (1998), also working in grassland
ecosystems restoration, showed that the transfer led to communities with species that
are very different from those of target communities. Highly selective stress conditions
leading to very predictable successional trajectories (Mesléard et al. 1999) may explain
the observed general success of soil transfer in wetlands as well as the promising results
of the present study in contrast to the observed response of terrestrial communities in
which selection is less strong. In aquatic ecosystems, the selection of plant communities
by the water filter is important, only aquatic species can survive in the environment. This
filter has an important selective effect, especially in our case, where the water regime is
temporary, increasing selection pressure (the species should be aquatic and tolerated
stages of drought, i.e. be annual). For terrestrial communities, even though there may be
obvious stressful conditions (e.g. drought), restoration is often done following

Chapter 3.1: Aquatic plant of Mediterranean temporary wetland
97
agricultural abandonment on land (chapter 4) with a nutrient-enriched soil and a seed
bank dominated by ruderal species, both favoring seed bank species and competition
with target species (chapter 4).
3.1.4.4. Other benefits of soil transfer
In addition to target species introduction, soil transfer seems to significantly
reduce the establishment of undesired species emerging from the seed bank and from
the surroundings, such as ricefield weeds. The increase in the cover of aquatic vegetation
seems to prevent the germination and growth of these weeds. The initial species
composition of the restored vegetation potentially affects the vegetation for a long time
(Vécrin et al. 2002) and non-desirable species installed at the beginning can persist,
hampering succession and/or changing the vegetation trajectory (Prach et al. 2001a;
Prach and Pysek 2001; Prach et al. 2001b; De Steven et al. 2006). Soil transfer may also
reduce stochasticity, by immediately installing a stable community (Weiher and Keddy
1995). Collinge and Ray (2009) and Reinartz and Warne (1993) have shown that wetlands
that initially received more native seeds were less prone to colonization by exotic species,
and that the early introduction of native wetland species may increase the long-term
diversity of communities in created wetlands. Indeed, in our case, the ricefield weeds can
compete with our target hydrophyte species. Although they are less adapted to the
temporary wetland and tend to disappear over time, a certain plasticity of their
phenology allowed their presence in the blocks and can thus compromise succession and
prevent the natural reestablishment of target species. Soil transfer appears to be an
appropriate method to accelerate succession towards the desired plant community and
to attempt to bypass some of blocked stages of succession (Reinartz and Warne 1993;
McKinstry and Anderson 2005; Collinge and Ray 2009).
Soil transfer provides an advantage for rare species showing dispersal limitation.
Indeed, some studies have shown that passive methods may not allow the full restoration
of the reference species composition (De Steven et al. 2006; Collinge and Ray 2009).
In using soil transferred from several donor sites, we increase the number of target
hydrophyte species at one site compared with a single donor site. We further increase the
pool of available species, allowing the selection of the most appropriate species to the

Chapter 3.1: Aquatic plant of Mediterranean temporary wetland
98
specific abiotic conditions of the Cassaïre site, and thereby increasing the probability of
success (Zedler 2000b). Soil transfer also provides a soil seed bank ensuring survival in
fluctuating environments. This dormant reservoir is a powerful mechanism for
maintaining species diversity by promoting the coexistence of a greater number of
species.
In addition, soil transfer allows i) the preservation of biotic interactions by
transferring soil microorganisms (Bullock 1998) which play an important role in
structuring plant community (Moora and Zobel 2009) and in improving substrate
conditions (McKinstry and Anderson 2005) and ii) the potential transfer of zooplankton
and macroinvertebrate egg bank (Chapter 3.2). Brady and coauthors (Brady et al. 2002)
demonstrated that soil transfer leads to a more natural invertebrate community
structure, and can be a significant benefit for non-aerial invertebrates, which are not able
to disperse alone, such as crustaceans (Cladocera and Triops) or mollusks.
3.1.4.5. Restoration perspectives and the importance of time and monitoring
The positive results obtained in the blocks after only few months and the low
technical effort demonstrate that soil transfer is a promising restoration method that
may also be applied at larger scales (i.e. creating 35 hectares of Mediterranean temporary
wetlands in our site). Indeed, unlike terrestrial ecosystems where soil transfer involves
the destruction of the donor ecosystem (Vécrin and Muller 2003; Jaunatre et al. 2012) and
cannot be a substitute for in situ conservation (McLean 2003), the soil transfer technique
used in our study appears a non-destructive method at the scale of the donor wetlands.
Because the seed bank of the first few centimeters of the soil in temporary wetlands is
rich in seed number and species diversity (Bonis and Grillas 2002), only 8 m² of soil were
collected in our case at the donor sites (corresponding approximately to less 0.001% of
the total area of the donor sites) and were spread for half a day over 32 m²
(corresponding to 200 liters of soil) in the blocks. The low quantities of soil required allow
an application of the method at a scale of several hectares. Moreover, instead of
spreading the soil over the whole area, soil may be transferred in small patches,
functioning as species-rich sources for spontaneous colonization of nearby areas not
transferred.

Chapter 3.1: Aquatic plant of Mediterranean temporary wetland
99
Short-term observations are not sufficient in predicting community dynamics
(Mesléard et al. 1991; Weiher et al. 1996; Collinge and Ray 2009). An initial success may be
compromised by long-term mortality, undesired successional trajectories, and does not
reflect long-term success (Dawe et al. 2000; Fahselt 2007), although long-term studies
confirm a beneficial role of soil transfer in wetland restoration (Reinartz and Warne 1993;
Balcombe et al. 2005a; Nishihiro et al. 2006). Long-term monitoring of changes in plant
community of restored wetlands is required to evaluate the potential of this technique
for restoring or creating Mediterranean temporary wetlands.

Chapter 3.1: Aquatic plant of Mediterranean temporary wetland
100

Chapter 3.2: Aquatic invertebrates of Mediterranean temporary wetland
101
Section 3.2: Effectiveness of soil transfer in restoring
Mediterranean temporary wetland invertebrate
communities
Muller Isabelle, Aline Waterkeyn, Elise Buisson, François Mesléard & Hector
Rodriguez
Submitted to Restoration Ecology on October, 15th 2013

Chapter 3.2: Aquatic invertebrates of Mediterranean temporary wetland
102
3.2.1. Introduction
Because zooplankton and macroinvertebrates play important roles in wetland
ecosystems, such as influencing sediment properties and water content (Rhoads and
Young 1970), they are extremely valuable components of wetland ecosystem functioning.
In spite of this, ecological restoration has been more focused on abiotic and plant
components, with limited attention given to the fauna in general and the invertebrates in
particular (e.g. Palmer et al. 1997; Keesing and Wratten 1998; Zedler 2000b; Longcore
2003; Cristescu et al. 2013). It is often assumed that animals will naturally recolonize a site
when the native plant community and suitable habitat conditions are present (Palmer et
al. 1997; Keesing and Wratten 1998), although this paradigm has recently been
questioned and tested (Block et al. 2001; Brady et al. 2002; Koch 2007; Cristescu et al.
2013).
Several studies of natural colonization processes in restored wetlands show that
some invertebrate taxa found at natural sites are able to colonize sites after the
restoration of habitat conditions (LaSalle et al. 1991; Brown et al. 1997; Balcombe et al.
2005b; Obolewski and Glińska-Lewczuk 2011). The proximity of natural wetlands is then a
determining factor for reducing dispersal limitations and for favoring the development of
faunal communities (Paterson and Fernando 1969; Sacco et al. 1994; Levin et al. 1996;
Chovanec and Raab 1997; Badosa et al. 2010). However, as Zedler (2000a) pointed out, “it
takes more than water to restore a wetland”: the assumption that providing the correct
habitat structure will naturally lead to the recovery of the appropriate communities
(Palmer et al. 1997) is rarely demonstrated. Indeed, with natural recruitment, e.g. passive
restoration, dispersal-limited species are less likely to appear (Zedler 2000a; Louette et al.
2009) and the recovery of the community may be limited by the capacity of some
organisms to be recruited (Bradshaw 1996; Palmer et al. 1996), which adversely affects
the success of restoration. Most aquatic insects, such as dragonflies (Odonata), water
bugs (Hemiptera), water beetles (Coleoptera), flies and mosquitos (Diptera), are good
dispersers because they are, at least for part of their life cycles, capable of active flight.
Most of them can therefore select their habitat (Heck and Crowder 1991; Palmer et al.
1996; Zedler 2000b). However, other macroinvertebrates, such as Gastropoda,
Amphipoda and Isopoda, and zooplankton species, such as Rotifera, Cladocera,

Chapter 3.2: Aquatic invertebrates of Mediterranean temporary wetland
103
Copepoda, Ostracoda, Anostraca, Notostraca and Spinicaudata, are dependent on
external vectors for their, less efficient, passive dispersal (Barnes 1983; Sacco et al. 1994;
Brown et al. 1997; Jenkins and Underwood 1998). This could lead to major differences in
community structure between restored and natural wetlands which are dominated by
highly mobile taxa having aerial dispersal capabilities (Barnes 1983; Layton and Voshell
1991; Levin et al. 1996; Brown et al. 1997), persisting for a long time, and having important
consequences for the recovery of wetland ecological processes (Barnes 1983).
In achieving restoration goals, the limited dispersal abilities of certain species of
interest can be overcome by active restoration such as stoking (direct introduction of
individuals of taxa with low dispersal) or transferring soil containing an egg bank
(inoculating soil harvested from a natural wetland) to facilitate the establishment of
these taxa (Levin et al. 1996; Keesing and Wratten 1998; Gleason et al. 2004; Chittapun et
al. 2005). Active restoration is a common procedure for restoring plant communities in
wetland ecosystems (Reinartz and Warne 1993; Kaplan et al. 1998; Nishihiro et al. 2006;
Chapter 3.1), but relatively few studies have documented the efficiency of this procedure
in restoring macroinvertebrates and zooplankton communities (Brown and Bedford 1997;
Brown et al. 1997; Brady et al. 2002; Tong et al. 2013). Brady and coauthors (2002) have
demonstrated that inoculating natural wetland soils and stocking weak disperser species
can increase invertebrate diversity, non-aerial invertebrates, and result in community
structures more similar to those found in natural wetlands. Brown et al. (1997) came to
the same conclusion using only inoculation of natural wetland soils, increasing overall
macroinvertebrate numbers accompanied by an abundance of some less mobile taxa.
In the Mediterranean Basin, temporary wetlands are probably among the most
remarkable, but also the most threatened of wetland habitats (Grillas et al. 2004). These
wetlands are characterized by winter and spring flooding, with durations that vary greatly
from year to year, and by a complete drying-out in summer (Grillas et al. 2004). They are
of high conservation value because they often house unique fauna and flora, contribute
significantly to regional diversity, and fulfill an important role in the landscape (Grillas et
al. 2004; Zacharias et al. 2007). Therefore, in recent decades, the restoration of temporary
wetlands has received increased attention (Zhang et al. 2010).

Chapter 3.2: Aquatic invertebrates of Mediterranean temporary wetland
104
Many organisms inhabiting these ecosystems exhibit adaptations for surviving the
dry phase as dormant eggs or other drought-resistant life stages that persist in wetland
sediments (Wiggins et al. 1980; Williams 1998). Inoculating restored sites with wetland
sediments collected at natural sites during the dry period can be a useful method of
restoring temporary wetlands and increasing their functionality, provided the introduced
sediments contain a persistent and viable egg bank (Brown and Bedford 1997; Brady et al.
2002; Tong et al. 2013). This method has been shown to immediately increase plant
species richness as well as the number of target hydrophyte species, leading to a
vegetation composition close to that of the ecosystem of reference (Chapter 3.1). Such
soil transfer could also play a role in restoring the invertebrate community by (1) directly
facilitating the establishment of populations of poorly dispersing taxa with dormant
stages and (2) indirectly attracting actively dispersing taxa with an adapted vegetation
and food web. Indeed, developed vegetation stands can promote invertebrate
establishment by providing a refuge from predation, and for reproduction, and a source
of food (Rozas and Odum 1988; Heck and Crowder 1991; Moy and Levin 1991; Korsu 2004;
Tong et al. 2013). On the other hand, high zooplankton prey densities can also support
larger macroinvertebrate predator populations (Lynch 1979; Cooper 1983; Rabe and
Gibson 1984).
The present study tests the effect of soil transfer from temporary wetlands, which
has been successfully used to restore plant communities (Chapter 3.1), on invertebrate
communities. The objective of this on-site experiment on wetland blocks is to assess how
soil transfer can benefit zooplankton and macroinvertebrate communities. We addressed
two questions: (1) By introducing soil do we increase zooplankton and macro-
invertebrates diversity? (2) Does soil transfer result in invertebrate communities more
similar to those of natural wetlands?
3.2.2. Methods
3.2.2.1. Study site
The experiment was conducted on the Cassaïre site (c. 43°31’ N, 4°44’ E, 3 meter
maximum elevation), located in the east of the Camargue area (Rhône delta, Southern
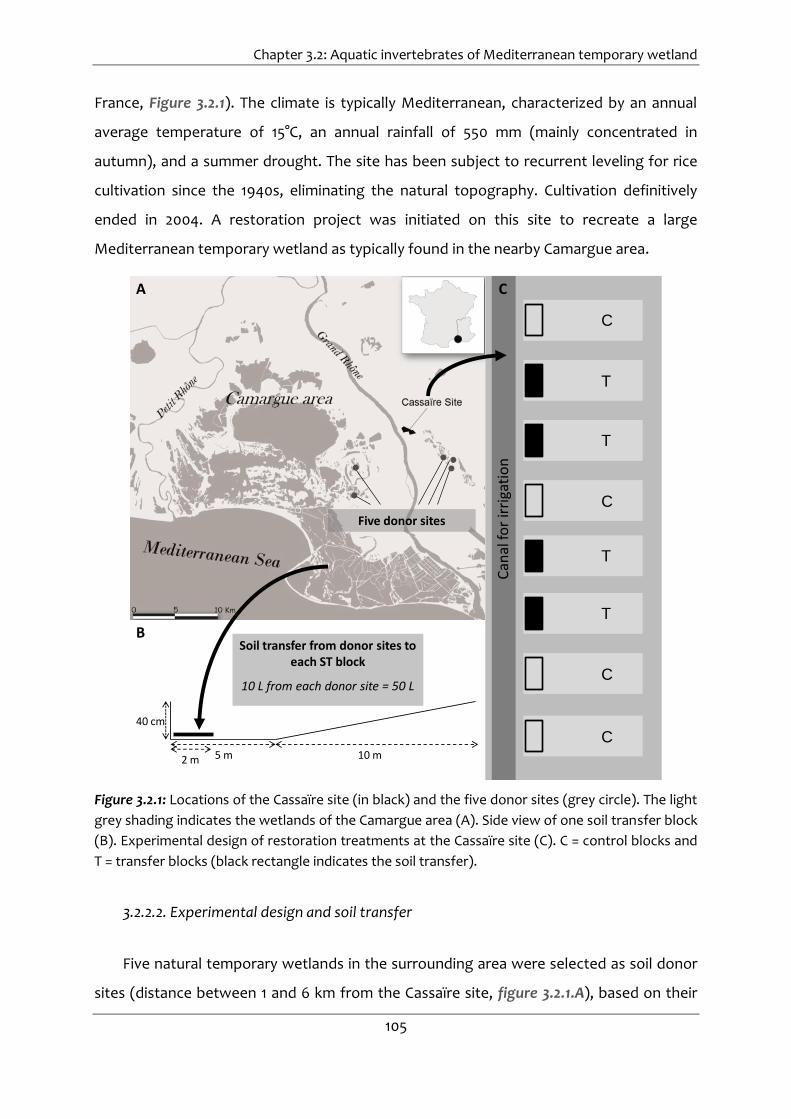
Chapter 3.2: Aquatic invertebrates of Mediterranean temporary wetland
105
France, Figure 3.2.1). The climate is typically Mediterranean, characterized by an annual
average temperature of 15°C, an annual rainfall of 550 mm (mainly concentrated in
autumn), and a summer drought. The site has been subject to recurrent leveling for rice
cultivation since the 1940s, eliminating the natural topography. Cultivation definitively
ended in 2004. A restoration project was initiated on this site to recreate a large
Mediterranean temporary wetland as typically found in the nearby Camargue area.
A
Can
al fo
r ir
riga
tio
n
C
B
40 cm
5 m 10 m
Five donor sites
2 m
T
C
C
C
C
T
T
T
Soil transfer from donor sites to each ST block
10 L from each donor site = 50 L
Figure 3.2.1: Locations of the Cassaïre site (in black) and the five donor sites (grey circle). The light
grey shading indicates the wetlands of the Camargue area (A). Side view of one soil transfer block
(B). Experimental design of restoration treatments at the Cassaïre site (C). C = control blocks and
T = transfer blocks (black rectangle indicates the soil transfer).
3.2.2.2. Experimental design and soil transfer
Five natural temporary wetlands in the surrounding area were selected as soil donor
sites (distance between 1 and 6 km from the Cassaïre site, figure 3.2.1.A), based on their

Chapter 3.2: Aquatic invertebrates of Mediterranean temporary wetland
106
aquatic plant communities (Chapter 3.1). The environmental conditions in these five
donor wetlands varies slightly from one wetland to another, but corresponded to the
range of expected environmental conditions on the Cassaïre site after the creation of the
temporary wetland, i.e. having a flooding period from September to June, a maximum
water depth of 30 cm, and salinity below 6g/L. Not every target hydrophyte plant species
could be found in a single donor wetland; rather, the five donor sites together provide a
regional, locally adapted target species pool. In August 2011, during the dry period, we
collected eight 45 × 45 cm sediment samples from a 3 cm depth corresponding
approximately to a total of 40 L per donor site. Our assumption was that these collected
soils would contain the seeds and eggs of the species present in the donor sites. We
pooled the 8 samples together and blended them using a cement mixer. The resulting
single bulk sample was stored dry until the transfer to the Cassaïre site.
To simulate the suitable environmental conditions characteristic of a Mediterranean
temporary wetland, eight blocks with a gentle slope were dug out (15 m long × 5 m large
× 40 cm deep; Figure 3.2.1.B) along an irrigation canal. Four blocks were used to test soil
transfer (transfer blocks). The four other blocks (control blocks) were used to monitor
natural colonization and establishment. The position of treatments was randomized
(Figure 3.2.1.C). We pooled 10 L samples from each of the five sites and we spread the 50
total L of soil on a 4 × 2 m plot at the bottom of each transfer block (Figure 3.2.1.B). A
pump was used to maintain a constant 20 cm water level for a time period beginning the
day after the transfer in January and ending in late June 2012. This is intended to
reproduce the flooded conditions associated with temporary wetland.
3.2.2.3. Zooplankton and macroinvertebrates sampling
In mid-June 2012, 5 months after applying treatments, zooplankton and
macroinvertebrate sampling were conducted. This was followed by measurements of
dissolved oxygen (mg.L-1), conductivity (mS.cm-1), and temperature (°C) in each block. We
observed no significant differences in chemical parameters between transfer blocks and
control blocks (Figure 3.2.2).

Chapter 3.2: Aquatic invertebrates of Mediterranean temporary wetland
107
Control Soil transfer
02
46
8
020
040
060
080
0
05
1015
2025
A.Dissolved oxygen
t= -0.7, NS
B.Conductivity
t= -1.3, NS
C.Temperature
t= -1.3, NS
mS.
cm-1
Control Soil transfer Control Soil transfer
mg.
L-1
C
Figure 3.2.2: Mean and standard errors of dissolved oxygen (A), conductivity (B), and temperature
(C) in control blocks (white, n=4) and in soil transfer blocks (grey bars, n=4). The t of Student test
performed are shown above the bars (NS: non significant).
For zooplankton, we collected 50 L of water at different depths in each block and
filtered the collected water though a 64 µm mesh. Macroinvertebrates were sampled by
performing a 1-minute sweep of a 250 µm net through all of the microhabitats (the water
column and the vegetation). The zooplankton and macroinvertebrates were stored in
ethanol (70%), counted, and identified under a binocular dissecting microscope.
Zooplanktons were identified to class level and macroinvetrebrates were identified to
class, family, or genus level. We classified all taxa found in non-aerial and in aerial taxa.
When the taxa were observed in a larval stage, it was noted. Taxonomic levels were not
identical between taxa, but for each taxon the level of taxonomic identification was
identical between blocks.
Thirty natural temporary wetlands (comprising two of the five donor sites), selected
along a broad salinity and hydroperiod gradient, were also sampled. The zooplankton and
macro-invertebrate communities were sampled using the same method and the same
level of identification (Waterkeyn et al. 2008) as was done for the study blocks.

Chapter 3.2: Aquatic invertebrates of Mediterranean temporary wetland
108
In order to determine whether soil transfer can modify the functional composition in
terms of feeding behavior (Moog 1995), we attributed each taxon to one or several
functional-feeding guilds (Moog 1995):
- Shredders (SHR): Fallen leaves, plant tissue, coarse particulate organic matter
- Grazers (GRA): Epilithic algal tissues, biofilm, partially particulate organic matter
- Active filter-feeders (AFIL): Food in water current (suspended fine particulate
organic matter, coarse particulate organic matter and prey) is actively filtered
- Passive filter-feeders (PFIL): Food (suspended fine particulate organic matter,
coarse particulate organic matter and prey) brought by flowing water current
- Detritus feeders (DET): Sedimented fine particulate organic matter
- Miners (MIN): Leaves of aquatic plants
- Xylophagous (XYL): Woody debris
- Predators (PRE): Prey
- Omnivorous animals (OTH): Diverse
Because the diets of some organisms are not exclusive, each taxon was given a score
out of 10, broken down by functional feeding guild in such a was as to represent the
relative contributions of each of the 9 guilds to the taxon’s overall nutrition (Moog 1995):
e.g., for Chironomini: SHR=0, GRA=0, AFIL=3, PFIL=0, DET=7, MIN=0, XYL=0, PRE=0,
OTH=0, total score/taxon=10.
To determine the composition of functional feeding guilds in each block, the number
of individuals of each taxon was first weighted by the functional feeding guild scores (e.g.
for 92 Chironomini in block#1: SHR=0×92, GRA=0×92, AFIL=3×92, PFIL=0×92, DET=7×92,
MIN=0×92, XYL=0×92, PRE=0×92, OTH=0×92). We then summed the weighted scores of
all taxa in each functional feeding guild, and then divided by the sum of the weighted
scores across guilds, resulting in a frequency of each guild in each block.
3.2.2.4. Data analysis
3.2.2.4.1. Effect of soil transfer on community composition
In order to study the effect of treatment (soil transfer/control) on the community
compositions of zooplankton and macroinvertebrates, we used a nonparametric

Chapter 3.2: Aquatic invertebrates of Mediterranean temporary wetland
109
multivariate analysis of variance (nonparametric MANOVA) (Anderson 2001). We used
Bray-Curtis dissimilarities on abundances with 999 permutations to calculate p-values. We
run separate analyses for zooplankton and for macroinvertebrates data. We also ran a
Correspondence Analysis (CA; Greenacre 1984) on both macroinvertebrate and
zooplankton compositions.
Diversity was assessed using the number of taxa, the Shannon index, and the
Shannon evenness (Pielou 1969), in zooplankton communities and in macroinvertebrate
communities. Statistical differences between treatments were measured with Student
tests. We also tested differences between treatments in total zooplankton abundance,
total macroinvertebrate abundance, among functional feeding guilds and among richness
of aerial and non aerial taxa, relative abundance of non aerial taxa and relative abundance
of larval stages with Student tests, when parametric assumption were reached, or with
Wilcoxon tests, when data were not normally distributed. We performed for each taxa a
student test on abundances (when abundances were not normally distributed, data were
log (w+1) transformed before testing) to identify differences in abundance between
treatments.
3.2.2.4.2. Comparison with natural temporary wetlands
In order to characterize the effect of soil transfer on the invertebrate community, we
calculated community similarity with the Jaccard similarity index (Jaccard 1901) between
each block and natural wetland composition, resulting in four replicate Jaccard indexes
for each treatment. An index of zero corresponds to an absence of species in common
between the treatment and the reference community, while an index of 1 indicates a
similar invertebrate composition. These four replicate indexes were compared among
treatments using student tests.
All tests were performed using R 2.12.0 (R Development Core Team, 2010) with a
p=0.05 threshold using “ade4” package (Chessel et al., 2004; Dray and Dufour, 2007; Dray
et al., 2007) and “vegan” package (Oksanen et al., 2008).

Chapter 3.2: Aquatic invertebrates of Mediterranean temporary wetland
110
3.2.3. Results
3.2.3.1. Effect of soil transfer on zooplankton community composition
After five months, three taxa, representing 4417 individuals, were identified in both
treatments. The soil transfer treatment significantly affected the zooplankton community
composition (df=1; F=4.8, p=0.028), although the CA (Figure 3.2.3) did not clearly
discriminate the two treatments because all the three taxa were found in both
treatments.
Control
Soil transfer
Copepods
Cladocers
Ostracods
Axis 2 = 18.9%
Axis 1= 81.1%
Figure 3.2.3: Ordination plot of the Correspondence analysis based on the zooplankton
composition in soil transfer blocks (dark grey, n=4) and in control blocks (light grey, n=4). Ellipses
are centered on the barycenter and their forms are weighted by distribution of all points
corresponding to the same treatment.
Zooplankton abundance was significantly higher in the soil transfer blocks
(828.8±180.3 zooplankton individuals in soil transfer blocks vs. 275.5±96.0 individuals in
the control block; Figure 3.2.4.A).

Chapter 3.2: Aquatic invertebrates of Mediterranean temporary wetland
111
0200
400
600
800
1000
0100
200
300
400
020
40
60
80
Ab
un
dan
ce(i
nd
ivid
ual
sp
er 5
L)
Ab
un
dan
ce(i
nd
ivid
ual
sp
er 1
min
ute
sam
plin
g)
Rel
ativ
e ab
un
dan
ce
Control Soiltransfer
Control Soiltransfer
Control Soiltransfer
Zooplanktont=-2.7, *
Macroinvertebratet=-0.1, NS
Proportion of non-aerial taxa
t=-2.7, *
A. B. C.
Figure 3.2.4: Mean and standard errors of total zooplankton abundance (A) total
macroinvertebrate abundance (B) and proportional abundance of non-aerial taxa (C) in control
blocks (white, n=4) and soil transfer blocks (grey bars, n=4). The t of Student test performed are
shown above the bars (NS: non significant, *: p<0.05).
This can be attributed to the significantly higher abundance of copepods
(799.5±164.5 copepods individuals for soil transfer vs. 271.5±95.0 copepods individuals for
control; Figure 3.2.5.A) and ostracods (7.6±2.5 ostracods individuals for soil transfer vs.
0.8±0.5 ostracods individuals for control; Figure 3.2.5.B) in soil transfer blocks. No
significant difference in species richness, Shannon index, or Shannon evenness between
treatments (t=-1.6, p=0.21; t=-0.5, p=0.65; t=0.4, p=0.95 respectively) was observed.

Chapter 3.2: Aquatic invertebrates of Mediterranean temporary wetland
112
02
00
40
06
00
80
01
00
0
02
00
40
06
00
80
01
00
0
02
46
8Control Soil
transfer
A. Copepodst= -2.8, *
Ab
un
dan
ce(i
nd
ivid
ual
sp
er 5
L)
Ab
ud
ance
(in
div
idu
als
per
1 m
inu
te s
amp
ling)
B. Ostracodst=-2.7, *
C. Laccophilust= -6.9, ***
Ab
un
dan
ce(i
nd
ivid
ual
sp
er 5
L)
Control Soiltransfer
Control Soiltransfer
Figure 3.2.5: Mean and standard errors of abundance of copepods (A), ostracods (B) and
Lacophilus (C) in control blocks (white, n=4) and soil transfer blocks (grey bars, n=4). The t of
Student test performed are shown above the bars (*: p<0.05, ***: p<0.001).
3.2.3.2. Effect of soil transfer on macroinvertebrates community composition
Concerning macroinvertebrates, 39 taxa were recorded in the blocks, representing a
total of 2558 individuals. Ten taxa were exclusively found in the soil transfer blocks,
including seven coleoptera, two odonata, and one gasteropoda. Five were entirely absent
from the soil transfer blocks, one coleopteran, one odonata, one heteroptera, and two
diptera. However, a nonparametric MANOVA did not detect any effect of treatment on
the macroinvertebrate community composition (df=1, F=0.74, p=0.55). This is confirmed
by the CA (Figure 3.2.6), which does not clearly discriminated between the two
treatments and where the projection of the two communities overlaps.

Chapter 3.2: Aquatic invertebrates of Mediterranean temporary wetland
113
Control
Soil transfer
Chironomini
Orthocladini
Stratiomyidae
Culicidae
Anophelidae
Tabanidae
LimoniidaePrediciniini
Ceratopogonidae
Sigara
Meladema
Helophorus Berosus Hydroglyphus
Enochrus
Helochares
Laccophilus
Haliplus
Graphoderus Ochthebius
Coelambus
Enochrus melanocephalus
Ischnura
Coenigrionidae
HydroporusDesconocida
Acilus
Axis 2 = 24.9%
Axis 1 = 46.4%
Figure 3.2.6: Ordination plot of the correspondence analysis based on the macroinvertebrate
composition in soil transfer blocks (filled circles, grey, n=4) and in control blocks (open circles,
white, n=4). Ellipses are centered on the barycenter and their forms are weighted by the
distribution of all points corresponding to the same treatment. In the interest of clarity, only the
27 taxa with the higher contributions to axes are shown.
Of the 39 taxa, only Lacophilus abundances (coleoptera), were significantly different
between the two treatments (2.5±1.3 Lacophilus individuals in the control blocks vs.
6.3±1.8 Lacophilus individuals in the soil transfer blocks; t=-6.9, p<0.001; Figure 3.2.5.C.).
Although species richness, Shannon index, Shannon evenness, and abundance of
macroinvertebrates (Figure 3.2.4.B) were higher in the soil transfer blocks, no significant
difference was recorded between treatments for these four parameters (t=-1.2, p=0.32;
t=-1.7, p=0.16; t=-1.7, p=0.15; t=-0.2, p=0.88 respectively).
While there was no observed difference in the number of aerial and non-aerial taxa
between the two treatments (t=-0.9, p=0.4 for aerial, and t=-1.6, p=0.22 for non-aerial),
the relative abundance of invertebrates without aerial dispersal (all zooplankton and the

Chapter 3.2: Aquatic invertebrates of Mediterranean temporary wetland
114
gasteropoda Planorbis) was significantly higher in the soil transfer blocks (71±3% for soil
transfer vs. 44±12% for control; Figure 3.2.4.C),
The macroinvertebrate communities showed no significant difference when
compared based on the six functional feeding guilds (no Omnivorous animals,
Xylophagous and Passive filter-feeders were recorded, Figure 3.2.7) or of developmental
stages (t=2.1, p=0.09 for the relative abundance of larval stages).
0.0
0.5
1.0
1.5
010
20
30
40
50
05
10
15
20
25
05
10
15
20
010
20
30
40
50
0.0
0.1
0.2
0.3
0.4
0.5
0.6
0.7
Control Soil transfer Control Soil transfer Control Soil transfer
Control Soil transfer Control Soil transfer Control Soil transfer
Shredderst= -1.1, NS
Perc
enta
ge(%
)
Grazerst= 0.7, NS
Active filter-feederst= -0.0, NS
Predatorst= -1.8, NS
Detritus feeders t= -0.1, NS
MinersW= 9, NS
Perc
enta
ge(%
)
Perc
enta
ge(%
)
Perc
enta
ge(%
)
Perc
enta
ge(%
)
Perc
enta
ge(%
)
Figure 3.2.7: Mean and standard errors of the percentage of the different functional feeding
guilds in the control blocks (white, n=4) and in the soil transfer blocks (grey bars, n=4). The t of
Student tests or the W of the Wilcoxon tests performed are shown above the bars (NS: non
significant).
3.2.3.3. Comparison with natural temporary wetlands
No significant difference was observed in the Jaccard similarity indices between the
two treatments and the natural community, and we observed high similarity indices with
the natural community for both soil transfer and control blocks (0.74±0.01 and 0.76±0.02;
Figure 3.2.8).
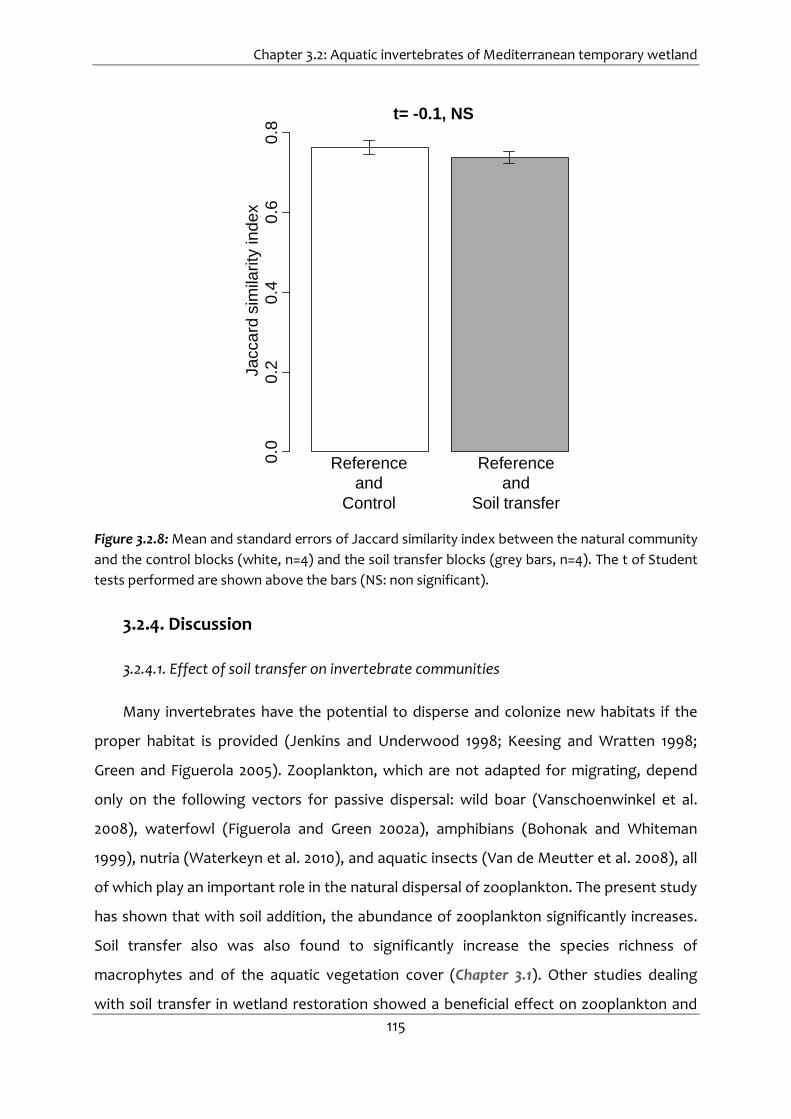
Chapter 3.2: Aquatic invertebrates of Mediterranean temporary wetland
115
Reference
and
Control
Reference
and
Soil transfer
0.0
0.2
0.4
0.6
0.8
t= -0.1, NS
Ja
cca
rdsim
ilari
tyin
de
x
Figure 3.2.8: Mean and standard errors of Jaccard similarity index between the natural community
and the control blocks (white, n=4) and the soil transfer blocks (grey bars, n=4). The t of Student
tests performed are shown above the bars (NS: non significant).
3.2.4. Discussion
3.2.4.1. Effect of soil transfer on invertebrate communities
Many invertebrates have the potential to disperse and colonize new habitats if the
proper habitat is provided (Jenkins and Underwood 1998; Keesing and Wratten 1998;
Green and Figuerola 2005). Zooplankton, which are not adapted for migrating, depend
only on the following vectors for passive dispersal: wild boar (Vanschoenwinkel et al.
2008), waterfowl (Figuerola and Green 2002a), amphibians (Bohonak and Whiteman
1999), nutria (Waterkeyn et al. 2010), and aquatic insects (Van de Meutter et al. 2008), all
of which play an important role in the natural dispersal of zooplankton. The present study
has shown that with soil addition, the abundance of zooplankton significantly increases.
Soil transfer also was also found to significantly increase the species richness of
macrophytes and of the aquatic vegetation cover (Chapter 3.1). Other studies dealing
with soil transfer in wetland restoration showed a beneficial effect on zooplankton and

Chapter 3.2: Aquatic invertebrates of Mediterranean temporary wetland
116
aquatic plants (Brown and Bedford 1997; Brown et al. 1997; Brady et al. 2002; Tong et al.
2013), due to dormant aquatic plant seeds and invertebrate eggs residing within the
wetland sediments. This strategy of persisting in resting stages is essential in temporary
wetlands where the dry phase is considered as a disturbance (Bonis 1998) and the
production of dormant propagules is a way of persisting and be resilient.
By improving macrophytes and zooplankton communities, we expected an increase
in macroinvertebrate communities. Indeed, as the components of ecosystems have
complex linkages to each other, changes in one component may lead to cascading
changes in the whole system. It had been demonstrated that vegetation affects
macroinvertebrate composition by providing food and protection from predators (Vince
et al. 1976; Rozas and Odum 1988; Heck and Crowder 1991; Peterson and Turner 1994;
Xingzhong et al. 2005; Stewart and Downing 2008; Tong et al. 2013). Vegetation can also
lead to higher frequencies of reproduction events where better habitats provide better
protection. Moreover, the higher abundance of zooplankton may lead to a change in the
functional-feeding composition, accompanied by an increase in prey. However, in this
study we found no clear macroinvertebrate composition change with soil transfer and no
difference in functional-feeding guilds, even we observed a trend with more predators in
soil transfer blocks, and no difference in larval stage abundance among treatments. Only
one coleopteran taxon was significantly more abundant in the soil transfer blocks.
Although the statistical analyses did not detect any differences, there were 5 species only
found in soil transfer blocks that were entirely absent from the control group. Among
them, a gastropod, which does not have an aerial stage, had probably been dispersed by
the soil transfer.
In contrast to zooplankton, macroinvertebrates are highly mobile and can choose
their habitat: temperature, salinity, and habitat structure are important determinants of
whether species colonize a habitat. Despite this, our study has shown that colonization of
macroinvertebrates is not only related to habitat quality but is also a function of
stochastic dispersal processes. Moreover, even if macrophytes and zooplankton
abundance can improve habitat quality, the effect may be insufficient to attract more
macroinvertebrates. Similar results were observed with hay transfer in grassland
restoration, where grasshoppers were transferred by hay but were not able to establish

Chapter 3.2: Aquatic invertebrates of Mediterranean temporary wetland
117
permanently due to poor habitat quality on the former arable field during the initial
restoration stages (Kiehl and Wagner 2006).
The absence of a change macroinvertebrate abundance between treatments may be
partially explained by the absence of fish in the blocks. With any predator risk, the
predator protection provided by macrophytes does not play a role in macroinvertebrates
habitat selection. Another partial explanation could be isolation. Indeed, connectivity,
habitat linkage, and landscape are important for colonization. If the restored wetland is
far from a natural “source population”, colonization may occur slowly. Restoring or
creating marshes in close proximity to natural marshes should accelerate the
development of invertebrate communities (Sacco et al. 1994). The existence of a nature
reserve containing temporary wetlands less than 1 km away makes dispersal processes
possible. Wetland size can also have a limiting effect on natural macroinvertebrate
colonization (Eitam et al. 2004) . Finally, long-term monitoring can also improve the
response of macroinvertebrate communities to soil transfer. This effect is demonstrated
by the significant correlation between taxa richness of restored sites and time since
restoration (LaSalle et al. 1991; Posey et al. 1997; Dodson and Lillie 2001; Muotka et al.
2002).
The present study has shown that soil transfer does not change the richness of the
zooplankton and macroinvertebrate community. With regard to abundance, it has been
shown that soil transfer does provide assistance to many non-aerial invertebrates and can
result in an invertebrate community that is dominated by non-aerial invertebrates. At the
same time, we did not observe enhanced similarity to natural wetland in the soil transfer
blocks; rather they exhibited an overall similarity index that was nearly identical to that of
the control block. This is in contrast to previous studies in which soil transfer resulted in
elevated similarity to the natural community together with greater diversity of
zooplankton and macroinvertebrates (Brown and Bedford 1997; Brown et al. 1997; Brady
et al. 2002; Tong et al. 2013). This study leads us to ask the need of soil transfer to restore
invertebrate community.
The approach used in this paper to quantify invertebrate recruitment after wetland
creation suffers from a number of pitfalls, which can explain the absence of any
difference in similarity index between treatments. The low number of replicates can

Chapter 3.2: Aquatic invertebrates of Mediterranean temporary wetland
118
explain the weak statistical results. The taxonomic levels of zooplanktons were not very
precise, limiting the detection of differences between control and soil transfer
treatments.
3.2.4.2. Implication for restoration: choose of indicators success
Even when invertebrates have dispersal ability, the aim of favoring their colonization
with soil transfer is to avoid unwanted succession stages and to facilitate their
colonization with a “jump start” (Brady et al. 2002). Indeed, succession is dictated in part
by dispersal abilities, by suitable habitat, and also by species interactions and succession
stages, and the presence of a dominant competitor could affect the succession sequence
(Jenkins and Underwood 1998). Moreover, by using soil transferred from several donor
sites, we may increase species richness in the soil. A consequence of introducing a diverse
egg bank is a storage effect, promoting the coexistence of competing species in a
temporally variable environment (Chesson 1985). This dormant reservoir is a powerful
mechanism for maintaining species diversity within communities by promoting the
coexistence of a greater number of species. Because the technique did not achieve the
restoration goals of this study, we propose, as has also been suggested by various other
authors (Levin et al. 1996; Keesing and Wratten 1998; Brady et al. 2002), to collect and
directly transfer individuals of threatened taxa, charismatic taxa, or taxa with low
dispersal to the restored wetland. Soil transfer has the advantage of being able to handle
not only invertebrate eggs but also macrophytes propagules, which means it can be more
efficient and less expensive.
However, even though our study does not recommend active restoration for
invertebrate communities, we have certainly highlighted the importance of using multiple
indicators to assess restoration success. Previous studies have observed differences
between floristic data and fauna such as grasshoppers (Andersen et al. 2001; Wagner
2004; Kiehl and Wagner 2006) and koala (Cristescu et al. 2013), with regard to the
response to restoration measures. The observed differences indicate that the faunal
compartment does not directly reflect the flora. Flora-only based assessment of
restoration success may not accurately assess fauna recolonization. Indeed, the soil
transfer technique itself appears very efficient at restoring plant communities while being
Chapter 3.2: Aquatic invertebrates of Mediterranean temporary wetland
119
markedly unhelpful in restoring invertebrate communities (Chapter 3.1), because
spontaneous colonization appears more rapid for invertebrate. Invertebrates have been
recognized as efficient indicators of ecosystem functioning, and because ecological
restoration should have the goal of recreating the integrity of an ecosystem (National
Research Council 1992), one should not only monitor plants and abiotic parameters but
also fauna. Moreover, macroinvertebrate and zooplankton can be used as reliable
indicators of restoration impacts (Ilmonen et al. 2013).
The choice between monitoring plants and monitoring fauna will ultimately be
decided by weighing cost and efficiency. Increasing the number of indicators leads
necessarily to higher costs. However, as recommended by Cristescu and coauthors (2013),
fauna species should be directly monitored to ensure the recolonization of 1) species of
interest and 2) fauna involved in the long-term resilience of the ecosystem. At least, if
restoration projects cannot take in account other compartments than plants, the present
study has shown us to at least be extremely cautious about the interpretation of a part of
the restoration that does not reflect the nature of the entire ecosystem.

Transition to Chapter 4
120
Transition to Chapter 4
The objectives of Chapter 4 are to find out if it is possible to restore a low productive
species-rich ecosystem after cultivation and amendments, and to determine if, as it is
demonstrated in the Chapter 3.1 for aquatic plant communities, the dispersion and the
abiotic filter play the more important roles in plant community assembly.
Ecosystèmes de référence
Ecosystème dégradé
Le transfert de foin permet-il de restaurer les
communautés terrestres?
Chapitre 4
Le transfert de sol permet-il de restaurer les
communautés d’invertébrés?
Chapitre 3.2
La restauration des conditions abiotiques est-elle
suffisante?
Chapitre 2
Quel est l’écosystème de référence?
Chapitre 1
Le transfert de sol permet-il de restaurer les
communautés aquatiques?
Chapitre 3.1
Figure T4.1: Location of Chapter 4 in the general thesis organization
T.4.1. Difference between invertebrate and plant colonization
Chapter 3.1 and 3.2 shows contrasted results between plant and invertebrate
spontaneous colonization (i.e. in control blocks). The similarity index between reference

Transition to Chapter 4
121
and control block was higher for the invertebrate community (0.74±0.01) than for the
plant community (0.19±0.06), indicating that recolonization appears more rapid for
invertebrates. The reasons for this might be that invertebrates have shorter life cycles,
some may be autogamous (no need to introduce the two sexes simultaneously) and most
macro-invertebrates are mobile in at least one stage of their life cycle.
T.4.2. Plant material choice for grassland restoration
To restore temporary wetland a community, soil transfer was used (Chapter 3.1).
However for terrestrial ecosystems, soil transfer involves the destruction of the donor
ecosystem (Vécrin and Muller 2003; Jaunatre et al. 2012) and another material must be
used. The objective of Chapter 4 is to test hay transfer for grassland community
restoration.

Transition to Chapter 4
122
Plant materiel gathering in a meso-xeric grassland using a leaf blower on the vacuum position
Plant material establishment on plant material transfer block (Trifolium resupinatum,
Brachypodium distachyon, Filago pygmaea, and Scorpiurus muricatus)

Chapter 4: Creation of Mediterranean meso-xeric grassland
123
Chapter 4 - Effect of topsoil removal and
plant material transfer on vegetation
development in created Mediterranean
meso-xeric grasslands
Isabelle Muller, François Mesléard & Elise Buisson
Accepted in Applied Vegetation Science on July, 17th 2013

Chapter 4: Creation of Mediterranean meso-xeric grassland
124
4.1. Introduction
In the coastal deltaic zones of the Northern Mediterranean region, meso-xeric
grasslands are mainly located on fluvial strips and relict dunes. In the Camargue area
(Rhône delta), this habitat has the highest plant richness characterized by a high
proportion of annuals (Molinier and Tallon 1970; Braun-Blanquet 1973) and is widely used
by rare and protected fauna (Guillaume 1975). These grasslands are traditionally managed
by extensive on-and-off livestock grazing throughout the year, maintaining habitats open
and enhancing biodiversity (Mesléard et al. 1991). Without this extensive grazing, they are
colonized by Phillyrea angustifolia L., leading to a decrease in species richness due to the
dense vegetation (Mesléard et al. 1991; Mesléard et al. 2011). They are also the most
threatened habitat, essentially because of cultivation expansion (Lemaire et al. 1987).
Thus, meso-xeric grasslands are included as a priority habitat (code 6220) in the European
Union Habitats Directive (European Commission 1992). Since World War II, these
grasslands have drastically declined locally from around 4000 ha to less than 2000 ha
fragmented in small units (Mesléard et al. 2011).
Nowadays, changes in agricultural activities and the local abandonment of land
devoted to crop cultivation provide opportunities to implement restoration projects. In
this context, restoration of suitable habitats for target species has been promoted as a
conservation strategy. Restoration consists of guiding degraded ecosystems towards
target ecosystems by accelerating or by passing the intermediate stages of succession,
recreating favorable abiotic and biotic conditions which allow recolonization by native
species (Bakker et al. 1996; Society for Ecological Restoration 2004).
One of the primary factors limiting the success of restoration is often the lack of
available target seeds because of depleted seed banks and limited seed dispersal from
the surrounding landscapes (McDonald 1993; Hutchings and Booth 1996; Bakker et al.
1996; Pärtel et al. 1998; Bischoff 2002; Münzbergová and Herben 2005; Bossuyt and
Honnay 2009). Several studies have demonstrated that target vegetation is likely to be
restored when the area to restore is adjacent to natural vegetation (Mesléard et al. 1999;
Prach et al. 2001b; Řehounková and Prach 2007; Prach and Hobbs 2008; Lencová and
Prach 2011; Jírová et al. 2012) or when a relictual seed bank is present (Mesléard et al.
1995; Willems and Bik 1998). However, when the site has been subjected to a long

Chapter 4: Creation of Mediterranean meso-xeric grassland
125
cultivation period, target vegetation cannot establish through spontaneous colonization
(Prach et al. 2001b) and an input of diaspores is required (Hutchings and Booth 1996;
Bischoff 2002; Cramer et al. 2008; Prach and Hobbs 2008; Török et al. 2011b; Hölzel et al.
2012). Indeed, agricultural practices can influence plant communities by fertilization
(Bakelaar and Odum 1978; McLaughlin and Mineau 1995; Bobbink et al. 1998), ploughing
(Gibson and Brown 1992; Clements et al. 1996; Sutcliffe and Kay 2000; Dutoit et al. 2004)
and water management (Burel et al. 2008). Plant material transfer is one possible method
of re-introducing target communities. Several studies indicate that seed limitations can be
overcome successfully by plant material transfer in various situations, such as in
heathland (Pywell et al. 2011), in fen meadow (Patzelt et al. 2001; Klimkowska et al.
2010b), flood-plain meadow (Vécrin et al. 2002; Hölzel and Otte 2003; Donath et al. 2007),
or grassland restoration (Edwards et al. 2007; Kiehl et al. 2010; Coiffait-Gombault et al.
2011; Török et al. 2012).
The abiotic and biotic conditions of the site to be restored potentially represent other
key factors determining the success of restoration. In former agricultural lands where
upper soil layers contain high levels of nutrient (Marrs 1985) favoring most of the ruderal
species of the seed bank (Davy 2008; Török et al. 2011a) and increasing competition
(Marrs 2002), the establishment of oligotrophic grasslands may be compromised despite
seed addition (Gough and Marrs 1990; Pywell et al. 2003). In the process of community
assembly described by the filter model (Keddy 1992; Lortie et al. 2004; Guisan and Rahbek
2011), overcoming the dispersion filter may not be sufficient; establishment limitation of
transferred seeds can be caused by two other filters: the environmental conditions and
competition. Indeed, the successful restoration of low-productive grasslands, such as
meso-xeric grasslands, is strongly hampered by abiotic and competition constraints.
When recruitment (regional processes) is accelerated by plant material transfer, local
processes, such as competition, play a role in plant composition (Klimkowska et al.
2010b); competition is an important biotic interaction in former agricultural land, because
weed species are successful competitors more adapted to post-cultivation abiotic
conditions (Török et al. 2011a). To overcome the stage with the dominance of these
competitive species, topsoil removal has been shown to facilitate restoration, by
removing the seed bank inherited from the agricultural period and by impoverishing

Chapter 4: Creation of Mediterranean meso-xeric grassland
126
nutrient soil content (Aerts et al. 1995; Patzelt et al. 2001; Tallowin and Smith 2001; Hölzel
and Otte 2003; Allison and Ausden 2004; Buisson et al. 2006b; Buisson et al. 2008; Kiehl et
al. 2010; Klimkowska et al. 2010b; Török et al. 2011b; Jaunatre et al. 2012).
Previous studies (Patzelt et al. 2001; Hölzel and Otte 2003; Kiehl and Wagner 2006;
Rasran et al. 2007; Klimkowska et al. 2010b) showed the benefits of the combination of
topsoil removal and plant materiel transfer in different types of plant communities. In this
study, we tested the restoration of a low-productive meso-xeric grassland. We thus used
experimental on-site blocks to know if topsoil removal and plant material transfer are
sufficient to allow the establishment of the less competitive and stress-tolerant target
species. The aim is to identify future treatments suitable for application to a larger area
(several hectares). In order to reduce the impact of cultivation on sites, characterized by
nutrient-rich soils and by a soil seed bank containing undesirable species, we used topsoil
removal and plant material transfer in combination. To assess the potential role of the
present soil seed bank (i.e. inherited from cultivation) on vegetation establishment, we
tested two depths of topsoil removal. We hypothesized that increasing topsoil removal
would lead to a diminution of the soil seek bank (i.e. depletion with depth) (Grillas et al.
1993; Bonis and Lepart 1994; Bonis et al. 1995; Hölzel and Otte 2003; Rasran et al. 2007;
Klimkowska et al. 2010b) allowing improved target species establishment. The objectives
were to test: (1) the effect of two depths of topsoil removal on soil seed bank inherited
from the cultivation period; to do so, we assessed, in the greenhouse, the emergence of
the seed bank from soil samples taken at soil surface (0 to 5 cm deep) and at two
different depths of topsoil removal (5 to 20 cm deep and 20 to 40 cm deep); (2) the effect
of two depths of topsoil removal on vegetation establishment; (3) the effect of plant
material transfer on vegetation establishment; and (4) the combined effect of two
depths of topsoil removal on the success of plant material transfer; to do so, we
monitored vegetation dynamics on permanent plots with four different treatments: 5 cm
topsoil removal, 20 cm topsoil removal, 5 cm topsoil removal with plant material transfer
and 20 cm topsoil removal with plant material transfer.
4.2. Materials and methods

Chapter 4: Creation of Mediterranean meso-xeric grassland
127
4.2.1. Study site
The experiment was conducted in the Cassaïre site (c. 43°31’ N, 4°44’ E, 3 m maximum
elevation) located east of the Camargue area (Rhône delta, Southern France, Figure 4.1).
The climate is typically Mediterranean, characterized by an annual average temperature
of 15°C, an annual rainfall of 550 mm mainly concentrated in autumn, and a summer
drought.
Figure 4.1: Location of the Cassaïre site (in black) and of the meso-xeric grassland corresponding
to the reference grassland (in black). The grey shading indicates the wetlands of the Camargue
area.
For more than 60 years, the study site has been subject to rice cultivation which
definitively stopped in 2004. The technical agricultural itinerary of rice cultivation includes
plowing to a 20 cm depth in winter, soil leveling and fertilization before impoundment
and planting in April for a harvest in September (Marnotte et al. 2006).The site has been

Chapter 4: Creation of Mediterranean meso-xeric grassland
128
submitted to recurrent leveling for rice cultivation since the 1940’s, leading to the
complete elimination of the natural topography.
The reference grassland, one of the largest remaining meso-xeric grasslands (30 ha)
in the Camargue area, is located in the Tour du Valat reserve (Otero and Bailey 2003),
which is about 5 km away from the Cassaïre site (c.43°29’ N, 4°40’ E, Figure 4.1). It is
characterized by a high diversity, composed of Brachypodium phoenicoides (L.) Roem. &
Schult., Brachypodium distachyon (L.) P. Beauv., Scorpiurus muricatus L., Psilurus aristatus
(Gouan) Schinz & Thell., Filago pygmaea L., Filago vulgaris Lam., Galium murale (L.) All.,
Euphorbia exigua L., Dactylis glomerata subsp. hispanica (Roth) Nyman, Crepis sancta (L.)
Bornm. and Crepis vesicaria L.. The reference grassland is managed by traditional
extensive on-and-off livestock grazing (Mesléard et al. 2011).
The present study concerns experiments conducted in 2010 with the aim of
identifying future treatments suitable for application on a large scale. This required that
ten blocks with a gentle slope be dug (15 m long × 5 m wide × 40 cm deep at the deeper
end, Figure 4.2) on the site in December 2010. They were arranged by randomly disposed
groups of two (five groups in total). The slopes of these blocks (10 m long × 5 m wide)
were used for this experiment.
In order to investigate soil properties at various depths of topsoil removal in the
Cassaïre site, and to compare with surface soil of the reference grassland, we randomly
collected in autumn 2011 soil samples composed of 3 pooled sub-samples: five soil
samples from the surface Cassaïre site (0-10 cm), five from 40 to 60 cm deep, and four
from the surface the reference grassland (0-10 cm). Samples, composed of one liter of
soil, were dried and sieved (at 200 µm). Soil analyses were conducted by the soil analysis
laboratory of the INRA (The French National Institute for Agricultural Research, Aras,
France).
4.2.2. Plant material gathering
The reference grassland was used as a donor site for plant material. To enhance
species diversity in seeds, plant material was gathered using two techniques, commonly
used for gathering plant material for small seeding areas, at various periods:

Chapter 4: Creation of Mediterranean meso-xeric grassland
129
- the meso-xeric grassland seeds were collected using a leaf blower on the vacuum
position in mid-May, mid-June and mid-July 2010 (vacuum harvested material)
- the meso-xeric grassland vegetation was cut with a scythe and raked in mid-May 2007,
mid-May 2008 and in the beginning of September 2010 (hay)
We stored this plant material dry in 4°C until the transfer to the Cassaïre site.
Figure 4.2: Experimental design of A) one group of blocks (five in total), B) side view of one block
with the two monitoring transects and C) the top view of one block with transfer slope, the 30 ×
30 cm monitoring plots are shown. The grey color shows zone where plant material was spread.
Vegetation monitoring in this reference grassland was carried out beginning in 2001
at the beginning of May (Damgaard et al. 2010), in three randomly distributed permanent
40 × 40 cm plots. In each permanent plot, a set of two crossing lines was established to
5 m
No transferslope
Transfer slope
1 mOne group of
two blocks
Plant material
5 m
40 cm
10 m
20 cm35 cm
Transect 1Topsoil removal: 5 cm
Soil seed bank associated: 5-20 cmTransect 2
Topsoil removal: 20 cmSoil seed bank associated: 20-40 cm
6 m1 m
A. Top view of one group of blocks
B. Side view of one block
C. Top view of one block with transfer slope
Transect 1 Transect 2
2 m1.5 m 2.5 m
3 m
2 m
10 m

Chapter 4: Creation of Mediterranean meso-xeric grassland
130
indicate 36 pins set on a 3 cm pitch. Species presence was recorded on each of the 36 pins
in order to compute the species frequency, the total vegetation cover (%) and species
richness in 40 × 40 cm plots were also estimated in all plots. To evaluate the fluctuation in
vegetation in response to strong potential climate variations over the years, we
performed a Correspondence Analysis (Greenacre 1984) on the reference vegetation data
from 2007 to 2012 (the years the plant material was sampled, Figure 4.3.A), we compared
species richness (Figure 4.3.B) and total cover of vegetation (Figure 4.3.C) between years.
We observed no obvious changes in plant community composition during these 6 years
(Figure 4.3).
2007
2008
2009 2010
2011 2012
Bellis annua
Brachypodium distachyon
Brachypodium phoenicoides
Bromus hordeaceus
Bromus madritensis
Bupleurum semicompositum
Carex divisa
Centaurium tenuiflorum
Crepis vesicaria
Dactylis hispanica
Catapodium rigidum
Euphorbia exigua
Halimione portulacoides
Linum strictum
Parapholis incurva
Plantago lagopus
Scorzonera laciniata
Polygala monspeliaca
Prospero autumnale
Scorpiurus muricatus
Vulpia ciliata
Vulpia alopecuros
Trifolium tomentosum
2007 2008 2009 2010 2011 2012
010
20
30
2007 2008 2009 2010 2011 2012
020
40
60
80
100
Axis 2 = 15.5%
Axis 1 = 17.5%
X²=8.4 p=0.13 NS
Specie
srichness
(1600 c
m²)
Tota
l cover
of
vegeta
tion
(%)
X²=6.3p=0.23 NS
A. B.
C.
Figure 4.3: A) Ordination plot of the Correspondence Analysis based on species abundances (18
plots × 47 species) on the reference grassland grouped by years, 2007 to 2012. Ellipses are
centered on the barycentre and their forms are weighted by the distribution of all points
corresponding to the same year. B) Mean and standard errors of species richness (1600 cm²) of
the reference grassland in 2007 to 2012. C) Mean and standard errors of total cover of vegetation
on 1600 cm² (%) of the reference grassland in 2007 to 2012. The χ² and p-value of Kruskal-Wallis
tests performed are shown above the bars (NS: non-significant). In the interests of clarity, only
the 23 species with the higher contributions to axis are shown.

Chapter 4: Creation of Mediterranean meso-xeric grassland
131
4.2.3. Restoration treatments
In order to test the effect of topsoil removal and plant material transfer on the
establishment of plant communities, plant material was spread along the slope (Figure
4.2) of one of the two blocks of each group in January 2011 on a day without wind.
Vacuum harvested material were spread first, then hay, which, as it is heavier, allowed
reducing seed loss by strong winds, improving moisture conditions, and reducing
temperature variations. For the five slopes where plant material was transferred (the five
transfer slopes), 100 g of vacuum harvested material and 215 g of hay were applied
manually on the 2 m × 10 m area (plant material density= 15.75 g.m-2, corresponding to a
donor area to transfer area ratio of 10:1; Figure 4.2). Before spreading, the soil was lightly
harrowed perpendicularly to the slope, to aerate the soil so as to provide better
conditions for germination. The same operation was done on the other slope of each
block group where no plant material transfer was applied (the five no transfer slopes). To
limit the abundance of competitive species and to mimic the effects of the grazing that
these grasslands are typically subject to we mowed and exported the vegetation in and
around the blocks in January 2012 and in January 2013.
4.2.4. Plant material content
To assess the composition (richness and species abundance) of the plant material
collected, the same material that was spread on the slopes was also spread in a
greenhouse. Three samples of 100 g of vacuum harvested material and 215 g of hay were
spread in February 2011 in 30 x 20 cm trays filled with a substrate composed of 50%
organic soil and 50% vermiculite (inert substrate) coated with 100 micron medical gauze,
to prevent the seeds from sink into the substrate. Each plant material sample was spread
on the medical gauze and was distributed among 3 trays in order to have a fine plant
material layer which is maximally conducive to seed germination. Trays were watered
regularly and rotated with each other several times during the ten months germination
period to ensure homogeneous germination conditions for all samples. Germinated
seedlings were identified, counted and removed every week to allow germination of
other seeds. Unidentifiable plants were transferred to pots and grown until they could be
identified.
Chapter 4: Creation of Mediterranean meso-xeric grassland
132
4.2.5. Vegetation monitoring
Vegetation monitoring was carried out along two permanent transects on each slope
(Figure 4.2), one at 1 m from the top of the slope (transect 1, corresponding to 5 cm depth
topsoil removal) and one at 6 m from the top, the middle of the slope (transect 2,
corresponding to 20 cm depth topsoil removal). The vegetation survey was carried out
using 30 × 30 cm permanent plots subdivided into nine 10 × 10 cm cells (according to the
high species richness and the small minimal area, small plot sizes are usually used in the
Camargue area to monitore the Mediterranean meso-xeric grasslands, (Damgaard et al.
2010)). Three plots were distributed along each transect (Figure 4.2.C). Presence/Absence
of all species was recorded in each cell and a frequency was calculated for each species in
each plot. The total vegetation cover (%) was also estimated in all plots. Plots were
monitored in mid May 2011 (four months after the transfer), in mid May 2012 (16 months
after transfer) and in mid May 2013 (28 months after transfer). In order to compare the
vegetation between the various treatments and the reference grassland with the same
vegetation monitoring, twenty 30 × 30 cm permanent plots (also subdivided into 10 x 10
cm cells) randomly distributed on the reference grassland were monitored mid May 2010.
We used the national code of nomenclature of names for the species (Gargominy et al.
2013).
To analyze the restoration success of communities, among the all species found
(Appendix 2), we arranged the species into two categories:
1. Meso-xeric grassland target species : present at the reference grassland, corresponding
to the characteristic flora of meso-xeric grasslands (Molinier and Tallon 1970; Braun-
Blanquet 1973).
2. Non-target species: Arable weeds, ruderal or mesophyllous meadow species
germinating from the soil seed bank resulting of the agricultural past and the intensive
amendments or resident in the Cassaïre site (e.g. Rumex crispus L., Symphyotrichum
subulatum var. squamatum (Spreng.) S.D.Sundb. or Trifolium repens L.); they are usually
absent from the reference grassland or species with a wide ecological range (e.g.
Lysimachia arvensis (L.) U.Manns & Anderb., Bromus madritensis L. or Sonchus oleraceus

Chapter 4: Creation of Mediterranean meso-xeric grassland
133
L.); some may be found in the reference grassland but are not considered as target
species.
4.2.6. Cassaïre seed bank sampling
In order to determine the influence of topsoil removal on the soil seed bank and the
potential role of buried seeds in succession in the Cassaïre, we randomly collected 12 soil
samples i) from the surface (0 to 5 cm deep), ii) from 5 to 20 cm deep (corresponding to
the first transect) and iii) from 20 to 40 cm deep (corresponding to the second transect)
(Figure 4.2). For each sample composed of 3 pooled sub-samples, 1 L of soil was taken in
January 2011 and the soil seed bank was described using the seedling emergence with
sample concentration method for ten months (Ter Heerdt et al. 1996). Each sample was
cleaned with water in a 200-micron sieve in order to separate the seeds from the clay
before spreading them in 30 x 20 cm trays filled with a 50%/50% mix of organic matter and
vermiculite coated 100-micron medical gauze, to prevent the seeds from sinking into the
substrate. Germinated seedlings were identified as explained previously for the plant
material analysis experiment. Control trays filled with the same substrate and coated with
medical gauze were used in order to make sure there was no germination from the
organic matter or from accidental seed rain in the greenhouse.
4.2.7. Data analysis
In order to test the effect of the two depths of topsoil removal on soil seed bank, we
compared species richness of germinated seeds and number of seedlings between the
surface and the two depths of seed bank using analysis of variance (ANOVA) followed by
Tukey tests (Sokal and Rohlf 1995). In order to compare the composition of the surface
seed bank to the deeper seed banks, we calculated for each sample the mean Bray-Curtis
similarity index, based on frequencies (Raup and Crick 1979) between each deeper
sample and each surface sample. In order to assess surface seed bank variability, we
compared each surface seed bank sample to other surface seed bank samples. An index
of zero corresponds to an absence of species in common between the two seed banks,
while an index of 1 means that there is a similar seed bank composition. We compared the

Chapter 4: Creation of Mediterranean meso-xeric grassland
134
means of the Bray-Curtis indices across the three depths using an analysis of variance
(ANOVA) followed by Tukey tests.
In order to test the effect of the two depths of topsoil removal on vegetation
establishment with or without transfer, we compared species richness, the number of
target species and the vegetation mean percent cover between transect 1 and transect 2
of no transfer slopes and transfer slopes for the two year period using the following non-
parametric tests: Kruskal-Wallis, followed by pairwise Wilcoxon comparisons with a p-
value adjustment according to Holm’s method (Holm 1979). To analyze differences
between transect 1 and transect 2, we used non parametric multivariate analysis of
variance on vegetation data for no transfer slopes and for transfer slopes (nonparametric
MANOVA, (Anderson 2001)).
In order to test the effect of plant material transfer on vegetation establishment, we
compared the transfer slopes (transect 1 + transect 2), the no transfer slopes (transect 1 +
transect 2), and the plant material with the reference grassland. We calculated the
Jaccard similarity index based on the presence and absence of species (Jaccard 1901): an
index of zero corresponds to an absence of species in common between the treatment
(plant material content, no transfer slopes or transfer slopes) and the reference
grassland, while an index of 1 means that there is a similar vegetation composition. For
each plot surveyed on a slope, the mean Jaccard index between this plot and each plot
on the reference grassland was calculated and an average Jaccard similarity index was
calculated for each treatment. In order to assess reference grassland variability, we
compared each plot of the reference grassland with the others on the reference
grassland. When the data were conform to parametric conditions, we used ANOVA,
followed by Tukey tests, otherwise, we used a Kruskal-Wallis test, followed by a pairwise
Wilcoxon comparison employing a p-value adjustment according to Holm’s method, to
compare species richness, number of target species richness, and the means of the
Jaccard index between treatments (reference grassland, plant material content, transfer
slopes and no transfer slopes). To analyze differences between transfer and no transfer
slopes, we used nonparametric MANOVA on vegetation data in 2011, 2012 and 2013. We
performed a CA based on the presence and absence of species present in at least three

Chapter 4: Creation of Mediterranean meso-xeric grassland
135
plots in the reference grassland, in the greenhouse plant material, on the transfer slopes
in 2013, and on the no transfer slopes in 2013 (83 plots × 94 species).
All tests were performed using R 2.12.0 (R Development Core Team 2010) with a
p=0.05 threshold using the “ade4” package (Dray et al. 2007) and the “vegan” package
(Oksanen et al. 2008).
4.3. Results
4.3.1. Effects of topsoil removal on soil nutrients
Soil analyses showed significantly lower amounts of total C, organic matter and total
N in the Cassaïre deep soil from reference grassland and the Cassaïre surface (Table 4.1).
P2O5 content was significantly lower in the Cassaïre deep, close to P2O5 content in
grassland reference (Table 4.1).
Table 4.1: Mean and standard errors of nutrient contents for the surface soil (0-10 cm) of the
reference grassland and of the Cassaïre site and for the soil at 40 cm deep at the Cassaïre site (40-
60 cm). Df are the degrees of freedom, χ² and p are the chi² value and p-value of Kruskal-Wallis
tests. Values on a line with the same letter are not significantly different according to pairwise
Wilcoxon multiple comparisons with Holm p adjustment.
4.3.2. Effects of topsoil removal on seeds germinating from the seed bank (greenhouse)
In total 41 species germinated from the soil seed bank (Appendix 2), representing a
total of 5102 seedlings. The number of seedlings of the soil seed bank declined
significantly when going from 0-5 cm and from 5-20 cm of topsoil removal (209±34 per
liter without topsoil removal vs. 119±19 per liter after 5 cm topsoil removal; Figure 4.4.A).
df p-value Reference grassland Surface Cassaïre site Depth Cassaïre site
Total C (g.kg-1) 2 < 0.05 26.95±7.58 a 19.75±1.08 a 4.81±0.80 b
Total N (g.kg-1) 2 < 0.05 2.46±0.91 a 1.67±0.07 a 0.31±0.05 b
OM (g.kg-1) 2 < 0.05 46.67±13.10 a 34.15±1.86 a 8.31±1.37 b
P2O5 (g.kg-1) 2 < 0.05 0.01±0.00 a 0.09±0.01 b 0.02±0.01 a
CaO (g.kg-1) 2 = 0.17 10.29±0.81 a 9.97±0.16 a 9.51±0.13 a
MgO (g.kg-1) 2 = 1.00 0.48±0.20 a 0.39±0.09 a 0.39±0.08 a
K2O (g.kg-1) 2 = 0.055 0.33±0.12 a 0.34±0.06 a 0.09±0.02 a
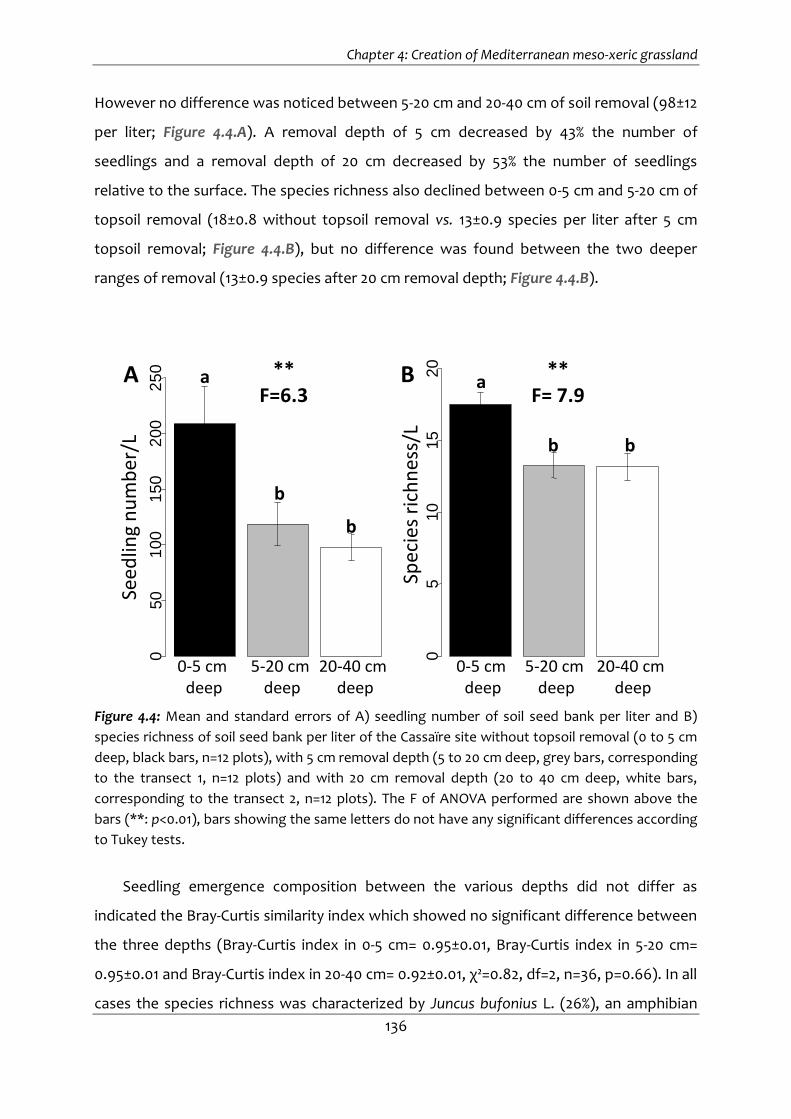
Chapter 4: Creation of Mediterranean meso-xeric grassland
136
However no difference was noticed between 5-20 cm and 20-40 cm of soil removal (98±12
per liter; Figure 4.4.A). A removal depth of 5 cm decreased by 43% the number of
seedlings and a removal depth of 20 cm decreased by 53% the number of seedlings
relative to the surface. The species richness also declined between 0-5 cm and 5-20 cm of
topsoil removal (18±0.8 without topsoil removal vs. 13±0.9 species per liter after 5 cm
topsoil removal; Figure 4.4.B), but no difference was found between the two deeper
ranges of removal (13±0.9 species after 20 cm removal depth; Figure 4.4.B).
Figure 4.4: Mean and standard errors of A) seedling number of soil seed bank per liter and B)
species richness of soil seed bank per liter of the Cassaïre site without topsoil removal (0 to 5 cm
deep, black bars, n=12 plots), with 5 cm removal depth (5 to 20 cm deep, grey bars, corresponding
to the transect 1, n=12 plots) and with 20 cm removal depth (20 to 40 cm deep, white bars,
corresponding to the transect 2, n=12 plots). The F of ANOVA performed are shown above the
bars (**: p<0.01), bars showing the same letters do not have any significant differences according
to Tukey tests.
Seedling emergence composition between the various depths did not differ as
indicated the Bray-Curtis similarity index which showed no significant difference between
the three depths (Bray-Curtis index in 0-5 cm= 0.95±0.01, Bray-Curtis index in 5-20 cm=
0.95±0.01 and Bray-Curtis index in 20-40 cm= 0.92±0.01, χ²=0.82, df=2, n=36, p=0.66). In all
cases the species richness was characterized by Juncus bufonius L. (26%), an amphibian
05
01
00
15
02
00
25
0
05
10
15
20
5-20 cmdeep
20-40 cm deep
5-20 cmdeep
20-40 cm deep
Seed
ling
nu
mb
er/L
**F=6.3
a
b
b
Spec
ies
rich
nes
s/L
**F= 7.9
a
b b
A B
0-5 cmdeep
0-5 cmdeep

Chapter 4: Creation of Mediterranean meso-xeric grassland
137
annual species present on wet sandy substrates in the Camargue area but favored by rice
cultivation, Ammannia χ coccinea Rottb. (12%), Lindernia dubia (L.) Pennell (9%) and
Cyperus difformis L. (9%) three typical exotic ricefield weeds, and Trifolium repens L. (10%).
We found 1 seedling each of meso-xeric grassland target species Plantago coronopus L.,
Trifolium campestre Schreb., Carex divisa Huds., Medicago polymorpha L. and Centaurium
spicatum (L.) Fritsch ex Janch.. No other seedling of target species of meso-xeric
grassland was recorded.
4.3.3. Effects of topsoil removal on spontaneous vegetation development: comparing
transects on no transfer slopes
Only one target species, Plantago coronopus L. present in the soil seed bank, was
recorded in the no transfer slopes in 2011 and in 2012 (Figure 4.5.C) and the vegetation
was significantly different from the reference grassland as determined by species
richness, which was lowest in the no transfer slopes (F=38.4, df=7, n=203, p<0.001; Figure
4.5.A) and by the Jaccard similarity index (χ²=113.6, df=7, n=203, p<0.001; Figure 4.5.B).
In the first year of monitoring, we found a significant decrease in plant species
richness with increasing topsoil removal (11.6±0.6 for transect 1 vs. 5.3±0.7 for transect 2,
χ²=51.1, df=11, n=180, p<0.001; Figure 4.6.A), but we found no difference in vegetation
cover (Figure 4.6.C). In the second and the third year of monitoring, we found no
significant difference in species richness (Figure 4.6.A), or in vegetation cover (Figure
4.6.C) between the two transects. The MANOVA performed on the species abundances in
2013 indicated no differences between the two transects in no transfer slopes (df=1, F=1.1,
p=0.3). The composition in the no transfer treatment was similar in the two transects, and
characterized by mesophyllous species Polygonum aviculare L. (9%) and Trifolium repens L.
(7%) in the first year, by Lolium rigidum Gaudin (8%) and Poa trivialis L. (6%) in the second
year and by Lotus corniculatus subsp. tenuis (Waldst. & Kit. ex Willd.) Berher (7%) and
Lolium rigidum Gaudin (6%) in the third year, which are five species present in the soil seed
bank and in the Cassaïre vegetation.

Chapter 4: Creation of Mediterranean meso-xeric grassland
138
Figure 4.5: Mean and standard errors of A) species richness (900 cm²), B) Jaccard similarity index
and C) target species richness (900 cm²) for the reference grassland in 2010 (black bars, n=20
plots), plant material (dark grey, n=3 plots), transfer slopes in 2011 (light grey bars, n=30 plots),
transfer slopes in 2012 (light grey bars, n=30plots), transfer slopes in 2013 (light grey bars,
n=30plots), no transfer slopes in 2011 (white bars, n=30 plots), no transfer slopes in 2012 (white
bars, n=30 plots) and no transfer slopes in 2013 (white bars, n=30plots). Df are the degrees of
freedom. The F of ANOVA or the χ ² of Kruskal-Wallis tests performed are shown above the bars
(***: p<0.001), bars showing the same letters do not have any significant differences according
Tukey test or to pairwise Wilcoxon multiple comparisons with Holm p adjustment.
4.3.4. Seed content in plant material (greenhouse)
A total of 4550 (±184) individuals representing 38 (±5) species, almost all included in
the meso-xeric grassland target species category, were found in the plant material
(Appendix 2). Plant material composition was characterized by Brachypodium distachyon
(L.) P. Beauv. (40%), Bromus hordeaceus L. (23%) and Parapholis incurva (L.) C.E. Hubb.
010
20
30
40
50
0.0
0.2
0.4
010
20
30
40
Sp
ecie
sri
ch
ne
ss
(90
0 c
m²)
Ja
cca
rdsim
ilari
ty
ind
ex
Ta
rge
t sp
ecie
s
richn
ess
(90
0 c
m²)
F=38.4, df=7, ***
X²=155.1, df=7, ***
Reference
grassland
Plant
material2011 2012
Transfer slopes No transfer slopes2013 2011 2012 2013
A
B
C
2011 2012Transfer slopes No transfer slopes
2013 2011 2012 2013
2011 2012Transfer slopes No transfer slopes
2013 2011 2012 2013
a
b
cd cd d d d
X²=113.6, df=7, ***
a
a
b c bcd d d
b
c c ca
d d dReference
grassland
Plant
material
Reference
grassland
Plant
material

Chapter 4: Creation of Mediterranean meso-xeric grassland
139
(14%). The vegetation of the reference grassland was characterized by Bellis annua L. (8%),
Brachypodium phoenicoides (L.) Roem. & Schult. (8%) and Scorpiurus muricatus L. (7%).
This change in composition between the plant material and the reference grassland was
revealed in the CA based on the presence of the species (Figure 4.7). The first axis of the
CA (20.1%) did not indicate a difference in composition between the two communities, but
the second axis of the CA (7.5%) discriminated the plant material from the reference
grassland. These results were confirmed with the significant difference in plant species
richness between the reference grassland and the plant material (37.7±5.0 for plant
material vs. 25.7±1.1 for reference grassland; Figure 4.5.A). However, we found no
significant difference in the number of target species (33.7±4.4 for plant material vs.
22.8±0.9 for reference grassland; Figure 4.5.C) between the reference grassland and the
plant material.
4.3.5. Effects of plant material transfer on vegetation development: comparing no
transfer slopes and transfer slopes
In the first year of monitoring, plant species richness significantly increased with
plant material transfer (16.0±1.4 species and 8.5±0.9 species on the transfer slopes and
the no transfer slopes respectively) but was significantly lower than the species richness
of the reference grassland and of the plant material (F=38.4, df=7, n=203, p<0.001; Figure
4.5.A). A few months after the transfer, transfer treatment had already increased the
number of target species which accounted for 46% of all the species found (7.4±0.8 target
species in the transfer slopes vs. and 0.03±0.03 in the no transfer slopes) but was still
lower to the ones of the reference grassland and the plant material (χ²=155.1, df=7, n=203,
p<0.001; Figure 4.5.C). In the first year, the vegetation where plant material was
transferred was characterized by two target species Brachypodium distachyon (L.) P.
Beauv. (7%) and Bromus madritensis L. (6%) and by Polygonum aviculare L. (7%). However,
in the second year of monitoring, the vegetation where plant material was transferred
was no longer characterized by target species and was instead characterized by
mesophyllous meadow species Lolium rigidum Gaudin (8%) and by Polygonum aviculare L.
(5%). The plant species richness (10.8±0.9 species, F=38.4, df=7, n=203, p<0.001; Figure
4.5.A) and the number of target species (4.0±0.5 target species, χ²=155.1, df=7, n=203,

Chapter 4: Creation of Mediterranean meso-xeric grassland
140
p<0.001; Figure 4.5.C) were significantly lower compared to the first year, even when the
contribution of target species to species richness was still high (37%). In the third year, the
species richness (11.6±1.6) and the number of target species (5.2±1.0, with a contribution
to species richness reaching 45%) in plant material transfer did not show significant
differences with the second year (Figure 4.5.A and Figure 4.5.C) and were still
characterized by mesophyllous meadow species Trifolium repens L. (13%) and Poa trivialis
L. (6%). The increase in species richness in transfer slopes the first year compared to no
transfer slope no longer appeared the second and the third years. No more significant
difference was observed in the species richness between the second and the third years
and between the two treatments (Figure 4.5.A). However, the Jaccard similarity index
and the number of target species were significantly higher in the transfer slopes
compared to those on the no transfer slopes over the three years (Figure 4.5.B and Figure
4.5.C). The nonparametric MANOVA showed that plant material transfer treatment
modified significantly plant community compositions between transfer and no transfer
slopes the three years (df=1, F=6.2, p=0.001 for the third year). The CA based on the
presence of the species highlights these mixed results (a decrease in species richness
over years but a higher number of target species in the transfer treatment). The first axis
of the CA (20.1%, Figure 4.7) discriminated the plant material and the reference grassland
composition from the transfer treatment and the no transfer treatment. The transfer
treatment occupied an intermediate position between the no transfer and the reference
grassland/plant material grown in the greenhouse, containing both meso-xeric grassland
target species and non-target species. The trajectories of their barycenter showed very
slow dynamics between the first and the second year, highlighting a convergence
towards the no transfer vegetation and then a higher divergence from the reference
grassland, confirming that the number of target species decreased in the second year.
The trajectories of their barycenter between the second and the third year suggested a
convergence toward the reference grassland which may be explained by the high
contribution of the target species the third year. Concerning the no transfer plot, no
changes were observed in species richness and plant composition from the first to the
third year (Figure 4.5.A and Figure 4.5.B).

Chapter 4: Creation of Mediterranean meso-xeric grassland
141
Figure 4.6: Mean and standard errors of A) species richness (900 cm²), B) target species richness
(900 cm²) and C) total cover of vegetation on 900 cm² (%) for the transect 1 (T1) of transfer slopes
in 2011 (grey bars, n=15 plots), in 2012 (grey bars, n=15 plots), in 2013 (grey bars, n=15 plots), for the
transect 2 (T2) of transfer slopes in 2011 (shaded grey bars, n=15 plots), in 2012 (shaded grey bars,
n=15 plots), in 2013 (shaded grey bars, n=15 plots), for the transect 1 (T1) of no transfer slopes in
2011 (white bars, n=15 plots), in 2012 (white bars, n=15 plots), in 2013 (white bars, n=15 plots), for
the transect 2 (T2) of no transfer slopes in 2011 (shaded white bars, n=15 plots), in 2012 (shaded
white bars, n=15 plots), in 2013 (shaded white bars, n=15 plots). Df are the degrees of freedom.
The χ² of Kruskal-Wallis tests performed are shown above the bars (***: p<0.001). Within each
treatment to compare transects, asterisks indicate significant differences according to pairwise
Wilcoxon multiple comparisons with Holm p adjustment (*: p<0.05 and NS: p>0.05).
4.3.6. Effects of topsoil removal on plant material transfer: comparing transects on
transfer slopes
We found no difference between the two transects in plant species richness over the
three year (17.0±2.2 for transect 1 vs. 15.0±1.7 for transect 2 in 2011, 10.3±1.2 for transect 1
05
10
15
20
02
46
810
020
40
60
80
120
AS
pe
cie
sri
ch
ne
ss
(90
0 c
m²)
To
tal co
ve
ro
f
ve
ge
tatio
n(%
)
Ta
rge
t sp
ecie
s
rich
ne
ss
(90
0 c
m²)
B
C
Transfer
Slopes 2011
No transfer
slopes 2013
T 2T 1 T 2T 1 T 2T 1 T 2T 1 T 2T 1 T 2T 1No transfer
slopes 2012
No transfer
slopes 2011
Transfer
Slopes 2012
Transfer
Slopes 2013
Transfer
Slopes 2011
No transfer
slopes 2013
T 2T 1 T 2T 1 T 2T 1 T 2T 1 T 2T 1 T 2T 1No transfer
slopes 2012
No transfer
slopes 2011
Transfer
Slopes 2012
Transfer
Slopes 2013
Transfer
Slopes 2011
No transfer
slopes 2013
T 2T 1 T 2T 1 T 2T 1 T 2T 1 T 2T 1 T 2T 1No transfer
slopes 2012
No transfer
slopes 2011
Transfer
Slopes 2012
Transfer
Slopes 2013
X²=116.5, df=11, ***
X²=41.8, df=11, ***
X²=51.1, df=11, ***
NS NS NS NS NS*
NS NS NS
NS NSNS
NS NS NSNS
NSNS

Chapter 4: Creation of Mediterranean meso-xeric grassland
142
vs. 11.3±1.4 for transect 2 in 2012, and 13.8±2.3 for transect 1 vs. 11.2±1.4 for transect 2 in
2013; Figure 4.6.A) and in the number of target species (7.5±1.1 target species for transect
1 vs. 7.4±1.2 for transect 2 in 2011, and 4.3±0.6 for transect 1 vs. 3.7±0.8 for transect 2 in
2012, and 7.0±1.3 for transect 1 vs. 4.7±0.7 for transect 2 in 2013; Figure 4.6.B) during the
three years.
Plant material
Reference
grassland
Transfer
slopes
No transfer
slopes
Symphyotrichum subulatum
Bellis annuaBrachypodium distachyon
Brachypodium phoenicoidesBromus diandrus
Chenopodium album
Cirsium arvense
Crepis sancta
Filago pygmaea
Galium murale
Hordeum murinum
Lactuca serriola
Leontodon tuberosus
Lolium rigidum
Lotus corniculatus
Helminthotheca echioides
Plantago lanceolata
Plantago major
Poa trivialisRumex crispus
Scorpiurus muricatus
Trifolium repens
Bromus hordeaceus
Elytrigia atherica
Lactuca saligna
Limonium narbonense
Medicago lupulina
Parapholis incurva Poa annua
1st1st
3rd
2nd
3rd
2nd
Axis 2 = 7.5%
Axis 1 = 20.1%
Figure 4.7: A) Ordination plot of the Correspondence Analysis based on species presence/absence
of the 28 species present in at least 3 plots (83 plots × 94 species) on reference grassland (dark,
20 plots), plant material (dark grey, 3 plots), transfer slopes in 2013 (grey, 30 plots) and no
transfer slopes in 2013 (light grey, 30 plots). Dark lines represent the succession of vegetation
from 2011 to 2012 (1st to 2nd year), and from 2012 to 2013 (2nd to 3rd year), for transfer slope and
no transfer slope, according to the position of their barycenter. In the interests of clarity, only the
50 species with the higher contributions to axis are shown.

Chapter 4: Creation of Mediterranean meso-xeric grassland
143
The vegetation mean percent cover did not differ between the two transects in the
first, the second, and the third years of monitoring (Figure 4.6.C). The MANOVA
performed on the species abundances in 2013 confirmed these results and indicated no
difference between the vegetation composition on transect 1 from the vegetation
composition on transect 2 in transfer slopes (df=1, F=1.3, p=0.3).
4.4. Discussion
4.4.1. Effects of plant material transfer
The knowledge of the potential seed sources of target species in the site to-be-
restored is an essential information in restoration ecology (Willems and Bik 1998). In our
study site, spontaneous succession on the no transfer slopes and on-site seed bank do
not indicate any potential for the establishment of target species. These results are in
accordance with previous studies on former cultivation which found a low or null
potential of seed banks for restoration, mainly containing ruderal seeds (Hutchings and
Booth 1996; Prach et al. 2001b; Buisson et al. 2006b; Török et al. 2011a). In the present
study, plant material transfer appeared to be an effective method to overcome the
dispersal limitations of target species from the reference plant community. Species from
transferred plant material contributed to 46% of the species richness per plot the first
year of monitoring, to 37% the second year and to 45% the third year. This transfer rate is
in the range of what has already been observed in previous plant material transfer studies
(e.g. 64% the first year of transfer and 49% four years after the transfer in (Hölzel and Otte
2003). However, this relative high contribution of target species the third year, also
corresponded to a significant decreasing of the species richness and the number of target
species between the first and the second years and a stabilization between the second to
the third year. This decrease led to the lack of difference in the species richness with the
no transfer slopes over the years. This type of decrease has been reported in a few
studies, showing that both the similarity with the reference community and the species
richness declined after a few years (Pywell et al. 2007; Klimkowska et al. 2010b).
Nevertheless, most studies on transfer experiments, found that the number of target
species increased along with species richness whereas non-target species, such as

Chapter 4: Creation of Mediterranean meso-xeric grassland
144
pioneer species or arable weeds, dominating the vegetation immediately after the plant
materiel transfer, declined the following years (Kirmer and Mahn 2001; Hölzel and Otte
2003; Kiehl and Wagner 2006; Donath et al. 2007; Rasran et al. 2007; Coiffait-Gombault et
al. 2011). Those studies suggested that the initial phase of succession does not determine
the final community, and that, despite competition, transfer may limit the recruitment of
non-target species from the seed bank by establishing a target vegetation. In our study,
despite the decrease in the number of target species, one new target species appeared
the second year (Hedypnois cretica (L.) Dum.Cours.) and another new one the third year
(Torilis nodosa (L.) Gaertn.).This weak second phase of recruitment might be explained by
the fact that some species present in the plant material require specific conditions to
germinate or develop much slower. In previous plant material experiments (Hölzel and
Otte 2003; Donath et al. 2007), some target species first appeared several years after the
transfer, indicating a longer seed dormancy or hard-to-meet germination conditions.
Obviously, germination conditions in the greenhouse (favorable temperature and water
regime, lack of competition) allowed the expression of many more seeds and species
than in the field.
The decrease in species between 2011 and 2012 might be also explained by
differences in weather conditions between the two years. Indeed, drought can reduce
species richness in grassland communities (De Boeck et al. 2008). In contrast, Török et al.
(Török et al. 2012) indicated that high precipitation might have altered the competitive
environment favoring the establishment of some target species. However, our
vegetation monitoring in the reference grassland and in the no transfer treatment, did
not show a decrease in species richness between 2011 and 2012 (Figure 4.3.B), indicating
that the decrease was probably not due to differences in weather conditions.
The decrease might also partially be caused by the increase in competition and the
influence of local processes (Kiehl and Wagner 2006; Klimkowska et al. 2010b). Seed
limitation is not always the only limiting factor in species establishment (Turnbull et al.
2000; Mouquet et al. 2004; Clark et al. 2007; Myers and Harms 2009); the successful
establishment of many plant species depends on more than simply germination
conditions. Other factors, in particular competition, can influence community assembly.
Non-target species, such as mesophyllous meadow or ruderal species resident in the

Chapter 4: Creation of Mediterranean meso-xeric grassland
145
Cassaïre site and in the seed bank, can have a negative effect on the germination and
growth of target species transferred with the plant material, because the latter are less
competitive. This decrease can be partially explained by the inadequate timing of the
management: mowing was only performed quite late following the plant material
transfer (one full calendar year later). Moreover, grazing has several advantages for
grassland restoration compared to mowing (Török et al. 2011b) and the Mediterranean
meso-xeric grasslands in the Camargue area are managed by traditional extensive on-and-
off livestock grazing throughout the year for conservation purposes, maintaining open
habitats (Peco et al. 1998). Grazing management similar to that applied on the reference
grassland is required. By controlling competition, plant biomass removal by grazing can
increase species richness and change the competitive interactions in favor of smaller,
stress-tolerant species (Lepš 1999; Bakker et al. 2006; Pywell et al. 2007; Rasran et al.
2007; Myers and Harms 2009). Grazing is known to be an efficient tool in maintaining a
grassland community (Hölzel and Otte 2003; Walker and Desanker 2004; Rasran et al.
2007; Klimkowska et al. 2010b). It can reduce the abundance of ruderal, competitive, and
mesophyllous meadow species, which leads to an increase in the abundance of rare
species (Woodcock et al. 2005). It also creates, through trampling, micro-sites which
increase recruitment opportunities for immigrating species (Bakker et al. 2006; Myers and
Harms 2009). Although the percentage of target species remained stable in the
vegetation over the third year of monitoring, the initial decrease in species richness
suggests a future dominance of competitive species, which may form dense compact
cover rarely outcompeted by other species, and may lead to the disappearance of target
species without appropriate management. In this study, we deliberately introduced
mowing late after the plant material transfer, to allow target vegetation to establish and
not to disturb the reproductive cycle of some of these species which are annual. Indeed,
grazing and mowing could have hampered restoration and negatively affected the target
vegetation (Török et al. 2011b). The timing of grazing/mowing is crucial in influencing the
success of restoration and appears as a compromise between the establishment of target
species and the control of the non-target species. By delaying the management, we
probably facilitated the competition of the non-target species of the soil seed bank.

Chapter 4: Creation of Mediterranean meso-xeric grassland
146
4.4.2. Effects of topsoil removal
The success of plant material transfer usually increases when it is applied in
conjunction with topsoil removal which creates favorable conditions for seedling
recruitment. It limits the proportion of unwanted plant species, such as arable weeds and
common meadow species and then favors the establishment of target species (Patzelt et
al. 2001; Hölzel and Otte 2003; Kiehl and Wagner 2006; Pywell et al. 2007; Klimkowska et
al. 2010b; Jaunatre et al. 2012). Topsoil removal generally also leads to a reduction in non-
target species by reducing the seed bank and limiting the immediate reinvasion and
colonization by non-target plants from the seed bank. The resulting presence of bare soil
allows for the establishment and maintenance of the oligotrophic target community
(Patzelt et al. 2001; Allison and Ausden 2004; Kiehl et al. 2010). A clear example of the
importance of these factors can be found in abandoned cultivation sites, where the seed
bank can indirectly control the establishment of target species because of the abundance
of competitive or ruderal species (Lepš 1999; Hölzel and Otte 2003; Kiehl and Wagner
2006; Pywell et al. 2007; Standish et al. 2008; Baer et al. 2009). In our case, we found no
significant difference on the number of seedlings and the species richness in the seed
bank between 5 cm and 20 cm. This vertical homogenization of the seed bank can be
explained by the technical rice cultivation practices, which included a 20 cm deep
plowing. In Hölzel & Otte (2003), soil seed bank was completely eliminated at 50 cm deep
in a former arable field. In most studies, the removal of the upper 30-50 cm ensures
favorable conditions for restoration (Rasran et al. 2007; Klimkowska et al. 2010b; Török et
al. 2011b). However, a topsoil removal at such depth can be too expensive to be used on
large areas.
On our study site, the initial hypothesis of a decrease in vegetation cover, of a
limitation of the competition and of an increase in the plant material transfer efficiency
with increasing depth of topsoil removal was not confirmed, because of the lack of an
appreciable difference in soil seed bank between 5 cm and 20 cm. Differing from our
results, Klimkowska et al. (2010b) found that vegetation in the deep removal treatment
with hay addition were more similar to the reference vegetation that shallow removal
treatment with hay.

Chapter 4: Creation of Mediterranean meso-xeric grassland
147
Forty cm depth topsoil removal resulted in a significant reduction of P2O5, organic
matter, total C and total N. Topsoil removal therefore decreased the nutrient content,
which is in agreement with similar experiments (Aerts et al. 1995; Patzelt et al. 2001;
Tallowin and Smith 2001; Hölzel and Otte 2003; Allison and Ausden 2004; Buisson et al.
2006b; Buisson et al. 2008; Kiehl et al. 2010; Jaunatre et al. 2012). Cultivation practices
induce severe constraints on community re-assembly (Gough and Marrs 1990; Pywell et
al. 2003) and despite seed addition, species of oligotrophic grasslands establish poorly in
excessively high-fertility conditions (Pywell et al. 2003) as they require nutrient-poor site
conditions to establish themselves successfully (Temperton et al. 2012). Topsoil removal
appears to be an efficient method of improving the environmental conditions while
mitigating competition by reducing seed bank for reinstalling meso-xeric grasslands on
abandoned farmland.
Three years after the application of the combination of the two treatments, the
restored plant communities are still very different from our target community. However,
these restoration treatments increased the number of target species and enhanced the
similarity to the reference grassland. They might help to bypass some of the early stages
of natural succession. Over the three years, the vegetation cover increased (from 35% to
86%; Figure 4.6.C) potentially slowing the spontaneous recruitment of target species. The
introduction of target species in the early stages of succession allowed their presence in
the community. This presence could play a major role in the development of community.
Indeed, some restoration projects have already tested the priority effect of target species
(foundation or structural species) in grasslands (Coiffait-Gombault et al. 2012) or wetlands
(Collinge and Ray 2009). In our study, Brachypodium distachyon (L.) P. Beauv. which is
common on the reference grassland, abundantly appeared the first year of monitoring in
the transfer treatment, and could thus be a key species which help to improve restoration
by accelerating the achievement to the full target community.
Our study showed that some meso-xeric grassland target species can be
reintroduced on a former ricefield by a combination of low topsoil removal and plant
material transfer. This is in accordance with other studies (Patzelt et al. 2001; Hölzel and
Otte 2003; Kiehl and Wagner 2006; Rasran et al. 2007; Klimkowska et al. 2010b)
demonstrating that these two methods are complementary, involving different processes
Chapter 4: Creation of Mediterranean meso-xeric grassland
148
of community assembly: plant material transfer overcomes the dispersion filter and
topsoil removal guarantees better abiotic and biotic conditions.
Although most studies on topsoil removal have shown that deeper topsoil removal is
more appropriate for target species establishment (Hölzel and Otte 2003; Rasran et al.
2007; Klimkowska et al. 2010b), our study does not discriminate the two different topsoil
removal depths in term of soil seed banks (species richness and number of seedlings),
resulting in lack of difference for species richness and target species number between the
two topsoil removal depth. Taking in account the high cost of this method (Klimkowska
et al. 2010a), we suggest to look the seed bank before choosing the thickness of topsoil
to remove as in our case, 5 cm were sufficient to eliminate half of the undesired seed
bank. However without seed addition, spontaneous succession did not provide successful
results. Plant material plays an important role in the early community assembly processes
and speeds up the establishment of target species. Harvesting at different times during
all the flowering period and with different methods (mowing and vacuuming) allowed us
to have a good plant material quality (Stevenson et al. 1995), maximizing the number of
target species, containing the early and the late flowering species, with a composition
closer to that of the donor site. In order to do restoration on large area, plant material
may be collected by harvesting machines (Kiehl et al. 2010). The densities used in our pilot
experiment corresponds to 150 kg of material per hectare, which is a much higher
quantity than in most plant material transfer studies (Török et al. 2011b). In order to limit
the quantity of material and thus reducing the harvest effort, the relevancy to transfer
plant material by only small patches, functioning as species-rich sources for spontaneous
colonization of nearby areas, might be used (Rasran et al. 2007; Török et al. 2011b). This
method is currently tested on the Cassaïre site especially to evaluate the consequences of
the existence of patches without material spread which could be, a contrario, windows of
colonization for undesirable species.
To be effective at restoring large scale Mediterranean meso-xeric grassland, plant
material transfers must therefore be combined with an appropriate grazing
management. Grazing has played a major role in the reference grassland structuring the
plant community over time, and is probably essential to maintain a good trajectory to
obtain on the site in current restoration the desired vegetation in the mid-or long term.

Transition to Discussion
149
Transition to Discussion
Chapter 3 and Chapter 4 assessed techniques for meso-xeric grassland and temporary
wetland restoration in small-scale experiments. They showed some positive effects on
the two ecosystems even it is more obvious for the temporary wetland. In April 2012,
several complementary experiments were carried out on a large scale in order to assess
the efficiency of these techniques at the ecosystem scale. Restoration techniques were
adapted to the operational scale to try to mitigate the costs of restoration without
affecting restoration success: the density of plant material transfer and the area of
inoculation (i.e. introduction design) were tested in large scale. The large scale
experiments were monitored in June 2012, but were not presented in this thesis.
Nevertheless, we can provide a summary of preliminary results concerning i) the transfer
of restoration techniques tested and approved in Chapter 3 and Chapter 4 to the
operational scale, ii) the effect of various plant material density for grassland community,
iii) the effect of area of inoculation and iv) the potential priority effects detected on this
scale for the grassland community.
TD.1. Effect of introduction design on the temporary wetland
The same soil used in the block experiments (Chapter 3) was inoculated on plots of 6
m × 6 m according to the following four treatments (Figure TD.1): inoculated on 100% of
the area (72 liters of soil inoculated in the whole plot), inoculated on 1/3 of the area on
two strips (36 liters of soil spread over two 1-m wide and 6-m long strips , spaced by 1.5 m
from the edge of the plot and by 1 m between each other), inoculated on 1/3 of the area
on one strip (36 liters of soil spread over one 2-m wide and 6-m long strip, 2 m from the
edge of the plot) and control (not inoculation) with five replicates per treatment. The
twenty plots were disposed randomly to the 4000m² restored area. The inoculation was
done in April 2012.
Vegetation surveys were carried out using nine 2 m × 2 m quadrats in June 2012 (2
months after soil inoculation) and May 2013 (13 months after soil inoculation), covering
the whole plots, recording the presence/absence of all species, and an average of the
species richness on the nine quadrats was calculated.
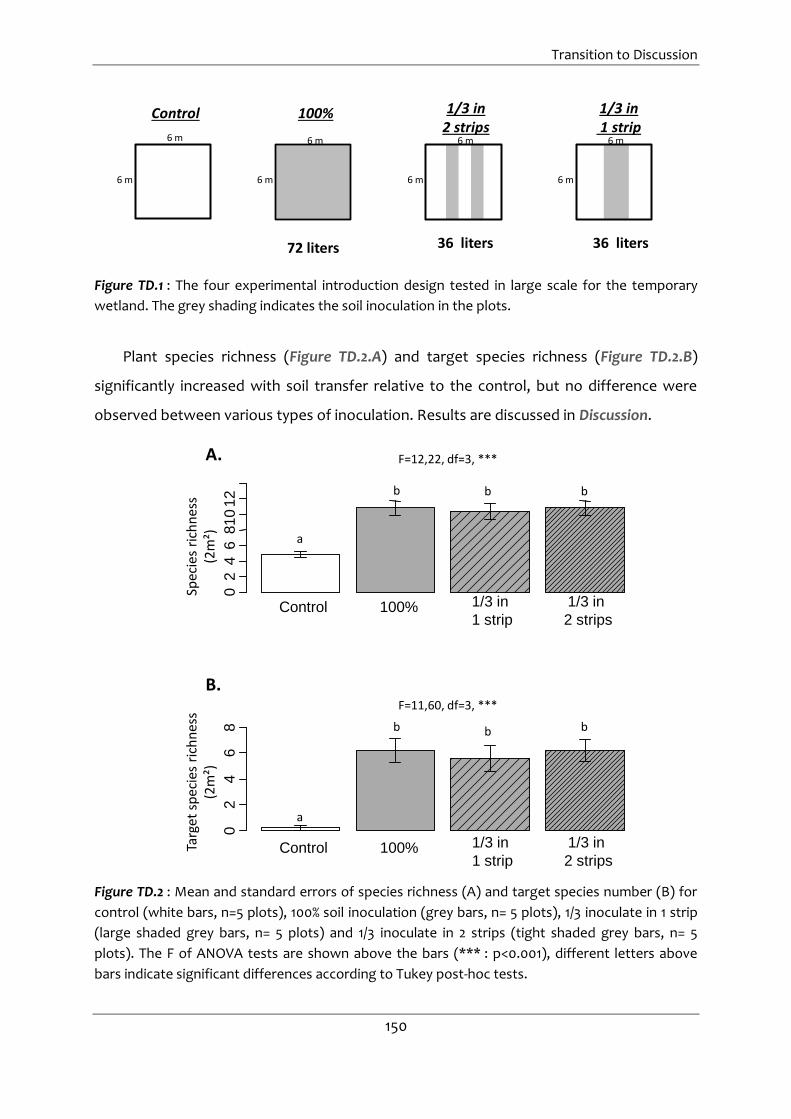
Transition to Discussion
150
6 m
6 m
6 m
6 m
6 m
6 m
72 liters 36 liters 36 liters
1/3 in 2 strips
1/3 in 1 strip
100%
6 m
6 m
Control
Figure TD.1 : The four experimental introduction design tested in large scale for the temporary
wetland. The grey shading indicates the soil inoculation in the plots.
Plant species richness (Figure TD.2.A) and target species richness (Figure TD.2.B)
significantly increased with soil transfer relative to the control, but no difference were
observed between various types of inoculation. Results are discussed in Discussion.
Control 100% 1/3 in
1 strip
1/3 in
2 strips
02
46
812
02
46
8
Control 100% 1/3 in
1 strip
1/3 in
2 strips
10
Spec
ies
rich
nes
s(2
m²)
Targ
et s
pec
ies
rich
nes
s(2
m²)
F=12,22, df=3, ***
F=11,60, df=3, ***
a
b b b
a
b b b
A.
B.
Figure TD.2 : Mean and standard errors of species richness (A) and target species number (B) for
control (white bars, n=5 plots), 100% soil inoculation (grey bars, n= 5 plots), 1/3 inoculate in 1 strip
(large shaded grey bars, n= 5 plots) and 1/3 inoculate in 2 strips (tight shaded grey bars, n= 5
plots). The F of ANOVA tests are shown above the bars (*** : p<0.001), different letters above
bars indicate significant differences according to Tukey post-hoc tests.

Transition to Discussion
151
TD.2. Effect of introduction design and density on the meso-xeric grassland
In addition to the experimental introduction design, two plant material densities
were tested, a high density (DF = 43.4g / m²) and low density (df = DF / 2 = 21.7g / m²). The
same plant material as the one used in the block experiments (Chapter 4) was inoculated
on plots of 3 m × 3 m according to the following seven treatments (Figure TD.3):
inoculated on 100% of the area (196 g of plant material inoculated on the whole plot),
inoculated on half of the area in two strips (98 g of plant material over two 0.75-m wide
and 3-m long strips, spaced by 0.5 m from the edges of the plot and by 0.5 m between
each other), inoculated on half of the area on one strip (98 g of plant material over one
1.5-m wide and 3-m long strip, 0.75 m from the plot edges) at low density and inoculated
on 100% of the area (391 g on the whole plot), inoculated on half of the area in two strips
(196 g over two 0.75-m wide and 3-m long strips, spaced by 0.5 m from the plot edges and
by 0.5 m between each other), inoculated on half of the area on one strip (196 g over one
1.5-m wide and 3-m long strip, 0.75 m from plot edges) in high density and control, with
four replicates per treatment. The twenty eight plots were disposed randomly to the
3000m² restored area. The inoculation was carried out in April 2012.
3 m
3 m
Control
1 2
4
6
0.5
0.5
50.5
0.5
3
3 m
3 m
3 m
3 m
3 m
3 m
1/2 in 2 bands
1/2 in 1 band
100%
1
3
2
54
6
1
3
2
54
6
1
3
2
5
4
6
0.2
5
0.2
5
0.2
5
0.2
5
0.25
0.2
5
0.2
5
0.75 1.5 0.750.5 0.5 0.50.75 0.75
0.1
25
0.1
250
.25
0.2
5 0.25
0.1
25
0.1
25
0.2
5
0.5
0.5
0.5
0.5
3 m
3 m
3 m
3 m
3 m
3 m
1
3
2
54
6
1
3
2
54
6
1
3
2
5
4
6
0.2
5
0.2
5
0.2
5 0.2
5
0.25
0.2
5
0.2
5
0.75 1.5 0.750.5 0.5 0.50.75 0.75
0.1
25
0.1
250
.25
0.2
5 0.25
0.1
25
0.1
25
0.2
5
0.5
0.5
0.5
0.5
High density
Lowdensity
391 g 196 g 196 g
196 g 98 g98 g
Figure TD.3 : The seven treatments tested at the operational scale for grassland. The grey shading
indicates the plant material inoculation in the plots (dark grey: high density ; light grey: low
density). The red squares indicate the permanent quadrats used to survey vegetation.
Vegetation surveys were carried out using six permanent 0.5 m × 0.5 m quadrats
(Figure TD.3) in June 2012 (2 months after inoculation of plant material) and May 2013 (13

Transition to Discussion
152
months after inoculation of plant material), recording the presence/absence of all species
using the same method that in the block experiments, and an average of species richness
of the six quadrats was calculated.
Plant species richness (Figure TD.4.A) and target species richness (Figure TD.4.B)
significantly increased with plant material transfer relative to the control, but no
difference were observed between various types of inoculation and the density two
months after the introduction. Results are discussed in Discussion.
010
20
30
40
05
10
15
20
Control 100% 1/2 in 1 strip 1/2 in 2 stripsSpec
ies
rich
nes
s(2
m²)
Targ
et s
pec
ies
rich
nes
s(2
m²)
F=5,89, df=6, ***
F=14,24, df=6, ***
A.
B.
100% 1/2 in 1 strip 1/2 in 2 strips
Low densityHigh density
Control 100% 1/2 in 1 strip 1/2 in 2 strips 100% 1/2 in 1 strip 1/2 in 2 strips
Low densityHigh density
a
b
abb babab
a
b
bcbcbc
cc
Figure TD.4 : Mean and standard errors of species richness (A) and target species number (B) for
control (white bars, n=4 plots), 100% plant material inoculation (dark grey bars, n= 4 plots), 1/2
inoculate in 1 strip (large shaded dark grey bars, n= 4 plots) and 1/2 inoculate in 2 strips(tight
shaded dark grey bars, n= 4 plots) in high density and 100% soil inoculation (light grey bars, n= 4
plots), 1/2 inoculate in 1 strip (large shaded light grey bars, n= 4 plots) and 1/2 inoculate in 2 strips
(tight shaded light grey bars, n= 4 plots) in low density in June 2012. The F of ANOVA test are
shown above the bars (*** : p<0.001), different letters above bars indicate significant differences
according to Tukey post-hoc tests.
TD.3. Improvement of diversity in restoration experiment with keystone species
These preliminary results on the potential priority effects were established from field
observations on the large scale grassland restoration, where some targets species,
according to their structure and biomass, seemed to aggregate the other species
transferred with the plant material.

Transition to Discussion
153
Using the inoculated quadrats, we calculated for each target species the species
richness (global and in target species) in each quadrat with and without the target
species, to see any effect of this species on global species richness and on target species
richness.
Out of the 36 target species, 13 showed significant increase in species richness and in
the number of target species with their presence. If for some of those species, this
correlation just indicated a site effect (increase in the species richness because the site is
favorable to an increase in species), for three species (Figure TD.5), where an aggregation
was showed in the field during the vegetation surveys, this correlation can indicated a
facilitation effect and may provide priority effect. The monitoring used here is not
efficient to bring out this biotic interactions effect. The results and some research
perspectives are discussed in Discussion.
Presence Absence
05
10
15
Presence Absence
05
10
15
Presence Absence
05
10
15
Brachypodium distachyonF=13.64, df=1, ***
Hedypnois creticaF=14.37, df=1, ***
Scorpiurus muricatusF=11.99, df=1, ***
Spec
ies
rich
nes
s(2
50
0 m
²)
Spec
ies
rich
nes
s(2
50
0 m
²)
Spec
ies
rich
nes
s(2
50
0 m
²)A. B. C.
Figure TD.5 : Mean and standars errors of species richness with the presence (grey bars) or with
the absence (white bars) of Brachypodium distachyon (A), Hedypnois cretica (B) and Scorpiurus
muricatus (C). The F of ANOVA test are shown above the bars (*** : p<0.001), different letters
above bars indicate significant differences according to Tukey post-hoc tests. Same results were
observed with the number of target species in the absence or the presence of these three
species.

Transition to Discussion
154
The Cassaïre site creation at large scale using a bulldozer to create topography.
Aerial photography of the Cassaïre site during the creation (foreground the arable field, in
background the wetland of the National Nature Reserve Les Marais du Vigueirat).

Discussion
155
Discussion Générale

Discussion
156
La thèse a pour objet la création de marais temporaires méditerranéens et de
pelouses méso-xériques méditerranéennes sur d’anciennes rizières (Figure D.1).
Ecosystèmes de référence
Ecosystème dégradé
Le transfert de foin permet-il de restaurer les communautés
terrestres?
OUI, EFFICACE- Mais filtre biotique à contrôler
Chapitre 4
Le transfert de sol permet-il de restaurer les communautés
d’invertébrés?
PAS NECESSAIRE-Recolonisation spontanée rapide
-Réflexion sur les indicateurs d’évaluation
Chapitre 3.2
La restauration des conditions abiotiques est-elle suffisante?
NON- Absence d’espèces cibles dans
le pool régional d’espèces- Etrépage de sol modifie le
filtre biotique
Chapitre 2
Quel est l’écosystème de référence?
SOCIO-ECOSYSTEME- Où conservation et
activités cynégétiques coïncident
Chapitre 1
Le transfert de sol permet-il de restaurer les communautés aquatiques?
OUI, TRES EFFICACE- Car contrainte du filtre abiotique forte
Chapitre 3.1
Figure D.1 : Schéma général d’organisation de thèse et principaux résultats acquis.
Les choix effectués concernant les écosystèmes de référence et leur justification sont
l’objet du chapitre 1. La restauration des conditions abiotiques seule ne permet pas un
changement de trajectoire des communautés végétales dans les directions escomptées,
en raison notamment de l’absence de graines d’espèces cibles dans le pool régional
d’espèces (chapitre 2). Dans un tel contexte, la manipulation de la dispersion par le
transfert de graines d’espèces cibles est donc nécessaire. Pour les communautés
Discussion
157
végétales des marais temporaires, le transfert de sol après restauration des conditions
abiotiques semble permettre l’expression de la totalité des espèces végétales
transférées, une augmentation de la similarité avec la communauté de référence et une
diminution des espèces identifiées comme indésirables (chapitre 3.1). Cette technique
apparaît moins pertinente pour les communautés d’invertébrés aquatiques,
probablement en raison de leur plus grande capacité à coloniser un milieu sans qu’il soit
nécessaire de procéder à des introductions (chapitre 3.2). Le succès contrasté de
l’inoculation de sol, en fonction du compartiment observé (plantes ou invertébrés),
souligne les risques à ne privilégier qu’un nombre restreint d’indicateurs de restauration,
qui ne reflètent pas nécessairement l’ensemble de l’écosystème. L’étrépage de sol (i.e.
qui permet de rendre les conditions abiotiques plus favorables) suivi d’un transfert de
foin apparaît être une combinaison pertinente pour recréer des communautés végétales
de pelouses méso-xériques méditerranéenne (chapitre 4).
D.1. Connaissances acquises en écologie des communautés et en
écologie de la restauration
D.1.1. Les mécanismes déterminant les communautés végétales
Le modèle des filtres présenté en Introduction section I.4.4 fournit un cadre
théorique pour la compréhension de l’assemblage des communautés végétales (Keddy
1992; Fattorini and Halle 2004; Lortie et al. 2004; Guisan and Rahbek 2011). L’étude des
mécanismes successionnels par le prisme des filtres peut également être un outil pour le
pilotage des communautés végétales. A travers les différents chapitres de ce manuscrit,
nous avons ainsi cherché à évaluer l’importance respective des filtres (i.e. dispersion,
abiotique et biotique) dans l’installation des communautés végétales. Compte tenu de la
difficulté de caractériser précisément toutes les composantes abiotiques d’un
écosystème (Miller and Hobbs 2007), la restauration des conditions abiotiques n’est bien
évidemment, dans notre étude, qu’une amélioration de certaines conditions abiotiques
identifiées importantes dans l’assemblage de ces communautés (i.e. diminution des
teneurs en nutriments du sol pour les pelouses meso-xériques et établissement du régime
hydrique pour les marais temporaires). Cette restauration des conditions biotiques est

Discussion
158
une démarche nécessaire dans un projet de restauration pour espérer atteindre les
communautés de référence (chapitre 2, Galatowitsch and Valk 1996; Lepš 1999; Prach et
al. 2001b; Bischoff 2002; Hobbs and Norton 2004; Kiehl et al. 2010; Bornette and Puijalon
2011), elle n’est cependant pas suffisante. La présence d’un pool régional d’espèces
présentant des espèces des communautés cibles est également déterminante. L’absence
d’espèces cibles dans la pluie de graines, la banque de graines et/ou la végétation
exprimée, constatée dans notre étude suggère que la restauration des conditions
abiotiques ne suffit pas à elle seule mais qu’une introduction de propagules soit au moins
nécessaire pour obtenir les espèces cibles rapidement. La succession spontanée après
restauration des conditions abiotiques a ici été étudiée sur une courte durée (chapitre 2);
elle ne permet pas de mettre en évidence l’importance de mécanismes se déroulant sur
des pas de temps plus long tels que la zoochorie, connue pour jouer un rôle important
dans la recolonisation spontanée (e.g. pour la dispersion des espèces des marais
temporaires par les oiseaux d’eau (Figuerola and Green 2002a; Brochet et al. 2010a); pour
la dispersion des espèces des pelouses par le bétail (Stevens 1932; Fischer et al. 1996)). A
plus long terme, une recolonisation spontanée par les espèces cibles est possible,
cependant manipuler le filtre de la dispersion en introduisant des espèces cibles en début
de succession végétale peut permettre (i) d’éviter des phases de blocage par des espèces
non désirées présentes dans le pool régional d’espèces par des mécanismes de
préemption (Reinartz and Warne 1993; Prach et al. 2001a; Prach et al. 2001b; McKinstry
and Anderson 2005; Collinge and Ray 2009) et (ii) d’augmenter l’imperméabilité à des
événements stochastiques (i.e. recrutement d’espèces non désirées) qui peuvent
également limiter l’établissement ou le développement spontanée de nos espèces cibles
(Van der Putten et al. 2000). Dans notre cas, le fait de manipuler les filtres des conditions
abiotiques et de la dispersion ne permet pas pour autant d’accéder directement aux
communautés végétales visées (chapitre 3.1 et chapitre 4). Alors que des graines
d’espèces cibles sont présentes et que les conditions abiotiques sont restaurées,
l’absence de l’installation complète de nos communautés cibles (particulièrement dans le
cas des communautés terrestres, voir section Discussion section D.2.1), suggère un rôle
important des interactions biotiques. En l’absence d’intervention (e.g. coupe, pâturage)
ces interactions biotiques semblent menacer la reproduction et le maintien des espèces

Discussion
159
cibles présentes et donc hypothéquer à terme la restauration des communautés (Baer et
al. 2009; Jaunatre et al. 2012). Pour être efficace, le forçage de la dispersion doit être
accompagné du contrôle de la compétition des espèces non désirées, dont la forte
présence sur le site est liée à une forte disponibilité en nutriments, résultante des intrants
des activités agricoles passées (Gough and Marrs 1990). Utilisés comme régimes de
perturbation, le pâturage des pelouses méso-xériques et l’assec estival des marais
temporaires, sembleraient efficace pour contrôler ces interactions biotiques défavorables
à la restauration de nos communautés de référence. En limitant la biomasse, en réduisant
l’abondance des espèces rudérales et mésophiles et en créant par le piétinement des
micro-sites facilitant le recrutement, le pâturage permet habituellement de diminuer la
compétition et favoriser ainsi l’installation de nos communautés végétales cibles (Hölzel
and Otte 2003; Walker and Desanker 2004; Woodcock et al. 2005; Bakker et al. 2006;
Pywell et al. 2007; Rasran et al. 2007; Myers and Harms 2009; Klimkowska et al. 2010b;
Coiffait-Gombault et al. 2011; Török et al. 2011a). En sélectionnant des espèces adaptées
au caractère temporaire (i.e. les espèces cibles), en défavorisant les espèces non
adaptées (i.e. espèces terrestres ou espèces aquatiques à inondation estivale favorisée
par la riziculture) l’assec estival limite les interactions biotiques. Soumettre nos deux
communautés de référence à ces perturbations ne parait cependant pas l’unique moyen
d’éviter la compétition. En effet, via le forçage de la dispersion et la restauration des
conditions abiotiques, les interactions biotiques défavorables peuvent indirectement être
réduites.
L’introduction de matériel végétal (i.e. transfert de foin et transfert de sol)
contrecarre le filtre de la dispersion mais est également susceptible de modifier les
interactions biotiques. En effet, le transfert de foin/sol, en augmentant la densité du
couvert végétal (mis en évidence pour le transfert de sol pour les communautés
aquatiques dans le chapitre 3.1 mais non mis en évidence dans le transfert de foin pour les
communautés terrestres dans le chapitre 4) freine l’expression de la banque de graines et
des espèces non désirées (Van der Putten et al. 2000; Klimkowska et al. 2010b; Török et
al. 2011a; Török et al. 2012; chapitre 3.1). Divers auteurs ont cependant montré qu’un
couvert végétal trop dense, dû au transfert de matériel végétal, était, a contrario,
susceptible de freiner le recrutement et l’établissement ultérieurs d’espèces cibles

Discussion
160
(Jongepierová et al. 2007; Lepš et al. 2007; Ruprecht et al. 2010; Török et al. 2010; Török et
al. 2011a). Dans notre cas, la diminution de nos espèces cibles dans les communautés de
pelouses restaurées peut être en partie attribuée à l’absence de gestion appropriée de la
compétition par les espèces non désirées présentes sur le site (chapitre 4).
L’étrépage de sol, utilisé pour rendre les conditions abiotiques plus favorables à nos
espèces cibles (i.e. diminution des quantités de nutriments dans le sol) modifie également
les interactions entre espèces en éliminant une partie de la végétation et de la banque de
graines (mis en évidence dans le chapitre 2), limitant ainsi l’installation des espèces non
désirées et potentiellement compétitrices (Aerts et al. 1995; Patzelt et al. 2001; Tallowin
and Smith 2001; Hölzel and Otte 2003; Allison and Ausden 2004; Buisson et al. 2006b;
Buisson et al. 2008; Kiehl et al. 2010; Klimkowska et al. 2010b; Török et al. 2011b; Jaunatre
et al. 2013a). Une forte teneur en nutriments n’empêche pas nécessairement les espèces
cibles de s’installer, mais compromet leur persistance par la présence d’espèces non
désirées (directement liée aux conditions environnementales) et les interactions
négatives qui en découlent (Yurkonis and Meiners 2004; Buisson et al. 2006b).
Les filtres sont pour partie dépendants les uns des autres et la manipulation d’un
filtre peut modifier indirectement un autre filtre (Figure D.2). Afin de lutter contre la
compétition par des espèces non désirées il convient d’agir dès le début de processus de
restauration. En effet, le transfert des espèces cibles sur un sol nu améliore fortement la
probabilité de succès du transfert, les interactions biotiques étant faibles ou nulles (Kiehl
et al. 2010), ce qui n’est pas le cas ultérieurement, les processus internes à la
communauté jouant un rôle de plus en plus important (Sutherland 1974; Turnbull et al.
2000; Klimkowska et al. 2010b).
Certaines espèces cibles via des interactions positives peuvent modifier la
composition de la communauté dans une direction souhaitée (Transition to Discussion
section TD.3). L’ordre d’arrivée des espèces, qui est un processus largement stochastique
et qui peut être manipulé en restauration écologique, est ainsi un mécanisme important
pour la structuration ultérieure de la communauté (Fukami et al. 2005).
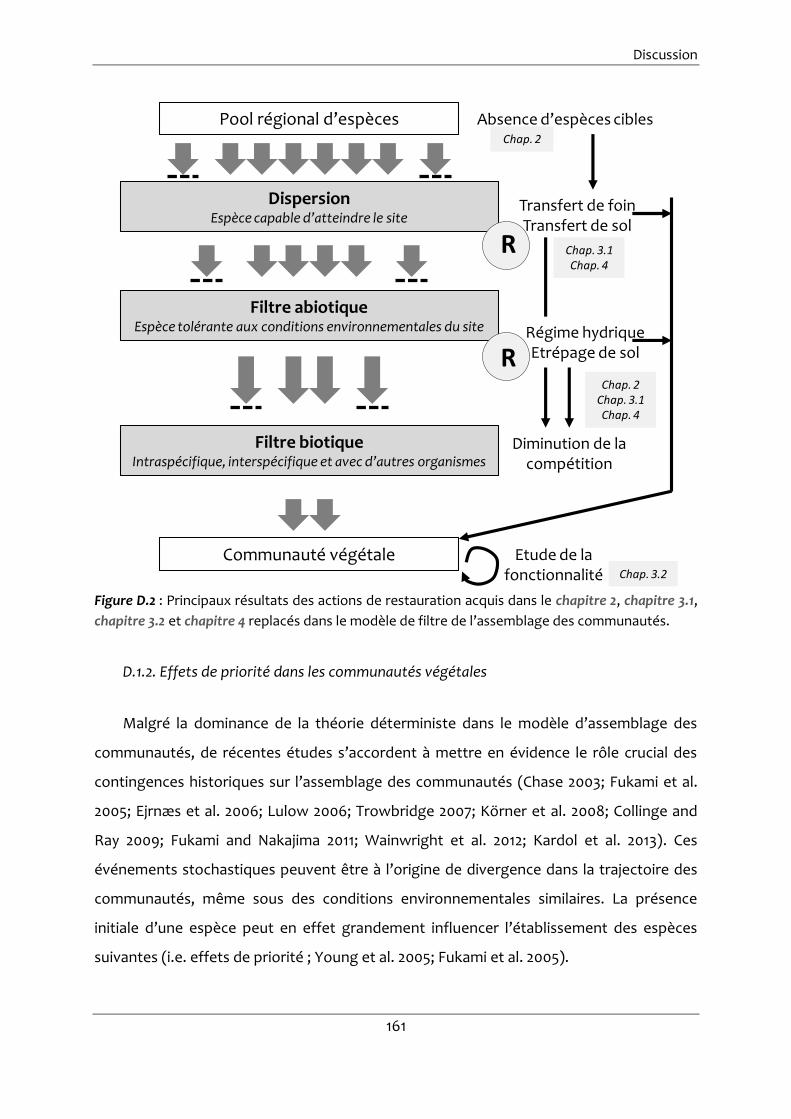
Discussion
161
Régime hydriqueEtrépage de sol
Pool régional d’espèces
Communauté végétale
DispersionEspèce capable d’atteindre le site
Filtre abiotiqueEspèce tolérante aux conditions environnementales du site
Filtre biotiqueIntraspécifique, interspécifique et avec d’autres organismes
R
R
Transfert de foinTransfert de sol
Etude de la fonctionnalité
Diminution de la compétition
Absence d’espèces ciblesChap. 2
Chap. 3.1Chap. 4
Chap. 3.2
Chap. 2Chap. 3.1Chap. 4
Figure D.2 : Principaux résultats des actions de restauration acquis dans le chapitre 2, chapitre 3.1,
chapitre 3.2 et chapitre 4 replacés dans le modèle de filtre de l’assemblage des communautés.
D.1.2. Effets de priorité dans les communautés végétales
Malgré la dominance de la théorie déterministe dans le modèle d’assemblage des
communautés, de récentes études s’accordent à mettre en évidence le rôle crucial des
contingences historiques sur l’assemblage des communautés (Chase 2003; Fukami et al.
2005; Ejrnæs et al. 2006; Lulow 2006; Trowbridge 2007; Körner et al. 2008; Collinge and
Ray 2009; Fukami and Nakajima 2011; Wainwright et al. 2012; Kardol et al. 2013). Ces
événements stochastiques peuvent être à l’origine de divergence dans la trajectoire des
communautés, même sous des conditions environnementales similaires. La présence
initiale d’une espèce peut en effet grandement influencer l’établissement des espèces
suivantes (i.e. effets de priorité ; Young et al. 2005; Fukami et al. 2005).

Discussion
162
Ces espèces « clés » ou « ingénieurs » (Jones et al. 1994; Brown 1995; Stone 1995) ont
un rôle dans l’assemblage des communautés, souvent lié à leur importante biomasse.
Installer ces espèces capables de favoriser la présence d’autres espèces cibles, semble
une démarche prometteuse en restauration. La présence de ces espèces en début de
succession pourrait également être un bon indicateur du devenir de la communauté, leur
présence influant fortement sur l’issue de la restauration de la communauté végétale (cf
Discussion section D.3.3).
L’utilisation des interactions biotiques positives (i.e. la facilitation) en restauration
écologique a déjà été testée à travers le semis d’espèces nurses (Aerts et al. 1995;
Verhagen et al. 2001; Coiffait-Gombault et al. 2012; Jaunatre et al. 2012), limitant les
espèces indésirables, utilisant l’excès d’azote et de phosphore dans le sol et qui
favorisent ainsi l’installation des espèces cibles.
Les études préliminaires sur les effets de priorité (Transition to Discussion section
TD.3) ont été mises en place à partir d’observations réalisées sur le terrain, et indiquent
que ces effets de priorité pourraient exister sur notre terrain, où certaines espèces cibles,
par leur structuration et leur biomasse, semblent agréger autour d’elle les autres espèces
présentes dans le transfert de foin (Figure D.3).
Les résultats concernant la richesse spécifique (Transition to Discussion section TD.2)
montrent une simple corrélation entre cette richesse et la présence de quelques espèces
cibles (i.e. Scorpiurus muricatus L., Hedypnois cretica Willd et Brachypodium distachyon (L.)
P.Beauv.) ne permettent pas de conclure sur un effet facilitateur. Un simple effet site (i.e.
bonnes conditions environnementales permettant une augmentation de la richesse
spécifique) pourrait également être à l’origine de cette corrélation positive. Diverses
études ont cependant montré qu’une agrégation de deux espèces était souvent due à de
la facilitation et non à des conditions abiotiques de microsites (Tirado and Pugnaire 2005;
Maestre et al. 2008). Les relevés de végétation, réalisés dans la restauration à plus large
échelle et utilisés pour ces calculs de corrélations et dans la mise en évidence de ces
corrélations, ne permettent pas d’affirmer si des phénomènes de facilitation sont à
l’origine de ces corrélations positives. En effet, la taille des quadrats d’échantillonnage
(50 x 50 cm) est trop grande pour mettre en évidence de la facilitation : les espèces
peuvent être présentes dans le même quadrat tout en étant éloignées l’une de l’autre, la

Discussion
163
cooccurrence ne pouvant pas alors être attribuée à des interactions biotiques positives,
uniquement mesurable à une échelle spatiale plus petite (cf Discussion section D.4.2;
Gotelli and McCabe 2002; Tirado and Pugnaire 2005; Maestre et al. 2008).
Figure D.3: Photographie d’une agrégation de Trifolium resupinatum L., Brachypodium distachyon
(L.)P.Beauv, Filago pygmaea L., Parapholis filiformis (Roth)C.E.Hubb. autour de Scorpiurus
muricatus L.
D.1.3. Les objectifs de restauration sont-ils atteints ?
Il est évidemment trop tôt pour conclure sur la possibilité pour les communautés en
cours de restauration d’atteindre les communautés de référence. A la lumière de nos
expérimentations et du suivi de courte durée, restaurer un marais temporaire ou une
pelouse meso-xérique sur des friches rizicoles semble nécessiter la manipulation des trois
filtres : dispersion, conditions environnementales et interactions biotiques, afin de
positionner rapidement les communautés sur la trajectoire des communautés de
référence. La restauration des communautés aquatiques via la manipulation de ces trois
filtres (chapitre 3.1) montre des résultats plus convaincants en terme de similarité avec les
communautés de référence, de nombre d’espèces cibles et d’espèces non désirées par

Discussion
164
rapport à la restauration de la communauté terrestre (chapitre 4), où la compétition
conduit dès la deuxième année à la diminution de la richesse spécifique et de la richesse
en espèces cibles.
D.2. Différentes réponses dans la dynamique végétale
D.2.1. Différence entre les communautés aquatiques et les communautés terrestres
Nos expérimentations en mésocosmes suggèrent qu’il est plus facile de réintroduire
les espèces cibles des marais que celles des pelouses. Cette différence pourrait, pour une
large part, s’expliquer par les conditions abiotiques probablement plus proches des
conditions de référence pour les marais que pour les pelouses. De façon générale, il paraît
plus aisé de restaurer le principal filtre abiotique des marais temporaires (i.e. le régime
hydrique ; Grillas 1990; Zedler 2000a) que celui des pelouses méso-xériques (i.e. sol
oligotrophe; Lepš 1999; Kiehl et al. 2010) en particulier dans un contexte post-cultural. La
capacité prédictive augmente avec le niveau de contrainte du milieu (Mesléard et al. 1991)
et les communautés aquatiques sont plus prédictibles, de par leur conditions abiotiques
drastiques qui les sélectionnent d’avantage. A l’inverse, dans les communautés terrestres,
la prédictibilité est d’autant plus perfectible que les conditions sont peu limitantes et
n’opèrent pas d’effets sélectifs forts.
Les communautés végétales des pelouses sont d’autre part soumises à un niveau de
compétition élevée résultant de la présence de nombreuses espèces non désirées
favorisées par le niveau trophique du sol. Ce n’est pas le cas pour les communautés
aquatiques où aucune espèce susceptible de rentrer en compétition avec la communauté
cible n’a été détectée dans le pool régional. Sachant que la zoochorie à l’origine d’une
forte dispersion de graines d’espèces de marais temporaires est hautement prévisible à
long terme (Figuerola and Green 2002a; Brochet et al. 2010a), la question de devoir
transférer des propagules doit être posée, sachant qu’aucune phase de blocage à
contrecarrer ne semble exister. Le transfert de propagules représente un coût humain et
financier supplémentaire. Dans le cas des marais temporaires, il ne semble qu’accélérer le
développement de la communauté cible et faciliter la présence de certaines espèces rares
(plus difficile à obtenir avec la colonisation spontanée). Pour autant, la mise en place de la

Discussion
165
restauration à large l’échelle nous invite cependant à être prudents quant à toute
conclusion hâtive. En effet, à cette échelle, et contrairement à nos observations dans les
mésocosmes, les algues filamenteuses Cladophora vagabunda (L.) Hoek (absentes du pool
régional d’espèces, car la méthodologie utilisée ne permet pas de détecter leur spores de
taille inférieur à 100 µm ; chapitre 2), peuvent gêner le plein développement nos espèces
cibles.
D.2.2. Différence entre restauration en mésocosme et à plus large échelle
L’étrépage de sol, la restauration du régime hydrique et le transfert de sol à plus large
échelle (4000m² ; Transition to Discussion section TD.1) n’aboutissent pas à des résultats
aussi convaincants qu’en mésocosmes (chapitre 3.1). La totalité des espèces transférées
n’apparaît pas dans le marais restauré et une diminution de l’abondance relative des
espèces cibles dans la communauté (55% d’espèces cibles à large échelle vs. 75% en
mésocosme) indique que la restauration apparaît plus complexe. L’omniprésence
d’algues filamenteuses (Cladophora vagabunda (L.) Hoek) sur toute la surface du marais
restauré, semble défavorable à l’installation de la communauté présente dans le transfert
de sol. La présence de cette algue, déjà mise en évidence dans les mésocosmes (chapitre
3.1) mais dont aucun effet n’avait été détecté, semble compromettre l’établissement des
espèces transférées à large échelle. Naturellement présentes dans les marais de
référence en octobre à la première mise en eau et en mai durant les premières chaleurs,
ces algues n’y influencent pas l’expression des macrophytes cibles et diminuent avec
l’augmentation de l’abondance de ceux-ci. Dans les marais restaurés, leur présence
pourrait être liée à un relargage de nutriments favorisé par la mise en suspension du
sédiment. D’autres études sur le transfert de sol (Bullock 1998; Jaunatre et al. 2012)
indiquent une modification de la communauté causée par la perturbation induite par le
transfert de sol. Le transfert de sol mis en place tardivement ainsi qu’une mise en eau
également tardive ont aussi pu contribuer à l’installation durable de ces algues.
A l’inverse, la restauration des communautés de pelouses méso-xériques à plus large
échelle (3000 m² ; Transition to Discussion section TD.2) montre par rapport à la
restauration des mésocosmes (chapitre 4), relativement petits, une augmentation de
l’abondance relative des espèces cibles dans la communauté (60% d’espèces cibles à large

Discussion
166
échelle vs. 46% en mésocosme). Cette amélioration de résultats peut s’expliquer par la
diminution à cette échelle des effets de bords, qui entrainent la rapide colonisation des
espèces non désirées (Rasran et al. 2007).
Même si les résultats d’écologie de la restauration à faible échelle (d’espace et de
temps) permettent de dessiner les lignes directrices et de tester les outils à mettre en
place pour la restauration à plus large échelle (Hagen and Evju 2013), ils ne permettent
pas de prédire l’exact déroulement des mécanismes (Zedler 2000a). L’incertitude et la
complexité des milieux vivants rendent difficiles la prédiction et encore d’avantage
lorsque la taille de l’objet d’étude s’agrandit. A l’échelle de l’écosystème rentre en jeu un
grand nombre de variables non maitrisées et souvent non prises en compte. La
restauration à cette échelle nécessite ainsi une gestion adaptative, qui repose sur une
logique d’apprentissage, d’amélioration pas-à-pas où les actions sont régulièrement
ajustées (Holling 1978; Olsson et al. 2004).
D.3. De l’écologie de la restauration à la restauration écologique :
propositions et recommandations
D.3.1. Matériel végétal transféré
Dans nos expériences de transfert de foin (chapitre 4) et de sol (chapitre 3.1), l’accent
a été mis sur la qualité du matériel végétal transféré, cette qualité pouvant avoir
d’importantes conséquences sur les résultats de la restauration. Plus le matériel végétal
transféré correspond à la communauté de référence en termes de richesse spécifique et
d’abondance, plus les résultats de la restauration sont prédictibles (Török et al. 2011b).
Concernant le matériel des communautés de pelouses, différentes techniques de
prélèvement ont été utilisées et à diverses périodes, maximisant ainsi le nombre
d’espèces cibles prélevées (démontré dans les etudes de Stevenson et al. 1995;
Stevenson et al. 1997; Kiehl et al. 2006). Le sol utilisé pour les communautés aquatiques a
lui été collecté sur différents marais temporaires, permettant de représenter la gamme
de variations environnementales (i.e. période d’inondation et salinité) et donc de
communautés végétales, correspondant à la gamme des conditions susceptibles d’être
rencontrées sur le site du Cassaïre. Le fait de prélever dans plusieurs marais temporaires

Discussion
167
vise à créer un effet de stockage de la banque de graines des marais temporaires (storage
effect ; Bonis et al. 1995; Cáceres 1997; Bonis 1998), mécanismes permettant de répondre
à des changements de conditions environnementales et à des populations de coexister
dans le temps.
Plusieurs études (Holling and Meffe 1996; Simenstad and Thom 1996; Moreno-
Mateos et al. 2012; Español et al. 2012) ont mis en évidence une plus forte vulnérabilité
aux perturbations des zones humides restaurées et une gamme de variations plus réduite
par rapport aux zones humides naturelles. Maximiser la diversité spécifique des milieux
restaurés peut donc potentiellement offrir une capacité de réponses à des changements
environnementaux, une complexité et une résilience plus grande (Tilman et al. 2006).
La restauration pourrait être améliorée en épandant directement, après récolte, le
matériel, ce qui éviterait des pertes en graines inhérentes au séchage et au stockage
(Török et al. 2011b) et augmenterait le taux d’établissement des espèces transférées
(Kiehl et al. 2010). La quantité de matériel mais aussi la fréquence d’ensemencement est
un facteur influençant le résultat de restauration. Le début de suivi du transfert de foin
sur une plus large échelle (Transition to Discussion section TD.2) ne suggère pas d’effet de
la densité sur la richesse spécifique globale ni sur le nombre d’espèces cibles. Augmenter
la fréquence d’ensemencement devrait permettre d’augmenter le recrutement et le
maintien des espèces transférées (Collinge and Ray 2009).
Si la quantité et la qualité du matériel végétal transféré sont des facteurs importants
dans la réussite de la restauration, la lourdeur des activités et le coût potentiel de la
restauration peuvent également limiter la réalisation de projets. La réduction des coûts et
de l’énergie dépensée semble possible en jouant sur les superficies d’ensemencement ou
en sélectionnant d’avantage les espèces à introduire par le seul transfert de quelques
espèces clés qui, par effet de priorité, faciliteraient l’obtention de la communauté de
référence. Tester ces différents facteurs permettrait probablement de proposer des
techniques de restauration présentant un bon compromis coût-résultat.
D.3.2. Superficie d’ensemencement
Par le développement d’un couvert végétal dense, l’ensemencement de la totalité de
la superficie à restaurer semble à priori mieux à même de limiter le recrutement par des

Discussion
168
espèces non désirées. Cependant, un tel apport, compte-tenu des coûts impliqués
(notamment en main d’œuvre), semble difficilement réalisable sur de grande superficie.
D’autre part la collecte qui en résulte est susceptible d’endommager les écosystèmes
donneurs (i.e. les écosystèmes de référence). Sous l’hypothèse que la zone
inoculée/semée fonctionne comme source d’espèces cibles pour la colonisation
spontanée des régions voisines non ensemencées (Hölzel and Otte 2003; Jongepierová et
al. 2007; Rasran et al. 2007; Kiehl et al. 2010; Török et al. 2011b; Aradottir 2012; Mitchley et
al. 2012), réduire les superficies sur lesquelles sont introduites ces propagules diminuerait
les coûts sans pour autant impacter significativement les résultats, à terme, de la
restauration.
Un parallèle peut être fait avec les réflexions concernant la délimitation des réserves
naturelles et le débat sur le SLOSS (Single Large Or Several Small ; Soulé and Simberloff
1986), dans lequel il s’agit de savoir s’il est préférable de protéger un unique grand espace
ou plusieurs petits. Même si le débat n’est pas résolu, la réponse semble essentiellement
dépendre de l’espèce considérée. Dans le cas des communautés végétales, la question
peut se résumer de façon pratique à savoir s’il est préférable d’introduire des propagules
sur une partie de la surface à restaurer et dans ce cas de quelle façon les introduire (i.e.
design d’introduction avec le même type de réflexion que sur le SLOSS) ou au contraire
s’il est préférable d’introduire des propagules sur la totalité de la superficie. Le fait de ne
devoir introduire des propagules que sur une partie du site repose sur la capacité des
espèces cibles à coloniser les espaces non ensemencés/inoculés (i.e. fonction source ou
effet de nucléation des zones ensemencées/inoculées ; Reis et al. 2003). Les parties non
ensemencées/inoculées pourraient cependant constituer des fenêtres d’invasion pour les
d’espèces indésirables (Johnstone 1986), rendant la communauté transférée plus
perméable aux espèces non désirées, la compétition aboutissant à un effet contraire à
celui escompté. Dans notre cas, les premiers résultats des tests sur le design
d’introduction (i.e. ensemencer la même quantité de matériel sur une bande ou sur deux
bandes, cf Transition to Discussion) ne montrent aucune différence en termes de richesse
spécifique globale et en espèce cibles, ni pour les communautés aquatiques, ni pour les
communautés terrestres (Transition to Discussion). De même, aucune différence n’est
observée lorsque l’on considère la proportion de la superficie ensemencée (i.e. 100% de la

Discussion
169
superficie vs. 50 %de la superficie pour les pelouses et 100% de la superficie vs. 1/3 de la
superficie pour les marais; Transition to Discussion). Si un suivi sur le long terme est
nécessaire pour tirer des conclusions, ensemencer la totalité de la superficie à restaurer
ne semble pas nécessaire, au vu de nos premiers résultats.
D.3.3. Effets de priorité
Le succès de restauration est souvent évalué sur un court laps de temps, par absence
de suivi sur le long terme (Fahselt 2007), cette évaluation rendant les prédictions quant
au devenir des communautés en cours de restauration moins fiables. Cette difficulté
pourrait être partiellement contournée en utilisant les espèces connues pour leur effet de
priorité. L’identification d’espèces facilitatrices et la bonne connaissance de leur rôle
structurant devraient permettre (i) d’obtenir un indicateur relativement grossier mais
précoce du potentiel succès de restauration (i.e. si l’espèce est présente il y a plus de
chance d’obtenir notre communauté de référence que si elle est absente) et (ii) de
réduire le coût des traitements de restauration (limitation des prélèvements alors
focalisés sur ces espèces) et potentiellement celui du suivi (l’unique détection de ces
espèces, de leur nombre et de leur répartition, sans pour autant devoir caractériser toute
la communauté).
Les effets de priorité paraissent notamment concerner certaines espèces des
pelouses méso-xériques (i.e. Scorpiurus muricatus L., Hedypnois cretica Willd et
Brachypodium distachyon (L.) P.Beauv.) identifiées comme possible facilitatrices des
espèces cibles (cf Transition to Discussion). Dans le cas des marais temporaires, introduire
des espèces telles que Ranunculus peltatus Schrank pourrait diminuer la présence des
algues filamenteuses qui semble être problématique dans l’établissement de nos espèces
cibles inoculées à l’échelle du marais (Figure D.4). En effet, cette espèce à phénologie
variable, peut germer très précocement, s’installe aisément, tolère des assecs estivaux
marqués et recouvre la surface de l’eau (Garbey et al. 2004; Mouronval and Baudouin
2010), empêchant ainsi la présence des algues filamenteuses. Cette espèce qui rend le
plan d’eau stable et moins turbide, disparaît d’autre part rapidement au cours de la
saison, ne posant probablement pas de problèmes à de nombreux macrophytes
commençant leur développement plus tardivement en saison.

Discussion
170
Figure D.4: Photographie du marais restauré à large échelle avec la présence d’algue filamenteuse
Cladophora vagabunda (L.) Hoek sur toute la surface du plan d’eau et d’une renoncule peltée
Ranunculus peltatus Schrank, qui pourrait être utilisée pour diminuer la présence de Cladophora
vagabunda (L.) Hoek.
La seule introduction de ces espèces clés pourrait ne pas suffire pour atteindre les
objectifs de restauration (i.e. aboutir à des communautés proches de celles de référence).
Leur présence semble néanmoins faciliter l’établissement d’autres espèces. Un choix
judicieux comprenant des espèces clés combinées à un matériel végétal contenant
d’autres espèces de la communauté pourrait permettre d’obtenir les communautés
souhaitées sans pour autant nécessiter des quantités importantes de matériel.
Afin de satisfaire au compromis « coût-résultat », qui guide la majorité des projets de
restauration, varier la superficie d’ensemencement en fonction des attributs des espèces,
comme le préconisent Pakeman et al. (2002) paraît donc une démarche souhaitable. Les
espèces identifiées comme espèces clés, à l’origine des effets de priorité, seraient
réintroduites sur la totalité de la zone à restaurer et le reste du matériel végétal
contenant les autres espèces cibles (foin ou sol) pourrait être transféré par taches, la

Discussion
171
capacité de colonisation de ces espèces non clés du matériel végétal étant assurée par les
conditions générées par les espèces clés (e.g. diminution des espèces non désirées par
couvert végétal et donc diminution de la compétition, piégeage de propagules,
restauration de conditions abiotiques adaptées). Dans ce cas, le transfert du matériel
végétal des espèces non clés semble devoir être réalisé dans un laps de temps assez court
après l’introduction des premières espèces clés.
Ces différentes recommandations pour la pratique de restauration à large échelle, qui
doivent être encore testées dans notre cas, si elles conduisent à diminuer le coût de la
restauration, permettraient également d’obtenir une meilleure acceptation du public
(Miller and Hobbs 2007).
D.3.4. Intégration de l’ensemble de l’écosystème dans l’évaluation de la restauration
Dans nos expérimentations nous avons mis en évidence des différences de réponses
à la restauration entre les invertébrés aquatiques et les macrophytes (chapitre 3.2), la
colonisation spontanée par les invertébrés étant plus rapide que celle des macrophytes
(cf Transition to Chapter 4). De telles différences dans les réponses entre compartiments
de l’écosystème, déjà mis en évidence par des études précédentes (Trexler 1995), doivent
être prises en compte dans les choix d’indicateurs d’évaluation. Cette intégration de
plusieurs compartiments de l’écosystème apporte des indications complémentaires sur la
fonctionnalité de ces communautés végétales restaurées (Figure D.1 et Figure D.2).
Cette thèse en écologie des communautés, écologie de la restauration et
restauration écologique (Tableau D.1.) ne constitue qu’une étape et appelle à de
nouvelles recherches dont les questions sont exposées dans le paragraphe suivant
(Tableau D.1.).

Discussion
172
Tableau D.1: Principaux résultats en écologie des communautés, en écologie de la restauration et
en restauration écologique. Les perspectives de recherche sont indiquées en italique.
Contribution à l’écologie des communautés
- La composition de la végétation est d’avantage corrélée à la composition de la banque de grainesqu’à la composition de la pluie de graines. Quand la densité de la banque de graines diminue, lapluie de graines peut plus facilement s’exprimer dans la végétation (Chapitre 2)
- Les rôles des filtres abiotique et de la dispersion sont déterminants en début de succession dansl’assemblage des communautés (Chapitre 3.1 et chapitre 4)
- Le filtre biotique joue un rôle important dans le devenir de la communauté végétale, surtoutquand les conditions abiotiques sont moins contraignantes (Chapitre 3.1 et chapitre 4)
- La colonisation spontanée des communautés d’invertébrés aquatiques est plus efficace que celledes communautés végétales (Chapitre 3.2)
- Les effets de priorités peuvent influencer l’assemblage des communautés en début de succession(Transition à la discussion )
Contribution à l’écologie de la restauration
- La prédictibilité de succès de restauration peut se mesurer à travers la contrainte exercée par lefiltre abiotique (Chapitre 3.1 et chapitre 4)
- La manipulation du filtre abiotique est indispensable mais insuffisante pour les deuxcommunautés (chapitre 2)
- La manipulation du filtre abiotique et de la dispersion est suffisante pour restaurer lescommunautés aquatiques (Chapitre 3.1)
- La manipulation du filtre abiotique et de la dispersion est insuffisante pour restaurer lescommunautés terrestres et doit être combinée à une diminution de la compétition (Chapitre 4)
- L’évaluation de la restauration ne doit pas se baser surune seule composante de l’écosystème(Chapitre 3.2)
- L’effet du pâturage sur les communautés terrestres doit être testé
- Les espèces clés liées à des effets de priorités doivent être identifiées avec des modèles nuls
Contribution à la restauration écologique
- L’étrépage de sol, le transfert de foin et le transfert de sol apparaissent comme des techniques derestauration pertinentes (Chapitre 3.1 et chapitre 4)
- L’introduction du matériel végétal sur toute la superficie de la zone à restaurer n’est pasnécessaire (Transition à la discussion )
- Les différences de résultats à petite échelle expérimentale et à l’échelle d’un écosystème dans larestauration doivent être pris en compte via une gestion adaptative (Transition à la discussion )
- D’autres composantes de l’écosystème doivent être intégrées dans l’évaluation du succès derestauration (Chapitre 3.2)
- L’activité de chasse peut être pris en compte pour évaluer la part sociale
- Le transfert de sol combiné à l’inoculation de Ranunculus peltatus pour limiter les alguesfilamenteuses doit être testé
- Le semis d’espèces clés sur toute la superficie combiné à l’inoculation de foin par taches doit êtretesté

Discussion
173
D.4. Perspectives de recherche sur le site du Cassaïre
D.4.1. Filtre biotique
Nous avons souligné l’importance du filtre biotique dans l’assemblage des
communautés. Cependant ce rôle n’a pas été directement testé dans nos
expérimentations. L’importance du pâturage a déjà été mis en évidence dans différents
travaux sur les pelouses et les friches rizicoles, son action permettant de diminuer la
compétition avec les espèces non désirées et d’augmenter significativement la richesse
spécifique (Mesléard et al. 1991; Mesléard et al. 1999; Coiffait-Gombault et al. 2011). Tester
l’effet du pâturage en particulier ovin et équin selon différentes modalités (charge,
période, durée, fréquence) sur les pelouses méso-xérique restaurées permettrait (i) de
mettre indirectement en évidence l’effet de la compétition par les espèces non désirées
dans la restauration des communautés végétales ii) de déterminer la ou les gestions ad
hoc contribuant au bon maintien des communautés sur les bonnes trajectoires.
D.4.2. Effets de priorité
Afin d’affirmer que les corrélations mises en évidence entre certaines espèces et la
richesse spécifique (Transition to Discussion section TD.3) peuvent être associées à des
phénomènes de facilitation, une lecture plus fine de la végétation doit être mise en place.
Dans ce sens, le suivi de végétation tel qu’utilisé par Maestre et al. (2008) (i.e. quadrats
réalisés à l’échelle des interactions potentielles de 5 cm × 5 cm), où la présence de chaque
individu est notée, pourrait aider à la mise en évidence de telles interactions. L’utilisation
de modèles nuls pour générer des communautés aléatoires non structurées par les
interactions biotiques permettrait en les comparant à nos communautés et en utilisant
différents indices de cooccurrence (voir Gotelli 2000 pour les détails des indices pouvant
être utilisés) de tester indirectement des effets de facilitation (coexistence des espèces
au sein d’un même quadrat plus forte qu’attendue aléatoirement). Il pourrait être
bénéfique de compléter les mesures de cooccurrence par des expériences d’introduction
d’espèces à priori facilitatrices, qui permettraient ainsi de s’affranchir d’un effet de simple
corrélation entre micro-habitat favorable, présence de ces espèces et augmentation de la

Discussion
174
richesse spécifique. Ainsi de façon concrète dans notre cas, compléter le transfert de sol
par l’ensemencement de graines de Ranunculus peltatus Schrank permettrait de tester le
rôle de cette espèce dans la diminution des algues filamenteuses des marais (cf
hypothèse Discussion section D.3.3.).
La connaissance des traits fonctionnels des espèces identifiées comme facilitatrices
complèterait la compréhension des processus de facilitation. Ces espèces pourraient par
exemple i) accumuler plus facilement les graines d’autres espèces, ii) modifier le micro-
habitat ou iii) éliminer les espèces non cibles. Scorpiurus muricatus L. identifiée dans les
résultats préliminaires (Transition to Discussion section TD.3), pourrait modifier l’habitat
via la fixation de l’azote (Famille des Fabacées).
D.4.3. Approche services écosystémique dans l’évaluation
L’évaluation par une approche communauté (richesse spécifique mais aussi structure
et composition de la communauté avec le développement de nouveau indicateur de
restauration cf Annexe 1; Jaunatre et al. 2013b) permet, pour partie, d’évaluer la stabilité
d’un écosystème face à des modifications environnementales (Reinartz and Warne 1993;
Tilman et al. 2006), elle ne reflète cependant qu’un compartiment de l‘écosystème.
L’avifaune peut apparaître également comme un indicateur de restauration à priori plus
aisé à mesurer que les communautés d’invertébrés. La pertinence de cet indicateur a
cependant été contesté et l’utilisation de ce seul indicateur ne permet pas de juger de la
qualité d’un habitat (Christian et al. 2009): un marais de chasse géré de façon opposée
aux conditions naturelles peut être fortement fréquenté par certains types d’oiseaux
d’eau mais se révéler pauvre d’un point de vue de la végétation (Tamisier and Grillas 1994;
Aznar et al. 2003). Dans notre cas, la composante avifaune sera de toute façon un critère
d’évaluation notamment pour l’activité cynégétique, i.e. un marais de chasse offrant une
diversité et une abondance d’oiseaux d’eau chassables. L’évaluation du niveau de
restauration à travers les services écosystémiques apparaît judicieuse (Bakker et al. 2000;
Findlay et al. 2002; Palmer and Filoso 2009) notamment dans des socio-écosystèmes
restaurés où une démarche participative est à l’origine du projet de restauration. Ainsi,
évaluer la fonction chasse (fréquentation par les chasseurs/tableau de chasse) sur le

Discussion
175
Cassaïre est aussi un des critères jugeant de l’efficacité du projet de restauration et de sa
part sociale.
La restauration à l’échelle du marais et la mise en place de la première année de
chasse en septembre 2012, sont trop récentes pour qu’une évaluation dans ce sens puisse
être faite. Cependant, à plus long terme, l’évaluation de la fonction de chasse, avec la
mise en perspective des tableaux de chasse et de la richesse spécifique en macrophytes
du marais restauré, comparée aux marais de chasse traditionnels, devrait permettre en
fonction des résultats, de promouvoir des remises en eau des marais plus tardives. Ces
mises en eau plus tardives si, comme nous le pensons, peuvent assurer une activité
cynégétique jugée convenable par les chasseurs et si ces mises en eau plus tardives
devenaient socialement acceptables voire bénéfiques (tableau de chasse, économie dans
la gestion de l’eau) pourraient contribuer à réduire la prolifération d’espèces invasives,
fréquentes dans les marais de chasse à mise en eau estivale.
L’approche service écosystémique ne peut cependant se substituer à des approches
plus traditionnelles visant la protection de la biodiversité (e.g. espèces patrimoniales,
espèces en danger, communauté de référence) et doit être utilisée de façon
complémentaire à d’autres indicateurs comme ceux utilisés par exemple dans cette
thèse. Les risques d’une démarche centrée sur les services écosystémiques, mettant en
exergue une vision non holistique mais utilitariste de l’écosystème, ont d’ailleurs été
largement exposés (Maris, 2010).
D.5. La place de la restauration écologique dans la société
Les expérimentations réalisées dans le cadre de cette thèse ont permis de tester des
techniques de restauration a priori pertinentes à large échelle. Elles soulignent néanmoins
la difficulté dans la restauration à appréhender plusieurs compartiments de l’écosystème
et a fortiori sa globalité. La perfectibilité des suivis de restauration entraîne souvent une
surestimation des gains de restauration (Chapitre 3.2, Regnery 2013). Un suivi à long
terme et la mise en place de différents indicateurs sont indispensables. Notre évaluation
sur trois années ne concerne que le début de la restauration, elle est donc partielle et
discutable. Elle coïncide néanmoins avec celle d’autres études, indiquant qu’un retour à

Discussion
176
l’état de référence est quasi-impossible (Holling and Meffe 1996; Fahselt 2007; Benayas et
al. 2009; Jaunatre 2012) mais souligne le bénéfice de la restauration pour la biodiversité.
L’écologie de la restauration apparaît donc bien comme un moyen pour maintenir la
biodiversité et contrôler son érosion.
Cependant, cette discipline est actuellement au centre de débats (Elliot 1982; Maris et
al. 2010) et provoque des craintes, en particulier sur son recours dans les projets
d’aménagements. Cette discipline dévaluerait et instrumentaliserait la nature et, loin de
contribuer aux objectifs définis par le plan stratégique pour la biodiversité (Convention
on Biological Diversity 2011), favoriserait, par effet pervers, la destruction des espaces
naturels. De nombreux projets de restauration écologique voient le jour dans le cadre de
mesures compensatoires suite au développement de projets d’aménagements
(Dunkerque LNG 2013; Dutoit and Oberlinkels 2013). La compensation écologique est la
dernière étape de la séquence « Eviter, Réduire, Compenser » (i.e. ERC) prévu par la
législation française dans le cas d’impact sur des espaces naturels. Comme l’indique son
nom, le but est de compenser les pertes, à travers des opérations d’acquisition ou de
restauration (Regnery 2013), pour atteindre des objectifs écologiques de zéro perte
nette. A ce titre, la multiplication de projets de restauration exclusivement financés dans
le cadre de mesures compensatoires en particulier avec la mise en place récente de
banques d’actifs naturels (i.e. mécanisme de compensation par l’offre) (e.g. Réserves
d’Actifs Naturels mis en place par la CDC Biodiversité sur le projet Cossure (Chabran and
Napoléone 2013), opération expérimentale d’offre de compensation sur le site de Combe
Madame, initié par EDF (EDF 2013)) risquerait d’amoindrir les deux premiers volets du
triptyque ERC, et peuvent constituer une dérive vers la marchandisation de la
biodiversité. Les services instructeurs de l’Etat contrôlent le travail d’évitement ou de
réduction avant la mise en œuvre de compensation, mais de nombreux exemples
témoignent de l’existence de failles dans l’application de cette séquence (Chabran and
Napoléone 2013). Les questions posées par ces dérives potentielles correspondent très
exactement à certaines questions posées dans notre travail « quel est le gain de
biodiversité en restauration ? », « comment l’évaluation de cette restauration est-elle
prise en compte ? », « peut-on considérer qu’il n’y a pas de perte nette ? » et nécessitent
bien évidemment des réponses.

Discussion
177
L’écologie de la restauration ne doit pas se substituer à la protection de milieux
naturels, et justifier leurs destructions, mais venir en complément aux efforts de
conservation qu’il convient de consolider (Fahselt 2007).

Bibliographie
178
Bibliographie
Adams CR, Steigerwalt NM (2011) Methodology for Wetland Seedbank Assays. Ifas, University
of Florida.
Aerts R, Huiszoon A, Van Oostrum JHA, Vijer CADMVD, Willems JH (1995) The potential for heathland restoration on formerly arable land at a site in Drenthe, the Netherlands. J Appl Ecol 32 : 827–835.
Allison M, Ausden M (2004) Successful use of topsoil removal and soil amelioration to create heathland vegetation. Biol Conserv 120 : 221–228.
Andersen AN, Ludwig JA, Lowe LM, Rentz DCF (2001) Grasshopper biodiversity and bioindicators in Australian tropical savannas: responses to disturbance in Kakadu National Park. Austral Ecol 26 : 213–222.
Anderson MJ (2001) A new method for non-parametric multivariate analysis of variance. Austral Ecol 26 : 32–46.
Anderson P (1995) Ecological restoration and creation: a review. Biol J Linn Soc 56 : 187–211.
Aradottir AL (2012) Turf transplants for restoration of alpine vegetation: does size matter? J. Appl. Ecol. 49 : 439–446.
Aronson J, Floc’h E (1996) Vital landscape attributes: missing tools for restoration ecology. Restor Ecol 4:377–387.
Aronson J, Floret C, Floc’h E, Ovalle C, Pontanier R (1993) Restoration and Rehabilitation of Degraded Ecosystems in Arid and Semi-Arid Lands. II. Case Studies in Southern Tunisia, Central Chile and Northern Cameroon. Restor Ecol 1 : 168–187.
Ash HJ, Gemmell RP, Bradshaw AD (1994) The introduction of native plant species on industrial waste heaps: a test of immigration and other factors affecting primary succession. J Appl Ecol 31 : 74–84.
Aznar JC, Dervieux A, Grillas P (2003) Association between aquatic vegetation and landscape indicators of human pressure. Wetlands 23 : 149–160.
Badosa A, Frisch D, Arechederra A, et al. (2010) Recovery of zooplankton diversity in a restored
Mediterranean temporary marsh in Doñana National Park (SW Spain). Hydrobiologia 654 : 67–82.
Baer SG, Engle DM, Knops JM, Langeland KA, Maxwell BD, Menalled FD, Symstad AJ (2009) Vulnerability of rehabilitated agricultural production systems to invasion by nontarget plant species. Environ Manage 43 : 189–196.
Bakelaar RG, Odum EP (1978) Community and population level responses to fertilization in an old-field ecosystem. Ecology 59 : 660–665.

Bibliographie
179
Bakker ES, Ritchie ME, Olff H, Milchunas DG, Knops JMH (2006) Herbivore impact on grassland plant diversity depends on habitat productivity and herbivore size. Ecol Lett 9 : 780–788.
Bakker JP, Grootjans AP, Hermy M, Poschlod P (2000) How to define targets for ecological restoration?-Introduction. Appl Veg Sci 3 : 3–6.
Bakker JP, Poschlod P, Strykstra RJ, Bekker RM, Thompson K (1996) Seed banks and seed dispersal: important topics in restoration ecology. Acta Bot Neerlandica 45 : 461–490.
Balcombe CK, Anderson JT, Fortney RH, Rentch J, Grafton, Kordek W (2005a) A comparison of plant communities in mitigation and reference wetlands in the mid-Appalachians. Wetlands 25 : 130–142.
Balcombe CK, Anderson JT, Fortney RH, Kordek WS (2005b) Aquatic macroinvertebrate assemblages in mitigated and natural wetlands. Hydrobiologia 541 : 175–188.
Barnes LE (1983) The colonization of ball-clay ponds by macroinvertebrates and macrophytes. Freshw Biol 13 : 561–578.
Barnosky AD, Hadly EA, Bascompte J, Berlow EL, Brown JH, Fortelius M, Getz WM, Harte J, Hastings A, Marquet PA, Martinez ND, Mooers A, Roopnarine P, Vermeij G, Williams JW, Gillespie R, Kitzes J, Marshall C, Matzke N, Mindell DP, Revilla E, Smith AB (2012) Approaching a state shift in Earth’s biosphere. Nature 486 : 52–58.
Beas BJ, Smith LM, Hickman KR, LaGrangec TG, Stutheitc R (2013) Seed bank responses to wetland restoration: Do restored wetlands resemble reference conditions following sediment removal? Aquat. Bot. 108 : 7–15.
Bedford BL (1996) The need to define hydrologic equivalence at the landscape scale for freshwater wetland mitigation. Ecol Appl 6 : 57–68.
Bell SS, Fonseca MS, Motten LB (1997) Linking restoration and landscape ecology. Restor Ecol 5 : 318–323.
Benayas JMR, Newton AC, Diaz A, Bullock JM (2009) Enhancement of biodiversity and ecosystem services by ecological restoration: a meta-analysis. Science 325 : 1121–1124.
Bischoff A (2002) Dispersal and establishment of floodplain grassland species as limiting factors in restoration. Biol Conserv 104 : 25–33.
Block WM, Franklin AB, Ward JP, et al. (2001) Design and implementation of monitoring studies to evaluate the success of ecological restoration on wildlife. Restor Ecol 9 : 293–303.
Bobbink R, Hornung M, Roelofs JG (1998) The effects of air-borne nitrogen pollutants on species diversity in natural and semi-natural European vegetation. J Ecol 86 : 717–738.
Bobbink R, Willems JH (1993) Restoration management of abandoned chalk grassland in the Netherlands. Biodivers Conserv 2 : 616–626.
De Boeck HJ, Lemmens CMHM, Zavalloni C, et al. (2008) Biomass production in experimental grasslands of different species richness during three years of climate warming. Biogeosciences 5 : 585–594.

Bibliographie
180
Bohonak AJ, Whiteman HH (1999) Dispersal of the fairy shrimp Branchinecta coloradensis (Anostraca): Effects of hydroperiod and salamanders. Limnol Ocean 44 : 487–493.
Bonis A (1998) Coexistence in a variable and unpredictable habitat: the importance of the seed bank and contrasted regeneration niche for annual plants in temporary pools. Arch Für Hydrobiol Spec Issues Adv Limnol 52 : 53–69.
Bonis A, Grillas P (2002) Deposition, germination and spatio-temporal patterns of charophyte propagule banks: a review. Aquat Bot 72 : 235–248.
Bonis A, Lepart J (1994) Vertical structure of seed banks and the impact of depth of burial on recruitment in two temporary marshes. Plant Ecol 112 : 127–139.
Bonis A, Lepart J, Grillas P (1995) Seed bank dynamics and coexistence of annual macrophytes in a temporary and variable habitat. Oikos 74 : 81–92.
Bornette G, Amoros C, Lamouroux N (1998) Aquatic plant diversity in riverine wetlands: the role of connectivity. Freshw Biol 39 : 267–283.
Bornette G, Puijalon S (2011) Response of aquatic plants to abiotic factors: a review. Aquat Sci 73 : 1–14.
Bossuyt B, Honnay O (2009) Can the seed bank be used for ecological restoration? An overview of seed bank characteristics in European communities. J Veg Sci 19 : 875–884.
Bradshaw AD (1996) Underlying principles of restoration. Can J Fish Aquat Sci 53 : 3–9.
Bradshaw AD (1987) Restoration: an acid test for ecology. In : Restor. Ecol. Synth. Approach Ecol. Res. Cambridge University Press, Cambridge, pp 23–29.
Brady VJ, Cardinale BJ, Gathman JP, Burton TM (2002) Does facilitation of faunal recruitment benefit ecosystem restoration? An experimental study of invertebrate assemblages in wetland mesocosms. Restor Ecol 10 : 617–626.
Braun-Blanquet J (1973) Fragmenta phytosociologica mediterranea I. Plant Ecol 27 : 101–113.
Braun-Blanquet J, Roussine N, Nègre R (1952) Les groupements végétaux de la France méditerranéenne. CNRS, Paris, France.
Brochet AL, Guillemain M, Fritz H, Gauthier-Clerc M, Green AJ (2010a) Plant dispersal by teal (Anas crecca) in the Camargue: duck guts are more important than their feet. Freshw Biol 55 : 1262–1273.
Brochet A-L, Guillemain M, Gauthier-Clerc M, Fritz H, Green AJ (2010b) Endozoochory of Mediterranean aquatic plant seeds by teal after a period of desiccation: Determinants of seed survival and influence of retention time on germinability and viability. Aquat Bot 93 : 99–106.
Brock MA, Nielsen DL, Shiel RJ, Grenn JD, Langley JD (2003) Drought and aquatic community resilience: the role of eggs and seeds in sediments of temporary wetlands. Freshw Biol 48 : 1207–1218.

Bibliographie
181
Brooker RW, Maestre FT, Callaway RM, Lortie CL, Cavieres LA, Kunstler G, Liancourt P, Tielbörger K, Travis JMJ, Anthelme F, Armas C, Coll L, Corcket E, Delzon S, Forey E, Kikvidze Z, Olofsson J, Pugnaire F, Quiroz CL, Saccone P, Schiffers K, Seifan M, Touzard B, Michalet R (2008) Facilitation in plant communities: the past, the present, and the future. J Ecol 96 : 18–34.
Brown JH (1995) Organisms as engineers: a useful framework for studying effects on ecosystems? Trends Ecol Evol 10 : 51–52.
Brown S, Bedford B (1997) Restoration of wetland vegetation with transplanted wetland soil: An experimental study. Wetlands 17 : 424–437.
Brown SC, Smith K, Batzer D (1997) Macroinvertebrate responses to wetland restoration in northern New York. Environ Entomol 26 : 1016–1024.
Bruno JF, Stachowicz JJ, Bertness MD (2003) Inclusion of facilitation into ecological theory. Trends Ecol Evol 18 : 119–125.
Buisson E (2011) Community and restoration ecology, importance of disturbance, natural resilience and assembly rules. Thèse d’Habilitation à Diriger les Recherches, Université d’Avignon et des Pays de Vaucluse.
Buisson E, Anderson S, Holl KD, Corcket E, Hayes GF, Toore F, Petters A, Dutoit T (2008) Reintroduction of Nassella pulchra to California coastal grasslands: Effects of topsoil removal, plant neighbour removal and grazing. Appl Veg Sci 11 : 195–204.
Buisson E, Dutoit T, Torre F, Römermann C, Poschlod P (2006a) The implications of seed rain and seed bank patterns for plant succession at the edges of abandoned fields in Mediterranean landscapes. Agric Ecosyst Environ 115 : 6–14.
Buisson E, Holl KD, Anderson S, Corcket E, Hayes GF, Toore F, Petters A, Dutoit T (2006b) Effect of Seed Source, Topsoil Removal, and Plant Neighbor Removal on Restoring California Coastal Prairies. Restor Ecol 14 : 569–577.
Bullock JM (1998) Community translocation in Britain: Setting objectives and measuring consequences. Biol Conserv 84 : 199–214.
Bullock JM, Aronson J, Newton AC, Pywell RF, Benayas JMR (2011) Restoration of ecosystem services and biodiversity: conflicts and opportunities. Trends Ecol Evol 26 : 541–549.
Burel F, Garnier E, Amiaud B, et al. (2008) Les effets de l’agriculture sur la biodiversité. Agriculture et biodiversité, Paris, France.
Burkholder JM (2009) Harmful Algal Blooms. In: Gene E. Likens Encycl. Inland Waters. Academic Press, Oxford, pp 264–285.
Cáceres CE (1997) Dormancy in invertebrates. Invertebr Biol 116 : 371–383.
Cairns J (1993) Is restoration ecology practical? Restor Ecol 1 : 3–7.
Callaway RM (2007) Positive interactions and interdependence in plant communities. Springer.

Bibliographie
182
Callaway RM, Walker LR (1997) Competition and facilitation: a synthetic approach to interactions in plant communities. Ecology 78 : 1958–1965.
Chabran F, Napoléone C (2013) Les conditions du développement des banques d’actifs naturels en France. Analyse du régime institutionnel de la première Réserve d’Actifs Naturels française. Développement Durable Territ. Économie Géographie Polit. Droit Sociol. 3: 1–14.
Chabrerie O, Alard D (2005) Comparison of three seed trap types in a chalk grassland: toward a standardised protocol. Plant Ecol 176 : 101–112.
Chase JM (2007) Drought mediates the importance of stochastic community assembly. Proc Natl Acad Sci 104 : 17430–17434.
Chase JM (2003) Community assembly: when should history matter? Oecologia 136 : 489–498.
Chauvelon P, Tournoud M-G, Sandoz A (2003) Integrated hydrological modelling of a managed coastal Mediterranean wetland (Rhone delta, France): initial calibration. Hydrol Earth Syst Sci Discuss 7 : 123–132.
Chauvet P (2012) La gestion de l’eau en Camargue. Chasser En Provence : 36–37.
Chave J (2004) Neutral theory and community ecology. Ecol Lett 7 : 241–253.
Chesson P (2000) Mechanisms of maintenance of species diversity. Annu Rev Ecol Syst 31 : 343–366.
Chesson P (1991) A need for niches? Trends Ecol Evol 6 : 26–28.
Chesson PL (1985) Coexistence of competitors in spatially and temporally varying environments: a look at the combined effects of different sorts of variability. Theor Popul Biol 28 : 263–287.
Chesson PL, Warner RR (1981) Environmental variability promotes coexistence in lottery competitive systems. Am Nat 117 : 923–943.
Chittapun S, Pholpunthin P, Segers H (2005) Restoration of tropical peat swamp rotifer communities after perturbation: an experimental study of recovery of rotifers from the resting egg bank. Hydrobiologia 546 : 281–289.
Choi YD (2007) Restoration ecology to the future: a call for new paradigm. Restor Ecol 15 : 351–353.
Choi YD (2004) Theories for ecological restoration in changing environment: toward “futuristic”restoration. Ecol Res 19 : 75–81.
Choi YD, Temperton VM, Allen EB, Grootjans AP, Halassy M, Hobbs RJ, Naeth MA, Torok K (2008) Ecological restoration for future sustainability in a changing environment. Ecoscience 15 : 53–64.
Chovanec A, Raab R (1997) Dragonflies (Insecta, Odonata) and the ecological status of newly created wetlands– examples for long-term bioindication programmes. Limnologica 27 : 381–392.

Bibliographie
183
Christian K, Isabelle LV, Frédéric J, Vincent D (2009) More species, fewer specialists: 100 years of changes in community composition in an island biogeographical study. Divers Distrib 15 : 641–648.
Clark CJ, Poulsen JR, Levey DJ, Osenberg CW (2007) Are plant populations seed limited? a critique and meta-analysis of seed addition experiments. Am Nat 170 : 128–142.
Clements DR, Benott DL, Murphy SD, Swanton CJ (1996) Tillage effects on weed seed return and seedbank composition. Weed Sci 44 : 314–322.
Clements FE (1936) Nature and structure of the climax. J Ecol 24 : 252–284.
Clements FE (1916) Plant succession: an analysis of the development of vegetation. Carnegie Institution of Washington.
Clewell AF, Aronson J (2006) Motivations for the restoration of ecosystems. Conserv Biol 20 :420–428.
Clewell AF, Aronson J (2007) Ecological restoration: principles, values, and structure of an emerging profession. Island Press.
Coiffait-Gombault C, Buisson E, Dutoit T (2011) Hay transfer promotes establishment of Mediterranean steppe vegetation on soil disturbed by pipeline construction. Restor Ecol 19 : 214–222.
Coiffait-Gombault C, Buisson E, Dutoit T (2012) Using a two-phase sowing approach in restoration: sowing foundation species to restore, and subordinate species to evaluate restoration success. Appl Veg Sci 15 : 277–289.
Colin JLA (1904) Annibale en Gaule. R. Chapelot et cie.
Collinge SK, Ray C (2009) Transient patterns in the assembly of vernal pool plant communities. Ecology 90 : 3313–3323.
Combes F (1989) Restauration des terrains en montagne. Du rêve à la réalité.
Combroux ICS, Bornette G (2004) Propagule banks and regenerative strategies of aquatic plants. J Veg Sci 15 : 13–20.
Connell JH (1978) Diversity in tropical rain forests and coral reefs. Science 199 : 1302–1310.
Connell JH, Slatyer RO (1977) Mechanisms of succession in natural communities and their role in community stability and organization. Am Nat 111 : 1119–1144.
Conservatoire Botanique National Méditerranée (2012) Méthodologie Liste noire - Méthodologie et liste noire 2012, CBNMed.
Convention on Biological Diversity (2011) Ways and means to support ecosystem restoration.
Cooper SD (1983) Selective predation on cladocerans by common pond insects. Can J Zool 61 : 879–886.

Bibliographie
184
Cramer VA, Hobbs RJ, Standish RJ (2008) What’s new about old fields? Land abandonment and ecosystem assembly. Trends Ecol Evol 23 : 104–112.
Cristescu RH, Rhodes J, Frere C, Banks PB (2013) Is restoring flora the same as restoring fauna? Lessons learned from koalas and mining rehabilitation. J. Appl. Ecol. 50 : 423–431.
Cristofoli S, Mahy G (2010) Restauration écologique: contexte, contraintes et indicateurs de suivi. Biotechnol. Agron. Société Environ. Biotechnol. Agron. Soc. Environ. 14: 203–211.
Damgaard C, Merlin A, Mesléard F, Bonis A (2010) The demography of space occupancy:
measuring plant colonization and survival probabilities using repeated pin-point measurements. Methods Ecol Evol 2 : 110–115.
Davis MA, Chew MK, Hobbs RJ, Lugo AE, Ewel JJ, Vermeij GJ, Brown JH, RosenzweigML, Gardener MR, Carroll SP, Thompson K, Pickett STA, Stromberg JC, Tredici PD, Suding KN, Ehrenfeld JG, Grime JP, MascaroJ, Briggs JC (2011) Don’t judge species on their origins. Nature 474 : 153–154.
Davy AJ (2008) Establishment and manipulation of plant populations and communities in terrestrial systems.In : Handb Ecol Restor Vol 1. Cambrigde University Press, Cambridge, pp. 223–241.
Dawe NK, Bradfield GE, Boyd WS, Trethewey DEC, Zolbrod AN (2000) Marsh creation in a northern Pacific estuary: is thirteen years of monitoring vegetation dynamics enough? Conserv Ecol 4 : 12.
De Steven D, Sharitz RR, Singer JH, Barton CD (2006) Testing a passive revegetation approach for restoring coastal plain depression wetlands. Restor Ecol 14 : 452–460.
Del Moral R, Wood DM, Titus JH (2005) Proximity, microsites, and biotic interactions during early succession. In : Ecol. Responses 1980 Erupt. Mt. St Helens. Springer, pp 93–109.
Dodson SI, Lillie RA (2001) Zooplankton communities of restored depressional wetlands in Wisconsin, USA. Wetlands 21 : 292–300.
Donadieu P (2002) Les références en écologie de la restauration. Rev Décologie Supplément 9 : 109–119.
Donath TW, Bissels S, Hölzel N, Otte A (2007) Large scale application of diaspore transfer with plant material in restoration practice–Impact of seed and microsite limitation. Biol Conserv 138 : 224–234.
Donath TW, Holzel N, Otte A (2003) The impact of site conditions and seed dispersal on restoration success in alluvial meadows. Appl Veg Sci 6 : 13–22.
Drake JA (1990) The mechanics of community assembly and succession. J Theor Biol 147 : 213–233.
Dray S, Dufour AB, Chessel D (2007) The ade4 package II: Two-table and K-table methods. R News 7 : 47–52.

Bibliographie
185
Duelli P, Obrist MK (2003) Biodiversity indicators: the choice of values and measures. Agric Ecosyst Environ 98 : 87–98.
Dunkerque LNG (2013) Mesures compensatoires: Echange terminal methanier contre Espace naturel sensible. Courr Nat : 11–12.
Dutoit T, Buisson E, Roche P, Alard D (2004) Land use history and botanical changes in the calcareous hillsides of Upper-Normandy (north-western France): new implications for their conservation management. Biol Conserv 115 : 1–19.
Dutoit T, Oberlinkels M (2013) Compensation par l’offre: Premier bilan de la réserve d’actifs naturels de Cossure (plaine de la Crau, Bouches-du-Rhône). Courr Nat : 8–11.
EDF (2013) Opération experimantale d’offre de compensation. Site de la Combe Madame.
Edwards AR, Mortimer SR, Lawson CS, Westbury DB, Harris SJ, Woodcock BA, Brown VK (2007) Hay strewing, brush harvesting of seed and soil disturbance as tools for the enhancement of botanical diversity in grasslands. Biol Conserv 134 : 372–382.
Ehrenfeld JG, Toth LA (1997) Restoration ecology and the ecosystem perspective. Restor Ecol 5 : 307–317.
Ehrlich PR, Ehrlich AH (1992) The value of biodiversity. Ambio Stockh 21 : 219–226.
Eitam A, Noreña C, Blaustein L (2004) Microturbellarian species richness and community similarity among temporary pools: relationships with habitat properties. Biodivers Conserv 13 : 2107–2117.
Ejrnæs R, Bruun HH, Graae BJ (2006) Community assembly in experimental grasslands: suitable environment or timely arrival? Ecology 87 : 1225–1233.
Elliot R (1982) Faking nature. Inquiry 25 : 81–93.
Elmarsdottir A, Aradottir AL, Trlica MJ (2003) Microsite availability and establishment of native species on degraded and reclaimed sites. J Appl Ecol 40 : 815–823.
Español C, Gallardo B, Pino MR, Martín A, Comín FA (2012) Is net ecosystem production higher in natural relative to constructed wetlands? Aquat Sci. : 1–13.
Etienne M, Aronson J, Le Floc’h E (1998) Abandoned lands and land use conflicts in southern France. In : Landsc. Disturb. Biodivers. Mediterr.-Type Ecosyst. Springer, pp 127–140.
European Commission (1992) Council Directive 92/43/EEC of 21 May 1992 on the conservation of natural habitats and of wild fauna and flora. Off J Eur Communities : 206:07.
European Commission (2000) Council Directive 2000/60/EC of 23 October 2000 on framework for Community action in the field of water policy. Off J Eur Communities : 327:72.
Fahselt D (2007) Is transplanting an effective means of preserving vegetation? Botany 85 : 1007–
1017.

Bibliographie
186
Falk DA, Palmer MA, Zedler JB (2006) Foundations of restoration ecology. Island Press Washington.
Fattorini M, Halle S (2004) The dynamic environmental filter model: how do filtering effects change in assembling communities after disturbance. In : Assem Rules Restor Ecol Bridg Gap Theory Pr. Island Press, Washington, pp. 96–114.
Figuerola J, Green AJ (2002a) Dispersal of aquatic organisms by waterbirds: a review of past research and priorities for future studies. Freshw Biol 47 : 483–494.
Figuerola J, Green AJ (2002b) How frequent is external transport of seeds and invertebrate eggs by waterbirds? A study in Dofiana, SW Spain. Arch Hydrobiol 155 : 557–565.
Figuerola J, Green AJ, Santamaría L (2002) Comparative dispersal effectiveness of wigeongrass seeds by waterfowl wintering in south-west Spain: quantitative and qualitative aspects. J Ecol 90 : 989–1001.
Findlay SEG, Kiviat E, Nieder WC, Blair EA (2002) Functional assessment of a reference wetland set as a tool for science, management and restoration. Aquat Sci-Res Boundaries 64 : 107–117.
Fischer SF, Poschlod P, Beinlich B (1996) Experimental studies on the dispersal of plants and animals on sheep in calcareous grasslands. J Appl Ecol 33 : 1206–1222.
Fox JW (2012) The intermediate disturbance hypothesis should be abandoned. Trends Ecol. Evol. 28 : 86–92.
Fukami T, Martijn Bezemer T, Mortimer SR, Putten WH (2005) Species divergence and trait convergence in experimental plant community assembly. Ecol Lett 8 : 1283–1290.
Fukami T, Nakajima M (2011) Community assembly: alternative stable states or alternative transient states? Ecol Lett 14 : 973–984.
Galatowitsch SM, Valk AG (1996) Vegetation and environmental conditions in recently restored
wetlands in the prairie pothole region of the USA. Plant Ecol 126 : 89–99.
Garbey C, Thiébaut G, Muller S (2004) Morphological plasticity of a spreading aquatic macrophyte, Ranunculus peltatus, in response to environmental variables. Plant Ecol 173 : 125–137.
Gargominy O, Tercerie S, Daszkiewicz P (2013) TAXREF v6.0, référentiel taxonomique pour la France. Méthodologie, mise en oeuvre et diffusion.
Gauthier-Clerc M, Mesléard F, Blondel J (2013) Ecologie de la conservation, De Boeck éditions. Paris.
Gibson CWD, Brown VK (1992) Grazing and vegetation change: deflected or modified succession? J Appl Ecol 29 : 120–131.
Gleason HA (1926) The individualistic concept of the plant association. Bull Torrey Bot Club 53 : 7–26.

Bibliographie
187
Gleason RA, Euliss NH, Hubbard DE, Duffy WG (2004) Invertebrate egg banks of restored, natural, and drained wetlands in the prairie pothole region of the United States. Wetlands 24 : 562–572.
Glenn-Lewin DC, Peet RK, Veblen TT (1992) Plant succession: theory and prediction. Springer.
Gobster PH, Hull RB (2000) Restoring nature: perspectives from the social sciences and humanities. Island Press.
Gotelli NJ (2000) Null model analysis of species co-occurrence patterns. Ecology 81 : 2606–2621.
Gotelli NJ, McCabe DJ (2002) Species co-occurrence: a meta-analysis of JM Diamond’s assembly rules model. Ecology 83 : 2091–2096.
Gough MW, Marrs RH (1990) A comparison of soil fertility between semi-natural and agricultural plant communities: Implications for the creations of species-rich grassland on abondoned agricultural land. Biol Conserv 51 : 83–96.
Graham DJ, Hutchings MJ (1988) Estimation of the seed bank of a chalk grassland ley established on former arable land. J Appl Ecol 25 : 241–252.
Green AJ, Figuerola J (2005) Recent advances in the study of long-distance dispersal of aquatic invertebrates via birds. Divers Distrib 11 : 149–156.
Greenacre MJ (1984) Theory and applications of correspondence analysis. Academic Press, London.
Greene DF, Johnson EA (1996) Wind dispersal of seeds from a forest into a clearing. Ecology 77 : 595–609.
Greene DF, Johnson EA (1989) A model of wind dispersal of winged or plumed seeds. Ecology 70: 339–347.
Grillas P (1990) Distribution of submerged macrophytes in the Camargue in relation to environmental factors. J Veg Sci 1 : 393–402.
Grillas P, Duncan P (1986) On the distribution and abundance of submerged macrophytes in temporary marshes in the Camargue (S. France). In : Proc 7th Symp Aquat. Weeds. pp 133–141.
Grillas P, Garcia-Murillo P, Geertz-Hansen O, Montes NMC, Duarte CM, Ham LT, Grossmann A (1993) Submerged macrophyte seed bank in a Mediterranean temporary marsh: abundance and relationship with established vegetation. Oecologia 94 : 1–6.
Grillas P, Gauthier P, Yavercovski N, Perennou C (2004) Les mares temporaires méditerranéennes. Tour du Valat, France.
Grime JP (1977) Evidence for the existence of three primary strategies in plants and its relevance to ecological and evolutionary theory. Am Nat 111 : 1169–1194.
Grime JP (1998) Benefits of plant diversity to ecosystems: immediate, filter and founder effects. J Ecol 86 : 902–910.

Bibliographie
188
Grime JP (1979) Plant strategies and vegetation processes. Wiley.
Grime JP (1973) Competitive exclusion in herbaceous vegetation. Nat UK 242 : 344–347.
Grinnell J (1917) The niche-relationships of the California Thrasher. The Auk 34 : 427–433.
Grubb PJ (1977) The maintenance of species-richness in plant communities: the importance of the regeneration niche. Biol Rev 52 : 107–145.
Guillaume CP (1975) Reptiles et Batraciens de Grande Camargue: Approche comparative avec la faune des Marismas (Sudouest de l’Espagne). Thèse. Université des Sciences et Techniques du Languedoc, France.
Guisan A, Rahbek C (2011) SESAM–a new framework integrating macroecological and species distribution models for predicting spatio-temporal patterns of species assemblages. J Biogeogr 38 : 1433–1444.
Hagen D, Evju M (2013) Using Short-Term Monitoring Data to Achieve Goals in a Large-Scale
Restoration. Ecol Soc 18 : 18:29.
Harper JL (1977) Population biology of plants.
Harris JA, Hobbs RJ, Higgs E, Aronson J (2006) Ecological restoration and global climate change. Restor Ecol 14 : 170–176.
Heck KLJ, Crowder LB (1991) Habitat structure and predator-prey interactions in vegetated aquatic systems. In : Habitat Struct. Springer Netherlands, pp. 281–299.
Heurteaux P (1970) Rapports des eaux souterraines avec les sols halomorphes et la végétation en Camargue. Terre Vie 24 : 467–510.
Heurteaux P (1976) Climatologie des années 1974 et 1975 en moyenne Camargue. Terre Vie 30 : 619–627.
Hilty JA, Lidicker Jr WZ, Merenlender A (2006) Corridor ecology: the science and practice of linking landscapes for biodiversity conservation. Island Press.
Hirst RA, Pywell RF, Marrs RH, Putwain PD (2003) The resistance of a chalk grassland to disturbance. J Appl Ecol 40 : 368–379.
Hobbs RJ, Arico S, Aronson J, Baron JS, Bridgewater P, Cramer VK, Epstein PR Ewel JJ, Klink CA, Lugo AE, Norton D, Ojima D, Richardson DM, Sanderson EW, Valladares F, Vilà M, Zamora R, Zobel M (2006) Novel ecosystems: theoretical and management aspects of the new ecological world order. Glob Ecol Biogeogr 15 : 1–7.
Hobbs RJ, Cramer VA (2007) Old field dynamics: regional and local differences, and lessons for ecology and restoration. In : Old Fields Dyn Restor Abandon Farml. Island Press, pp. 309–318.

Bibliographie
189
Hobbs RJ, Groves RH, Hopper SD, Lambeck RJ, Lamont BB, Lavorel S, Main AR, Majer JD, Saunders DA (1995) Function of biodiversity in the mediterranean-type ecosystems of southwestern Australia.In : Mediterr.-Type Ecosyst. Springer, pp. 233–284.
Hobbs RJ, Higgs E, Harris JA (2009) Novel ecosystems: implications for conservation and restoration. Trends Ecol Evol 24 : 599–605.
Hobbs RJ, Norton DA (2004) Ecological filters, thresholds, and gradients in resistance to ecosystem reassembly. In : Assem Rules Restor Ecol Isl. Press Wash DC, pp. 72–95.
Hobbs RJ, Norton DA (1996) Towards a conceptual framework for restoration ecology. Restor Ecol 4 : 93–110.
Holling CS (1978) Adaptive environmental assessment and management.
Holling CS, Meffe GK (1996) Command and control and the pathology of natural resource management. Conserv Biol 10 : 328–337.
Hollis GE (1992) The causes of wetland loss and degradation in the Mediterranean. Manag Mediterr Wetl Their Birds 20 : 83–90.
Holm S (1979) A simple sequentially rejective multiple test procedure. Scand J Stat : 65–70.
Hölzel N, Buisson E, Dutoit T (2012) Species introduction–a major topic in vegetation restoration. Appl Veg Sci 15 6 : 161–165.
Hölzel N, Otte A (2003) Restoration of a species-rich flood meadow by topsoil removal and diaspore transfer with plant material. Appl Veg Sci 6 : 131–140.
Hooper DU, Chapin Iii FS, Ewel JJ, Hector A, Inchausti P, Lavorel S, Lawton JH, Lodge DM, Loreau M, Naeem S, Schmid B, Setälä H, Symstad AJ, Vandermeer J, Wardle DA (2005) Effects of biodiversity on ecosystem functioning: a consensus of current knowledge. Ecol Monogr 75 : 3–35.
Hopfensperger KN (2007) A review of similarity between seed bank and standing vegetation across ecosystems. Oikos 116 : 1438–1448.
Hosper S (1998) Stable states, buffers and switches: an ecosystem approach to the restoration and management of shallow lakes in the Netherlands. Water Sci Technol 37 : 151–164.
Hubbell SP (2005) Neutral theory in community ecology and the hypothesis of functional equivalence. Funct Ecol 19 : 166–172.
Hunter ML, Gibbs JP (2006) Fundamentals of Conservation Biology. John Wiley & Sons.
Hutchings MJ, Booth KD (1996) Studies on the feasibility of re-creating chalk grassland vegetation on ex-arable land. I. The potential roles of the seed bank and the seed rain. J Appl Ecol 33 : 1171–1181.
Huxley TH (1869) Nature: aphorisms by Goethe. Nature 1 : 9–11.

Bibliographie
190
Ilmonen J, Virtanen R, Paasivirta L, Muotka T (2013) Detecting restoration impacts in inter-
connected habitats: Spring invertebrate communities in a restored wetland. Ecol Indic 30 : 165–169.
Jabot F, Etienne RS, Chave J (2008) Reconciling neutral community models and environmental
filtering: theory and an empirical test. Oikos 117 : 1308–1320.
Jaccard P (1901) Etude comparative de la distribution florale dans une portion des Alpes et du Jura. Impr. Corbaz.
Jackson ST, Hobbs RJ (2009) Ecological restoration in the light of ecological history. Science 325 : 567–569.
Jaunatre R (2012) Dynamique et restauration d’une steppe méditerranéenne après changements d’usages (La Crau, Bouches-du-Rhône, France). Thèse, Université d’Avignon, France.
Jaunatre R, Buisson E, Dutoit T (2012) First-year results of a multi-treatment steppe restoration experiment in La Crau (Provence, France). Plant Ecol Evol 145 : 13–23.
Jaunatre R, Buisson E, Dutoit T (2013a) Topsoil removal improves various restoration treatments of a Mediterranean steppe (La Crau, southeast France). Appl. Veg. Sci..
Jaunatre R, Buisson E, Muller I, et al. (2013b) New synthetic indicators to assess community resilience and restoration success. Ecol Indic 29 : 468–477.
Jenkins DG, Underwood MO (1998) Zooplankton may not disperse readily in wind, rain, or waterfowl. Hydrobiologia 387 : 15–21.
Jírová A, Klaudisová A, Prach K (2012) Spontaneous restoration of target vegetation in old-fields in a central European landscape: a repeated analysis after three decades. Appl. Veg. Sci. 15 : 245–252.
Johnstone IM (1986) Plant invasion windows: a time-based classification of invasion potential. Biol Rev 61 : 369–394.
Jones CG, Lawton JH (1995) Linking species and ecosystems. Springer.
Jones CG, Lawton JH, Shachak M (1994) Organisms as ecosystem engineers. Oikos 69 : 373–386.
Jongepierová I, Mitchley J, Tzanopoulos J (2007) A field experiment to recreate species rich hay meadows using regional seed mixtures. Biol Conserv 139 : 297–305.
Jordan WR, Gilpin ME (1987) Restoration ecology: a synthetic approach to ecological research. Cambridge University Press, Cambridge.
Kalamees R, Zobel M (2002) The role of the seed bank in gap regeneration in a calcareous
grassland community. Ecology 83 : 1017–1025.

Bibliographie
191
Kaplan D, Oron T, Gutman M (1998) Development of macrophytic vegetation in the Agmon Wetland of Israel by spontaneous colonization and reintroduction. Wetl Ecol Manag 6 : 143–150.
Kardol P, Souza L, Classen AT (2013) Resource availability mediates the importance of priority effects in plant community assembly and ecosystem function. Oikos 122 : 84–94.
Katz E (2000) Another look at restoration: technology and artificial nature.In : Restoring Nat Perspect Soc Sci Humanit, pp. 37–48.
Keddy PA (1992) Assembly and response rules: two goals for predictive community ecology. J Veg Sci 3 : 157–164.
Keesing V, Wratten SD (1998) Indigenous invertebrate components in ecological restoration in agricultural landscapes. New Zealand J Ecol 22 : 99–104.
Kettenring KM, Galatowitsch SM (2011) Seed rain of restored and natural prairie wetlands. Wetlands 31 : 283–294.
Kiehl K, Kirmer A, Donath TW, Rasran L, Hölzel N (2010) Species introduction in restoration projects–Evaluation of different techniques for the establishment of semi-natural grasslands in Central and Northwestern Europe. Basic Appl Ecol 11 : 285–299.
Kiehl K, Thormann A, Pfadenhauer J (2006) Evaluation of initial restoration measures during the restoration of calcareous grasslands on former arable fields. Restor Ecol 14 : 148–156.
Kiehl K, Wagner C (2006) Effect of Hay Transfer on Long-Term Establishment of Vegetation and Grasshoppers on Former Arable Fields. Restor Ecol 14 : 157–166.
Kinlan BP, Gaines SD (2003) Propagule dispersal in marine and terrestrial environments: a community perspective. Ecology 84 : 2007–2020.
Kinlan BP, Gaines SD, Lester SE (2005) Propagule dispersal and the scales of marine community process. Divers Distrib 11 : 139–148.
Kirmer A, Mahn E-G (2001) Spontaneous and initiated succession on unvegetated slopes in the abandoned lignite-mining area of Goitsche, Germany. Appl Veg Sci 4 : 19–27.
Klimkowska A, Dzierża P, Brzezińska K, Kotowski W, Mędrzycki P (2010a) Can we balance the high costs of nature restoration with the method of topsoil removal? Case study from Poland. J Nat Conserv 18 : 202–205.
Klimkowska A, Kotowski W, Van Diggelen R, Grootjans AP, Dzierża P, Brzezińska K (2010b) Vegetation Re-development After Fen Meadow Restoration by Topsoil Removal and Hay Transfer. Restor Ecol 18 : 924–933.
Koch JM (2007) Alcoa’s mining and restoration process in South Western Australia. Restor Ecol 15 : S11–S16.
Körner C, Stöcklin J, Reuther-Thiébaud L, Pelaez-Riedl S (2008) Small differences in arrival time influence composition and productivity of plant communities. New Phytol 177 : 698–705.

Bibliographie
192
Korsu K (2004) Response of benthic invertebrates to disturbance from stream restoration: the importance of bryophytes. Hydrobiologia 523 : 37–45.
Krebs CJ (1972) Ecology: the experimental analysis of distribution and abundance. Harper and Row, New York.
LaSalle MW, Landin MC, Sims JG (1991) Evaluation of the flora and fauna of aSpartina alterniflora
marsh established on dredged material in Winyah Bay, South Carolina. Wetlands 11 : 191–208.
Layton RJ, Voshell JR (1991) Colonization of new experimental ponds by benthic macroinvertebrates. Environ Entomol 20 : 110–117.
Leck MA (2003) Seed-bank and vegetation development in a created tidal freshwater wetland on the Delaware River, Trenton, New Jersey, USA. Wetlands 23 : 310–343.
Lemaire S, Tamisier A, Gagnier F (1987) Surface, distribution et diversité des principaux milieux de Camargue: leur évolution de 1942 à 1984. Rev D’écologie : 47–56.
Lencová K, Prach K (2011) Restoration of hay meadows on ex-arable land: commercial seed mixtures vs. spontaneous succession. Grass Forage Sci 66 : 265–271.
Leopold A (1999) For the health of the land: Previously unpublished essays and other writings. Island Press.
Lepš J (1999) Nutrient status, disturbance and competition: an experimental test of relationships in a wet meadow. J Veg Sci 10 : 219–230.
Lepš J, Doleẑal J, Bezemer TM, Brown VK, Hedlund K, Arroyo MI, Putten WH (2007) Long-term effectiveness of sowing high and low diversity seed mixtures to enhance plant community development on ex-arable fields. Appl Veg Sci 10 : 97–110.
Levin LA, Talley D, Thayer G (1996) Succession of macrobenthos in a created salt marsh. Mar Ecol Prog Ser Oldendorf 141: 67–82.
Levin SA (1989) Challenges in the development of a theory of community and ecosystem structure and function. Perspect Ecol Theory 242.
Light A (2009) Ecological restoration and the culture of nature: A pragmatic perspective. Readings Philos Technol.
Longcore T (2003) Terrestrial arthropods as indicators of ecological restoration success in coastal sage scrub (California, USA). Restor Ecol 11 : 397–409.
Lortie CJ, Brooker RW, Choler P, et al. (2004) Rethinking plant community theory. Oikos 107 : 433–438.
Louette G, Declerck S, Vandekerkhove J, De Meester L (2009) Evaluation of Restoration Measures in a Shallow Lake through a Comparison of Present Day Zooplankton Communities with Historical Samples. Restor Ecol 17 : 629–640.

Bibliographie
193
Luken JO (1990) Directing ecological succession. Chapman & Hall.
Lulow ME (2006) Invasion by Non-Native Annual Grasses: The Importance of Species Biomass, Composition, and Time Among California Native Grasses of the Central Valley. Restor Ecol 14 : 616–626.
Lynch M (1979) Predation, competition, and zooplankton community structure: An experimental study. Limnol Ocean 24 : 253–272.
MacArthur RH, Wilson EO (1967) The theory of island biogeography. Princeton University
Press.
Mackey RL, Currie DJ (2001) The diversity-disturbance relationship: is it generally strong and peaked? Ecology 8 2: 3479–3492.
Maestre FT, Cortina J (2004) Are Pinus halepensis plantations useful as a restoration tool in semiarid Mediterranean areas? For Ecol Manag 198 : 303–317.
Maestre FT, Escolar C, Martínez I, Escudero A (2008) Are soil lichen communities structured by biotic interactions? A null model analysis. J Veg Sci 19 : 261–266.
Manchester SJ, McNally S, Treweek JR, Sparks TH, Mountford JO (1999) The cost and practicality of techniques for the reversion of arable land to lowland wet grassland-an experimental study and review. J Environ Manage 55 : 91–109.
Maris V (2010) Philosophie de la biodiversité. Petite Éthique Pour Une Nature En Péril. France.
Maris V, Mathevet R, Béchet A (2010) Figures de style sur la destruction de la biodiversité. Espac. Nat. 29.
Marnotte P, Carrara A, Dominati E, Girardot F (2006) Plantes des rizières de Camargue. CIRAD, Montpellier, France.
Marrs RH (2002) Manipulating the chemical environment of the soil. Handb Ecol Restor 1 : 155–183.
Marrs RH (1985) Techniques for reducing soil fertility for nature conservation purposes: a review in relation to research at Roper’s Heath, Suffolk, England. Biol Conserv 34 : 307–332.
Maskit J (2009) On the recuperation of postindustrial sites: an aesthetic analysis. Cybergeo Eur. J. Geogr.
Mathevet R (2004) Camargue incertaine: sciences, usages et natures. Buchet-Chastel Paris, France.
Matus G, Verhagen R, Bekker RM, Grootjans AP (2003) Restoration of the Cirsio dissecti-Molinietum in The Netherlands: Can we rely on soil seed banks? Appl Veg Sci 6 : 73–84.
May RM (1973) Stability and complexity in model ecosystems. Princeton University Press.
McDonald AW (1993) The role of seedbank and sown seeds in the restoration of an English flood-meadow. J Veg Sci 4 : 395–400.

Bibliographie
194
McIntyre S, Hobbs R (1999) A framework for conceptualizing human effects on landscapes and its relevance to management and research models. Conserv Biol 13 : 1282–1292.
McKinstry MC, Anderson SH (2005) Salvaged-wetland soil as a technique to improve aquatic vegetation at created wetlands in Wyoming, USA. Wetl Ecol Manag 13 : 499–508.
McLaughlin A, Mineau P (1995) The impact of agricultural practices on biodiversity. Agric Ecosyst Environ 55 : 201–212.
McLean IFG (2003) A policy for conservation translocations of species in Britain. Jt. Nat. Conserv. Comm.
McMahon Jr MJ (1972) Federal Water Pollution Control Act Amendments of 1972. The. BC Indus Com Rev 14 : 672.
Meffe GK, Carroll CR (1997) Principles of conservation biology. Sinauer Ass Inc Publ Sunderland Mass. USA.
Menninger HL, Palmer MA, Falk DA (2006) Restoring ecological communities: from theory to practice. Found Restor Ecol. Isl Press Wash DC, pp. 88–112.
Mesléard F, Grillas P, Lepart J (1991) Plant community succession in a coastal wetland after abandonment of cultivation: the example of the Rhone delta. Vegetatio 94 : 35–45
Mesléard F, Grillas P, Tan Ham L (1995) Restoration of seasonally-flooded marshes in abandoned ricefields in the Camargue (southern France) : preliminary results on vegetation and use by ducks. Ecol Eng 5 : 95–106.
Mesléard F, Lepart J (1991) Germination and seedling dynamics of Arbutus unedo and Erica arborea on Corsica. J Veg Sci 2 : 155–164.
Mesléard F, Lepart J, Grillas P, Mauchamp A (1999) Effects of seasonal flooding and grazing on the vegetation of former ricefields in the Rhône delta (Southern France). Plant Ecol 145 : 101–114.
Mesléard F, Mauchamp A, Pineau O, Dutoit T (2011) Rabbits are More Effective than Cattle for Limiting Shrub Colonization in Mediterranean Xero-Halophytic Meadows. Ecoscience 18 : 37–41.
Millar CI, Brubaker LB (2006) Climate change and paleoecology: new contexts for restoration ecology. In : Found Restor Ecol. Isl Press Wash DC, pp. 315–340.
Millennium Ecosystem Assessment (2005) Ecosystems and Human Well-being: Biodiversity Synthesis, World Resources Institute, Washington, DC.
Miller JR, Hobbs RJ (2007) Habitat Restoration—Do We Know What We’re Doing? Restor Ecol 15 : 382–390.
Mitchell RJ, Auld MHD, Le Duc MG, Robert MH (2000) Ecosystem stability and resilience: a review of their relevance for the conservation management of lowland heaths. Perspect Plant Ecol Evol Syst 3 : 142–160.

Bibliographie
195
Mitchley J, Jongepierová I, Fajmon K (2012) Regional seed mixtures for the re-creation of species-rich meadows in the White Carpathian Mountains: results of a 10-yr experiment. Appl Veg Sci 15 : 253–263.
Mitsch WJ, Wilson RF (1996) Improving the success of wetland creation and restoration with know-how, time, and self-design. Ecol Appl 6 : 77–83.
Mitsch WJ, Wu X, Nairn RW, Wang N, Deal R, Boucher CE (1998) Creating and restoring wetlands. BioScience 48 : 1019–1030.
Molinier R, Tallon G (1970) Prodrome des unités phytosociologiques observées en Camargue. Bull Mus Hist Nat Marseille 30 : 5–110.
Moog O (1995) Fauna aquatica austriaca. Wasser-Wirtschafts-Kataster, Bundesministerium für Land-und Forstwirtschaft.
Moora M, Zobel M (2009) Arbuscular mycorrhizae and plant–plant interactions. Impact of invisible world on visible patterns.In : Posit. Interactions Plant Community Dyn. CRC Press, pp. 79–98.
Morel MP, Jean R (2010) L’utilisation du territoire entre 2006 et 2009: l’artificialisation atteint 9% du territoire en 2009. Agreste Primeur, Ministère alimentation, agriculture et pêche, Paris, France.
Moreno-Mateos D, Comin FA (2010) Integrating objectives and scales for planning and implementing wetland restoration and creation in agricultural landscapes. J Environ Manage 91 : 2087–2095.
Moreno-Mateos D, Power ME, Comín F a, Yockteng R (2012) Structural and functional loss in restored wetland ecosystems. PLoS Biol 10.
Mouquet N, Gravel D, Massol F, Calcagno V (2013) Extending the concept of keystone species to communities and ecosystems. Ecol Lett 16 : 1–8.
Mouquet N, Leadley P, Mériguet J, Loreau M (2004) Immigration and local competition in herbaceous plant communities: a three-year seed-sowing experiment. Oikos 104 : 77–90.
Mouronval J-B, Baudouin S (2010) Plantes aquatiques de Camargue et de Crau. Office national de la chasse et de la faune sauvage, Paris, France.
Moy LD, Levin LA (1991) AreSpartina marshes a replaceable resource? A functional approach to evaluation of marsh creation efforts. Estuaries 14 : 1–16.
Münzbergová Z, Herben T (2005) Seed, dispersal, microsite, habitat and recruitment limitation: identification of terms and concepts in studies of limitations. Oecologia 145 : 1–8.
Muotka T, Paavola R, Haapala A, Novikmec M, Laasonen P (2002) Long-term recovery of stream habitat structure and benthic invertebrate communities from in-stream restoration. Biol Conserv 105 : 243–253.
Myers JA, Harms KE (2009) Seed arrival, ecological filters, and plant species richness: a meta-analysis. Ecol Lett 12 : 1250–1260.

Bibliographie
196
Naeem S, Haakansson K, Lawton JH, Crawley MJ, Thompson LJ (1996) Biodiversity and plant
productivity in a model assemblage of plant species. Oikos 76 : 259–264.
Naeem S, Tjossem SF, Byers D, et al. (1999) Plant neighborhood diversity and production. Ecoscience 6 : 355–365.
Nathan R (2006) Long-distance dispersal of plants. Science 313 : 786–788.
National Research Council (1992) Restoration of aquatic ecosystems: science, technology, and public policy. National Academies Press.
Niering WA, Goodwin RH (1974) Creation of relatively stable shrublands with herbicides: arresting“ succession” on rights-of-way and pastureland. Ecology 55 : 784–795.
Nishihiro J, Nishihiro MA, Washitani I (2006) Restoration of wetland vegetation using soil seed banks: lessons from a project in Lake Kasumigaura, Japan. Landsc Ecol Eng 2 : 171–176.
Obolewski K, Glińska-Lewczuk K (2011) Effects of oxbow reconnection based on the distribution
and structure of benthic macroinvertebrates. Soil Air Water 39 : 853–862.
Oksanen J, Kindt R, Legendre P, O’Hara B, Stevens MHH, Oksanen MJ, Suggests MASS (2008) Vegan: Community Ecology Package., R package version 1. 13–1.
Olsson P, Folke C, Berkes F (2004) Adaptive comanagement for building resilience in social–ecological systems. Environ Manage 34 : 75–90.
Otero C, Bailey AD (2003) Europe’s natural and Cultural Heritage. Friends of the Countryside.
Padilla FM, Pugnaire FI (2006) The role of nurse plants in the restoration of degraded
environments. Front Ecol Environ 4 : 196–202.
Pakeman RJ, Pywell RF, Wells TCE (2002) Species spread and persistence: implications for experimental design and habitat re-creation. Appl Veg Sci 5 : 75–86.
Palmer MA (2009) Reforming watershed restoration: science in need of application and applications in need of science. Estuaries Coasts 32 : 1–17.
Palmer MA, Allan JD, Butman CA (1996) Dispersal as a regional process affecting the local dynamics of marine and stream benthic invertebrates. Trends Ecol Evol 11 : 322–326.
Palmer MA, Ambrose RF, Poff NLR (1997) Ecological theory and community restoration ecology. Restor Ecol 5 : 291–300.
Palmer MA, Bernhardt ES, Allan JD, Lake PS, Alexander G, Brooks S, Sudduth E (2005) Standards for ecologically successful river restoration. J Appl Ecol 42 : 208–217.
Palmer MA, Filoso S (2009) Restoration of ecosystem services for environmental markets. Science 325 : 575.

Bibliographie
197
Pärtel M, Kalamees R, Zobel M, Rosén E (1998) Restoration of species-rich limestone grassland communities from overgrown land: the importance of propagule availability. Ecol Eng 10 : 275–286.
Paterson CG, Fernando CH (1969) Macroinvertebrate colonization of the marginal zone of a small impoundment in Eastern Canada. Can J Zool 47 : 1229–1238.
Patzelt A, Wild U, Pfadenhauer J (2001) Restoration of wet fen meadows by topsoil removal: vegetation development and germination biology of fen species. Restor Ecol 9 : 127–136.
Peco B, Espigares T, Levassor C (1998) Trends and fluctuations in species abundance and richness in Mediterranean annual pastures. Appl Veg Sci 1 : 21–28.
Peterson GW, Turner RE (1994) The value of salt marsh edge vs interior as a habitat for fish and decapod crustaceans in a Louisiana tidal marsh. Estuaries 17 : 235–262.
Pickett STA, Kolasa J, Armesto JJ, Collins SL (1989) The ecological concept of disturbance and its expression at various hierarchical levels. Oikos 54 : 129–136.
Pielou EC (1969) An introduction to mathematical ecology.
Piqueray J, Bottin G, Delescaille LM, Bisteau E, Colinet G, Mahy G (2011) Rapid restoration of a species-rich ecosystem assessed from soil and vegetation indicators: the case of calcareous grasslands restored from forest stands. Ecol Indic 11 : 724–733.
Pirot JY, Chessel D, Tamisier A (1984) Exploitation alimentaire des zones humides de Camargue par cinq espèces de canards de surface en hivernage et en transit: modélisation spatio-temporelle. Rev D’écologie 39 : 167–192.
Poff NL (1997) Landscape filters and species traits: towards mechanistic understanding and prediction in stream ecology. J North Am Benthol Soc 16 : 391–409.
Posey MH, Alphin TD, Powell CM (1997) Plant and infaunal communities associated with a created marsh. Estuaries 20 : 42–47.
Prach K, Bartha S, Joyce CB, Diggelen R, Wiegleb G (2001a) The role of spontaneous vegetation succession in ecosystem restoration: a perspective. Appl Veg Sci 4 : 111–114.
Prach K, Hobbs RJ (2008) Spontaneous succession versus technical reclamation in the restoration of disturbed sites. Restor Ecol 16 : 363–366.
Prach K, Lepš J, Rejmánek M (2007) Old field succession in Central Europe: local and regional patterns. In : Old Fields Dyn Restor Abandon Farml, pp. 180–201.
Prach K, Pyvsek P, Bastl M (2001b) Spontaneous vegetation succession in human-disturbed habitats: A pattern across seres. Appl Veg Sci 4 : 83–88.
Prach K, Pysek P (2001) Using spontaneous succession for restoration of human-disturbed habitats: Experience from Central Europe. Ecol Eng 17 : 55–62.
Prach K, Walker LR (2011) Four opportunities for studies of ecological succession. Trends Ecol Evol 26 : 119–123.

Bibliographie
198
Primack RB, Sarrazin F, Lecomte J (2012) Biologie de la conservation. Editions Dunod, France.
Pywell RF, Bullock JM, Roy DB, Warman LIZ, Walker KJ, Rothery P (2003) Plant traits as predictors of performance in ecological restoration. J Appl Ecol 40 : 65–77.
Pywell RF, Bullock JM, Tallowin JB, Walker KJ, Warman EA, Masters G (2007) Enhancing diversity of species-poor grasslands: an experimental assessment of multiple constraints. J Appl Ecol 44 : 81–94.
Pywell RF, Meek WR, Webb NR, Putwain PD, Bullock JM (2011) Long-term heathland restoration on former grassland: The results of a 17-year experiment. Biol Conserv 144 : 1602–1609.
R Development Core Team (2010) R: A language and environment for statistical computing.
Vienna, Austria.
Rabe FW, Gibson F (1984) The Effect of Macrophyte Removal on the Distribution of Selected invertebrates in a Littoral Environment. J Freshw Ecol 2 : 359–371.
Rand TA (2000) Seed dispersal, habitat suitability and the distribution of halophytes across a salt marsh tidal gradient. J Ecol 88 : 608–621.
Rands MR, Adams WM, Bennun L, Butchart SH, Clements A, Coomes D, Vira B (2010) Biodiversity conservation: challenges beyond 2010. Science 329 : 1298–1303.
Rasran L, Vogt K, Jensen K (2007) Effects of topsoil removal, seed transfer with plant material and moderate grazing on restoration of riparian fen grasslands. Appl Veg Sci 10 : 451–460.
Raup DM, Crick RE (1979) Measurement of faunal similarity in paleontology. J Paleontol 53 : 1213–1227.
Regnery B (2013) Les mesures compensatoires pour la biodiversité. Conceptions et perspectives d’applications.Thèse Univeristé Pierre et Marie Curie, France.
Řehounková K, Prach K (2007) Spontaneous vegetation succession in gravel–sand pits: a potential for restoration. Restor Ecol 16 : 305–312.
Reinartz J, Warne E (1993) Development of vegetation in small created wetlands in southeastern Wisconsin. Wetlands 13 : 153–164.
Reis A, Bechara FC, Espíndola MB, Sousa LD (2003) Restauração de áreas degradadas: a nucleação como base para incrementar os processos sucessionais. Nat Conserv 1 : 28–36.
Rhoads DC, Young DK (1970) The influence of deposit-feeding organisms on sediment stability and community trophic structure. J Mar Res 28 : 150–178.
Römermann C, Dutoit T, Poschlod P, Buisson E (2005) Influence of former cultivation on the unique Mediterranean steppe of France and consequences for conservation management. Biol Conserv 121 : 21–33.
Rowarth JS, Hampton JG, Hill MJ (2007) New Zealand native seed germination requirements: a review. New Zealand J Bot 45 : 485–501.

Bibliographie
199
Rozas LP, Odum WE (1988) Occupation of submerged aquatic vegetation by fishes: testing the roles of food and refuge. Oecologia 77 : 101–106.
Ruprecht E, Enyedi MZ, Eckstein RL, Donath TW (2010) Restorative removal of plant litter and vegetation 40 years after abandonment enhances re-emergence of steppe grassland vegetation. Biol Conserv 143 : 449–456.
Sacco JN, Seneca ED, Wentworth TR (1994) Infaunal community development of artificially
established salt marshes in North Carolina. Estuaries 17 : 489–500.
Schnitzler A, Génot J-C (2012) La France des friches: de la ruralité à la féralité. Editions Quae.
Shackelford N, Hobbs RJ, Burgar JM, Erickson TE, Fontaine JB, Laliberté E, Standish RJ (2013) Primed for Change: Developing Ecological Restoration for the 21st Century. Restor Ecol 21 : 297–304.
Shmida A, Ellner S (1985) Coexistence of plant species with similar niches. In : Plant Community Ecol. Pap. Honor Robert H Whittaker. Springer, pp 275–301.
Simenstad CA, Thom RM (1996) Functional equivalency trajectories of the restored Gog-Le-Hi-Te estuarine wetland. Ecol Appl 6 : 38–56.
Smallwood KS (2001) Linking habitat restoration to meaningful units of animal demography. Restor Ecol 9 : 253–261.
Society for Ecological Restoration (2004) The SER International primer on ecological restoration. SER Int. Prim. Ecol. Restor. www.ser.org & Tucson: Society for Ecological Restoration International.
Sokal RR, Rohlf FJ (1995) The principles and practice of statistics in biological research. New York.
Soons MB, Heil GW, Nathan R, Katul GG (2004) Determinants of long-distance seed dispersal by wind in grasslands. Ecology 85 : 3056–3068.
Soons MB, Ozinga WA (2005) How important is long-distance seed dispersal for the regional survival of plant species? Divers Distrib 11 : 165–172.
Soulé ME, Simberloff D (1986) What do genetics and ecology tell us about the design of nature reserves? Biol Conserv 35 : 19–40.
Sousa WP (1984) The role of disturbance in natural communities. Annu Rev Ecol Syst 15 : 353–391.
Southwood TRE (1977) Habitat, the templet for ecological strategies? J Anim Ecol 46 : 337–365.
Standish RJ, Cramer VA, Hobbs RJ (2008) Land-use legacy and the persistence of invasive Avena barbata on abandoned farmland. J Appl Ecol 45 : 1576–1583.
Stevens OA (1932) The number and weight of seeds produced by weeds. Am J Bot 19 : 784–794.
Stevenson MJ, Bullock JM, Ward LK (1995) Re-creating Semi-natural Communities: Effect of Sowing Rate on Establishment of Calcareous Grassland. Restor Ecol 3 : 279–289.
Bibliographie
200
Stevenson MJ, Ward LK, Pywell RF (1997) Re-creating Semi-natural Communities: Vacuum Harvesting and Hand Collection of Seed on Calcareous Grassland. Restor Ecol 5 : 66–76.
Stewart TW, Downing JA (2008) Macroinvertebrate communities and environmental conditions in recently constructed wetlands. Wetlands 28 : 141–150.
Stone R (1995) Taking a new look at life through a functional lens. Science 269 : 316–317.
Strykstra RJ, Bekker RM, Bakker JP (1998) Assessment of dispersule availability: its practical use in restoration management. Acta Bot Neerlandica 47 : 57–70.
Suding KN, Gross KL, Houseman GR (2004) Alternative states and positive feedbacks in restoration ecology. Trends Ecol Evol 19 : 46–53.
Sutcliffe OL, Kay QO (2000) Changes in the arable flora of central southern England since the 1960s. Biol Conserv 93 : 1–8.
Sutherland JP (1974) Multiple stable points in natural communities. Am Nat 108 : 859–873.
Swetnam TW, Allen CD, Betancourt JL (1999) Applied historical ecology: using the past to manage for the future. Ecol Appl 9 : 1189–1206.
Tallowin JRB, Smith REN (2001) Restoration of a Cirsio-Molinietum Fen Meadow on an
Agriculturally Improved Pasture. Restor Ecol 9 : 167–178.
Tamisier A (1991) The Camargue: in search of a new equilibrium between man and nature. Landsc Urban Plan 20 : 263–267.
Tamisier A, Grillas P (1994) A review of habitat changes in the Camargue: an assessment of the effects of the loss of biological diversity on the wintering waterfowl community. Biol Conserv 70 : 39–47.
Temperton VM, Hobbs RJ, Nuttle T, Halle S (2004) Assembly rules and restoration ecology: bridging the gap between theory and practice. Island Press.
Temperton VM, Märtin LL, Röder D, Lücke A, Kiehl K (2012) Effects of Four Different Restoration Treatments on the Natural Abundance of 15N Stable Isotopes in Plants. Front Plant Sci 3 : 70.
Ter Heerdt GNJ, Verweij GL, Bekker RM, Bakker JP (1996) An improved method for seed-bank analysis: seedling emergence after removing the soil by sieving. Funct Ecol 10 : 144–151.
Thompson K, Bakker JP, Bekker RM (1997) The soil seed banks of North West Europe: methodology, density and longevity. Cambridge university press.
Tilman D (1997) Community invasibility, recruitment limitation, and grassland biodiversity. Ecology 78 : 81–92.
Tilman D (2004) Niche tradeoffs, neutrality, and community structure: a stochastic theory of resource competition, invasion, and community assembly. Proc Natl Acad Sci USA 01 : 10854–10861.

Bibliographie
201
Tilman D, Reich PB, Knops JMH (2006) Biodiversity and ecosystem stability in a decade-long grassland experiment. Nature 441 : 629–632.
Tirado R, Pugnaire FI (2005) Community structure and positive interactions in constraining environments. Oikos 111 : 437–444.
Tong C, Baustian JJ, Graham SA, Mendelssohn IA (2013) Salt marsh restoration with sediment-slurry application: effects on benthic macroinvertebrates and associated soil–plant variables. Ecol Eng 51 : 151–160.
Török P, Deák B, Vida E, Valkó O, Lengyel S, Tóthmérész B (2010) Restoring grassland biodiversity: sowing low-diversity seed mixtures can lead to rapid favourable changes. Biol Conserv 143 : 806–812.
Török P, Matus G, Papp M, Tóthmérész B (2009) Seed bank and vegetation development of sandy grasslands after goose breeding. Folia Geobot 44 : 31–46.
Török P, Miglécz T, Valkó O, Kelemen A, Deák B, Lengyel S, Tóthmérész B (2011a) Recovery of native grass biodiversity by sowing on former croplands: Is weed suppression a feasible goal for grassland restoration? J Nat Conserv 20 : 41–48.
Török P, Miglécz T, Valkó O, Kelemen A, Tóth K, Lengyel S, Tóthmérész B (2012) Fast restoration of grassland vegetation by a combination of seed mixture sowing and low-diversity hay transfer. Ecol Eng 44 : 133–138.
Török P, Vida E, Deák B, Lengyel S, Tóthmérész B (2011b) Grassland restoration on former croplands in Europe: an assessment of applicability of techniques and costs. Biodivers Conserv 20 : 2311–2332.
Tour du Valat (2000) A research centre for the conservation of Mediterranean wetlands.
Trakhtenbrot A, Nathan R, Perry G, Richardson DM (2005) The importance of long-distance dispersal in biodiversity conservation. Divers Distrib 11 : 173–181.
Trexler JC (1995) Restoration of the Kissimmee River: a conceptual model of past and present fish communities and its consequences for evaluating restoration success. Restor Ecol 3 : 195–210.
Trowbridge WB (2007) The role of stochasticity and priority effects in floodplain restoration. Ecol Appl 17 : 1312–1324.
Turnbull LA, Crawley MJ, Rees M (2000) Are plant populations seed-limited? a review of seed sowing experiments. Oikos 88 : 225–238.
Valk AG, Pederson RL, Davis CB (1992) Restoration and creation of freshwater wetlands using
seed banks. Wetl Ecol Manag 1 : 191–197.
Van de Meutter F, Stoks R, De Meester L (2008) Size-selective dispersal of Daphnia resting eggs by backswimmers (Notonecta maculata). Biol Lett 4 : 494–496.

Bibliographie
202
Van der Putten WH, Mortimer SR, Hedlund K, Van Dijk C, Brown VK, Lepä J, Smilauer P (2000) Plant species diversity as a driver of early succession in abandoned fields: a multi-site approach. Oecologia 124 : 91–99.
Vanschoenwinkel B, Waterkeyn A, Vandecaetsbeek T, Pineau O, Grillas P, Brendonck L (2008) Dispersal of freshwater invertebrates by large terrestrial mammals: a case study with wild boar (Sus scrofa) in Mediterranean wetlands. Freshw Biol 53 : 2264–2273.
Vécrin M p., van Diggelen R, Grévilliot F, Muller S (2002) Restoration of species-rich flood-plain meadows from abandoned arable fields in NE France. Appl Veg Sci 5 : 263–270.
Vécrin MP, Muller S (2003) Top-soil translocation as a technique in the re-creation of species-rich meadows. Appl Veg Sci 6 : 271–278.
Vellend M (2010) Conceptual synthesis in community ecology. Q Rev Biol 85 : 183–206.
Verhagen R, Klooker J, Bakker JP, Diggelen R van (2001) Restoration success of low-production plant communities on former agricultural soils after top-soil removal. Appl Veg Sci 4 : 75–82.
De Villeneuve-Bargemon CC (1826) Statistique du département des Bouches-du-Rhône.
Vince S, Valiela I, Backus N, Teal JM (1976) Predation by the salt marsh killifish Fundulus heteroclitus (L.) in relation to prey size and habitat structure: Consequences for prey distribution and abundance. J Exp Mar Biol Ecol 23 : 255–266.
Vitousek PM, Mooney HA, Lubchenco J, Melillo JM (1997) Human domination of Earth’s ecosystems. Science 277 : 494–499.
Wagner C (2004) Passive dispersal of Metrioptera bicolor (Orthopteroidea: Ensifera:
Tettigoniidae) by transfer of hay. J Insect Conserv 8 : 287–296.
Wainwright CE, Wolkovich EM, Cleland EE (2012) Seasonal priority effects: implications for invasion and restoration in a semi-arid system. J Appl Ecol 49 : 234–241.
Walker KJ, Stevens PA, Stevens DP, Mountford JO, Manchester SJ, Pywell RF (2004) The restoration and re-creation of species-rich lowland grassland on land formerly managed for intensive agriculture in the UK. Biol Conserv 119 : 1–18.
Walker LR, Del Moral R (2003) Primary succession and ecosystem rehabilitation. Cambridge University Press.
Walker SM, Desanker PV (2004) The impact of land use on soil carbon in Miombo Woodlands of Malawi. For Ecol Manag 203 : 345–360.
Waterkeyn A, Grillas P, Vanschoenwinkel B, Brendonck L (2008) Invertebrate community patterns in Mediterranean temporary wetlands along hydroperiod and salinity gradients. Freshw Biol 53 : 1808–1822.

Bibliographie
203
Waterkeyn A, Pineau O, Grillas P, Brendonck L (2010) Invertebrate dispersal by aquatic mammals: a case study with nutria Myocastor coypus (Rodentia, Mammalia) in Southern France. Hydrobiologia 654 : 267–271.
Weiher E, Keddy PA (1995) The assembly of experimental wetland plant communities. Oikos 73 : 323–335.
Weiher E, Wisheu IC, Keddy PA, Moore DRJ (1996) Establishment, persistence, and management implications of experimental wetland plant communities. Wetlands 16 : 208–218.
Whisenant S (1999) Repairing damaged wildlands: a process-orientated, landscape-scale approach. Cambridge University Press.
White PS, Jentsch A (2001) The search for generality in studies of disturbance and ecosystem dynamics. Prog Bot 62:399–450.
White PS, Jentsch A (2004) Disturbance, succession, and community assembly in terrestrial plant communities. In : Assem Rules Restor Ecol Bridg Gap Theory Pr. Island Press, Washington, pp. 342–366.
White PS, Pickett STA (1985) Natural disturbance and patch dynamics: an introduction.
Wiggins GB, Mackay RJ, Smith IM (1980) Evolutionary and ecological strategies of animals in annual temporary pools. Arch Für Hydrobiol Suppl 58.
Wilde SA (1954) Reaction of soils: facts and fallacies. Ecology 35 : 89–92.
Willems JH, Bik LPM (1998) Restoration of high species density in calcareous grassland: the role of seed rain and soil seed bank. Appl Veg Sci 1 : 91–100.
Williams DD (1998) Temporary ponds and their invertebrate communities. Aquat Conserv Mar Freshw Ecosyst 7 : 105–117.
Willm L, Yavercovski N, Mesléard F (2011) Etude d’avant projet sur le site du Cassaïre. Tour du Valat, France.
Willson MF (1993) Dispersal mode, seed shadows, and colonization patterns. Vegetatio 107 : 261–280.
Wilson EO (1992) The diversity of life. Springer.
Woodcock BA, Pywell RF, Roy DB, Rose RJ, Bell D (2005) Grazing management of calcareous grasslands and its implications for the conservation of beetle communities. Biol Conserv 125 : 193–202.
Xingzhong Y, Hong L, Jianjian L (2005) Effect of Scirpus mariqueter vegetation on salt marsh
benthic macrofaunal community of the Changjiang estuary. J Coast Res 21 : 73–78.
Young TP, Chase JM, Huddleston RT (2001) Community succession and assembly comparing, contrasting and combining paradigms in the context of ecological restoration. Ecol Restor 19 : 5–18.
Bibliographie
204
Young TP, Petersen DA, Clary JJ (2005) The ecology of restoration: historical links, emerging issues and unexplored realms. Ecol Lett 8 : 662–673.
Yurkonis KA, Meiners SJ (2004) Invasion impacts local species turnover in a successional system.
Ecol Lett 7 : 764–769.
Zacharias I, Dimitriou E, Dekker A, Dorsman E (2007) Overview of temporary ponds in the
Mediterranean region: threats, management and conservation issues. J Environ Biol 28 : 1–9.
Zedler JB (2005) Ecological restoration: guidance from theory. San Francisco Estuary Watershed Sci. 3.
Zedler JB (2000a) Progress in wetland restoration ecology. Trends Ecol Evol 15 : 402–407.
Zedler JB (1999) The ecological restoration spectrum. In : Int. Perspect. Wetl. Rehabil. Springer, pp 301–318.
Zedler JB (2000b) Handbook for Restoring Tidal Wetlands. CRC Press Inc.
Zedler JB, Kercher S (2005) Wetland resources: status, trends, ecosystem services, and restorability. Annu Rev Env Resour 30 : 39–74.
Zedler PH, Black C (1992) Seed Dispersal by a Generalized Herbivore: Rabbits as Dispersal Vectors in a Semiarid California Vernal Pool Landscape. Am Midl Nat 128 : 1–10.
Zelenỳ D, Li C-F, Chytrỳ M (2010) Pattern of local plant species richness along a gradient of landscape topographical heterogeneity: result of spatial mass effect or environmental shift? Ecography 33 : 578–589.
Zhang L, Wang MH, Hu J, Ho YS (2010) A review of published wetland research, 1991–2008: Ecological engineering and ecosystem restoration. Ecol Eng 36 : 973–980.
Zobel M, Maarel E, Dupré C (1998) Species pool: the concept, its determination and significance for community restoration. Appl Veg Sci 1 : 55–66.
Zonneveld IS (1995) Vicinism and mass effect. J Veg Sci 6 : 441–444.

Annexes
205
Annexes

Annexe 1: Jaunatre et al., 2013. New synthetic indicators to assess community resilience and restoration success. Ecological Indicators 29: 468-477
206
Annexe 1: New synthetic indicators to assess community resilience and restoration success.
Ecological indicators. Jaunatre et al., 2013b.

Annexe 1: Jaunatre et al., 2013. New synthetic indicators to assess community resilience and restoration success. Ecological Indicators 29: 468-477
207

Annexe 1: Jaunatre et al., 2013. New synthetic indicators to assess community resilience and restoration success. Ecological Indicators 29: 468-477
208

Annexe 1: Jaunatre et al., 2013. New synthetic indicators to assess community resilience and restoration success. Ecological Indicators 29: 468-477
209

Annexe 1: Jaunatre et al., 2013. New synthetic indicators to assess community resilience and restoration success. Ecological Indicators 29: 468-477
210
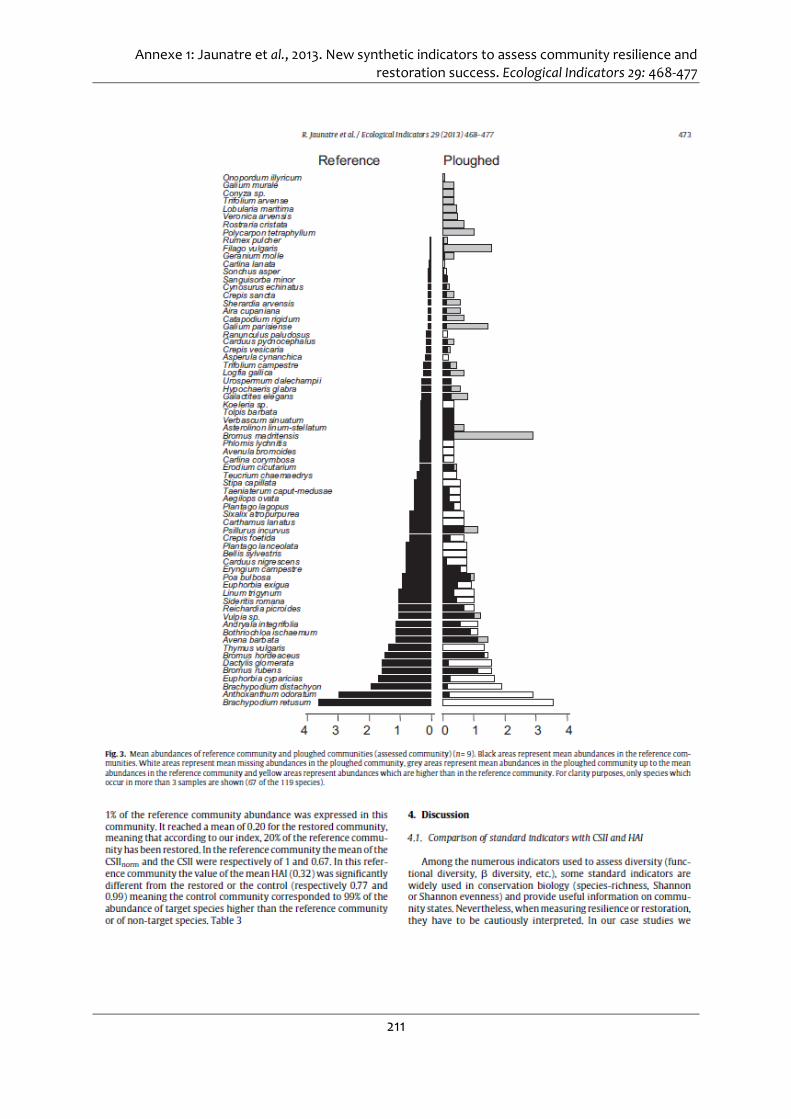
Annexe 1: Jaunatre et al., 2013. New synthetic indicators to assess community resilience and restoration success. Ecological Indicators 29: 468-477
211

Annexe 1: Jaunatre et al., 2013. New synthetic indicators to assess community resilience and restoration success. Ecological Indicators 29: 468-477
212

Annexe 1: Jaunatre et al., 2013. New synthetic indicators to assess community resilience and restoration success. Ecological Indicators 29: 468-477
213

Annexe 1: Jaunatre et al., 2013. New synthetic indicators to assess community resilience and restoration success. Ecological Indicators 29: 468-477
214

Annexe 1: Jaunatre et al., 2013. New synthetic indicators to assess community resilience and restoration success. Ecological Indicators 29: 468-477
215

Annexe 2: Liste d’espèces presents dans l’étude du chapitre 4
216
Annexe 2: Espèces présentes dans la banque de grains du Cassaïre, les pelouses meso-
xériques de reference, le materiel vegetal transféré, les mésocosmes transférés et les
mésocosmes témoins. Les espèces cibles sont indiquées en gras.
Species recordedIn soil seed bank of the Cassaïre site
In referencegrassland
In Hay material
In hay transfer slopes
In control slopes
Aegilops ovata × ×Aetheorhiza bulbosa × ×Ammania coccinea ×Anagalis arvensis × × × × ×Aster squamatus × × ×
Asterolinon linum-stellatum ×
Atriplex prostata ×Avena barbata ×
Bellis annua × × ×Blackstonia acuminata × ×
Bolboschoenus maritimus × ×Brachypodium distachyon × × ×
Brachypodium phoenicoides × × ×
Bromus diandrus × ×Bromus hordeaceus × × ×Bromus madritensis × × ×
Bromus rubens ×Bromus sp × ×
Bromus sterilis × ×
Bupleurum semicompositum × × ×
Carduus tenuiflorus ×Carex divisa × × ×
Carex otrubae ×Catapodium rigidum × × ×Centaurium spicatum × ×
Centaurium tenuifolium ×Chenopodium album × ×
Cirsium arvense × ×Conyza sumatrensis ×
Coronopus squamatus ×Crepis sancta × × ×
Crepis vesicaria × × ×Cynodon dactylon ×Cyperus difformis ×Cyperus eragrostis ×
Cyperus fuscus × ×Cyperus sp ×
Dactylis hispanica × × ×Dactylis sp ×
Daucus carota ×Dittrichia viscosa ×Echinochloa sp × × ×
Elytrigia atherica × × ×Epilobium tetragonum ×

Annexe 2: Liste d’espèces presents dans l’étude du chapitre 4
217
Species recordedIn soil seed bank of the Cassaïre site
In reference grassland
In Hay material
In hay transfer slopes
In control slopes
Erigeron canadense ×Erodium cicutarium ×Euphorbia exigua × × ×
Euphorbia peploides ×Evax pygmaea × ×
Festuca arundinacea ×Filago vulgaris × × ×Galium murale × × ×
Gastridium ventricosum × ×Geranium molle × × ×
Hainardia cylindricaHalimione portulacoides ×
Hedypnois cretica × ×Hippocrepis biflora ×
Holcus lanatus × × ×Hordeum marinum × ×Hordeum murinum × ×
Juncus bufonius × × ×Juncus lamprocarpus × ×
Lactuca saligna × ×Lactuca serriola × ×
Leontodon tuberosus × ×Limonium narbonense × ×
Limonium virgatum × ×Lindernia dubia ×Linum bienne ×
Linum strictum ×Lolium perenne × ×Lolium rigidum × ×
Lolium sp × ×Lotus tenuis × × ×
Lythrum hyssopifolia ×Medicago lupulina × × ×Medicago minima ×
Medicago polymorpha × × × ×Medicago rigidula ×
Medicago truncatula ×Melilotus inducus ×
Melilotus sp × ×Nardurus maritimus × ×Parapholis filiformis × ×Parapholis incurva × × ×Parietaria judaica ×
Paspalum distichum × ×Phillyrea angustifolia ×

Annexe 2: Liste d’espèces presents dans l’étude du chapitre 4
218
Species recordedIn soil seed bank of the Cassaïre site
In reference grassland
In Hay material
In hay transfer slopes
In control slopes
Erigeron canadense ×Erodium cicutarium ×Euphorbia exigua × × ×
Euphorbia peploides ×Evax pygmaea × ×
Festuca arundinacea ×Filago vulgaris × × ×Galium murale × × ×
Gastridium ventricosum × ×Geranium molle × × ×
Hainardia cylindricaHalimione portulacoides ×
Hedypnois cretica × ×Hippocrepis biflora ×
Holcus lanatus × × ×Hordeum marinum × ×Hordeum murinum × ×
Juncus bufonius × × ×Juncus lamprocarpus × ×
Lactuca saligna × ×Lactuca serriola × ×
Leontodon tuberosus × ×Limonium narbonense × ×
Limonium virgatum × ×Lindernia dubia ×Linum bienne ×
Linum strictum ×Lolium perenne × ×Lolium rigidum × ×
Lolium sp × ×Lotus tenuis × × ×
Lythrum hyssopifolia ×Medicago lupulina × × ×Medicago minima ×
Medicago polymorpha × × × ×Medicago rigidula ×
Medicago truncatula ×Melilotus inducus ×
Melilotus sp × ×Nardurus maritimus × ×Parapholis filiformis × ×Parapholis incurva × × ×Parietaria judaica ×
Paspalum distichum × ×Phillyrea angustifolia ×

Annexe 3: Article sur le Cassaïre. Le Figaro. Juin 2012
219
Annexe 3: Article sur le Cassaïre. Le Figaro. Juin 2012

Annexe 4: Journal du CNRS, n°266, Mai-Juin 2012.Ingénieuse écologie
220
Annexe 4: Article sur le Cassaïre. Journal du CNRS, Ingénieuse écologie.

Annexe 4: Journal du CNRS, n°266, Mai-Juin 2012.Ingénieuse écologie
221


« Le vent l’emportera »
Noir désir

Résumé La restauration écologique est considérée comme un des moyens susceptibles d’enrayer la perte de la
biodiversité. Les changements d’occupation du sol peuvent être des opportunités pour restaurer des
écosystèmes dégradés par les activités agricoles. C’est notamment le cas du projet participatif du domaine
du Cassaïre, situé dans le delta du Rhône, qui vise à recréer sur d’anciennes rizières des écosystèmes
méditerranéens favorables à l’activité cynégétique. Deux écosystèmes sont plus particulièrement visés, les
marais temporaires et les pelouses méso-xériques. Les objectifs de la thèse sont de mettre en évidence les
principaux mécanismes concourant à l’installation d’une communauté végétale, de tester des techniques de
restauration et d'en évaluer les conséquences pour les communautés végétales mais aussi pour d'autres
compartiments de l'écosystème. En l’absence d’espèces cibles dans le pool régional d’espèces,
l’introduction de ces espèces est nécessaire en addition de la restauration des conditions abiotiques.
L’étrépage et le transfert de sol pour la communauté des marais permettent une augmentation des espèces
cibles et de la similarité avec la communauté de référence. Cette technique apparaît moins pertinente pour
la communauté d’invertébrés aquatiques. Le succès contrasté du transfert de sol souligne les risques à ne
pas privilégier qu’un nombre restreint d’indicateurs de restauration, ne reflétant pas l’ensemble de
l’écosystème. L’étrépage de sol suivi d’un transfert de foin semble être une combinaison pertinente pour
recréer la communauté végétale de pelouses, même si les résultats obtenus, probablement en raison d’une
compétition élevée, sont moins convaincants que pour les marais temporaires. Nos résultats obtenus pour la
grande majorité en mésocosmes, s’ils ne concernent que les premières étapes de la restauration, mettent
cependant en évidence des techniques de restauration qui paraissent pertinentes pour installer certaines
composantes des deux écosystèmes de référence. Ces résultats, par leurs limites, suggèrent néanmoins de
privilégier la conservation in situ des habitats naturels plutôt que de chercher à les restaurer après qu’ils
aient été détruits.
Mots clés : Biodiversité, Ecologie de la communauté, Ecologie de la restauration, Ecosystème aquatique,
Ecosystème terrestre, Ecosystèmes méditerranéens, Etrépage de sol, Friches rizicoles, Perturbation,
Transfert de foin, Transfert de sol
Abstract Ecological restoration is considered as one approach to slow down the loss of biodiversity. Changes in
land-uses may be an opportunity to restore ecosystems degraded by agricultural activities. This is the case of
the participatory project of the Cassaïre site, located in the Rhône delta, which aims at recreating
Mediterranean ecosystems favorable to hunting on former ricefields. Two ecosystems are targeted,
temporary wetlands and meso-xeric grasslands. The aims of the thesis are to highlight the main drivers of
plant community establishment, to test restoration techniques and to evaluate their effects on plant
communities but also on other compartments of the ecosystem. In the absence of target species in the
regional species pool, the introduction of these species is necessary in addition to the restoration of abiotic
conditions. Topsoil removal and soil transfer for wetland communities allow an increase of target species
and of similarity with the reference community. This technique appears to be less relevant for aquatic
invertebrate community. The contrasted successful of soil transfer highlights the risks of favoring some
indicators of restoration success, as they may not reflect the entire ecosystem. Topsoil removal and hay
transfer seem to be a relevant combination to recreate grassland plant community, although the results
obtained are less convincing than for temporary wetland, probably due to high competition. Our results,
obtained in mesocosms, even if they relate only to the early stages of recovery, provide restoration
techniques that seem relevant to establish some components of the two reference ecosystems. These
results, by their limitations, however, suggest focusing on in situ conservation of natural habitats rather than
trying to restore them after they were destroyed.
Keywords: Biodiversity, Community ecology, Restoration ecology, Aquatic ecosystem, Terrestrial
ecosystem, Mediterranean Ecosystems, Topsoil removal, Former ricefield, Disturbance, Hay transfer, Soil
transfer