Embed Size (px)
Citation preview
© All Rights Reserved*Corresponding author. Email: [email protected]: 603-26162735 , Fax: 603-26926542
International Food Research Journal 19 (3): 1095-1107 (2012)
1Nurul Izzah, A., 2Aminah, A., 2Md Pauzi, A., 2Lee, Y. H., 1Wan Rozita, W. M. and 1Siti Fatimah, D.
1Institute for Medical Research, Jalan Pahang 50588 Kuala Lumpur, Malaysia 2Universiti Kebangsaan Malaysia, 47100 Bangi, Selangor, Malaysia
Patterns of fruits and vegetable consumption among adults of different ethnics in Selangor, Malaysia
Abstract: A survey was conducted to investigate patterns of fruits and vegetables consumption among Malaysian adults residing in Selangor, Malaysia. Two hundred forty two subjects comprises of male (28%) and female (72%) of major ethnics (Malays-52.3%; Chinese-30.5%; Indians-16.9%) with the mean age of 43.5±18 years were studied from July to November 2002. Consumption data for vegetables were collected using 24 hours duplicate samples method while for fruits 24-hour diet record was used. The results showed that most frequently consumed leafy, leguminous, root, brassica and fruits vegetables were celery (Apium graveolens), spinach (Spinacia oleracea), water spinach (Ipomoea aquatic), long beans (Vigna sesquipedolis), French beans (Phaseolus vulgaris), carrot (Daucas carota), potato (Solanum tuberosum), Chinese mustard (Brassica juncea), round cabbage (Brassica reptans), cauliflower (Brassica oleracea var cauliflora), chilies (red, green, small or dried) (Capsicum sp.), tomato (Lycopersicum esculentum), cucumber (Cucumis sativus), long eggplant (Solanum melongena) and okra (Hibiscus esculentus). While most consumed ulam and traditional vegetables were petai (Parkia speciosa), sweet leaves (Sauropus andragynus) and Indian pennywor (Hydrocotyle asiatica). Other vegetables inclusive spices and flavorings that were preferred by subjects were shallot (Allium fistulosum), garlic (Allium sativum), onion (Alium cepa), green bean sprout (Phaseolus aureus) and curry leaves (Murraya koenigii). The most preferred fruits were banana (Musa spp.) and apples (.Malus domestica). A total consumption of fruits and vegetables among adults in Selangor was 173 g/day and the consumption among Malays (202 g/day) was significantly higher (P<0.001) compared to the Chinese or Indians. Individually, vegetables were consumed 133 g/day while fruits were 179 g/day. No significant differences (P<0.05) were shown for consumption of different vegetable categories among different ethnic groups. Study subjects consumed more brassica vegetables compared to other vegetable categories and the Malays preferred traditional vegetables compared to the other two ethnics. Most vegetables were consumed as soup and boiled, least was consumed as raw and salad form.
Key words: Fruits, vegetables, consumption pattern, Malaysian, ethnic
Introduction
Fruits and vegetables are important foods for health promotion because they contain essential nutrient such as vitamins, minerals, proteins, fibers and bio-functional components while also being low in fat, sodium and calories compared to many other foods (Devine et al., 1998). Many studies had consistently linked a decreased risk of many cancers (such as cancer of the lung, esophagus, mouth, stomach, colon and pancreas (Hall et al., 2009)) as well as cardiovascular disease, diabetes, stroke, obesity, diverticulosis and cataract (Bogers et al., 2004) with a high consumption of fruits and vegetables.
A published report by World Health Organization (WHO) on diet, nutrition and the prevention of chronic diseases, recommends the intake of a minimum of 5 portions or 400g of fruits and vegetables per person per day but excluding potatoes and other
starchy tubers (WHO, 2003). This recommendation specify at least 2 daily servings of fruits (160 g) and 3 daily servings of vegetables (240 g) with at least one serving of vegetables involving dark green and leafy or orange vegetable (nutrient-rich vegetable) (Striegel-Moore et al., 2006). A strong correlation between vegetable consumption and taste preference (Uglem et al., 2007) was reported while bitterness was reported as a sensory deterrent for vegetable preference and consumption (Dinehart et al., 2006).
In Malaysia, the Federation of Agricultural Malaysia (FAMA) reported the total vegetable consumption among Malaysian was 36 kg per capita for the year 1991 (FAMA, 1995) and the household expenditure survey (1985-1995) showed an increment of only 7.7% for fresh vegetables expenditure (Aminah and Huda, 2006). Aimed at promoting increasing vegetable consumption among Malaysian, in the year 1996, the Ministry of Agriculture of Malaysia had launched ‘Eat more vegetables’ campaign (Chin,
1096 Nurul Izzah, A., Aminah, A., Md Pauzi, A., Lee, Y. H., Wan Rozita, W. M. and Siti Fatimah, D.
International Food Research Journal 19(3): 1095-1107
1999). The campaign seemed successful with daily calorie intake of vegetable among Malaysian increasing from 26.1 to 49.2 calories from the year 1990 to 2005 (Warr et al., 2008). However, results from the World Health Survey in year 2002-2003 showed the prevalence of low fruit and vegetable consumption among men (85%) and women (85.5%) in Malaysia (Hall et al., 2009). Findings from the Malaysian Adult Nutrition Survey (MANS) in year 2003 also showed similar results where only 40% of Malaysian adults consumed 1 cup (96 g) of green leafy vegetables daily (Norimah et al., 2008) and this accounted for only 40% of the total recommendation of 240g per day by WHO (Striegel-Moore et al., 2006).
It is interesting to determine the proportion of the population that met the fruits and vegetable recommendation because research has shown that diets rich in fruits and vegetables are associated with reduced risk of cancer, cardiovascular disease and other chronic diseases (Bogers et al., 2004; Guenther et al., 2006; 2004; Hall et al., 2009). Although the exact mechanisms through which fruits and vegetables play a role in disease prevention have not been fully defined, the benefits are generally credited to the additive and synergistic effects of the phytochemicals found in these whole plant foods (Lui, 2003; Guenther et al., 2006). Fruits and vegetables may also be important for weight management by promoting satiety and decrease energy intake as these foods are high in water and fiber and low in energy and energy density (Guenther et al., 2006).
A database search was unsuccessful in identifying any study reporting on consumption of fruits and vegetable among Malaysian adults. Thus, the purpose of this study was to determine the consumption these food groups and to establish the patterns among adults of different ethnic resided in the Selangor, Malaysia. It is hope that the data reported will serve as invaluable baseline data for calculating and assessing risk on contaminants through vegetable consumption.
Material and Methods
Study locationSelangor State is situated at the west coast of
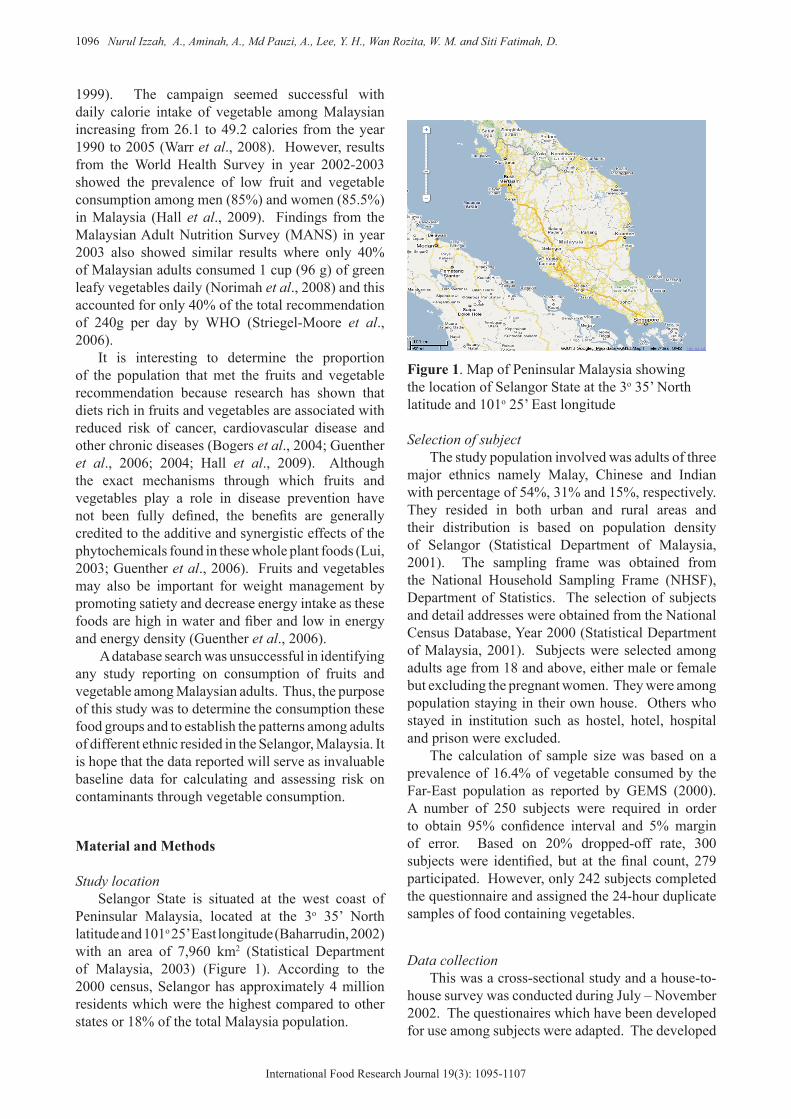
Peninsular Malaysia, located at the 3o 35’ North latitude and 101o 25’ East longitude (Baharrudin, 2002) with an area of 7,960 km2 (Statistical Department of Malaysia, 2003) (Figure 1). According to the 2000 census, Selangor has approximately 4 million residents which were the highest compared to other states or 18% of the total Malaysia population.
Figure 1. Map of Peninsular Malaysia showing the location of Selangor State at the 3o 35’ North latitude and 101o 25’ East longitude
Selection of subjectThe study population involved was adults of three
major ethnics namely Malay, Chinese and Indian with percentage of 54%, 31% and 15%, respectively. They resided in both urban and rural areas and their distribution is based on population density of Selangor (Statistical Department of Malaysia, 2001). The sampling frame was obtained from the National Household Sampling Frame (NHSF), Department of Statistics. The selection of subjects and detail addresses were obtained from the National Census Database, Year 2000 (Statistical Department of Malaysia, 2001). Subjects were selected among adults age from 18 and above, either male or female but excluding the pregnant women. They were among population staying in their own house. Others who stayed in institution such as hostel, hotel, hospital and prison were excluded.
The calculation of sample size was based on a prevalence of 16.4% of vegetable consumed by the Far-East population as reported by GEMS (2000). A number of 250 subjects were required in order to obtain 95% confidence interval and 5% margin of error. Based on 20% dropped-off rate, 300 subjects were identified, but at the final count, 279 participated. However, only 242 subjects completed the questionnaire and assigned the 24-hour duplicate samples of food containing vegetables.
Data collectionThis was a cross-sectional study and a house-to-
house survey was conducted during July – November 2002. The questionaires which have been developed for use among subjects were adapted. The developed
Fruits and vegetable consumption among Malaysian 1097
International Food Research Journal 19(3): 1095-1107
questionaires was pre-tested, improved and finally used in this study (Nurul Izzah, 2007). The eleven pages self-administered questionnaire include a socio-demographic information section as well as questions on knowledge, perception and practices towards vegetables consumption and a single 24-hour food record forms.
The enumerators were trained to review and understand the questionnaires. During training, they were taught on how to handle duplicate samples and to provide instructions to subjects. They were equipped with set of questionnaire tool to help the subjects recording the type of foods they consumed. The questionnaire tools included pictures of serving dishes, vegetables, fruits and common household measure like standard measuring cups, bowls, ladles and spoons. The self-administrated questionnaire was given between 9.00 am to 6.00 pm. Enumerators will assist by reading the questionnaires to some of the elderly or illiterate. They will also re-checked all food recorded in food record forms to verify types and amount of food consumed and the duplicate samples handed over by subjects. Second visits were made to the subjects if duplicate samples were not provided or survey was not completed during first visit. The height and weight of study subjects were measured using calibrated SECA digital weighing machine, while Body Mass Index (BMI) were calculated by using the formula of body weight (kg) divided by square roots of height (m2). The WHO criteria for obesity based on the BMI guidelines was used in this study (WHO 1995), commencing from underweight (BMI<18.5 Kg/m2), normal (BMI 18.5-24.9 Kg/m2), overweight (BMI 25.0-29.9 Kg/m2) and obese (BMI≥30 Kg/m2),
Food intake dataThe duplicate portion of food containing
vegetables was used for collecting data on vegetable consumption among study subjects. This method was chosen in order to deal with varieties of vegetable recipe that covered vegetable dishes and other food dishes that contained vegetables as ingredients such as noodles, fried rice, tom yam, fish curry, etc. Study subjects were requested to keep the duplicate of food containing vegetables consumed within 24 hours refrigerated. These food samples were kept in plastic bags, tighten with rubber band and properly labeled before being transported in the icebox to the laboratory. In the laboratory, food samples were weighed as a whole. The slurry or soup was separated using plastic colander and each type of vegetables was discrete before individual weight was taken. The discretion of different vegetables was only conducted if it is
possible. Food items such as vegetable porridge or wholly blended will be measured the whole weight.
Collection of fruits consumption data were conducted using a single 24-hour records method. Study subjects were requested to record fruits that they consumed within 24-hours. The portion weight of fruits was referred to the Atlas Makanan: Saiz pertukaran dan Porsi. (Suzana et al., 2002). The collection of both duplicate food samples and the single 24-hour food record were conducted during weekdays and weekends.
Consent approvalThe project was supported by the Division of Food
Safety and Quality, Ministry of Health and informs consent was obtained from the subjects beforehand.
Data analysisResults were tabulated using SPSS (version 11.5
for windows, 2002, SPSS Inc). The data included demographic characteristics, frequency types of consumed fruits and vegetables and consumption of vegetables at different categories, group and preparation. Data was clean and checked for discrepancies before analysis. Initially, analysis included descriptive statistics was conducted to assess data normality. The data was found not distributed in a normal bell-shaped curve, mainly because of the existing of the outliers. To test the differences between independent variables inclusive socio-demographic characteristics and fruits and vegetable consumption, non parametric tests were used. Data were presented as medians (with interquartile range) and the statistical significance of difference was assessed using Kruskall-Wallis’s test, followed by Mann-Whitney’s test. Significance was set a priory at P≤0.05.
Results
Subjects characteristicsThere was a good response rate (87%), with 242
adults completing the questionnaire and handing over the duplicate samples of vegetables or food containing vegetables consumed within 24 hours. Table 1 showed the socio-demographic characteristics of subjects involved in the food consumption survey in Selangor. The subjects comprised of 127 (52.3%) Malays, 74 (30.5%) Chinese and 41 (16.9%) Indian and their median age were 43.5 years. Most of the subjects were female (72%) as most of them were homemakers and at home during the visit. Only 28% of men who owned business, shift worker, on medical
1098 Nurul Izzah, A., Aminah, A., Md Pauzi, A., Lee, Y. H., Wan Rozita, W. M. and Siti Fatimah, D.
International Food Research Journal 19(3): 1095-1107
leaved or retired were interviewed.
Socio-demographic variable
Malay(n=127)
Chinese(n=74)
Indian(n=42)
Overall total(n=243)
*P- value
Age (y±IQR) 44±17 44±21 40±23 43.5±18 NS
GenderMaleFemale
(n,%)32(14)95(40)
(n,%)21(9)53(23)
(n,%)14(6)28(12)
(n,%)67(28)176(72) -
BMI Index(±IQR) 25.7±6.9a 21.7±4.2b 23.4±7.5ab 24.2±7.1 0.000
Household number (±IQR) 6±3 5±3 5±2.5 5±3 NS
Selangor residentialPeriod (y± IQR) 30±32 27.5±35 27±29 29±32 NS
Marital statusSingleMarriedWidowed / divorced
(n,%)6(3)
110(47)9(4)
(n,%)13(6)58(25)3(1)
(n,%)8 (3)
33(14)1(0.4)
(n,%)27(11)
201(83)14(6) -
House hold income per month(RM± IQR) 2,000±2,100a 2800±2900b 2500±1600ab 2100±2500 0.014
Allocation for food per household per month(RM± IQR) 600±500a 800±575b 600±250a 600±500 0.001
IQR – Inter-quartile Range # Significant difference (P<0.05) between different ethnics were evaluated using Kruskall-Wallis H and Mann-Whitney U test. Different alphabet within the same row indicate significant different (p<0.05)
Table 1. Socio-demographic characteristics of the subjects included in the vegetable consumption survey in Selangor (N=242)
Fruits and vegetable consumption among Malaysian 1099
International Food Research Journal 19(3): 1095-1107
The median for BMI was in the normal range, however the differences between ethnics were significant (P<0.001). The BMI for Malays was in the overweight range compared to the Chinese and Indians, which were normal. The median number per household was five and many of them have resided in Selangor for nearly 30 years. Most of the subjects were married (83%), 11% of them were single and 6% were either widowed or divorced. The household income per month for the Chinese and Indians were higher (P=0.014) compared to the Malays but only the Chinese spent significantly (P<0.001) higher income on food. Overall, subjects spent about 29% of their income on food and only 4% on vegetables. The Malays spent less (P=0.018) of their income on purchasing vegetables compared to the Chinese and Indians.
Fruits and vegetables preferences
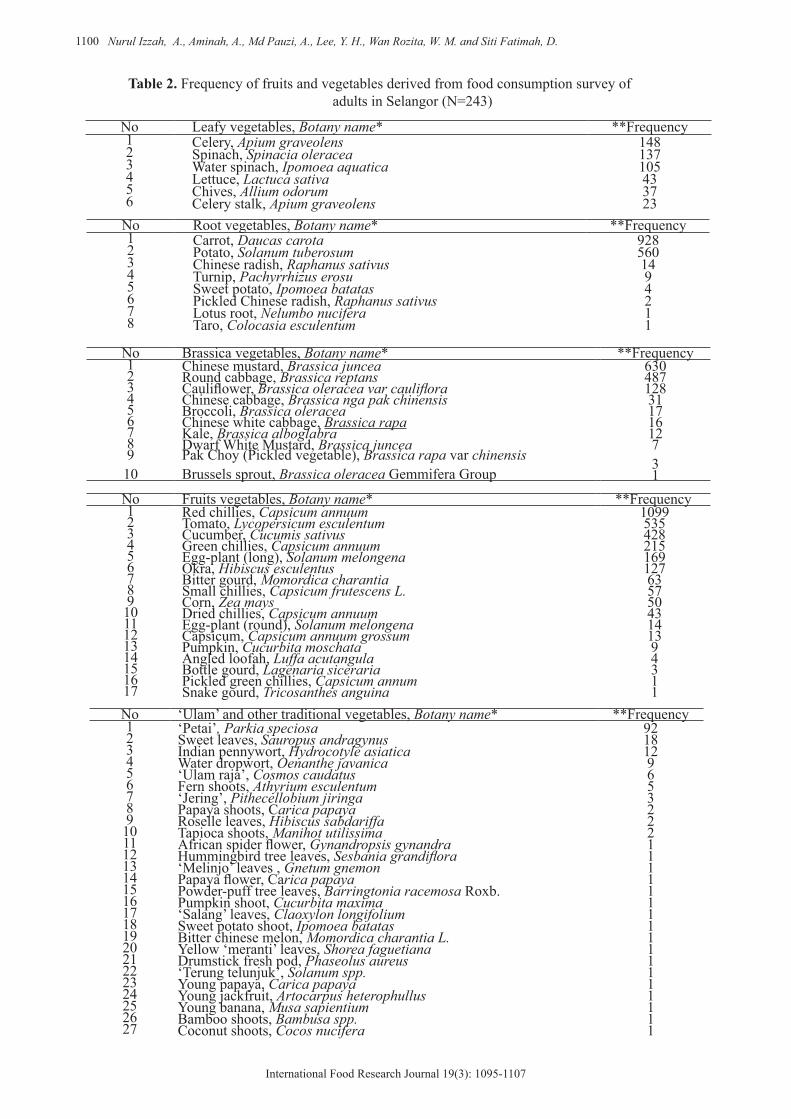
Table 2 shows the frequencies of different types of vegetables consumed by subjects. Overall, there were 96 types of either commercial or traditional vegetables that were consumed as raw/salad or cooked as a vegetable dishes or as an ingredient in other prepared food. Among them were 6 leafy vegetables, 5 leguminous vegetables, 8 root vegetables, 10 brassica vegetables and 17 fruits vegetables. There were also 27 types of ulam and traditional vegetables and another 23 types of vegetables were group under other vegetables that inclusive of spices and flavorings.
Celery (Apium graveolens), spinach (Spinacia oleracea), water spinach (Ipomoea aquatic), long beans (Vigna sesquipedolis), French beans (Phaseolus vulgaris), carrot (Daucas carota) and potato (Solanum tuberosum) were among the most frequently consumed leafy, leguminous and root vegetables. Subjects preferred three brassica vegetables which were Chinese mustard (Brassica juncea), round cabbage (Brassica reptans) and cauliflower (Brassica oleracea var cauliflora). A total of 17 types of fruit vegetables were identified and most frequently consumed were chilies (red, green, small or dried) (capsicum spp.), tomato (Lycopersicum esculentum), cucumber (Cucumis sativus), long egg-plant (Solanum melongena) and okra (Hibiscus esculentus). Other fruit vegetables such as bitter gourd (Momordica charantia), corn (Zea mays), round egg-plant (Solanum melongena) and capsicum (Capsicum annum grossum) were also among highly preferred fruit vegetables by subjects.
The most frequently consumed ulam was petai (Parkia speciosa) followed by Indian pennywort (Hydrocotyle asiatica), water dropwort (Oenanthe
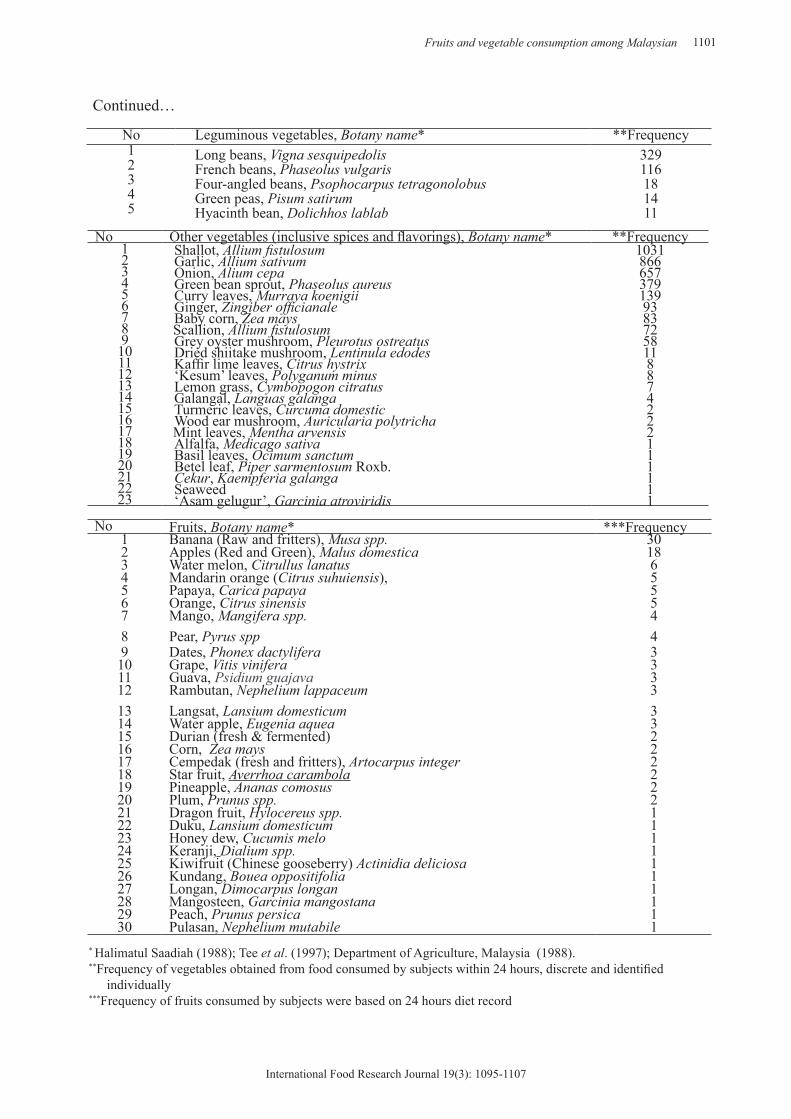
javanica) and ulam raja (Cosmos caudatus). Highly consumed traditional vegetables were sweet leaves (Sairopus andragynus) and fern shoots (Athyrium esculatum). Spices and flavorings such as shallot (Allium fistulosum), garlic (Allium sativum), onion (Allium cepa), curry leaves (Murraya koenigii) and ginger (Zingziber officianale) were commonly used as an ingredient during food preparation and were the most frequent found in food samples. Green bean sprout (Phaseolus aureus) were frequently added as ingredient in prepared food such as noodles and prawn fritters, while baby corn (Zea mays) and grey oyster mushroom (Pleurotus ostreatus) were frequently prepared in mixed vegetables dishes.
Exploring the list of fruits (Table 2) consumed by subjects revealed 30 types of fruits inclusive of both local and imported fruits. The most consumed fruits were banana (Musa sp.) and apples (Malus domestica). Other fruits consumed by quite a number of subjects were water melons (Citrullus lanatus), mandarin orange (Citrus suhuiensis), papayas (Carica papaya), orange (Citrus spp.), Mango (Mangifera spp.) and Pear (Pyrus spp.). Fruits were mostly consumed raw, however banana was also eaten in the form of fritters which is consumed during afternoon tea as snack by most Malaysian.
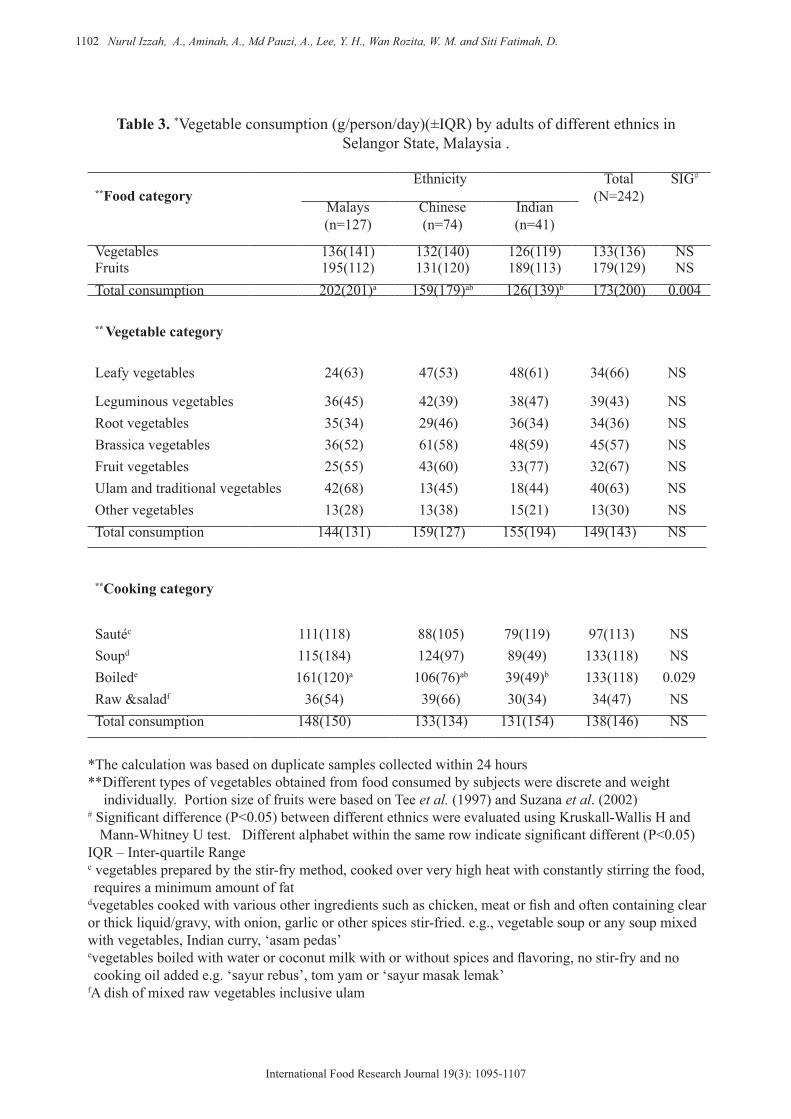
Fruits and vegetables consumptionTable 3 shows consumption of fruits and
vegetables at different categories by different ethnicity in Selangor. There were no significant differences on the intake of each category of vegetables and fruits among the three different ethnics. The median consumption of vegetables and fruits per day were 133 g/day and 179 g/day, respectively. However, when both category were combined and analyzed, it showed that Malays (202 g/day) consumed significantly (P=0.004) more of fruits and vegetables compared to the other two ethnics groups.
Generally, women (193 g/day) were found to consume more fruits and vegetables than men (153 g/day) did, however the differences was not significant (P≥0.05). Subject resided in the rural areas consumed significantly (P=0.017) more vegetables (213 g/day) compared to those in the urban areas (129 g/day). In contrary, the results showed that urban subjects (195 g/day) consumed more fruits compared to the rural (130 g/day); however, the difference was not significant (P≥0.05). Consumption of fruits and vegetables during weekdays and weekends also showed no significant differences (P≥0.05).
1100 Nurul Izzah, A., Aminah, A., Md Pauzi, A., Lee, Y. H., Wan Rozita, W. M. and Siti Fatimah, D.
International Food Research Journal 19(3): 1095-1107
No Leafy vegetables, Botany name* **Frequency1 Celery, Apium graveolens 1482 Spinach, Spinacia oleracea 1373 Water spinach, Ipomoea aquatica 1054 Lettuce, Lactuca sativa 435 Chives, Allium odorum 376 Celery stalk, Apium graveolens 23
No Root vegetables, Botany name* **Frequency1 Carrot, Daucas carota 9282 Potato, Solanum tuberosum 5603 Chinese radish, Raphanus sativus 144 Turnip, Pachyrrhizus erosu 95 Sweet potato, Ipomoea batatas 46 Pickled Chinese radish, Raphanus sativus 27 Lotus root, Nelumbo nucifera 18 Taro, Colocasia esculentum 1
No Brassica vegetables, Botany name* **Frequency1 Chinese mustard, Brassica juncea 6302 Round cabbage, Brassica reptans 4873 Cauliflower, Brassica oleracea var cauliflora 1284 Chinese cabbage, Brassica nga pak chinensis 315 Broccoli, Brassica oleracea 176 Chinese white cabbage, Brassica rapa 167 Kale, Brassica alboglabra 128 Dwarf White Mustard, Brassica juncea 79 Pak Choy (Pickled vegetable), Brassica rapa var chinensis 310 Brussels sprout, Brassica oleracea Gemmifera Group 1No Fruits vegetables, Botany name* **Frequency1 Red chillies, Capsicum annuum 10992 Tomato, Lycopersicum esculentum 5353 Cucumber, Cucumis sativus 4284 Green chillies, Capsicum annuum 2155 Egg-plant (long), Solanum melongena 1696 Okra, Hibiscus esculentus 1277 Bitter gourd, Momordica charantia 638 Small chillies, Capsicum frutescens L. 579 Corn, Zea mays 5010 Dried chillies, Capsicum annuum 4311 Egg-plant (round), Solanum melongena 1412 Capsicum, Capsicum annuum grossum 1313 Pumpkin, Cucurbita moschata 914 Angled loofah, Luffa acutangula 415 Bottle gourd, Lagenaria siceraria 316 Pickled green chillies, Capsicum annum 117 Snake gourd, Tricosanthes anguina 1No ‘Ulam’ and other traditional vegetables, Botany name* **Frequency1 ‘Petai’, Parkia speciosa 922 Sweet leaves, Sauropus andragynus 183 Indian pennywort, Hydrocotyle asiatica 124 Water dropwort, Oenanthe javanica 95 ‘Ulam raja’, Cosmos caudatus 66 Fern shoots, Athyrium esculentum 57 ‘Jering’, Pithecellobium jiringa 38 Papaya shoots, Carica papaya 29 Roselle leaves, Hibiscus sabdariffa 210 Tapioca shoots, Manihot utilissima 211 African spider flower, Gynandropsis gynandra 112 Hummingbird tree leaves, Sesbania grandiflora 113 ‘Melinjo’ leaves , Gnetum gnemon 114 Papaya flower, Carica papaya 115 Powder-puff tree leaves, Barringtonia racemosa Roxb. 116 Pumpkin shoot, Cucurbita maxima 117 ‘Salang’ leaves, Claoxylon longifolium 118 Sweet potato shoot, Ipomoea batatas 119 Bitter chinese melon, Momordica charantia L. 120 Yellow ‘meranti’ leaves, Shorea faguetiana 121 Drumstick fresh pod, Phaseolus aureus 122 ‘Terung telunjuk’, Solanum spp. 123 Young papaya, Carica papaya 124 Young jackfruit, Artocarpus heterophullus 125 Young banana, Musa sapientium 126 Bamboo shoots, Bambusa spp. 127 Coconut shoots, Cocos nucifera 1
Table 2. Frequency of fruits and vegetables derived from food consumption survey of adults in Selangor (N=243)
Fruits and vegetable consumption among Malaysian 1101
International Food Research Journal 19(3): 1095-1107
No Leguminous vegetables, Botany name* **Frequency 1 Long beans, Vigna sesquipedolis 3292 French beans, Phaseolus vulgaris 1163 Four-angled beans, Psophocarpus tetragonolobus 184 Green peas, Pisum satirum 145 Hyacinth bean, Dolichhos lablab 11
No Other vegetables (inclusive spices and flavorings), Botany name* **Frequency1 Shallot, Allium fistulosum 10312 Garlic, Allium sativum 8663 Onion, Alium cepa 6574 Green bean sprout, Phaseolus aureus 3795 Curry leaves, Murraya koenigii 1396 Ginger, Zingiber officianale 937 Baby corn, Zea mays 838 Scallion, Allium fistulosum 729 Grey oyster mushroom, Pleurotus ostreatus 5810 Dried shiitake mushroom, Lentinula edodes 1111 Kaffir lime leaves, Citrus hystrix 812 ‘Kesum’ leaves, Polyganum minus 813 Lemon grass, Cymbopogon citratus 714 Galangal, Languas galanga 415 Turmeric leaves, Curcuma domestic 216 Wood ear mushroom, Auricularia polytricha 217 Mint leaves, Mentha arvensis 218 Alfalfa, Medicago sativa 119 Basil leaves, Ocimum sanctum 120 Betel leaf, Piper sarmentosum Roxb. 121 Cekur, Kaempferia galanga 122 Seaweed 123 ‘Asam gelugur’, Garcinia atroviridis 1
No Fruits, Botany name* ***Frequency1 Banana (Raw and fritters), Musa spp. 302 Apples (Red and Green), Malus domestica 183 Water melon, Citrullus lanatus 64 Mandarin orange (Citrus suhuiensis), 55 Papaya, Carica papaya 56 Orange, Citrus sinensis 57 Mango, Mangifera spp. 48 Pear, Pyrus spp 49 Dates, Phonex dactylifera 310 Grape, Vitis vinifera 311 Guava, Psidium guajava 312 Rambutan, Nephelium lappaceum 313 Langsat, Lansium domesticum 314 Water apple, Eugenia aquea 315 Durian (fresh & fermented) 216 Corn, Zea mays 217 Cempedak (fresh and fritters), Artocarpus integer 218 Star fruit, Averrhoa carambola 219 Pineapple, Ananas comosus 220 Plum, Prunus spp. 221 Dragon fruit, Hylocereus spp. 122 Duku, Lansium domesticum 123 Honey dew, Cucumis melo 124 Keranji, Dialium spp. 125 Kiwifruit (Chinese gooseberry) Actinidia deliciosa 126 Kundang, Bouea oppositifolia 127 Longan, Dimocarpus longan 128 Mangosteen, Garcinia mangostana 129 Peach, Prunus persica 130 Pulasan, Nephelium mutabile 1
* Halimatul Saadiah (1988); Tee et al. (1997); Department of Agriculture, Malaysia (1988).**Frequency of vegetables obtained from food consumed by subjects within 24 hours, discrete and identified
individually***Frequency of fruits consumed by subjects were based on 24 hours diet record
Continued…
1102 Nurul Izzah, A., Aminah, A., Md Pauzi, A., Lee, Y. H., Wan Rozita, W. M. and Siti Fatimah, D.
International Food Research Journal 19(3): 1095-1107
**Food categoryEthnicity Total
(N=242)SIG#
Malays(n=127)
Chinese (n=74)
Indian(n=41)
Vegetables 136(141) 132(140) 126(119) 133(136) NSFruits 195(112) 131(120) 189(113) 179(129) NSTotal consumption 202(201)a 159(179)ab 126(139)b 173(200) 0.004
** Vegetable category
Leafy vegetables 24(63) 47(53) 48(61) 34(66) NS
Leguminous vegetables 36(45) 42(39) 38(47) 39(43) NSRoot vegetables 35(34) 29(46) 36(34) 34(36) NSBrassica vegetables 36(52) 61(58) 48(59) 45(57) NSFruit vegetables 25(55) 43(60) 33(77) 32(67) NSUlam and traditional vegetables 42(68) 13(45) 18(44) 40(63) NSOther vegetables 13(28) 13(38) 15(21) 13(30) NSTotal consumption 144(131) 159(127) 155(194) 149(143) NS
**Cooking category
Sautéc 111(118) 88(105) 79(119) 97(113) NSSoupd 115(184) 124(97) 89(49) 133(118) NSBoilede 161(120)a 106(76)ab 39(49)b 133(118) 0.029Raw &saladf 36(54) 39(66) 30(34) 34(47) NSTotal consumption 148(150) 133(134) 131(154) 138(146) NS
Table 3. *Vegetable consumption (g/person/day)(±IQR) by adults of different ethnics in Selangor State, Malaysia .
*The calculation was based on duplicate samples collected within 24 hours **Different types of vegetables obtained from food consumed by subjects were discrete and weight
individually. Portion size of fruits were based on Tee et al. (1997) and Suzana et al. (2002)# Significant difference (P<0.05) between different ethnics were evaluated using Kruskall-Wallis H and
Mann-Whitney U test. Different alphabet within the same row indicate significant different (P<0.05) IQR – Inter-quartile Range c vegetables prepared by the stir-fry method, cooked over very high heat with constantly stirring the food, requires a minimum amount of fat
dvegetables cooked with various other ingredients such as chicken, meat or fish and often containing clear or thick liquid/gravy, with onion, garlic or other spices stir-fried. e.g., vegetable soup or any soup mixed with vegetables, Indian curry, ‘asam pedas’ evegetables boiled with water or coconut milk with or without spices and flavoring, no stir-fry and no cooking oil added e.g. ‘sayur rebus’, tom yam or ‘sayur masak lemak’
fA dish of mixed raw vegetables inclusive ulam
Fruits and vegetable consumption among Malaysian 1103
International Food Research Journal 19(3): 1095-1107
The consumption of different categories of vegetables by subject of different ethnics showed no significant differences (P>0.05) (Table 3). Subjects consumed more brassica vegetables (45 g/person/day) followed by ulam and traditional vegetables (40 g/person/day), leguminous vegetables (39 g/person/day), root and leafy vegetables (34 g/person/day, respectively) and fruits vegetables (32 g/person/day). The brassica and leafy vegetables were among commonly used as ingredients in prepared food such as fried rice and noodles. Other vegetables, which were the least consumed (13g /person /day), were mainly used as spices and flavoring.
No significant differences (P>0.05) were shown for the consumption of vegetables prepared using different methods or recipes by different ethnic groups, accepted for boiled vegetables (Table 3). The Malays (161 g/day) and Chinese (106 g/day) consumed more boiled vegetables compared to the Indians (39 g/day) (P=0.029). None of the Indian consumed salad at the time of the survey for this study. Only small amount of vegetables were consumed raw (34 g/person/day).
Discussion
This study examined the consumption of fruits and vegetable among adults of different ethnic resided in Selangor, Malaysia. Overall, it was observed that the daily consumption of vegetables among adults (55%) of different ethnics are still below than the recommended amount by WHO (2003). Nevertheless, the median consumption (133 g/day) from this study is nearly 40% higher than the results reported by the Ministry of Health Malaysia (2006) from the Malaysian Adult Nutrition Survey (MANS) in year 2003 (Norimah et al., 2008). The difference may refer to duplicate portion method that was implemented in this study. All vegetables consumed by subjects which inclusive vegetable dishes and vegetable added as an ingredients in prepared food were collected as duplicate portion. The weight of each types of vegetable was measured and total consumption was calculated. Consumption data from previous study was calculated based on frequency of vegetable consumption that included vegetable dishes only.
In Malaysia, most prepared food contained vegetables as ingredients. An example of prepared food with vegetable added as an ingredients are varieties of soup (vegetable soup, tom yam soup, chicken soup, etc), rice dishes (fried rice, ‘nasi kerabu’, ‘nasi dagang’, chicken rice, etc), varieties of noodles dishes (fried noodles, ‘laksa’, fried kuew teow, fried rice noodle, etc) and traditional snacks
(prawn fritters, spring rolls, ‘rojak’, etc). The Food Frequency Questionnaire (FFQ) approach provided estimates on the frequency and quantity of food consumed by individuals (Kubena, 2000; Norimah et al., 2008) with less specificity (McNutt et al., 2008).
In contrast with vegetables consumption, the median consumption of fruits meet WHO recommendation (WHO, 2003) of 160 g per day. Although the consumption was slightly insufficient for the Chinese but the difference was not significant (P>0.05). However, these results were derived from the response of only 26.3% of study subjects who consumed fruits on the day the study was conducted. The pattern of fruit consumption was not affected by the availability of fruits as at the time of this survey (July to November) local fruits such as durian (Durio sp.), rambutans (Nephelium lappaceum), cempedak (Artocarpus integer), duku/dokong (Lansium domesticum) and mangosteen (Garcinia mangostana) are in season (fruit season in Selangor started from August to October) (FAMA, 2010). Since it was fruits season, the price of these fruits were comparatively cheaper than other fruits and abundance of them are put up for sale even at the road side. The data showed that consumption of seasonal fruits at lowest price point did not show an increased and frequent in intake. Thus, this indicated that price was not a single factor that determine preferences in consumption of these seasonal fruits. In agreement with this finding, another study on motive of food choice with a comparison of consumers from selected Asia countries showed that price is not an important food choice factors among Malaysian consumers, specifically the Chinese (Prescott et al., 2002). A study conducted among Polish population also showed similar findings where price were only among moderate factor that influenced food choice (Wadolowska et al 2008). However, many studies had showed a positive correlation between total household income with fruit consumption (Kamphuis et al., 2007; Riediger et al., 2007; Powell et al., 2009). In Selangor, some of the lower-income families who live in rural neighbourhoods were less accessible to shops or supermarket but were surrounded by fruit trees and orchard which may explain consumption of fruits by means of its availability only. But for urban dwellers, more groceries stores and supermarkets offer varieties of local and imported fruits at affordable prices through-out the year.
Taste and preference suffice as the influencial factors of fruits consumption. Unlike vegetables which had been reported containing compounds responsible for bitterness, pungency and/or astringency (Drewnowski and Gomez-Carneros,
1104 Nurul Izzah, A., Aminah, A., Md Pauzi, A., Lee, Y. H., Wan Rozita, W. M. and Siti Fatimah, D.
International Food Research Journal 19(3): 1095-1107
2000; Dinehart, 2006), fruits were preferred based on interactions between its good texture and taste (Harker et al., 2003). For example apples were preferred for its sweetness and hard texture or juiceness and acidic taste (Daillant-Spinnler et al., 1996). Crunchy texture is particularly important for fruits and were always been associated with its freshness and wholesomeness. It is a desirable quality and contributed to enjoyment of eating fruits (Fillion and Kilcast, 2002).
The study disclosed that vegetable at all categories were preferred by subjects, however the traditional vegetables were only preferred by the Malays compared to the other two ethnic groups. The Chinese and Indians consumed more leafy and brassica vegetables compared to the Malays. Nevertheless, the variety of vegetables consumed covers dark green vegetables, starchy and fruits vegetables and other vegetables were consistent with recommendation by the Malaysian Food Pyramid (Ministry of Health, 2008). Subjects preferred boiled and soup vegetables compared to saute, less vegetables were consumed raw. Unlikely for Indians, none of the subject consumed salad on the day this study was conducted. The results of this study indicated that fruits and vegetable consumption behaviour are almost similar among different ethnics of Malaysians.
The low level of nutritional practice in relation to vegetables intake among subjects in this study showed that majority of subjects were not aware of the dietary recommendations for vegetables as stated in the Malaysian Food Pyramid. In Malaysia, no study has specifically examined factors influencing fruit and vegetable consumption, yet consumption data are scanty. Previous reports discussed on the numerous determinants of food choice and among the factors are demographic and socioeconomic variables, social, cultural and cognitive influences, hunger and satiety, individual taste preferences, as well as the sensory and other physical characteristics of food (Shepherd and Stockley, 1985; 1987). A dietary restraint was a consistent predictor of food choice compared to nutrition knowledge and food beliefs (Tepper et al., 1997). Among other significant factors were the sensory and functional factors, while health and price were moderate (Wadolowska et al., 2008).
Many theoretical approaches have been employed to explain general fruit and vegetable consumption in many studies inclusive the Theory of Planned Behaviour in which a central predictor of behaviour is an individual’s intention to perform the behaviour (Blanchard et al., 2009). There are research examining fruit and vegetables consumption
reported the attitudes, subjective norm and perceived behavioral control as significant predictors in study subjects (Blanchard et al., 2009). Association between higher levels of fruit and vegetable consumption with lower prices were also reported (Powell et al., 2009)
There is a need to conduct such studies in this country, as dietary recommendation intake has to be met for chronic diseases prevention. Nearly two decades ago, the Ministry of Health Malaysia had launched the Healthy Lifestyle Campaign with different disease-oriented themes each year where healthy eating was selected as theme for the year 1997. The theme was remained as one of the four basic elements in the following Healthy Lifestyle Campaign in 2003 (Ministry of Health Malaysia, 2003). Notwithstanding the effort through these campaigns, the intervention programs that aimed (1) to increase in nutrition knowledge (2) to show positive changes in attitudes toward healthy eating behaviours (including preference of vegetables) and sustainable ways of procuring food and (3) to consume more vegetables at home or out-side home are another wise attempt for implementation. Such programs had been carried out in United States (Richards et al., 2006; Knai et al., 2006; Rolnick et al., 2009; Ha and Caine-Bish, 2009; Wang et al., 2010) and European countries (Bere et al., 2004; Panunzio et al., 2007; Ha and Caine-Bish, 2009; Houston-Price et al., 2009) where most of the programs were implemented as nutrition–related obesity prevention programs (Wang et al., 2010). Youth are an important group to target for vegetables intervention efforts as intake that established in youth could be tracked into adulthood (French and Stable, 2003). School-based nutrition intervention have been an important setting examining strategies to increase healthy food choices among youth as it provide high access to youth of diverse/ethnics and socioeconomic groups (French and Stables, 2003; Richards et al., 2006; Panunzio et al., 2007; Ha and Caine-Bish, 2009; Wang et al., 2010).
This study had a number of limitations. Firstly, it was a cross-sectional study that used the National Household Sampling Frame (NHSF), obtained from the National Census Database, Year 2000 (Statistical Department of Malaysia, 2001). In every selected household, only one adult participated in the study. This ended up with sample composed largely of female adults, as they were at home at the time the survey was conducted. Thus, the results may not be generalized to population adults as a whole. This situation can be improved if all adults from selected house-hold involved in the study. Secondly, the 24-hour recall method may suffer recall bias, limiting
Fruits and vegetable consumption among Malaysian 1105
International Food Research Journal 19(3): 1095-1107
the accuracy or completeness of the information. To minimize this bias, the enumerators were trained to properly execute the 24-hours recalls methodology. Finally, given the cross-sectional nature of the data, differences across levels of key demographic variables did not indicate a causal nature for differences in fruits and vegetable intakes. A major strength of this study was obtaining accurate all vegetable consumption data using duplicate portion of food containing vegetables consumed in one day by study subjects.
Conclusions
The survey procedure described in this study represents a reliable method in estimating fruits and vegetables consumption amongst Malaysian. The results showed that Malaysian adults consumed varieties of fruits and vegetables per day. The amount of vegetables consumed is much lower than the daily-recommended intake by World Health Organization, nevertheless, the intake of fruits fulfilled the minimum requirement. The study findings indicate a need for new and enhanced effort targeting improvement in vegetable intake in Malaysian adults.
Acknowledgements
The authors would like to thank all subjects who participated in this survey and support staff of Environmental Health Research Center, Institute for Medical Research who directly or indirectly supported the project. A special thanks to the Director General of Health, Ministry of Health Malaysia for giving permission to publish this article. Due recognition go to the Division of Food Safety and Quality, Ministry of Health for funding this research under research activity number 20500.
References
Aminah, A. and Huda, N. 2006. Nutrition security in Muslim Ummah. To drive towards a healthy Ummah In JAKIM (Ed) Food and Technological Program – An Islamic perspective. Kuala Lumpur : JAKIM.
Baharrudin, Z. 2000. Pengenalan Ilmu Falah. Kuala Lumpur: Dewan Bahasa dan Pustaka.
Bere, E., Veierod, M.B. and Klepp, K-I. 2005. The Norwegian school fruit programme: evaluating paid vs. no-cost subscriptions. Preventive Medicine 41: 463-470.
Blanchard, C.M., Fisher J., Sparling, P.B., Shanks, T.H., Nehl, E., Rhodes, R.E., Courneya, K.S. and Baker, F. 2009. Understanding adherence to 5 servings of fruits and vegetables per day: A theory of planned behavior perspective. Journal of Nutrition Education and Behavior 41(1): 3-10.
Bogers, R.P., Assema, van, P., Kester, A.D.M. Westerterp, K.R. and Dagnelie, P.C. 2004. Reproducibility validity and responsiveness to change of a short questionnaire for measuring intake of fruits and vegetables. American Journal of Epidemiology 1: 900-909.
Chin, H.F. 1999. Malaysian vegetables in colour - A complete guide. Kuala Lumpur : Art Printing Works Sdn Bhd.
Daillant-Spinnler, B. MacFie, H.J.H., Beyts, P.K. and Hedderley, D. 1996. Relationship between perceived sensory properties and major preference directions of 12 varieties of apples from the Southern Hemisphere. Food Quality and Preference 7: 113-126.
de Bruijn, G.J. 2010. Understanding college students’ fruit consumption. Integrating habit strength in the theory of planned behavior. Appetite 54: 16-22.
Department of Agriculture, Malaysia. 1988. Hidangan ulam dan sayuran tradisional. Risalah Pertanian Bil. 51. Kuala Lumpur : Penerbitan Adabi,
Devine, C.M., Connors, M., Bisogni, C.A. and Sobal J. 1998. Life-course influences on fruit and vegetable trajectiroes: qualitative analysis of food choices. Journal of Nutrition and Education 30(6): 361-370.
Dinehart, M.E., Hayes, J.E., Bartoshuk, L.M., Lanier, S.L. and Duffy, V.B. 2006. Bitterness taste markers explain variability in vegetable sweetness, bitterness and intake. Physiology and Behavior 87: 304-313.
Drewnowski, A. and Gomez-Carneros, C. 2000. Bitter taste, phytonutrients and the consumer: a review. The American Journal of Clinical Nutrition 2(6): 1424-1435.
FAMA. 1995. Tinjauan pasaran sayur-sayuran. Sistem Maklumat Pasaran Pertaniaan. ISSN 0128-7028. FAMA, Kementerian Pertanian Malaysia, Kuala Lumpur.
FAMA. 2010. Kalendar Buah-buahan bermusim 2010, Malaysia. FAMA, Kementerian Pertanian Malaysia, Kuala Lumpur.
Fillion, L. and Kilcast, D. 2002. Consumer perception of crispness and crunchiness in fruits and vegetables. Food Quality and Preference 13: 23-29.
Guenther, P.M., Kevin, W.D., Reedy, J. and Krebs-Smith, S.M. 2006. Most American eat much less than recommended amounts of fruits and vegetables. Journal of American Dietetic Association. 106(9): 1371-1379.
Ha, E.J. and Caine-Bish, N. 2009. Effects of nutrition intervention using a general nutrition course for promoting fruit and vegetable consumption among college students. Journal of Nutrition Education and Behavior 41(2): 103-109.
Halimatul Saadiah A.S. 1998. Sayur-sayuran Semenanjung Malaysia. Kuala Lumpur : Dewan Bahasa dan
1106 Nurul Izzah, A., Aminah, A., Md Pauzi, A., Lee, Y. H., Wan Rozita, W. M. and Siti Fatimah, D.
International Food Research Journal 19(3): 1095-1107
Pustaka.Hall J.N., Moore, S., Harper, S.B. and Lynch, J.W. 2009.
Global variability in fuit and vegetable consumption. American Journal of Preventive Medicine 36(5): 402-409.
Harker, F.R., Gunson, F.A. and Jaeger, S.R. 2003. The case for fruit quality: an interpretive review of consumer attitudes and preferences for apples. Postharvest Biology and Technology 28:333-347.
Houston-Price, C., Butler, L. and Shiba, P. 2009. Visual exposure impacts on toddlers’ willingness to taste fruits and vegetables. Appetite 53: 450-453.
Internet: GEMS. 2000. GEMS/Food Regional diets (in grams per person per day). Download from http://www.who.int/fsf/GEMS/index.htm on 6/6/2000.
Internet: Ministry of Health, Malaysia. 2008. Food pyramid. Myhealth Portal – Malaysian Dietary Guidelines. Downloaded from http://www.myhealth.gov.my/myhealth on 30/3/2011
Internet: Statistical Department of Malaysia 2003. Selangor in figure. Downloaded from http://www.selangor.gov.my/final/figure.htm. on 4/3/2011
Internet: Statistical Department of Malaysia. 2001. Press Statement: Population distribution and basic demographic characteristics report population and housing census 2000. Downloaded from http://www.statistics.gov.my/English/pressdemo.htm on 10/7/2003
Internet: WHO. 2003. Fruit and vegetable promotion initiative–A meeting report 25-27/08/03. Downloaded from http://www.who.int/dietphysicalactivity/publications/f&v_promotion_initiative_report.pdf on 10/9/2009.
Kamphuis, C.B.M., van Lenthe, F.J., Giskes, K., Brug, J. and Mackenbach, J.P. 2007. Perceived environmental determinants of physical activity and fruit and vegetable consumption among high and low socioeconomic groups in the Netherlands. Health and Place 13: 493-503.
Knai, C., Pomerleau, J., Lock, K. and McKee M. 2006. Getting children to eat more fruit and vegetables: A systematic review. Preventive Medicine 42: 85-95.
Kubena, K.S. 2000 Accuracy in dietary assessment: On the road to good science. Journal of American Dietetic Association 100(7): 775-776.
Liu R.H. 2003. Health benefits of fruits and vegetables are from additive and synergistic combinations of phytochemicals. The American Journal of Clinical Nutrition 78(suppl): 517S-520S.
McNutt, S., Zimmerman, T.P. and Hull, S.G. 2008. Development of food composition databases for food frequency questionnaire (FFQ). Journal of Food Composition and Analysis 21: S20-S26.
Ministry of Health, Malaysia. 2003. Healthy lifestyle campaign: Be healthy for life. Kuala Lumpur: Health Education Division.
Ministry of Health, Malaysia. 2006. Food consumption statistics of Malaysia 2003. For adult population aged 18-59 years. Vol 1. Putrajaya: Department of Public Health, Malaysia.
Norimah, A.K., Safiah, M., Jamal K., Siti, H., Zuhaida, H., Rohida, S. Fatimah, S., Siti, N., Poh, B.K., Kandiah, M., Zalilah, M.S., Wan Manan, W.M., Fatimah, S. and Azmi, M.Y. 2008. Food consumption patterns: findings from the Malaysian Adult Nutrition Survey (MANS). Malaysian Journal of Nutrition 14(1): 25-39.
Nurul Izzah, A. 2007. Penilaian risiko pengambilan sisa racun perosak terpilih melalui pemakanan sayur-sayuran di kalangan penduduk dewasa di negeri Selangor. Malaysia: Universiti Kebangsaan Malaysia. PhD thesis.
Panunzio, M.F., Antonietta, A., Pisano, A. and Dalton. 2007. Nutrition education intervention by teacher may promote fruit and vegetable consumption in Italian students. Nutrition Research 27: 524-528.
Powell, L.M., Zhao, Z. and Wang, Y. 2009. Food prices and fruit and vegetable consumption among young American adults. Health and Place 15: 1064-1070.
Prescott, J., Young, O., Neill, L.O., Yau, N.J.N. and Stevens, R. 2002. Motives for food choice: a comparison of consumers from Japan, Taiwan, Malaysia and New Zealand. Food Quality Preference 13: 489-495.
Richards, A., Kattelmann, K.K. and Ren, C. 2006. Motivating 18-24-year-olds to increase their fruit and vegetable consumption. Journal of American Dietetic Association 106(9): 1405-1411.
Riediger, N.D., Shooshtari, S. and Moghadasian, M.H. 2007. The influence of sociodemographic factors on patterns of fruits and vegetable consumption in Canadian adolescents. Journal of American Dietetic Association 107(9): 1511-1518.
Rolnick, S.J., Calvi, J., Heimendinger, J., McClure, J.B., Kelley, M., Johnson, C. and Alexander, G.L. Focus groups inform a web-based program to increase fruit and vegetable intake. Patient Education Counseling 77: 314-318.
Shepherd, R. and Stockley L. 1985. Fat consumption and attitudes towards foods with a high fat content. Human Nutrition: Applied Nutrition 39A: 431-442
Shepherd, R. and Stockley, L. 1987. Nutrition knowledge, attitudes and fat consumption. Journal of the American Dietetic Association 87: 615-619.
Striegel-Moore, R.H., Thompson, D.R., Affenito, S.G., Franko, D.L., Barton, B.A., Schreiber, G.B., Daniels, S.R., Schmidt, M. and Crawford, P.B. 2006. Fruit and vegetable intake: Few adolescent girls meet national guidelines. Preventive Medicine 42: 223-228.
Suzana, S., Rafidah, G., Noor Aini, M.Y., Nik Shanita, S., Zahara, A.M. and Shahrul Azman, M.N. 2002. Atlas Makanan: Saiz pertukaran dan Porsi. Universiti Kebangsaan Malaysia. Kuala Lumpur: MDC Publishers and Printers Sdn Bhd.
Tee, E.S., Mohd Ismail, N., Mohd Nasir, A. and Khatijah, I. 1997. Nutrient composition of Malaysian foods. ASEAN Sub-Committee on protein: Food habits research and development, Kuala Lumpur.
Tepper, B.J, Young, S.C. and Nayga, R.M. Jr. 1997. Understanding food choice in adult men: Influence of nutrition knowledge, food beliefs and dietary restraint. Food Quality and Preference 8(4): 307-317.
Fruits and vegetable consumption among Malaysian 1107
International Food Research Journal 19(3): 1095-1107
Uglem, S., Frolich W.; zzzstea, T.H. and Wandel M. 2007. Correlates of vegetable consumption among young men in the Norwegian National Guard. Appetite 48: 46-53.
Wadolowska, L., Babicz-Zielinska E. and Czarnocinska, J. 2008. Food choice models and their relation with food preferences and eating frequency in the Polish population: POFPRES study. Food Policy 33: 122-134.
Wang, M.C., Rauzon, S., Studer, N., Martin, A.C., Craig, L., Merlo, C., Fung, K., Kursunoglu, D., Shannguan, M. and Crawford, P. 2010. Exposure to a comprehensive school intervention increases vegetable consumption. Journal of Adolescent Health 47: 74-82.
Warr, S., Rodriguez, G. and Penm, J. 2008. Changing food consumption and imports in Malaysia. Opportunities for Australian agricultural exports. ABARE research report 08.6 for the Australian Government Department of Agriculture, Fisheries and Forestry, Canberra.
WHO. 1995. Expert Committee on Physical Status. Physical status: the use and interpretation of anthropometry. Report of a WHO expert Committee. WHO technical report series: 854. Geneva: WHO.