Embed Size (px)
Citation preview
Pengelolaan Perikanan (Fisheries Management)
dan Strategy Pemanenan (Harvest Strategy)
Peninsula Hotel
Manado, 11 Desember 2017
Natural Resources National Policy 1
2
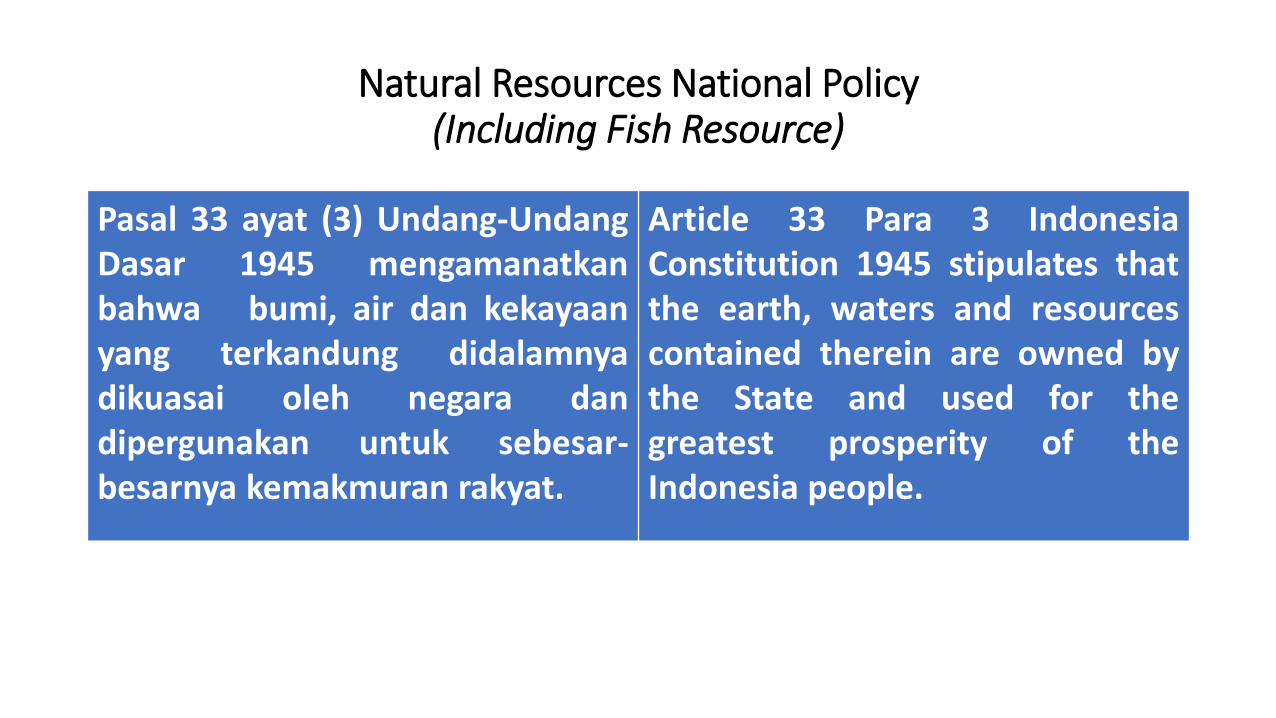
Natural Resources National Policy (Including Fish Resource)
Pasal 33 ayat (3) Undang-Undang Dasar 1945 mengamanatkan bahwa bumi, air dan kekayaan yang terkandung didalamnya dikuasai oleh negara dan dipergunakan untuk sebesar-besarnya kemakmuran rakyat.
Article 33 Para 3 Indonesia Constitution 1945 stipulates that the earth, waters and resources contained therein are owned by the State and used for the greatest prosperity of the Indonesia people.
Pengelolaan Perikanan 2
4
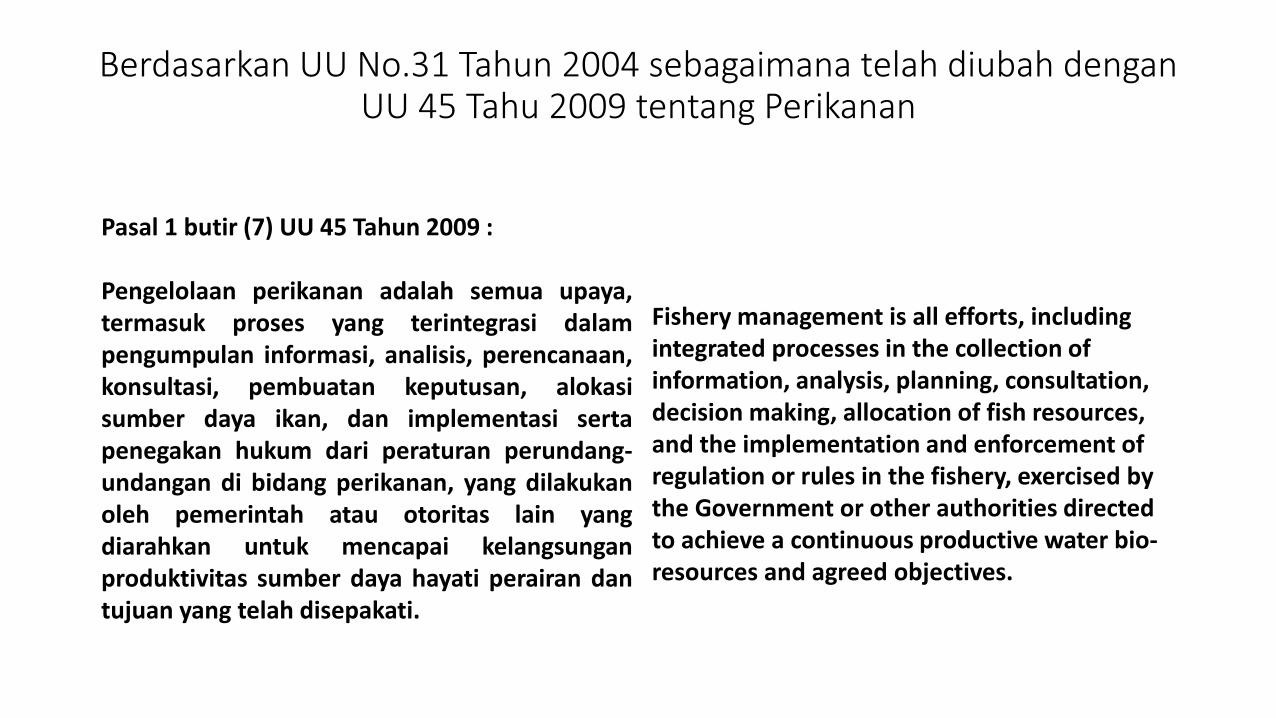
Berdasarkan UU No.31 Tahun 2004 sebagaimana telah diubah dengan UU 45 Tahu 2009 tentang Perikanan
Pasal 1 butir (7) UU 45 Tahun 2009 : Pengelolaan perikanan adalah semua upaya, termasuk proses yang terintegrasi dalam pengumpulan informasi, analisis, perencanaan, konsultasi, pembuatan keputusan, alokasi sumber daya ikan, dan implementasi serta penegakan hukum dari peraturan perundang-undangan di bidang perikanan, yang dilakukan oleh pemerintah atau otoritas lain yang diarahkan untuk mencapai kelangsungan produktivitas sumber daya hayati perairan dan tujuan yang telah disepakati.
Fishery management is all efforts, including integrated processes in the collection of information, analysis, planning, consultation, decision making, allocation of fish resources, and the implementation and enforcement of regulation or rules in the fishery, exercised by the Government or other authorities directed to achieve a continuous productive water bio-resources and agreed objectives.
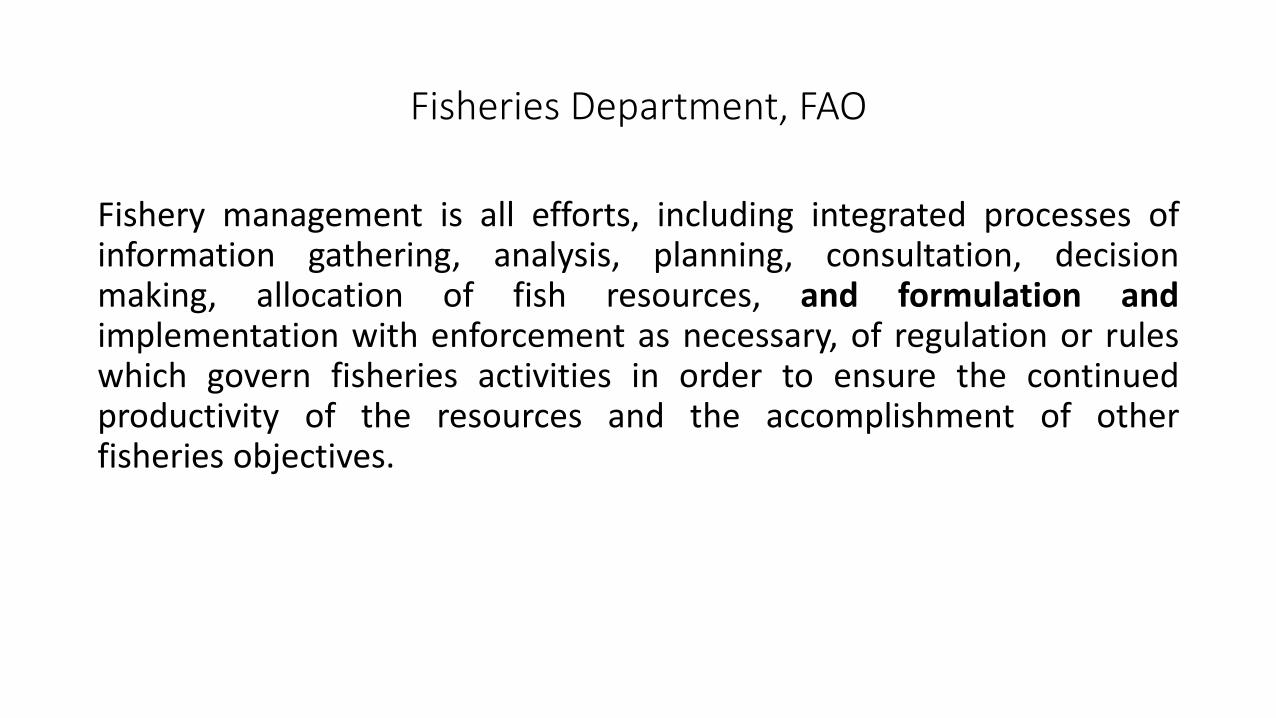
Fisheries Department, FAO
Fishery management is all efforts, including integrated processes of information gathering, analysis, planning, consultation, decision making, allocation of fish resources, and formulation and implementation with enforcement as necessary, of regulation or rules which govern fisheries activities in order to ensure the continued productivity of the resources and the accomplishment of other fisheries objectives.
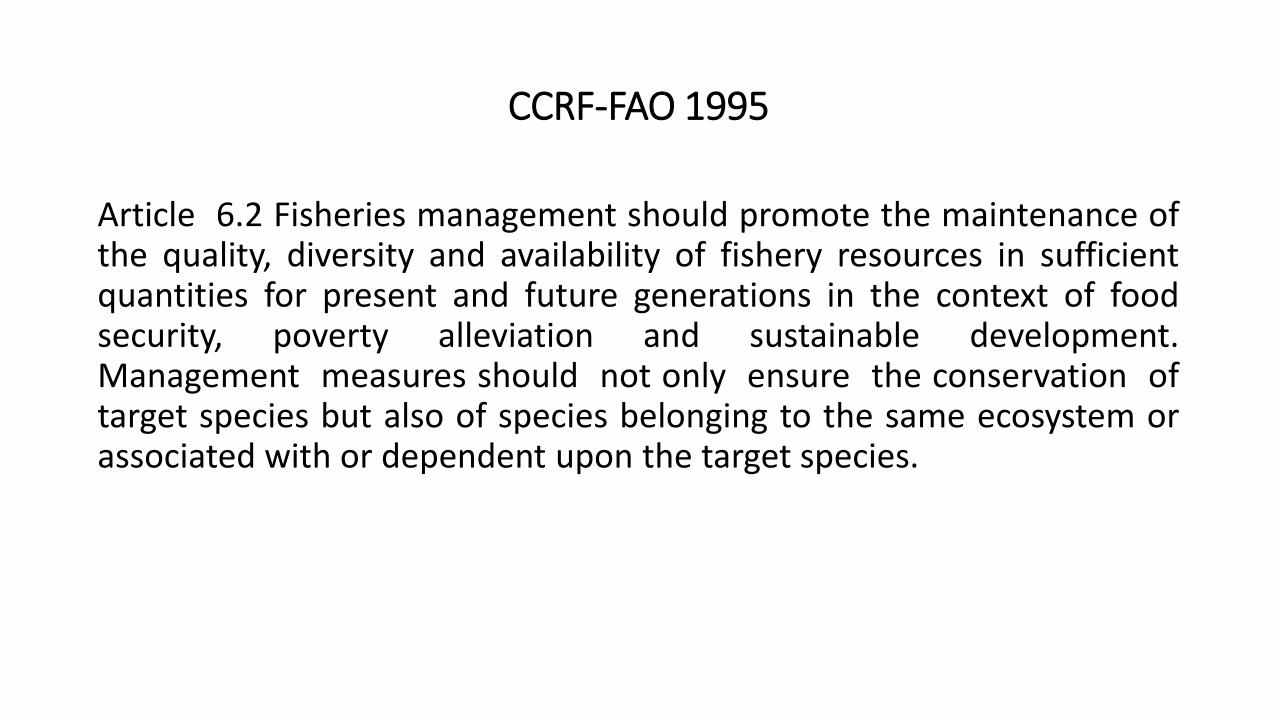
CCRF-FAO 1995
Article 6.2 Fisheries management should promote the maintenance of the quality, diversity and availability of fishery resources in sufficient quantities for present and future generations in the context of food security, poverty alleviation and sustainable development. Management measures should not only ensure the conservation of target species but also of species belonging to the same ecosystem or associated with or dependent upon the target species.
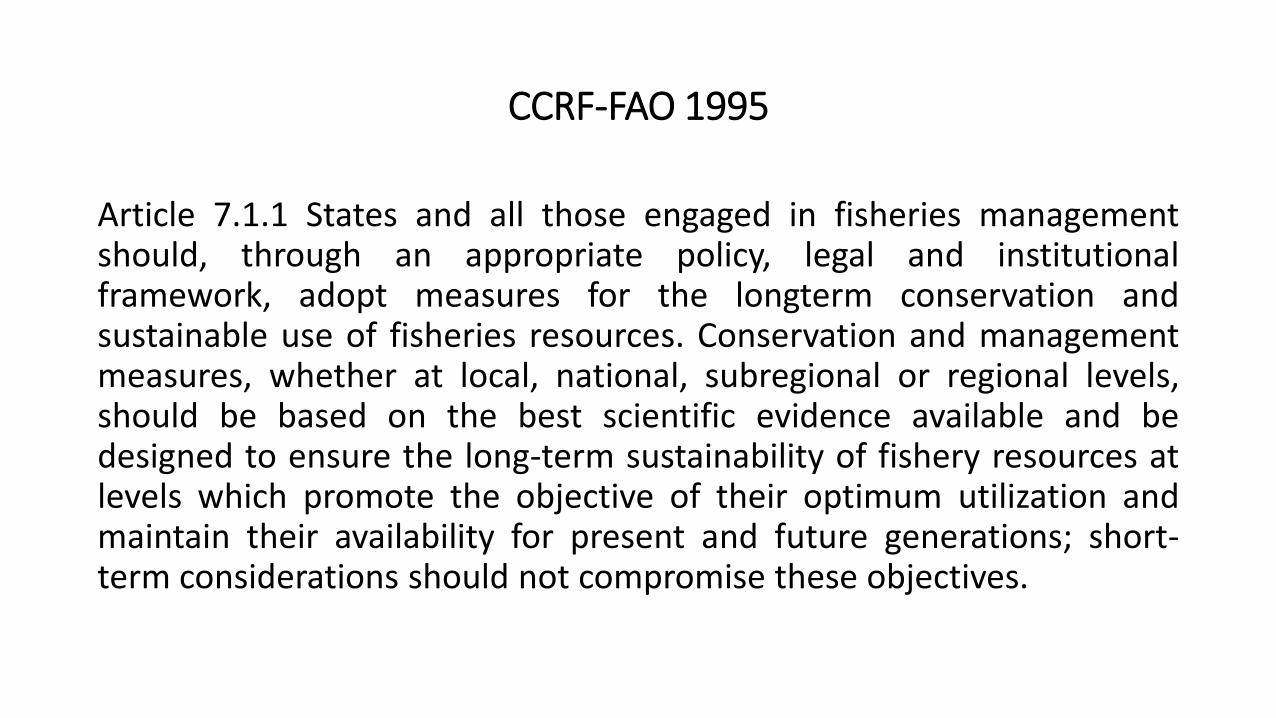
CCRF-FAO 1995
Article 7.1.1 States and all those engaged in fisheries management should, through an appropriate policy, legal and institutional framework, adopt measures for the longterm conservation and sustainable use of fisheries resources. Conservation and management measures, whether at local, national, subregional or regional levels, should be based on the best scientific evidence available and be designed to ensure the long-term sustainability of fishery resources at levels which promote the objective of their optimum utilization and maintain their availability for present and future generations; short-term considerations should not compromise these objectives.
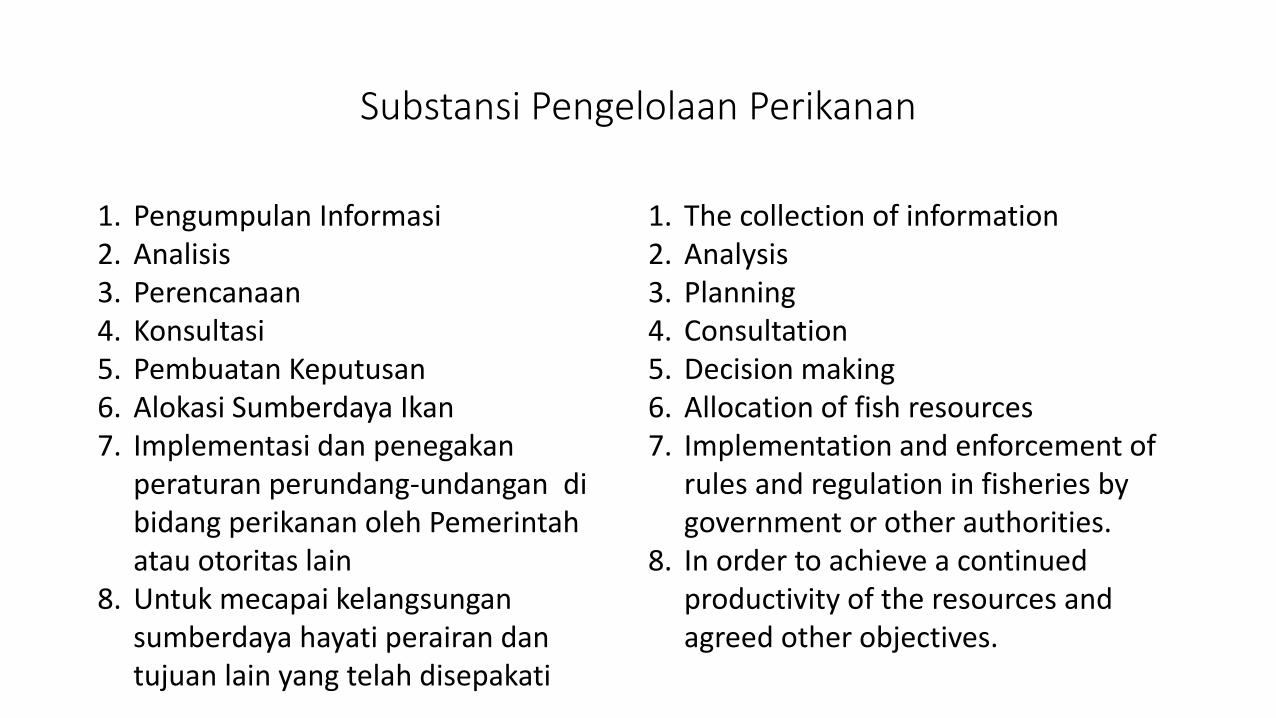
Substansi Pengelolaan Perikanan
1. Pengumpulan Informasi 2. Analisis 3. Perencanaan 4. Konsultasi 5. Pembuatan Keputusan 6. Alokasi Sumberdaya Ikan 7. Implementasi dan penegakan
peraturan perundang-undangan di bidang perikanan oleh Pemerintah atau otoritas lain
8. Untuk mecapai kelangsungan sumberdaya hayati perairan dan tujuan lain yang telah disepakati
1. The collection of information 2. Analysis 3. Planning 4. Consultation 5. Decision making 6. Allocation of fish resources 7. Implementation and enforcement of
rules and regulation in fisheries by government or other authorities.
8. In order to achieve a continued productivity of the resources and agreed other objectives.
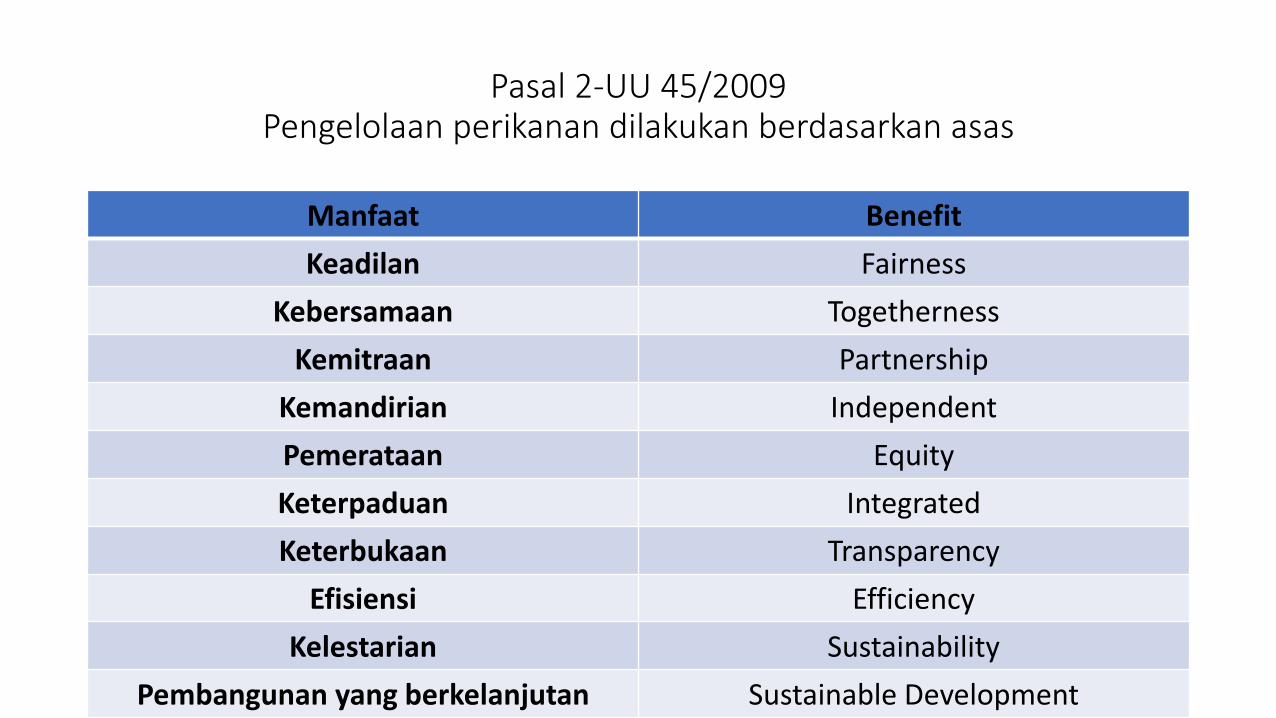
Pasal 2-UU 45/2009 Pengelolaan perikanan dilakukan berdasarkan asas
Manfaat Benefit
Keadilan Fairness
Kebersamaan Togetherness
Kemitraan Partnership
Kemandirian Independent
Pemerataan Equity
Keterpaduan Integrated
Keterbukaan Transparency
Efisiensi Efficiency
Kelestarian Sustainability
Pembangunan yang berkelanjutan Sustainable Development
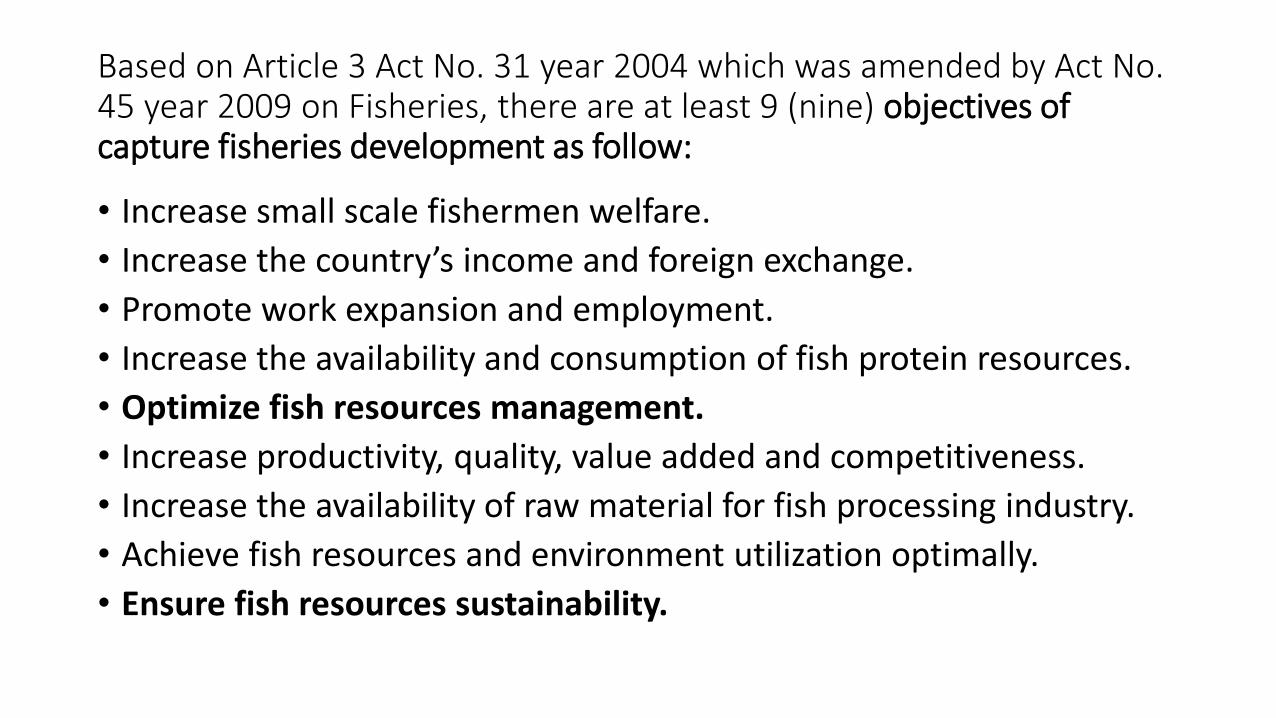
Based on Article 3 Act No. 31 year 2004 which was amended by Act No. 45 year 2009 on Fisheries, there are at least 9 (nine) objectives of capture fisheries development as follow:
• Increase small scale fishermen welfare.
• Increase the country’s income and foreign exchange.
• Promote work expansion and employment.
• Increase the availability and consumption of fish protein resources.
• Optimize fish resources management.
• Increase productivity, quality, value added and competitiveness.
• Increase the availability of raw material for fish processing industry.
• Achieve fish resources and environment utilization optimally.
• Ensure fish resources sustainability.
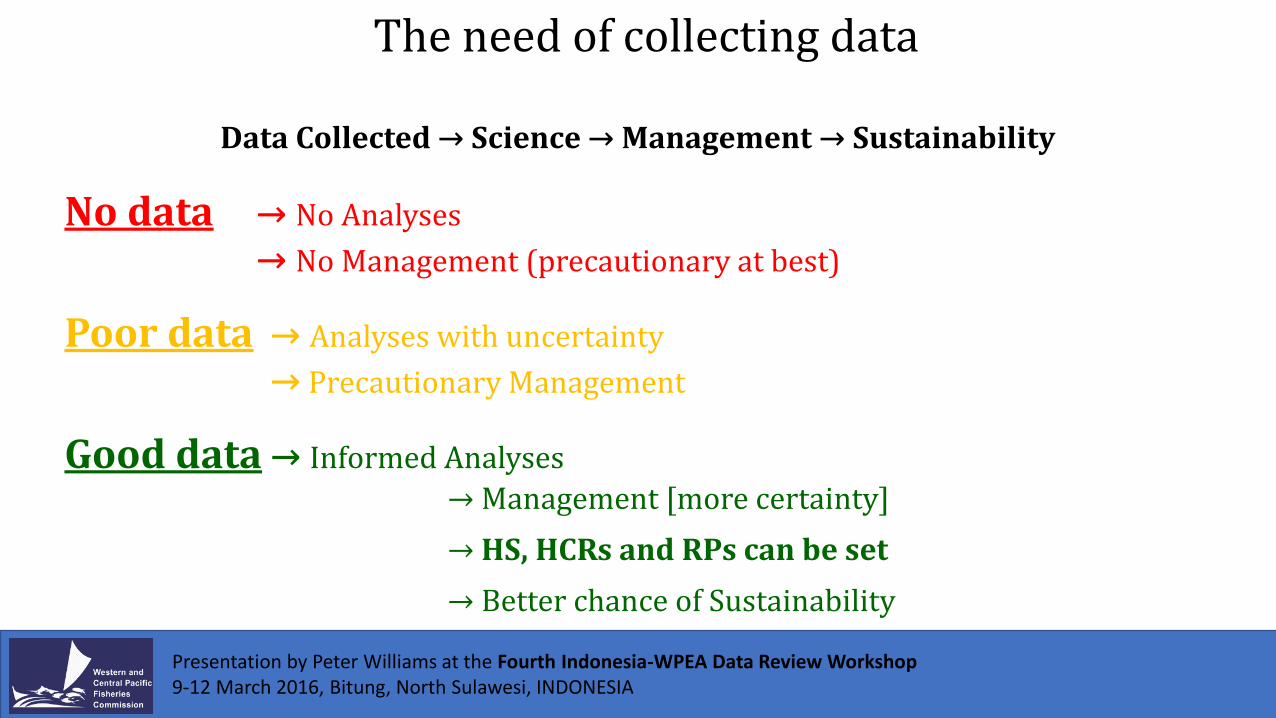
The need of collecting data
Data Collected → Science → Management → Sustainability
No data → No Analyses
→ No Management (precautionary at best)
Poor data → Analyses with uncertainty
→ Precautionary Management
Good data → Informed Analyses
→ Management [more certainty]
→ HS, HCRs and RPs can be set
→ Better chance of Sustainability Presentation by Peter Williams at the Fourth Indonesia-WPEA Data Review Workshop 9-12 March 2016, Bitung, North Sulawesi, INDONESIA
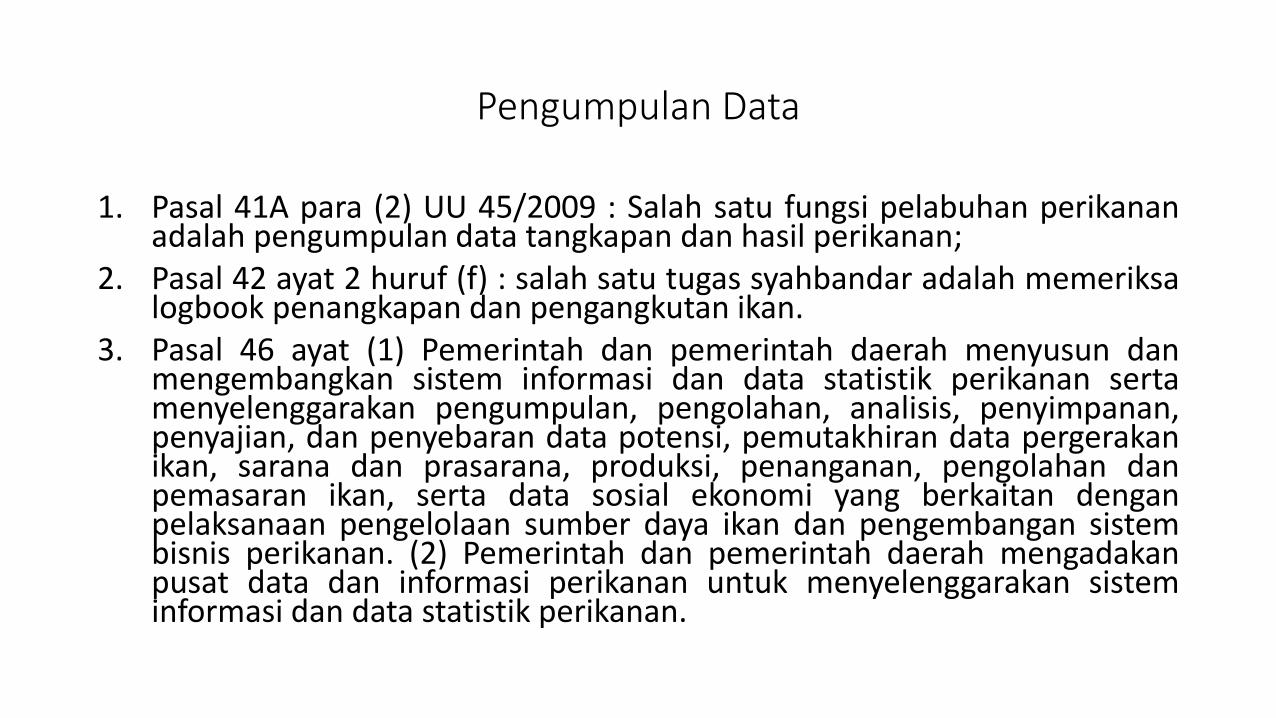
Pengumpulan Data
1. Pasal 41A para (2) UU 45/2009 : Salah satu fungsi pelabuhan perikanan adalah pengumpulan data tangkapan dan hasil perikanan;
2. Pasal 42 ayat 2 huruf (f) : salah satu tugas syahbandar adalah memeriksa logbook penangkapan dan pengangkutan ikan.
3. Pasal 46 ayat (1) Pemerintah dan pemerintah daerah menyusun dan mengembangkan sistem informasi dan data statistik perikanan serta menyelenggarakan pengumpulan, pengolahan, analisis, penyimpanan, penyajian, dan penyebaran data potensi, pemutakhiran data pergerakan ikan, sarana dan prasarana, produksi, penanganan, pengolahan dan pemasaran ikan, serta data sosial ekonomi yang berkaitan dengan pelaksanaan pengelolaan sumber daya ikan dan pengembangan sistem bisnis perikanan. (2) Pemerintah dan pemerintah daerah mengadakan pusat data dan informasi perikanan untuk menyelenggarakan sistem informasi dan data statistik perikanan.
Kerahasiaan Data
Pasal 46A Pemerintah menjamin kerahasiaan data dan informasi perikanan yang berkaitan dengan data log book penangkapan dan pengangkutan ikan, data yang diperoleh pengamat, dan data perusahaan dalam proses perizinan usaha perikanan.
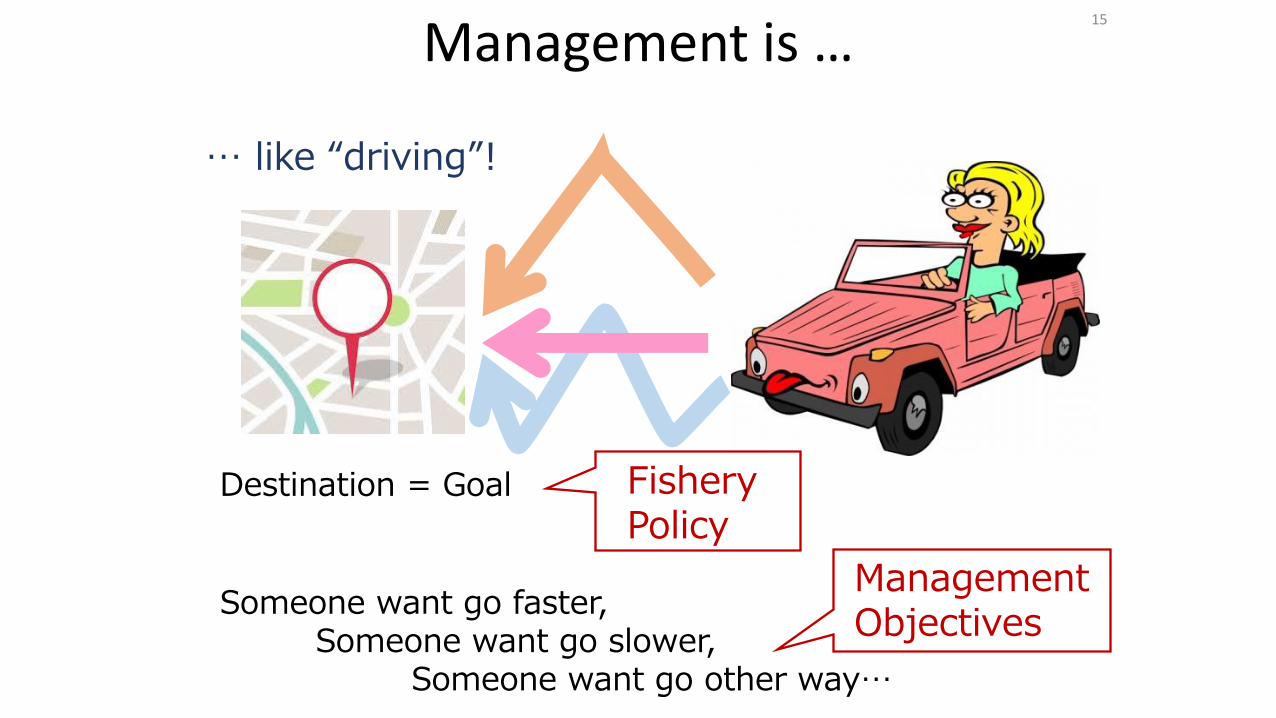
Management is …
… like “driving”!
Destination = Goal
Someone want go faster, Someone want go slower, Someone want go other way…
Fishery Policy
Management Objectives
15
HARVEST STRATEGY 3
16
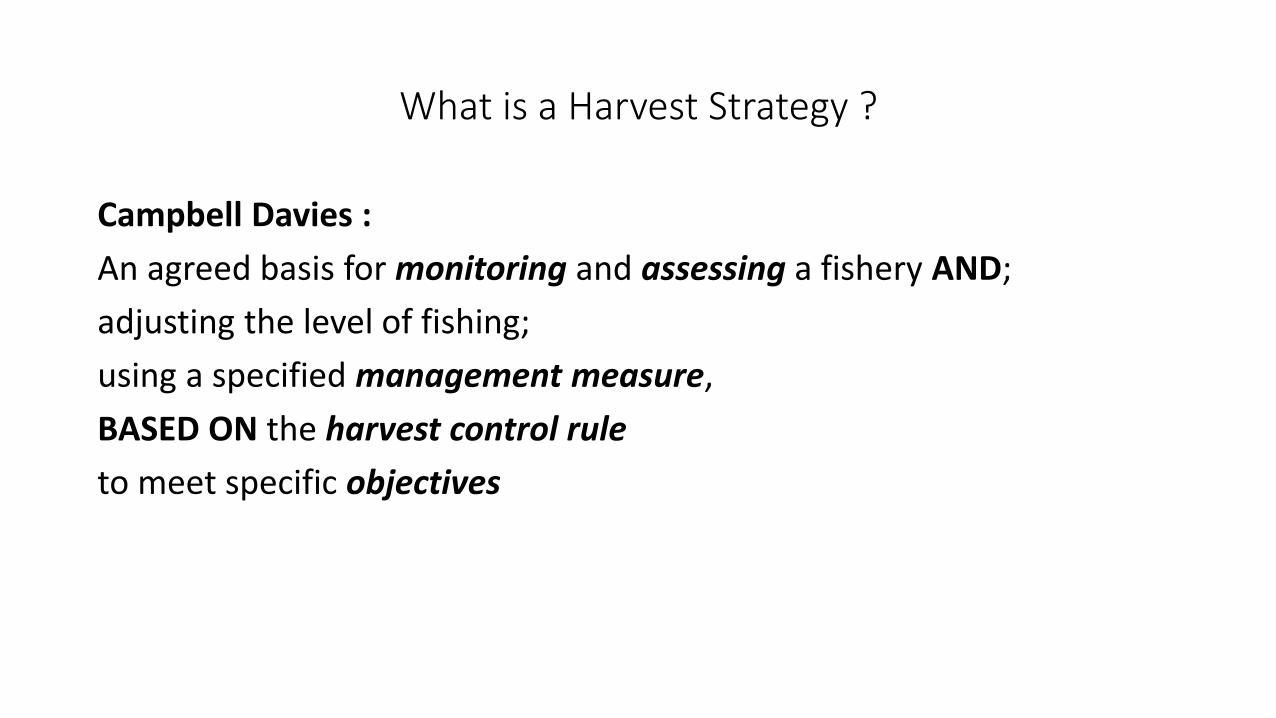
What is a Harvest Strategy ?
Campbell Davies :
An agreed basis for monitoring and assessing a fishery AND;
adjusting the level of fishing;
using a specified management measure,
BASED ON the harvest control rule
to meet specific objectives
What is a Harvest Strategy ?
Doug Butterworth:
• In essence, harvest strategies amount to agree the rules before you play the game (to agree rules before fishing operation)
• You set up the rules first, and then you stick to the rules. Because if you don't have that situation, when you get into trouble, the action that’s taken is too little too late.
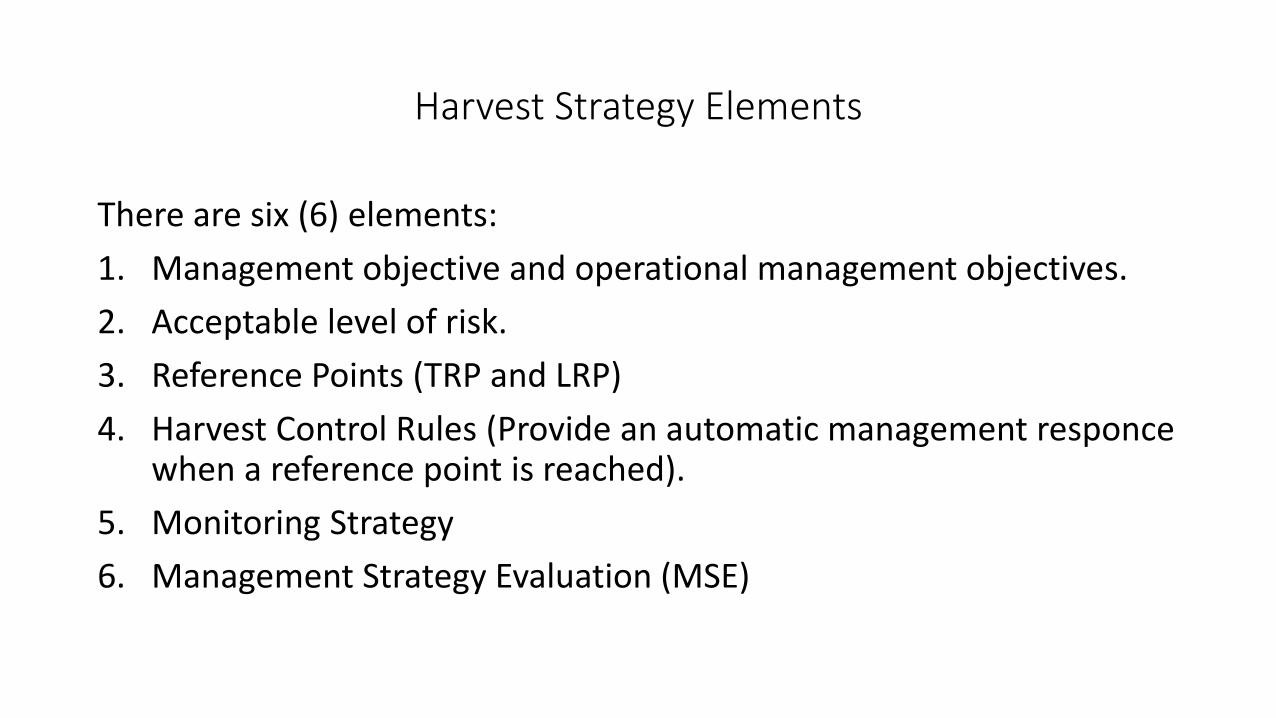
Harvest Strategy Elements
There are six (6) elements:
1. Management objective and operational management objectives.
2. Acceptable level of risk.
3. Reference Points (TRP and LRP)
4. Harvest Control Rules (Provide an automatic management responce when a reference point is reached).
5. Monitoring Strategy
6. Management Strategy Evaluation (MSE)
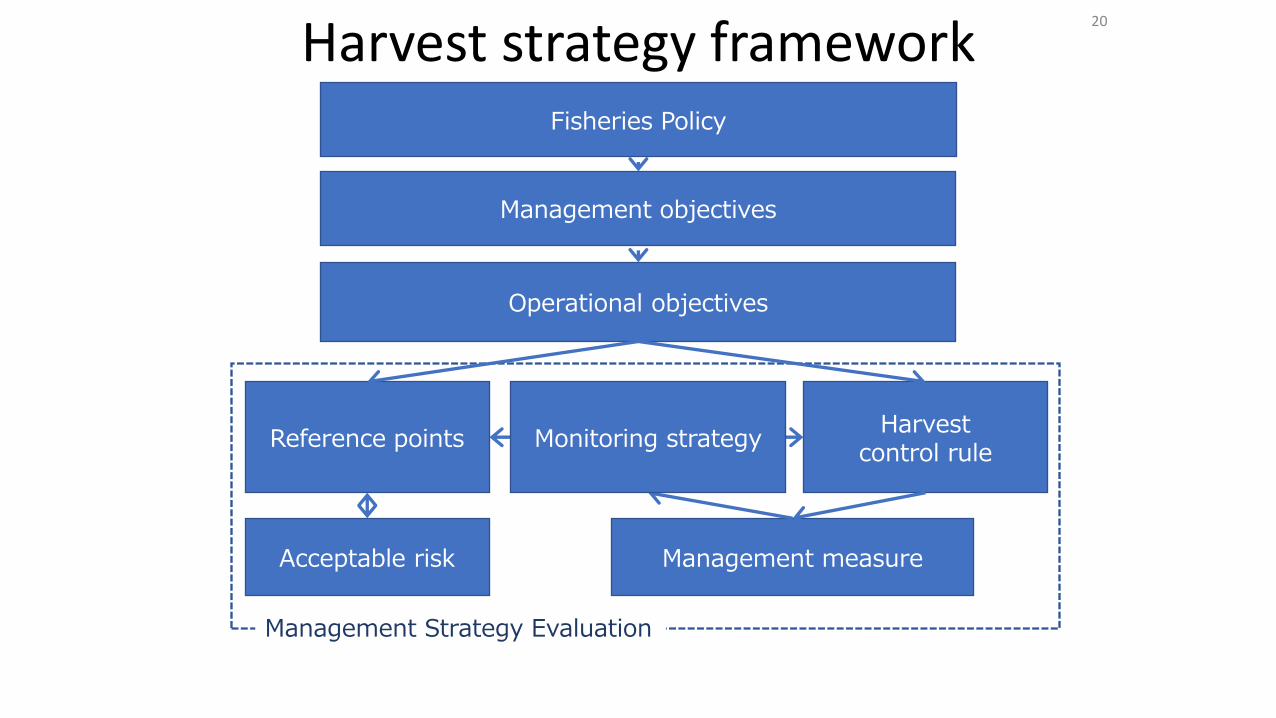
Harvest strategy framework
Management objectives
Operational objectives
Reference points
Acceptable risk
Harvest control rule
Management measure
Management Strategy Evaluation
Fisheries Policy
Monitoring strategy
20
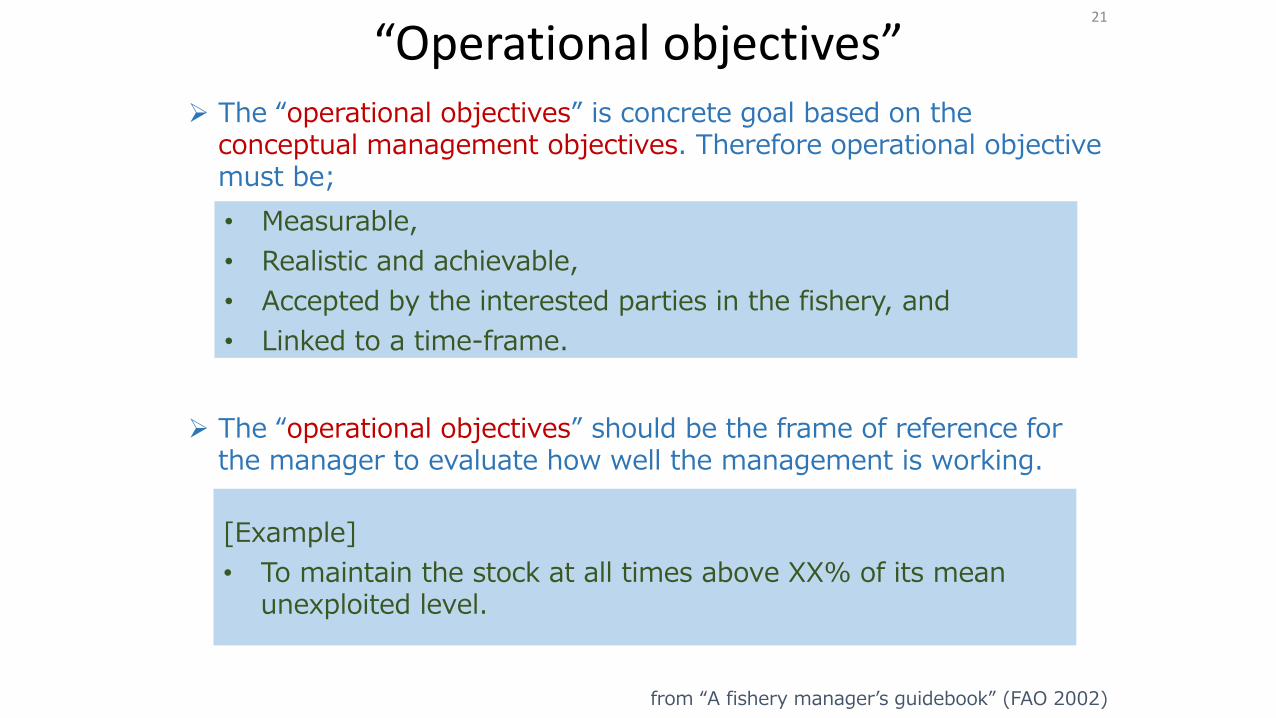
“Operational objectives”
The “operational objectives” should be the frame of reference for the manager to evaluate how well the management is working.
The “operational objectives” is concrete goal based on the conceptual management objectives. Therefore operational objective must be;
• Measurable,
• Realistic and achievable,
• Accepted by the interested parties in the fishery, and
• Linked to a time-frame.
[Example]
• To maintain the stock at all times above XX% of its mean unexploited level.
from “A fishery manager’s guidebook” (FAO 2002)
21
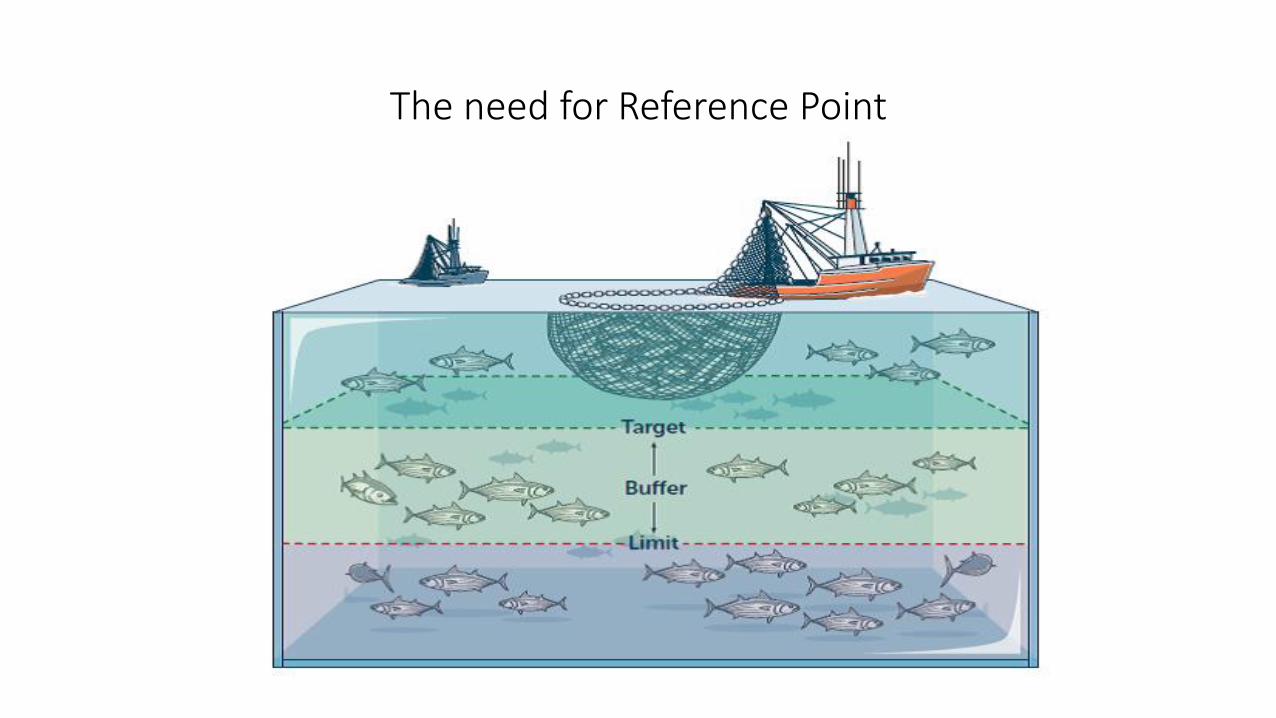
The need for Reference Point
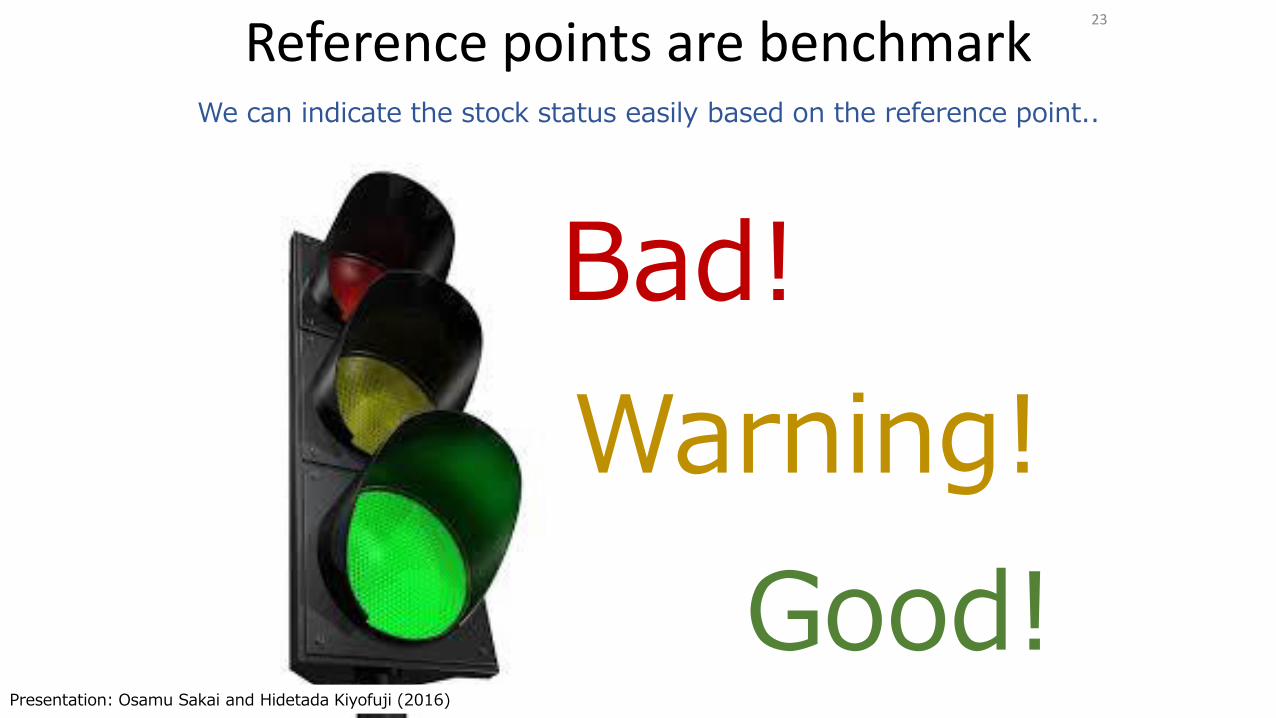
Reference points are benchmark We can indicate the stock status easily based on the reference point..
Good!
Warning!
Bad!
23
Presentation: Osamu Sakai and Hidetada Kiyofuji (2016)
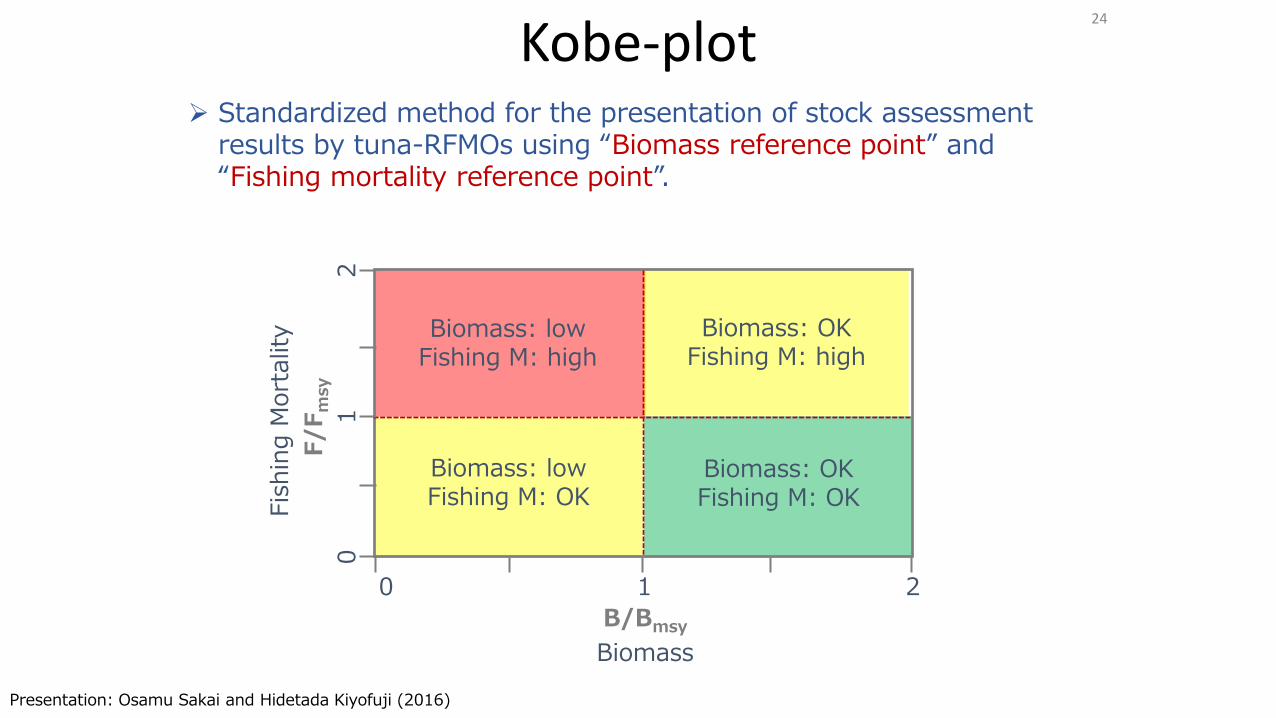
Kobe-plot Standardized method for the presentation of stock assessment
results by tuna-RFMOs using “Biomass reference point” and “Fishing mortality reference point”.
F/F
msy
B/Bmsy
Biomass: low Fishing M: high
Biomass: OK Fishing M: high
Biomass: low Fishing M: OK
Biomass: OK Fishing M: OK F
ishin
g M
ort
ality
Biomass
0
1
2
0 1 2
24
Presentation: Osamu Sakai and Hidetada Kiyofuji (2016)
Kobe-plot Standardized method for the presentation of stock assessment
results by tuna-RFMOs using “Biomass reference point” and “Fishing mortality reference point”.
B/Bmsy
Biomass
0 1 2
Biomass: OK
Current biomass is higher than Bmsy
Biomass reference point
Biomass: low
Current biomass is lower than Bmsy
F/F
msy
Fis
hin
g M
ort
ality
0
1
2
Fishing M: high
Current fishing mortality is higher than Fmsy
Fishing M: OK
Current fishing mortality is lower than Fmsy
Fishing mortality
reference point F/F
msy
Fis
hin
g M
ort
ality
0
1
2
B/Bmsy
Biomass
0 1 2
Overfishing
Overfished
Overfishing &
Overfished
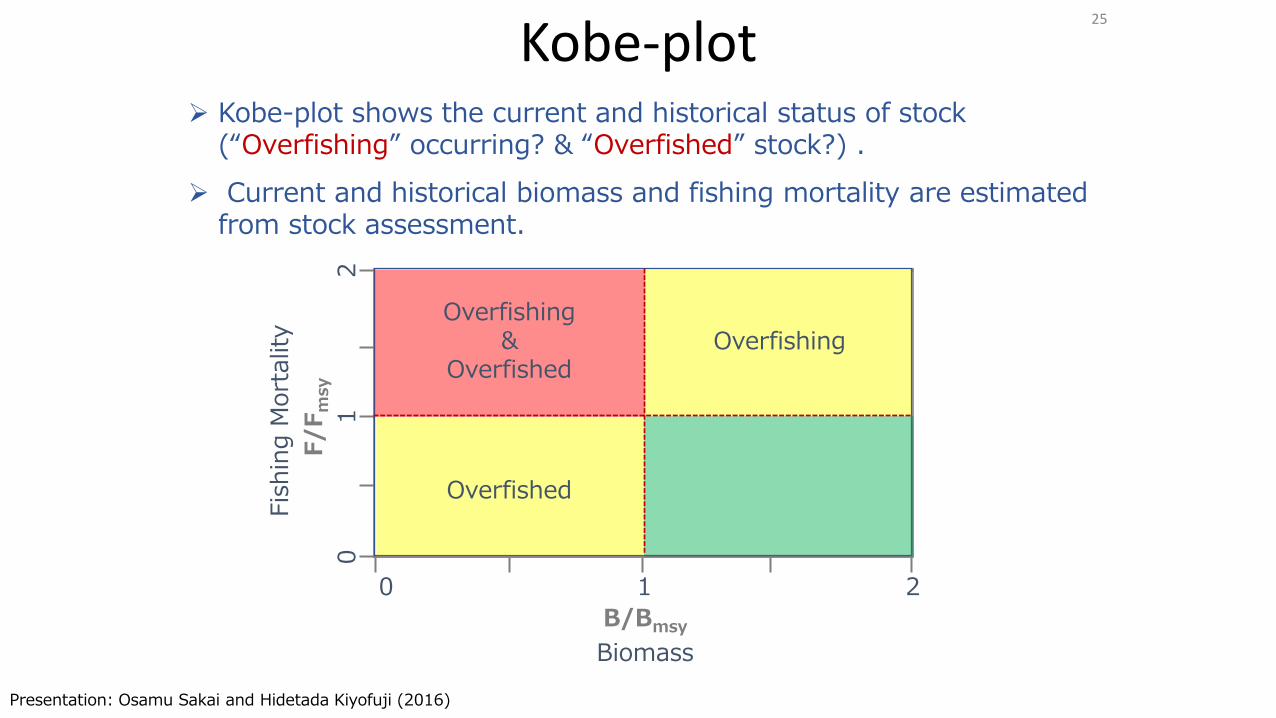
Kobe-plot shows the current and historical status of stock (“Overfishing” occurring? & “Overfished” stock?) .
Current and historical biomass and fishing mortality are estimated from stock assessment.
Overfishing
Overfished
Overfishing &
Overfished
25
Presentation: Osamu Sakai and Hidetada Kiyofuji (2016)
APA YANG SEDANG KITA KERJAKAN ? 4
26
PENYUSUNAN HARVEST STRATEGY DI PERAIRAN KEPULAUAN INDONESIA
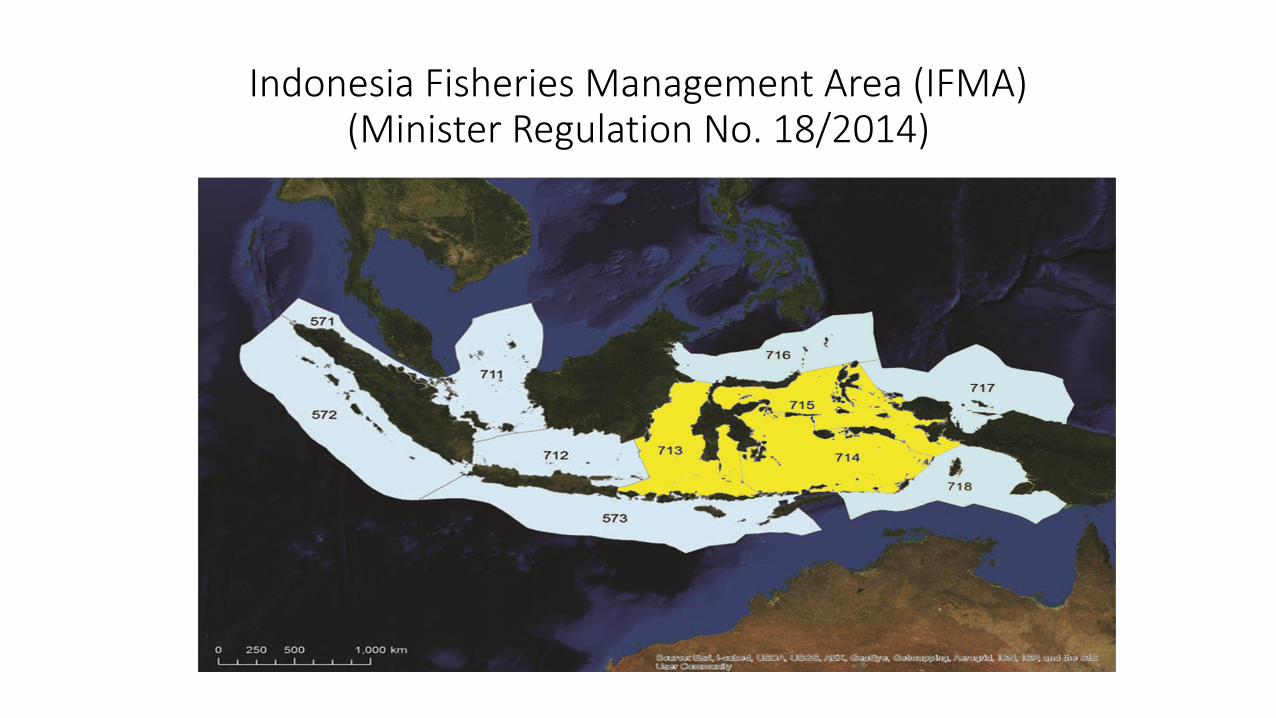
Indonesia Fisheries Management Area (IFMA) (Minister Regulation No. 18/2014)
Ministry Regulation No. 18/2014
(11 IFMA)
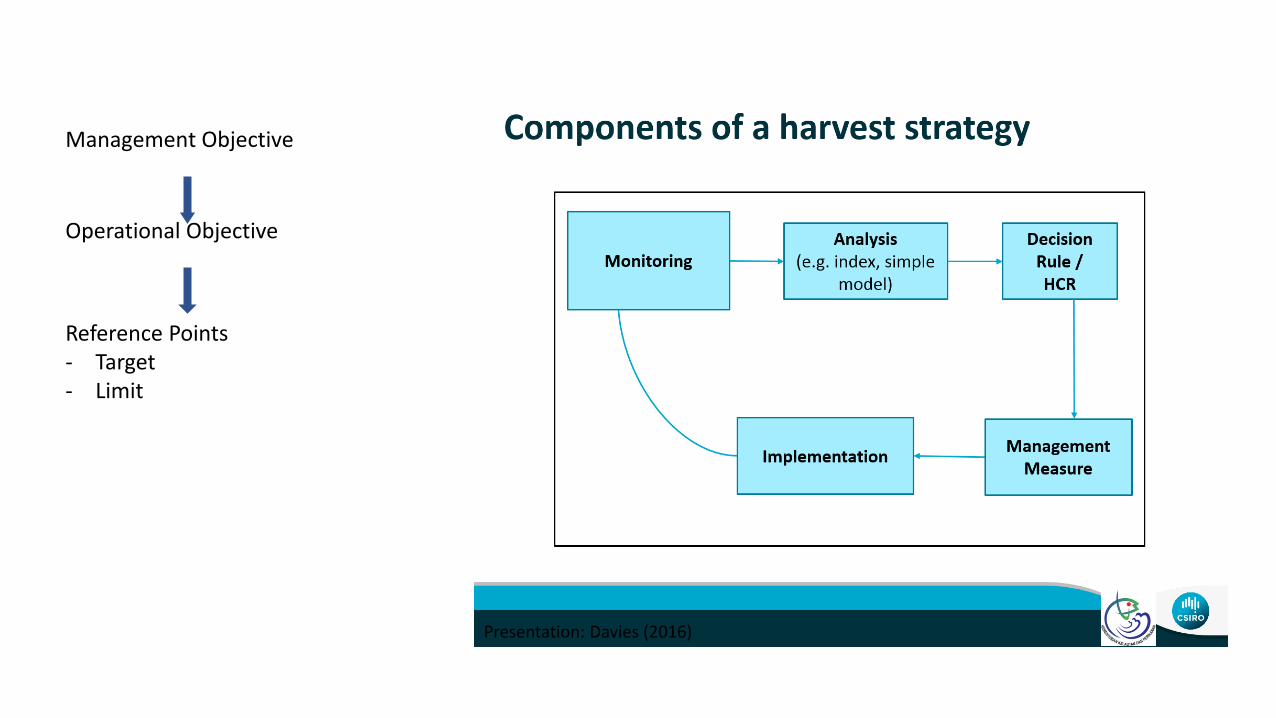
Presentation: Davies (2016)
Management Objective
Operational Objective
Reference Points - Target - Limit
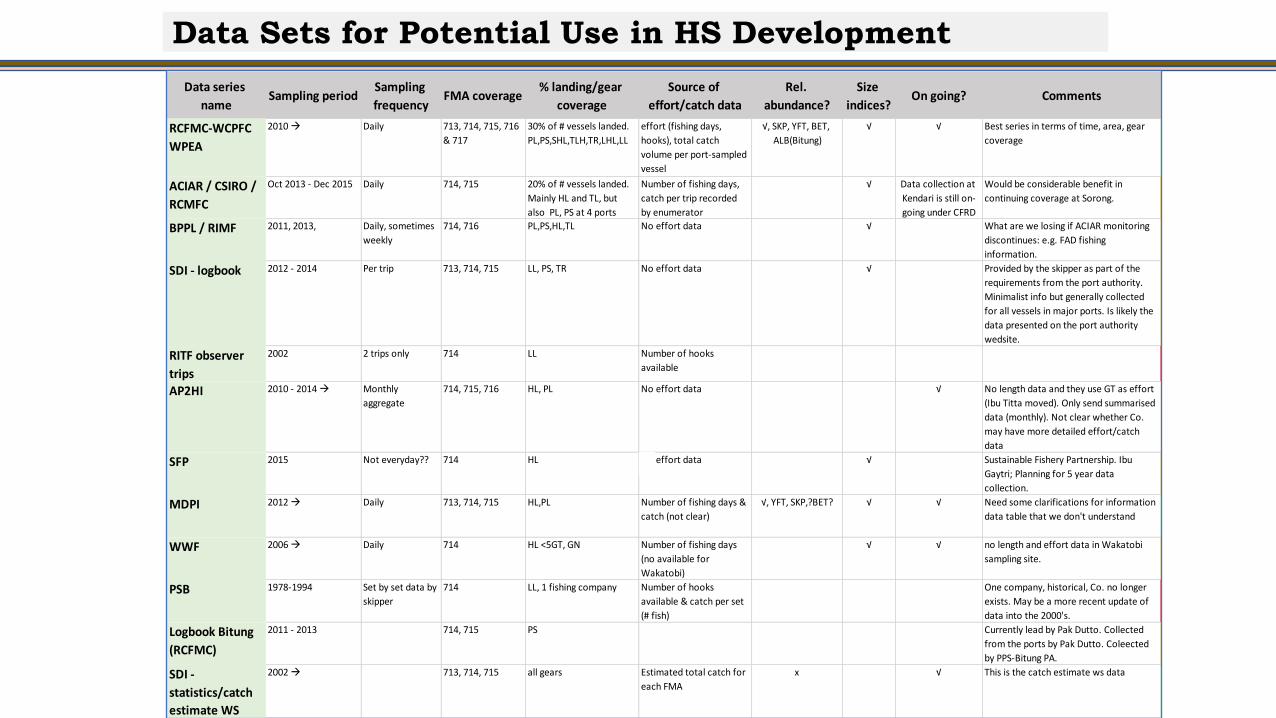
Data Sets for Potential Use in HS Development
Data series
nameSampling period
Sampling
frequencyFMA coverage
% landing/gear
coverage
Source of
effort/catch data
Rel.
abundance?
Size
indices?On going? Comments
RCFMC-WCPFC
WPEA
2010 Daily 713, 714, 715, 716
& 717
30% of # vessels landed.
PL,PS,SHL,TLH,TR,LHL,LL
effort (fishing days,
hooks), total catch
volume per port-sampled
vessel
√, SKP, YFT, BET,
ALB(Bitung)
√ √ Best series in terms of time, area, gear
coverage
ACIAR / CSIRO /
RCMFC
Oct 2013 - Dec 2015 Daily 714, 715 20% of # vessels landed.
Mainly HL and TL, but
also PL, PS at 4 ports
Number of fishing days,
catch per trip recorded
by enumerator
√ Data collection at
Kendari is still on-
going under CFRD
Would be considerable benefit in
continuing coverage at Sorong.
BPPL / RIMF 2011, 2013, Daily, sometimes
weekly
714, 716 PL,PS,HL,TL No effort data √ What are we losing if ACIAR monitoring
discontinues: e.g. FAD fishing
information.
SDI - logbook 2012 - 2014 Per trip 713, 714, 715 LL, PS, TR No effort data √ Provided by the skipper as part of the
requirements from the port authority.
Minimalist info but generally collected
for all vessels in major ports. Is likely the
data presented on the port authority
wedsite.
RITF observer
trips
2002 2 trips only 714 LL Number of hooks
available
AP2HI 2010 - 2014 Monthly
aggregate
714, 715, 716 HL, PL No effort data √ No length data and they use GT as effort
(Ibu Titta moved). Only send summarised
data (monthly). Not clear whether Co.
may have more detailed effort/catch
data
SFP 2015 Not everyday?? 714 HL No effort data √ Sustainable Fishery Partnership. Ibu
Gaytri; Planning for 5 year data
collection.
MDPI 2012 Daily 713, 714, 715 HL,PL Number of fishing days &
catch (not clear)
√, YFT, SKP,?BET? √ √ Need some clarifications for information
data table that we don't understand
WWF 2006 Daily 714 HL <5GT, GN Number of fishing days
(no available for
Wakatobi)
√ √ no length and effort data in Wakatobi
sampling site.
PSB 1978-1994 Set by set data by
skipper
714 LL, 1 fishing company Number of hooks
available & catch per set
(# fish)
One company, historical, Co. no longer
exists. May be a more recent update of
data into the 2000's.
Logbook Bitung
(RCFMC)
2011 - 2013 714, 715 PS Currently lead by Pak Dutto. Collected
from the ports by Pak Dutto. Coleected
by PPS-Bitung PA.
SDI -
statistics/catch
estimate WS
2002 713, 714, 715 all gears Estimated total catch for
each FMA
x √ This is the catch estimate ws data
Presentation: Davies (2017)
32 Presentation: Davies (2017)
33 Presentation: Davies (2017)
Presentation: Davies (2017)
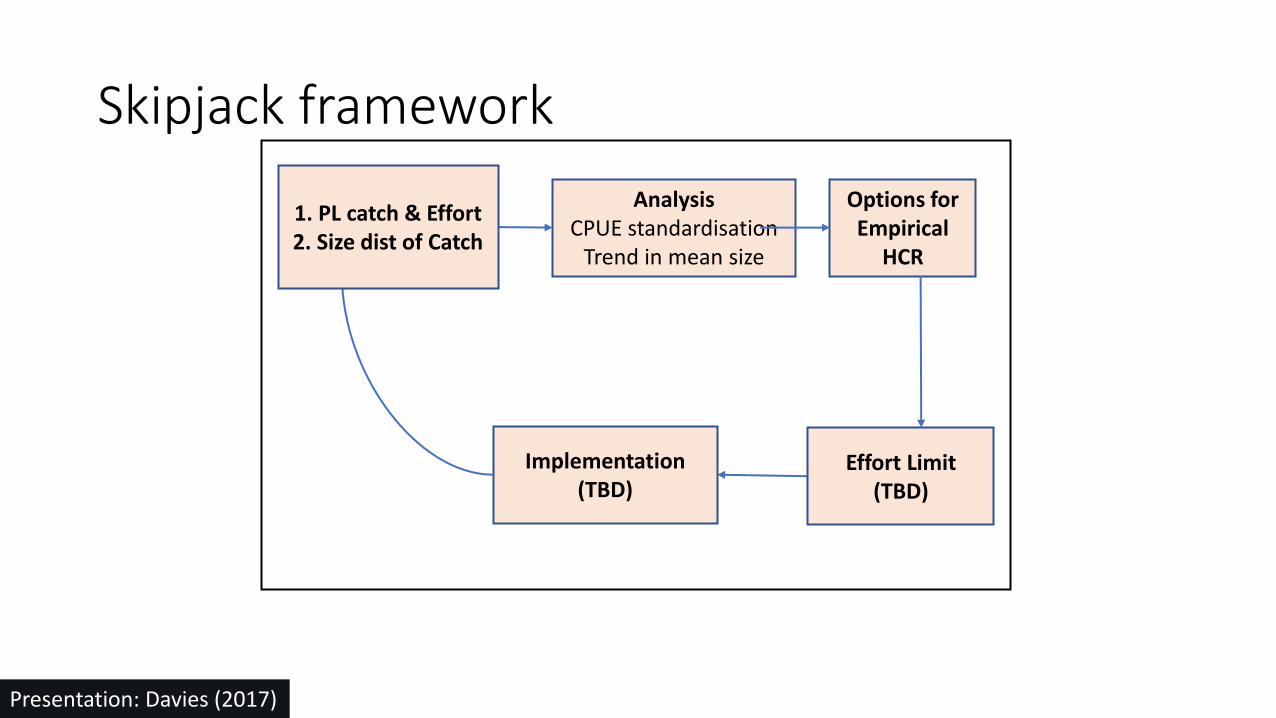
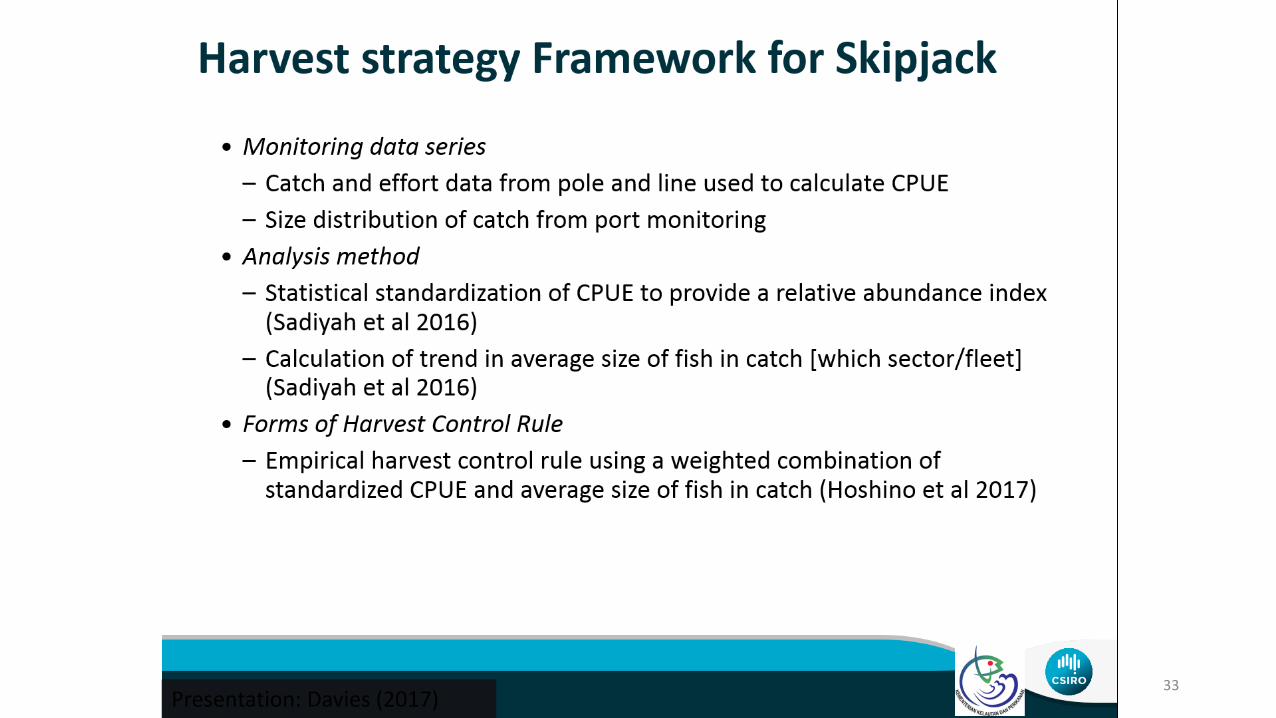
Skipjack framework
Analysis CPUE standardisation
Trend in mean size
Options for Empirical
HCR
Effort Limit (TBD)
Implementation (TBD)
1. PL catch & Effort 2. Size dist of Catch
Presentation: Davies (2017)
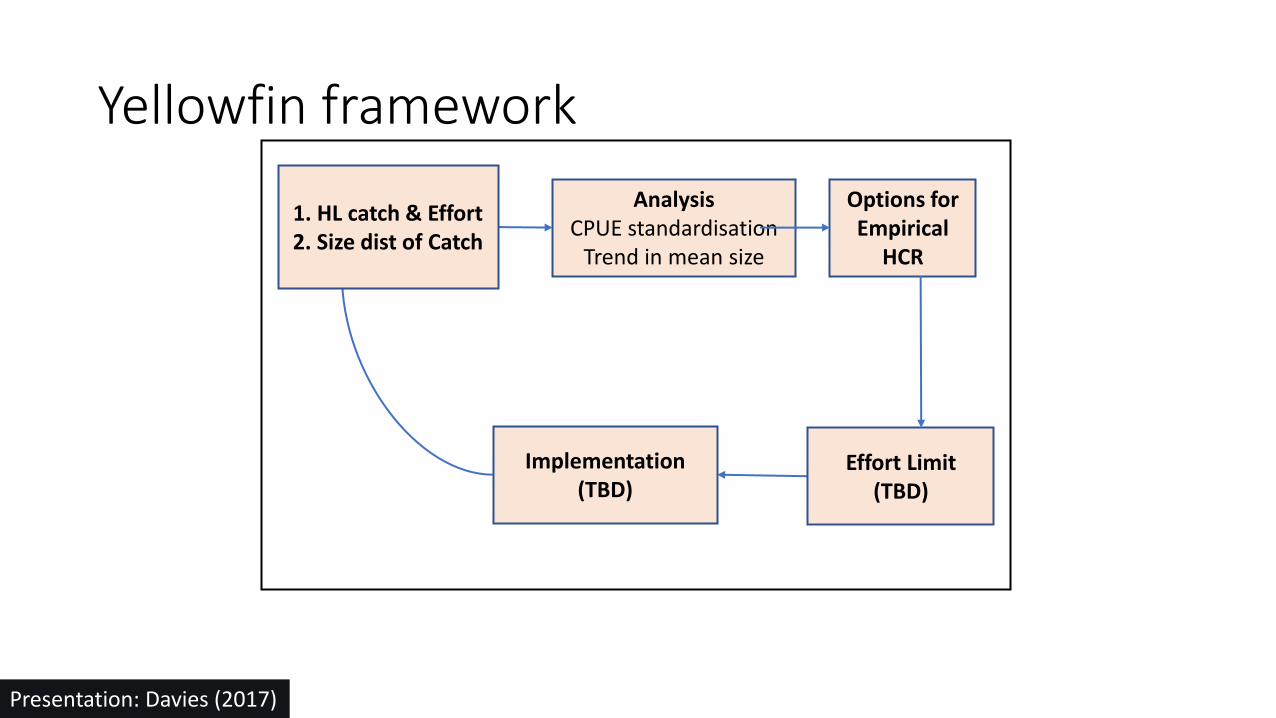
Yellowfin framework
Analysis CPUE standardisation
Trend in mean size
Options for Empirical
HCR
Effort Limit (TBD)
Implementation (TBD)
1. HL catch & Effort 2. Size dist of Catch
Presentation: Davies (2017)
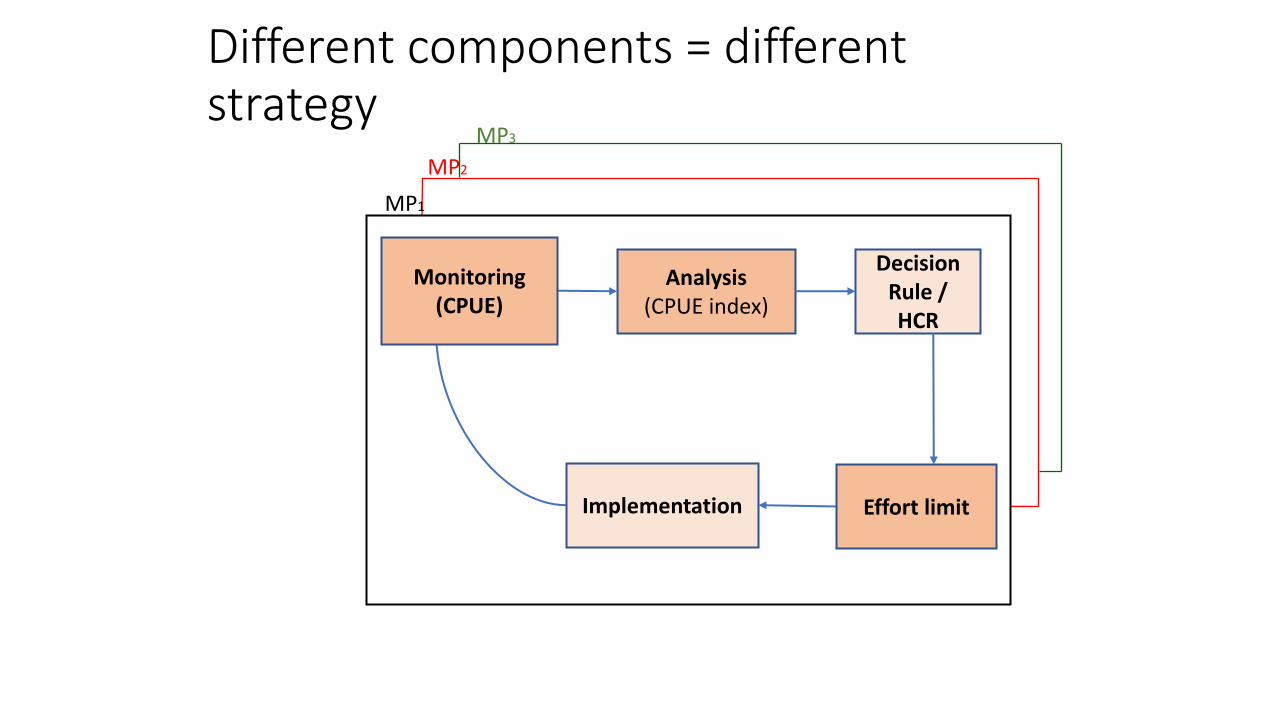
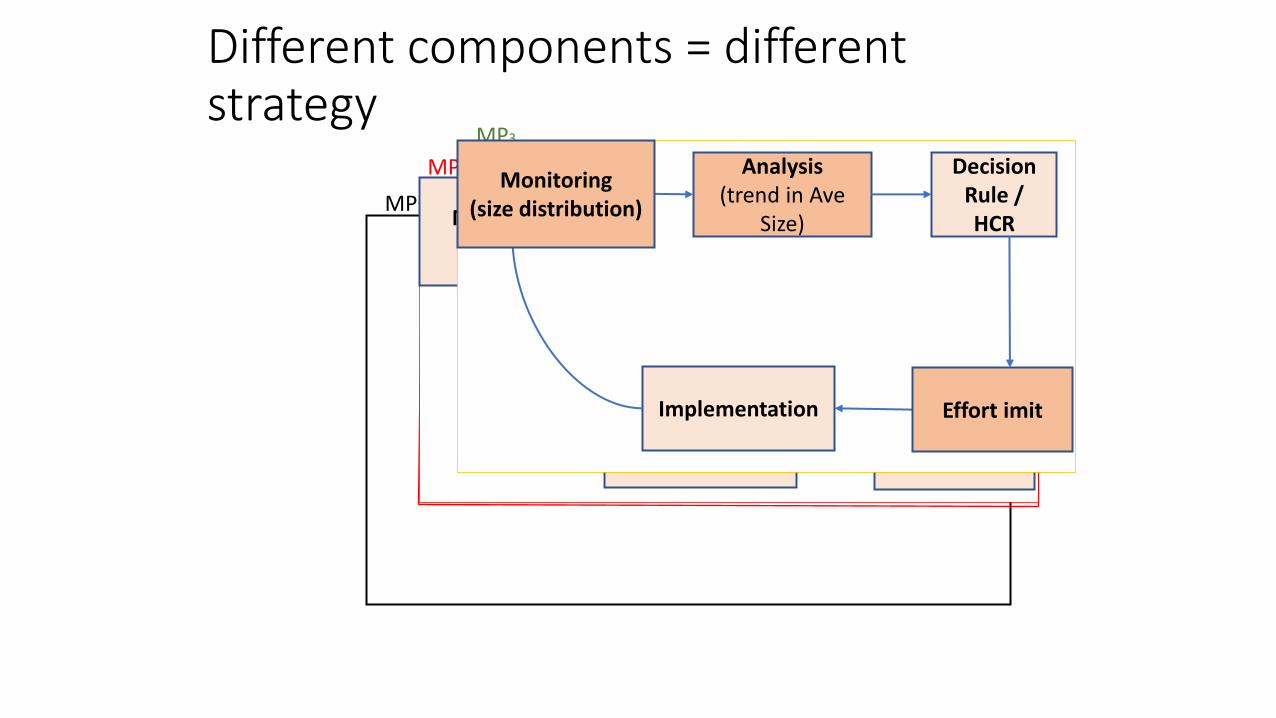
Different components = different strategy
MP3
MP2
MP1
Analysis (CPUE index)
Decision Rule / HCR
Effort limit Implementation
Monitoring (CPUE)
Different components = different strategy
MP3
MP2
MP1 Analysis (Fishing
Mortality)
Decision Rule / HCR
Management Measure
Implementation
Monitoring (Tagging)
Analysis (trend in Ave
Size)
Decision Rule / HCR
Effort imit Implementation
Monitoring (size distribution)
From HS framework to Implementation
1. Work program for refinement, specification of harvest strategies and Management Strategy Evaluation
2. Consultation and implementation 3. Relationship between Interim Harvest Strategy
and Regional Fisheries Management Organizations.
Presentation: Davies (2017)
CONTOH HARVEST CONTROL RULES 5
40
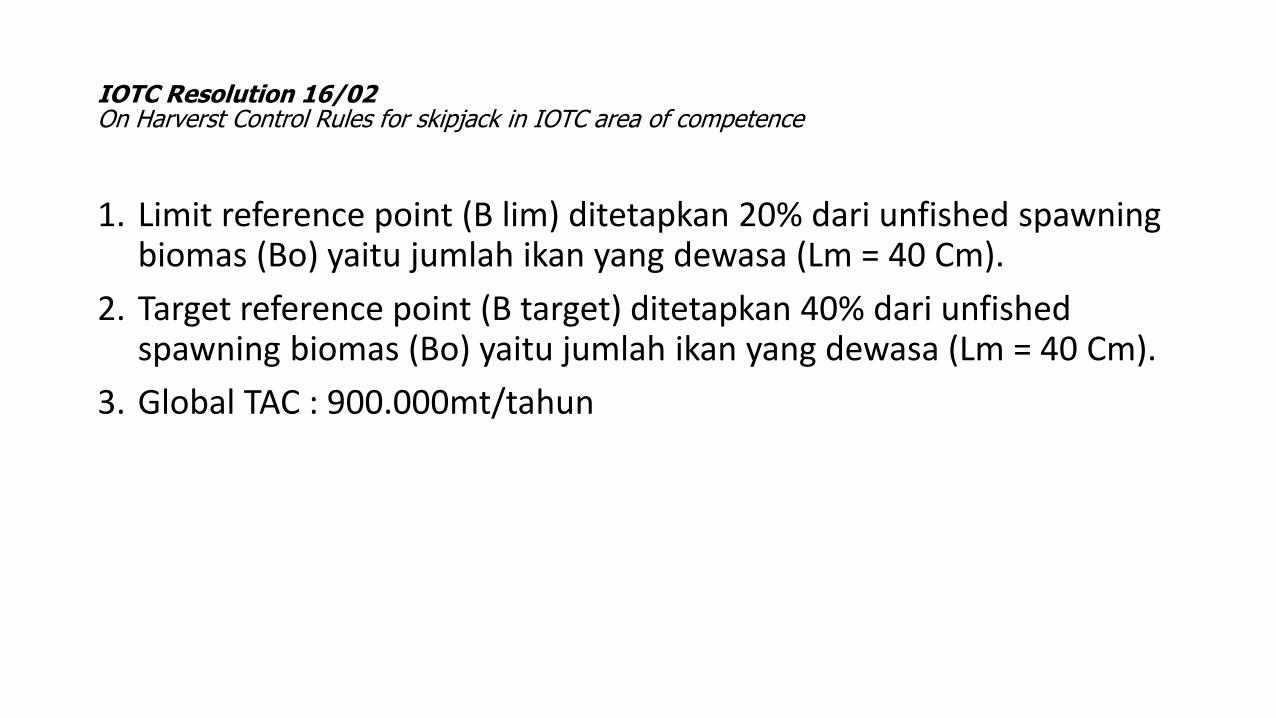
IOTC Resolution 16/02 On Harverst Control Rules for skipjack in IOTC area of competence
1. Limit reference point (B lim) ditetapkan 20% dari unfished spawning biomas (Bo) yaitu jumlah ikan yang dewasa (Lm = 40 Cm).
2. Target reference point (B target) ditetapkan 40% dari unfished spawning biomas (Bo) yaitu jumlah ikan yang dewasa (Lm = 40 Cm).
3. Global TAC : 900.000mt/tahun
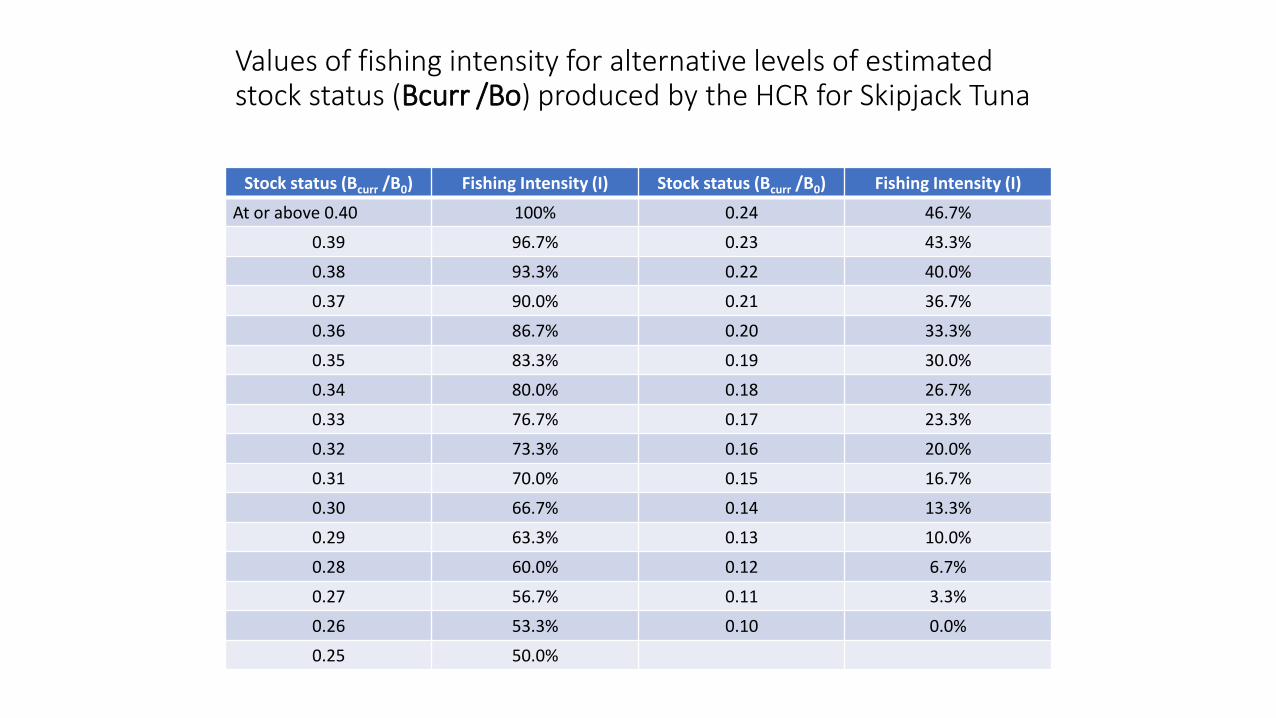
Values of fishing intensity for alternative levels of estimated stock status (Bcurr /Bo) produced by the HCR for Skipjack Tuna
Stock status (Bcurr /B0) Fishing Intensity (I) Stock status (Bcurr /B0) Fishing Intensity (I)
At or above 0.40 100% 0.24 46.7%
0.39 96.7% 0.23 43.3%
0.38 93.3% 0.22 40.0%
0.37 90.0% 0.21 36.7%
0.36 86.7% 0.20 33.3%
0.35 83.3% 0.19 30.0%
0.34 80.0% 0.18 26.7%
0.33 76.7% 0.17 23.3%
0.32 73.3% 0.16 20.0%
0.31 70.0% 0.15 16.7%
0.30 66.7% 0.14 13.3%
0.29 63.3% 0.13 10.0%
0.28 60.0% 0.12 6.7%
0.27 56.7% 0.11 3.3%
0.26 53.3% 0.10 0.0%
0.25 50.0%
STOCK ASSESSMENT MODELLING 6
43
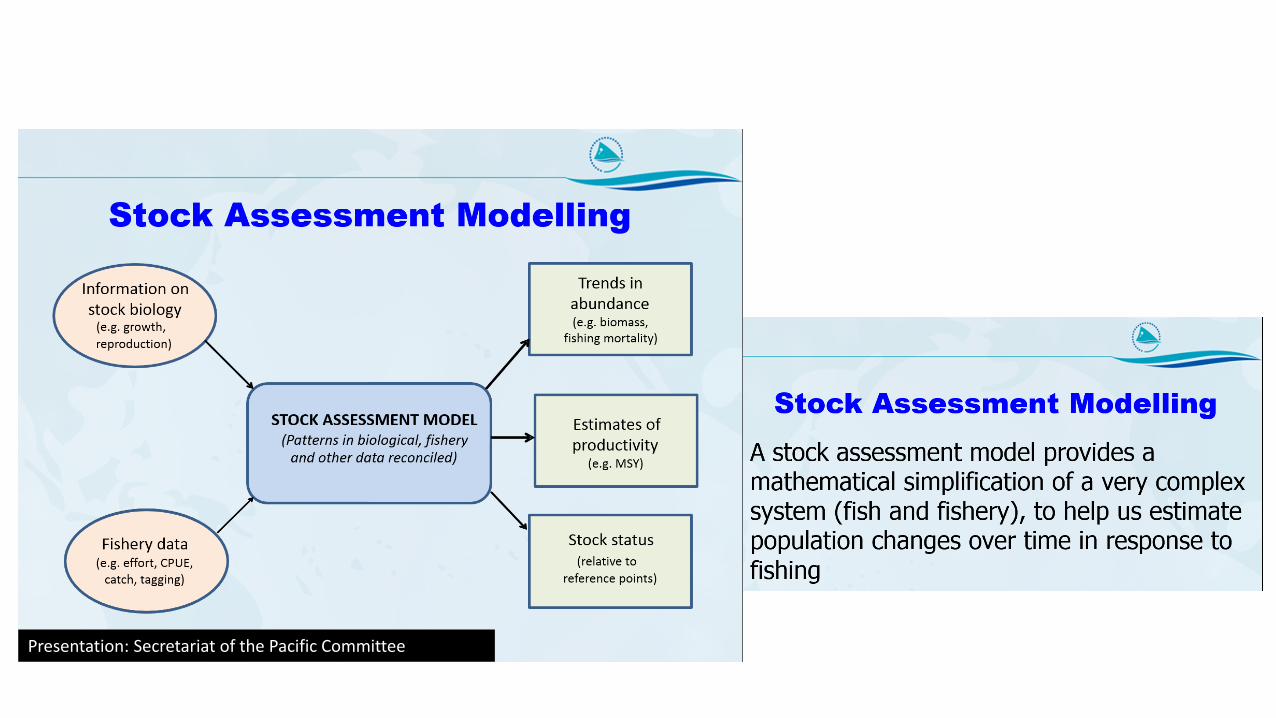
Presentation: Secretariat of the Pacific Committee
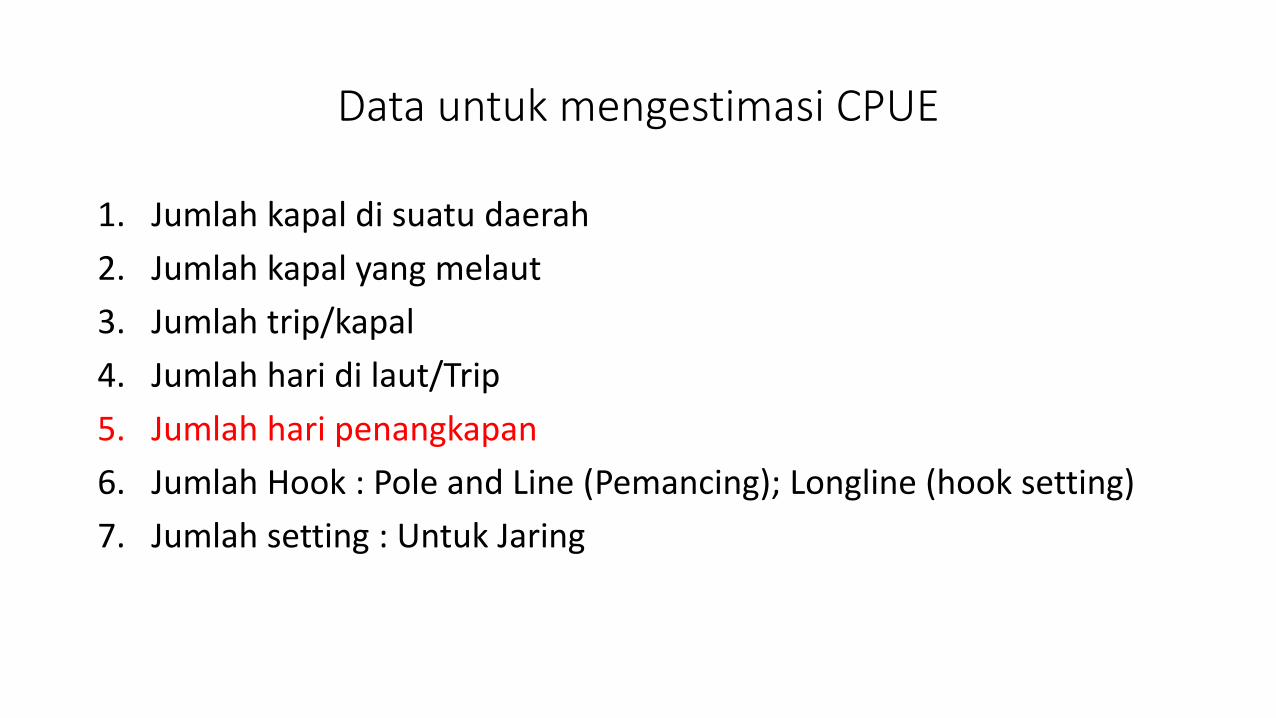
Data untuk mengestimasi CPUE
1. Jumlah kapal di suatu daerah
2. Jumlah kapal yang melaut
3. Jumlah trip/kapal
4. Jumlah hari di laut/Trip
5. Jumlah hari penangkapan
6. Jumlah Hook : Pole and Line (Pemancing); Longline (hook setting)
7. Jumlah setting : Untuk Jaring

TERIMA KASIH