Embed Size (px)
Citation preview
PENGUMUMAN
Equity Research PT Trikomsel Oke Tbk. (TRIO)
(Tercatat Di Papan : Utama) No.Peng-ER-00007/BEI.PPJ/01-2012
(dapat dilihat di laman: http://www.idx.co.id) PT Bursa Efek Indonesia pada tanggal 24 Januari 2012 telah menerima surat melalui email dari PT Pemeringkat Efek Indonesia dengan No. 114/PEF-DIR/I/2012 tanggal 20 Januari 2012 mengenai Publikasi Laporan Penilaian Target Harga Referensi Saham PT Trikomsel Oke Tbk. sebagaimana terlampir (32 lembar). Demikian agar maklum.
24 Januari 2012
Umi Kulsum Andre P.J. Toelle Kepala Divisi Penilaian Perusahaan Sektor Jasa Kepala Divisi Perdagangan Saham Tembusan: 1. Yth. Ketua Badan Pengawas Pasar Modal dan LK; 2. Yth. Kepala Biro Transaksi dan Lembaga Efek Bapepam dan LK; 3. Yth. Kepala Biro PKP Sektor Jasa Bapepam dan LK; 4. Yth. Pengurus Pusat Referensi Pasar Modal; 5. Yth. Direksi PT Trikomsel Oke Tbk.
psu_TRIO_er_20120124_07
PEFINDO CREDIT RATING INDONESIA
'114/PEF-DIR/I/2012·
Jakarta, 20 Januari 2012
Kepada Yth.1. PT Trikomsel Oke, Tbk
Equity Tower Lt. 30 SCBD Lot.9JI. Jend. Sudirman Kav 52-53Jakarta 12190
u.p. Ibu Juliana Samudro, Direktur
2. PT Bursa Efek IndonesiaGedung Bursa Efek IndonesiaJI. Jend. Sudirman Kav 52-53Jakarta Selatan, 12190
u.p. Bapak Ito Warsito, Direktur UtamaBapak Eddy Sugito, Direktur Penilaian Perusahaan
Perihal : Publikasi Laporan Penilaian Target Harga Referensi Saham PT Trikomsel OkeTbk.
Dengan hormat,
Sehubungan dengan penugasan yang kami peroleh untuk melakukan Penilaian Target HargaReferensi Saham, denqan ini kami sampaikan hasil penilaian kami atas saham PT Trikomsel Oke Tbk(TRIO) dalam versi Bahasa Indonesia dan Bahasa Inggris.
Apabila masih ada hal-hal yang memerlukan penjelasan lebih lanjut, mohon agar menghubungi kami.Atas perhatian dan kerjasamanya, kami ucapkan terima kasih.
Hormat kami,
sa~Direktur
e Rizalirektur
Tembusan : Ibu Umi Kulsum, Kepala Divisi Pencatatan Sektor Jasa, PT Bursa Efek Indonesia
/ww
PT. Pemeringkat Efek IndonesiaPanin Tower Senayan City 17th FloorJI. Asia Afrika Lot 19. Jakarta 10270, INDONESIAPhone: (62-21) 72782380' Fax: (62-21) 7278 2370
Halaman 1 dari 16 halaman
Kontak: Equity & Index Valuation Division Phone: (6221) 7278 2380 [email protected]
“Pernyataan discalimer pada halaman akhir
merupakan bagian yang tidak terpisahkan dari
dokumen ini”
www.pefindo.com
Trikomsel Oke, Tbk Laporan Utama
Equity Valuation 20 Januari 2012
Target Harga
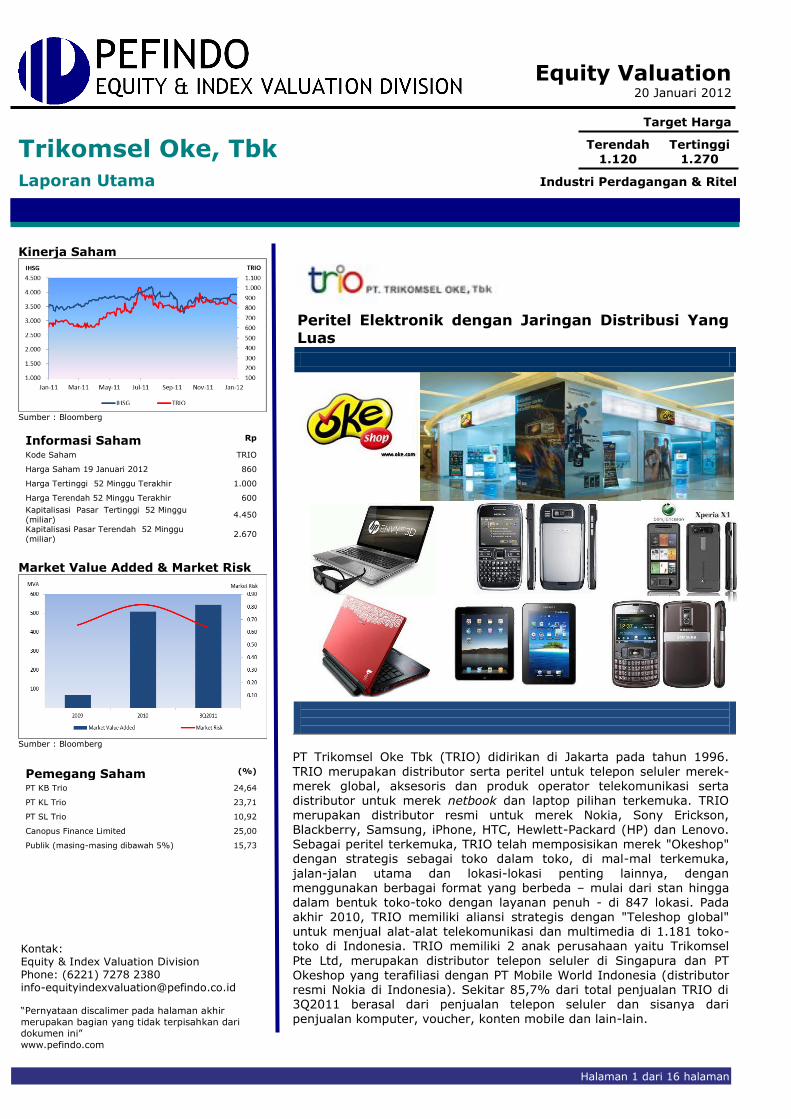
Terendah Tertinggi 1.120 1.270
Industri Perdagangan & Ritel
Kinerja Saham
Sumber : Bloomberg
Informasi Saham Rp
Kode Saham TRIO
Harga Saham 19 Januari 2012 860
Harga Tertinggi 52 Minggu Terakhir 1.000
Harga Terendah 52 Minggu Terakhir 600
Kapitalisasi Pasar Tertinggi 52 Minggu
(miliar) 4.450
Kapitalisasi Pasar Terendah 52 Minggu
(miliar) 2.670
Market Value Added & Market Risk
Sumber : Bloomberg
Pemegang Saham (%)
PT KB Trio 24,64
PT KL Trio 23,71
PT SL Trio 10,92
Canopus Finance Limited 25,00
Publik (masing-masing dibawah 5%) 15,73
Peritel Elektronik dengan Jaringan Distribusi Yang Luas
PT Trikomsel Oke Tbk (TRIO) didirikan di Jakarta pada tahun 1996.
TRIO merupakan distributor serta peritel untuk telepon seluler merek-merek global, aksesoris dan produk operator telekomunikasi serta distributor untuk merek netbook dan laptop pilihan terkemuka. TRIO merupakan distributor resmi untuk merek Nokia, Sony Erickson, Blackberry, Samsung, iPhone, HTC, Hewlett-Packard (HP) dan Lenovo.
Sebagai peritel terkemuka, TRIO telah memposisikan merek "Okeshop" dengan strategis sebagai toko dalam toko, di mal-mal terkemuka,
jalan-jalan utama dan lokasi-lokasi penting lainnya, dengan menggunakan berbagai format yang berbeda – mulai dari stan hingga dalam bentuk toko-toko dengan layanan penuh - di 847 lokasi. Pada akhir 2010, TRIO memiliki aliansi strategis dengan "Teleshop global" untuk menjual alat-alat telekomunikasi dan multimedia di 1.181 toko-toko di Indonesia. TRIO memiliki 2 anak perusahaan yaitu Trikomsel
Pte Ltd, merupakan distributor telepon seluler di Singapura dan PT Okeshop yang terafiliasi dengan PT Mobile World Indonesia (distributor resmi Nokia di Indonesia). Sekitar 85,7% dari total penjualan TRIO di 3Q2011 berasal dari penjualan telepon seluler dan sisanya dari penjualan komputer, voucher, konten mobile dan lain-lain.
“Pernyataan Disclaimer pada halaman
akhir merupakan bagian yang tidak
terpisahkan dari dokumen ini”
www.pefindo.com
Trikomsel Oke, Tbk
20 Januari 2012 Halaman 2 dari 16 halaman
Didukung Oleh Jaringan Distribusi Yang Luas
TRIO adalah salah satu distributor dan peritel terbesar perangkat
telekomunikasi dan multimedia yang memiliki jaringan distribusi yang paling luas. Per September 2011, TRIO memiliki sekitar 847 gerai “Okeshop" yang tersebar di 153 kota di 33 provinsi di Indonesia. TRIO juga memiliki jaringan dengan sekitar 15.000 peritel independen di seluruh Indonesia. Selain itu, TRIO juga menembus pasar luar negeri seperti Singapura, Dubai dan Cina. Pada tahun 2011, TRIO memfokuskan ekspansinya ke daerah-daerah luar Jawa dan menambahkan sekitar
39 toko baru. Kami percaya bahwa dengan jaringan distribusi yang luas TRIO akan dapat melayani pasar yang lebih luas dan meningkatkan pendapatannya.
Memiliki Kinerja Keuangan Yang Kuat Selama periode 2008-2010, penjualan TRIO stabil di kisaran Rp 5 triliun
dan tumbuh dengan CAGR sebesar 1,6%. Namun, dalam hal laba operasi
dan laba bersih, TRIO membukukan pertumbuhan yang signifikan yaitu masing-masing sebesar 40,9% dan 40,2% per tahun. Selama 9M2011, bersamaan dengan naiknya penjualan telepon seluler nasional yang tumbuh sebesar 61,4% YoY, TRIO berhasil membukukan pendapatan yang hampir sama dengan angka tahun 2010. TRIO membukukan pendapatan sebesar Rp 5,3 triliun, naik 39,9% YoY. Sementara itu, laba
usaha tumbuh sebesar 39,0% menjadi Rp 440 miliar dan laba bersih meningkat 37,0% YoY menjadi Rp 213 miliar. Angka-angka ini lebih tinggi dari laba usaha dan laba bersih yang diperoleh selama tahun 2010. Untuk 2011, kami memperkirakan pendapatan TRIO akan meningkat 30,2% YoY menjadi Rp 7,2 triliun dari Rp 5,3 triliun pada 2010, sedangkan laba bersih akan tumbuh sebesar 35,3% YoY menjadi Rp 273 miliar dari Rp 202 miliar pada 2010.
Profitabilitas Meningkat Melalui Efisiensi TRIO meningkatkan efisiensi dengan fokus pada produk-produk yang
memiliki marjin tinggi dan mengurangi sejumlah toko yang tidak memenuhi harapan dan sebagai gantinya, TRIO lebih fokus menggarap lokasi di kota-kota terkemuka yang diidentifikasi memiliki lalu lintas ritel
yang lebih tinggi dan daya beli kuat. Hasilnya, TRIO berhasil meningkatkan marjin labanya dan menjadi lebih tinggi dari perusahaan pembandingnya. Selama 9M2011, marjin laba kotor, marjin laba operasi dan marjin laba bersih TRIO masing-masing adalah sebesar 13,2%, 8,2% dan 4,0%. Lebih jauh lagi, dengan marjin laba yang tinggi membuat TRIO lebih kompetitif, karena TRIO memiliki marjin laba yang lebih tinggi dibandingkan dengan rata-rata industri.
Prospek Usaha Sejalan dengan perubahan gaya hidup masyarakat Indonesia, mereka memiliki kecenderung untuk memiliki handset dengan teknologi dan model terbaru, telah menaikan permintaan terhadap telepon seluler dan aksesorisnya. Fenomena ini diperkuat oleh semakin banyaknya pengguna
jejaring sosial seperti Facebook dan twitter. Permintaan untuk perangkat
telekomunikasi dan multimedia diperkirakan akan meningkat, didukung oleh: (i) proyeksi pertumbuhan ekonomi yang tinggi di Indonesia, yang diestimasikan akan tumbuh sebesar 6,2% di tahun 2012, didukung oleh konsumsi domestik dan kinerja ekspor (ii) meningkatnya pendapatan per kapita rakyat Indonesia (lebih dari USD 3.000 di tahun 2010) (iii) besarnya populasi usia muda di Indonesia yang merupakan pasar
telekomunikasi (iv) Indonesia adalah pengguna Facebook terbesar ke-3, pengguna twitter terbesar dan pasar terbesar ke 2 untuk RIM (produsen Blackberry) di dunia. Berdasarkan argumen di atas, ditambah dengan ekspansi TRIO yang menambah beberapa toko "Okeshop" dan pusat distribusi di 2011 dan 2012, kami percaya pendapatan TRIO akan tumbuh dengan CAGR sebesar 21,2% selama periode 2010-2014. Pada
PARAMETER INVESTASI

“Pernyataan Disclaimer pada halaman
akhir merupakan bagian yang tidak
terpisahkan dari dokumen ini”
www.pefindo.com
Trikomsel Oke, Tbk
20 Januari 2012 Halaman 3 dari 16 halaman
lini bawah, laba bersih TRIO, untuk periode yang sama, akan tumbuh dengan CAGR sebesar 32,3%.
Tabel 1: Ringkasan Kinerja
2008 2009 2010 2011P 2012P
Pendapatan (Rp miliar) 5.340 5.463 5.511 7.084 8.730
Laba sebelum pajak (Rp miliar)
148 164 277 364 528
Laba Bersih (Rp miliar) 103 118 202 273 396
EPS (Rp) 23 26 45 61 89
Pertumbuhan EPS (%) n.a 15 71 35 45
P/E (x) n.a 8 15 13* 8*
PBV (x) n.a 1,4 3,6 3,6* 2,8* Sumber: PT Trikomsel Oke Tbk, Estimasi Pefindo Divisi Valuasi Saham & Indexing Catatan: *)Berdasarkan harga per 19 Januari 2012 – Rp 860/saham

“Pernyataan Disclaimer pada halaman
akhir merupakan bagian yang tidak
terpisahkan dari dokumen ini”
www.pefindo.com
Trikomsel Oke, Tbk
20 Januari 2012 Halaman 4 dari 16 halaman
Growth-Value Map memberikan gambaran akan eskpektasi pasar untuk perusahaan-perusahaan yang tercatat di BEI. Metrik Current Performance (“CP”), sumbu horisontal, adalah bagian dari nilai pasar saham saat ini yang dapat dihubungkan dengan nilai perpetuitas dari kinerja profitabilitas perusahaan.
Metrik Growth Expectations (“GE”), sumbu vertikal, merupakan perbedaan antara nilai pasar saham saat ini dengan nilai current performance. Kedua metrik tersebut dinormalisasikan dengan nilai buku perusahaan.
Growth-Value Map membagi perusahaan-perusahaan ke dalam empat kluster, yaitu:
Excellent value managers (“Q-1”) Pasar memiliki ekspektasi terhadap perusahaan-perusahaan di Q-1
melebih benchmark mereka dalam hal profitabilitas dan pertumbuhan.
Expectation builders (“Q-2”) Pasar memiliki ekspektasi yang relatif rendah terhadap profitabilitas perusahaan-perusahaan di Q-2 dalam jangka pendek, tetapi memiliki ekspektasi pertumbuhan yang melebihi benchmark.
Traditionalists (“Q-3”) Pasar memiliki ekspektasi yang rendah terhadap pertumbuhan
perusahaan-perusahaan di Q-3, walaupun mereka menunjukkan profitabilitas yang baik dalam jangka pendek.
Asset-loaded value managers (“Q-4”) Pasar memiliki ekspektasi yang rendah terhadap profitabilitas dan pertumbuhan perusahaan-perusahaan di Q-4
Gambar 1: Growth-Value Map
(TRIO, Sub-Industri Perdagangan dan Industri Perdagangan, Jasa dan
Investasi)
Sumber: Pefindo Divisi Valuasi Saham & Indexing
TRIO berada pada kuadran Excellent Value Managers (Q1). Hal ini
mengindikasikan bahwa pasar mengharapkan TRIO untuk bisa melampaui pembandingnya dalam profitabilitas dan pertumbuhan. Kemampuan TRIO dalam mempertahankan dan meningkatkan profitabilitas melalui strategi pemasaran yang efektif dan efisiensi biaya telah meningkatkan pendapatan serta laba bersih pada 3Q2011. Dalam periode yang sama, Price to Earning Ratio (P/E) dibukukan sebesar 14x. Selain itu, konsistensi TRIO dalam memberikan dividen untuk pemegang saham dan memberikan informasi kepada publik tentang kegiatan
usaha, kinerja keuangan dan informasi terkait lainnya membuat TRIO menarik bagi investor.
GROWTH VALUE MAP

“Pernyataan Disclaimer pada halaman
akhir merupakan bagian yang tidak
terpisahkan dari dokumen ini”
www.pefindo.com
Trikomsel Oke, Tbk
20 Januari 2012 Halaman 5 dari 16 halaman
Didukung oleh Jaringan Distribusi di Seluruh Nusantara
PT Trikomsel Oke (TRIO) adalah distributor resmi untuk produk telekomunikasi
dan multimedia terkenal yaitu Nokia, Sony Ericsson, Hewlett Packard (HP), Lenovo, dan HTC. Dalam melakukan bisnis, TRIO bertindak sebagai distributor dan juga peritel. Sebagai distributor, TRIO terhubung dengan lebih dari 15.000 peritel yang tersebar di 152 kota di Indonesia dan memiliki hubungan langsung dengan para produsen. Sebagai peritel, TRIO telah menempatkan merek "Okeshop" pada posisi yang strategis sebagai sebuah toko di dalam toko, mal-mal, jalan-jalan utama dan lokasi-lokasi penting lainnya. Pada September 2011,
TRIO telah mengoperasikan sekitar 847 toko di 153 kota di Indonesia. Selain itu, TRIO juga memperluas jaringan distribusi melalui www.oke.com. Pada akhir tahun 2010, "Okeshop" memiliki aliansi strategis dengan "Teleshop global" untuk memasarkan perangkat telekomunikasi dan multimedia di 1.181 toko-toko di Indonesia. Selain itu, TRIO juga menembus pasar Singapura melalui anak perusahaannya PT Trikomsel Pte. Ltd.
Gambar 2: Jaringan Distribusi TRIO Di Tahun 2010
Sumber: PT Trikomsel Oke Tbk, Pefindo Divisi Valuasi Saham & Indexing
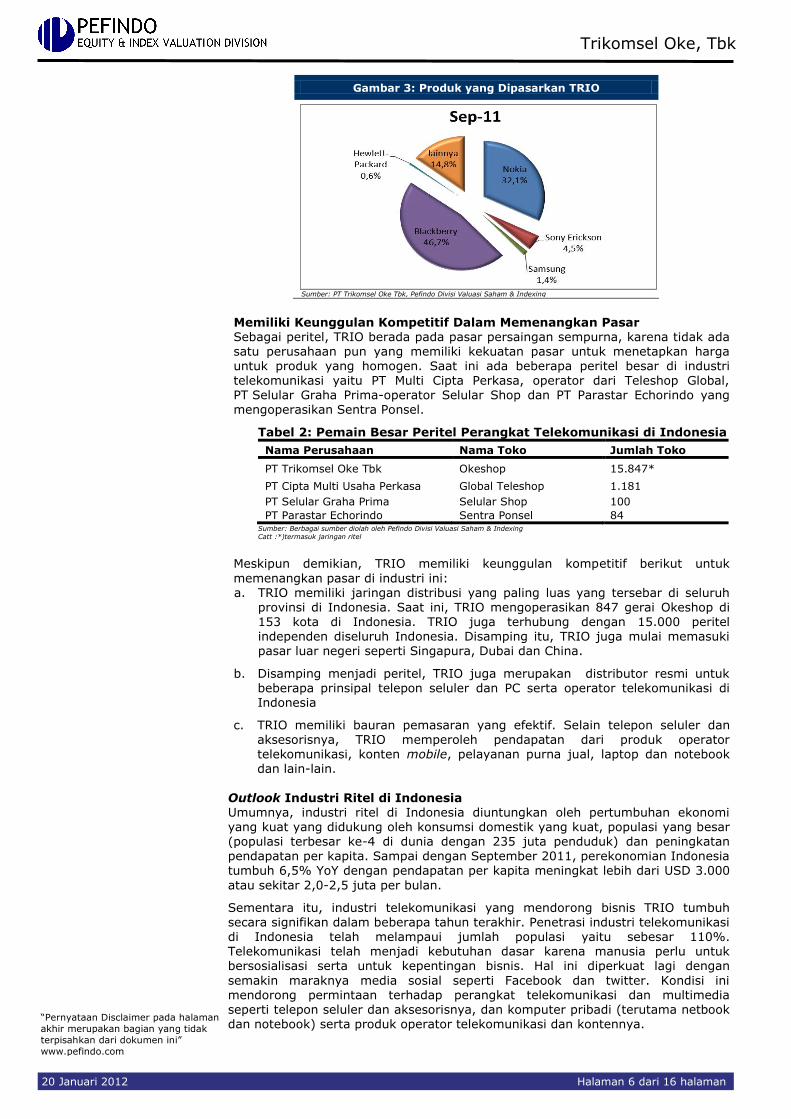
Bauran Pemasaran Yang Efektif
Salah satu kekuatan TRIO adalah memiliki bauran penjualan yang efektif dan memiliki diversifikasi produk yang luas dan beragam. TRIO adalah distributor resmi untuk beberapa prinsipal global untuk berbagai telepon seluler seperti Nokia, Sony Ericsson, Samsung, Blackberry, dan HTC. TRIO juga ditunjuk sebagai distributor resmi Hewlett Packard (HP) dan Lenovo di Indonesia. Selama 3Q2011, HP memiliki pangsa pasar nomor dua di pasar Pesonal Computer (PC) Indonesia (12,9% pangsa pasar) dan Lenovo memiliki pangsa pasar sebesar 7,3%. Selain
itu TRIO juga menyediakan voucher isi ulang operator telekomunikasi.
Kondisi ini membuat TRIO memiliki fleksibilitas dalam memasarkan produknya karena mereka dapat mengikuti perubahan yang cepat di industri telekomunikasi. Selama 3Q2011, Blackberry merupakan penyumbang terbesar pendapatan TRIO dengan kontribusi penjualan sekitar 46,7%. Hal ini sejalan dengan pertumbuhan pelanggan Blackberry di Indonesia yang mencapai 1000% dalam dua tahun
terakhir.
INFORMASI USAHA
“Pernyataan Disclaimer pada halaman
akhir merupakan bagian yang tidak
terpisahkan dari dokumen ini”
www.pefindo.com
Trikomsel Oke, Tbk
20 Januari 2012 Halaman 6 dari 16 halaman
Gambar 3: Produk yang Dipasarkan TRIO
Sumber: PT Trikomsel Oke Tbk, Pefindo Divisi Valuasi Saham & Indexing
Memiliki Keunggulan Kompetitif Dalam Memenangkan Pasar Sebagai peritel, TRIO berada pada pasar persaingan sempurna, karena tidak ada satu perusahaan pun yang memiliki kekuatan pasar untuk menetapkan harga
untuk produk yang homogen. Saat ini ada beberapa peritel besar di industri telekomunikasi yaitu PT Multi Cipta Perkasa, operator dari Teleshop Global, PT Selular Graha Prima-operator Selular Shop dan PT Parastar Echorindo yang mengoperasikan Sentra Ponsel.
Tabel 2: Pemain Besar Peritel Perangkat Telekomunikasi di Indonesia
Nama Perusahaan Nama Toko Jumlah Toko
PT Trikomsel Oke Tbk Okeshop 15.847*
PT Cipta Multi Usaha Perkasa Global Teleshop 1.181
PT Selular Graha Prima Selular Shop 100
PT Parastar Echorindo Sentra Ponsel 84 Sumber: Berbagai sumber diolah oleh Pefindo Divisi Valuasi Saham & Indexing Catt :*)termasuk jaringan ritel
Meskipun demikian, TRIO memiliki keunggulan kompetitif berikut untuk
memenangkan pasar di industri ini: a. TRIO memiliki jaringan distribusi yang paling luas yang tersebar di seluruh
provinsi di Indonesia. Saat ini, TRIO mengoperasikan 847 gerai Okeshop di 153 kota di Indonesia. TRIO juga terhubung dengan 15.000 peritel independen diseluruh Indonesia. Disamping itu, TRIO juga mulai memasuki pasar luar negeri seperti Singapura, Dubai dan China.
b. Disamping menjadi peritel, TRIO juga merupakan distributor resmi untuk beberapa prinsipal telepon seluler dan PC serta operator telekomunikasi di Indonesia
c. TRIO memiliki bauran pemasaran yang efektif. Selain telepon seluler dan aksesorisnya, TRIO memperoleh pendapatan dari produk operator telekomunikasi, konten mobile, pelayanan purna jual, laptop dan notebook dan lain-lain.
Outlook Industri Ritel di Indonesia Umumnya, industri ritel di Indonesia diuntungkan oleh pertumbuhan ekonomi yang kuat yang didukung oleh konsumsi domestik yang kuat, populasi yang besar (populasi terbesar ke-4 di dunia dengan 235 juta penduduk) dan peningkatan
pendapatan per kapita. Sampai dengan September 2011, perekonomian Indonesia tumbuh 6,5% YoY dengan pendapatan per kapita meningkat lebih dari USD 3.000
atau sekitar 2,0-2,5 juta per bulan.
Sementara itu, industri telekomunikasi yang mendorong bisnis TRIO tumbuh secara signifikan dalam beberapa tahun terakhir. Penetrasi industri telekomunikasi di Indonesia telah melampaui jumlah populasi yaitu sebesar 110%. Telekomunikasi telah menjadi kebutuhan dasar karena manusia perlu untuk bersosialisasi serta untuk kepentingan bisnis. Hal ini diperkuat lagi dengan
semakin maraknya media sosial seperti Facebook dan twitter. Kondisi ini mendorong permintaan terhadap perangkat telekomunikasi dan multimedia seperti telepon seluler dan aksesorisnya, dan komputer pribadi (terutama netbook dan notebook) serta produk operator telekomunikasi dan kontennya.
“Pernyataan Disclaimer pada halaman
akhir merupakan bagian yang tidak
terpisahkan dari dokumen ini”
www.pefindo.com
Trikomsel Oke, Tbk
20 Januari 2012 Halaman 7 dari 16 halaman
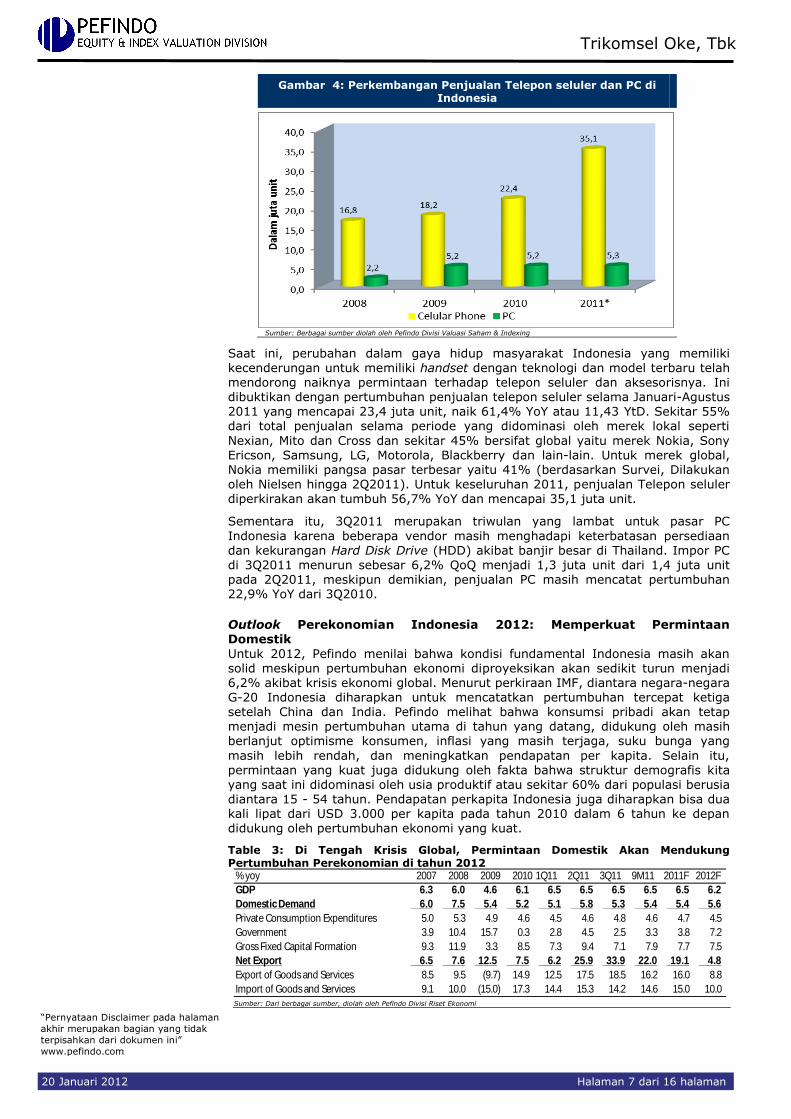
Gambar 4: Perkembangan Penjualan Telepon seluler dan PC di Indonesia
Sumber: Berbagai sumber diolah oleh Pefindo Divisi Valuasi Saham & Indexing
Saat ini, perubahan dalam gaya hidup masyarakat Indonesia yang memiliki
kecenderungan untuk memiliki handset dengan teknologi dan model terbaru telah mendorong naiknya permintaan terhadap telepon seluler dan aksesorisnya. Ini dibuktikan dengan pertumbuhan penjualan telepon seluler selama Januari-Agustus 2011 yang mencapai 23,4 juta unit, naik 61,4% YoY atau 11,43 YtD. Sekitar 55% dari total penjualan selama periode yang didominasi oleh merek lokal seperti
Nexian, Mito dan Cross dan sekitar 45% bersifat global yaitu merek Nokia, Sony Ericson, Samsung, LG, Motorola, Blackberry dan lain-lain. Untuk merek global, Nokia memiliki pangsa pasar terbesar yaitu 41% (berdasarkan Survei, Dilakukan oleh Nielsen hingga 2Q2011). Untuk keseluruhan 2011, penjualan Telepon seluler diperkirakan akan tumbuh 56,7% YoY dan mencapai 35,1 juta unit.
Sementara itu, 3Q2011 merupakan triwulan yang lambat untuk pasar PC
Indonesia karena beberapa vendor masih menghadapi keterbatasan persediaan dan kekurangan Hard Disk Drive (HDD) akibat banjir besar di Thailand. Impor PC di 3Q2011 menurun sebesar 6,2% QoQ menjadi 1,3 juta unit dari 1,4 juta unit pada 2Q2011, meskipun demikian, penjualan PC masih mencatat pertumbuhan 22,9% YoY dari 3Q2010.
Outlook Perekonomian Indonesia 2012: Memperkuat Permintaan Domestik
Untuk 2012, Pefindo menilai bahwa kondisi fundamental Indonesia masih akan solid meskipun pertumbuhan ekonomi diproyeksikan akan sedikit turun menjadi 6,2% akibat krisis ekonomi global. Menurut perkiraan IMF, diantara negara-negara G-20 Indonesia diharapkan untuk mencatatkan pertumbuhan tercepat ketiga setelah China dan India. Pefindo melihat bahwa konsumsi pribadi akan tetap menjadi mesin pertumbuhan utama di tahun yang datang, didukung oleh masih berlanjut optimisme konsumen, inflasi yang masih terjaga, suku bunga yang
masih lebih rendah, dan meningkatkan pendapatan per kapita. Selain itu, permintaan yang kuat juga didukung oleh fakta bahwa struktur demografis kita yang saat ini didominasi oleh usia produktif atau sekitar 60% dari populasi berusia diantara 15 - 54 tahun. Pendapatan perkapita Indonesia juga diharapkan bisa dua kali lipat dari USD 3.000 per kapita pada tahun 2010 dalam 6 tahun ke depan didukung oleh pertumbuhan ekonomi yang kuat.
Table 3: Di Tengah Krisis Global, Permintaan Domestik Akan Mendukung Pertumbuhan Perekonomian di tahun 2012
% yoy 2007 2008 2009 2010 1Q11 2Q11 3Q11 9M11 2011F 2012F
GDP 6.3 6.0 4.6 6.1 6.5 6.5 6.5 6.5 6.5 6.2
Domestic Demand 6.0 7.5 5.4 5.2 5.1 5.8 5.3 5.4 5.4 5.6
Private Consumption Expenditures 5.0 5.3 4.9 4.6 4.5 4.6 4.8 4.6 4.7 4.5
Government 3.9 10.4 15.7 0.3 2.8 4.5 2.5 3.3 3.8 7.2
Gross Fixed Capital Formation 9.3 11.9 3.3 8.5 7.3 9.4 7.1 7.9 7.7 7.5
Net Export 6.5 7.6 12.5 7.5 6.2 25.9 33.9 22.0 19.1 4.8
Export of Goods and Services 8.5 9.5 (9.7) 14.9 12.5 17.5 18.5 16.2 16.0 8.8
Import of Goods and Services 9.1 10.0 (15.0) 17.3 14.4 15.3 14.2 14.6 15.0 10.0 Sumber: Dari berbagai sumber, diolah oleh Pefindo Divisi Riset Ekonomi

“Pernyataan Disclaimer pada halaman
akhir merupakan bagian yang tidak
terpisahkan dari dokumen ini”
www.pefindo.com
Trikomsel Oke, Tbk
20 Januari 2012 Halaman 8 dari 16 halaman
9M2011: Pendapatan Meningkat Dengan Signifikan
Selama periode 2008-2010, pendapatan TRIO hanya tumbuh pada CAGR sebesar
1,6% dari Rp 5,3 triliun di tahun 2008 menjadi Rp 5,5 triliun pada 2010. Pada periode ini, kenaikan penjualan ini didukung oleh keberhasilan dari bauran pemasaran pada segmen utama. Peningkatan signifikan pada penjualan anak perusahaan TRIO yaitu sebesar 80,5% YoY, menutupi penurunan pendapatan TRIO dari penjualan konten mobile dan voucher isi ulang. Sedangkan penjualan telepon seluler di 2010 ini tumbuh sebesar 3,9% menjadi Rp 3,7 triliun.
Penjualan TRIO selama 9M2011 menunjukkan kinerja yang luar biasa. TRIO
mencatat pertumbuhan penjualan sebesar 39,9% YoY menjadi Rp 5,3 triliun, hampir sama dengan angka 2010. Pertumbuhan ini berasal dari peningkatan penjualan telepon seluler yang naik sebesar 55,2% YoY menjadi Rp 3,8 triliun. Pendapatan TRIO dari anak perusahaan meningkat 5,3% YoY menjadi Rp 746,9 miliar. Mengingat pertumbuhan permintaan telepon seluler dan PC sampai dengan September 2011, kami memperkirakan penjualan TRIO di tahun 2011
akan meningkat sebesar 30,2% YoY menjadi Rp 7,2 triliun.
Gambar 5: Pendapatan TRIO
Sumber: PT Trikomsel Oke Tbk., Pefindo Divisi Valuasi Saham & Indexing
Memiliki Kinerja Keuangan Yang Kuat Dengan berfokus pada penjualan produk yang memiliki margin lebih tinggi dan meningkatkan efisiensi melalui penataan ulang toko Okeshop, TRIO mencatat perbaikan marjin yang positif selama 2008 – 2010, dibandingkan dengan kenaikan pendapatan yang relatif kecil. Pendapatan TRIO pada tahun 2010 hanya meningkat sebesar 0,9% YoY, namun laba operasi dan laba bersih meningkat signifikan masing-masing sebesar 49,0% YoY dan 71,3% YoY. Marjin laba kotor,
laba operasi dan laba bersih TRIO pada periode yang sama tercatat masing-masing sebesar 12,9%, 7,4% dan 3,6%. Sementara di 3Q2011, laba operasi tumbuh sebesar 39,0% YoY menjadi Rp 439,9 miliar dengan marjin operasi tercatat sebesar 8,2%. Laba bersih dibukukan sebesar Rp 212,9 miliar, naik 37,0% YoY.
Gambar 6: Rasio Profitabilitas TRIO
Sumber: PT Trikomsel Oke Tbk., Pefindo Divisi Valuasi Saham & Indexing
KEUANGAN

“Pernyataan Disclaimer pada halaman
akhir merupakan bagian yang tidak
terpisahkan dari dokumen ini”
www.pefindo.com
Trikomsel Oke, Tbk
20 Januari 2012 Halaman 9 dari 16 halaman
Strategi ini juga membuat marjin TRIO menjadi kompetitif dibandingkan dengan perusahaan lain, karena TRIO mencatatkan marjin laba yang paling tinggi baik marjin laba kotor, marjin laba operasi dan marjin laba bersih.
Gambar 7: Marjin Laba TRIO dan Peernya Per 30 September 2011
Sumber: PT Trikomsel Oke Tbk., Pefindo Divisi Valuasi Saham & Indexing
Pendapatan Sebagai Distributor Mendominasi Pendapatan TRIO Kami membagi pendapatan TRIO berdasarkan saluran distribusinya yaitu sebagai distributor dan peritel. Per September 2011, pendapatan TRIO sebagai distributor (termasuk penjualan dari anak perusahaan dan penjualan ke luar negeri) mendominasi pendapatan TRIO yaitu sebesar 79,5%. Sementara, pendapatan
dari toko sendiri (ritel) memberikan kontribusi sekitar 20,5%. Bauran penjualan tersebut menguntungkan TRIO ditengah ketatnya persaingan saat ini, dari pada menjadi pesaing, TRIO menjadi pemasok untuk para peritel independen. Per September 2011, TRIO memiliki 108 pusat distribusi (termasuk anak perusahaan di Singapura) dan melayani sekitar 15.000 peritel independen di seluruh Indonesia.
Gambar 8: Komposisi Pendapatan TRIO per 3Q2011
Sumber: PT Trikomsel Oke Tbk., Pefindo Divisi Valuasi Saham & Indexing
Berekspansi Untuk Pertumbuhan Berkelanjutan Untuk mendukung pertumbuhan pendapatan di masa yang akan datang, TRIO memperluas bisnisnya melalui penambahan outlet Okeshop dan mengembangkan sistem informasi teknologi yang kuat dan terintegrasi. Untuk 2011 dan 2012, TRIO telah menganggarkan belanja modal sebesar masing-masing Rp 20 miliar dan Rp 22 miliar. Sampai dengan September 2011 TRIO telah menambah 39
toko baru dan meningkatkan jumlah tokonya sebesar 5% menjadi 847 toko dari 808 toko pada tahun 2010. Selanjutnya, Okeshop akan terus memperluas jaringan distribusi di dalam dan luar Pulau Jawa dengan menambahkan sekitar 80 toko. Rencana ekspansi akan didanai oleh kas internal TRIO.

“Pernyataan Disclaimer pada halaman
akhir merupakan bagian yang tidak
terpisahkan dari dokumen ini”
www.pefindo.com
Trikomsel Oke, Tbk
20 Januari 2012 Halaman 10 dari 16 halaman
Gambar 9: Pertumbuhan Gerai Okeshop dan Pusat Distribusi TRIO
Sumber: PT Trikomsel Oke Tbk., Estimasi Pefindo Divisi Valuasi Saham & Indexing Catt *) Proyeksi
Konsisten Dalam Membagikan Dividen
Sejak tahun 2008 sampai dengan 2010, TRIO menunjukkan konsistensinya dalam membagikan dividen tunai bagi para pemegang sahamnya. Pada tahun 2009 TRIO
membayar dividen tunai final sebesar Rp 7 per saham, sementara di tahun 2010 TRIO membagikan dividen senilai Rp 8 per saham. Pada tahun 2011, TRIO juga membagikan dividen tunai sebesar Rp 15 per saham untuk para pemegang saham, yang dihitung dari besarnya laba TRIO selama periode 2010 serta dengan mempertimbangkan antisipasi kebutuhan pendanaan. Konsistennya pembayaran dividen ini merupakan indikasi positif bagi para investor jangka panjang, karena mereka tahu bahwa TRIO akan terus membagikan dividen. Mengacu pada harga
saham TRIO per tanggal pencatatan dividen pada tanggal 11 Mei 2011 sebesar Rp 750 per saham dan dividen per saham, menghasilkan imbal hasil dividen (dividen yield) sebesar 2,0% untuk pemegang saham.
Gambar 10: Kronologi Dividen TRIO
Sumber: PT Trikomsel Oke Tbk., Pefindo Divisi Valuasi Saham & Indexing
Memiliki Kondisi Keuangan Yang Lebih Sehat Total aset TRIO di 3Q2011 adalah sebesar Rp 3,4 triliun, mencerminkan kenaikan sebesar 49,8%YtD dari angka pada 31 Desember 2010. Hal ini disebabkan peningkatan aset lancar TRIO, terutama piutang usaha, sejalan dengan
pertumbuhan penjualan TRIO pada periode yang sama.
Selama periode 3Q2011 TRIO memperoleh pinjaman jangka pendek dari beberapa bank komersial nasional dan bank asing untuk mendukung modal kerja. Dengan tambahan pinjaman tersebut, total kewajiban TRIO dalam periode ini naik 61,3% YTD menjadi Rp 2,5 triliun dari Rp 1,5 triliun pada 31 Desember 2010. Rasio utang terhadap ekuitas (DER) adalah 2,5 x dan rasio hutang berbunga terhadap ekuitas adalah sebesar 3,3x. Sementara itu, ekuitas pada
3Q2011 meningkat 17,1%YtD menjadi Rp 1,0 triliun yang disebabkan oleh peningkatan laba ditahan sebagai efek dari peningkatan laba bersih TRIO. Untuk 2011, kami memperkirakan total kewajiban TRIO akan tumbuh sebesar 58,1% YoY menjadi Rp 2,4 triliun, sedangkan ekuitas akan tumbuh 24,2% YoY menjadi Rp 10,6 triliun.

“Pernyataan Disclaimer pada halaman
akhir merupakan bagian yang tidak
terpisahkan dari dokumen ini”
www.pefindo.com
Trikomsel Oke, Tbk
20 Januari 2012 Halaman 11 dari 16 halaman
Kami menganggap TRIO memiliki kondisi keuangan sehat, karena rasio utang terhadap modal (DER) dan Rasio utang terhadap aset (DAR) lebih rendah dari perusahaan pembandingnya. Pada 3Q2011, DER dan DAR TRIO masing-masing
adalah sebesar 2,5x dan 0,7 x, sedangkan DER dan DAR peer-nya adalah sebesar
3,1x dan 0,8x.
Gambar 11: Aset, Kewajiban dan Ekuitas TRIO
(Dalam Rp miliar)
Sumber: PT Trikomsel Oke Tbk., Estimasi Pefindo Divisi Valuasi Saham & Indexing
Prospek Usaha TRIO Sejalan dengan perubahan gaya hidup orang Indonesia, dimana mereka memiliki kecenderungan untuk memiliki handset dengan teknologi dan model terbaru, telah mendorong permintaan terhadap telepon seluler dan aksesorisnya. Fenomena ini diperkuat oleh semakin banyaknya pengguna jejaring sosial seperti
Facebook dan twitter. Permintaan untuk perangkat telekomunikasi dan multimedia diproyeksikan akan naik, didukung oleh: (i) proyeksi pertumbuhan ekonomi Indonesia yang tinggi, diestimasikan sebesar 6,2% di tahun 2012, didukung oleh konsumsi domestik dan kinerja ekspor (ii) meningkatnya pendapatan per kapita rakyat Indonesia (lebih dari USD 3000 di tahun 2010) (iii)
besarnya populasi penduduk berusia muda di Indonesia yang merupakan pasar telekomunikasi (iv) Indonesia adalah pengguna Facebook terbesar ke-3,
pengguna Twitter terbesar dan pasar terbesar ke-2 untuk RIM (produsen Blackberry produsen) di dunia.
Berdasarkan argumen di atas, ditambah dengan ekspansi TRIO yang akan menambah beberapa toko "Okeshop" dan pusat distribusi di 2011 dan 2012, kami percaya pendapatan TRIO akan tumbuh dengan rata-rata CAGR sebesar 22,5% selama periode 2010-2014. Pada lini bawah, laba bersih TRIO diproyeksikan akan tumbuh dengan CAGR sebesar 36,9%.
Gambar 12: Proyeksi Pendapatan dan Laba Bersih TRIO
(Dalam Rp miliar)
Sumber: PT Trikomsel Oke Tbk., Estimasi Pefindo Divisi Valuasi Saham & Indexing

“Pernyataan Disclaimer pada halaman
akhir merupakan bagian yang tidak
terpisahkan dari dokumen ini”
www.pefindo.com
Trikomsel Oke, Tbk
20 Januari 2012 Halaman 12 dari 16 halaman
Tabel 4: Analisa SWOT
Strengths (Kekuatan) Weaknesses (Kelemahan)
Memiliki jaringan distribusi yang tersebar di seluruh provinsi di Indonesia
Memiliki hubungan yang baik dengan pabrikan peralatan telekomunikasi global yang terkenal
TRIO bertindak sebagai distributor dan sekaligus peritel, sehingga bisa menangkap pasar yang lebih luas
Secara konsisten membagikan informasi kepada publik
Jika TRIO terlambat dalam merespon tren pasar, konsumen akan dengan mudah berpindah ke pesaingnya
Opportunities (Peluang) Threats (Ancaman)
Semakin baiknya kondisi perekonomian
Besarnya jumlah penduduk (Indonesia memiliki populasi penduduk ke 4 terbesar di dunia)
Meningkatnya pendapatan per kapita
Tingginya persaingan dalam industri ritel, terutama dari peritel independen
Adanya kemungkinan prinsipal untuk memutuskan kontrak jangka panjang
Tabel 5: Perbandingan Industri 9M2011
TRIO SKYB Rata-rata
Penjualan [Rp miliar] 5.344 1.265
Laba Kotor [Rp miliar] 708 79
Laba operasional [Rp miliar] 440 34
Laba Bersih [Rp miliar] 213 32
Total Aset [Rp miliar] 3.484 763
Total Kewajiban [Rp miliar] 2.482 578
Total Ekuitas [Rp miliar] 1.001 185
Pertumbuhan YoY
Penjualan [%] 39,92 305,45
Laba Kotor [%] 32,67 157,98
Laba Operasional [%] 39,01 293,02
Laba Bersih [%] 35,66 446,88
Profitabilitas
Marjin Laba Kotor [%] 13,25 6,26 9,75
Marjin Laba Operasional [%] 8,23 2,67 5,45
Marjin Laba Bersih [%] 4,00 2,49 3,24
ROA [%] 6,11 4,13 5,12
ROE [%] 21,26 17,03 19,14
Leverage [9M11]
DER [x] 2,48 3,12 2,80
Sumber: PT Trikomsel Oke Tbk. PT Skybee Tbk, Pefindo Divisi Valuasi Saham & Indexing
ANALISA SWOT
PERBANDINGAN INDUSTRI

“Pernyataan Disclaimer pada halaman
akhir merupakan bagian yang tidak
terpisahkan dari dokumen ini”
www.pefindo.com
Trikomsel Oke, Tbk
20 Januari 2012 Halaman 13 dari 16 halaman
PENILAIAN
Metodologi Penilaian
Kami mengaplikasikan pendekatan pendapatan menggunakan Discounted Cash Flows (DCF) sebagai metode penilaian utama dengan pertimbangan bahwa pertumbuhan pendapatan adalah merupakan faktor yang sangat mempengaruhi nilai (value driver) TRIO jika dibandingkan dengan
pertumbuhan aset. Selain itu, kami menggunakan metode Guideline company method (GCM) sebagai metode pembanding. Penilaian ini didasarkan pada Nilai 100% saham per tanggal 19 Januari 2012,
menggunakan laporan keuangan TRIO per tanggal 30 September 2011 sebagai dasar dilakukannya analisa fundamental.
Estimasi Nilai
Kami menggunakan Cost of Capital sebesar 9,7% dan Cost of Equity sebesar 10,8% berdasarkan asumsi-asumsi berikut:
Table 6: Asumsi
Risk free rate [%]* 5,6
Risk premium [%]* 8,8
Beta [x]* 0,6
Cost of Equity [%] 10,8
Marginal tax rate [%] 25,0
Debt to Equity Ratio 2,3
WACC (%) 9,7
Sumber: Bloomberg, Estimasi Pefindo Divisi Valuasi Saham & Indexing Catt: Per tanggal 19 Januari 2012
Target harga saham untuk 12 bulan berdasarkan posisi penilaian pada tanggal 19 Januari 2012 adalah sebagai berikut:
Dengan menggunakan metode DCF dan asumsi tingkat diskonto 9,7%, adalah sebesar Rp 1.200 – Rp 1.390 per saham.
Dengan menggunakan metode GCM (PBV 3,8X and P/E 14,6X) adalah sebesar Rp 910- Rp 990 per saham.
Untuk mendapatkan nilai yang mewakili kedua indikasi nilai tersebut dilakukan rekonsiliasi dengan dilakukan pembobotan terhadap kedua metode tersebut sebesar 70% untuk DCf dan 30% untuk metode GCM.
Berdasarkan perhitungan di atas, maka Target Harga Saham TRIO untuk 12 bulan adalah Rp 1.120- Rp 1.270 per saham.
Tabel 7: Ringkasan Penilaian dengan Metode DCF
Konservatif Moderat Agresif
PV of Free Cash Flows [Rp miliar] 1.995 2.100 2.205
PV Terminal Value [Rp miliar] 5.631 5.927 6.223
Non-Operating Asset [Rp miliar] 88 88 88
Net Debt [Rp miliar] (2.317) (2.317) (2.317)
Total Equity Value [Rp miliar] 5.396 5.797 6.198
Number of Share [juta saham] 4.450 4.450 4.450
Fair Value per Share [Rp] 1.200 1.300 1.390
Sumber: Estimasi Pefindo Divisi Valuasi Saham & Indexing
TARGET PRICE

“Pernyataan Disclaimer pada halaman
akhir merupakan bagian yang tidak
terpisahkan dari dokumen ini”
www.pefindo.com
Trikomsel Oke, Tbk
20 Januari 2012 Halaman 14 dari 16 halaman
Table 8: Pembanding GCM
TRIO
Penilaian, 19 Januari 2012
P/E, [x] 14,6
P/BV, [x] 3,8
Sumber: Bloomberg, Pefindo Divisi Valuasi Saham & Indexing
Tabel 9: Ringkasan Penilaian Metode GCM
Multiples
(x)
Est. EPS
(Rp)
Est. BV/Share
(Rp)
Value
(Rp)
P/BV 3,8 - 239 910
P/E 14,6 68 - 990 Sumber: Bloomberg, Estimasi Pefindo Divisi Valuasi Saham & Indexing
Tabel 10: Rekonsiliasi Nilai Wajar Nilai Wajar per Saham [Rp]
DCF GCM Rata-rata
Upper limit 1.390 990 1.270
Bottom limit 1.200 910 1.120
Weight 70% 30%
Sumber: Estimasi Pefindo Divisi Valuasi Saham & Indexing

“Pernyataan Disclaimer pada halaman
akhir merupakan bagian yang tidak
terpisahkan dari dokumen ini”
www.pefindo.com
Trikomsel Oke, Tbk
20 Januari 2012 Halaman 15 dari 16 halaman
Table 11: Laporan Laba (Rugi)
(Rp miliar)
Laporan Laba (Rugi) 2008 2009 2010 2011P 2012P
Penjualan 5.340 5.463 5.511 7.178 8.940
Harga Pokok Penjualan (4.901) (4.899) (4.802) (6.257) (7.763)
Laba Kotor 439 564 709 921 1.177
Beban Operasional (233) (289) (299) (369) (423)
Laba Operasional 206 275 410 552 755
Pendapatan (Beban)
Lain-lain (59) (111) (133) (152) (133)
Laba Sebelum Pajak 148 164 277 401 623
Pajak (45) (46) (76) (100) (156)
Laba Bersih 103 118 202 301 467
Sumber: PT Trikomsel Oke Tbk., Estimasi Pefindo Divisi Valuasi Saham & Indexing
Tabel 12: Laporan Neraca
(Rp miliar)
Laporan Neraca 2008 2009 2010 2011P 2012P
Aset
Aset Lancar
Kas dan Setara Kas 212 90 80 92 98
Piutang Usaha 146 319 594 1.057 1.043
Persediaan 467 573 558 630 782
Aset Lancar Lainnya 274 780 1.022 1.610 1.487
Total Aset Lancar 1.099 1.762 2.254 3.389 3.410
Aset Tetap 33 41 78 82 77
Aset Lin-lain 78 146 62 24 25
Total Aset 1.210 1.949 2.394 3.495 3.512
Kewajiban
Hutang Usaha 45 207 98 178 199
Pinjaman Jk. Pendek 697 1.014 1.398 2.189 1.858
Pinjaman Jk. Pendek
Lainnya 33 32 32 55 60
Pinjaman Jk. Panjang 0.5 0 0.3 0.1 0
Pinjaman Jk. Panjang
Lainnya 6 8 11 11 12
Total Kewajiban 782 1.261 1.539 2.433 2.129
Total Ekuitas 429 687 855 1.062 1.383
Sumber: PT Trikomsel Oke Tbk., Estimasi Pefindo Divisi Valuasi Saham & Indexing
Gambar 13: P/E dan P/BV Historis
Gambar 14: ROA, ROE dan Total Asset Turnover Historis
Tabel 13: Rasio Kunci
Rasio 2008 2009 2010 2011P 2012P
Pertumbuhan (%)
Penjualan n.a 2,3 0,9 30,2 24,6
Laba Operasional n.a 33,3 49,0 34,7 36,7
EBITDA n.a 31,7 47,0 27,1 41,0
Laba Bersih n.a 14,7 71,3 49,1 55,4
Profitabilitas (%)
Marjin Laba Kotor 8,2 10,3 12,9 12,8 13,2
Marjin Laba
Operasional 3,9 5,0 7,4 7,7 8,4
Marjin EBITDA 3,8 4,9 7,2 7,7 8,6
Marjin Laba Bersih 1,9 2,1 3,7 4,1 5,2
ROA 8,5 6,0 8,4 8,6 13,3
ROE 23,9 17,1 23,6 28,3 33,77
Solvabilitas (X)
Debt to Equity 1,8 1,8 1,8 2,3 1,5
Debt to Asset 0,6 0,6 0,6 2,1 1,3
Likuiditas (X)
Rasio Lancar 1,4 1,4 1,5 1,4 1,6
Quick Ratio 0,5 0,3 0,4 0,6 0,6
Sumber: PT Trikomsel Oke Tbk., Estimasi Pefindo Divisi Valuasi Saham & Indexing
“Pernyataan Disclaimer pada halaman
akhir merupakan bagian yang tidak
terpisahkan dari dokumen ini”
www.pefindo.com
Trikomsel Oke, Tbk
20 Januari 2012 Halaman 16 dari 16 halaman
DISCLAIMER
Laporan ini dibuat berdasarkan sumber-sumber yang kami anggap terpercaya dan dapat diandalkan. Namun kami tidak menjamin kelengkapan, keakuratan atau kecukupannya. Dengan demikian kami tidak bertanggung jawab atas segala keputusan investasi yang diambil berdasarkan laporan ini. Adapun asumsi, opini, dan perkiraan merupakan hasil dari pertimbangan internal kami per tanggal penilaian (cut off date), dan kami dapat mengubah pertimbangan diatas sewaktu-waktu tanpa pemberitahuan terlebih dahulu. Kami tidak bertanggung jawab atas kekeliruan atau kelalaian yang terjadi akibat penggunaan laporan ini. Kinerja dimasa lalu tidak selalu dapat dijadikan acuan hasil masa depan. Laporan ini bukan merupakan rekomendasi penawaran, pembelian atau menahan suatu saham tertentu. Laporan ini mungkin tidak sesuai untuk beberapa investor. Seluruh opini dalam laporan ini telah disampaikan dengan itikad baik, namun sewaktu-waktu dapat berubah tanpa pemberitahuan terlebih dahulu, dan disajikan dengan benar per tanggal diterbitkan laporan ini. Harga, nilai, atau pendapatan dari setiap saham Perseroan yang disajikan dalam laporan ini kemungkinan dapat lebih rendah dari harapan pemodal, dan pemodal juga mungkin mendapatkan pengembalian yang lebih rendah dari nilai investasi yang ditanamkan. Investasi didefinisikan sebagai pendapatan yang kemungkinan besar diterima dimasa depan, namun nilai dari pendapatan yang akan diterima tersebut kemungkinan besar juga akan berfluktuasi. Untuk saham Perseroan yang penyajian laporan keuangannya didenominasi dalam mata uang selain Rupiah, perubahan nilai tukar mata uang tersebut kemungkinan dapat menurunkan nilai, harga, atau pendapatan investasi pemodal. Informasi dalam laporan ini bukan merupakan pertimbangan pajak dalam mengambil suatu keputusan investasi. Target harga saham dalam Laporan ini merupakan nilai fundamental, bukan merupakan Nilai Pasar Wajar, dan bukan merupakan harga acuan transaksi yang diwajibkan oleh peraturan perundang-undangan yang berlaku.
Laporan target harga saham yang diterbitkan oleh Pefindo Divisi Valuasi Saham & Indexing bukan merupakan rekomendasi untuk membeli, menjual, atau menahan suatu saham tertentu, dan tidak dapat dianggap sebagai nasehat investasi oleh Pefindo Divisi Valuasi Saham & Indexing yang behubungan dengan cakupan Jasa Pefindo Divisi Valuasi Saham & Indexing kepada, atau kaitannya kepada, beberapa pihak, termasuk emiten, penasehat keuangan, pialang saham, investment banks, institusi keuangan dan perantara keuangan, dalam kaitannya menerima imbalan atau keuntungan lainnya dari pihak tersebut. Laporan ini tidak ditujukan untuk pemodal tertentu dan tidak dapat dijadikan bagian dari tujuan investasi terhadap suatu saham dan juga bukan merupakan rekomendasi investasi terhadap suatu saham tertentu atau suatu strategi investasi. Sebelum melakukan tindakan dari hasil laporan ini, pemodal disarankan untuk mempertimbangkan terlebih dahulu kesesuaian situasi dan kondisi dan, jika dibutuhkan, mintalah bantuan penasehat keuangan. PEFINDO memisahkan kegiatan Valuasi Saham dengan kegiatan Pemeringkatan untuk menjaga independensi dan objektivitas dari proses dan produk kegiatan analitis. PEFINDO telah menetapkan kebijakan dan prosedur untuk menjaga kerahasiaan informasi non-publik tertentu yang diterima sehubungan dengan proses analitis. Keseluruhan proses, metodologi dan database yang digunakan dalam penyusunan Laporan Target Harga Referensi Saham ini secara keseluruhan adalah berbeda dengan proses, metodologi dan database yang digunakan PEFINDO dalam melakukan pemeringkatan. Laporan ini dibuat dan disiapkan Pefindo Divisi Valuasi Saham dan Indexing dengan tujuan untuk meningkatkan transparansi harga saham yang tercatat di Bursa Efek Indonesia. Laporan ini juga bebas dari pengaruh tekanan atau paksaan dari Bursa maupun Perseroan yang dinilai. Pefindo Divisi Valuasi Saham dan Indexing akan menerima imbalan sebesar Rp 20.000.000,- dari Bursa Efek Indonesia dan Perseroan yang dinilai untuk 2 (dua) kali pelaporan per tahun. keterangan lebih lanjut, dapat mengunjungi website kami di http://www.pefindo.com Laporan ini dibuat dan disiapkan oleh Pefindo Divisi Valuasi Saham dan Indexing. Di Indonesia Laporan ini dipublikasikan pada website kami dan juga pada website Bursa Efek Indonesia.
Page 1 of 15 pages
Contact: Equity & Index Valuation Division Phone: (6221) 7278 2380 [email protected]
“Disclaimer statement in the last page is an
integral part of this report”
www.pefindo.com
Trikomsel Oke, Tbk Primary Report
Equity Valuation January 20th, 2012
Target Price
Low High 1,120 1,270
Trade & Retail Industry
Historical Chart
Source : Bloomberg
Stock Information Rp
Ticker code TRIO
Market price as of January 19th, 2012 860
Market price – 52 week high 1,000
Market price – 52 week low 600
Market cap – 52 week high (bn) 4,450
Market cap – 52 week low (bn) 2,670
Market Value Added & Market Risk
Source : Bloomberg
Shareholders (%)
PT KB Trio 24.64
PT KL Trio 23.71
PT SL Trio 10.92
Canopus Finance Limited 25.00
Public (each below 5%) 15.73
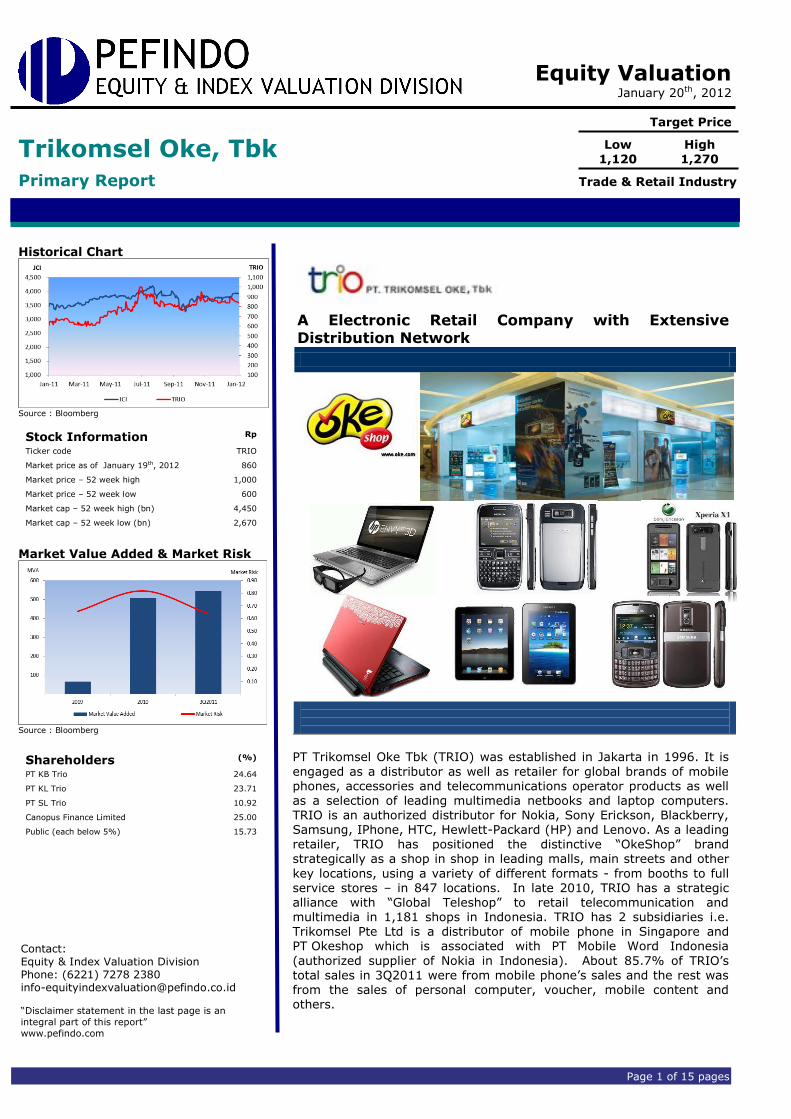
A Electronic Retail Company with Extensive Distribution Network
PT Trikomsel Oke Tbk (TRIO) was established in Jakarta in 1996. It is
engaged as a distributor as well as retailer for global brands of mobile phones, accessories and telecommunications operator products as well as a selection of leading multimedia netbooks and laptop computers. TRIO is an authorized distributor for Nokia, Sony Erickson, Blackberry, Samsung, IPhone, HTC, Hewlett-Packard (HP) and Lenovo. As a leading
retailer, TRIO has positioned the distinctive “OkeShop” brand strategically as a shop in shop in leading malls, main streets and other
key locations, using a variety of different formats - from booths to full service stores – in 847 locations. In late 2010, TRIO has a strategic alliance with “Global Teleshop” to retail telecommunication and multimedia in 1,181 shops in Indonesia. TRIO has 2 subsidiaries i.e. Trikomsel Pte Ltd is a distributor of mobile phone in Singapore and PT Okeshop which is associated with PT Mobile Word Indonesia
(authorized supplier of Nokia in Indonesia). About 85.7% of TRIO’s total sales in 3Q2011 were from mobile phone’s sales and the rest was from the sales of personal computer, voucher, mobile content and others.
“Disclaimer statement in the last page
is an integral part of this report”
www.pefindo.com
Trikomsel Oke, Tbk
January 20th, 2012 Page 2 of 15 pages
Supported by Extensive Distribution Network
TRIO is one of the largest distributor and retailer of telecommunication
and multimedia devices which has the most extensive distribution network. As of September 2011, TRIO has about 847 stores of “Okeshop” which spread over 153 cities in 33 provinces in Indonesia. It also has networking with about 15,000 independence dealer throughout Indonesia. Besides, TRIO also penetrates overseas market such as Singapore, Dubai and China. In 2011, TRIO focuses its expansion to areas outside of Java and added about 39 new stores. We believe that
with the extensive distribution network TRIO will be able to cater wider market and increase its revenue.
Strong Financial Performance During 2008-2010 periods, TRIO’s sales are stable on Rp 5 trillion and grew with a CAGR of 1.6%. However, in operating and net income, TRIO booked a significant growth (CAGR) of 40.9% and 40.2%, respectively. In 9M2011, along with the soaring of national mobile phone sales which
grow by 61.4% YoY, TRIO success to book revenue to almost equal to
2010’s figures. It booked revenue of Rp 5.3 trillion, up by 39.9% YoY. Meanwhile, operating income grew by 39.0% to Rp 440 billion and net income increased by 37.0% YoY to Rp 213 billion. These figures are higher than operating income and net income obtained during 2010. For 2011, we estimate TRIO’s revenue will increase by 28.5% YoY to Rp 7.1
trillion, while net income will grow by 35.3% YoY to Rp 273 billion from Rp 202 billion in 2010.
Improve Profitability through Efficiency TRIO increases its efficiency by focusing on high margin product, and reduced the number of stores which were not meeting expectations and instead, focused on locations within leading cities that identified have higher retail traffic and stronger spending power. Thus, TRIO managed to
improve its margin and become higher than its peer. During 9M2011, gross margin, operating margin and net margin are at 13.2%, 8.2% and 4.0%, respectively. In addition, this will also makes TRIO more competitive, as it margin is higher than its peer.
Business Prospects In line with the change of Indonesia people lifestyle, which tend to have a handset with the latest technology and type, has roused the demand for
mobile phone and its accessories. This phenomenon is strengthened by the growing of social networks users such as Facebook and Twitter. The demand for telecommunication and multimedia devices is expected to increase, supported by: (i) high projection of Indonesia economic growth, which is estimated will grow by 6.2% in 2012, backed by domestic consumption and export performance (ii) increasing per capita income of
Indonesian people (more than USD 3,000 in 2010) (iii) significant number of young-age population in Indonesia which is the telecommunication’s target market (iv) Indonesia is the 3rd largest of Facebook users, the largest Twitter users and the 2nd largest market for RIM (Blackberry producer) in the world. Based on the above arguments, coupled with TRIO expansion by adding several “Okeshop” stores and distribution center in 2011 and 2012, we believe TRIO’s revenues will grow at a CAGR
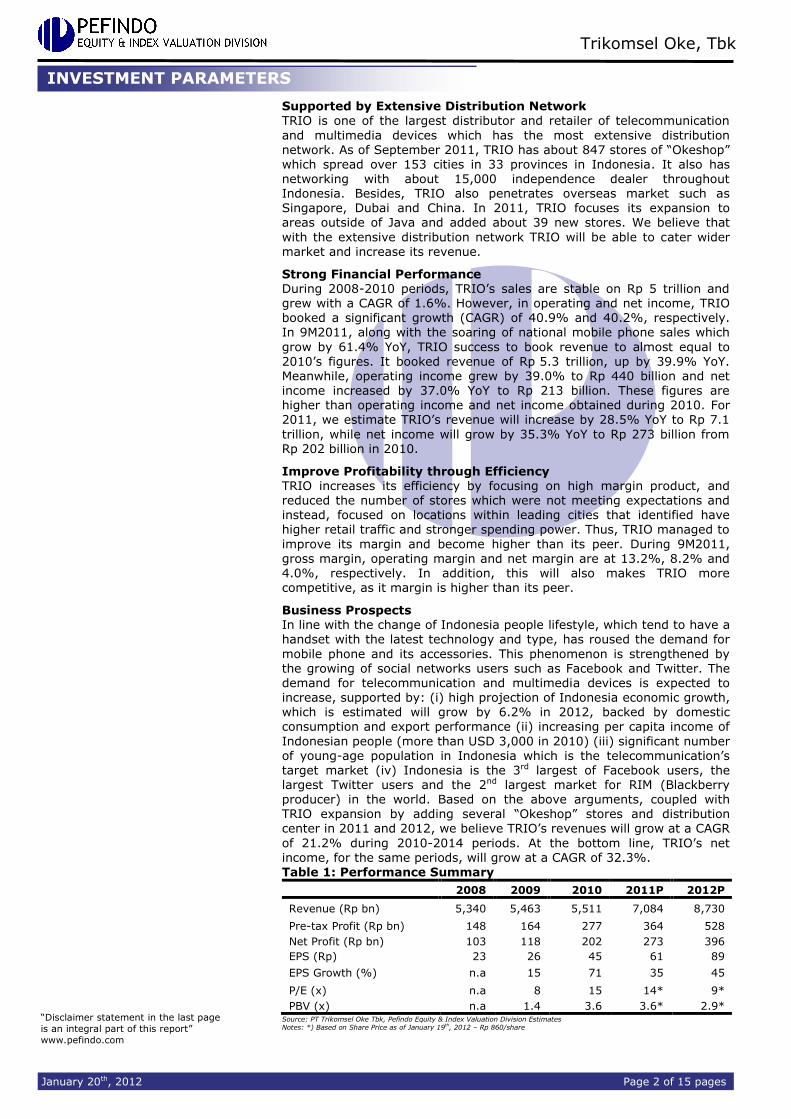
of 21.2% during 2010-2014 periods. At the bottom line, TRIO’s net income, for the same periods, will grow at a CAGR of 32.3%. Table 1: Performance Summary
2008 2009 2010 2011P 2012P
Revenue (Rp bn) 5,340 5,463 5,511 7,084 8,730
Pre-tax Profit (Rp bn) 148 164 277 364 528
Net Profit (Rp bn) 103 118 202 273 396
EPS (Rp) 23 26 45 61 89
EPS Growth (%) n.a 15 71 35 45
P/E (x) n.a 8 15 14* 9*
PBV (x) n.a 1.4 3.6 3.6* 2.9* Source: PT Trikomsel Oke Tbk, Pefindo Equity & Index Valuation Division Estimates Notes: *) Based on Share Price as of January 19
th, 2012 – Rp 860/share
INVESTMENT PARAMETERS
“Disclaimer statement in the last page
is an integral part of this report”
www.pefindo.com
Trikomsel Oke, Tbk
January 20th, 2012 Page 3 of 15 pages
Growth-Value Map gives visualization of market expectations for the companies listed on IDX. Current Performance (“CP”) metric is a portion of current stock market value that can be linked to the perpetuity of current company’s performance in profitability. Growth Expectations (“GE”) metric is the difference
between current stock market value and the value of current performance. Both metrics are normalized by the company’s book value. Growth-Value Map divides companies into four clusters, they are:
Excellent value managers (“Q-1”) Market expects companies in Q-1 to surpass their benchmark in
profitability and growth.
Expectation builders (“Q-2”) Market has relatively low expectations of profitability from companies in Q-2 in the short term, but has growth expectations exceed the benchmark.
Traditionalists (“Q-3”)
Market has low growth expectations of companies in the Q-3, although they showed a good profitability in the short term.
Asset-loaded value managers (“Q-4”) Market has low expectations in terms of profitability and growth for companies in Q-4
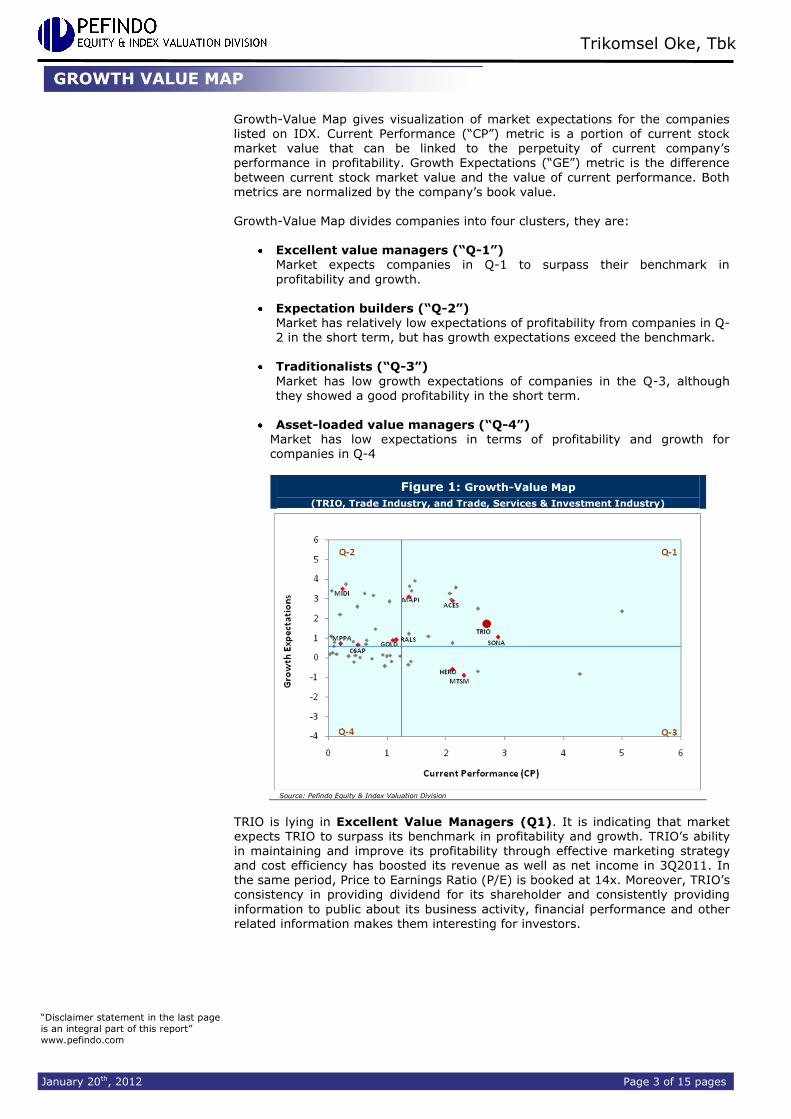
Figure 1: Growth-Value Map
(TRIO, Trade Industry, and Trade, Services & Investment Industry)
Source: Pefindo Equity & Index Valuation Division
TRIO is lying in Excellent Value Managers (Q1). It is indicating that market expects TRIO to surpass its benchmark in profitability and growth. TRIO’s ability
in maintaining and improve its profitability through effective marketing strategy and cost efficiency has boosted its revenue as well as net income in 3Q2011. In the same period, Price to Earnings Ratio (P/E) is booked at 14x. Moreover, TRIO’s consistency in providing dividend for its shareholder and consistently providing
information to public about its business activity, financial performance and other related information makes them interesting for investors.
GROWTH VALUE MAP
“Disclaimer statement in the last page
is an integral part of this report”
www.pefindo.com
Trikomsel Oke, Tbk
January 20th, 2012 Page 4 of 15 pages
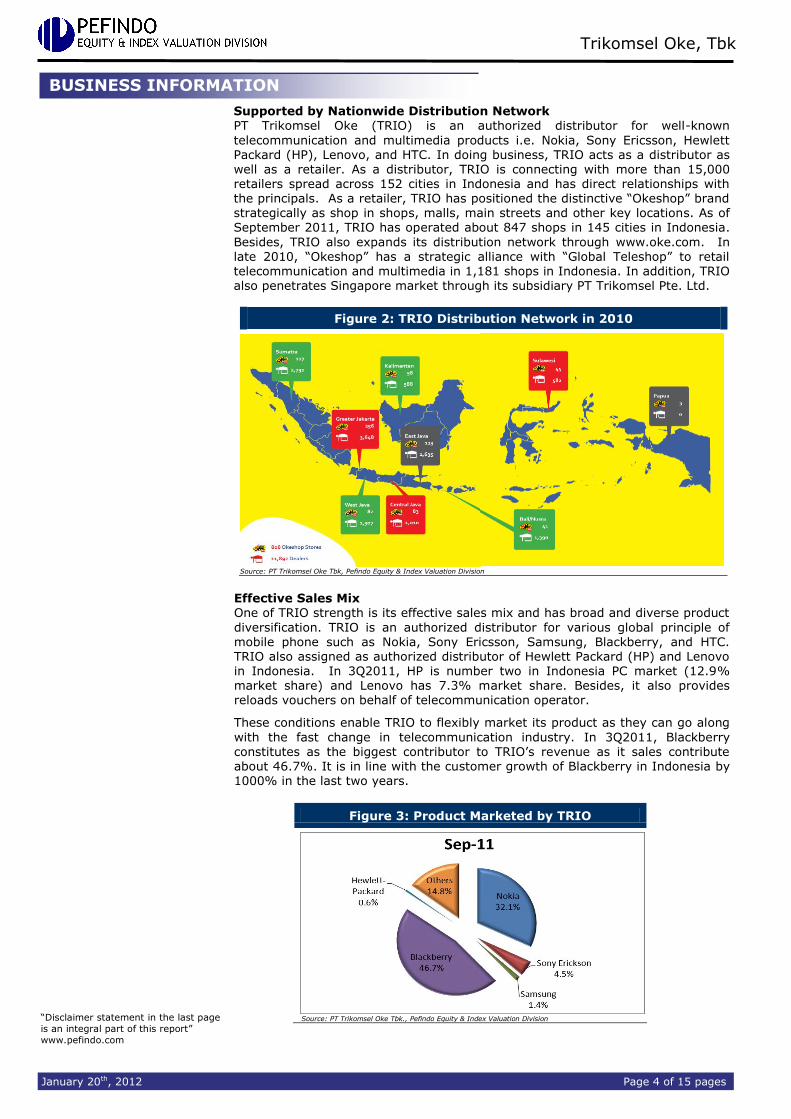
Supported by Nationwide Distribution Network
PT Trikomsel Oke (TRIO) is an authorized distributor for well-known
telecommunication and multimedia products i.e. Nokia, Sony Ericsson, Hewlett Packard (HP), Lenovo, and HTC. In doing business, TRIO acts as a distributor as well as a retailer. As a distributor, TRIO is connecting with more than 15,000 retailers spread across 152 cities in Indonesia and has direct relationships with the principals. As a retailer, TRIO has positioned the distinctive “Okeshop” brand strategically as shop in shops, malls, main streets and other key locations. As of September 2011, TRIO has operated about 847 shops in 145 cities in Indonesia.
Besides, TRIO also expands its distribution network through www.oke.com. In late 2010, “Okeshop” has a strategic alliance with “Global Teleshop” to retail telecommunication and multimedia in 1,181 shops in Indonesia. In addition, TRIO also penetrates Singapore market through its subsidiary PT Trikomsel Pte. Ltd.
Figure 2: TRIO Distribution Network in 2010
Source: PT Trikomsel Oke Tbk, Pefindo Equity & Index Valuation Division
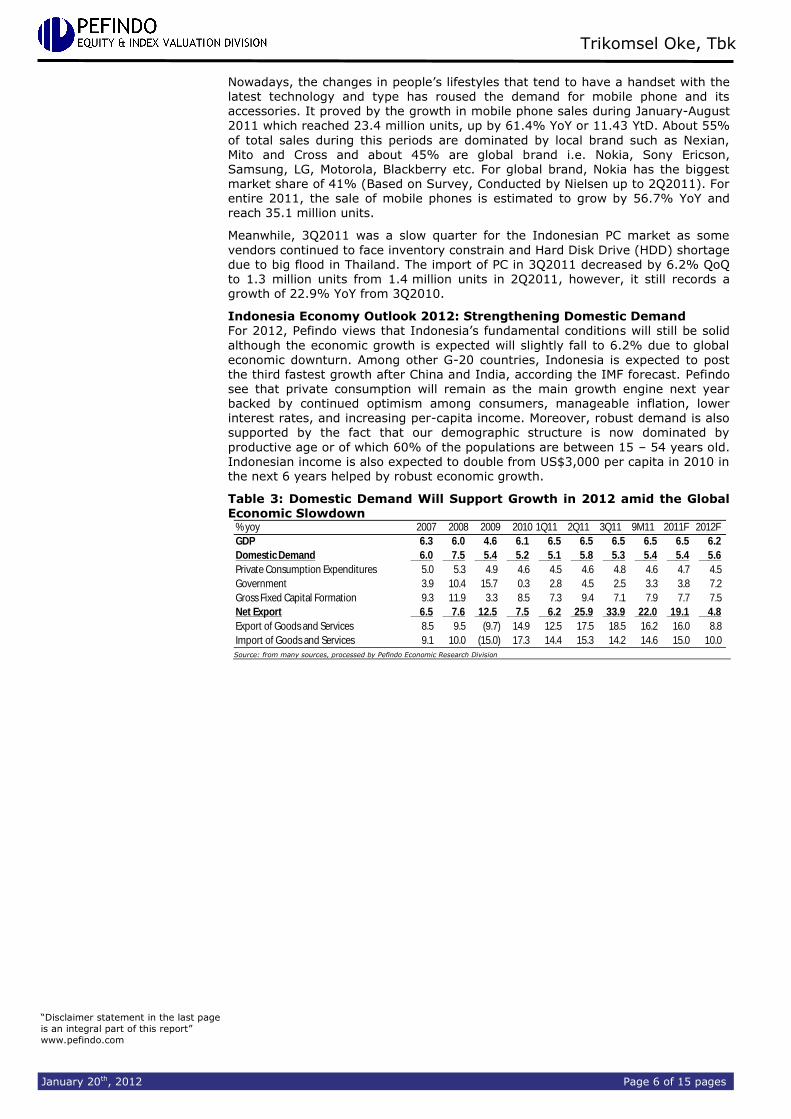
Effective Sales Mix
One of TRIO strength is its effective sales mix and has broad and diverse product
diversification. TRIO is an authorized distributor for various global principle of mobile phone such as Nokia, Sony Ericsson, Samsung, Blackberry, and HTC. TRIO also assigned as authorized distributor of Hewlett Packard (HP) and Lenovo in Indonesia. In 3Q2011, HP is number two in Indonesia PC market (12.9% market share) and Lenovo has 7.3% market share. Besides, it also provides reloads vouchers on behalf of telecommunication operator.
These conditions enable TRIO to flexibly market its product as they can go along
with the fast change in telecommunication industry. In 3Q2011, Blackberry constitutes as the biggest contributor to TRIO’s revenue as it sales contribute about 46.7%. It is in line with the customer growth of Blackberry in Indonesia by 1000% in the last two years.
Figure 3: Product Marketed by TRIO
Source: PT Trikomsel Oke Tbk., Pefindo Equity & Index Valuation Division
BUSINESS INFORMATION

“Disclaimer statement in the last page
is an integral part of this report”
www.pefindo.com
Trikomsel Oke, Tbk
January 20th, 2012 Page 5 of 15 pages
Competitive Strengths to Win the Market As a retailer, TRIO is in perfect competition market, as no participants are large enough to control the price of a homogeneous product. Currently there are
several big retailers in telecommunication industry i.e. PT Multi Cipta Perkasa,
operator of the Global Teleshop, PT Selular Graha Prima- operator of Selular Shop and PT Parastar Echorindo which operates Sentra Ponsel.
Table 2: Big Player of Telecommunication Product in Indonesia
Company’s Name Names of Outlet No. Outlet
PT Trikomsel Oke Tbk Okeshop 15,847*
PT Cipta Multi Usaha Perkasa Global Teleshop 1,181
PT Selular Graha Prima Selular Shop 100
PT Parastar Echorindo Sentra Ponsel 84 Source: Various Source Processed by Pefindo Equity & Index Valuation Division Note :*) include retail network
However TRIO has the following competitive strengths to win the competition in this industry: a. TRIO has the most extensive distribution network spread in all province of
Indonesia. Currently, TRIO has 847 Okeshop in 153 cities in Indonesia. TRIO
also connected with 15,000 independent retailers throughout Indonesia. Besides, TRIO also penetrates overseas market such as Singapore, Dubai and
China.
b. Besides retailer, TRIO is an authorized distributor for several global principal of mobile phone and PC as well as telecommunication operator in Indonesia.
c. TRIO has an effective sales mix. In addition to mobile phones and its accessories, TRIO obtains revenue from operator product, mobile content, after sales services, laptop and notebook and others.
Outlook of Retail Industry Generally, retail industry in Indonesia is benefited by strong economic growth that backed by strong domestic consumption, large population (the 4th largest population in the world with 235 million inhabitants) and the increase of per capita income. Up to September 2011, Indonesia economy grew by 6.5% YoY with per capita income increase to more than USD 3,000 or about Rp 2-2.5 million per
month.
Meanwhile, telecommunication industry that drives TRIO business grew significantly in recent years. The penetration of telecommunication industry in Indonesia has surpassed the population number of 110%. Telecommunication becomes the basic need as people need to socialize as well as for business. It strengthens by widespread of social media like Facebook and Twitter. These conditions stimulate the demand for telecommunication and multimedia devices
such as mobile phone and its accessories, and personal computer (especially netbook and notebook) and operator telecommunication product and its content.
Figure 4: The Development of Cellular Phone and Personal Computer in Indonesia
Source: various source processed by Pefindo Equity & Index Valuation Division
“Disclaimer statement in the last page
is an integral part of this report”
www.pefindo.com
Trikomsel Oke, Tbk
January 20th, 2012 Page 6 of 15 pages
Nowadays, the changes in people’s lifestyles that tend to have a handset with the latest technology and type has roused the demand for mobile phone and its accessories. It proved by the growth in mobile phone sales during January-August
2011 which reached 23.4 million units, up by 61.4% YoY or 11.43 YtD. About 55%
of total sales during this periods are dominated by local brand such as Nexian, Mito and Cross and about 45% are global brand i.e. Nokia, Sony Ericson, Samsung, LG, Motorola, Blackberry etc. For global brand, Nokia has the biggest market share of 41% (Based on Survey, Conducted by Nielsen up to 2Q2011). For entire 2011, the sale of mobile phones is estimated to grow by 56.7% YoY and reach 35.1 million units.
Meanwhile, 3Q2011 was a slow quarter for the Indonesian PC market as some
vendors continued to face inventory constrain and Hard Disk Drive (HDD) shortage due to big flood in Thailand. The import of PC in 3Q2011 decreased by 6.2% QoQ to 1.3 million units from 1.4 million units in 2Q2011, however, it still records a growth of 22.9% YoY from 3Q2010.
Indonesia Economy Outlook 2012: Strengthening Domestic Demand For 2012, Pefindo views that Indonesia’s fundamental conditions will still be solid
although the economic growth is expected will slightly fall to 6.2% due to global
economic downturn. Among other G-20 countries, Indonesia is expected to post the third fastest growth after China and India, according the IMF forecast. Pefindo see that private consumption will remain as the main growth engine next year backed by continued optimism among consumers, manageable inflation, lower interest rates, and increasing per-capita income. Moreover, robust demand is also supported by the fact that our demographic structure is now dominated by
productive age or of which 60% of the populations are between 15 – 54 years old. Indonesian income is also expected to double from US$3,000 per capita in 2010 in the next 6 years helped by robust economic growth.
Table 3: Domestic Demand Will Support Growth in 2012 amid the Global Economic Slowdown
% yoy 2007 2008 2009 2010 1Q11 2Q11 3Q11 9M11 2011F 2012F
GDP 6.3 6.0 4.6 6.1 6.5 6.5 6.5 6.5 6.5 6.2
Domestic Demand 6.0 7.5 5.4 5.2 5.1 5.8 5.3 5.4 5.4 5.6
Private Consumption Expenditures 5.0 5.3 4.9 4.6 4.5 4.6 4.8 4.6 4.7 4.5
Government 3.9 10.4 15.7 0.3 2.8 4.5 2.5 3.3 3.8 7.2
Gross Fixed Capital Formation 9.3 11.9 3.3 8.5 7.3 9.4 7.1 7.9 7.7 7.5
Net Export 6.5 7.6 12.5 7.5 6.2 25.9 33.9 22.0 19.1 4.8
Export of Goods and Services 8.5 9.5 (9.7) 14.9 12.5 17.5 18.5 16.2 16.0 8.8
Import of Goods and Services 9.1 10.0 (15.0) 17.3 14.4 15.3 14.2 14.6 15.0 10.0 Source: from many sources, processed by Pefindo Economic Research Division

“Disclaimer statement in the last page
is an integral part of this report”
www.pefindo.com
Trikomsel Oke, Tbk
January 20th, 2012 Page 7 of 15 pages
9M2011: Revenue Increase Significantly
During 2008-2010 periods, TRIO’s revenue only grew at a CAGR of 1.6% from
Rp 5.3 trillion in 2008 to Rp 5.5 trillion in 2010. In this period, the increasing sales were supported by the success of the marketing mix on the main segments. Significant increase in the sales of TRIO’s subsidiaries by 80.5% YoY in 2010, overcome the decrease of TRIO’s income from mobile content and reload voucher. While the sales of mobile phone in 2010 were grow by 3.9% to Rp 3.7 trillion.
TRIO’s sales during 9M2011 showed a superb performance. It recorded a growth
of 39.9% YoY to Rp 5.3 trillion, it almost equal to 2010 figures. This growth is derived from the increase of mobile phone sales, which rose by 55.2% YoY to Rp 3.8 trillion. TRIO’s revenue from its subsidiary is increase by 5.3% YoY to Rp 746.9 billion. Considering the growth of mobile phone and PC demand up to September 2011, we estimate TRIO’s sales in 2011 will increase by 30.2% YoY to Rp 7.2 trillion.
Figure 5: TRIO’s Revenue
Source: PT Trikomsel Oke Tbk., Pefindo Equity & Index Valuation Division
Strong Financial Performance By focusing on selling products which have higher margins and increase the
efficiency through rearrangement of Okeshop’s store, TRIO records a positive improvement on its margin during 2008-2010 in contrast with relatively slight increase in its revenue. TRIO’s revenue in 2010 only increase by 0.9% YoY, but its operating profit and net profit increased significantly by 49.0% YoY and 71.3% YoY, respectively. TRIO’s gross margin, operating margin and net margin in this period were recorded at 12.9%, 7.4% and 3.6%, respectively. While in 3Q 2011, operating income grew by 39.0% YoY to Rp 439.9 billion with operating margin at
8.2% level. Net income was booked of Rp 212.9 billion, up by 37.0% YoY.
Figure 6: TRIO’s Profitability
Source: PT Trikomsel Oke Tbk., Pefindo Equity & Index Valuation Division
FINANCE

“Disclaimer statement in the last page
is an integral part of this report”
www.pefindo.com
Trikomsel Oke, Tbk
January 20th, 2012 Page 8 of 15 pages
The strategy also makes TRIO’s margin become competitive compared to other company, as they become the highest in term of gross margin, operating margin and net margin.
Figure 7: TRIO’s Margin and Its Peer as of September 30th, 2011
Source: PT Trikomsel Oke Tbk., Pefindo Equity & Index Valuation Division
Distributor Dominated TRIO’s Revenue We divide TRIO’s revenue based on its distribution channel i.e. as distributor and retailer. As of September 2011, revenue as distributor (including the sales from subsidiary and outbound) dominates TRIO’s income of 79.5%. While, revenue from its own stores contributed about 20.5%. The sales mix is benefiting them amid the current tight competition, instead of compete, TRIO supplies those
independent retailers. As of September 2011, TRIO has 108 distribution centers (including a subsidiary in Singapore) and served about 15,000 independent retailers throughout Indonesia.
Figure 8: Composition of TRIO’s Revenue as of 3Q2011
Source: PT Trikomsel Oke Tbk., Pefindo Equity & Index Valuation Division
Expansion for Further Growth To support its further revenue growth, TRIO expands its business through the addition of Okeshop outlets and develops a strong and integrated information technology system. For 2011 and 2012, TRIO has budgeted capital expenditure of Rp 20 billion and Rp 22 billion, respectively. Up to September 2011, TRIO has added 39 new stores and increased its store by 5% to 847 stores from 808 stores
in 2010. Further, Okeshop will continue to expand its distribution network in and out of Java Island by adding about 80 stores. The expansion plan will be funded by TRIO internal cash.

“Disclaimer statement in the last page
is an integral part of this report”
www.pefindo.com
Trikomsel Oke, Tbk
January 20th, 2012 Page 9 of 15 pages
Figure 9: Growth of Okeshop and Distribution Center
Source: PT Trikomsel Oke Tbk., Pefindo Equity & Index Valuation Division Estimates
Note: *)Projection
Provide Dividend Consistently
During 2008 – 2010 periods, TRIO showed consistency in providing cash dividends to its shareholders. In 2009 TRIO paid final cash dividend of Rp 7/share, while in 2010 TRIO paid Rp 8/share. In 2011, TRIO paid Rp 15/share of final cash dividend to its shareholders, measured from TRIO’s profit during 2010 period as well as considering TRIO’s anticipated funding needs. This consistent payment is a good sign for long term investors, since they will acknowledge that TRIO will continue to
pay dividend. Relating TRIO’s share price as of recording date in May 11th, 2011, which was Rp 750/share and its dividend per share, produce dividend yield of 2.0% for its shareholders.
Figure 10: Chronology of TRIO’s Dividend
Source: PT Trikomsel Oke Tbk. Pefindo Equity & Index Valuation Division
Healthier Financial Condition
TRIO’s total assets in 3Q2011 is Rp 3.4 trillion, reflect a 49.8% YtD increases from December 31st, 2010 figures. It was due to the increase of TRIO’s current asset, especially its account receivable. It is in line with TRIO’s sales growth in the same periods.
During 3Q2011 TRIO has obtained short-term loan from several national commercial bank and foreign bank to back up its working capital. With the additional loan, TRIO’s total liabilities in this periods up by 61.3% YtD to Rp 2.5 trillion from Rp 1.5 trillion in December 31st, 2010. Debt to equity ratio (DER) is 2.5x and interest bearing debt to equity ratio is 3.3x. While, its equity in 3Q2011 increased by 17.1% YtD to Rp 1.0 trillion caused by the increase in retained earnings as the effect of net income increase. For 2011, we estimate
TRIO’s total liabilities will grow by 58.1% YoY to Rp 2.4 trillion, while its equity will grow by 24.2% YoY to Rp 1.06 trillion.
“Disclaimer statement in the last page
is an integral part of this report”
www.pefindo.com
Trikomsel Oke, Tbk
January 20th, 2012 Page 10 of 15 pages
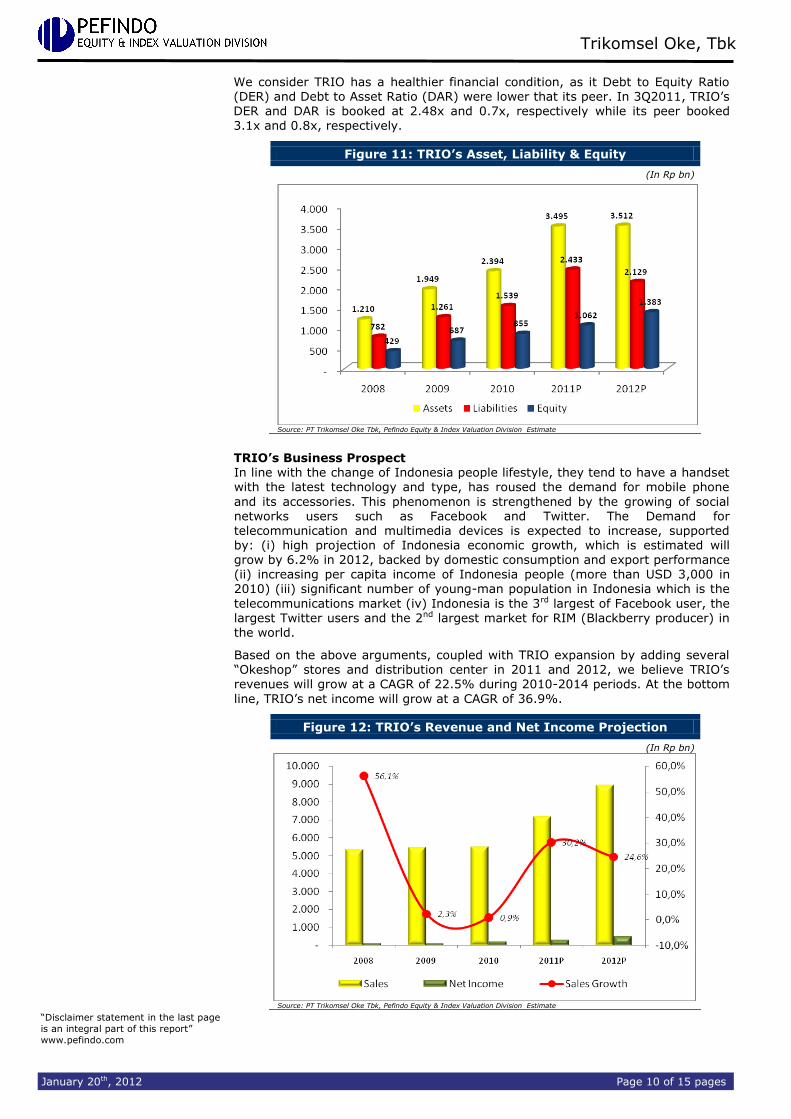
We consider TRIO has a healthier financial condition, as it Debt to Equity Ratio (DER) and Debt to Asset Ratio (DAR) were lower that its peer. In 3Q2011, TRIO’s DER and DAR is booked at 2.48x and 0.7x, respectively while its peer booked
3.1x and 0.8x, respectively.
Figure 11: TRIO’s Asset, Liability & Equity
(In Rp bn)
Source: PT Trikomsel Oke Tbk, Pefindo Equity & Index Valuation Division Estimate
TRIO’s Business Prospect In line with the change of Indonesia people lifestyle, they tend to have a handset with the latest technology and type, has roused the demand for mobile phone
and its accessories. This phenomenon is strengthened by the growing of social networks users such as Facebook and Twitter. The Demand for telecommunication and multimedia devices is expected to increase, supported by: (i) high projection of Indonesia economic growth, which is estimated will grow by 6.2% in 2012, backed by domestic consumption and export performance (ii) increasing per capita income of Indonesia people (more than USD 3,000 in 2010) (iii) significant number of young-man population in Indonesia which is the
telecommunications market (iv) Indonesia is the 3rd largest of Facebook user, the largest Twitter users and the 2nd largest market for RIM (Blackberry producer) in the world.
Based on the above arguments, coupled with TRIO expansion by adding several “Okeshop” stores and distribution center in 2011 and 2012, we believe TRIO’s revenues will grow at a CAGR of 22.5% during 2010-2014 periods. At the bottom
line, TRIO’s net income will grow at a CAGR of 36.9%.
Figure 12: TRIO’s Revenue and Net Income Projection
(In Rp bn)
Source: PT Trikomsel Oke Tbk, Pefindo Equity & Index Valuation Division Estimate

“Disclaimer statement in the last page
is an integral part of this report”
www.pefindo.com
Trikomsel Oke, Tbk
January 20th, 2012 Page 11 of 15 pages
Table 4: SWOT Analysis
Strengths Weaknesses
Has a large distribution network spread over all provinces in Indonesia
Has a good networking with well-known telecommunication devices’s manufacturers
TRIO act as distributor as well as retailer, which will cater wider market
Consistently share information to public
If TRIO lagged in responding market trend, the customers will move to competitors easily
Opportunities Threats
Better economic condition High Population (Indonesia is the 4th
biggest population in the world) Increase of per capita income
High competition in retail industry, especially from independent retailers
Principal can teminate its long-term contract
Table 5: Industry Comparison 9M2011
TRIO SKYB Average
Sales [Rp bn] 5,344 1,265
Gross Profit [Rp bn] 708 79
Operating Profit [Rp bn] 440 34
Net Profit [Rp bn] 213 32
Total Asset [Rp bn] 3,484 763
Total Liabilities [Rp bn] 2,482 578
Total Equity [Rp bn] 1,001 185
Growth [YoY]
Sales [%] 39.92 305.45
Gross Profit [%] 32.67 157.98
Operating Profit [%] 39.01 293.02
Net Profit [%] 35.66 446.88
Profitability 9M11
Gross Margin [%] 13.25 6.26 9.75
Operating Margin [%] 8.23 2.67 5.45
Net Margin [%] 4.00 2.49 3.24
ROA [%] 6.11 4.13 5.12
ROE [%] 21.26 17.03 19.14
Leverage 9M2011
DER [x] 2.48 3.12 2.80
Source:PT Trikomsel Oke Tbk., PT Skybee Tbk, Pefindo Equity & Index Valuation Division
SWOT ANALYSIS
INDUSTRY COMPARISON

“Disclaimer statement in the last page
is an integral part of this report”
www.pefindo.com
Trikomsel Oke, Tbk
January 20th, 2012 Page 12 of 15 pages
VALUATION
Methodology
We apply Discounted Cash Flow (DCF) method as the main valuation approach considering the income growth is a value driver in TRIO instead of asset growth.
Furthermore, we also apply Guideline Company Method (GCM) as comparison method. This valuation is based on 100% shares price as of January 19th, 2012, using TRIO’s financial report as of September 30th, 2011, for our fundamental analysis.
Value Estimation
We use Cost of Capital of 9.7% and Cost of Equity of 10.8% based on the following assumptions: Table 6: Assumption
Risk free rate [%]* 5.6
Risk premium [%]* 8.8
Beta [x]* 0.6
Cost of Equity [%] 10.8
Marginal tax rate [%] 25.0
Debt to Equity Ratio 2.3
WACC (%) 9.7
Source: Bloomberg, Pefindo Equity & Index Valuation Division Estimates Notes: * As of January 19
th, 2012
Target price for 12 months based on valuation as per January 19th, 2012 is as follows:
Using DCF method with discount rate assumption 9.7% is Rp 1,200 –
Rp 1,390 per share. Using GCM method (PBV 3.8X and P/E 14.6X) is Rp 910- Rp 990 per share.
In order to obtain a value which represents both value indications, we have weighted both DCF and GCM methods by 70%:30%. Based on the above calculation, target price of TRIO for 12 month is Rp 1,120- Rp 1,270 per share.
Table 7: Summary of DCF Method Valuation
Conservative Moderate Aggressive
PV of Free Cash Flows [Rp bn] 1,995 2,100 2,205
PV Terminal Value [Rp bn] 5,631 5,927 6,223
Non-Operating Asset [Rp bn] 88 88 88
Net Debt [Rp bn] (2,317) (2,317) (2,317)
Total Equity Value [Rp bn] 5,396 5,797 6,198
Number of Share [mn shares] 4,450 4,450 4,450
Fair Value per Share [Rp] 1,200 1,300 1,390
Source: Pefindo Equity & Index Valuation Division Estimates
TARGET PRICE

“Disclaimer statement in the last page
is an integral part of this report”
www.pefindo.com
Trikomsel Oke, Tbk
January 20th, 2012 Page 13 of 15 pages
Table 8: GCM Comparison
TRIO
Valuation, January 19th, 2012
P/E, [x] 14.6
P/BV, [x] 3.8
Source: Bloomberg, Pefindo Equity & Index Valuation Division Estimates
Table 9: Summary of GCM Method Valuation
Multiples (x)
Est. EPS (Rp)
Est. BV/Share (Rp)
Value (Rp)
P/BV 3.8 - 239 910 P/E 14.6 68 - 990
Source: Bloomberg, Pefindo Equity & Index Valuation Division Estimates
Table 10: Fair Value Reconciliation Fair Value per Share [Rp]
DCF GCM Average
Upper limit 1,390 990 1,270
Bottom limit 1,200 910 1,120
Weight 70% 30%
Source: Pefindo Equity & Index Valuation Division Estimates

“Disclaimer statement in the last page
is an integral part of this report”
www.pefindo.com
Trikomsel Oke, Tbk
January 20th, 2012 Page 14 of 15 pages
Table 11: Income Statement
(Rp bn)
Income Statement 2008 2009 2010 2011P 2012P
Sales 5,340 5,463 5,511 7,178 8,940
COGS (4,901) (4,899) (4,802) (6,257) (7,763)
Gross Profit 439 564 709 921 1,177
Operating Expense (233) (289) (299) (369) (423)
Operating Profit 206 275 410 552 755
Other Income
(Charges) (59) (111) (133) (152) (133)
Pre-tax Profit 148 164 277 401 623
Tax (45) (46) (76) (100) (156)
Net Profit 103 118 202 301 467
Source: PT Trikomsel Oke Tbk., Pefindo Equity & Index Valuation Division Estimates
Table 12: Balance Sheet
(Rp bn)
Balance Sheet 2008 2009 2010 2011P 2012P
Assets
Current Assets
Cash & cash
equivalents 212 90 80 92 98
Receivables 146 319 594 1,057 1,043
Inventory 467 573 558 630 782
Other Assets 274 780 1,022 1,610 1,487
Total Current Assets 1,099 1,762 2,254 3,389 3,410
Fixed Assets 33 41 78 82 77
Other Assets 78 146 62 24 25
Total Assets 1,210 1,949 2,394 3,495 3,512
Liabilities
Trade payables 45 207 98 178 199
Short-term payables 697 1,014 1,398 2,189 1,858
Other Short-term
payables 33 32 32 55 60
Long-term payables 0.5 0 0.3 0.1 0
Other long-term
payables 6 8 11 11 12
Total Liabilities 782 1,261 1,539 2,433 2,129
Total Equity 429 687 855 1,062 1,383
Source: PT Trikomsel Oke Tbk., Pefindo Equity & Index Valuation Division Estimates
Figure 13: Historical P/E and P/BV
Figure 14: Historical ROA, ROE and Total Asset Turnover
Table 13: Key Ratio
Ratio 2008 2009 2010 2011P 2012P
Growth (%)
Sales n.a 2.3 0.9 30.2 24.6
Operating Profit n.a 33.3 49.0 34.7 36.7
EBITDA n.a 31.7 47.0 27.1 41.0
Net Profit n.a 14.7 71.3 49.1 55.4
Profitability (%)
Gross Margin 8.2 10.3 12.9 12.8 13.2
Operating Margin 3.9 5.0 7.4 7.7 8.4
EBITDA Margin 3.8 4.9 7.2 7.7 8.6
Net Margin 1.9 2.1 3.7 4.1 5.2
ROA 8.5 6.0 8.4 8.6 13.3
ROE 23.9 17.1 23.6 28.3 33.77
Solvability (X)
Debt to Equity 1.8 1.8 1.8 2.3 1.5
Debt to Asset 0.6 0.6 0.6 2.1 1.3
Liquidity (X)
Current Ratio 1.4 1.4 1.5 1.4 1.6
Quick Ratio 0.5 0.3 0.4 0.6 0.6
Source: PT Trikomsel Oke Tbk., Pefindo Equity & Index Valuation Division Estimates

“Disclaimer statement in the last page
is an integral part of this report”
www.pefindo.com
Trikomsel Oke, Tbk
January 20th, 2012 Page 15 of 15 pages
DISCLAIMER
This report was prepared based on the trusted and reliable sources. Nevertheless, we do not guarantee its completeness, accuracy and adequacy. Therefore we do not responsible of any investment decision making based on this report. As for any assumptions, opinions and predictions were solely our internal judgments as per reporting date, and those judgments are subject to change without further notice. We do not responsible for mistake and negligence occurred by using this report. Last performance could not always be used as reference for future outcome. This report is not an offering recommendation, purchase or holds particular shares. This report might not be suitable for some investors. All opinion in this report has been presented fairly as per issuing date with good intentions; however it could be change at any time without further notice. The price, value or income from each share of the Company stated in this report might lower than the investor expectation and investor might obtain lower return than the invested amount. Investment is defined as the probable income that will be received in the future; nonetheless such return may possibly fluctuate. As for the Company which its share is denominated other than Rupiah, the foreign exchange fluctuation may reduce the value, price or investor investment return. This report does not contain any information for tax consideration in investment decision making. The share price target in this report is a fundamental value, not a fair market value nor a transaction price reference required by the regulations. The share price target issued by Pefindo Equity & Index Valuation Division is not a recommendation to buy, sell or hold particular shares and it could not be considered as an investment advice from Pefindo Equity & Index Valuation Division as its scope of service to, or in relation to some parties, including listed companies, financial advisor, broker, investment bank, financial institution and intermediary, in correlation with receiving rewards or any other benefits from that parties. This report is not intended for particular investor and cannot be used as part of investment objective on particular shares and neither an investment recommendation on particular shares or an investment strategy. We strongly recommended investor to consider the suitable situation and condition at first before making decision in relation with the figure in this report. If it is necessary, kindly contact your financial advisor. PEFINDO keeps the activities of Equity Valuation separate from Ratings to preserve independence and objectivity of its analytical processes and products. PEFINDO has established policies and procedures to maintain the confidentiality of certain non-public information received in connection with each analytical process. The entire process, methodology and the database used in the preparation of the Reference Share Price Target Report as a whole is different from the processes, methodologies and databases used PEFINDO in doing the rating. This report was prepared and composed by Pefindo Equity & Index Valuation Division with the objective to
enhance shares price transparency of listed companies in Indonesia Stock Exchange (IDX). This report is also free of other party’s influence, pressure or force either from IDX or the listed company which reviewed by Pefindo Equity & Index Valuation Division. Pefindo Equity & Index Valuation Division will earn reward amounting to Rp 20 mn each from IDX and the reviewed company for issuing report twice per year. For further information, please visit our website at http://www.pefindo.com This report is prepared and composed by Pefindo Equity & Index Valuation Division. In Indonesia, this report is published in our website and in IDX website.