Embed Size (px)
Citation preview

© 2012 Noyce Foundation
Performance Assessment Task Suzi’s Company
Grade 7 task aligns in part to CCSSM HS Statistics & Probability The task challenges a student to demonstrate understanding of the concepts of statistical methods used to display, analyze, compare, and interpret data. A student must make sense of the shape of the data distribution, including finding measures of center and spread. A student must be able to give a mathematical justification and argument for the use of one measure of center or spread to best support a particular stance, be it political or economic.
Common Core State Standards Math ‐ Content Standards High School – Statistics and Probability – Interpreting Categorical and Quantitative Data Summarize, represent, and interpret data on a single count or measurement variable. S‐ID.1 Represent data with plots on the real number line (dot plots, histograms, and box plots). S‐ID.2 Use statistics appropriate to the shape of the data distribution to compare center (median, mean) and spread (interquartile range, standard deviation) of two or more different data sets.
Common Core State Standards Math – Standards of Mathematical Practice MP.2 Reason abstractly and quantitatively.Mathematically proficient students make sense of quantities and their relationships in problem situations. They bring two complementary abilities to bear on problems involving quantitative relationships: the ability to decontextualize—to abstract a given situation and represent it symbolically and manipulate the representing symbols as if they have a life of their own, without necessarily attending to their referents—and the ability to contextualize, to pause as needed during the manipulation process in order to probe into the referents for the symbols involved. Quantitative reasoning entails habits of creating a coherent representation of the problem at hand; considering the units involved; attending to the meaning of quantities, not just how to compute them; and knowing and flexibly using different properties of operations and objects. MP.3 Construct viable arguments and critique the reasoning of others. Mathematically proficient students understand and use stated assumptions, definitions, and previously established results in constructing arguments. They make conjectures and build a logical progression of statements to explore the truth of their conjectures. They are able to analyze situations by breaking them into cases, and can recognize and use counterexamples. They justify their conclusions, communicate them to others, and respond to the arguments of others. They reason inductively about data, making plausible arguments that take into account the context from which the data arose. Mathematically proficient students are also able to compare the effectiveness of two plausible arguments, distinguish correct logic or reasoning from that which is flawed, and—if there is a flaw in an argument—explain what it is. Elementary students can construct arguments using concrete referents such as objects, drawings, diagrams, and actions. Such arguments can make sense and be correct, even though they are not generalized or made formal until later grades. Later, students learn to determine domains to which an argument applies. Students at all grades can listen or read the arguments of others, decide whether they make sense, and ask useful questions to clarify or improve the arguments.
Assessment Results This task was developed by the Mathematics Assessment Resource Service and administered as part of a national, normed math assessment. For comparison purposes, teachers may be interested in the results of the national assessment, including the total points possible for the task, the number of core points, and the percent of students that scored at standard on the task. Related materials, including the scoring rubric, student work, and discussions of student understandings and misconceptions on the task, are included in the task packet. Grade Level Year Total Points Core Points % At Standard
7 2007 10 5 46 %
Copyright © 2007 by Mathematics Assessment Page 19 Suzi’s Company Test 7 Resource Service. All rights reserved.
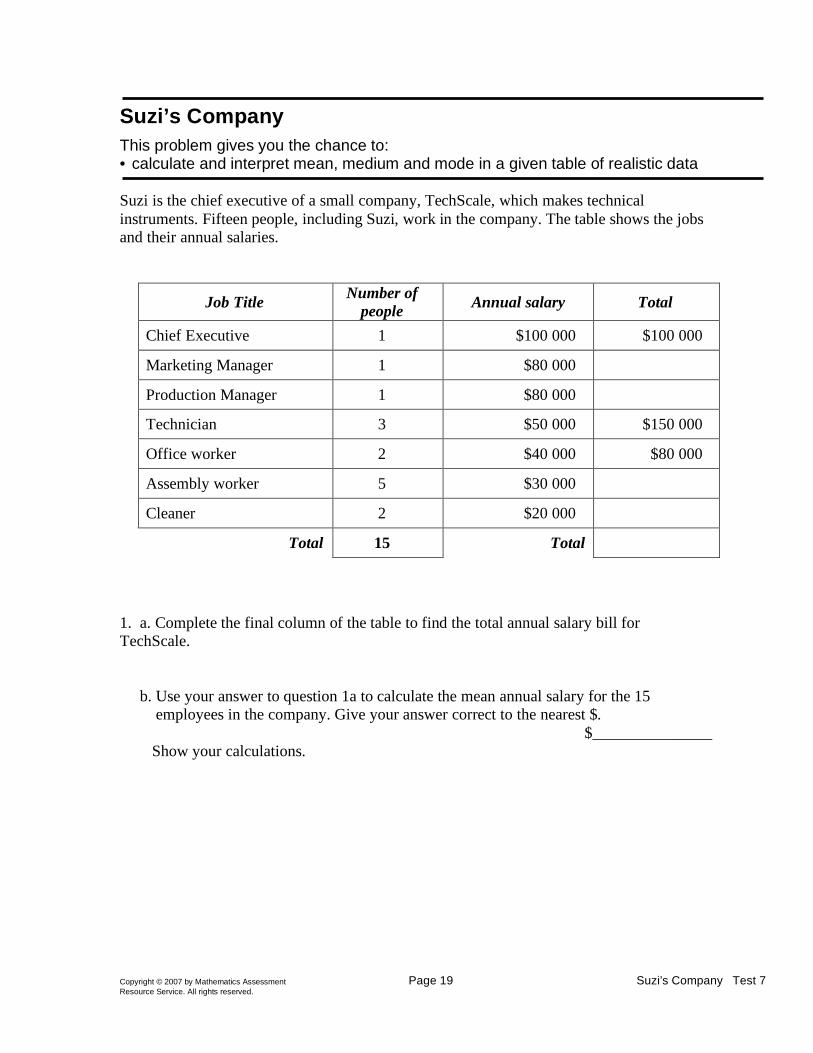
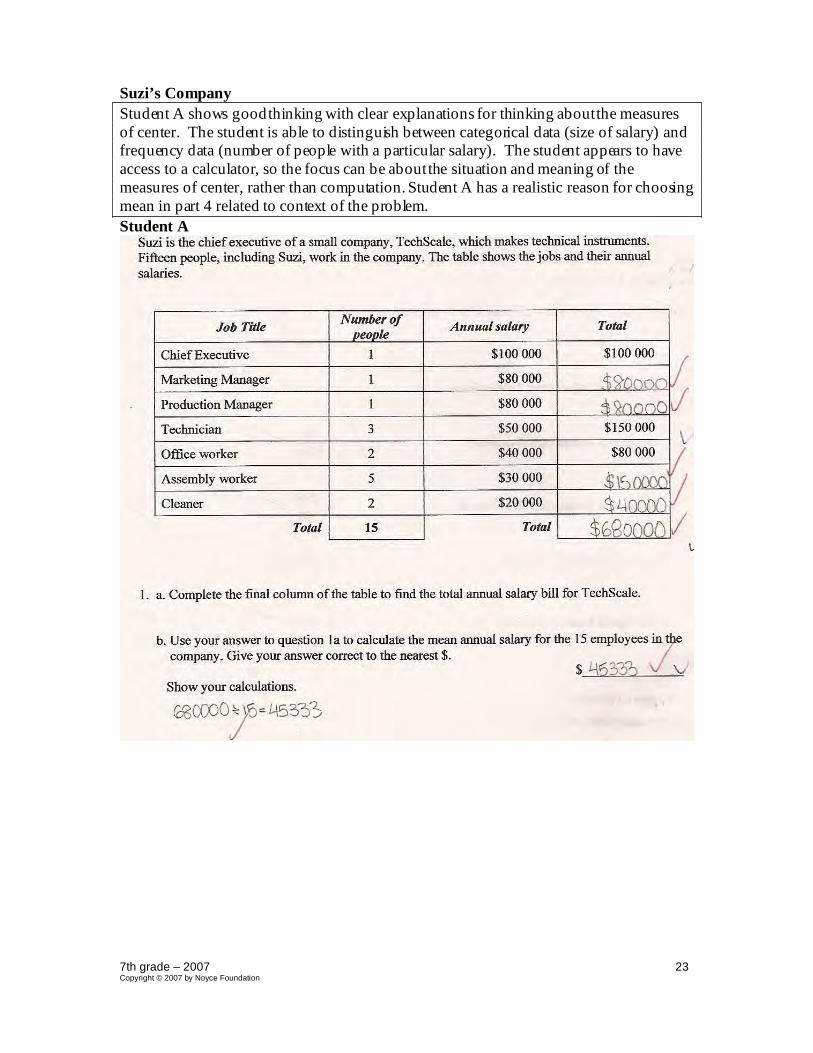
Suzi’s Company This problem gives you the chance to: • calculate and interpret mean, medium and mode in a given table of realistic data Suzi is the chief executive of a small company, TechScale, which makes technical instruments. Fifteen people, including Suzi, work in the company. The table shows the jobs and their annual salaries.
Job Title Number of people Annual salary Total
Chief Executive 1 $100 000 $100 000
Marketing Manager 1 $80 000
Production Manager 1 $80 000
Technician 3 $50 000 $150 000
Office worker 2 $40 000 $80 000
Assembly worker 5 $30 000
Cleaner 2 $20 000
Total 15 Total 1. a. Complete the final column of the table to find the total annual salary bill for TechScale.
b. Use your answer to question 1a to calculate the mean annual salary for the 15
employees in the company. Give your answer correct to the nearest $. $_______________
Show your calculations.

Copyright © 2007 by Mathematics Assessment Page 20 Suzi’s Company Test 7 Resource Service. All rights reserved.
2. John looks at the table and says, “The mode of the salary at TechScale is eighty thousand dollars a year.”
a. What mistake has John made?
b. What is the correct mode of the salary?
3. a. What is the median annual salary at TechScale?
b. Explain how you figured it out.
4. Which of the three averages, mean, median or mode, would you use to show that the average
wage at TechScale is very good?
Explain your answer.
5. Last year, TechScale did not do very well so Suzi decided not to pay herself any salary for a year.
Which of the averages (mean, median and mode) will not change?
10
Copyright © 2007 by Mathematics Assessment Page 21 Suzi’s Company Test 7 Resource Service. All rights reserved.
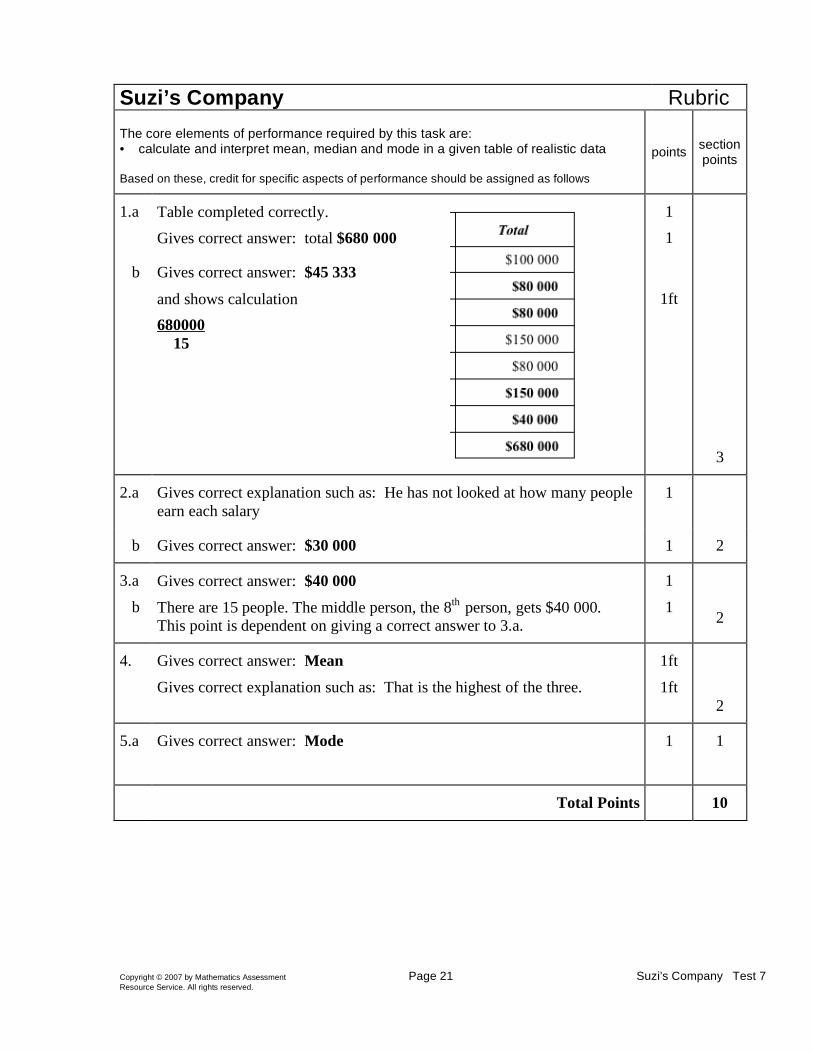
Suzi’s Company Rubric The core elements of performance required by this task are: • calculate and interpret mean, median and mode in a given table of realistic data Based on these, credit for specific aspects of performance should be assigned as follows
points section points
1.a Table completed correctly. Gives correct answer: total $680 000
1 1
b Gives correct answer: $45 333 and shows calculation 680000 15
1ft
3
2.a Gives correct explanation such as: He has not looked at how many people earn each salary
1
b Gives correct answer: $30 000 1 2
3.a b
Gives correct answer: $40 000 There are 15 people. The middle person, the 8th person, gets $40 000. This point is dependent on giving a correct answer to 3.a.
1 1
2
4. Gives correct answer: Mean Gives correct explanation such as: That is the highest of the three.
1ft 1ft
2
5.a Gives correct answer: Mode 1 1
Total Points 10
7th grade – 2007 22Copyright © 2007 by Noyce Foundation
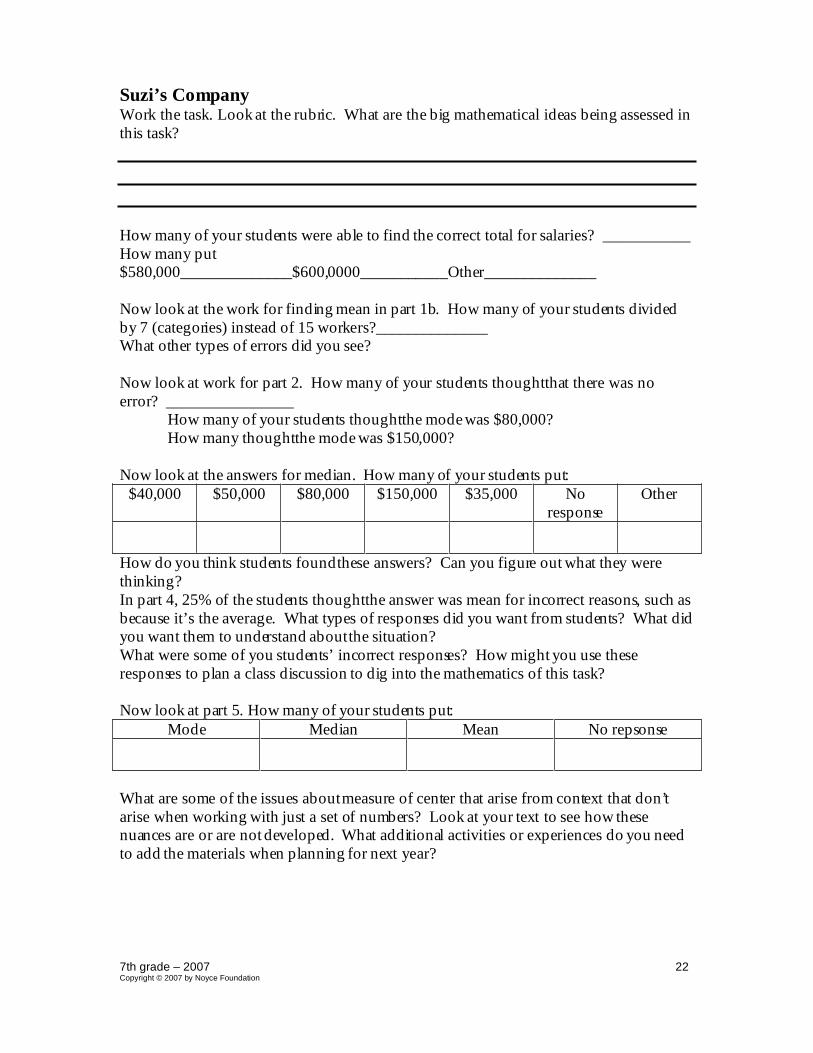
Suzi’ s C ompanyWork the task. L ook at the rubric. What are thebig mathematical ideas being assessed inthis task?
How many of your students were able to find thecorrect total for salaries? ___________How many put$580,000______________$600,0000___________Other______________
Now look at thework for findingmean in part 1b. How many of your students dividedby 7 (categories) instead of 15 workers?______________What other types of errors did you see?
Now look at work for part 2. How many of your students thoughtthat there was noerror? ________________
How many of your students thoughtthe modewas $80,000?How many thoughtthe modewas $150,000?
Now look at theanswers for median. How many of your students put:$40,000 $50,000 $80,000 $150,000 $35,000 No
responseOther
How do you think students foundthese answers? Can you figure outwhat they werethinking?In part 4, 25% of thestudents thoughtthe answer was mean for incorrect reasons, such asbecause it’ s the average. What types of responses did you want fromstudents? What didyou want them to understand aboutthe situation?What were some of you students’ incorrect responses? How mightyou use theseresponses to plan a class discussion to dig into themathematics of this task?
Now look at part 5. How many of your students put:Mode Median Mean No repsonse
What are some of the issues aboutmeasure of center that arise fromcontext that don’tarise when working with just a set of numbers? Look at your text to see how thesenuances are or are notdeveloped. What additional activities or experiences do you needto add the materials when planning for next year?
7th grade – 2007 23Copyright © 2007 by Noyce Foundation
Suzi’ s C ompanyStudent A shows goodthinkingwith clear explanations for thinking aboutthe measuresof center. The student is able to distinguish between categorical data (size of salary) andfrequency data (number of people with a particular salary) . Thestudent appears to haveaccess to a calculator, so the focus can beaboutthe situation and meaning of themeasures of center, rather than computation. Student A has a realistic reason for choosingmean in part 4 related to context of the problem.Student A
7th grade – 2007 24Copyright © 2007 by Noyce Foundation
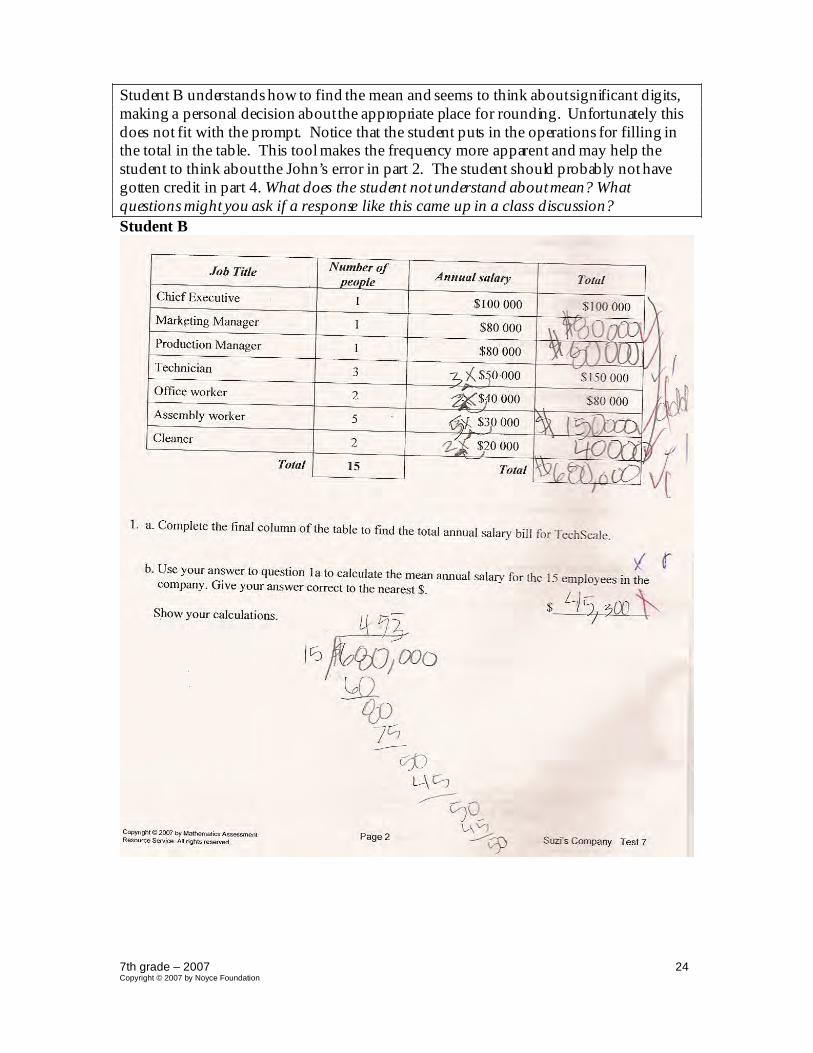
Student B understandshow to findthe mean andseems to think aboutsignificant digits,making a personal decision abouttheappropriate place for rounding. Unfortunately thisdoes notfit with theprompt. Notice that the student puts in the operations for filling inthe total in the table. This tool makes the frequency more apparentand may help thestudent to think aboutthe John’s error in part 2. The student should probably nothavegotten credit in part 4. What does the student notunderstand aboutmean? Whatquestions mightyou ask if a response like this came up in a class discussion?Student B

7th grade – 2007 25Copyright © 2007 by Noyce Foundation
Student B , par t 2

7th grade – 2007 26Copyright © 2007 by Noyce Foundation
Student C tries to groupnumbers to make the longaddition friendlier. Unfortunately, thestudent makes a slip in multiplying 150,000 by 2. The student also understands themathematics of findingmean in this context, butmakes a decimal error. Notice howthestudent makes an effective use of the table to findmedian and make sense of frequency.Student C shows a common misconception in part 4 that mean is the average. The studentis notthinkingaboutchoosing themeasure of center with greatest magnitude.Student C

7th grade – 2007 27Copyright © 2007 by Noyce Foundation
Student C , par t 2
Student D correctly computes the average, butdoes notthink aboutsignificant digits.The student gives the calculation to the nearest cent. Student D does notsee theimportance of frequency for finding mode. Students needed to think about frequency ofeach type of salary rather than frequency of totals. In part 3, thestudent ignores thefrequency of each salary when findingmedian. The student knows a procedure butnothow to work that procedure in context. Does your current text provideenoughopportunity for students to grapple with ideas about measures of center in context or ismost of the instructional time spent practicing procedures with a list of numbers? Whyor howdoes context changethe thinking or understanding of themathematical ideas?Notice again the lack of understanding of mean in part 4.

7th grade – 2007 28Copyright © 2007 by Noyce Foundation
Student D

7th grade – 2007 29Copyright © 2007 by Noyce Foundation
Student E attempts to use a stem-and- leaf plot to find median. What are has the studentmade?Student E

7th grade – 2007 30Copyright © 2007 by Noyce Foundation
Student F madean additionerror in findingthe total on the chart, but then correctlycalculated a mean of $50,666. Notice that thestudent has correct reasoning for howtopick between the 3 measures of centers, butcan’t identify the onewith the largest value.This student has madeanother commonerror in finding median using the totals for eachcategory rather than a median of thesalaries.Student F

7th grade – 2007 31Copyright © 2007 by Noyce Foundation
Student G is able to think abouttheneed to roundthe answer. Do you think the student isthinking aboutsignificant digits for comparison or is just used to roundingto the frontnumber? What question mightyou ask to probethe thinking? Thestudent has someunderstanding aboutthe importance of frequency and is able to explain John’s mistake.However the student lets go of that thinkingand just searches for most in part 2b. Noticethat the student has trouble with magnitudeof numbers. In part 4 thestudent wants thenumber “in between” butpicks the lowest number. What mightbesome next steps forthis student?Student G

7th grade – 2007 32Copyright © 2007 by Noyce Foundation
Student G , par t 2

7th grade – 2007 33Copyright © 2007 by Noyce Foundation
Student H seems to beconfused aboutthe meaningof table design. The student seems tobepicking up clues aboutdescending order andgives totals assembly worker and cleanerthat don’t make sense. Thestudent makes errors in addition. The student makes acommon error of dividingby 7 categories instead of 15 people to find themean. Thestudent makes significant computational errors. Notice that in part 4 the student gives aprocedure for calculating mean, rather than a contextual reason aboutwhich measure ofcenter would bemost beneficial. StudentH mightbenefit fromsome discussion thatwould help her confrontthe misconceptions aboutmeasure of center. The student seemsto be ready to think reasonably aboutthegrade level ideas on measure of center, butneeds tools such as a calculator to help with computation. In addition to regularinstruction on grade level topics, the student probably needs a secondclass to developnumber understanding andfluency.Student H

7th grade – 2007 34Copyright © 2007 by Noyce Foundation
Student H, par t 2

7th grade – 2007 35Copyright © 2007 by Noyce Foundation
7th G rade T ask 2 Suzi’ s C ompany
Student T ask Calculate and interpret mean, mediumand modein a given table ofrealistic data. Understand the importance of frequency in dealing withstatistical measures.
C ore I dea 5Statistics
Students deepen their understanding of statistical methods used todisplay, analyze, compare and interpret different data sets.
Analyze data, including findingmeasures of center and spreadpresented in a frequency distribution.
Mathematics of this task:Ability to reason and calculate measures of center in contextAbility to relate frequency to categorical values in a table and use frequency incomputationAbility to order numbers and judgeaccuracy based on understanding of placevalue
Based on teacher observations, this is what seventh graders knew and were able to do:Fill in the totals in the table.Choose the largest number in part 4Understand that deleting onesalary would notchangethe mode
Areas of difficulty for seventh graders:Understanding frequency in findingmodeDistinguishing between totals, categorical information, andfrequency to calculatemodeand median (relating between data sets for relevant information)Confusing mean as the only average (seeing computations as numbers rather thanan attempt to describea situation)
7th grade – 2007 36Copyright © 2007 by Noyce Foundation
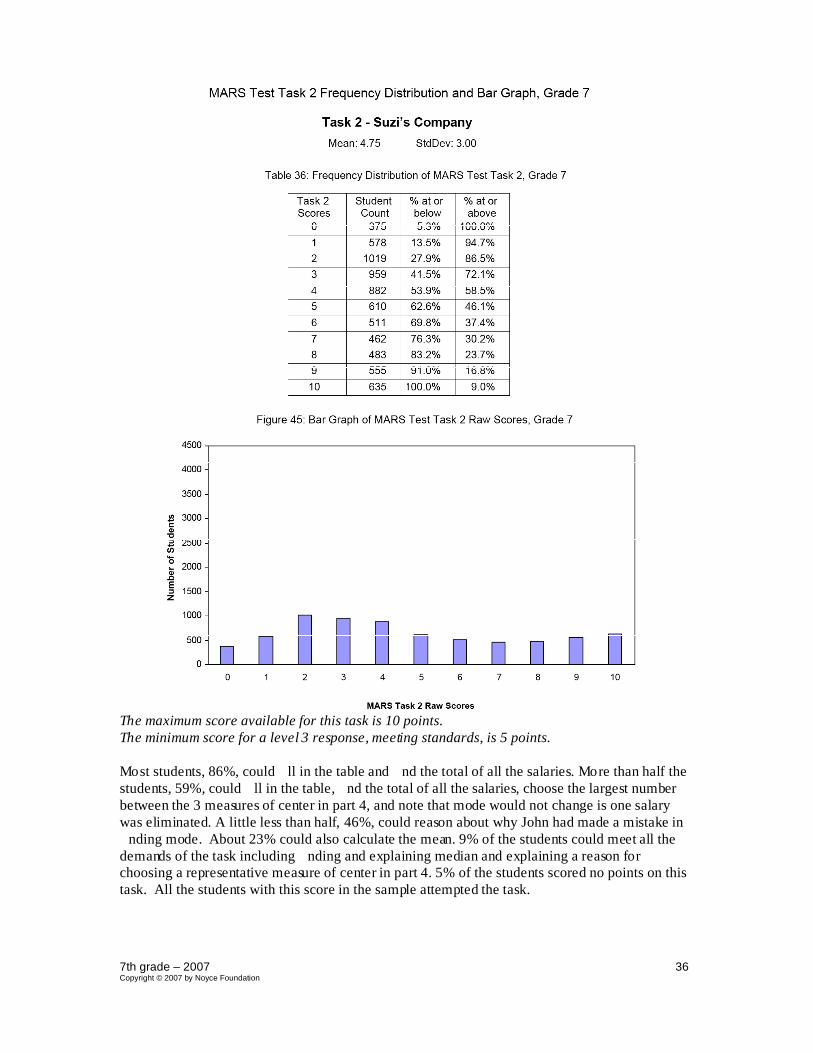
The maximum score available for this task is 10 points.The minimumscore for a level 3 response, meeting standards, is 5 points.
Most students, 86%, could �ll in the table and �nd the total of all the salaries. More than half thestudents, 59%, could �ll in the table, �nd the total of all the salaries, choose the largest numberbetween the 3 measures of center in part 4, and note that mode would not change is one salarywas eliminated. A little less than half, 46%, could reason about why John had made a mistake in�nding mode. About 23% could also calculate the mean. 9% of the students could meet all thedemands of the task including �nding and explaining median and explaining a reason forchoosing a representative measure of center in part 4. 5% of the students scored no points on thistask. All the students with this score in the sample attempted the task.

7th grade – 2007 37Copyright © 2007 by Noyce Foundation
Suzi’ s C ompanyPoints Unders tandings Misunderstandings
0 All the students in the samplewith this score attempted thetask.
Students did not understand how the table worked.Some students tried to make the totals havedescending values as they went through the table.Students also had trouble adding the totals.5% hada total of 580,000 and 4% had a total of 600,000.4% had totals over 1,000,000.
2 Students could �ll in the tableand add up all the salaries.
Students had di� culty thinking about whichmeasure wouldn’t change if one salary waseliminated. 15% of the students thought themedian wouldn’t change. 9% did not answer thispart of the task. Almost 7% thought the meanwould not change. 10% did not respond whenasked to pick a very good average. Many studentsdid not pick the largest of the 3 values.
4 Students could �ll in the table,�nd the total, recognize thelargest measure of center, anddetermine that mode would notchange.
Students had di� culty describing why John waswrong in �nding mode. 14% said that John did notmake an error. 7% did not attempt this part of thetask. Students also had di� culty �nding themode. 23.5% thought the mode was $80,000. 4%thought the mode was $150,000. Other commonresponses: $60,000; $35,000; and $100,000.
5 Students could �ll in the table,�nd the total, recognize thelargest measure of center, anddetermine that mode would notchange. Students could alsoeither explain John’s error in�nding mode or �nd the mode.
Students had di� culty calculating mean. Theymay have dividedby 7 categories rather than 15people (about 10%). About 8% roundedinappropriately or forgot to round. About 10%made signi�cant place value errors somewhere inpart 1. Students also struggled with mode. 20%thought the mode was $50,000. 17% thought themode was $80,000. Almost 6% thought the modewas $150,000.
8 Students could �ll in the table,�nd the total, recognize thelargest measure of center, anddetermine that mode would notchange.
Students had di� culty giving a correct reason forchoosing a measure of center in part 4. 25% saidthat the meanwas the average. This may haveincludedstatements about mean is how mucheveryone makes. Some thought mode because itsin the middle or the most accurate.
9 Students were equally dividedbetween errors intotal, errors in mean, and reasons for choice in part4.
10 Students could meetall thedemands of the task includingapplying data about frequency to�nd mean, median, and modeand justify calculations. Studentscould identify the largestmeasure of center and whichmeasure would not be changedby eliminating one salary.

7th grade – 2007 38Copyright © 2007 by Noyce Foundation
I mplications for I nstructionStudents need more practice using data from tables and workingwith data in a context.Students are used to finding statistics froma given set up numbers withoutthinking aboutthe meaning attached to thenumbers. The issue of a category versus a frequency or scaledoesn’t arise in workingwith stringsof numbers. Too frequently students deal with sucha small amountof data that the measures of center seem trivial. They need to beexposedto contexts where different measures make sense for different types of decisions ordifferent points of view. They need to see how themeasures help make sense of theinformation. (For similar problems, see MARS 2001 5th gradeWashington Street and 7th
2005 Ducklings).Action R esear ch – T he R ole of C ontext – I nvestigating DifferentR epresentationsTry planninga lesson to help students compare and contrast various representations fordata. Start with a simple mind set by giving students a set of numbers and asking them tofind mean, median, and mode. This checks that everyonehas a basic understanding ofthe procedures for calculating these measures.
Now have them work the tasks: 2007 6th gradeHousehold Statistics and 7th gradeSuzi’ sCompany. For each task just give students just thetable or thegraphandask them toagain find themean, median, andmode. Graphpaper should beavailable for students.
Now we want to explore their thinkingaboutinformation in these two representations.Start with Household Statistics. Pose a question for class discussion, such as:
L ettie says,” I think theequation would for mean would be”:0 +1+ 2 + 3+ 4 + 5
6
Her partner, Nadia disagrees. Nadia thinks the solutions is:1+ 5 + 8 + 4 +1+1
20
Mary says I think neither of these is correct. I think we’ re forgettingsomething.Can you help them solve this? Give reasons for your answers.
During the discussion probestudent thinking to explore why L ettie and Nadia are wrong.I f students seem stuck ask them if they can write out the stringof data numbers beingrepresented by the graph. See if they can start to talk aboutfrequency versus data. Havethem talk abouthow to use the graphfor findingmodeand median. Try to have a studentcome to the board to show how he or she counted to findthe median.
When they are finished, have them look at the table for Suzi’ s company. Ask them howthey mightputthe informationaboutHousehold Statistics into a table. What would thatlook like? Where are thedata points? Where is the frequency in their tables?
7th grade – 2007 39Copyright © 2007 by Noyce Foundation
Now pose a question aboutSuzi’ s Company. For example:
L ydia says the mean is $30,000. B ruce says that the mean is $97,142. How can theiranswers beso far apart? What doyou think they are doing? They both started with totalsof $680,000. Who doyou think is right? Convince me.
See if students relate this information to the ideas that came up in the discussion forHousehold Statistics. Are they mentioningthe difference between categories and totalnumber of households?
Next you mightpose a question, such as that on part 2 of theoriginal task. Johnlooks atthe table and says, “Themodeof the salary is eighty thousand dollars a year. Whatmistake has Johnmade?”
When the class discussion is over, maybe even a day or two later, give students red pensand asked them to revise their work and write about the ideas they have learned. Whydid they choose to changetheir answers based on new ideas or ways of thinking fromtheclassroomdiscussion. What are thingsyou have to consider when lookingat a table orgraph that is different from lookingat a list of data?