Embed Size (px)
Citation preview
Perfusion MRI: Perfusion MRI: Perfusion MRI: Perfusion MRI:
Technical AspectsTechnical AspectsTechnical AspectsTechnical Aspects
2009 Lecture
장건호
경희대학교 영상의학과
Objectives
• 관류영상 방법의 원리를 이해.
– 1. DCE perfusion MRI
– 2. DSC perfusion MRI
– 3. ASL perfusion MRI
2009 Lecture
– 3. ASL perfusion MRI
• 관류영상 방법의 최신 동향을 이해.
Contents
• Perfusion(관류) MRI
– Exogenous
• Dynamic Contrast Enhanced (DCE, bolus
passage)
2009 Lecture
passage)
• Dynamic Susceptibility Contrast (DSC, bolus
tracking)
– Endogenous
• Arterial spin labeling (ASL)
Abbreviations
• BBB: blood- brain barrier
• SI: signal intensity
• T1W: T1- weighted (T1WI, imaging)
2009 Lecture
• T2*W: T2*- weighted (T2*WI, imaging)
• EPI: echo planar imaging
• EES: extravascular- extracullular space
• AIF: Arterial input function
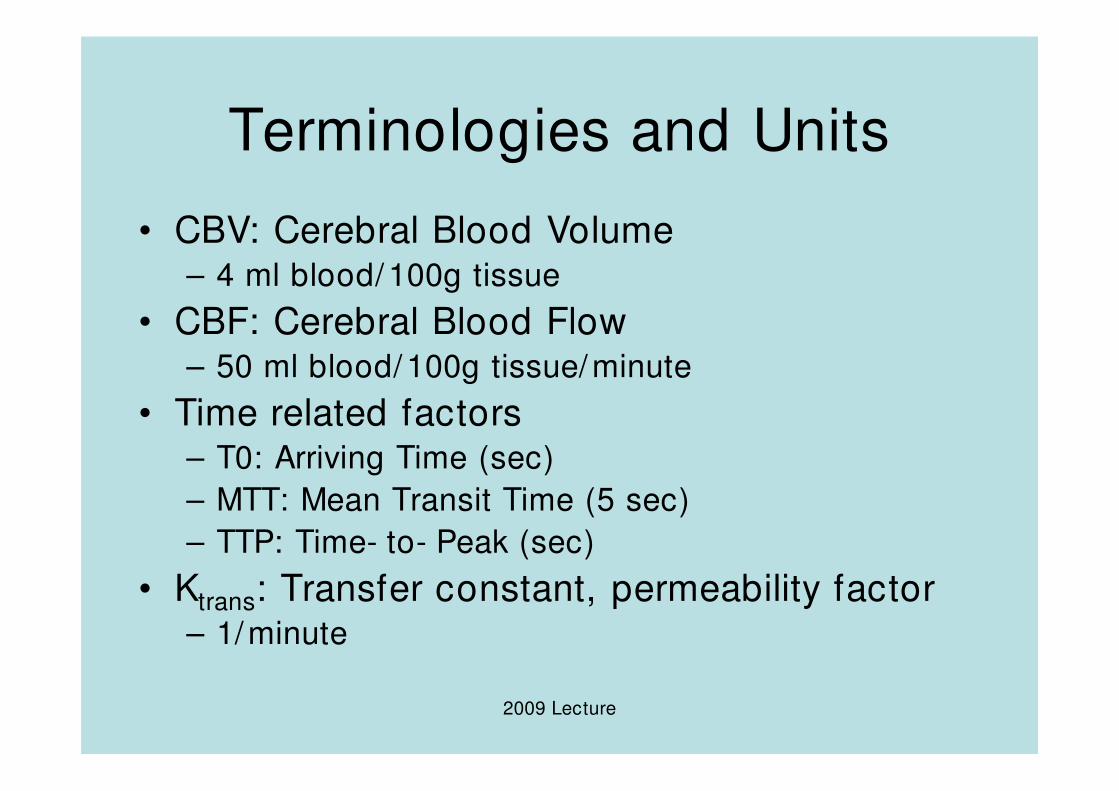
Terminologies and Units
• CBV: Cerebral Blood Volume– 4 ml blood/100g tissue
• CBF: Cerebral Blood Flow– 50 ml blood/100g tissue/minute
• Time related factors
2009 Lecture
• Time related factors– T0: Arriving Time (sec)
– MTT: Mean Transit Time (5 sec)
– TTP: Time- to- Peak (sec)
• Ktrans: Transfer constant, permeability factor– 1/minute
1. DCE Perfusion MRI
• Exogenous
• Sequences– 2D Dynamic T1W MRI
– 3D Dynamic T1W MRI
• Applications
2009 Lecture
• Applications– Breast
– Prostate
– Pelvic
– Muscle
– Brain
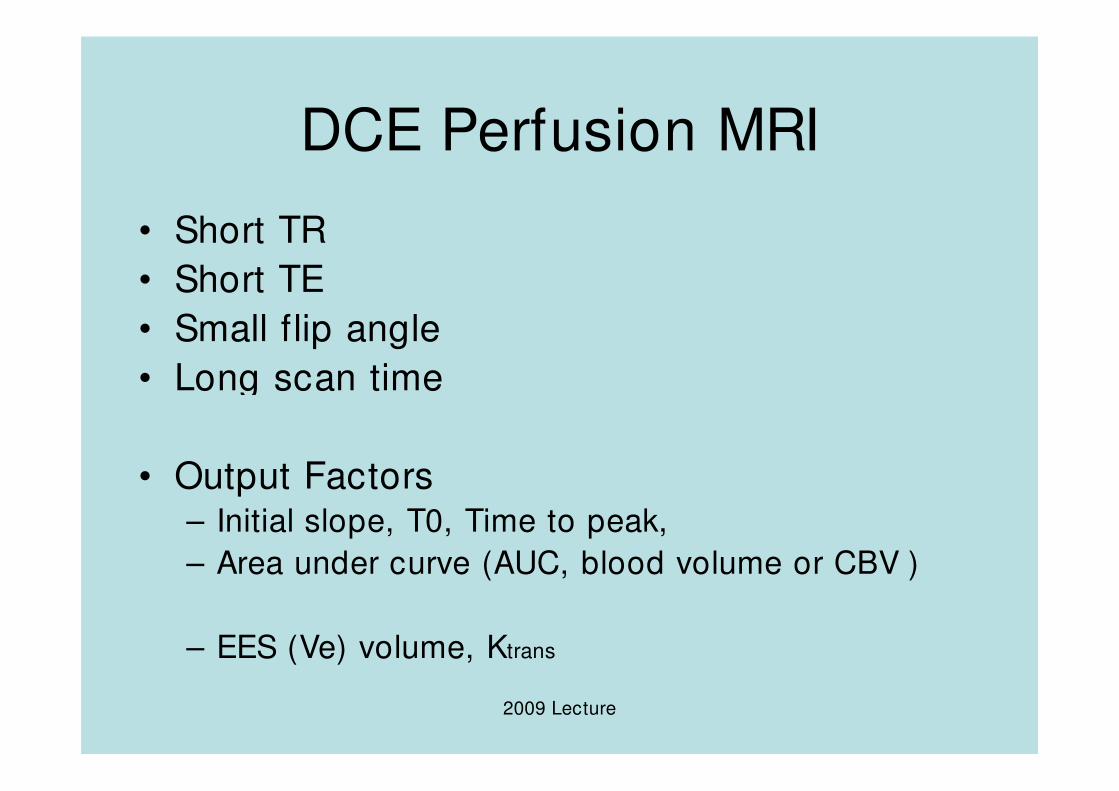
DCE Perfusion MRI
• Short TR
• Short TE
• Small flip angle
• Long scan time
2009 Lecture
• Output Factors– Initial slope, T0, Time to peak,
– Area under curve (AUC, blood volume or CBV )
– EES (Ve) volume, Ktrans
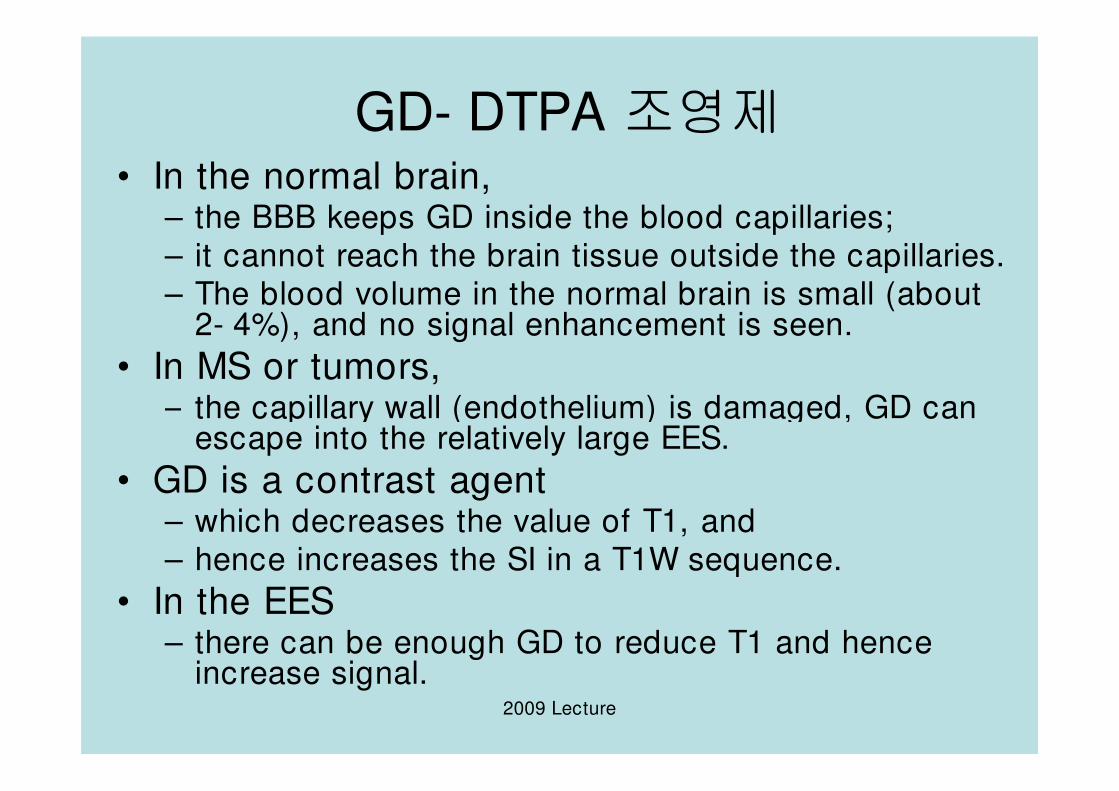
GD- DTPA 조영제
• In the normal brain, – the BBB keeps GD inside the blood capillaries;
– it cannot reach the brain tissue outside the capillaries.
– The blood volume in the normal brain is small (about 2- 4%), and no signal enhancement is seen.
• In MS or tumors, – the capillary wall (endothelium) is damaged, GD can
2009 Lecture
– the capillary wall (endothelium) is damaged, GD can escape into the relatively large EES.
• GD is a contrast agent – which decreases the value of T1, and
– hence increases the SI in a T1W sequence.
• In the EES – there can be enough GD to reduce T1 and hence
increase signal.
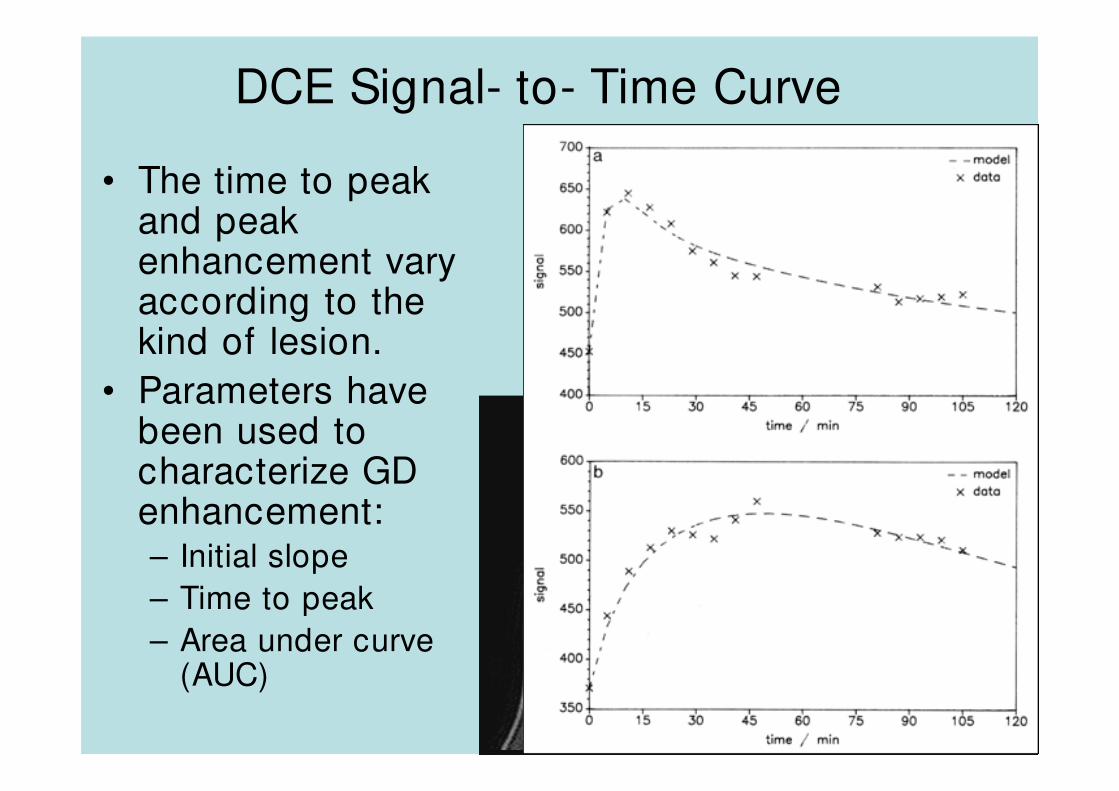
DCE Signal- to- Time Curve
• The time to peak and peak enhancement vary according to the kind of lesion.
• Parameters have
2009 Lecture
• Parameters have been used to characterize GD enhancement:– Initial slope
– Time to peak
– Area under curve (AUC)
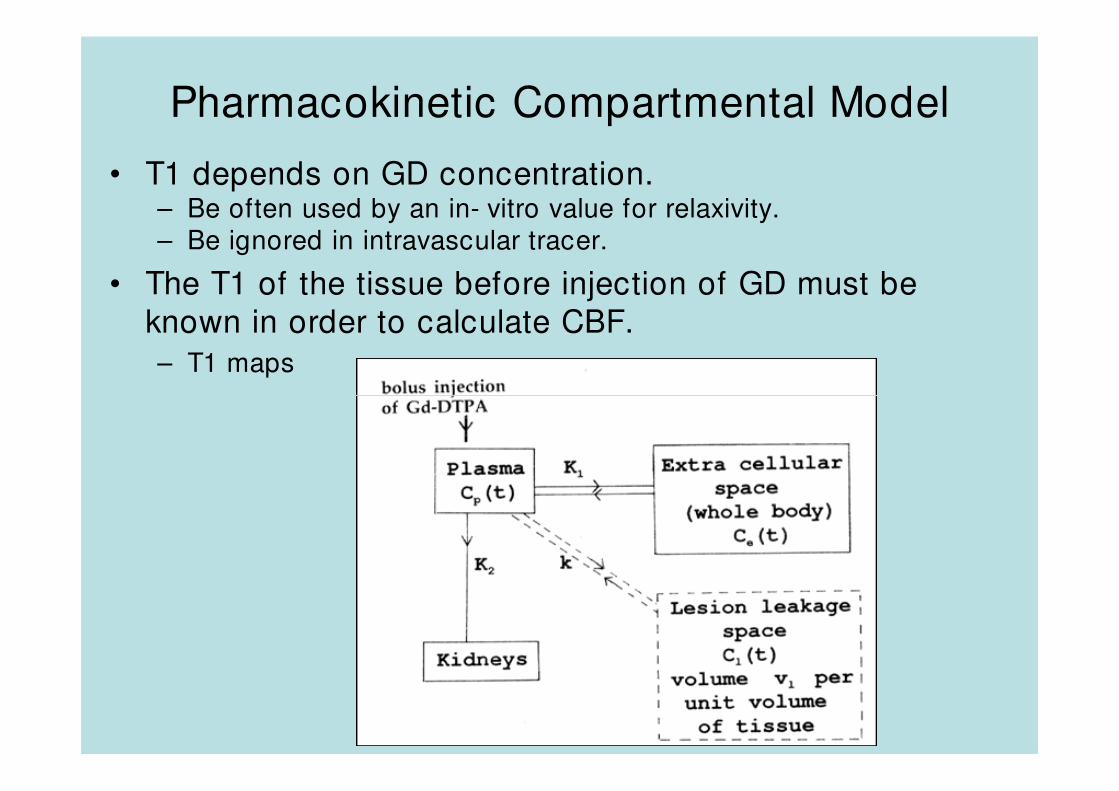
Pharmacokinetic Compartmental Model
• T1 depends on GD concentration.– Be often used by an in- vitro value for relaxivity.– Be ignored in intravascular tracer.
• The T1 of the tissue before injection of GD must be
known in order to calculate CBF.
– T1 maps
2009 Lecture
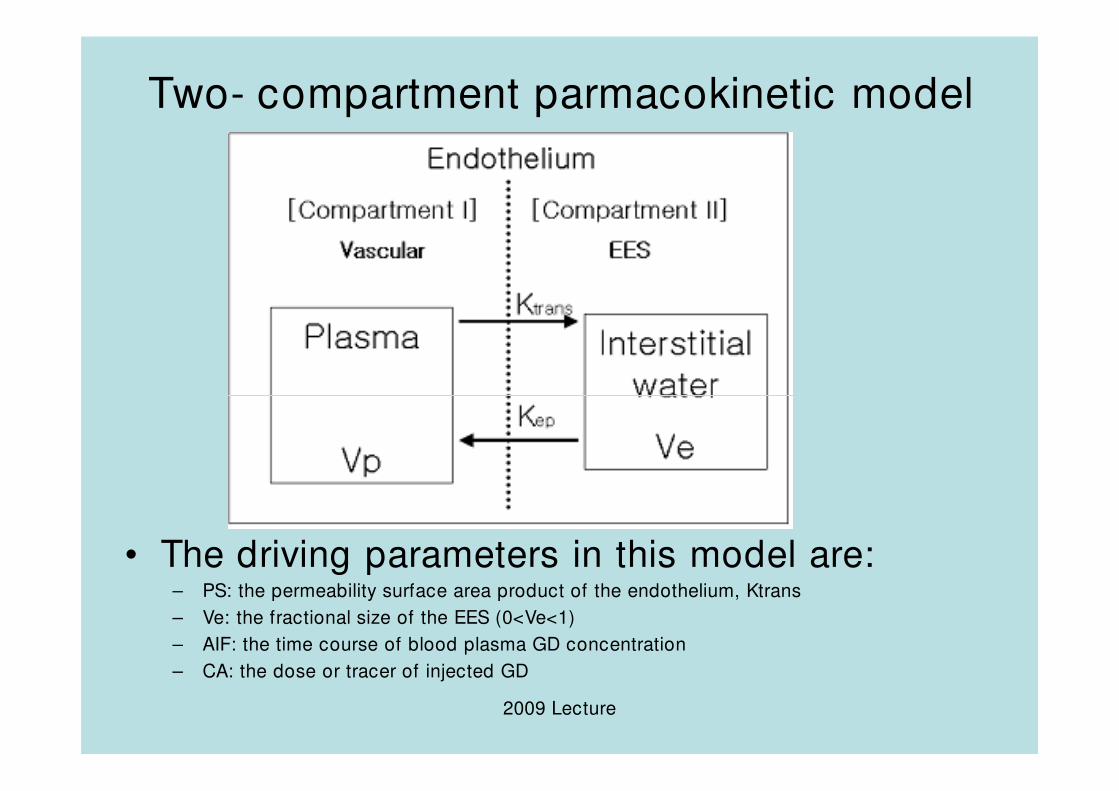
Two- compartment parmacokinetic model
2009 Lecture
• The driving parameters in this model are:– PS: the permeability surface area product of the endothelium, Ktrans
– Ve: the fractional size of the EES (0<Ve<1)
– AIF: the time course of blood plasma GD concentration
– CA: the dose or tracer of injected GD
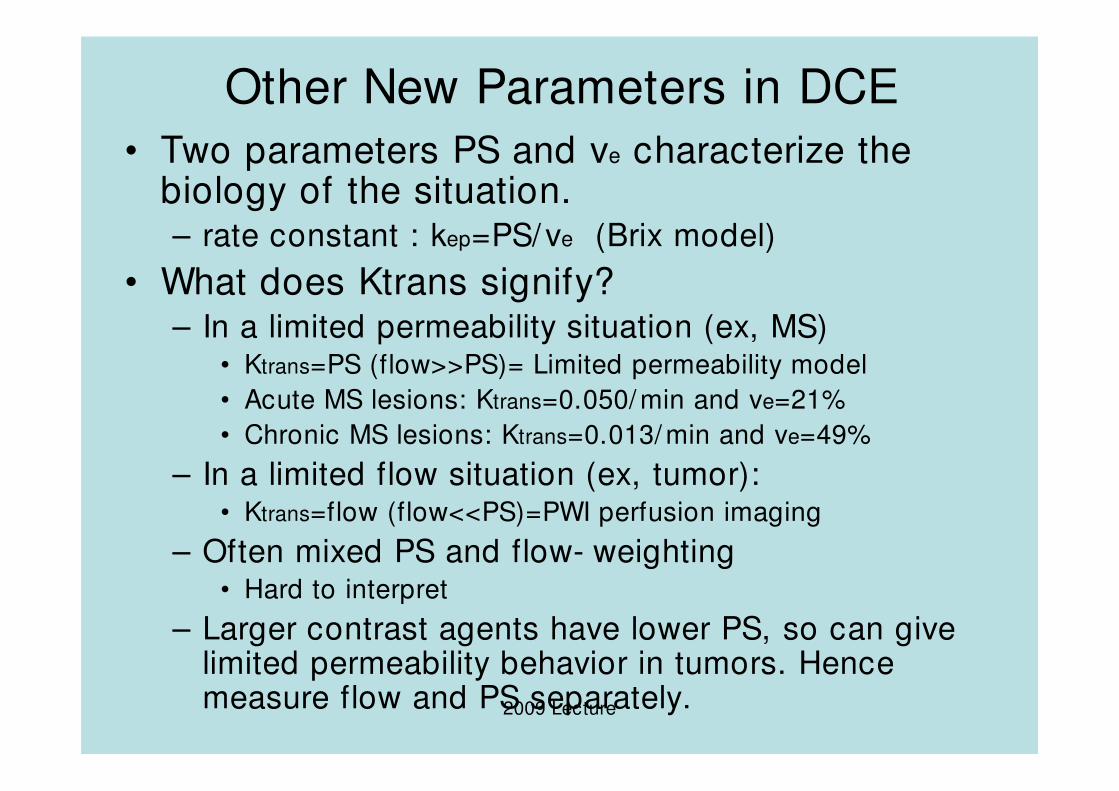
Other New Parameters in DCE
• Two parameters PS and ve characterize the biology of the situation. – rate constant : kep=PS/ve (Brix model)
• What does Ktrans signify?– In a limited permeability situation (ex, MS)
• Ktrans=PS (flow>>PS)= Limited permeability model
• Acute MS lesions: Ktrans=0.050/ min and ve=21%
2009 Lecture
• Acute MS lesions: Ktrans=0.050/ min and ve=21%
• Chronic MS lesions: Ktrans=0.013/ min and ve=49%
– In a limited flow situation (ex, tumor): • Ktrans=flow (flow<<PS)=PWI perfusion imaging
– Often mixed PS and flow- weighting• Hard to interpret
– Larger contrast agents have lower PS, so can give limited permeability behavior in tumors. Hence measure flow and PS separately.
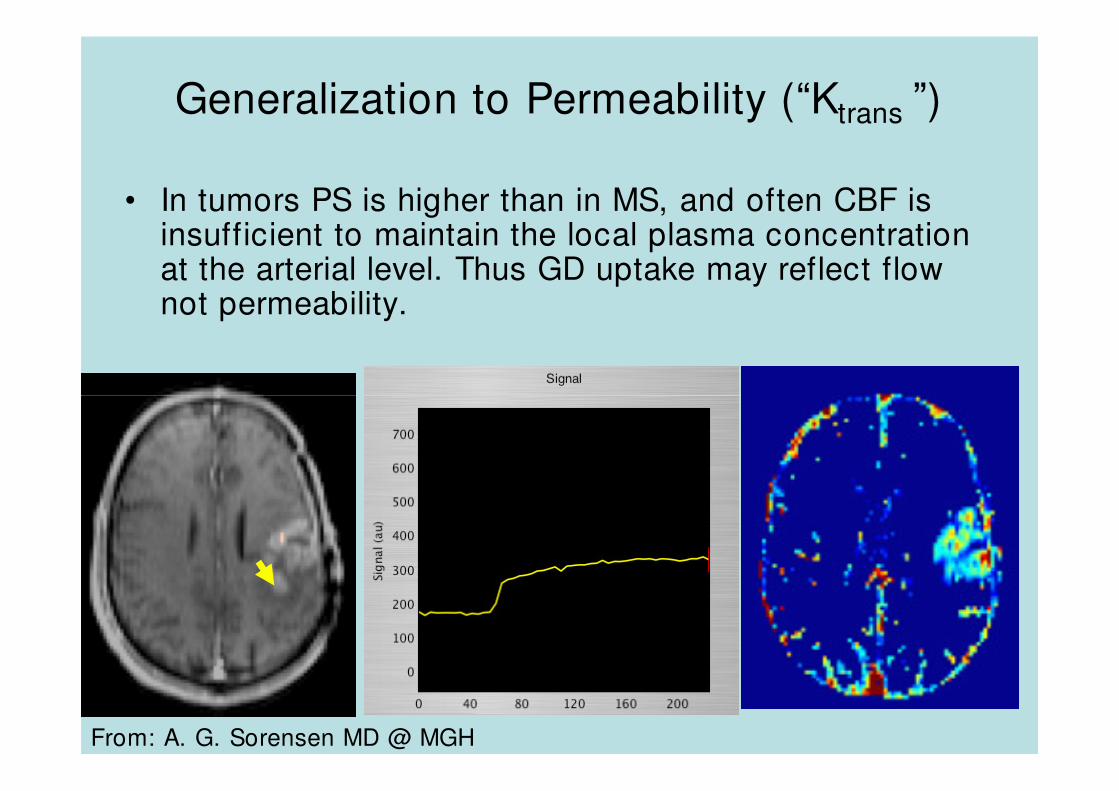
Generalization to Permeability (“Ktrans ”)
• In tumors PS is higher than in MS, and often CBF is insufficient to maintain the local plasma concentration at the arterial level. Thus GD uptake may reflect flow not permeability.
2009 Lecture
From: A. G. Sorensen MD @ MGH
CBF Calculation in DCE
• T1W DCE gives CBF under conditions of:
– Low PS (i.e. flow- limited) and
– Blood plasma volume (vp) not too big (IV
tracer not modeled well).
2009 Lecture
tracer not modeled well).

Example
2009 Lecture
Current Issues of DCE
• Imaging Protocol: temporal vs spatial resolution– 3D Fast GE T1W sequence
– TR<7 msec, TE<1.5 msec, FA=30
• AIF can be ideally measured with MRI – Hard to get a slice,
2009 Lecture
– Partial volume errors
– Good temporal resolution needed
– Signal nonlinear with high GD concentrations
• Modeling:– IV tracer: incomplete exchange of intravascular and
extravascular water reduces the visibility of IV GD.
– Distributed system (tissue homogeneity model better?)
2. DSC Perfusion MRI
• Exogenous
• Sequences
– 2D Gradient- echo T2*W MRI
– 2D Echo- planar imaging (EPI) T2*W MRI
2009 Lecture
– 2D Echo- planar imaging (EPI) T2*W MRI
– 3D T2*W MRI
• Application
– Brain
DSC Perfusion MRI
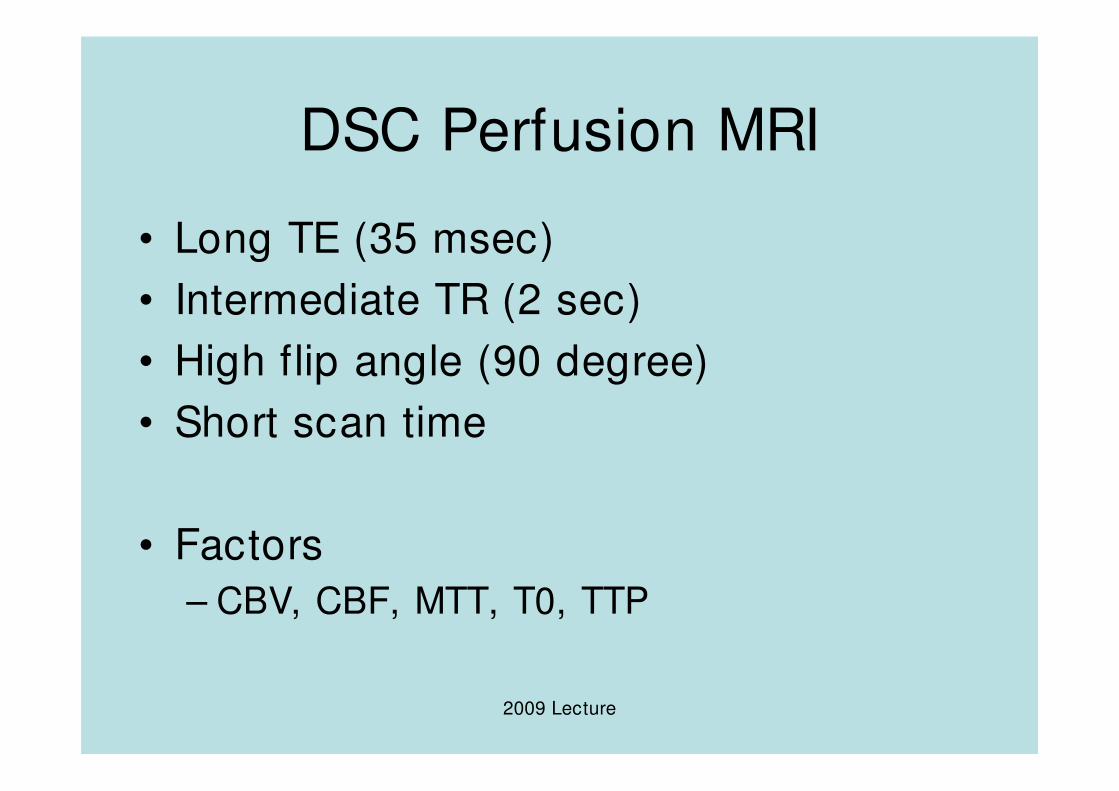
• Long TE (35 msec)
• Intermediate TR (2 sec)
• High flip angle (90 degree)
2009 Lecture
• Short scan time
• Factors
– CBV, CBF, MTT, T0, TTP
DSC or T2*W PWI pMRI
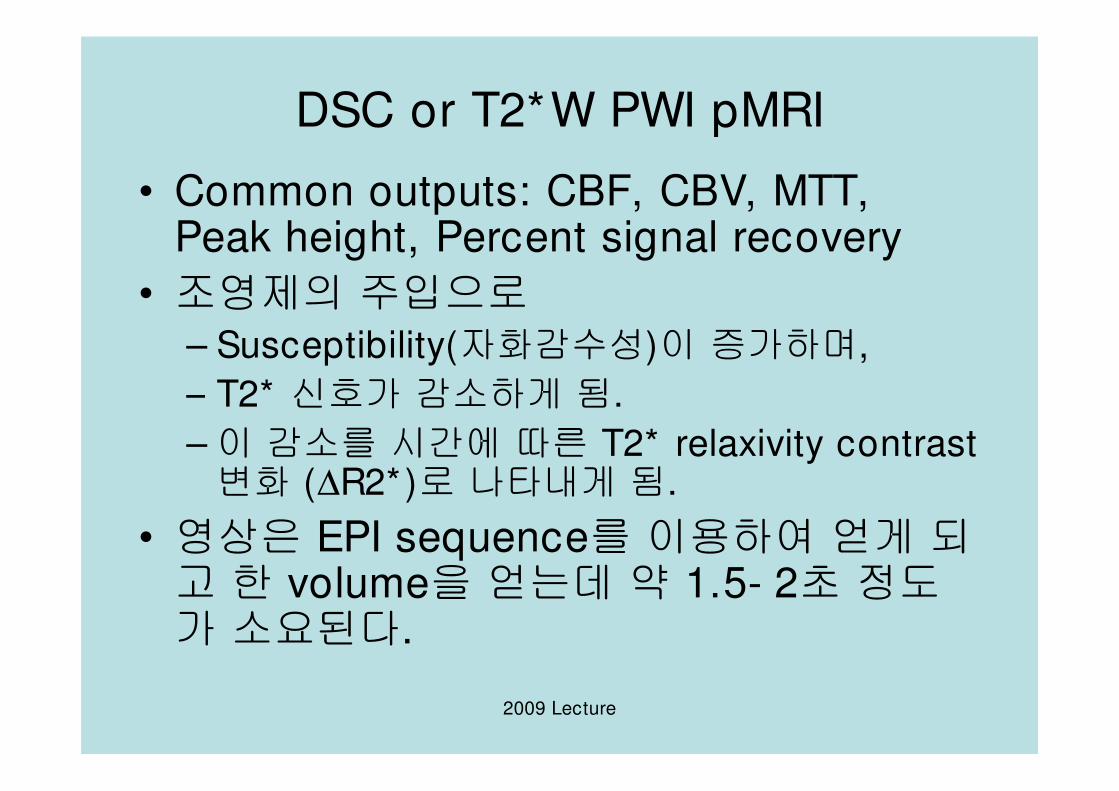
• Common outputs: CBF, CBV, MTT, Peak height, Percent signal recovery
• 조영제의 주입으로– Susceptibility(자화감수성)이 증가하며,
– T2* 신호가 감소하게 됨.
2009 Lecture
– T2* 신호가 감소하게 됨.
–이 감소를 시간에 따른 T2* relaxivity contrast 변화 (∆R2*)로 나타내게 됨.
• 영상은 EPI sequence를 이용하여 얻게 되고 한 volume을 얻는데 약 1.5- 2초 정도가 소요된다.
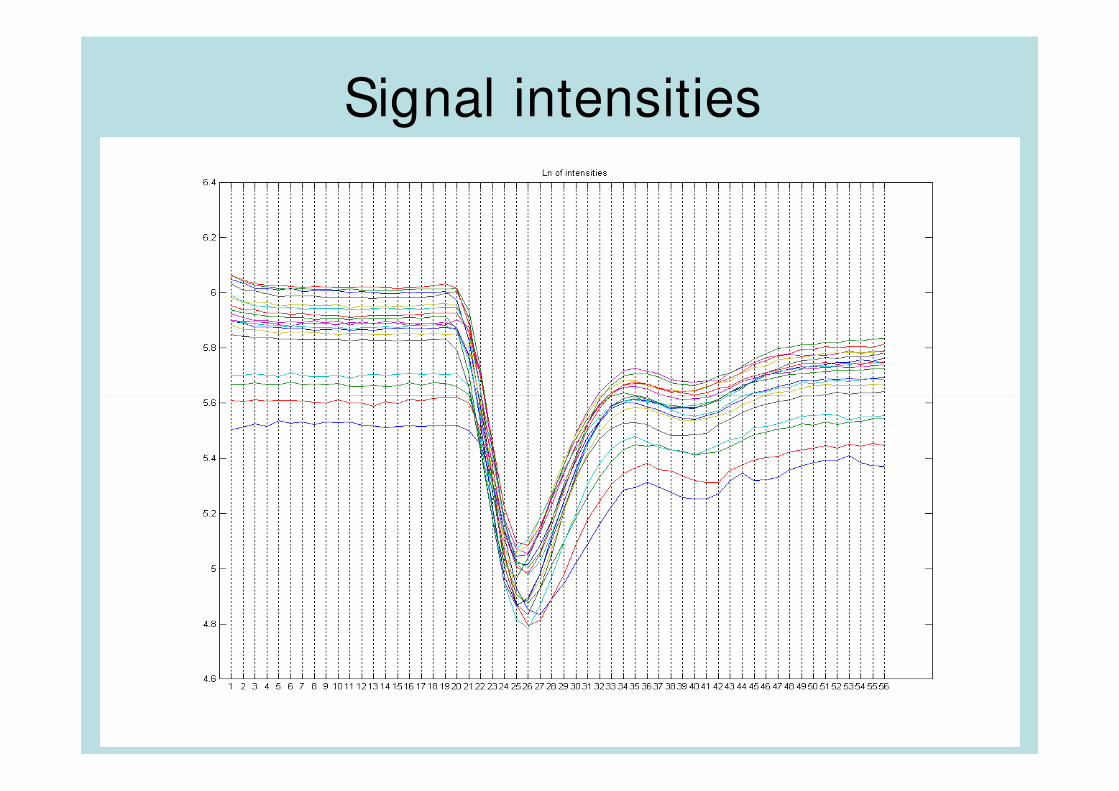
Signal intensities
2009 Lecture
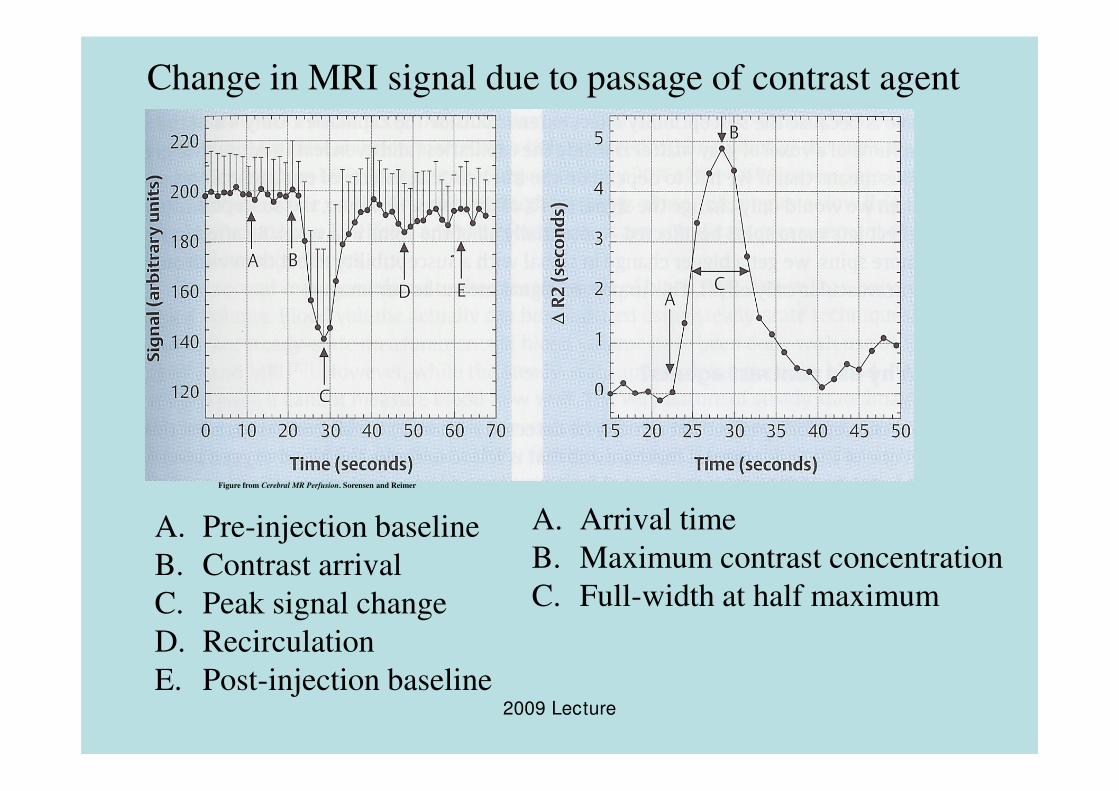
Change in MRI signal due to passage of contrast agent
2009 Lecture
A. Pre-injection baseline
B. Contrast arrival
C. Peak signal change
D. Recirculation
E. Post-injection baseline
A. Arrival time
B. Maximum contrast concentration
C. Full-width at half maximum
Figure from Cerebral MR Perfusion. Sorensen and Reimer
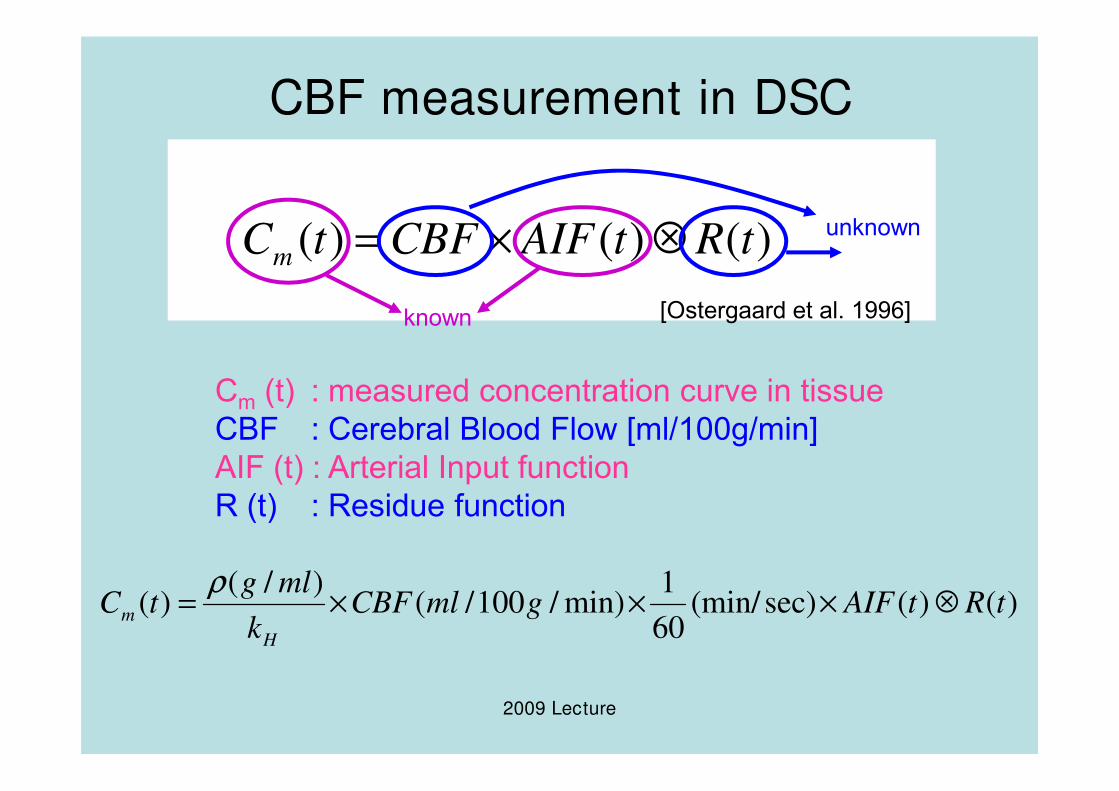
CBF measurement in DSC
)()()( tRtAIFCBFtCm ⊗×=
Cm (t) : measured concentration curve in tissue
[Ostergaard et al. 1996]known
unknown
2009 Lecture
Cm (t) : measured concentration curve in tissue
CBF : Cerebral Blood Flow [ml/100g/min]
AIF (t) : Arterial Input function
R (t) : Residue function
)()(sec)(min/60
1min)/100/(
)/()( tRtAIFgmlCBF
k
mlgtC
H
m ⊗×××=ρ
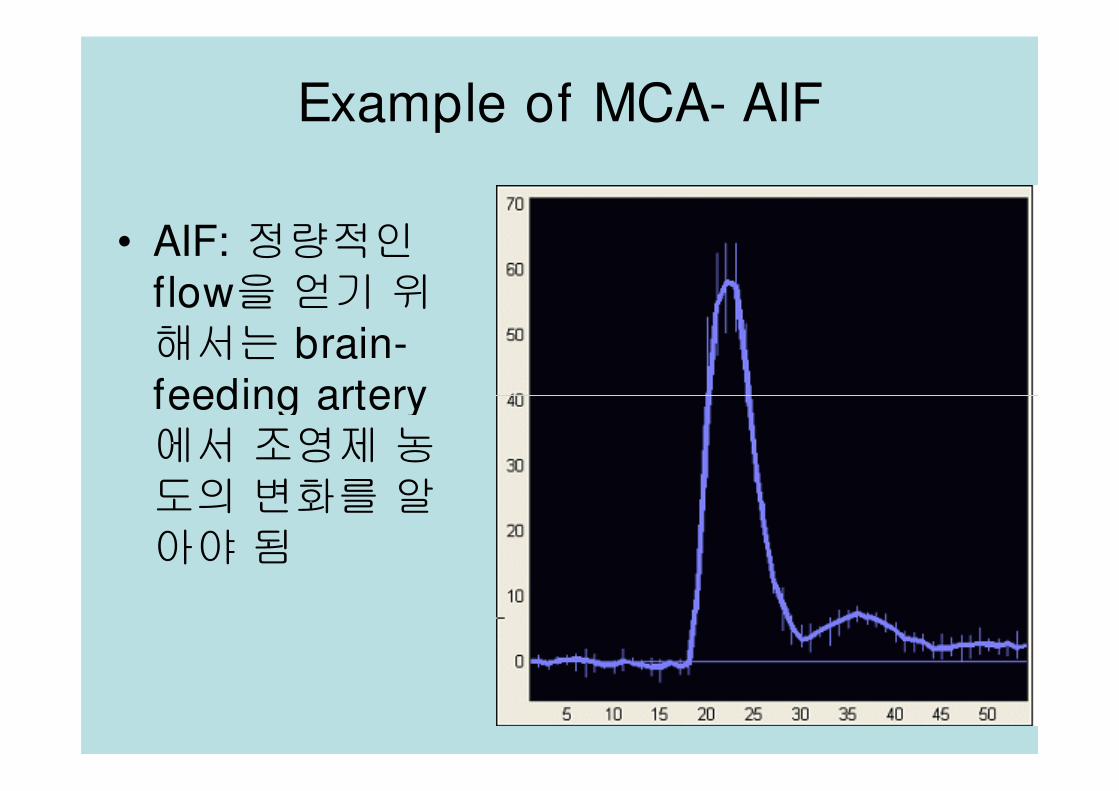
Example of MCA- AIF
• AIF: 정량적인flow을 얻기 위해서는 brain-feeding artery
2009 Lecture
feeding artery에서 조영제 농
도의 변화를 알
아야 됨
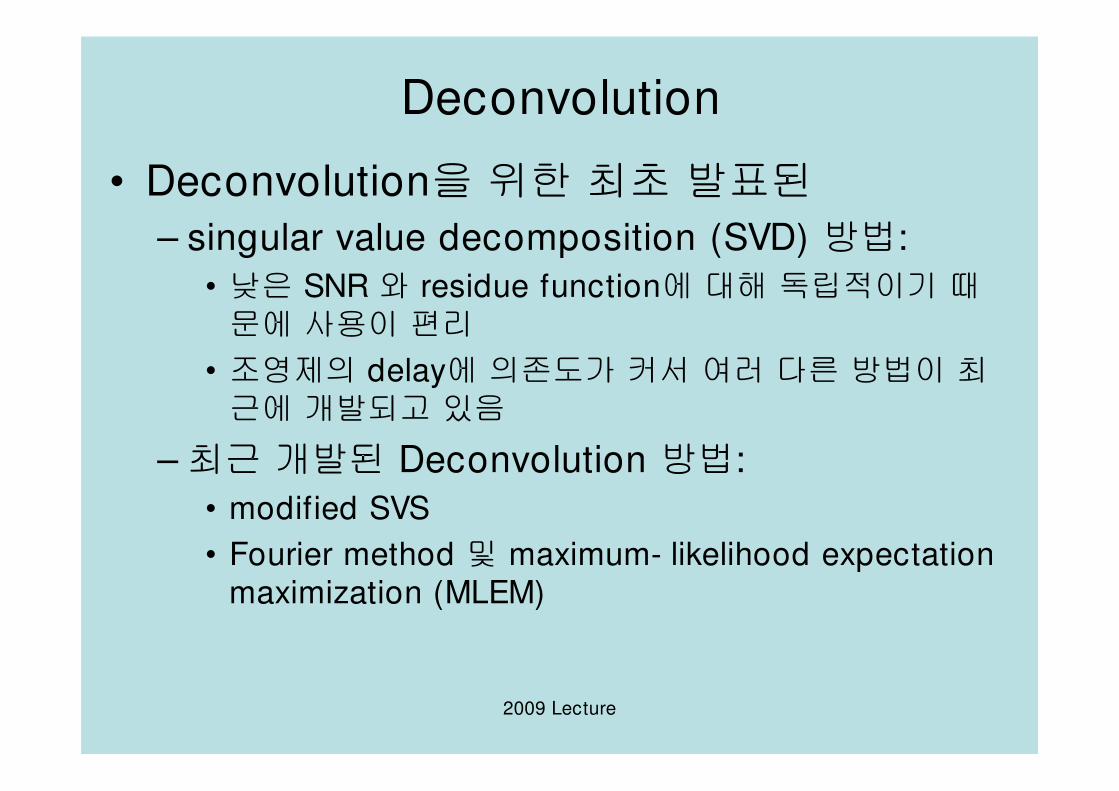
Deconvolution
• Deconvolution을 위한 최초 발표된
– singular value decomposition (SVD) 방법:
• 낮은 SNR 와 residue function에 대해 독립적이기 때
문에 사용이 편리
• 조영제의 delay에 의존도가 커서 여러 다른 방법이 최
근에 개발되고 있음
2009 Lecture
근에 개발되고 있음
–최근 개발된 Deconvolution 방법:
• modified SVS
• Fourier method 및 maximum- likelihood expectation
maximization (MLEM)
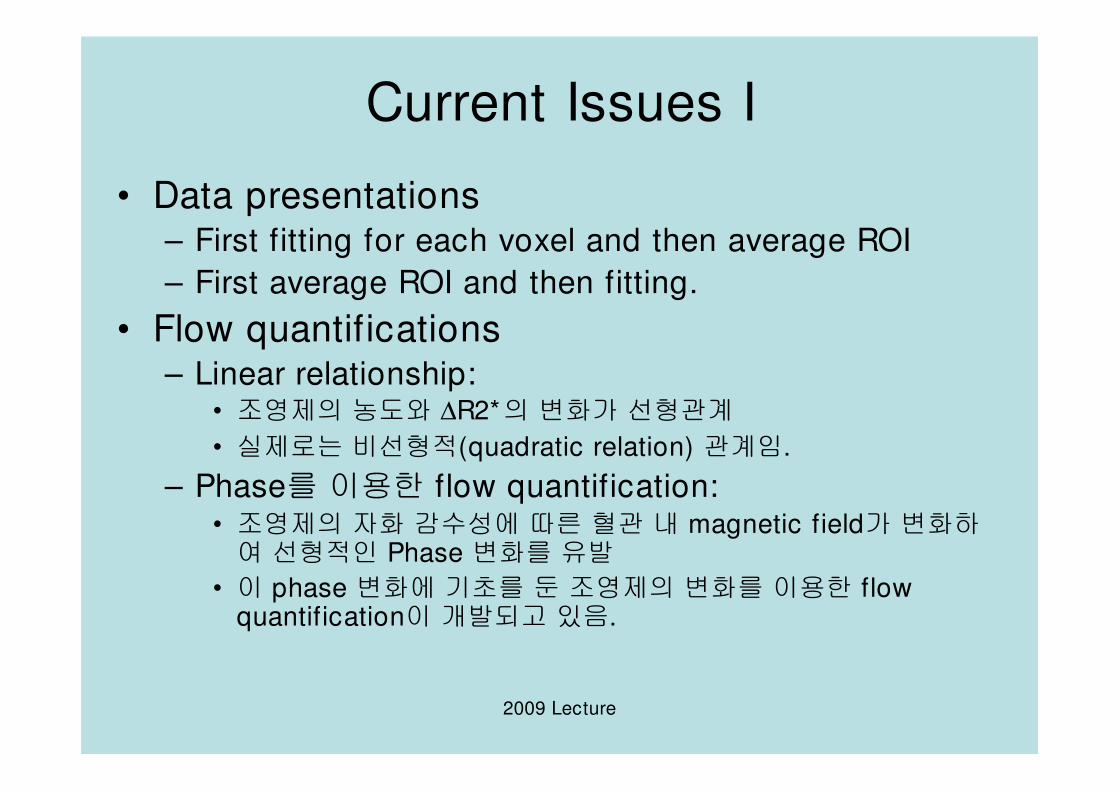
Current Issues I
• Data presentations– First fitting for each voxel and then average ROI
– First average ROI and then fitting.
• Flow quantifications– Linear relationship:
∆
2009 Lecture
• 조영제의 농도와 ∆R2*의 변화가 선형관계
• 실제로는 비선형적(quadratic relation) 관계임.
– Phase를 이용한 flow quantification:• 조영제의 자화 감수성에 따른 혈관 내 magnetic field가 변화하여 선형적인 Phase 변화를 유발
• 이 phase 변화에 기초를 둔 조영제의 변화를 이용한 flow quantification이 개발되고 있음.
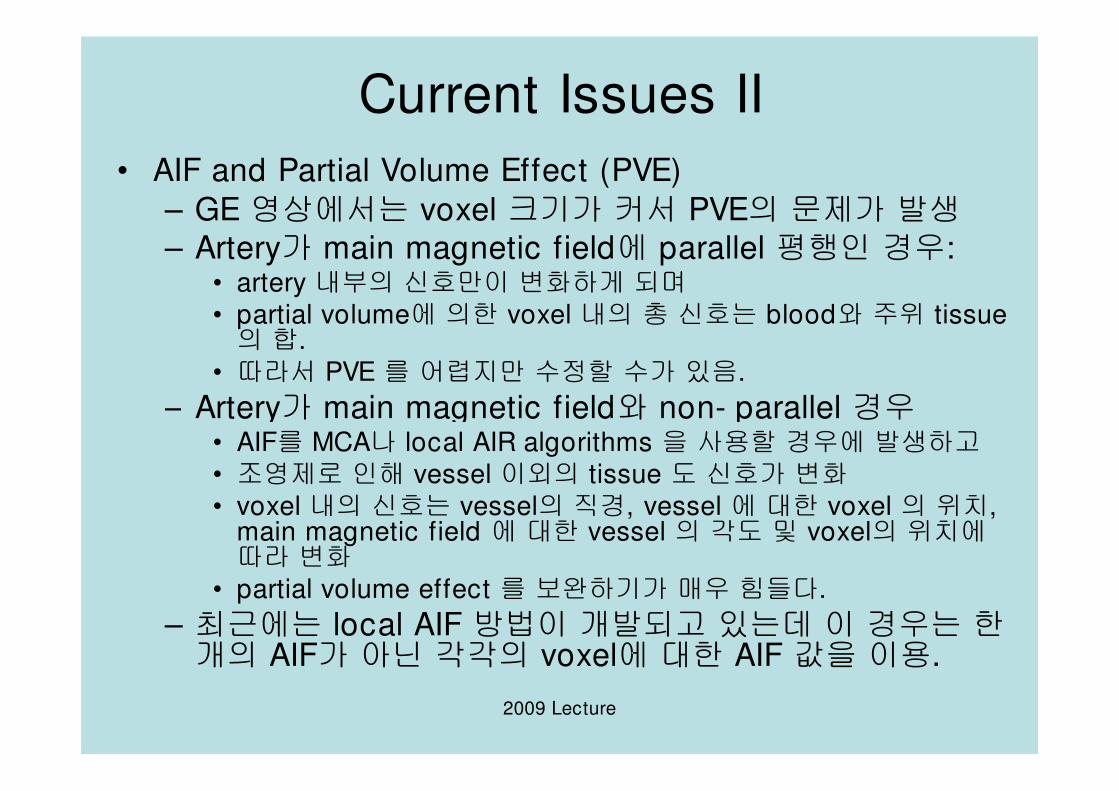
Current Issues II
• AIF and Partial Volume Effect (PVE)
– GE 영상에서는 voxel 크기가 커서 PVE의 문제가 발생
– Artery가 main magnetic field에 parallel 평행인 경우:• artery 내부의 신호만이 변화하게 되며• partial volume에 의한 voxel 내의 총 신호는 blood와 주위 tissue 의 합.
• 따라서 PVE 를 어렵지만 수정할 수가 있음.
– Artery가 main magnetic field와 non- parallel 경우
2009 Lecture
– Artery가 main magnetic field와 non- parallel 경우• AIF를 MCA나 local AIR algorithms 을 사용할 경우에 발생하고• 조영제로 인해 vessel 이외의 tissue 도 신호가 변화• voxel 내의 신호는 vessel의 직경, vessel 에 대한 voxel 의 위치,
main magnetic field 에 대한 vessel 의 각도 및 voxel의 위치에따라 변화
• partial volume effect 를 보완하기가 매우 힘들다.
– 최근에는 local AIF 방법이 개발되고 있는데 이 경우는 한개의 AIF가 아닌 각각의 voxel에 대한 AIF 값을 이용.
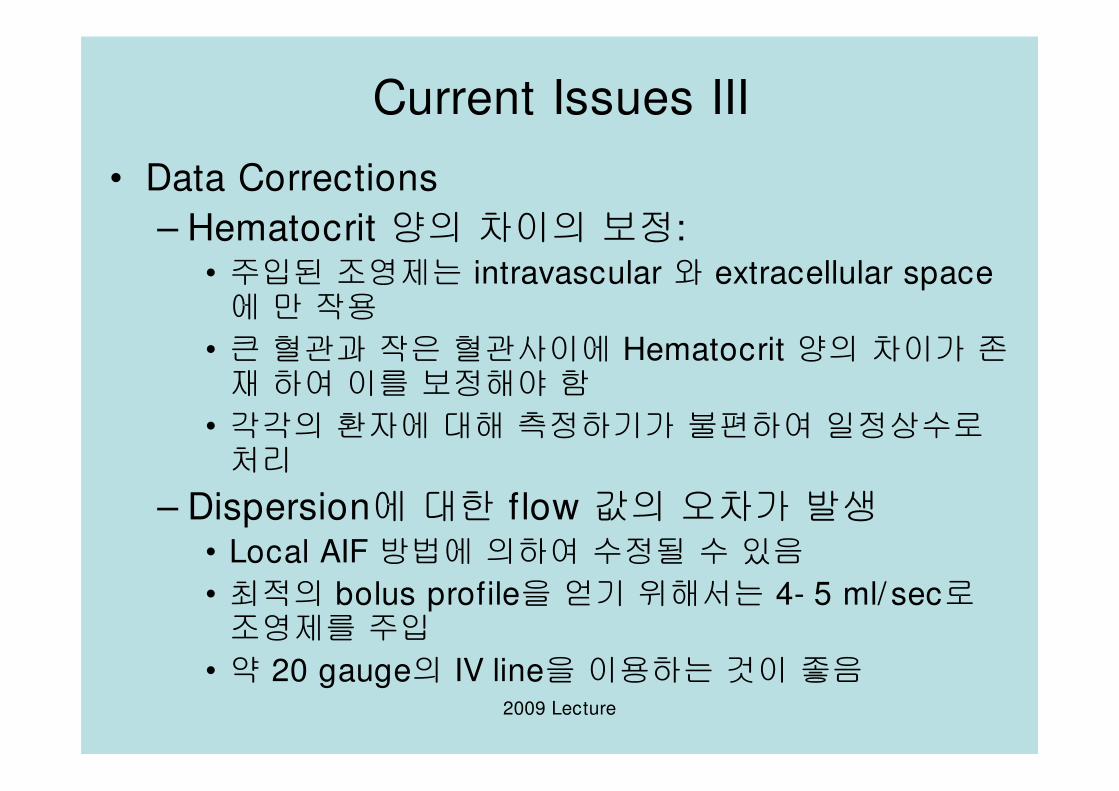
Current Issues III
• Data Corrections
– Hematocrit 양의 차이의 보정: • 주입된 조영제는 intravascular 와 extracellular space 에 만 작용
• 큰 혈관과 작은 혈관사이에 Hematocrit 양의 차이가 존재 하여 이를 보정해야 함
2009 Lecture
재 하여 이를 보정해야 함
• 각각의 환자에 대해 측정하기가 불편하여 일정상수로처리
– Dispersion에 대한 flow 값의 오차가 발생• Local AIF 방법에 의하여 수정될 수 있음
• 최적의 bolus profile을 얻기 위해서는 4- 5 ml/ sec로조영제를 주입
• 약 20 gauge의 IV line을 이용하는 것이 좋음
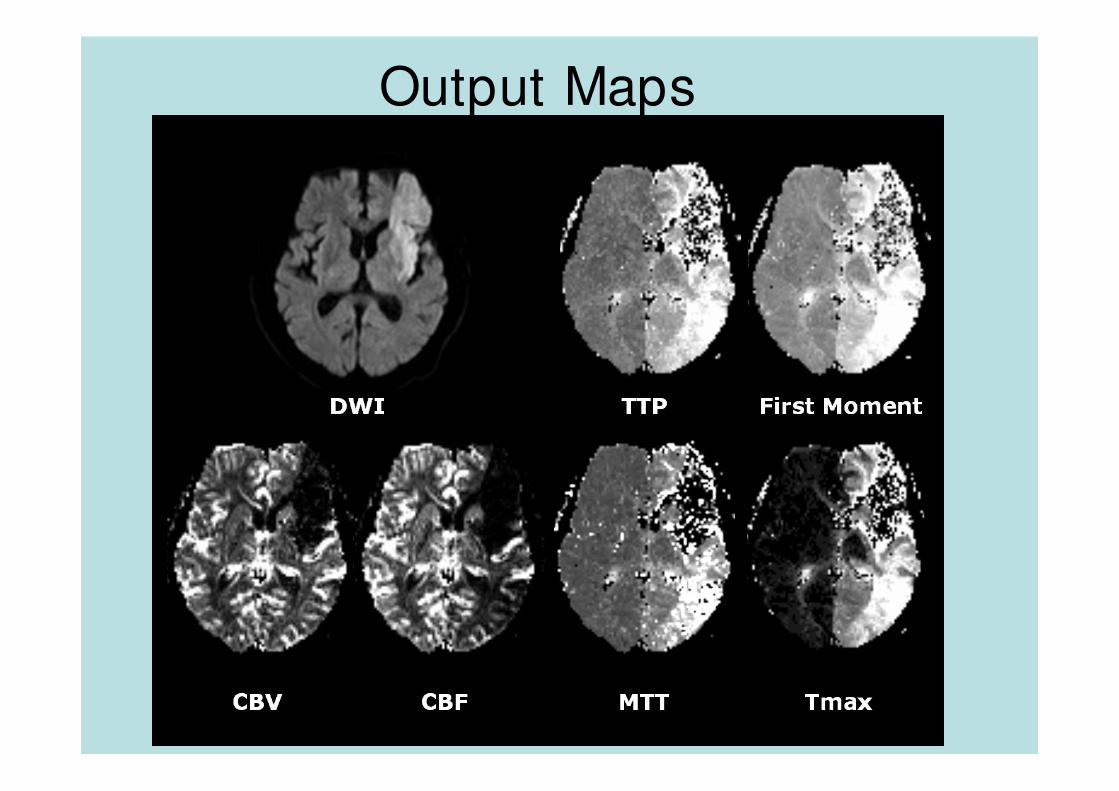
Output Maps
2009 Lecture
3. ASL Perfusion MRI
• Endogenous
• Sequences– 2D Proton- density weighted EPI MRI
– 3D Proton- density weighted EPI MRI
2009 Lecture
– 3D Proton- density weighted EPI MRI
• Applications– Brain
– Heart
– Kidney
– Muscle
ASL Perfusion MRI
• Long TR (3 sec)
• Short TE (shortest)
• High flip angle (90 degree)
2009 Lecture
• Long scan time with multiple averaging
• Factors
– CBF, (T0, TTP, CBV)
ASL pMRI
• Common output: CBF
• ASL perfusion 영상: RF 펄스를 이용하여 arterial blood의longitudinal magnetization를 변화시켜 얻는 방법– blood의 T1 relaxation 시간이 영상의 질을 좌우
– Control or Reference 영상: blood는 자화 없이 영상
– Labeled or Tagged 영상: blood를 자화시킨 후에 영상
– PWI = Control - Labeled
2009 Lecture
– PWI = Control - Labeled
• ASL 방법:– pulsed ASL (PASL)
– continuous ASL (CASL)
– velocity selective ASL(VS- ASL)
– Vascular Territory Imaging (VTI)
Development issues
• static tissue의 기여도를 최소한도로 줄이고
• blood labeling 효과를 최대한도로 높이기 위함
• Static tissue의 기여로 flow 량의 계산에 오차가 발생하는데 그 주된 이유 중의 하나가
2009 Lecture
차가 발생하는데 그 주된 이유 중의 하나가
magnetization transfer (MT) effect에 의한것임
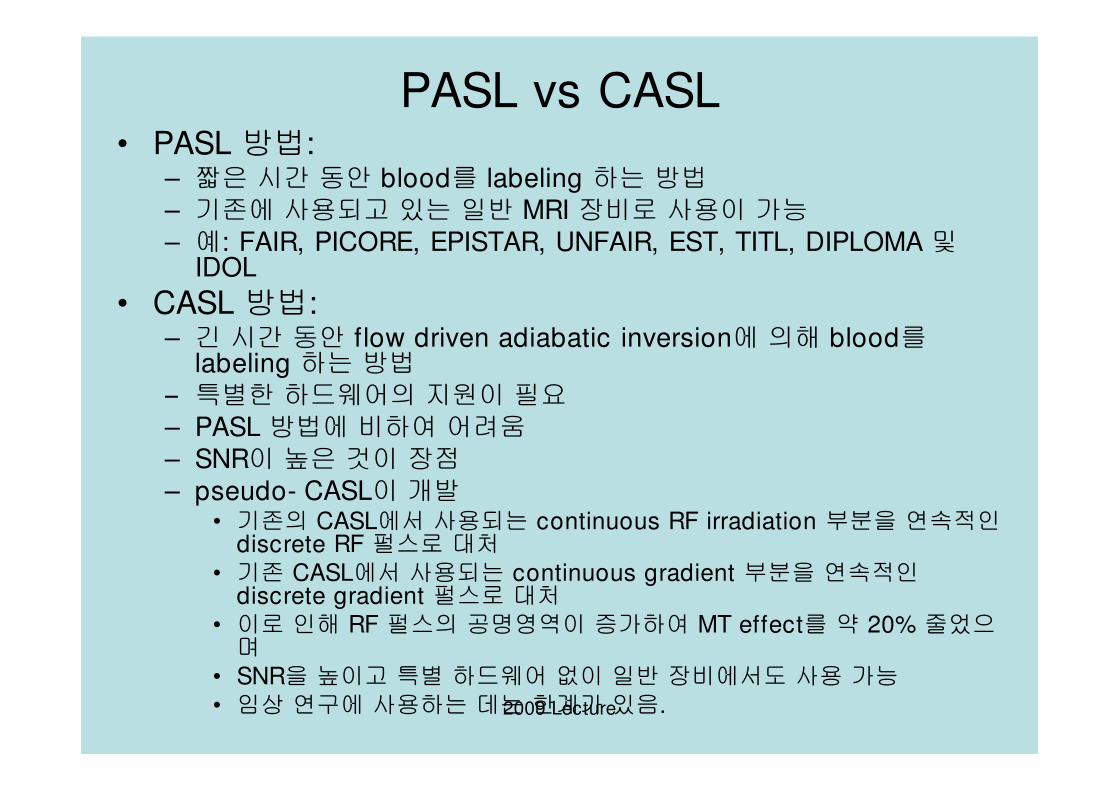
PASL vs CASL• PASL 방법:
– 짧은 시간 동안 blood를 labeling 하는 방법– 기존에 사용되고 있는 일반 MRI 장비로 사용이 가능– 예: FAIR, PICORE, EPISTAR, UNFAIR, EST, TITL, DIPLOMA 및
IDOL
• CASL 방법:– 긴 시간 동안 flow driven adiabatic inversion에 의해 blood를
labeling 하는 방법– 특별한 하드웨어의 지원이 필요
2009 Lecture
– 특별한 하드웨어의 지원이 필요– PASL 방법에 비하여 어려움– SNR이 높은 것이 장점– pseudo- CASL이 개발
• 기존의 CASL에서 사용되는 continuous RF irradiation 부분을 연속적인discrete RF 펄스로 대처
• 기존 CASL에서 사용되는 continuous gradient 부분을 연속적인discrete gradient 펄스로 대처
• 이로 인해 RF 펄스의 공명영역이 증가하여 MT effect를 약 20% 줄었으며
• SNR을 높이고 특별 하드웨어 없이 일반 장비에서도 사용 가능
• 임상 연구에 사용하는 데는 한계가 있음.
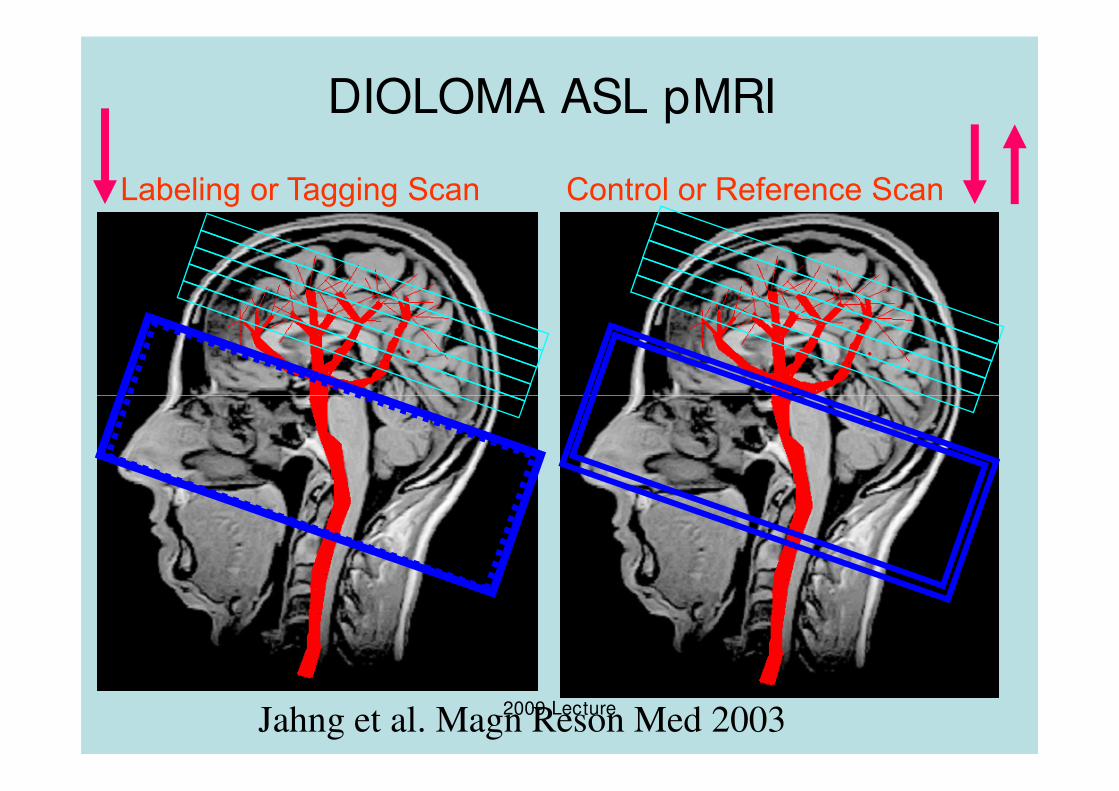
DIOLOMA ASL pMRI
Labeling or Tagging Scan Control or Reference Scan
2009 LectureJahng et al. Magn Reson Med 2003
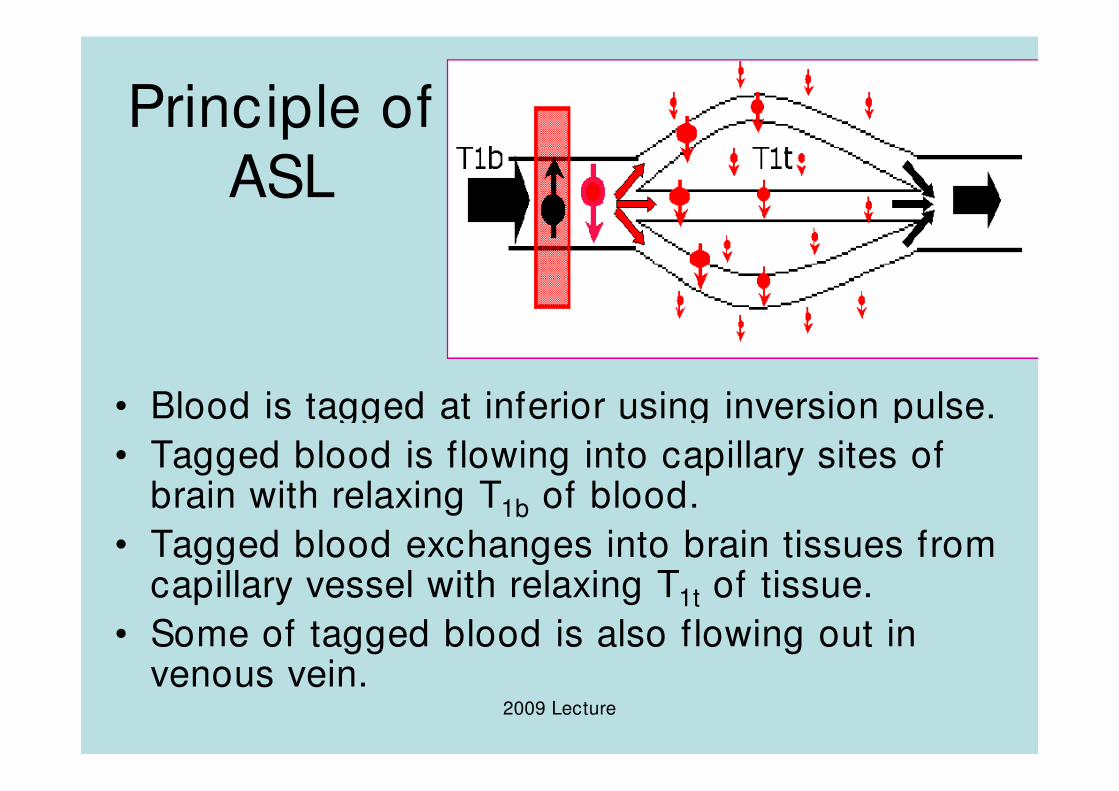
Principle of
ASL
• Blood is tagged at inferior using inversion pulse.
2009 Lecture
• Blood is tagged at inferior using inversion pulse.
• Tagged blood is flowing into capillary sites of brain with relaxing T1b of blood.
• Tagged blood exchanges into brain tissues from capillary vessel with relaxing T1t of tissue.
• Some of tagged blood is also flowing out in venous vein.
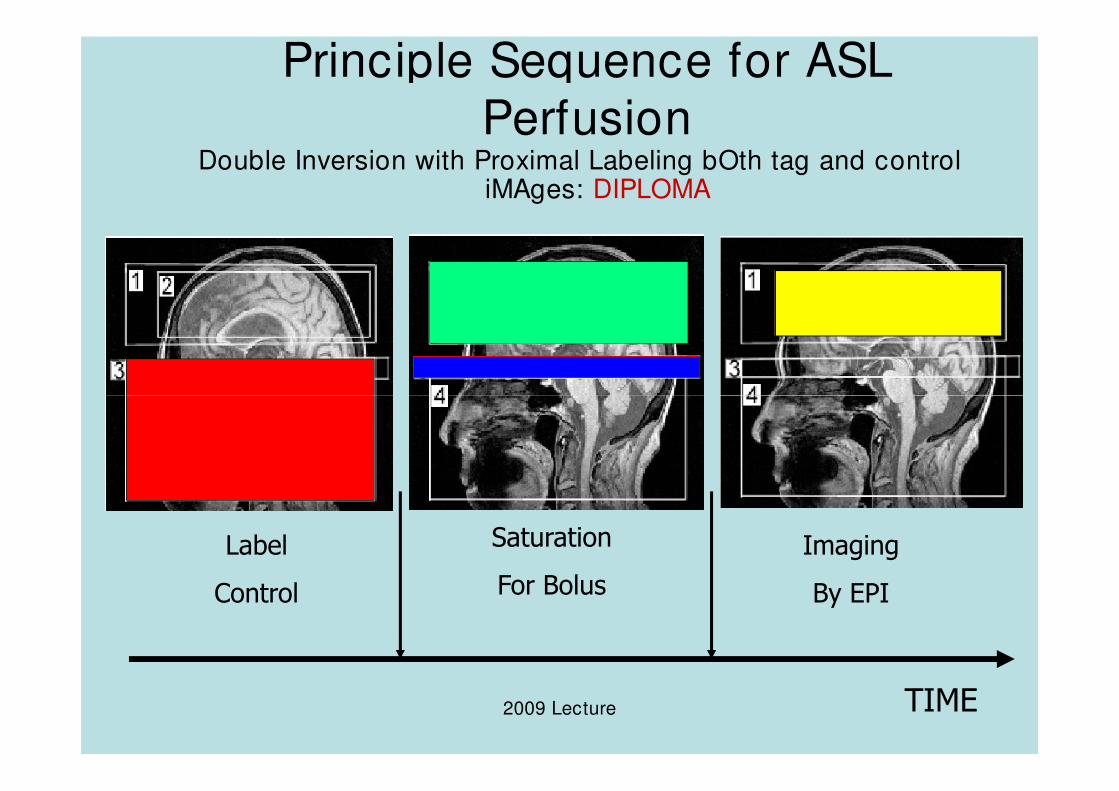
Principle Sequence for ASL
PerfusionDouble Inversion with Proximal Labeling bOth tag and control
iMAges: DIPLOMA
2009 Lecture
Label
Control
Imaging
By EPI
TIME
Saturation
For Bolus
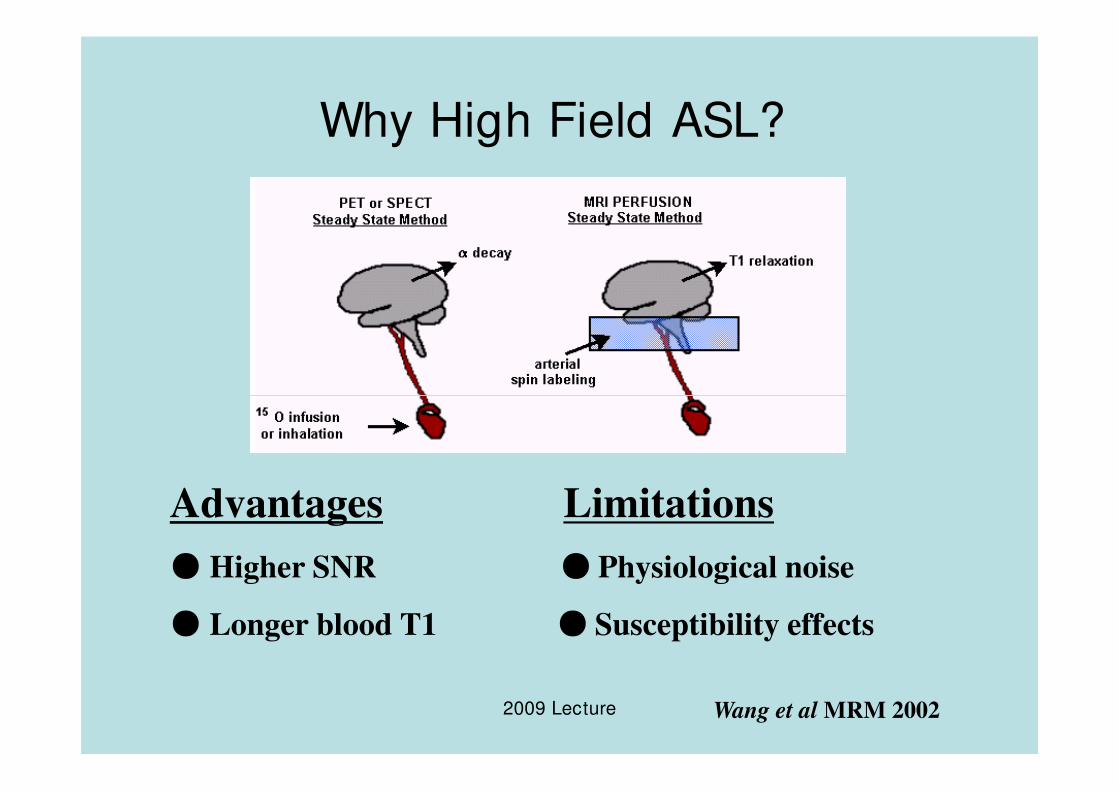
Why High Field ASL?
2009 Lecture
Advantages Limitations
● Higher SNR ● Physiological noise
● Longer blood T1 ● Susceptibility effects
Wang et al MRM 2002
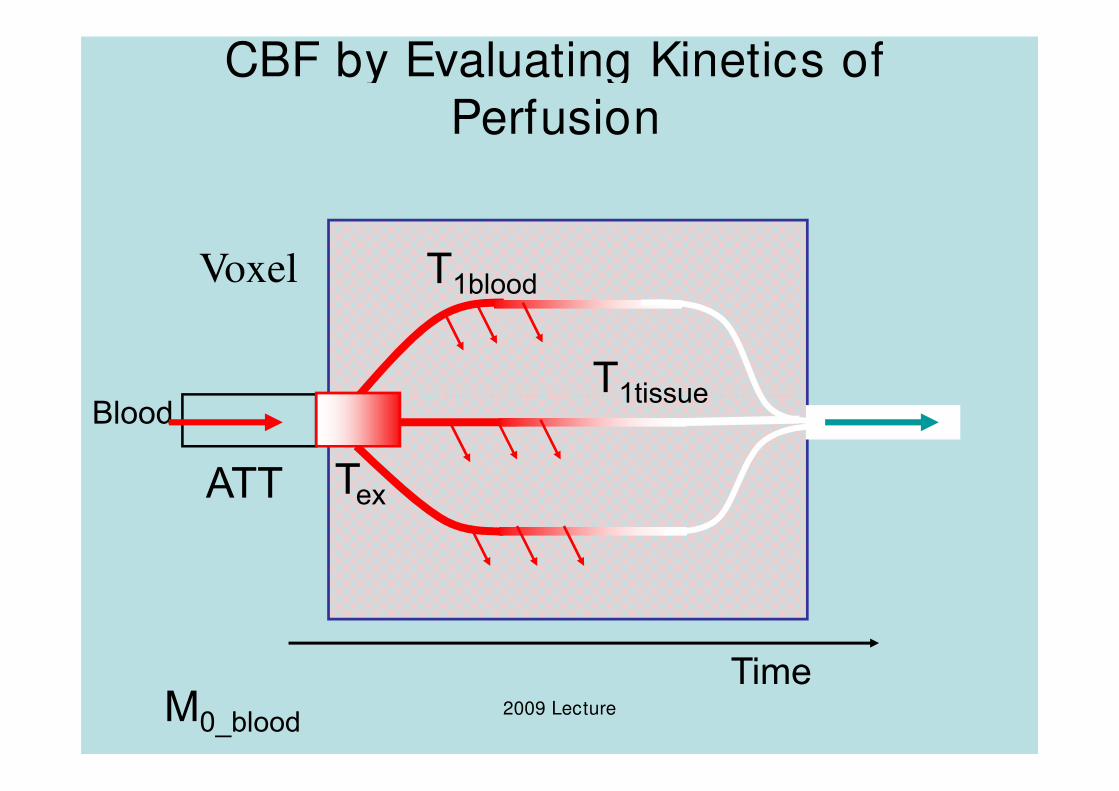
CBF by Evaluating Kinetics of
Perfusion
Blood
Voxel
T1tissue
T1blood
2009 Lecture
Blood
ATT Tex
Time
T1tissue
M0_blood
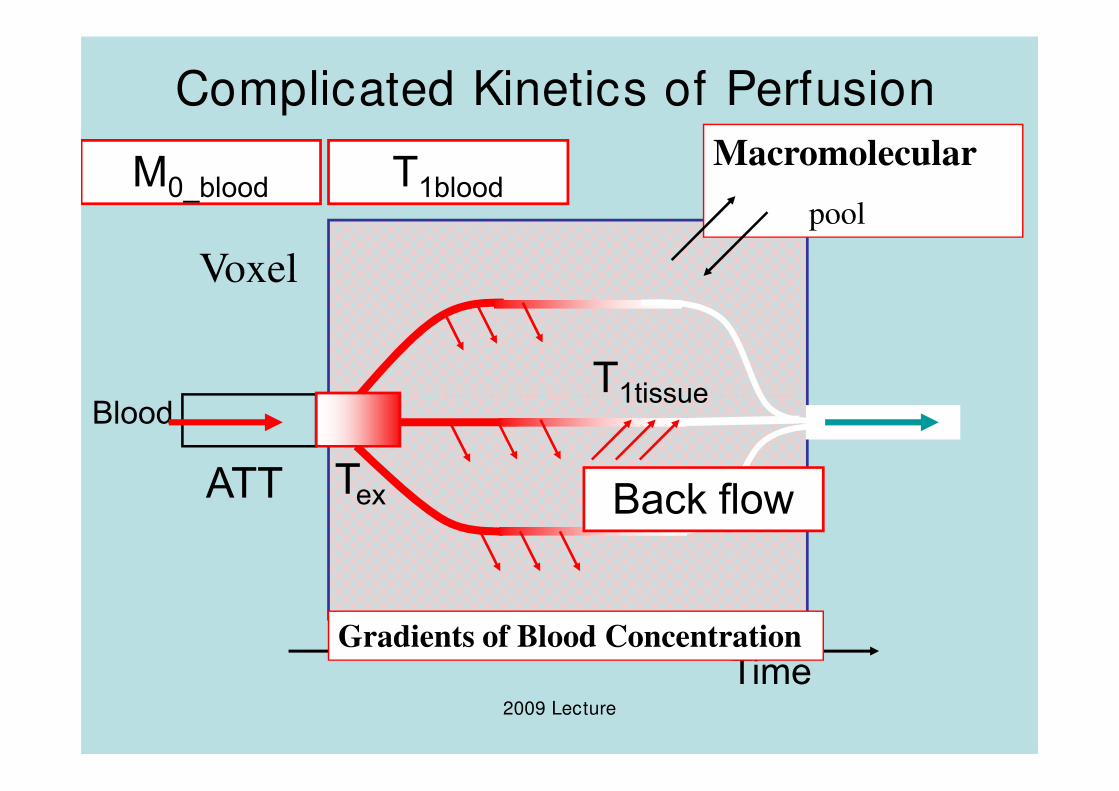
Complicated Kinetics of Perfusion
Blood
Voxel
T1tissue
T1bloodM0_bloodMacromolecular
pool
2009 Lecture
Blood
ATT Tex
Time
T1tissue
Gradients of Blood Concentration
Back flow
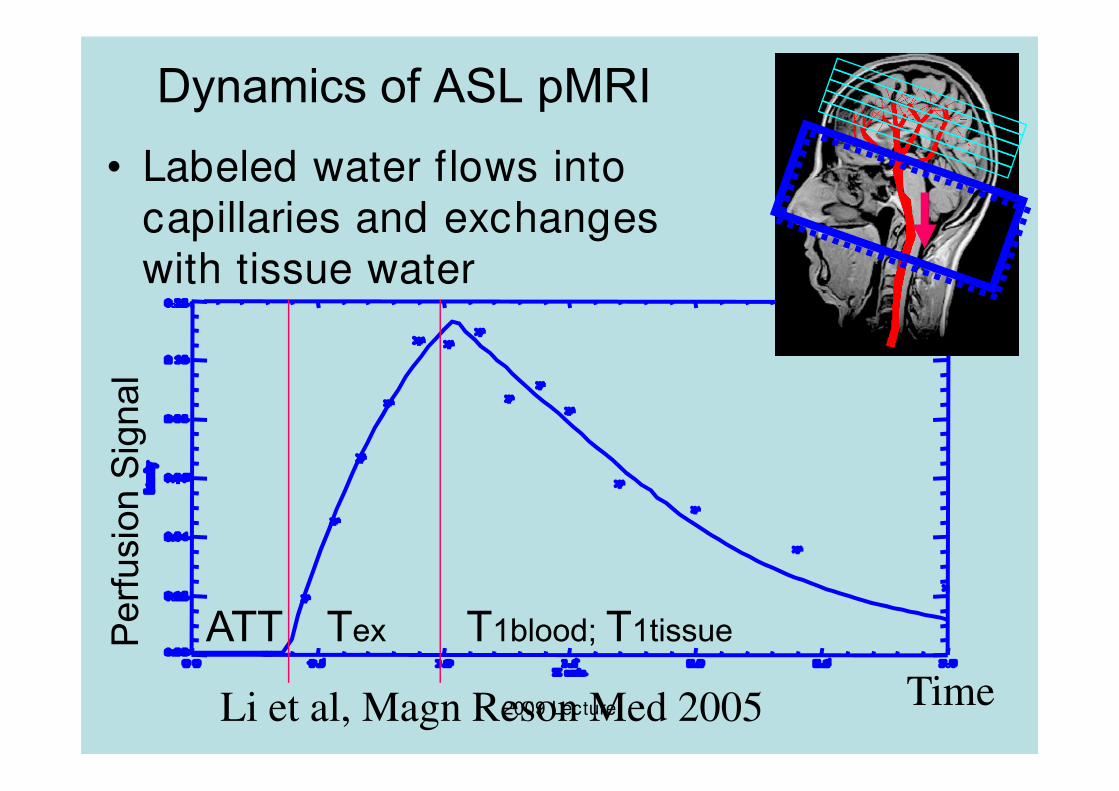
Dynamics of ASL pMRI
• Labeled water flows into capillaries and exchanges with tissue water
Perfusion Signal
2009 LectureTime
Perfusion Signal
Li et al, Magn Reson Med 2005
ATT Tex T1blood; T1tissue
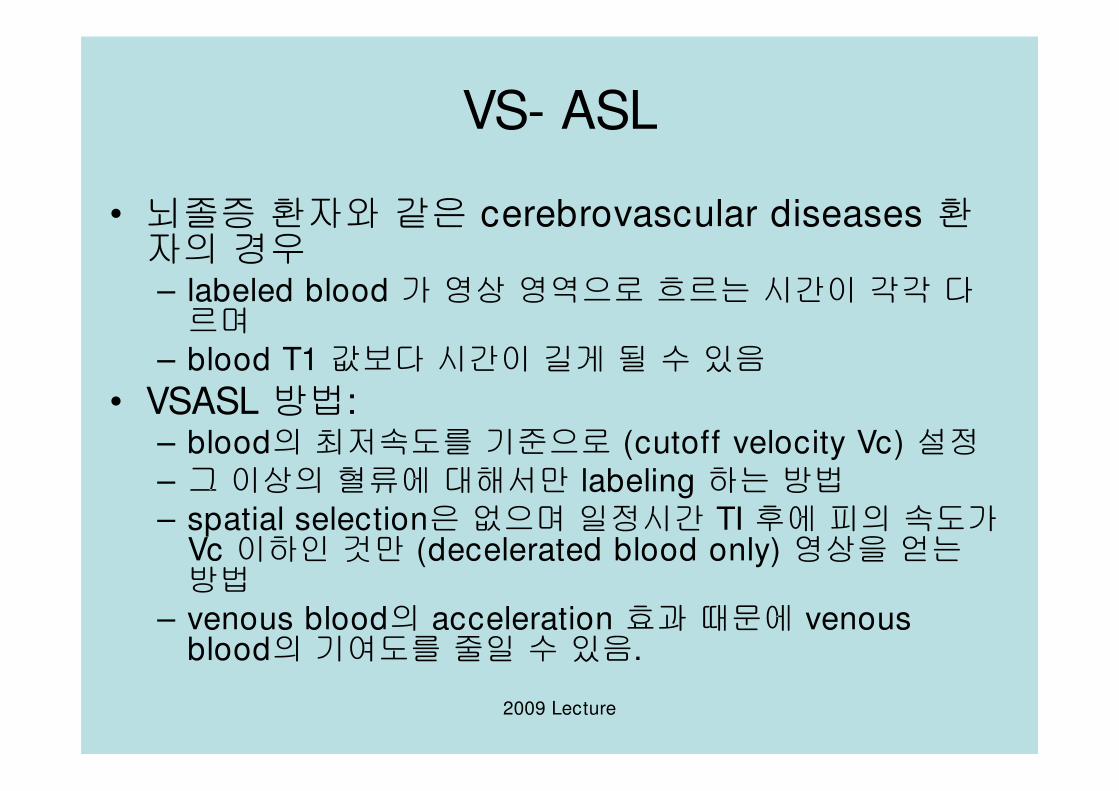
VS- ASL
• 뇌졸증 환자와 같은 cerebrovascular diseases 환자의 경우– labeled blood 가 영상 영역으로 흐르는 시간이 각각 다르며
– blood T1 값보다 시간이 길게 될 수 있음
• VSASL 방법:
2009 Lecture
• VSASL 방법: – blood의 최저속도를 기준으로 (cutoff velocity Vc) 설정
– 그 이상의 혈류에 대해서만 labeling 하는 방법
– spatial selection은 없으며 일정시간 TI 후에 피의 속도가Vc 이하인 것만 (decelerated blood only) 영상을 얻는방법
– venous blood의 acceleration 효과 때문에 venous blood의 기여도를 줄일 수 있음.
Vascular Territory Imaging (VTI)
• Cerebrovascular disease 환자에서
– stenotic vessel들이 여러 개 있을 경우
– carotid endarterectomy, stenting, 혹은
bypass등의 intervention 시술을 수행할 경우
2009 Lecture
bypass등의 intervention 시술을 수행할 경우
에 유용하게 사용될 수 있음.
• VTI 영상법은 PASL 방법을 이용하여 일부feeding artery 만을 labeling하는 방법임.
CBF and BOLD and CMRO2
• ASL 영상법을 이용하는 경우 oxygen metabolism (CMRO2)을 얻을 수 있음
• 동시에 CBF와 BOLD 영상을 얻고 이를 바탕으로CMRO2을 구할 수 있음
– Dual- echo method:
2009 Lecture
– Dual- echo method:• 1st echo=ASL
• 2nd echo=BOLD
• CMRO2
– Single- echo method:• addition=BOLD
• subtraction=CBF
• CMRO2
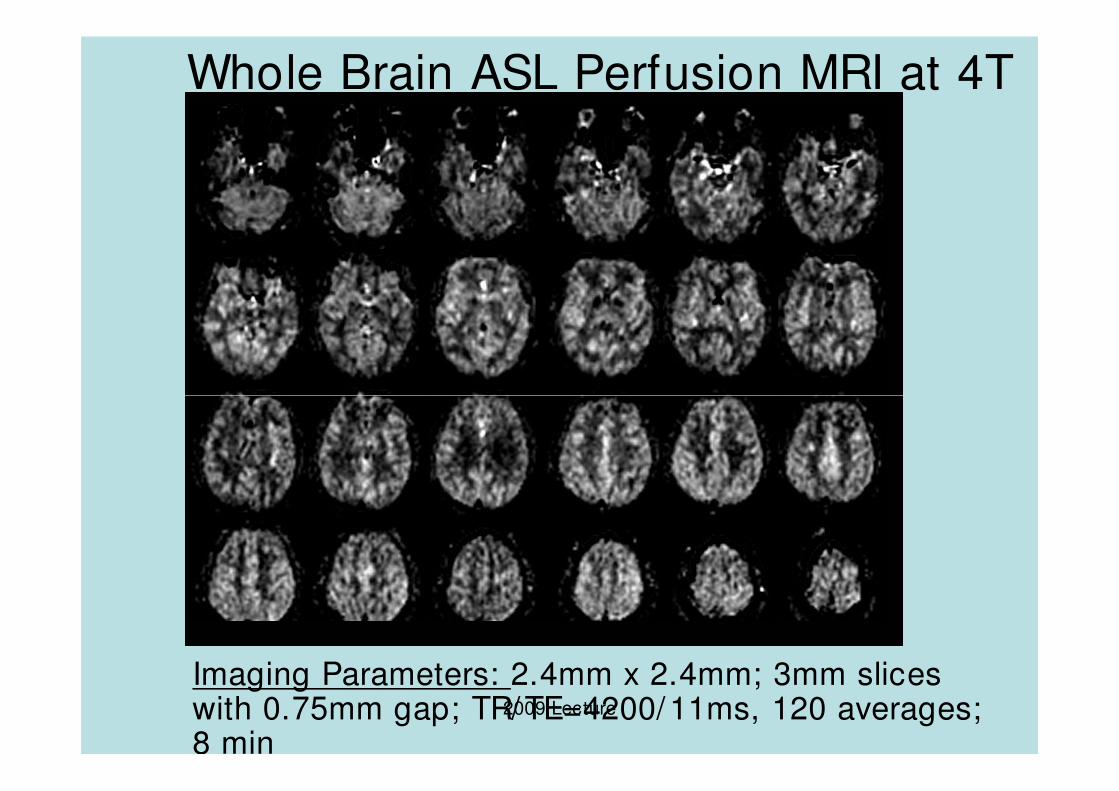
Whole Brain ASL Perfusion MRI at 4T
2009 Lecture
Imaging Parameters: 2.4mm x 2.4mm; 3mm slices with 0.75mm gap; TR/TE=4200/11ms, 120 averages; 8 min
Acknowledgements
• 대한자기공명의과학회
• 경희대학교 부속 동서신의학병원 영상의학과
2009 Lecture
학과
• 보건복지부 보건의료기술진흥사업의 지원(A062284).