Embed Size (px)
Citation preview
Research ArticlePhase Boundary Mapping in ZrNiSn Half-Heusler for EnhancedThermoelectric Performance
Xiaofang Li,1 Pengbo Yang,1 Yumei Wang,2 Zongwei Zhang,1 Dandan Qin,3 Wenhua Xue,2
Chen Chen,1 Yifang Huang,1 Xiaodong Xie,1 Xinyu Wang,1 Mujin Yang,1 Cuiping Wang,4
Feng Cao,5 Jiehe Sui,3 Xingjun Liu,1,3 and Qian Zhang 1
1Department of Materials Science and Engineering, Institute of Materials Genome & Big Data, Harbin Institute of Technology,Shenzhen, Guangdong 518055, China2Beijing National Laboratory for Condensed Matter Physics, Institute of Physics, Chinese Academy of Sciences, Beijing 100190, China3State Key Laboratory of Advanced Welding and Joining, Harbin Institute of Technology, Harbin, Heilongjiang 150001, China4Department of Materials Science and Engineering, Xiamen University, Xiamen, Fujian 361005, China5Department of Science, Harbin Institute of Technology, Shenzhen, Guangdong 518055, China
Correspondence should be addressed to Jiehe Sui; [email protected], Xingjun Liu; [email protected],and Qian Zhang; [email protected]
Received 29 October 2019; Accepted 22 December 2019; Published 30 January 2020
Copyright © 2020 Xiaofang Li et al. Exclusive Licensee Science and Technology Review Publishing House. Distributed under aCreative Commons Attribution License (CC BY 4.0).
The solubility range of interstitial Ni in the ZrNi1+xSn half-Heusler phase is a controversial issue, but it has an impact on thethermoelectric properties. In this study, two isothermal section phase diagrams of the Zr-Ni-Sn ternary system at 973K and1173K were experimentally constructed based on the binary phase diagrams of Zr-Ni, Zr-Sn, and Ni-Sn. The thermodynamicequilibrium phases were obtained after a long time of heating treatment on the raw alloys prepared by levitation melting.Solubilities of x < 0:07 at 973K and x < 0:13 at 1173K were clearly indicated. An intermediate-Heusler phase with a partly filledNi void was observed, which is believed to be beneficial to the lowered lattice thermal conductivity. The highest ZT value~0:71at 973K was obtained for ZrNi1.11Sn1.04. The phase boundary mapping provides an important instruction for the furtheroptimization of ZrNiSn-based materials and other systems.
1. Introduction
Thermoelectric (TE) materials are semiconducting func-tional materials, which can convert heat energy directly intoelectricity or vice versa [1, 2]. The overall TE performanceof materials is governed by the dimensionless figure-of-merit (ZT), defined as ZT = σS2T/ðκe + κLÞ, where σ is theelectrical conductivity, S the Seebeck coefficient, κe the elec-tronic thermal conductivity, κL the lattice thermal conductiv-ity, and T the absolute temperature. Good TE materialsshould not only have high ZTs, but also be environmentallyfriendly, cost-effective, stable, and strong, which arousesthe interest on the promising half-Heusler alloys. Manystrategies have been proven useful in enhancing the TEperformance in this material system, including carrier con-centration manipulating and energy band tailoring forimproved power factor, and isoelectronic alloying, nano-
structure constructing, and phase separation for loweredlattice thermal conductivity [3–13]. High ZTs > 1:5 havebeen achieved in different kinds of half-Heusler alloys,such as a high ZT~1:52 at 973K for Ta0.74V0.1Ti0.16FeSband a high ZT~1:6 at 1200K for (Nb1−xTax)0.8Ti0.2FeSb(x = 0:36 or 0.4) [14, 15].
A typical half-Heusler crystalizes in a cubic MgAgAs-type structure (space group F�43m) with the general formulaABX, where A and B are both transition metals and X is amain group element. A and X form a rock salt structure withB located at one of the two body diagonal positions (1/4, 1/4,1/4). When the vacant position (3/4, 3/4, 3/4) is fulfilled by B,the AB2X full-Heusler phase (MnCu2Al-type, space groupFm�3m) forms. Lowered lattice thermal conductivity andthe enhanced Seebeck coefficient are often observed in thehalf-Heusler alloy ABX composited with a small amountof the full-Heusler alloy AB2X with coherent boundaries
AAASResearchVolume 2020, Article ID 4630948, 9 pageshttps://doi.org/10.34133/2020/4630948
[16–19]. So, a nonstoichiometric AB1+xX is generallydesigned. However, it is difficult to determine the excessamount of interstitial B atoms since there is a controversialsolid solubility limit of B in the vacant position [20–24].Recently, a convincing study on the solid solubility of Niin the vacant position of TiNi1+xSn half-Heusler has beenconducted by using the phase diagram technique [25].The narrow temperature-dependent solubility range (e.g.,0 ≤ x ≤ 0:06 at 1223K in TiNi1+xSn) was observed throughphase boundary mapping on a Ti-Ni-Sn phase diagram.Many other successful examples have also been reportedrelated to the phase diagram engineering for the enhance-ment of the thermoelectric properties. Tang et al. used aphase diagram approach to design the filling fraction limitof Ce in CoSb3 [26]. Ohno et al. controlled the dopingconcentration of the Zintl phase Ca9Zn4+xSb9 by usingphase boundary mapping [27].
Herein, the phase equilibria of a Zr-Ni-Sn ternary sys-tem at 973K and 1173K were experimentally examined.The obtained isothermal section phase diagrams clearlyindicate the solubility limit of Ni in the vacant positionof ZrNi1+xSn, where x < 0:07 at 973K and x < 0:13 at1173K. Samples with x ≤ 0:13 were selected based on theobtained phase equilibria points at 1173K. The influence ofinterstitial Ni content on the microstructure and thermoelec-tric performance of ZrNi1+xSny alloys was discussed. A maxi-mum ZT value~0:71 was obtained at 973K for ZrNi1.11Sn1.04with the intermediate-Heusler phase but without extradoping. This study provides an important instruction forthe further optimization of ZrNiSn half-Heusler and othermaterial systems.
2. Experimental Section
2.1. Sample Preparation. Zirconium (Zr, 99.7%, shot), nickel(Ni, 99.98%, chunk), and tin (Sn, 99.85%, shot) wereweighted according to the nominal compositions selectedon the basis of the Zr-Ni, Zr-Sn, and Ni-Sn binary phase dia-
grams. The ternary Zr-Ni-Sn button ingots were sealed intothe evacuated quartz tubes with tantalum foil wrapped afterlevitation melting for several times [17, 28]. The quartz tubeswere annealed at 973K for 720 hours and 1173K for 480hours, followed by rapidly quenching into ice water.
Compositions of ZrNi1+xSny (x = 0:02, 0.05, 0.11, and0.13; y was determined by the obtained phase diagram) wereselected under the guidance of a Zr-Ni-Sn ternary isothermalsection phase diagram at 1173K. The melted ingots wereplaced into a stainless-steel jar with stainless-steel balls inan argon-filled glove box, and then ball milled by a high-energy ball mill (SPEX 8000M) for 2 hours. The powderwas loaded into a graphite die with an inner diameter of12.7mm and condensed at 1173K for 10min with an axialpressure of 50MPa by spark plasma sintering (SPS). Therelative density of all the samples is >98%.
2.2. Sample Characterization. The microstructures and com-positions of the annealed ingots were investigated by opticalmicroscopy (OM, 4XC-PC), and electron probe microanaly-sis (EPMA, JOEL, JXA-8100). The crystal structures ofsintered pellets were examined by X-ray diffraction spectraon a Rigaku D/max 2500 PC instrument with Cu Kα
(λ = 1:5418Å) radiation and a scanning rate of 5°min-1.The microstructures of sintered samples were investigatedby a scanning electron microscope (SEM, Hitachi S4700)and a spherical aberration-corrected (Cs-corrected) electronmicroscope (JEM-ARM200F). The Seebeck coefficient (S)and electrical conductivity (σ) were simultaneously measuredon a commercial apparatus (ZEM-3, Advance-Riko) fromroom temperature to 973K. The temperature-dependent Hallcoefficient (RH) was measured using the van-der-Pauwtechnique under a reversible magnetic field of 1.5T. The Hallcarrier concentration (nH) and the Hall mobility (μH) werecalculated via nH = 1/ðeRHÞ and μH = RH/ρ, respectively. Thethermal conductivity (κ) was calculated using κ =DαCp,where D is the volumetric density determined by the
ZrNiSn
Zr
ZrNi2Sn
Ni
Sn Ni
0.0 0.2 0.4 0.6 0.8 1.0200
400
600
800
1000
1200
1400
1600
1800
Calculation [20]
This work
This work
ZrNi1.04Sn [22]
ZrNi1.3Sn [24]
ZrNi1.05Sn [23]
ZrNi1.03Sn [21]
x
HH melting point
T (K
)
Full-Heusler
Half-Heusler
FH +HH
(a) (b)
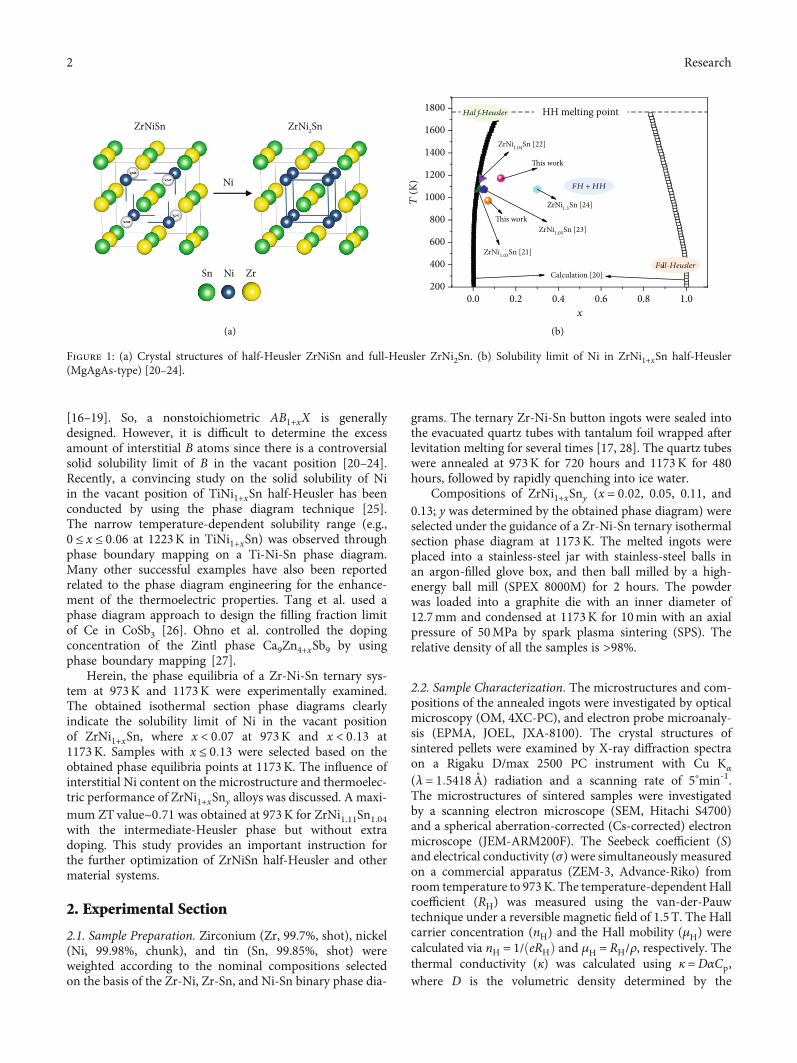
Figure 1: (a) Crystal structures of half-Heusler ZrNiSn and full-Heusler ZrNi2Sn. (b) Solubility limit of Ni in ZrNi1+xSn half-Heusler(MgAgAs-type) [20–24].
2 Research
Archimedes method, α is the thermal diffusivity measuredusing a laser flash technique (Netzsch LFA 457), and Cp isthe specific heat capacity measured by a differential scanningcalorimetry thermal analyzer (Netzsch DSC 404 F3). Theuncertainty for the electrical conductivity is 3%, the Seebeckcoefficient is 5%, and the thermal conductivity is 7% (com-prising uncertainties of 4% for the thermal diffusivity, 5%for the specific heat, and 3% for the density). As a result, thecombined uncertainty for the power factor is 10% and thatfor the ZT value is 13%. The uncertainty for the phase bound-ary is about 3%.
3. Results and Discussion
Figure 1(a) shows the crystal structure of ZrNiSn, where Zroccupies the (1/2, 1/2, 1/2) site, the Ni (1/4, 1/4, 1/4) site,and the Sn (0, 0, 0) site, while the (3/4, 3/4, 3/4) site is vacant.When the vacant position is fulfilled by Ni, the ZrNi2Sn full-Heusler phase forms. To elucidate the transition processfrom half-Heusler to Heusler, the first-principles phase dia-gram calculations have been conducted [24]. As presentedin Figure 1(b), there is a miscibility gap between ZrNiSnand ZrNi2Sn. With the increasing content of interstitial Ni,
Zr5Sn4
ZrNi2Sn
Zr2Ni2Sn
Ni7Zr2Ni10Zr7
Ni3Sn4
Sn2Zr
Ni3Sn2
5Sn4
ZrNiZZr 2Sn
Zr2Ni2SnS
Ni77ZNi10Zr7
Ni33SnSnSn444
SnS 2Zr
N
100
9080
7060
50
4030
20
10Ni
Sn
1020
30
4050
6070
80
90
Zr0 10 20 30 40 50 60 70 80 90 100
Ni (atm%)
Ni (atm%)
Sn (atm%)
Sn (atm%)
Zr (a
tm%)
Zr (a
tm%)
T = 1173 K
30
32
34
36
38
4030 32 34 36 38 40 NiZr
40
38
36
34
32
30
Sn
1 2
73
46
5
1
27
3
4
6
5
Sn
Sn
Sn (atm%)
Zr (a
tm%)
Zr (a
tm%) Sn (atm
%)1020
30
4050
60
70
80
90
Zr0 10 20 30 40 50 60 70 80 90 100
100
9080
7060
50
40
30
20
10Ni
NiNi (atm%)
Ni (atm%)
30 40
38
36
32
34
36
38
4030 32 34 36 38 40
34
32
30
T = 973 K
ZrNi0.98Sn1.06 ZrNi1.07Sn1.08
Zr5Sn3
Zr5Sn4
Sn2Zr
ZrNi2Sn
Zr2Ni2Sn
Ni3Sn4
Ni3Sn2
ZrNi1.01Sn1.10 ZrNi1.13Sn1.03
Sn (atm%)
Zr (a
1020
30
40
100
9080
7060
50
40
30
20
Ni (atm%)
36
38
4030 32 34 36
5Sn3
Zr5Sn4
Sn2ZZrZr
ZrNi2Sn
NiNiNi3SnS 4
NiNiNiNi3Snn22
1 2
345
1 2
4
3
5
(a)
(b)
Zr
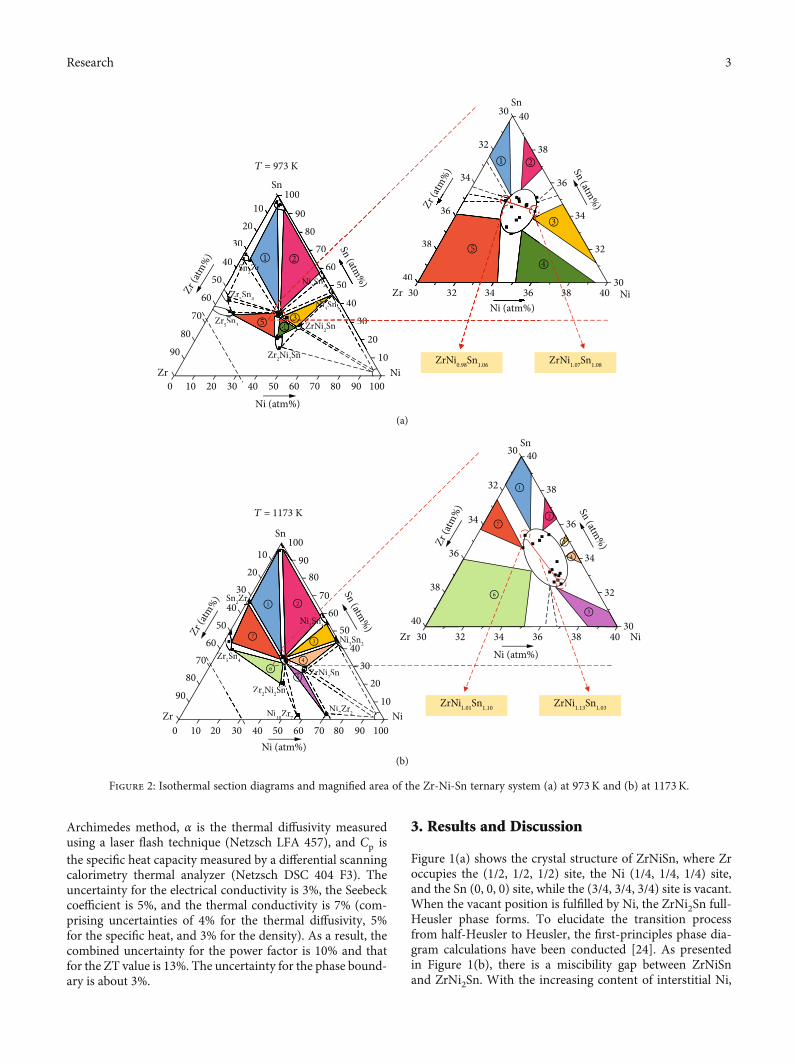
Figure 2: Isothermal section diagrams and magnified area of the Zr-Ni-Sn ternary system (a) at 973K and (b) at 1173K.
3Research
the half-Heusler alloy changes to the composite of half-Heusler with full-Heusler and at last completely changes tothe full-Heusler alloy. With increasing temperature, the solu-bility of Ni increases in the half-Heusler alloy and decreasesin the full-Heusler alloy. Since the half-Heusler phase hassuperior TE properties, more studies are focusing on theboundary of the half-Heusler site. We pointed out thereported experimental solubility limit in ZrNi1+xSn, whichis around 0:03 ≤ x ≤ 0:05 at 1100-1200K [20–22]. Moredifferently, Romaka et al. found this solubility up to x = 0:3at 1100K [23]. By using the phase diagram technique,the boundary seats approximately at x < 0:07 at 973Kand x < 0:13 at 1173K in this work.
To obtain the ternary isothermal section phase diagramof the Zr-Ni-Sn system, we selected the nominal composi-tions according to the binary phase diagram of Zr-Ni,Zr-Sn, and Ni-Sn at 973K and 1173K, respectively (shownin Table S1 and S2; see details for the construction of theisothermal section diagram in Supplementary Information).Based on the phase equilibrium data, the phase mappingboundary of the Zr-Ni-Sn ternary system was confirmed.
Figure 2(a) shows the complete isothermal section diagramand its central magnified area of Zr-Ni-Sn at 973K. At thistemperature, several compounds such as Sn2Zr, Ni3Sn4,Ni3Sn2, ZrNi2Sn, Zr2Ni2Sn, and Zr5Sn3 were detected,indicating five three-phase regions in this phase diagrammarked by different colors. Amplifying the center area,a single phase zone was observed for ZrNi1+xSn(wrapped in an oval), showing that the leftmost componentis ZrNi0.98Sn1.06 and the rightmost component isZrNi1.07Sn1.08. When the temperature increased to 1173K,the number of the three-phase regions increased to seven,including (Sn+Sn2Zr+ZrNiSn), (Sn+Ni3Sn4+ZrNiSn),(Ni3Sn4+Ni3Sn2+ZrNiSn), (Ni3Sn2+ZrNi2Sn+ZrNiSn),(Ni7Zr2+ZrNi2Sn+ZrNiSn), (Zr5Sn4+Zr2Ni2Sn+ZrNiSn),and (Zr5Sn4+Sn2Zr+ZrNiSn), as shown in Figure 2(b).The magnified central area reveals that the leftmostcomponent is ZrNi1.01Sn1.10 and the rightmost componentis ZrNi1.13Sn1.03. The solubility limit of Ni in ZrNi1+xSnhalf-Heusler increased from x = 0:07 at 973K to x = 0:13 at1173K. You can find the typical phase compositionsdetected by back-scattered electron microscopy in Tables S1
T (K)
300 450 600 750 900 10501
10𝜎
(104 S
m–
1 )
T (K) T (K)300 400 500 600 700 800
–0.08
–0.06
–0.04
–0.02
0.00
RH (c
m3 C
–1 )
300 450 600 750 900 1050
–120
–180
–240
–300
ZrNi1.02Sn1.09
ZrNi1.05Sn1.08
ZrNi1.11Sn1.04
ZrNi1.13Sn1.03
S (𝜇
V K
–1 )
T (K)
300 450 600 750 900 1050
1
2
3
4
PF
(10–
3 W m
–1 K
–2 )
(a) (b)
(c) (d)
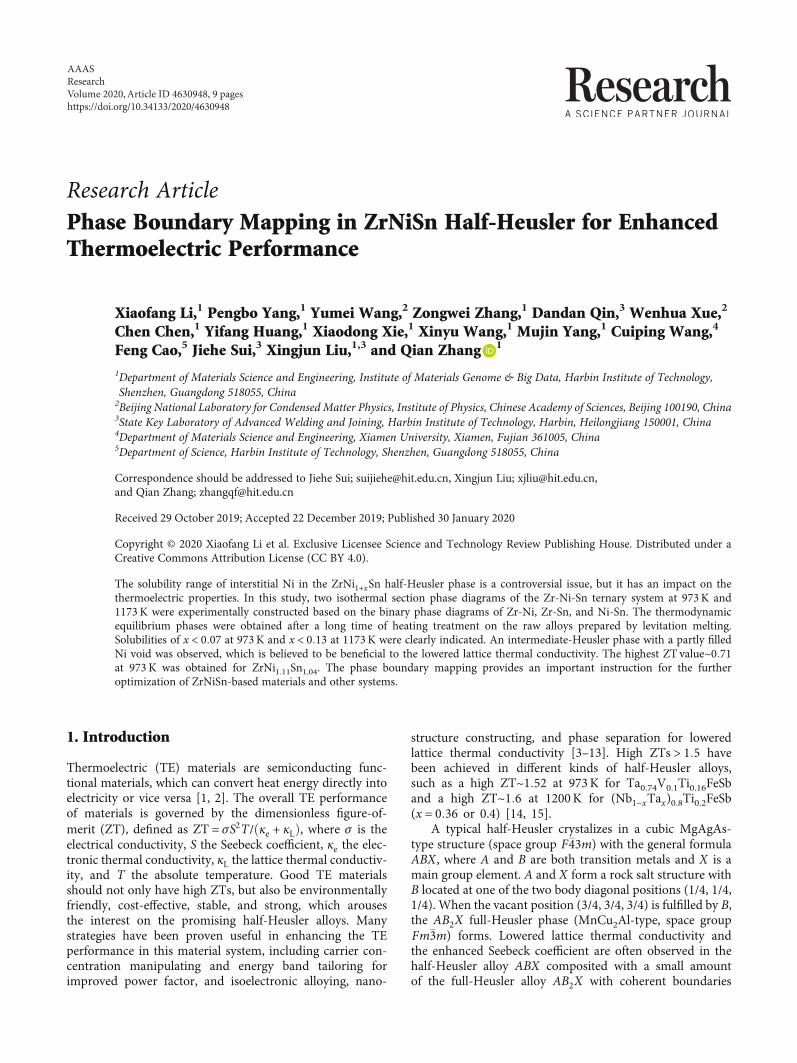
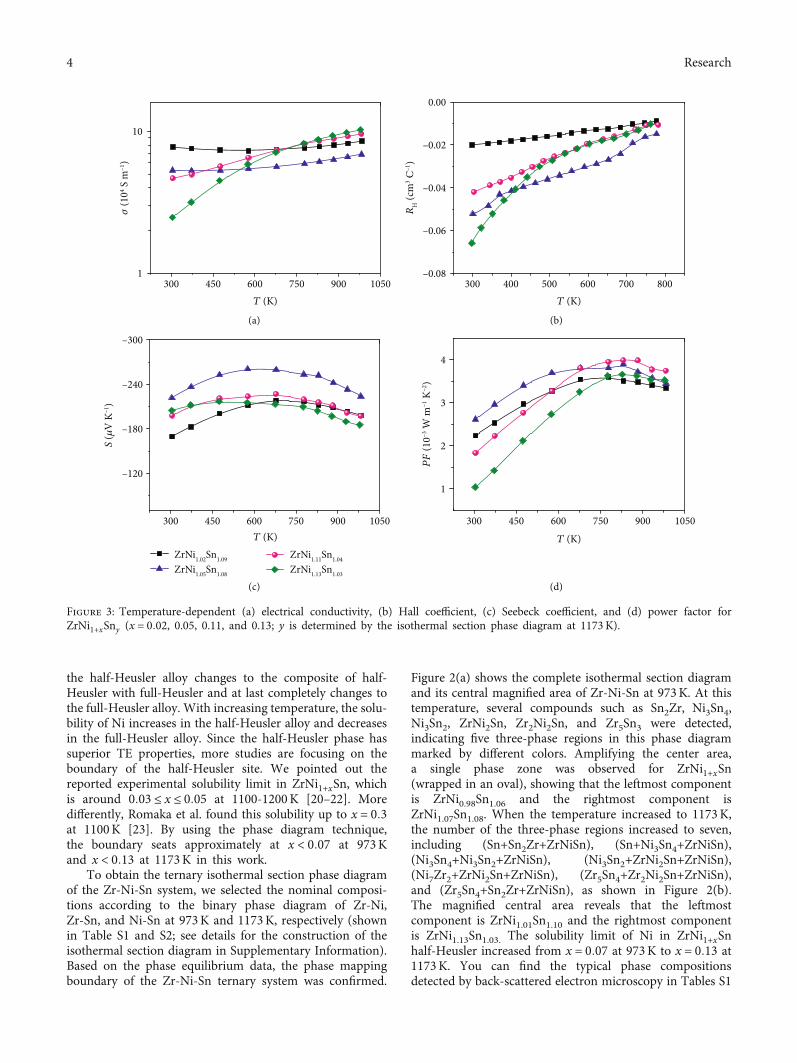
Figure 3: Temperature-dependent (a) electrical conductivity, (b) Hall coefficient, (c) Seebeck coefficient, and (d) power factor forZrNi1+xSny (x = 0:02, 0.05, 0.11, and 0.13; y is determined by the isothermal section phase diagram at 1173K).
4 Research
and S2 and Figures S3 and S4. Since we only focus on theZrNi1+xSn single-phase region, a series of alloy pointsaround the center point were selected for the determinationof some of the three-phase zones. The triangles enclosed bythe black dotted line and the blank parts are trivial.
According to the isothermal section diagram at 1173K(see Figure 2(b)), we selected four compositions within thesingle phase region to study the effect of interstitial Nicontent on the TE performance. Samples with x < 0:13 showa single phase without an additional impurity peak, and thelattice constant increased slightly with increasing Ni content(see Figure S1), indicating that the excess Ni atom mayoccupy the interstitial void in the ZrNiSn half-Heuslermatrix. The full-Heusler phase emerged in the sample withx = 0:13. So it is safe to determine the solubility limit asx < 0:13, considering the experimental error around the
boundary. Figure 3 presents the temperature dependence of(a) the electrical conductivity, (b) the Hall coefficient, (c) theSeebeck coefficient, and (d) the power factor for ZrNi1+xSny(x = 0:02, 0.05, 0.11, and 0.13; y was determined by theisothermal section phase diagram at 1173K). The electricalconductivity of Ni self-doping samples increased withincreasing temperature, exhibiting typical semiconductorbehavior. With the increase of the Ni content, the roomtemperature electrical conductivity decreased, which is dueto the decreased carrier density resulting from the filteringof the low energy electrons at the HH/IH/FH interfaces[18, 29]. It has been reported that when Ni is self-doped,an impurity level will exist within the band gap, leadingto the temperature-dependent carrier concentration,which is consistent with the data shown in Figure 3(b)[30–32]. The Seebeck coefficient increased first and then
300 450 600 750 900 10504
5
6
7
8
9
10
ZrNi1.02Sn1.09
ZrNi1.05Sn1.08
ZrNi1.11Sn1.04
ZrNi1.13Sn1.03
ZrNi1.02Sn1.09
ZrNi1.05Sn1.08
ZrNi1.11Sn1.04
ZrNi1.13Sn1.03
T (K)300 450 600 750 900 1050
3
4
5
6
7
8
9
10
T (K)
35%
1E20 1E210
100
200
300
400
500
This work @300 KThis work @773 K
300 Km⁎ = 3.0 me
|S| (𝜇
V K
–1 )
nH (cm–3)
773 K
300 400 500 600 700 800
10
20
30
40
50
ZrNi1.02Sn1.09
ZrNi1.05Sn1.08
ZrNi1.11Sn1.04
ZrNi1.13Sn1.03
𝜇H (c
m2 V
–1 s–
1 )
T (K)
𝜇 ~ T–0.5
𝜅 (W
m–
1 K–
1 )
𝜅L (W
m–
1 K–
1 )
(a) (b)
(c) (d)
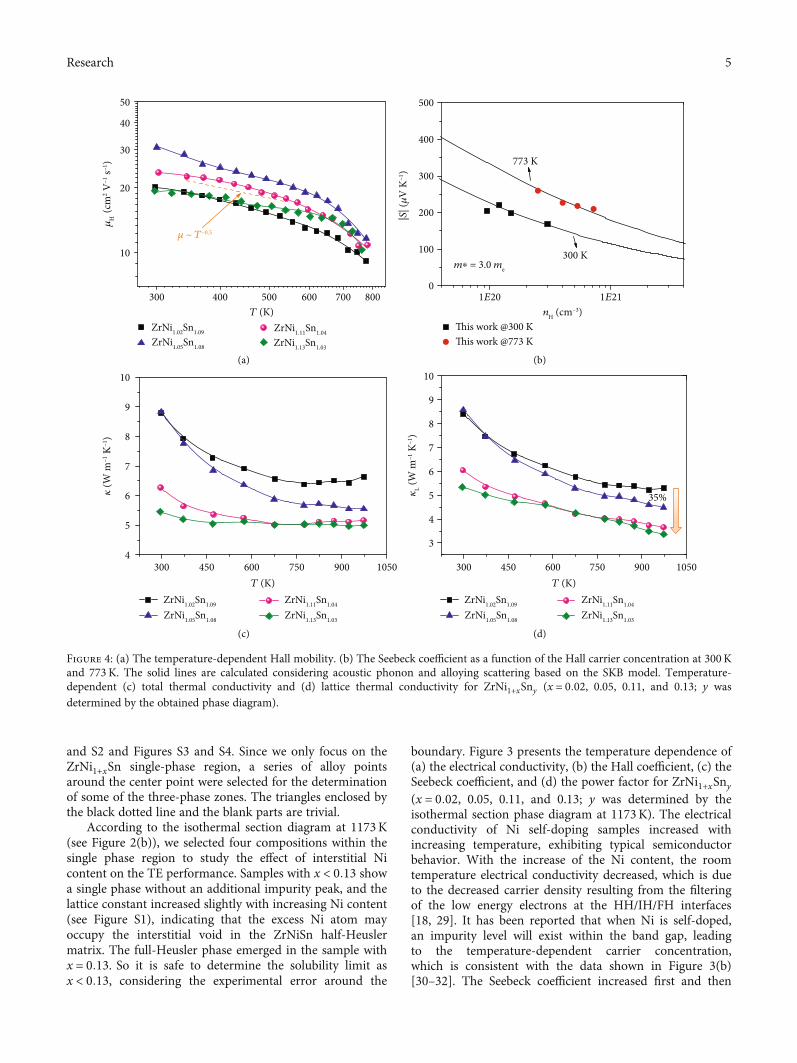
Figure 4: (a) The temperature-dependent Hall mobility. (b) The Seebeck coefficient as a function of the Hall carrier concentration at 300Kand 773K. The solid lines are calculated considering acoustic phonon and alloying scattering based on the SKB model. Temperature-dependent (c) total thermal conductivity and (d) lattice thermal conductivity for ZrNi1+xSny (x = 0:02, 0.05, 0.11, and 0.13; y wasdetermined by the obtained phase diagram).
5Research
decreased when x > 0:05, and the negative value indicatesan n-type conductive behavior, being consistent with theHall measurement. The maximum power factor of~4000μWm-1K-2 was obtained at 830K for the samplewith x = 0:11.
Figure 4(a) shows the temperature-dependent carriermobility, indicating the dominated alloying scattering at atemperature lower than 650K and acoustic phonon scatter-ing at a higher temperature, which is consistent with previousreports [30, 33]. The Pisarenko plot of S versus nH at differenttemperatures is presented in Figure 4(b), which is well fittedby the line calculated based on the single-Kane-band (SKB)model in view of acoustic phonon and alloying scattering[30]. The effective massm∗ = 3:0me was used in this calcula-tion, and more details can be found in the SupplementaryInformation. Figures 4(c) and 4(d) present the temperaturedependence of the thermal properties of the selected samples.The lattice thermal conductivity was ascertained by subtract-ing the electronic contribution from the total, which can beestimated by κL = κ − LσT , where L is the Lorenze number(see details in the Supplementary Information). As theNi content rises, the room-temperature lattice thermalconductivity is reduced from 8.4Wm-1K-1 to 5.3Wm-1K-1,which is lower than those of the reported values of~11.4Wm-1K-1 for ZrNiSn and ~6Wm-1K-1 for ZrNi1.10Snwith a high density of full-Huesler precipitates [34, 35].
Especially, this value is lower than those of the alloyedsamples at ~13Wm-1K-1 for Zr0.9Ti0.1NiSn and ~6Wm-1K-1
for Zr0.7Ti0.3Ni1.03Sn [20, 29]. The lowest lattice thermalconductivity is ~3.4Wm-1K-1 at 973K for ZrNi1.13Sn1.03,suggesting the effective medium-to-high frequency phononscattering [16, 36, 37].
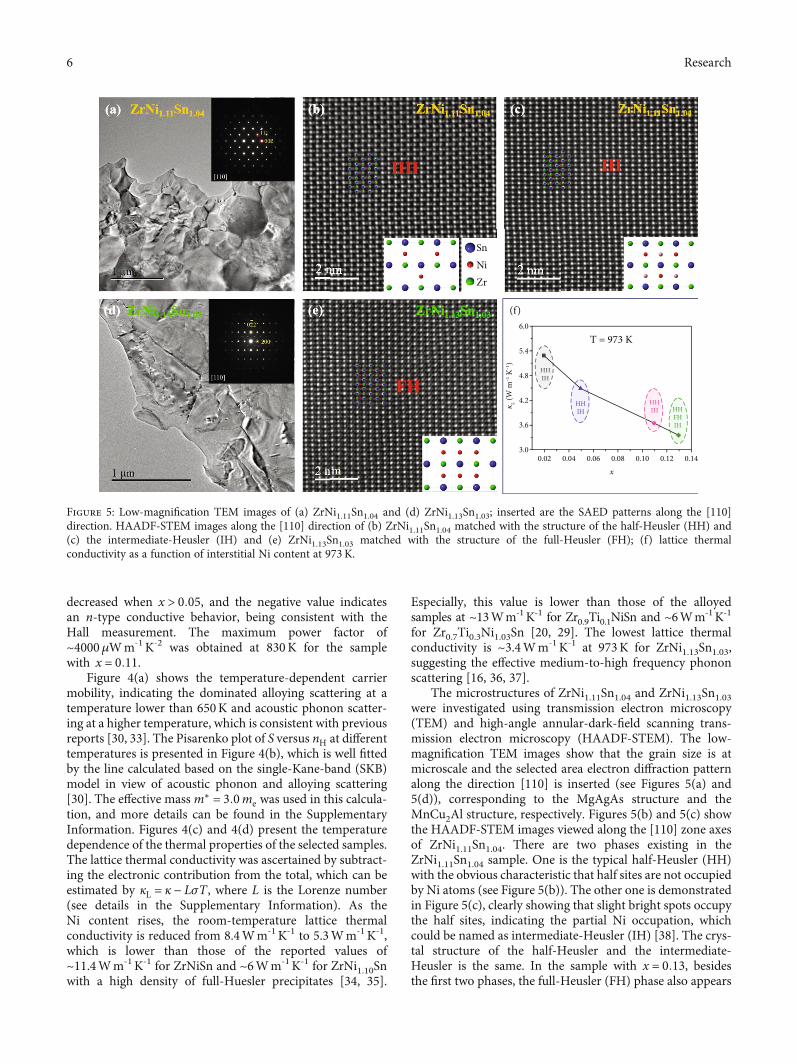
The microstructures of ZrNi1.11Sn1.04 and ZrNi1.13Sn1.03were investigated using transmission electron microscopy(TEM) and high-angle annular-dark-field scanning trans-mission electron microscopy (HAADF-STEM). The low-magnification TEM images show that the grain size is atmicroscale and the selected area electron diffraction patternalong the direction [110] is inserted (see Figures 5(a) and5(d)), corresponding to the MgAgAs structure and theMnCu2Al structure, respectively. Figures 5(b) and 5(c) showthe HAADF-STEM images viewed along the [110] zone axesof ZrNi1.11Sn1.04. There are two phases existing in theZrNi1.11Sn1.04 sample. One is the typical half-Heusler (HH)with the obvious characteristic that half sites are not occupiedby Ni atoms (see Figure 5(b)). The other one is demonstratedin Figure 5(c), clearly showing that slight bright spots occupythe half sites, indicating the partial Ni occupation, whichcould be named as intermediate-Heusler (IH) [38]. The crys-tal structure of the half-Heusler and the intermediate-Heusler is the same. In the sample with x = 0:13, besidesthe first two phases, the full-Heusler (FH) phase also appears
T = 973 K
(f)
0.02
HHIH
HHIH
HHIH HH
FHIH
6.0
5.4
4.8
4.2
3.6
3.00.04 0.06 0.08
x
0.10 0.12 0.14
𝜅L (W
m–
1 K–
1 )
SnNiZr
Figure 5: Low-magnification TEM images of (a) ZrNi1.11Sn1.04 and (d) ZrNi1.13Sn1.03; inserted are the SAED patterns along the [110]direction. HAADF-STEM images along the [110] direction of (b) ZrNi1.11Sn1.04 matched with the structure of the half-Heusler (HH) and(c) the intermediate-Heusler (IH) and (e) ZrNi1.13Sn1.03 matched with the structure of the full-Heusler (FH); (f) lattice thermalconductivity as a function of interstitial Ni content at 973K.
6 Research
(showing in Figure 5(e)). Intuitively, all Ni atoms have thesame brightness and uniformly occupy the half sites. Thisresult is consistent with the analysis of XRD (see Figure S1).In Figure 5(f), the lattice thermal conductivity versus the Nisolubility is displayed. It is generally believed that thepresence of FH reduces the lattice thermal conductivity,which is also confirmed in this study (green symbols)[29, 39]. However, we should pay more attention to theinterstitial Ni in the IH phase before the appearance ofthe FH phase (red symbols), which is significant for thedecrease of the lattice thermal conductivity.
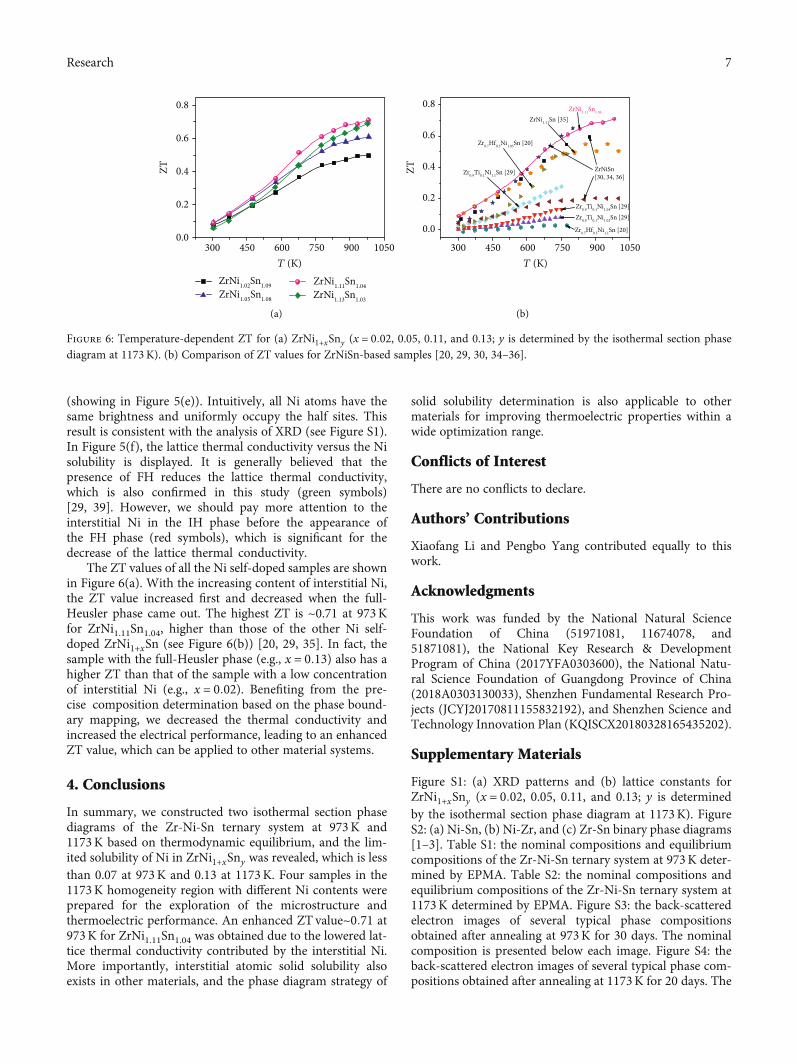
The ZT values of all the Ni self-doped samples are shownin Figure 6(a). With the increasing content of interstitial Ni,the ZT value increased first and decreased when the full-Heusler phase came out. The highest ZT is ~0.71 at 973Kfor ZrNi1.11Sn1.04, higher than those of the other Ni self-doped ZrNi1+xSn (see Figure 6(b)) [20, 29, 35]. In fact, thesample with the full-Heusler phase (e.g., x = 0:13) also has ahigher ZT than that of the sample with a low concentrationof interstitial Ni (e.g., x = 0:02). Benefiting from the pre-cise composition determination based on the phase bound-ary mapping, we decreased the thermal conductivity andincreased the electrical performance, leading to an enhancedZT value, which can be applied to other material systems.
4. Conclusions
In summary, we constructed two isothermal section phasediagrams of the Zr-Ni-Sn ternary system at 973K and1173K based on thermodynamic equilibrium, and the lim-ited solubility of Ni in ZrNi1+xSny was revealed, which is lessthan 0.07 at 973K and 0.13 at 1173K. Four samples in the1173K homogeneity region with different Ni contents wereprepared for the exploration of the microstructure andthermoelectric performance. An enhanced ZT value~0:71 at973K for ZrNi1.11Sn1.04 was obtained due to the lowered lat-tice thermal conductivity contributed by the interstitial Ni.More importantly, interstitial atomic solid solubility alsoexists in other materials, and the phase diagram strategy of
solid solubility determination is also applicable to othermaterials for improving thermoelectric properties within awide optimization range.
Conflicts of Interest
There are no conflicts to declare.
Authors’ Contributions
Xiaofang Li and Pengbo Yang contributed equally to thiswork.
Acknowledgments
This work was funded by the National Natural ScienceFoundation of China (51971081, 11674078, and51871081), the National Key Research & DevelopmentProgram of China (2017YFA0303600), the National Natu-ral Science Foundation of Guangdong Province of China(2018A0303130033), Shenzhen Fundamental Research Pro-jects (JCYJ20170811155832192), and Shenzhen Science andTechnology Innovation Plan (KQISCX20180328165435202).
Supplementary Materials
Figure S1: (a) XRD patterns and (b) lattice constants forZrNi1+xSny (x = 0:02, 0.05, 0.11, and 0.13; y is determinedby the isothermal section phase diagram at 1173K). FigureS2: (a) Ni-Sn, (b) Ni-Zr, and (c) Zr-Sn binary phase diagrams[1–3]. Table S1: the nominal compositions and equilibriumcompositions of the Zr-Ni-Sn ternary system at 973K deter-mined by EPMA. Table S2: the nominal compositions andequilibrium compositions of the Zr-Ni-Sn ternary system at1173K determined by EPMA. Figure S3: the back-scatteredelectron images of several typical phase compositionsobtained after annealing at 973K for 30 days. The nominalcomposition is presented below each image. Figure S4: theback-scattered electron images of several typical phase com-positions obtained after annealing at 1173K for 20 days. The
300 450 600 750 900 10500.0
0.2
0.4
0.6
0.8
ZrNi1.02Sn1.09ZrNi1.05Sn1.08
ZrNi1.11Sn1.04ZrNi1.13Sn1.03
ZT
T (K)300 450 600 750 900 1050
0.0
0.2
0.4
0.6
0.8
ZrNiSn[30, 34, 36]
Zr0.7Hf0.3Ni1.1Sn [20]
Zr0.9Ti0.1Ni1.1Sn [29]
Zr0.9Ti0.1Ni1.04Sn [29]Zr0.9Ti0.1Ni1.02Sn [29]
ZrNi1.11Sn [35]
Zr0.7Hf0.3Ni1.05Sn [20]
ZrNi1.11Sn1.04
ZT
T (K)
(a) (b)
Figure 6: Temperature-dependent ZT for (a) ZrNi1+xSny (x = 0:02, 0.05, 0.11, and 0.13; y is determined by the isothermal section phasediagram at 1173K). (b) Comparison of ZT values for ZrNiSn-based samples [20, 29, 30, 34–36].
7Research
nominal composition is presented below each image. FigureS5: temperature-dependent specific heat capacity Cp forZrNi1.02Sn1.09. (Supplementary Materials)
References
[1] J. Mao, Z. Liu, J. Zhou et al., “Advances in thermoelectrics,”Advances in Physics, vol. 67, no. 2, pp. 69–147, 2018.
[2] W. S. Liu, J. Z. Hu, S. M. Zhang, M. J. Deng, C. G. Han, andY. Liu, “New trends, Strategies and Opportunities in Thermo-electric Materials: A Perspective,” Materials Today Physics,vol. 1, pp. 50–60, 2017.
[3] Y. Liu, C. Fu, K. Xia et al., “Lanthanide contraction as a designfactor for high-performance half-Heusler thermoelectricmaterials,” Advanced Materials, vol. 30, no. 32, article1800881, 2018.
[4] J. P. A. Makongo, D. K. Misra, J. R. Salvador et al., “Thermaland electronic charge transport in bulk nanostructuredZr0.25Hf0.75NiSn composites with full-Heusler inclusions,”Journal of Solid State Chemistry, vol. 184, no. 11, pp. 2948–2960, 2011.
[5] H. Zhu, R. He, J. Mao et al., “Discovery of ZrCoBi based halfHeuslers with high thermoelectric conversion efficiency,”Nature Communications, vol. 9, no. 1, article 2497, 2018.
[6] J. Zhou, H. Zhu, T. H. Liu et al., “Large thermoelectric powerfactor from crystal symmetry-protected non-bonding orbitalin half-Heuslers,”Nature Communications, vol. 9, no. 1, article1721, 2018.
[7] J. Yu, K. Xia, X. Zhao, and T. Zhu, “High performance p-typehalf-Heusler thermoelectric materials,” Journal of Physics D:Applied Physics, vol. 51, no. 11, article 113001, 2018.
[8] R. He, H. Zhu, J. Sun et al., “Improved thermoelectric perfor-mance of N-type half-Heusler MCo1−xNixSb (M=Hf, Zr),”Materials Today Physics, vol. 1, pp. 24–30, 2017.
[9] T. Zhu, C. Fu, H. Xie, Y. Liu, and X. Zhao, “High efficiencyhalf-Heusler thermoelectric materials for energy harvesting,”Advanced Energy Materials, vol. 5, no. 19, article 1500588,2015.
[10] E. Rausch, B. Balke, J. M. Stahlhofen, S. Ouardi, U. Burkhardt,and C. Felser, “Fine tuning of thermoelectric performancein phase-separated half-Heusler compounds,” Journal ofMaterials Chemistry C, vol. 3, no. 40, pp. 10409–10414,2015.
[11] C. Fu, T. Zhu, Y. Liu, H. Xie, and X. Zhao, “Band engineeringof high performance P-type FeNbSb based half-Heusler ther-moelectric materials for figure of merit zT > 1,” Energy &Environmental Science, vol. 8, pp. 216–220, 2015.
[12] C. Fu, S. Bai, Y. Liu et al., “Realizing high figure of merit inheavy-band p-type half-Heusler thermoelectric materials,”Nature Communications, vol. 6, no. 1, article 8144, 2015.
[13] H. Z. Zhao, B. L. Cao, S. M. Li et al., “Engineering the thermo-electric transport in half-Heusler materials through a bottom-up nanostructure synthesis,” Advanced Energy Materials,vol. 7, no. 18, article 1700446, 2017.
[14] H. Zhu, J. Mao, Y. Li et al., “Discovery of TaFeSb-basedhalf-Heuslers with high thermoelectric performance,”Nature Communications, vol. 10, no. 1, article 270, 2019.
[15] J. Yu, C. Fu, Y. Liu et al., “Unique role of refractory ta alloyingin enhancing the figure of merit of NbFeSb thermoelectricmaterials,” Advanced Energy Materials, vol. 8, no. 1, article1701313, 2018.
[16] P. Larson, S. D.Mahanti, andM. G. Kanatzidis, “Structural sta-bility of Ni-containing half-Heusler compounds,” PhysicalReview B, vol. 62, pp. 12754–12762, 2000.
[17] H.-H. Xie, J.-L. Mi, L.-P. Hu et al., “Interrelation betweenatomic switching disorder and thermoelectric properties ofZrNiSn half-Heusler compounds,” CrystEngComm, vol. 14,no. 13, pp. 4467–4471, 2012.
[18] J. P. Makongo, D. K. Misra, X. Zhou et al., “Simultaneouslarge enhancements in thermopower and electrical conduc-tivity of bulk nanostructured half-Heusler alloys,” Journalof the American Chemical Society, vol. 133, no. 46,pp. 18843–18852, 2011.
[19] C. Uher, J. Yang, S. Hu, D. T. Morelli, and G. P. Meisner,“Meisner transport properties of pure and doped MNiSn(M=Zr, Hf),” Physical Review B, vol. 59, no. 13, pp. 8615–8621, 1999.
[20] A. Bhardwaj, N. S. Chauhan, B. Sancheti, G. N. Pandey, T. D.Senguttuvan, and D. K. Misra, “Panoscopically optimizedthermoelectric performance of a half-Heusler/full-Heuslerbased in situ bulk composite Zr0.7Hf0.3Ni1+xSn: an energyand time efficient way,” Physical Chemistry Chemical Physics,vol. 17, pp. 30090–30101, 2015.
[21] N. S. Chauhan, B. Gahtori, B. Sivaiah, S. D. Mahanti, A. Dhar,and A. Bhattacharya, “Modulating the lattice dynamics ofN-type Heusler compounds via tuning Ni concentration,”Applied Physics Letters, vol. 113, no. 1, article 013902, 2018.
[22] Y. Liu, A. Page, P. Sahoo, H. Chi, C. Uher, and P. F.Poudeu, “Electronic and phonon transport in Sb-dopedTi0.1Zr0.9Ni1+xSn0.975Sb0.025 nanocomposites,” Dalton Trans-actions, vol. 43, pp. 8094–8101, 2014.
[23] V. V. Romaka, P. Rogl, L. Romaka et al., “Peculiarities of struc-tural disorder in Zr- and Hf-containing Heusler and half-Heusler stannides,” Intermetallics, vol. 35, pp. 45–52, 2013.
[24] A. Page, C. Uher, P. F. Poudeu, and A. Van der Ven, “Phaseseparation of full-Heusler nanostructures in half-Heusler ther-moelectrics and vibrational properties from first-principlescalculations,” Physical Review B, vol. 92, no. 17, article174102, 2015.
[25] Y. Tang, X. Li, L. H. J. Martin et al., “Impact of Ni content onthe thermoelectric properties of half-Heusler TiNiSn,” Energy& Environmental Science, vol. 11, no. 2, pp. 311–320, 2018.
[26] Y. Tang, R. Hanus, S. W. Chen, and G. J. Snyder, “Solubilitydesign leading to high figure of merit in low-cost Ce-CoSb3skutterudites,” Nature Communications, vol. 6, no. 1, article7584, 2015.
[27] S. Ohno, U. Aydemir, M. Amsler et al., “Achieving zT > 1 ininexpensive Zintl phase Ca9Zn4+xSb9 by phase boundary map-ping,” Advanced Functional Materials, vol. 27, article 1606361,2017.
[28] C. Yu, T.-J. Zhu, R.-Z. Shi, Y. Zhang, X.-B. Zhao, and J. He,“High-performance half-Heusler thermoelectric materialsHf1−xZrxNiSn1−ySby prepared by levitation melting and sparkplasma sintering,” Acta Materialia, vol. 57, pp. 2757–2764,2009.
[29] Y. Liu, P. Sahoo, J. P. Makongo et al., “Large enhancements ofthermopower and carrier mobility in quantum dot engineeredbulk semiconductors,” Journal of the American Chemical Soci-ety, vol. 135, no. 20, pp. 7486–7495, 2013.
[30] H. Xie, H. Wang, C. Fu et al., “The intrinsic disorder relatedalloy scattering in ZrNiSn half-Heusler thermoelectric mate-rials,” Scientific Reports, vol. 4, article 6888, 2014.
8 Research
[31] D. T. Do, S. D. Mahanti, and J. J. Pulikkoti, “Electronic struc-ture of Zr-Ni-Sn systems: role of clustering and nanostructuresin half-Heusler and Heusler limits,” Journal of Physics: Con-densed Matter, vol. 26, article 275501, 2014.
[32] W. G. Zeier, J. Schmitt, G. Hautier et al., “Engineering half-Heusler thermoelectric materials using Zintl chemistry,”Nature Reviews Materials, vol. 1, no. 6, article 16032, 2016.
[33] H. Xie, H. Wang, Y. Pei et al., “Beneficial contribution of alloydisorder to electron and phonon transport in half-Heuslerthermoelectric materials,” Advanced Functional Materials,vol. 23, no. 41, pp. 5123–5130, 2013.
[34] Q. Shen, L. Chen, T. Goto et al., “Effects of partial substitutionof Ni by Pd on the thermoelectric properties of ZrNiSn-basedhalf-Heusler compounds,” Applied Physics Letters, vol. 79,no. 25, pp. 4165–4167, 2001.
[35] Y. W. Chai, T. Oniki, and Y. Kimura, “Microstructure andthermoelectric properties of a ZrNi1.1Sn half-Heusler alloy,”Acta Materialia, vol. 85, pp. 290–300, 2015.
[36] P. Qiu, J. Yang, X. Huang, X. Chen, and L. Chen, “Effect ofantisite defects on band structure and thermoelectric perfor-mance of ZrNiSn half-Heusler alloys,” Applied Physics Letters,vol. 96, no. 15, article 152105, 2010.
[37] A. Katre, J. Carrete, and N. Mingo, “Unraveling the dominantphonon scattering mechanism in the thermoelectric com-pound ZrNiSn,” Journal of Materials Chemistry A, vol. 4,no. 41, pp. 15940–15944, 2016.
[38] A. Kosinskiy, O. B. Karlsen, M. H. Sørby, and Ø. Prytz, “Ter-nary phases (Heusler) in the system Ti-Co-Sn,” Metallurgicaland Materials Transactions E, vol. 3, pp. 329–336, 2016.
[39] B. Gong, Y. Li, F. Liu et al., “Continuously enhanced structuraldisorder to suppress the lattice thermal conductivity ofZrNiSn-based half-Heusler alloys by multielement and multi-site alloying with very low Hf content,” ACS Applied Materials& Interfaces, vol. 11, no. 14, pp. 13397–13404, 2019.
9Research