Embed Size (px)
Citation preview
Philadelphia Water Department9/24/13
Need for PWD to develop water quality models of Delaware and tidal Schuylkill Rivers
Overview of data collection and modeling efforts◦ Hydrodynamics and water quality
Progress to date
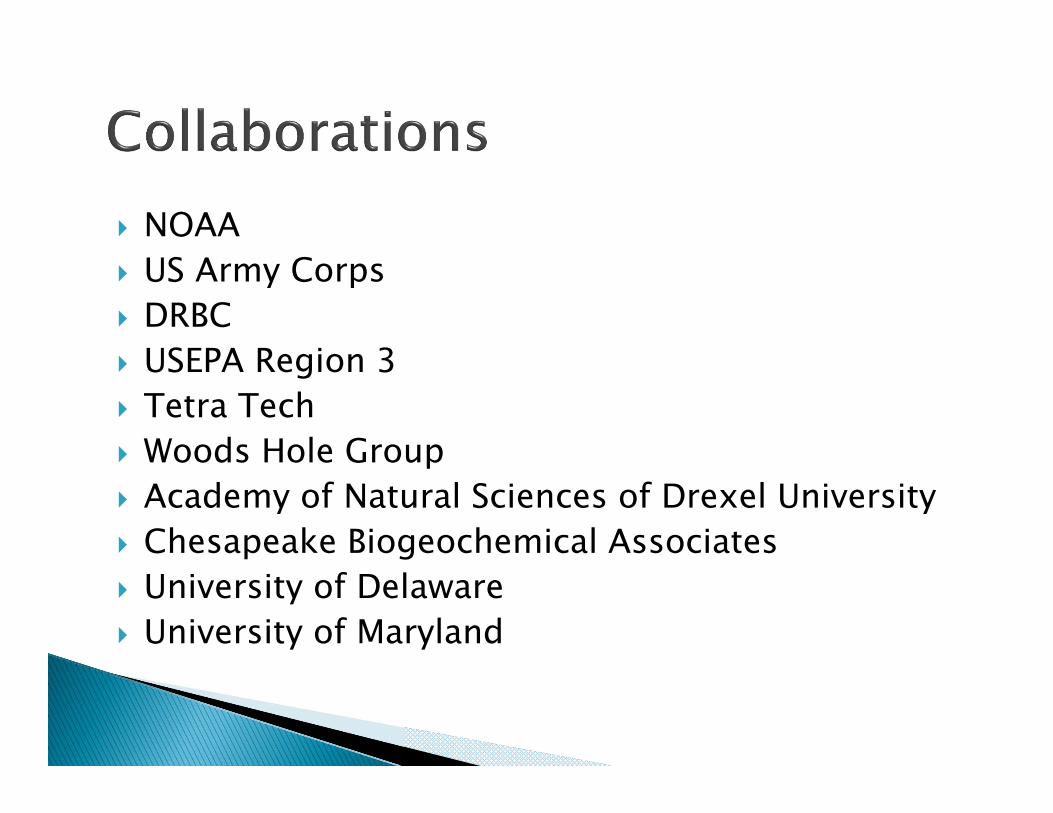
NOAA US Army Corps DRBC USEPA Region 3 Tetra Tech Woods Hole Group Academy of Natural Sciences of Drexel University Chesapeake Biogeochemical Associates University of Delaware University of Maryland
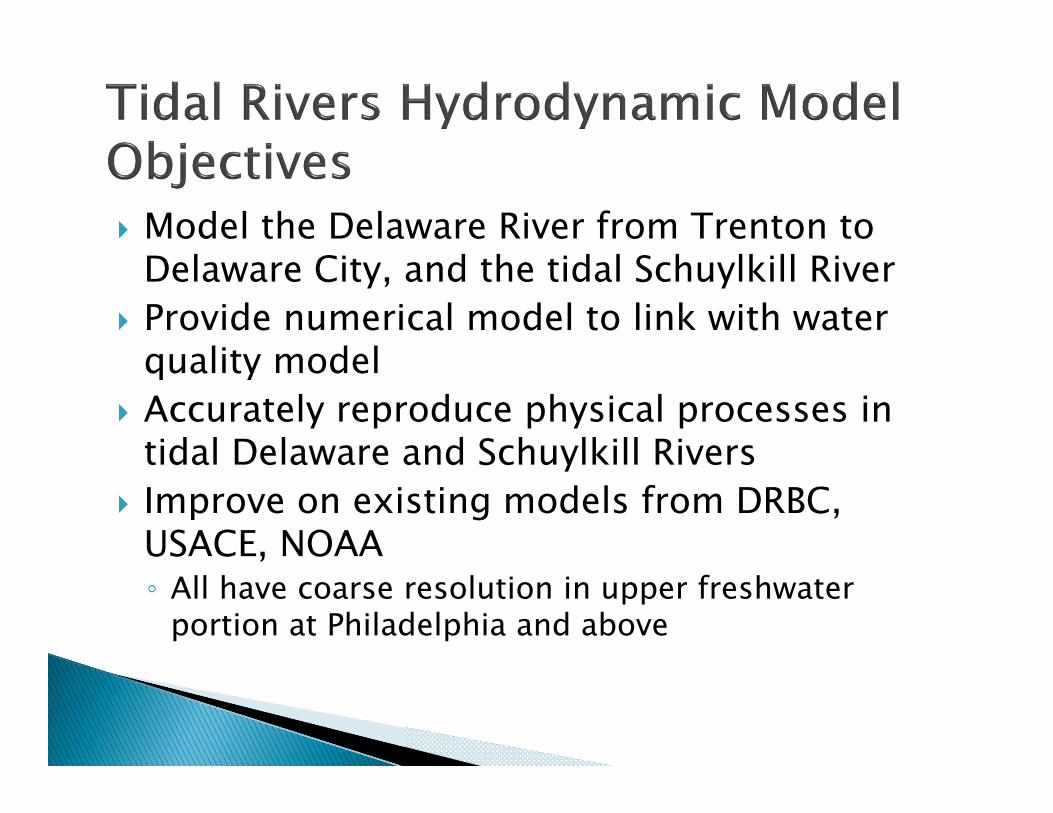
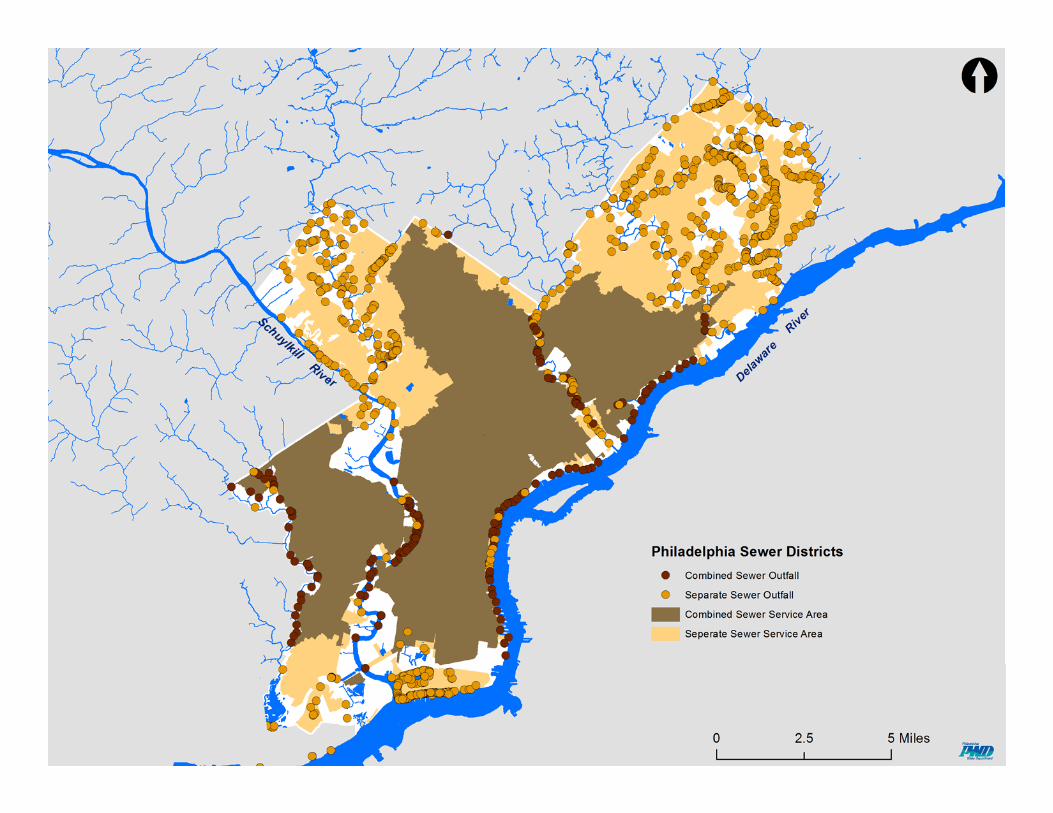
Model the Delaware River from Trenton to Delaware City, and the tidal Schuylkill River
Provide numerical model to link with water quality model
Accurately reproduce physical processes in tidal Delaware and Schuylkill Rivers
Improve on existing models from DRBC, USACE, NOAA◦ All have coarse resolution in upper freshwater
portion at Philadelphia and above
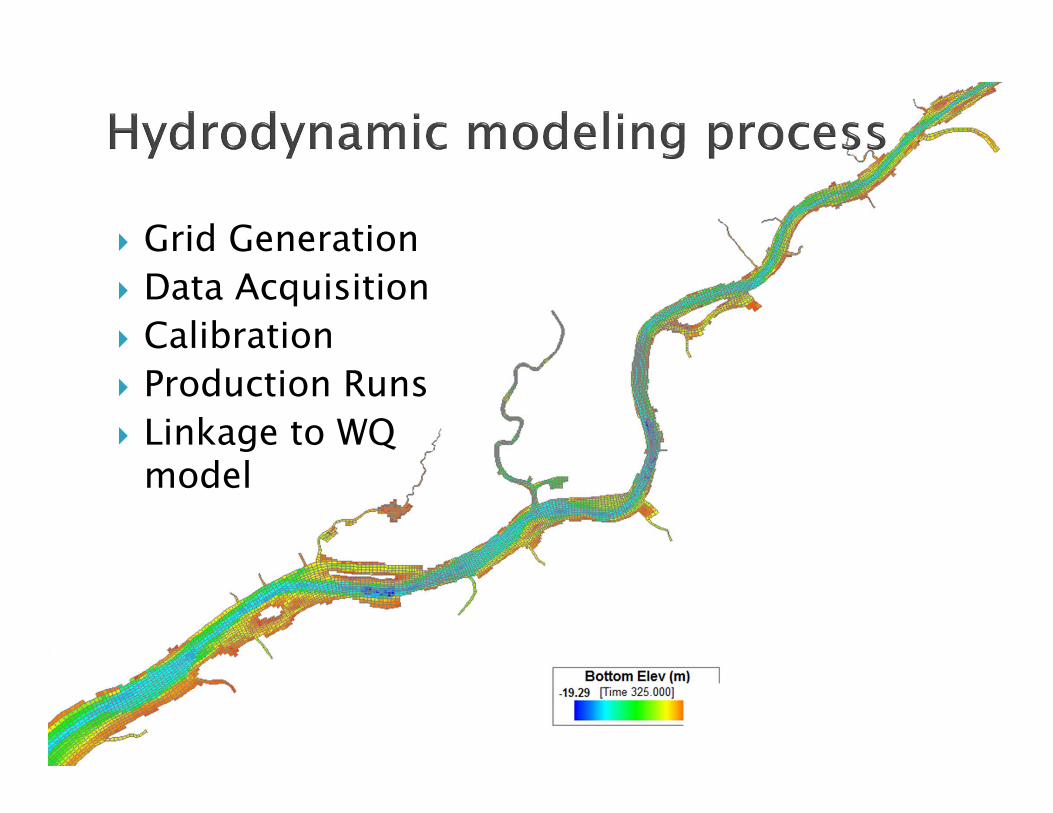
Grid Generation Data Acquisition Calibration Production Runs Linkage to WQ
model
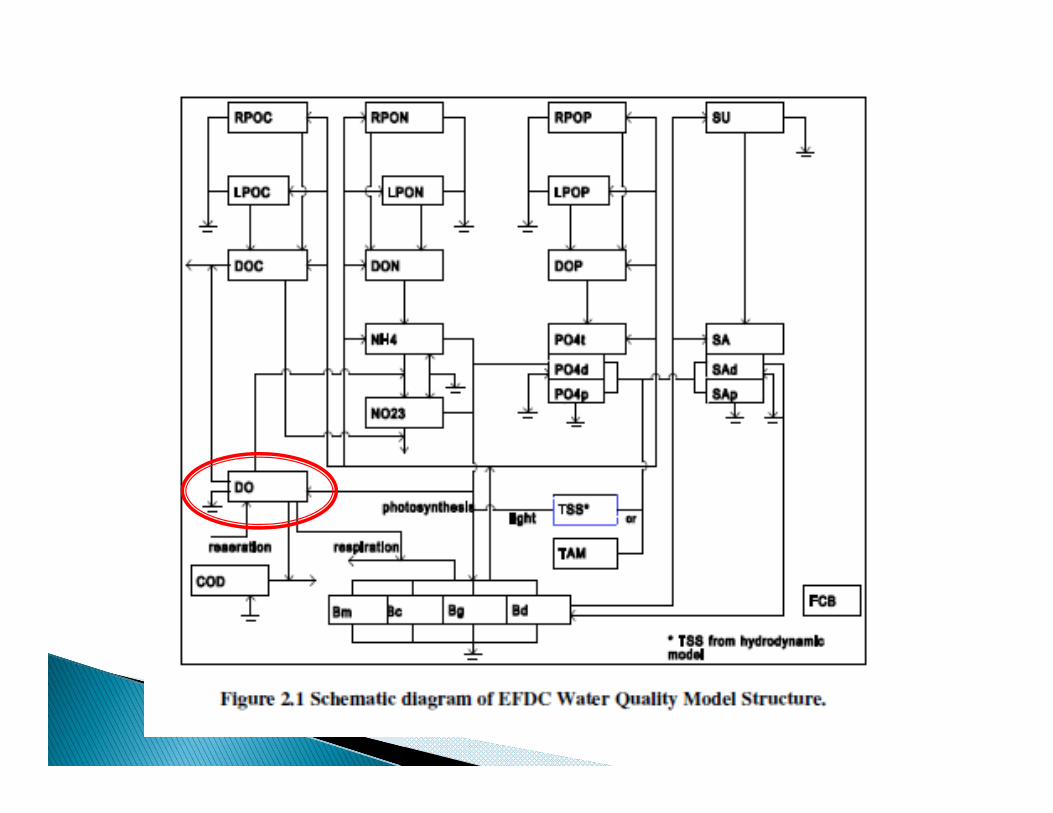
EFDC – Environmental Fluid Dynamics Code Hydrodynamics code capable of 1-, 2- or 3-
dimensional simulations EFDC HD model provides vessel to convey
biological processes One of most widely used, technically
defensible hydrodynamic models worldwide Part of EPA TMDL Toolbox
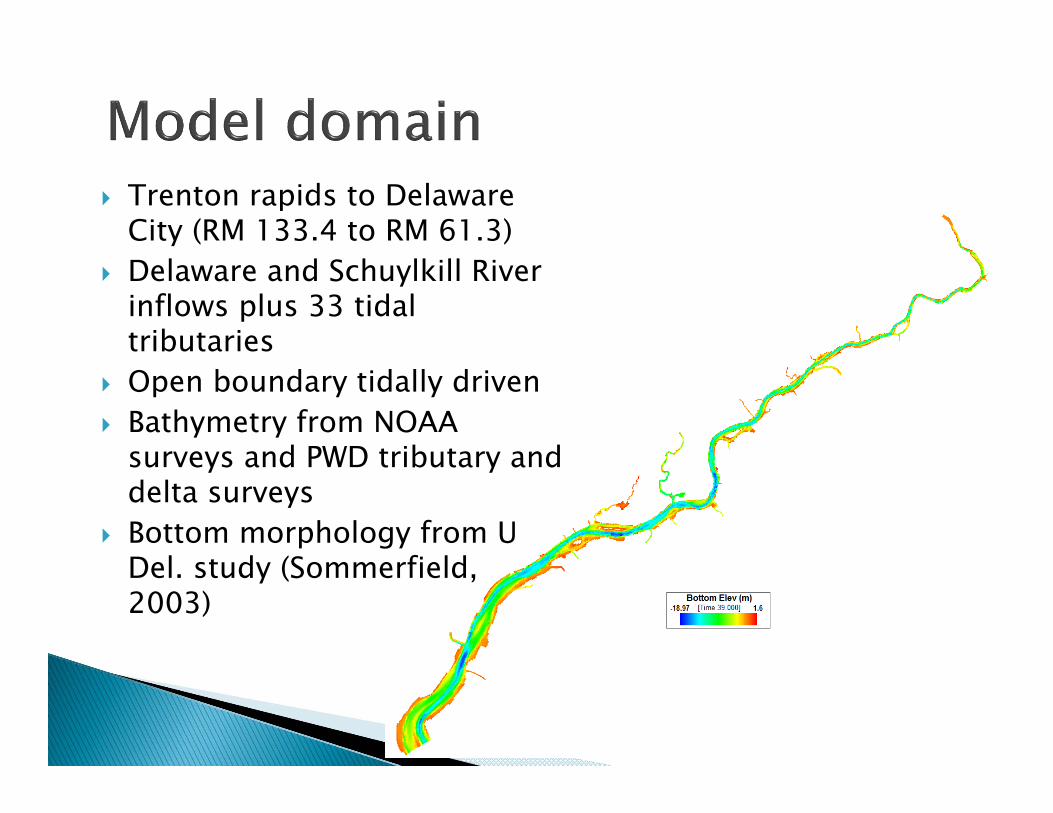
Trenton rapids to Delaware City (RM 133.4 to RM 61.3)
Delaware and Schuylkill River inflows plus 33 tidal tributaries
Open boundary tidally driven Bathymetry from NOAA
surveys and PWD tributary and delta surveys
Bottom morphology from U Del. study (Sommerfield, 2003)
Historic/Contemporary◦ NOS Del River & Bay Circulation Survey: 1984-85◦ NOAA PORTS◦ NCDC Meteorological Data◦ USGS/NWIS discharge, conductivity, temp◦ NOAA/NOS bathymetry surveys
Contemporary◦ PWD/WHG Current Meter Deployment◦ USACE Bathymetry◦ PWD tributary bathymetry survey
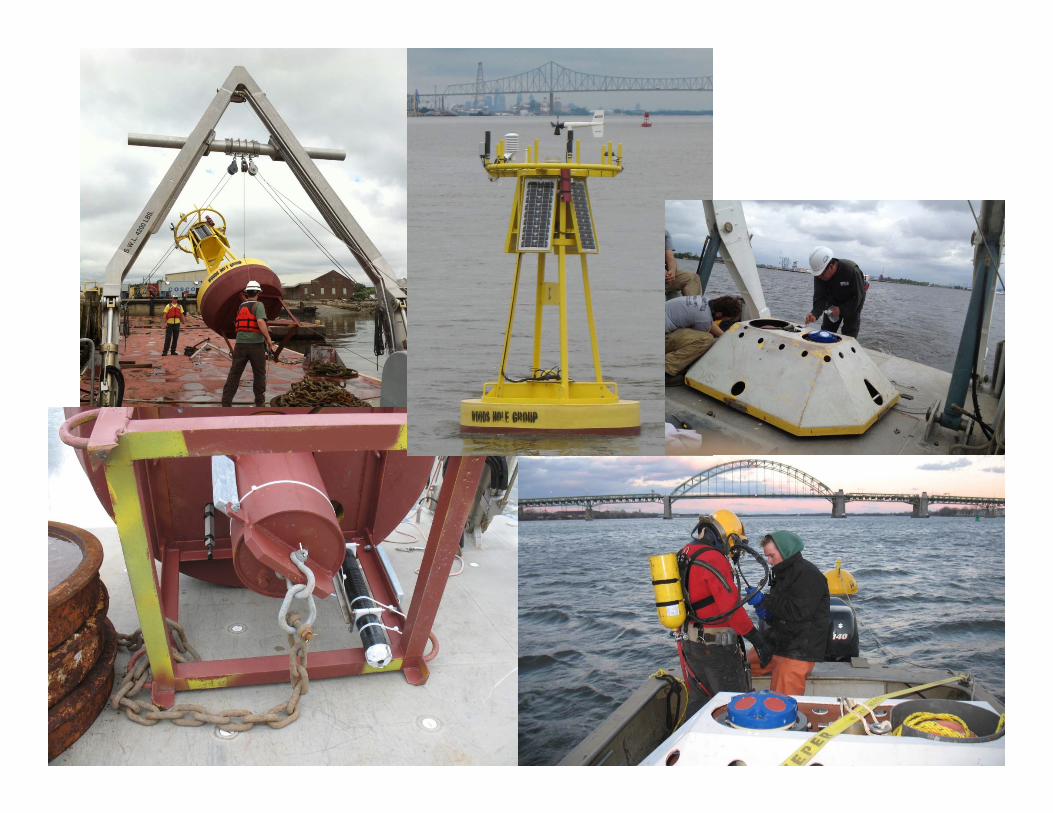
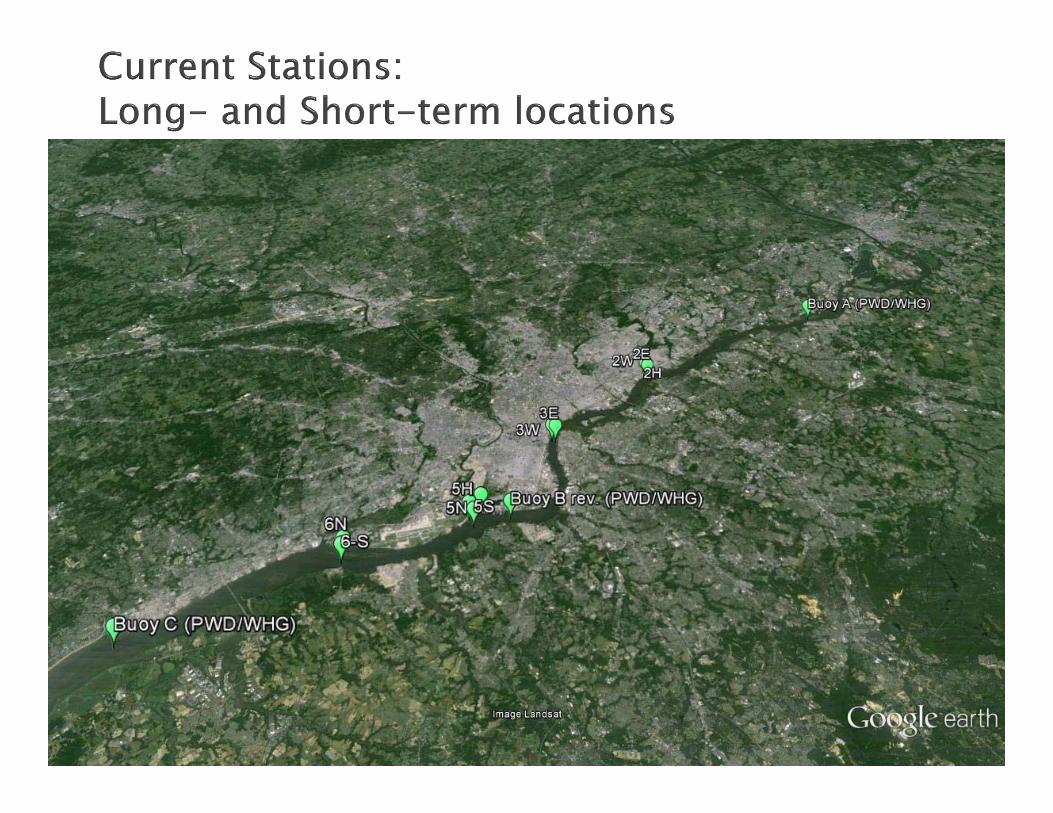
Current meter deployment◦ Long term: 3 Acoustic Doppler Current Profilers
(ADCPs) (≥1 year) Characterize current at different depths in the water
column 3 meters recording reliable data since August 2012
(Burlington, Eagle Point, Marcus Hook)◦ Short term: 4 sites with combination of side looking
and bottom mounted ADCPs (30 day) Characterize current across a transect
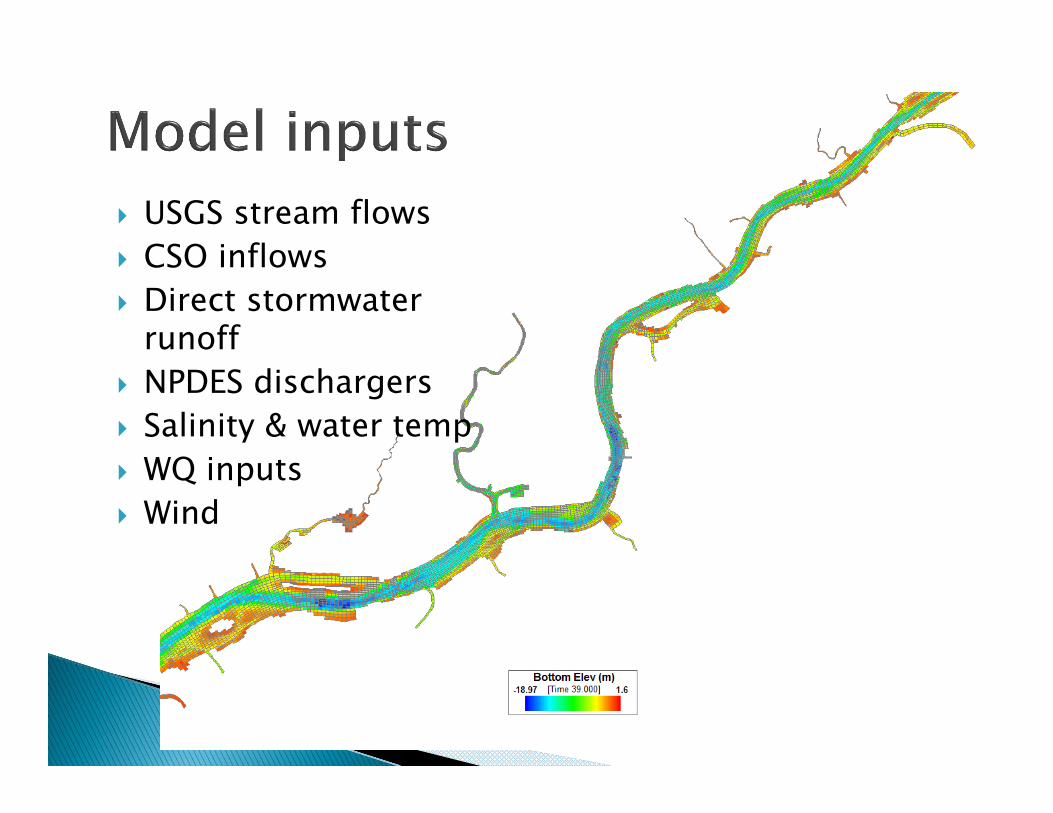
USGS stream flows CSO inflows Direct stormwater
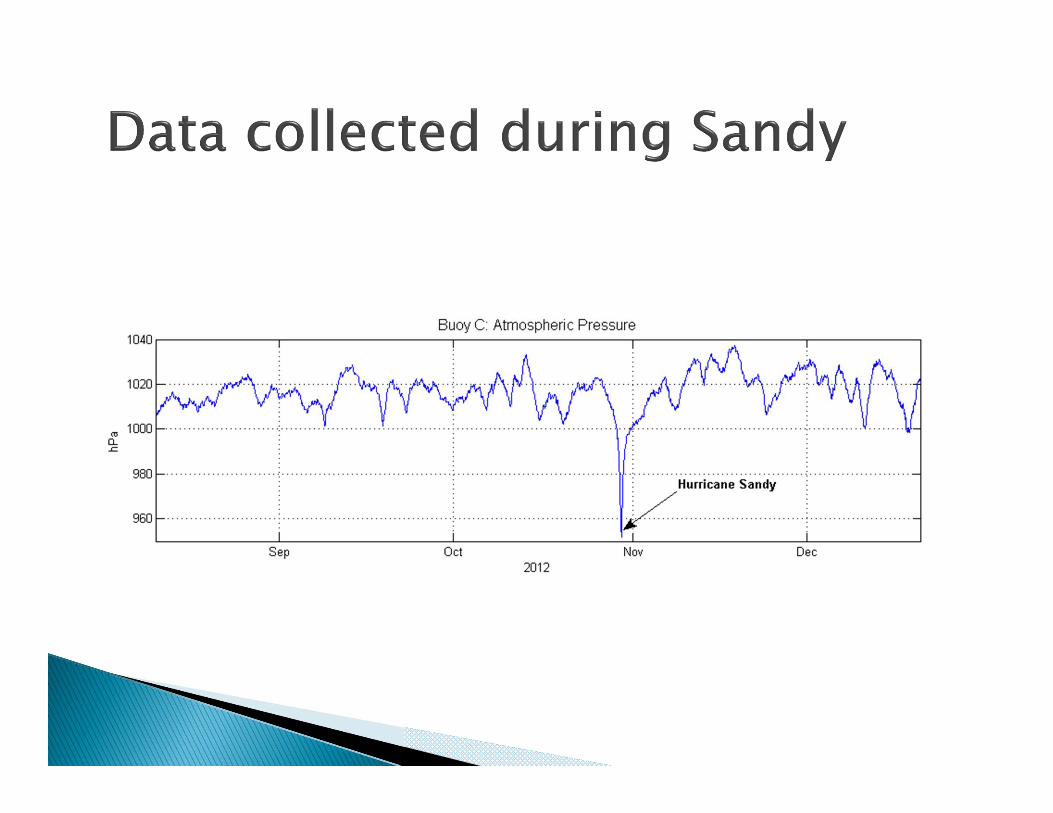
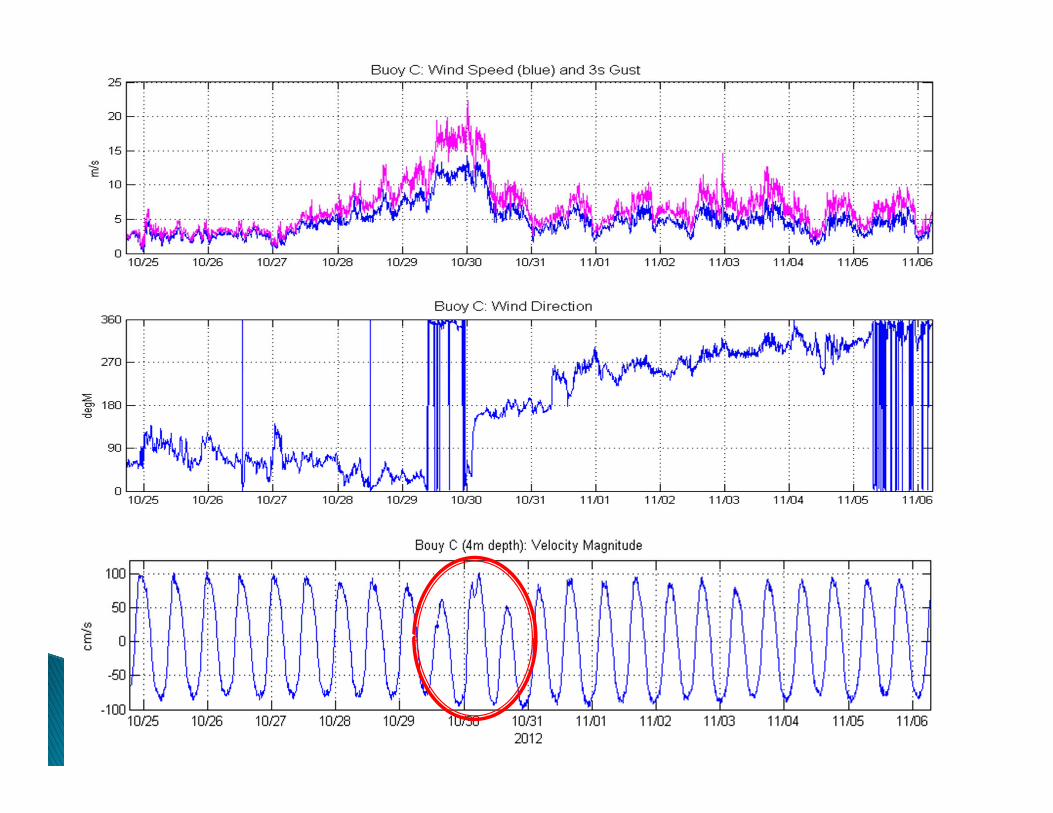
runoff NPDES dischargers Salinity & water temp WQ inputs Wind
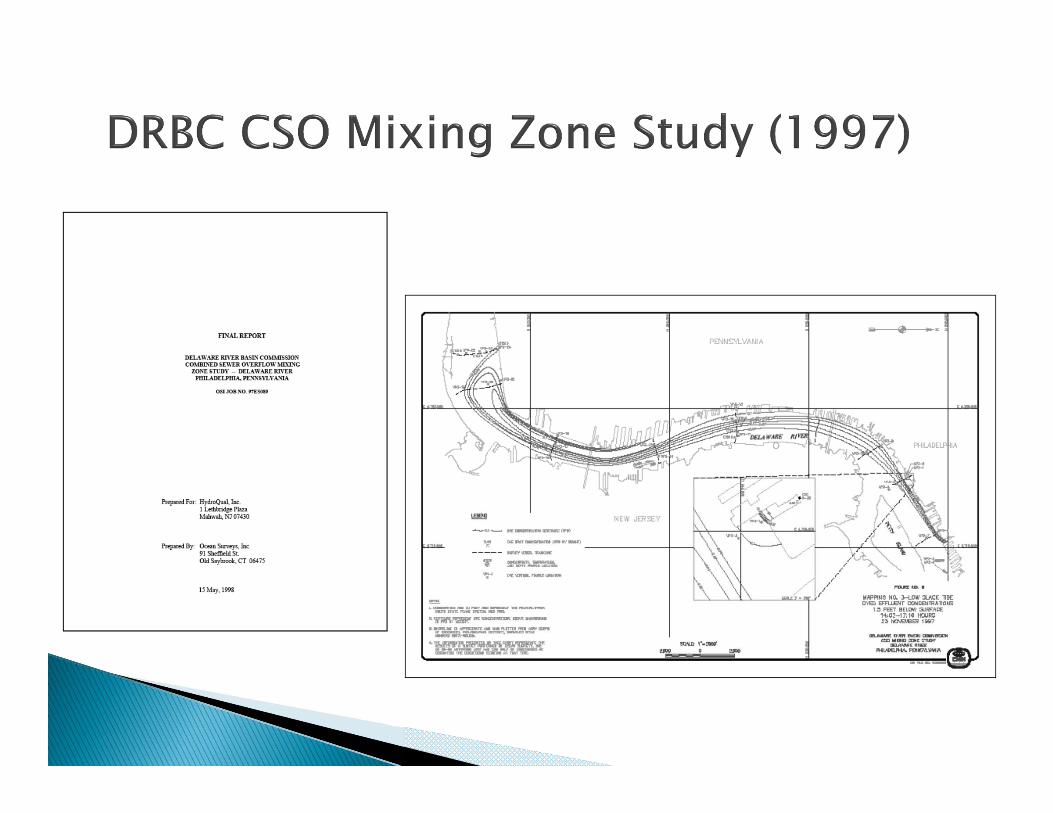
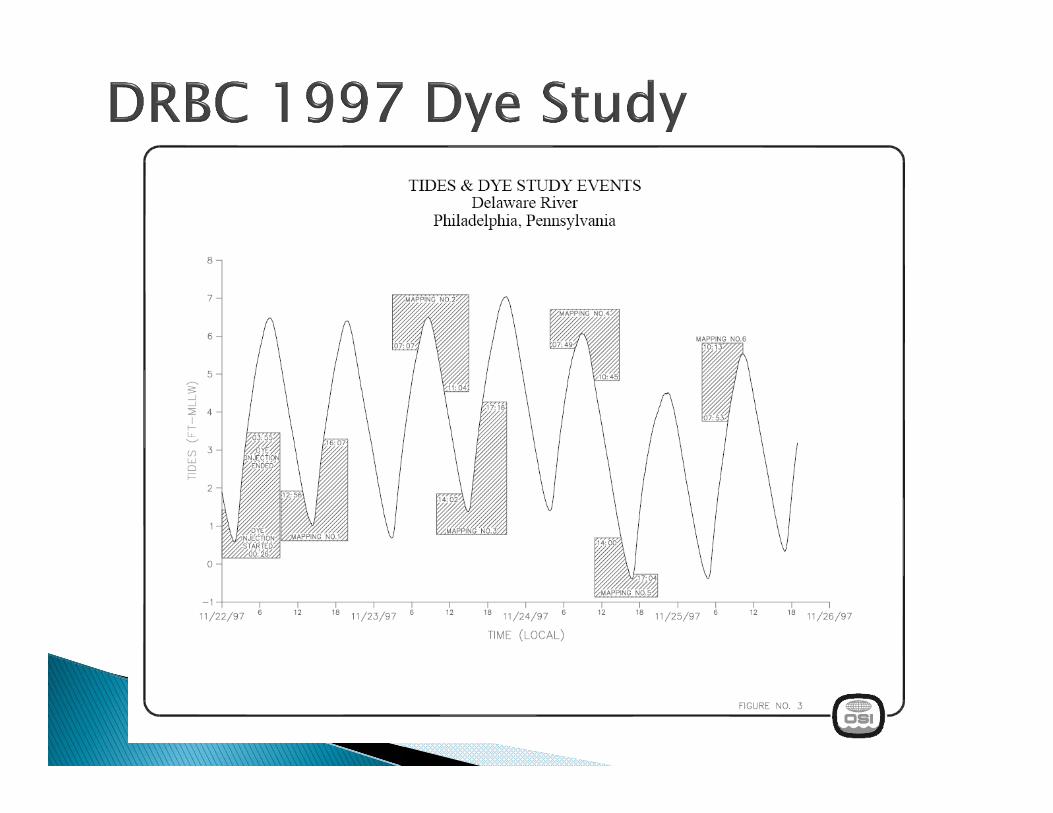
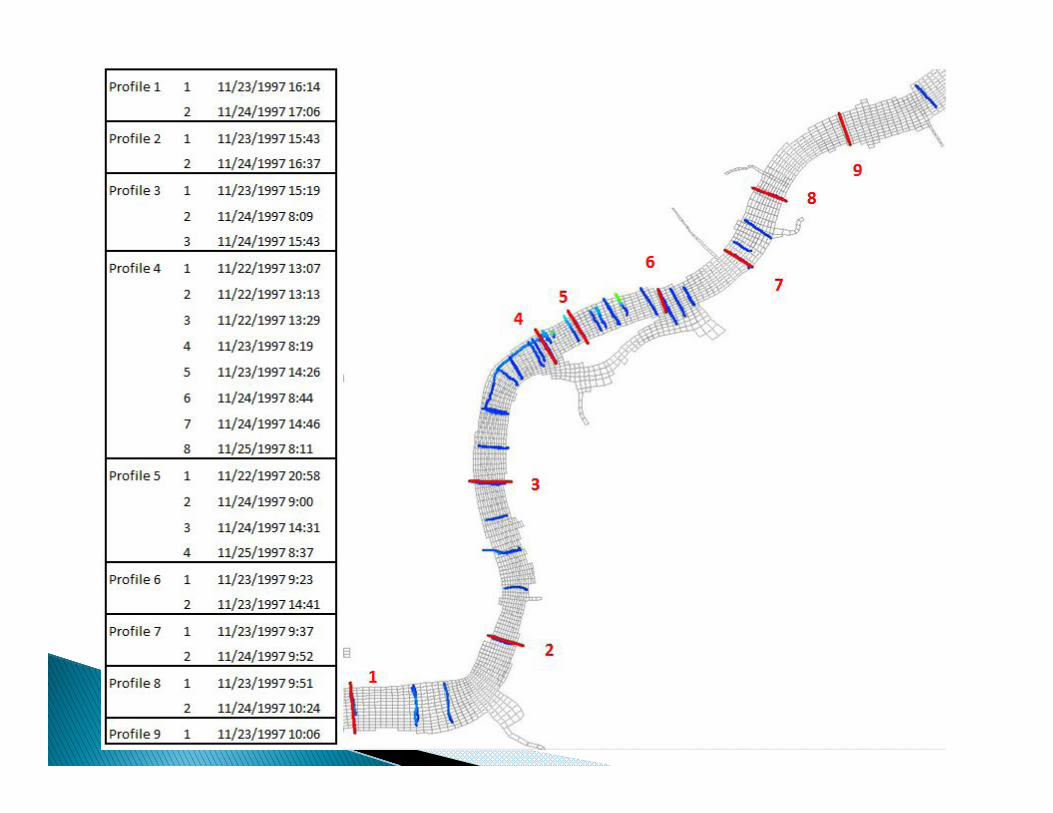
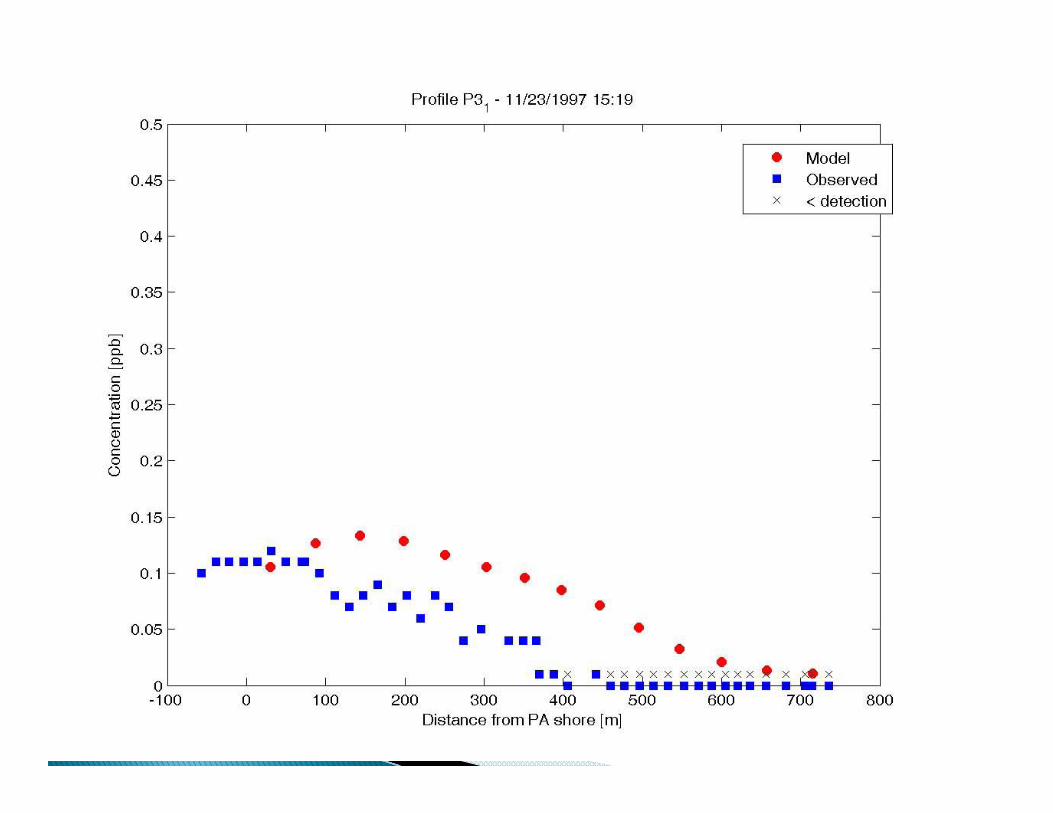
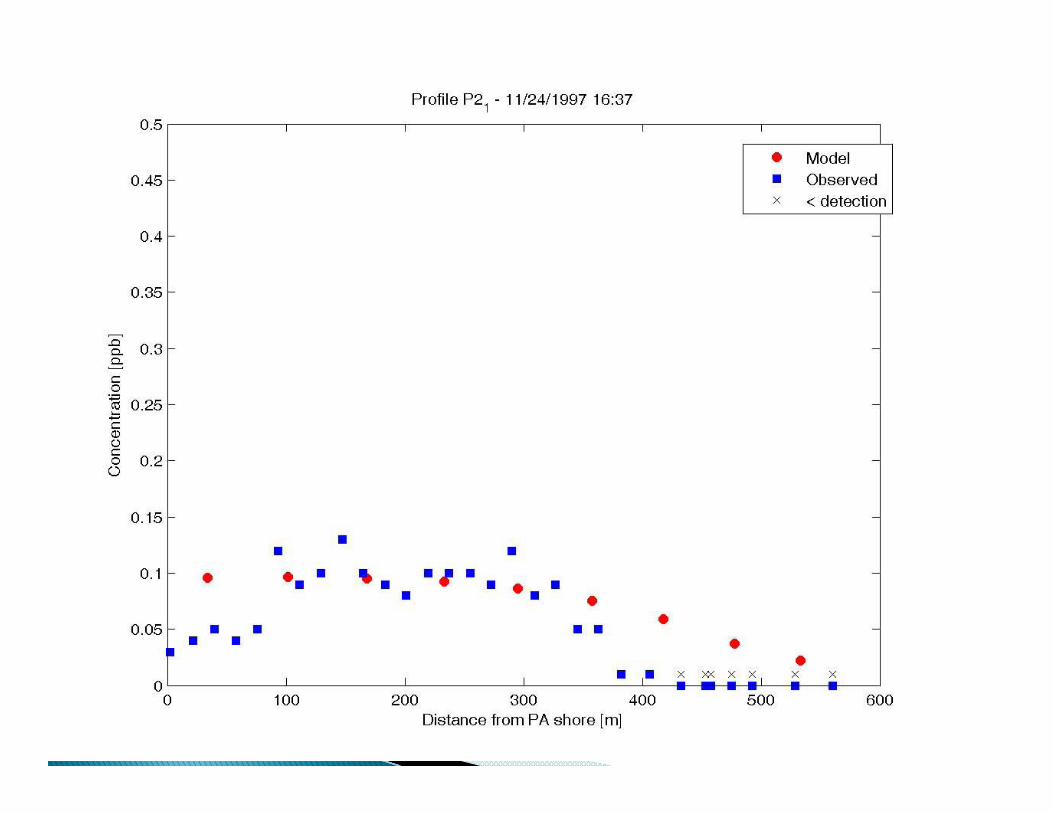
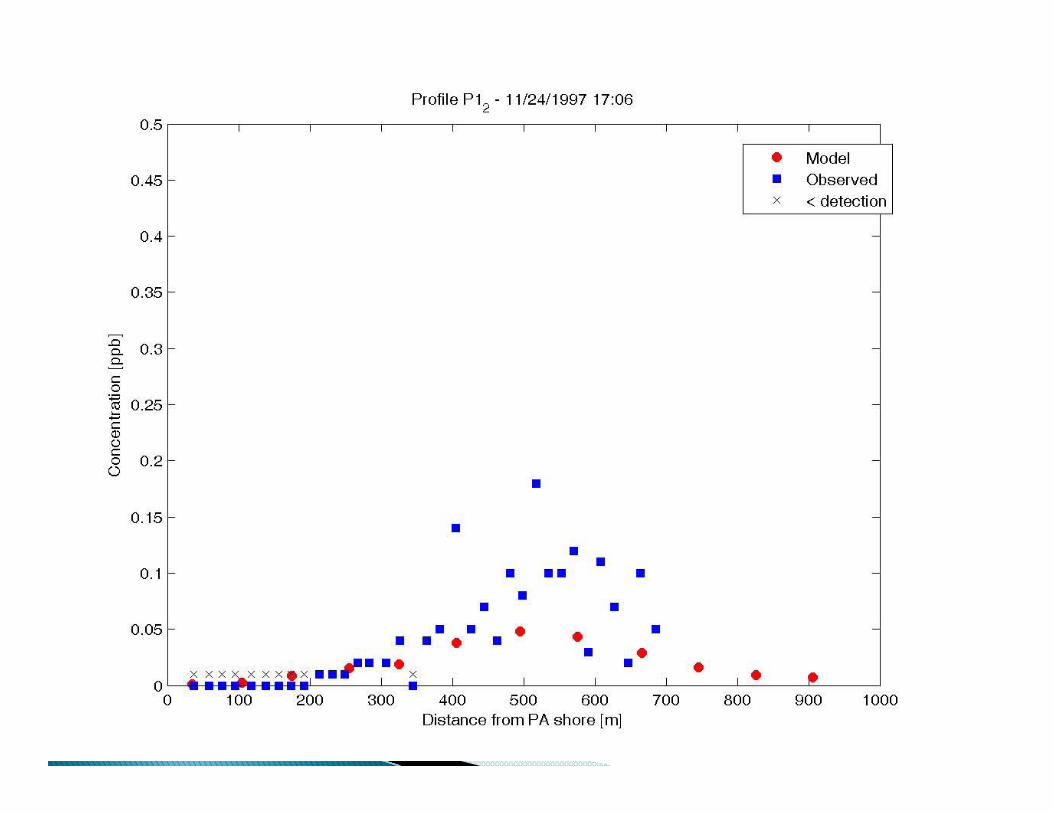
Disturbance from wind event Only 2 dye profiles were provided at high and
low slack tide per 24 hours A single sampling window included both
flood and ebb No sampling occurred at night No mass balance analysis on injected dye
Conduct at dry weather in summer (target low discharge, no wind conditions)
4 dye profiles per tidal cycle (~ one profile per 3 hours); 24 hour coverage for 6 tidal cycles
Characterize entire longitudinal and lateral extent of plume
Further step in model validation Requires funding partners
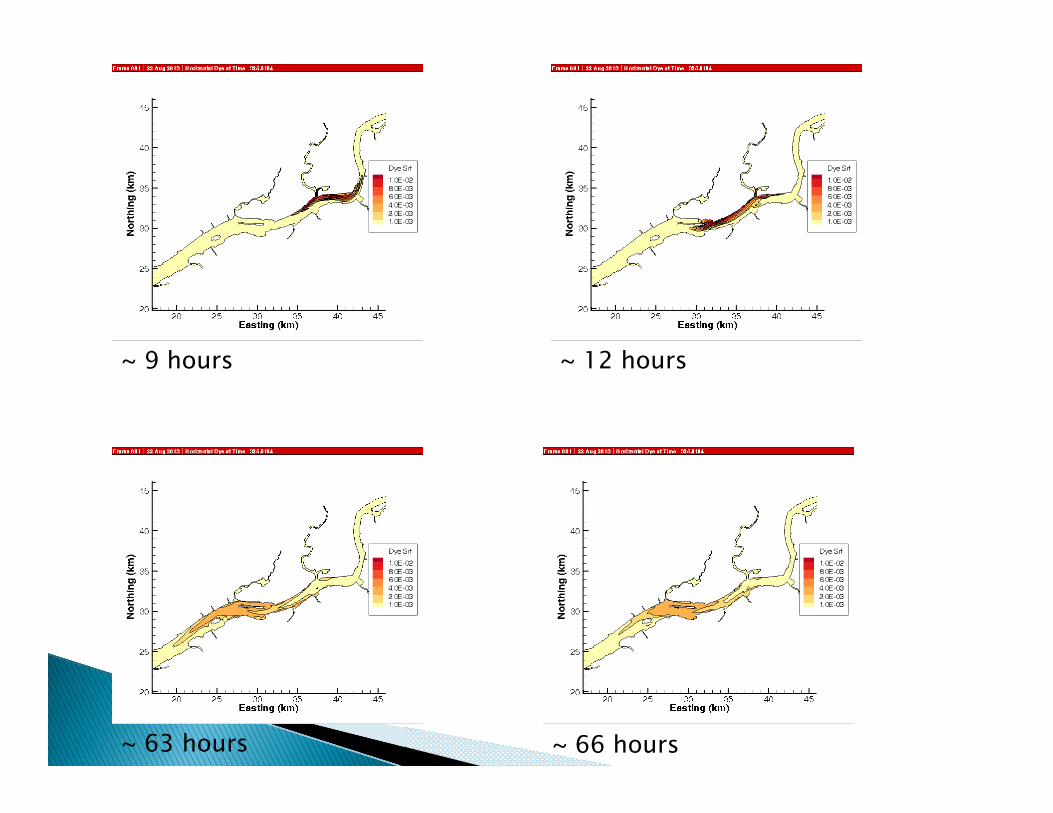
~ 9 hours ~ 12 hours
~ 63 hours ~ 66 hours
Simulate fate and transport of bacteria and dissolved oxygen processes in model domain
Reflect observed spatial and temporal trends Utilize contemporary and past data sources
for model input and validation Investigate relative effects of various sources
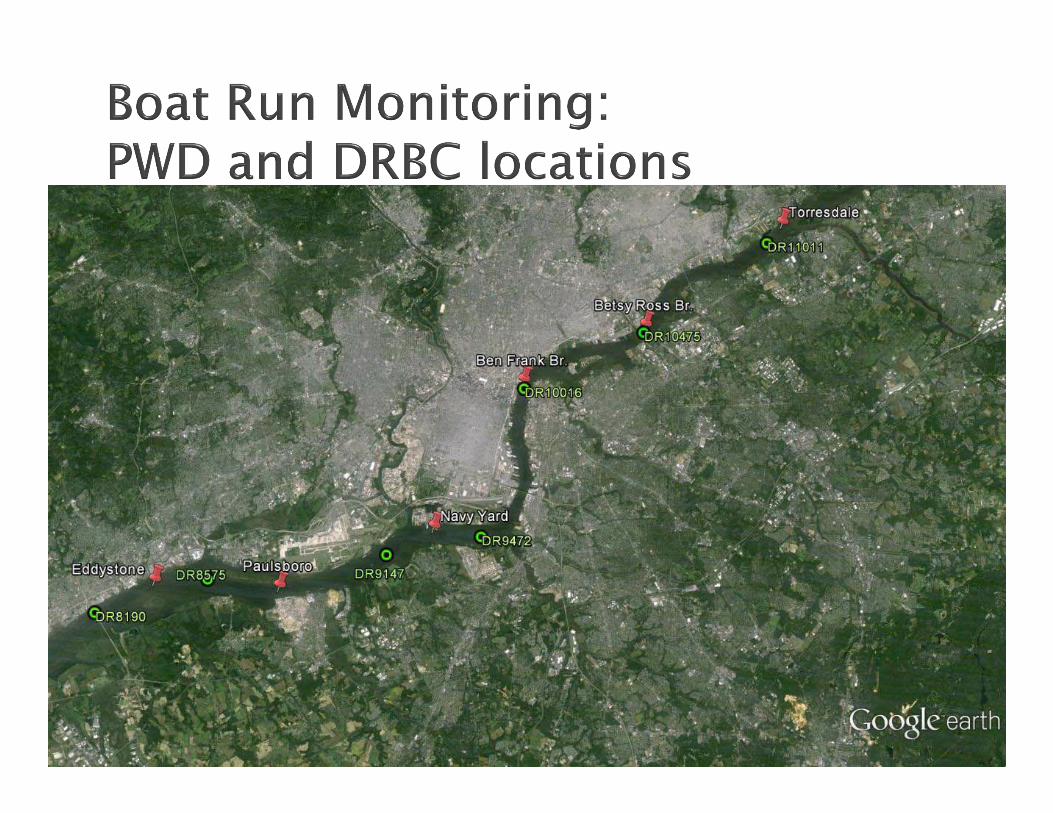
Use EFDC Water Quality model Data collection◦ Compiling existing data from other sources DRBC, U Delaware, state agencies, USGS etc.◦ PWD monthly boat runs at low tide (with EPA Region
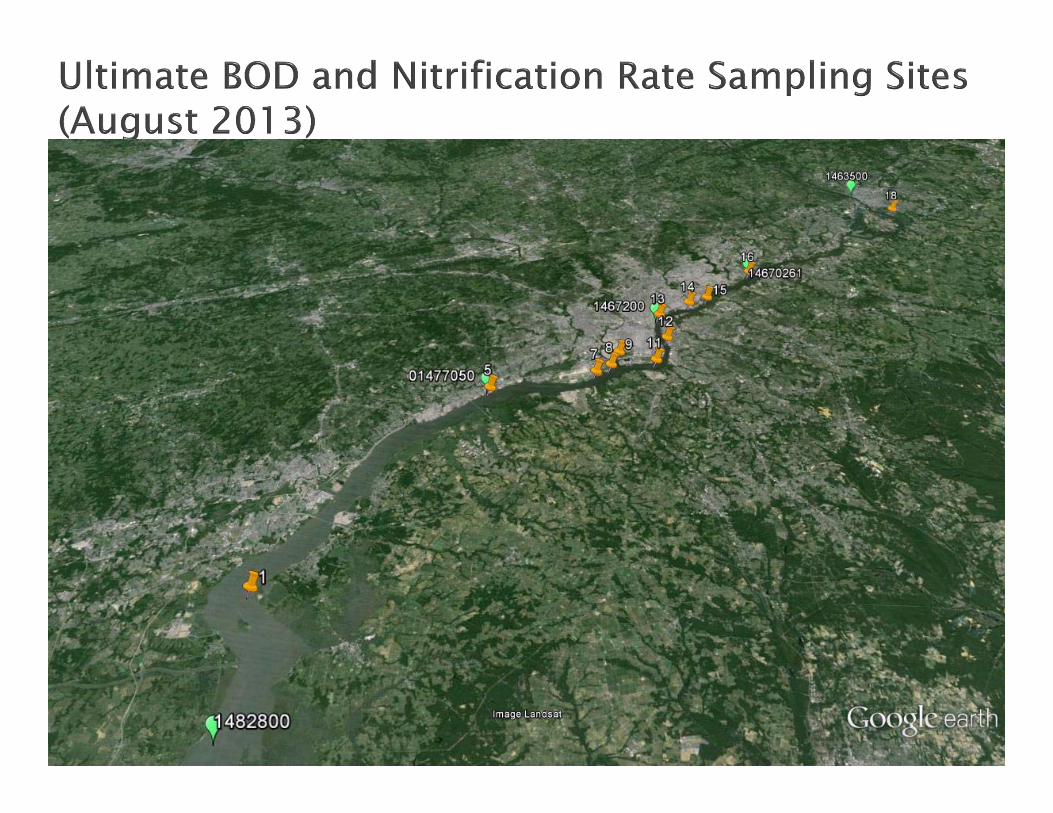
3 support) since June 2011◦ SOD and surrogate parameter study◦ Sediment nutrient fluxes study◦ Ultimate BOD and nitrification rate analyses
Model segmentation, setting of boundary conditions, parameterization etc. planned to begin in 2014
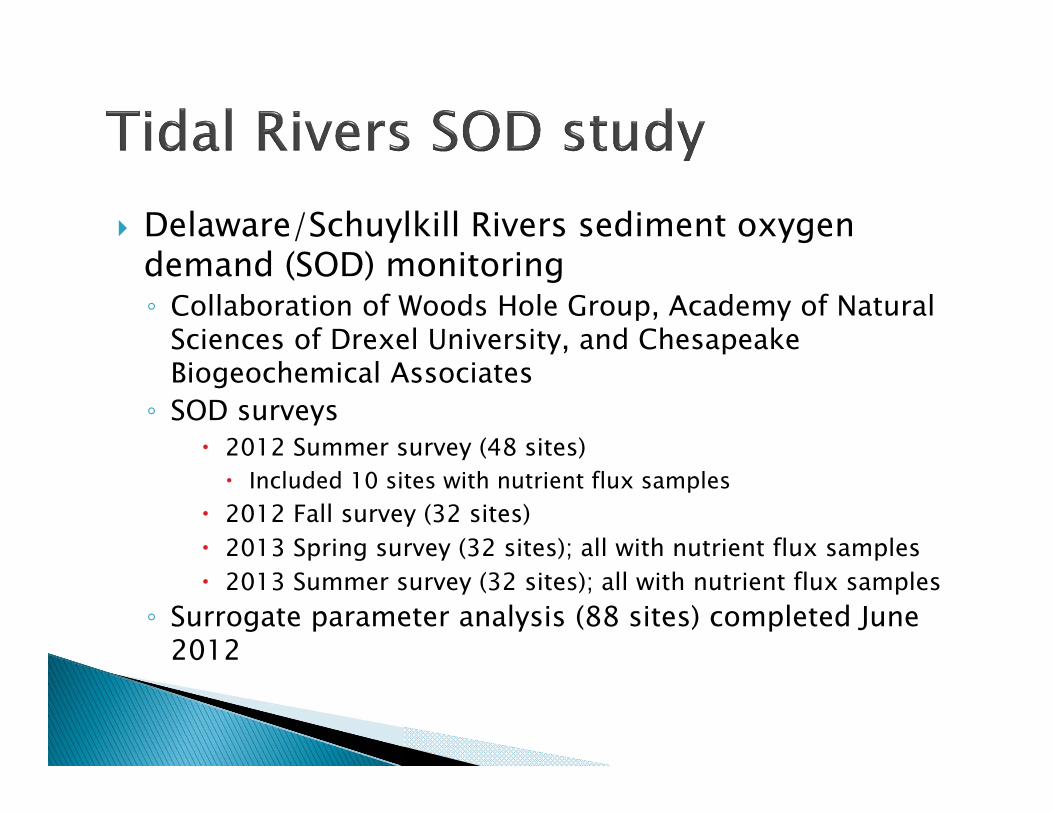
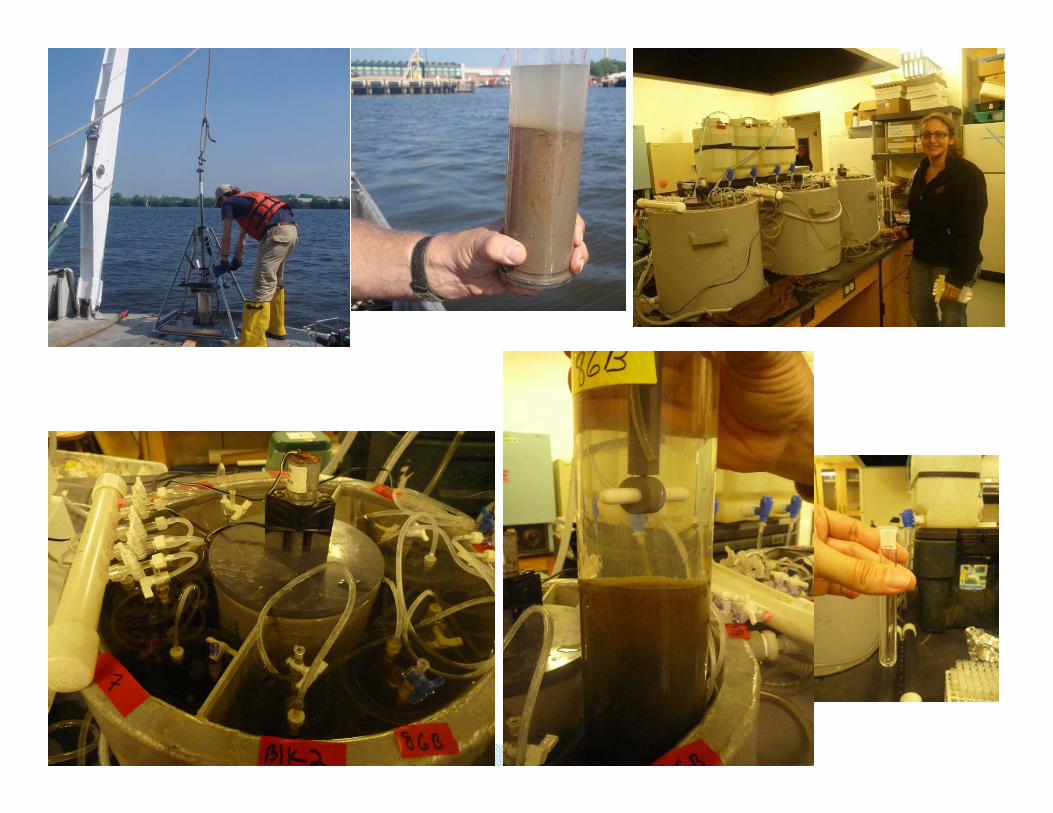
Delaware/Schuylkill Rivers sediment oxygen demand (SOD) monitoring◦ Collaboration of Woods Hole Group, Academy of Natural
Sciences of Drexel University, and Chesapeake Biogeochemical Associates
◦ SOD surveys 2012 Summer survey (48 sites) Included 10 sites with nutrient flux samples
2012 Fall survey (32 sites) 2013 Spring survey (32 sites); all with nutrient flux samples 2013 Summer survey (32 sites); all with nutrient flux samples
◦ Surrogate parameter analysis (88 sites) completed June 2012
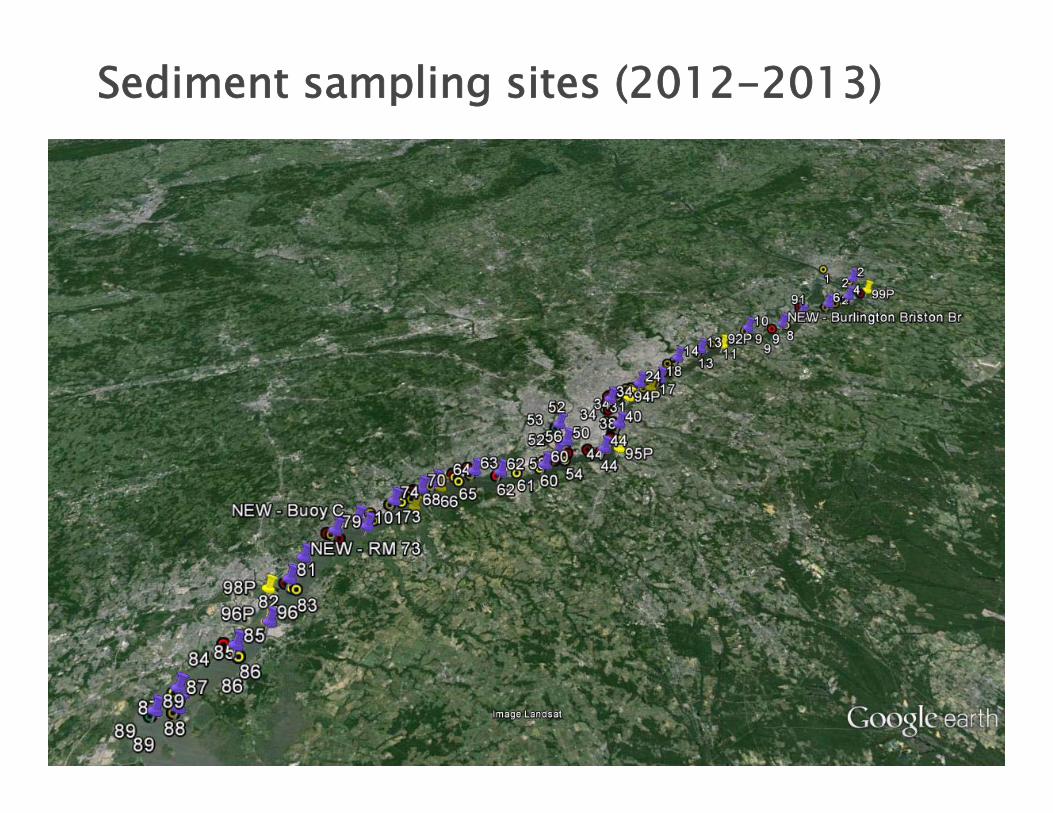
Sediment sampling sites (2012-2013)