Embed Size (px)
Citation preview
27
Photo P8 - « Wrinckles » sur Porosus brut visibles également sous l’écaille soulevée (zone plus claire)
3.3. Les piqûres Elles sont aujourd’hui principalement présentes sur l’alligator (Floride essentiellement) ; on ne les retrouve que peu sur les Porosus et les Niloticus. 3.4. La double écaille Elle devient un véritable problème principalement sur le Niloticus (jusqu’à 20% quelque soit les tailles) et sur le Porosus (jusqu’à 10/15 % des lots). Ce défaut est en effet de plus en plus rejeté par la clientèle. 3.5. Les attaques de parasites Elles sont difficilement visibles en brut. 10/15% des peaux d’alligators sont concernées (surtout dans les tailles 35 à 49 cm). Elles sont beaucoup plus rares sur le Porosus et le Niloticus

28
4. Impacts financiers des differents defauts naturels sur la filiere, par marches 4.1. Maroquinerie L’étude du déclassement pour présence de défauts naturels sur plusieurs lots de Porosus finis (lissés) destinés à la maroquinerie a donné les résultats suivants : N°du lot Pourcentage de déclassement pour
défauts naturels Nombre de peaux
concernées 1 27% 186 2 34% 68 3 31% 75
Tableau T2 – Déclassement pour défauts naturels sur Porosus finis Les même études portant sur des lots de Niloticus lissés ont donné des résultats comparables : N°du lot Pourcentage de déclassement pour
défauts naturels Nombre de peaux
concernées 1 31% 285 2 26% 650 3 63% (lot non pré-trié en croûtes) 211
Tableau T3 – Déclassement pour défauts naturels sur Niloticus finis L’impact de ces défauts (griffures et cicatrices principalement) est donc évident. Il faut noter que ces peaux avaient déjà fait l’objet d’un pré-tri en croûtes avant teinture mais que des défauts ont été rendus visibles par la finition. Ces peaux déclassées ont été vendues avec une décote supérieure à 20% ce qui représente une perte sèche pour la filière. 4.2. Bracelet montre Le même type d’études réalisées sur des lots d’alligators finis pour la fabrication de bracelets montre a donné les résultats suivants : N°du lot Pourcentage de déclassement pour
défauts naturels Nombre de peaux
concernées 1 33% 200 (noir lissé) 2 19% 101 (couleur lissé) 3 46% 155 (rose pastel mat) 4 33% 350 (noir mat)
Tableau T4 – Déclassement pour défauts naturels sur Alligators finis Le déclassement est ici encore très important, surtout si l’on considère que les lots ont été pré-triés en croûtes. La décote est ici de 15% de perte sur ces marchandises.

29
5. Conclusions L’impact des défauts naturels sur la gestion financière et commerciale de nos matières premières est d’autant plus regrettable, que contrairement aux autres filières de tannage pour lesquelles la peau est un sous-produit de l’industrie de la viande, et n’est par conséquent pas maîtrisable en qualité et en quantité, nous devrions être en mesure de mieux satisfaire aux attentes de nos marchés et valoriser notre matière première. Une attention toute particulière doit donc être apportée à la résolution des défauts au stade de l’élevage, de la préparation et de la conservation des peaux brutes. 6. Propositions d’amelioration des bagues CITES actuelles 6.1. Cas des Matières Plastiques Utilisées Les codes CITES sont quelquefois réalisés dans des matières plastiques cassantes provoquant la perte du code et des dégâts à la surface des peaux en travail (cf. photo P9). Notre filière pourrait directement bénéficier d’une homogénéisation du type de bagues CITES utilisées avec en particulier le retrait des matériaux inadaptés et posant un risque direct sur la qualité de nos produits.
Photo P9 – Code CITES en matière plastique bleue cassante
Photo P10 – Code CITES en matière plastique rose souple et résistante
Les Tanneries des Cuirs d’Indochine et de Madagascar ont mis en place depuis 1995 un dispositif de code-barres systématique en complément des bagues CITES.

30
D’autres tanneries ont également adapté ce moyen de gestion complémentaire qui permet une identification rapide et complète de chaque peau. Les code-barres apportent entres autres avantages :
? Une traçabilité en cas de problème ? Une localisation aisée des peaux en cours de production. ? Une gestion rapide et précise des stocks ? Un suivi statistique de la production, des achats, des ventes, … ? Un transfert de données entre sociétés ? Un historique des peaux travaillées
Les difficultés techniques rencontrées ont concerné :
? La qualité de l’étiquette code barre dont le plastique doit pouvoir résister aux acides, au sulfure et au perchloroéthylène
? Le marquage au laser des étiquettes ? La lecture du code après teinture avec la sélection d’un lecteur approprié ? La mise en place d’un réseau informatique ? La création d’un logiciel de base de données adapté à nos besoins
spécifiques 6.2. Proposition d’impression des code-barres sur les bagues CITES L’impression des code-barres sur les bagues CITES actuelles présenterait, pour l’ensemble de notre filière, les avantages suivants:
? Possibilité pour chacun de mettre en place une gestion informatique à partir d’un système simple, fiable, et rapide
? Diminution du coût pour les utilisateurs actuels de code barres et allègement du poids de la queue au profit d’une meilleure gestion qualité en production
? Standardisation du système ? Extension de la traçabilité à toute la filière. ? Transfert d’informations facilité entre fournisseurs et clients. ? Simplification et automatisation de la gestion des CITES, pour une plus
grande rapidité et un moindre risque d’erreurs et de fraudes.
----

31
World Trade In Crocodilian Skins, 2002-2004
John Caldwell
United Nations Environment Programme – World Conservation Monitoring Centre
219 Huntingdon Road, Cambridge CB3 0DL, United Kingdom
1. Introduction This is the thirteenth report produced by UNEP-WCMC for the International Alligator and Crocodile Trade Study (IACTS) and examines the international trade in crocodilian skins from 1980 to 2004. As in the previous reports, the data used in this report have been obtained from the CITES Trade Database that UNEP-WCMC maintains on behalf of the CITES Secretariat, with additional information provided by the Crocodile Farmers Association of Zimbabwe. The present report is intended to update the earlier reports by detailed analysis of information for the years up to 2004. It also attempts to identify problem areas and to recommend, where possible, workable solutions. As in the IACTS reports for 2001 - 2003, this report presents information on trade levels in classic skins (alligators and true crocodiles) and caimans and also trade in other products such as live animals and meat. 2. Methods This report is based on an analysis of the annual reports submitted by the Parties to CITES for all years up to 2004, and if applicable, 2005. A list of annual reports for 2002-2004 that had been received at UNEP-WCMC at the time of writing is given in Table 1. In order to be comparable with previous IACTS reports, all trade in whole skins and sides of crocodilian species has been analysed with two sides being considered to be equivalent to one skin. Trade in skins reported in units of weight, area, length or sub-units such as 'tails' has been mainly excluded. Wherever possible, data reported by the producer countries have been used in preference to that reported by importing countries because small differences in the manner of reporting, or the time lag between export and import, may lead to double-counting and thus an overestimation of trade volume. However where producer countries have failed to submit annual report data on exports of crocodilians, importers’ data have been used. Many of the transactions have been analysed at the export permit level. As with previous reports that covered the years 1995-2003, re-export trade has not been included in the estimation of annual production. 3. Limitations of data Late submission or complete failure to submit CITES annual reports continue to be the biggest problems in conducting trade studies using CITES annual report data.

32
In the IACTS 2002 report we drew attention to measures taken by the CITES Standing Committee that resulted in many Parties providing their missing reports however the situation appears to slipped back since then. A further problem with annual reports is the basis on which they are compiled. According to CITES Notification to the Parties No. 2002/022 of 9 April 2002 (now replaced by No. 2006/030 of 2 May 2006), Parties may report on the basis of the permits and certificates they have issued if they are unable to report on the actual number of specimens that entered or left the country. However, reporting on the basis of permits issued may lead to overestimates of trade volume as permits are frequently issued for quantities in excess of those actually traded and indeed, some of the permits may not even be used. Despite frequent reminders from the CITES Secretariat, the majority of Parties still fail to provide any details concerning the basis on which their annual reports are compiled and although UNEP-WCMC has access to the export permits routinely sent by several Parties to the CITES Secretariat, few of these are currently from crocodilian exporting countries. Most CITES annual reports are compiled on a shipment-by-shipment basis and many include the exporters’ permit numbers. This allows for very accurate cross-checking of data, particularly where an export may be reported in one year and the import of the same shipment reported the following year, and enables potential reporting or typographical errors to be traced. In recent years only Switzerland, a significant importer of crocodilian skins, has failed to report in this way. All annual reports for the years up to 2004 should have been submitted by 31 October 2005 but, at the time of writing (June 2006), several reports that might contain important data have still not been received by the CITES Secretariat. These include Honduras (2002), Kenya (2003), Malawi (2002), Nicaragua (2004), Panama (2002), Uganda (2002, 2003 and 2004), Venezuela (2004) and Viet Nam (2003, 2004). The potential effect of such omissions has been commented upon during the analysis. However Japan, a major importer of crocodilian skins that has consistently failed to report on time, has now caught up with its backlog of reports thus allowing better estimation of trade involving major exporters that have failed to submit reports.
Table 1. CITES annual reports for 2002-2004 available for analysis
Country 2002 2003 2004 Algeria * * * Antigua and Barbuda * * _
Argentina * * * Australia * * * Austria * * * Azerbaijan * * * Bahamas * _ _ Bangladesh * * * Barbados * * * Belarus * * *

33
Country 2002 2003 2004 Belgium * * * Belize * * _ Benin * _ * Bermuda * _ _ Bhutan * _ Bolivia * * * Botswana * * _ Brazil * * * Brunei Darussalam * * _ Bulgaria * * * Burkina Faso * * * Burundi * * * Cambodia * * * Cameroon * _ _ Canada * * * Central African Republic * * _ Chad * * * Chile * * * China * * * Colombia * * * Comores _ _ _ Congo * * _ Costa Rica * * * Côte d’Ivoire * * * Croatia * * * Cuba * * * Cyprus * * * Czech Republic * * * Democratic Republic of the Congo * * * Denmark * * * Djibouti * _ _ Dominica * _ _ Dominican Republic * _ _ Ecuador _ _ * Egypt * * * El Salvador * * * Equatorial Guinea * * * Eritrea * _ _ Estonia * * * Ethiopia * * * Finland * * * France * * * Gabon * * * Gambia * * * Georgia * * _ Germany * * * Ghana * * *

34
Country 2002 2003 2004 Greece * * * Greenland * * _ Grenada * _ _ Guatemala * * _ Guinea * * _ Guinea Bissau * * _ Guyana * * * Honduras _ * * Hong Kong, SAR * * * Hungary * * * Iceland * * * India * * * Indonesia * * * Iran * * * Ireland * * * Israel * * * Italy * * * Jamaica * * * Japan * * * Jordan * * * Kazakhstan * * _ Kenya * _ * Kuwait * * Latvia * * * Liberia * * * Liechtenstein * * * Lithuania * * Luxembourg * * * Macao, SAR * * * Macedonia * * * Madagascar * * * Malawi _ * * Malaysia * * * Mali * * * Malta * * * Mauritius * * * Mexico * * * Moldova * * * Monaco * * * Mongolia _ _ _ Morocco * * * Mozambique * * * Myanmar * * * Namibia * * * Nepal * * _ Netherlands * * * New Caledonia * *

35
Country 2002 2003 2004 New Zealand * * * Nicaragua * * _ Niger * * _ Nigeria * * * Norway * * * Pakistan * * * Panama _ * * Papua New Guinea * * * Paraguay * * _ Peru * * * Philippines * * * Poland * * * Portugal * * * Qatar * * * Republic of Korea * * * Romania * * * Russian Federation * * * Rwanda * _ _ Saint Kitts and Nevis * * * Saint Lucia * * * Saint Vincent and the Grenadines
* * *
Saudi Arabia _ * * Senegal * * * Serbia and Montenegro * * * Seychelles * _ _ Sierra Leone * * * Singapore * * * Slovakia * * * Slovenia * * * South Africa * * * Spain * * * Sri Lanka * * * Sudan * * * Suriname * * * Swaziland * * * Sweden * * * Switzerland * * * Thailand * * * Togo * * * Trinidad and Tobago * * * Tunisia * * * Turkey * * * Uganda _ _ _ Ukraine * * _ United Arab Emirates * * * United Kingdom * * *
36
Country 2002 2003 2004 United Republic of Tanzania * * * United States of America * * * Uruguay * * * Uzbekistan * * * Vanuatu * * _ Venezuela * * _ Viet Nam * _ _ Yemen * * * Zambia * * * Zimbabwe * * *
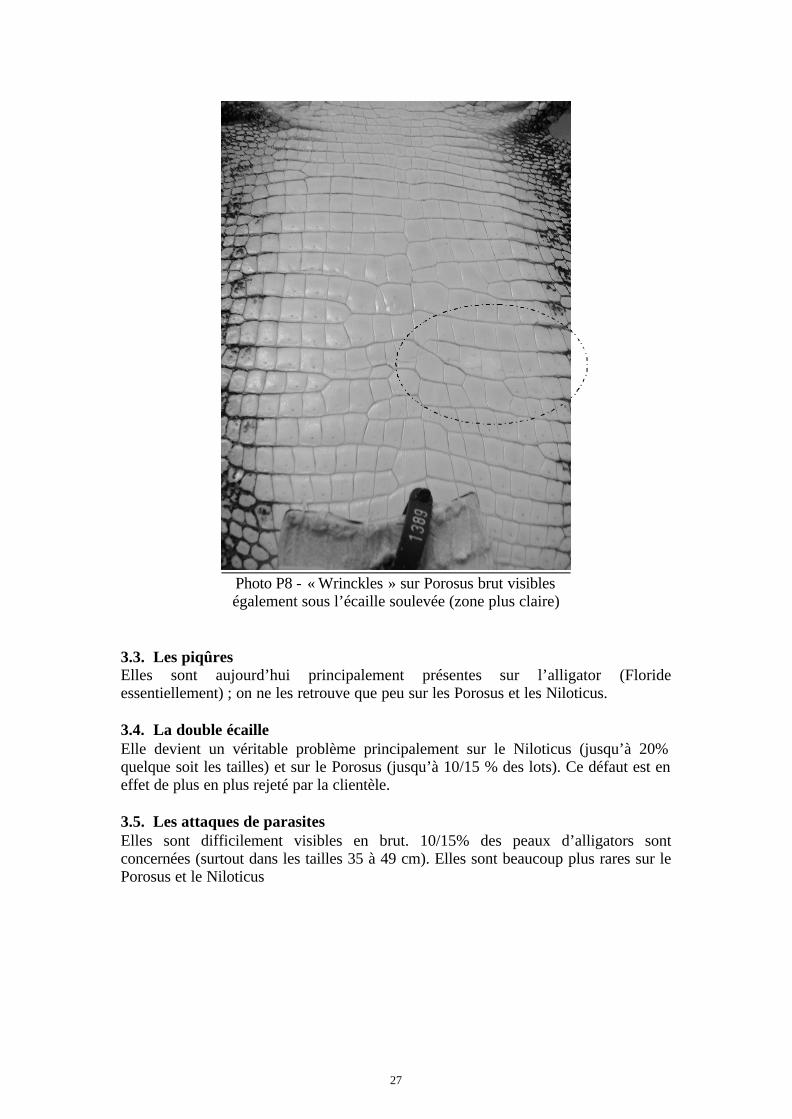
* = report available; _ = report not received; no symbol denotes country not party to CITES The accuracy of the data provided in CITES annual reports is a further limitation to perfect analysis. In previous IACTS reports it has been noted that skins have been reported as live animals, skin pieces such as back strips, necks, flanks and tails have been reported as whole skins and, in the case of the Zimbabwe annual reports, mixed shipments of belly skins, hornbacks and backskins on multiple permits have been confused to the extent that the reported exports on those permits were overestimated by 450 per cent. Possibly the greatest cause of confusion are “backskins” that are frequently reported simply as “skins”. Considerable effort has again been made during the compilation of this report to clear up these inconsistencies by close cross matching of imports with the original export permit information and the results are discussed in the various species accounts. 4. Skins species accounts 4.1. Crocodylus acutus / American crocodile The first recorded trade in this species since 1989 was two shipments, each of 50 skins from captive-bred animals, exported from Colombia to France in 2001. Both the importer and the exporter reported this trade. No further trade was reported as occurring in 2002, however France reported importing 130 skins (two shipments) from registered captive-breeding operations in Colombia in 2003. Colombia has two farms registered with CITES for production of this species and confirmed the exports to France. A further 30 skins were reported as exports to France by Colombia in 2004. Honduras has one registered farm producing this species and it appears the first reported import was of 500 skins by Japan in 2003. This was followed by an export of 197 skins to Panama in 2004 that were apparently subsequently re-exported back to Honduras. 4.2. Crocodylus johnsoni / Australian freshwater crocodile Figure 1. Australian exports of Crocodylus johnsoni 1988 - 2003

37
Figure 1 shows that exports from Australia peaked at 3875 in 1993, remained high between 1994 and 1996 but have since fallen to insignificant levels. No direct exports in skins of this species was reported in 2001 or 2004 and only two, exported to Japan, in 2002. Japan reported the import of 184 skins in 2003 but the format of the export permit numbers would suggest the trade was in manufactured products rather than whole skins. In 2004 Singapore reported re-exporting 1581 of the skins exported by Australia in 1994 and 1995 to China. 4.3. Crocodylus moreletii / Morelet's Crocodile Mexico has three captive-breeding operations for this species registered with the CITES Secretariat. Exports began in 1997 with 146 skins going to France, Italy and Panama. This was followed by exports of 193 skins in 1998 and a further two in 1999. In 2000 exports increased to 1228 skins and again to 3643 in 2001. Exports then decreased to 1588 skins in 2002, to 1037 in 2003 and further to 609 in 2004. Japan has been the main importer since 2002 with lesser quantities going to France, Italy and Spain. 4.4. Crocodylus niloticus / Nile crocodile The major analysis of the data for this species, based on available permit numbers that was initiated with the IACTS 2002 report has continued with the aim of eliminating misinterpretation caused by the variety of terms used to describe the skins. For the purposes of this report, bellies, skins and hornbacks have been treated as representing entire skins. A summary of the trade data from 1997-2003 can be found in Table 2. 4.4.1. Range States exporters - Botswana: although Botswana reported exports of over 9000 skins between 1992
and 1994, there have been no commercial exports of skins between 1997 and 2004
0
500
1000
1500
2000
2500
3000
3500
4000
4500
88 89 90 91 92 93 94 95 96 97 98 99 00 01 02 03Year
Qu
anti
ty

38
apart from 152 skins from captive-bred individuals that South Africa reported importing in 2001.
- Central African Republic: apart from an import of 35 skins reported by France in
1986 there have been no commercial exports. - Congo: small numbers of skins were exported to France during the 1980s but there
have been no commercial exports reported since 1989. - Ethiopia: is an intermittent exporter and the crocodile breeding operation is not
currently registered with the CITES Secretariat. The only importer appears to be the United Kingdom who reported importing 220 skins in 2002. In 2003 Ethiopia reported exports of 1354 skins and a further 446 in 2004.
- Guinea: Guinea has not reported exporting skins since 1991, nor have there been any reported imports from that country apart from a seizure of 100 skins reported by Spain in 1995.
- Kenya: Singapore reported importing 1687 skins from Kenya in 2003 (no report has been received from Kenya for that year) and Kenya reported exports of 2850 skins in 2004. All trade was in ranched material.
- Liberia: a few commercial exports to France, amounting to almost 1500 skins, were reported between 1981 and 1984 but none since.
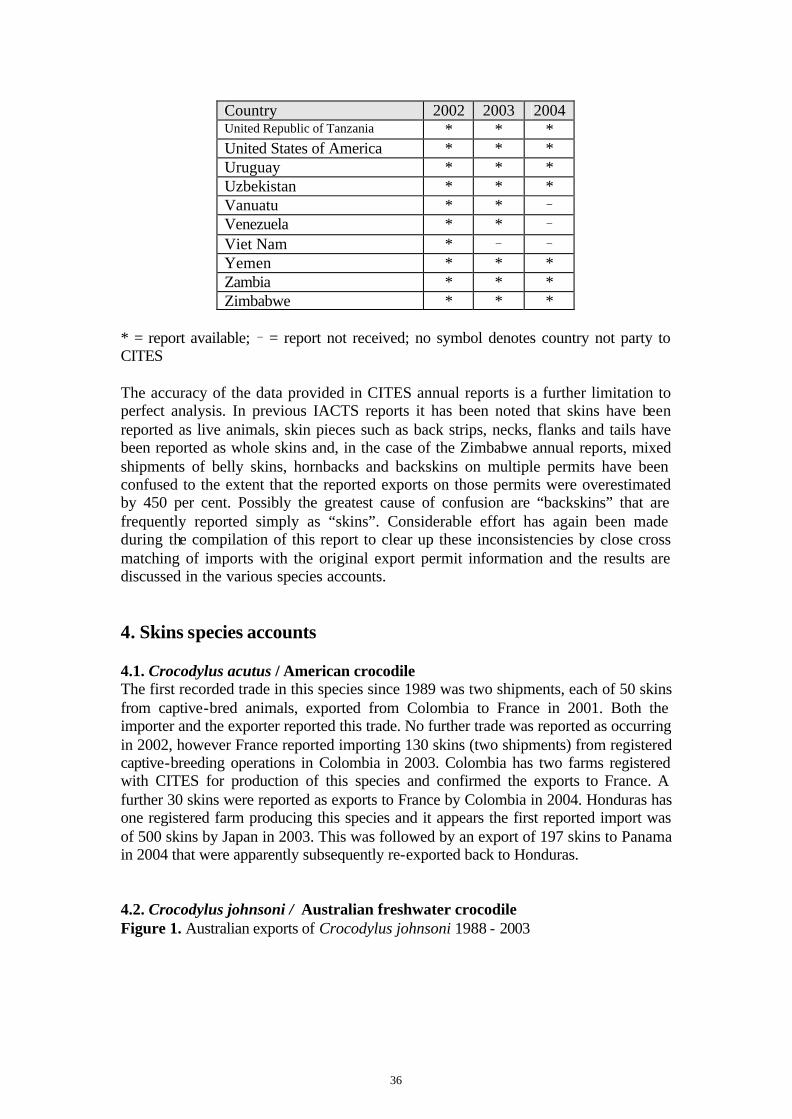
- Madagascar: Madagascar’s exports since 1992 are shown in Figure 2 and indicate a steady increase until 2001. Reported exports then dropped to 6936 skins of which 500 were reported to be from the wild in 2002, and then increased slightly in 2003 to 7300, of which 700 were from the wild. Reported exports fell further to 4760 in 2004, of which 2110 were reportedly captive-bred, 2150 ranched and 500 from the wild. It should be noted that Madagascar had a quota of 7600 skins from ranched animals and 500 skins from wild nuisance animals in 2002, 2003 and 2004.
Figure 2. Exports of Crocodylus niloticus skins from Madagascar 1992 - 2004
0
1000
2000
3000
4000
5000
6000
7000
8000
9000
10000
92 93 94 95 96 97 98 99 00 01 02 03 04
Year
Qua
ntity

39
- Malawi: In 2003 Malawi reported exporting a total of 301 skins, to France, Singapore and Zimbabwe, and a further 20 to France in 2004. However France reported the import of 80 skins in 2004 on a Malawi export permit not reported by Malawi in either year so it seems likely that Malawi’s true export figure was 100 skin in 2004. All skins were reported to be of wild origin.
- Mozambique: In 2003 Mozambique reported exporting 3160 skins, mostly going to South Africa with a few (338) going to Singapore, all but 195 from ranched animals. The annual reports of the importing countries confirmed most of these shipments. The 2004 report from Mozambique only indicates exports of 2000 back skins to Singapore in that year and there are no reports from importers to indicate to the contrary.
- Namibia: No exports of skins have been reported since 2000. Namibia has one crocodile ranching operation registered with the CITES Secretariat.
- Nigeria: as noted in previous IACTS reports, Italy reported importing 10,304 skins from Nigeria in 1981 and a further nine in 1983. No further commercial shipments have been reported although seizures of items from tourists returning from that country occur regularly.
- Somalia: as noted in previous IACTS reports, a total of 2189 skins were reported as imports by Italy and Japan in 1980 and 1981 but no further commercial shipments have been reported since.
- South Africa: reported exports up to 2002 indicated a steady expansion of the trade from 29,698 skins for in 2000, 33,335 in 2001 and 45,755 in 2002. Reported exports decreased to 31,321 in 2003 and increased again to 35,760 in 2004. Almost all of the skins were reported to be from captive-bred animals. It should be noted that South Africa has been a major re-exporter of skins produced in Zambia and Zimbabwe.
- Sudan: as previously reported in IACTS 2004, the only recorded commercial trade involving Sudan was in 1992 when Egypt reported importing 7900 skins. However, there have been no records of re-exports of Sudanese crocodile skins by Egypt and it seems likely that they may have actually been skins of Nile monitor, Varanus niloticus, and misreported by Egypt.
- Togo: as noted in previous IACTS reports, no trade in skins has been reported since the early 1980s when 6377 were exported to France between 1982 and 1983.
- Uganda: The first trade since 1994 began in 2000 and continued in 2001 with a total export of 1408 skins, all to Italy. Italy reported importing a further two skins in 2002 but none in 2003. In 2004 the Republic of Korea reported importing 300 skins from captive-bred animals. Uganda has not yet submitted reports for 2002, 2003 or 2004.
- United Republic of Tanzania: although commercial exports increased steadily between 1997, when Tanzania reported exporting 275 skins, and 2001 when 1498 were reported being exported, commercial trade appears to have stabilised with totals of 1359 in 2002, 1439 in 2003 and 1067 in 2004, all from wild origin. Serious doubt has emerged that Tanzania has included all of their crocodile export data in their latest annual reports so these figures have been taken from the reports of the importing countries, notably France and Singapore.

40
- Zambia: In 2002, Zambia reported exports of 22,259 skins, a further 28,019 in 2003 and 26,353 in 2004. All of appear to be from ranching operations. Singapore and Japan were the main destinations, with Spain and South Africa taking lesser amounts.
- Zimbabwe: In 2003 CFAZ reported exporting 73,707 skins, a slight decrease from the year before. The CITES M.A. recorded a similar figure (70,378) for that year, which may suggest an improvement in reporting as comparisons for earlier years had shown significant discrepancies. In 2004 the Management Authority reported exports of 60,185 skins and CFAZ 68,263. Comparison between the two datasets indicates that the Management Authority have failed to report some 30 shipments reported by CFAZ that can be confirmed by data from the importing countries. In table 2 we have used the CFAZ figure to calculate the total number of skins.
4.4.2. Exporters from other countries (out of range states) - Brazil: Brazil reported exporting one skin to the United States in 2003 and a further
44 in 2004. - Israel: reported exporting 699 skins to France in 2002, a figure confirmed by the
importer, No further exports were reported for 2003 0r 2004. - Mauritius: first reported exporting skins (30) from captive-bred individuals in
2000. This gradually increased to 93 in 2001, 178 in 2002, 118 in 2003 and 400 in 2004. The importers have been Madagascar, Singapore and Zimbabwe.
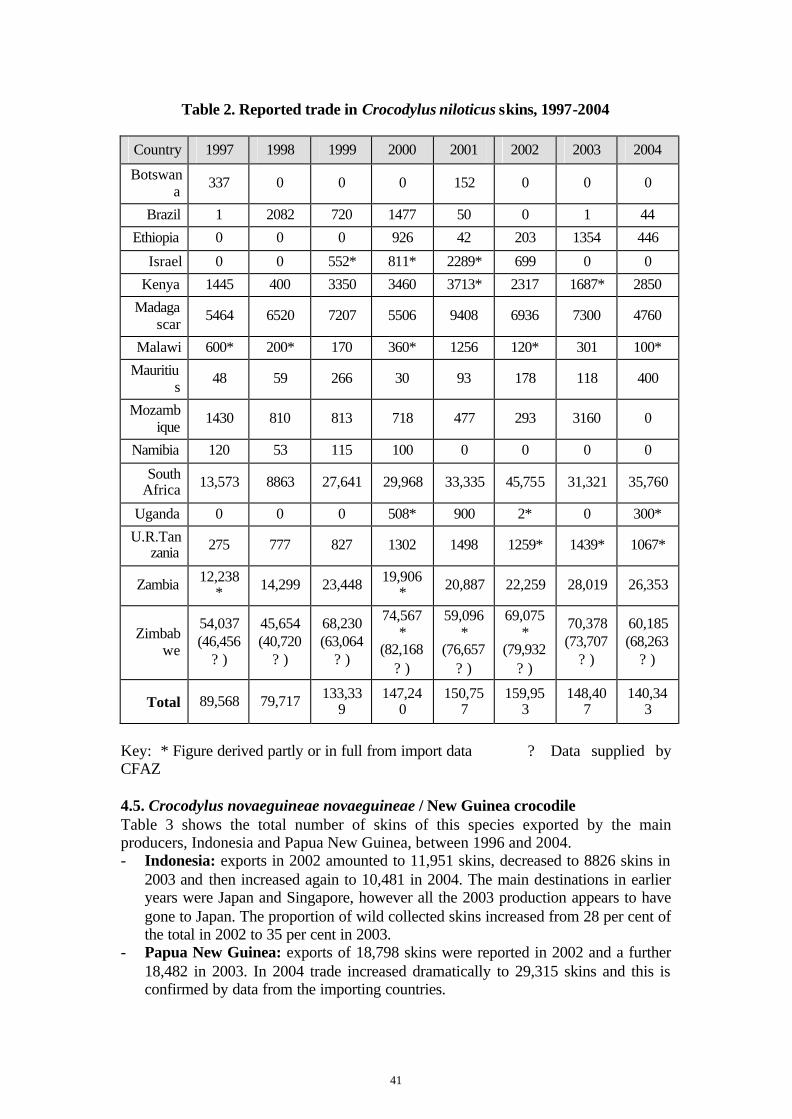
41
Table 2. Reported trade in Crocodylus niloticus skins, 1997-2004
Country 1997 1998 1999 2000 2001 2002 2003 2004
Botswana 337 0 0 0 152 0 0 0
Brazil 1 2082 720 1477 50 0 1 44
Ethiopia 0 0 0 926 42 203 1354 446
Israel 0 0 552* 811* 2289* 699 0 0
Kenya 1445 400 3350 3460 3713* 2317 1687* 2850
Madagascar 5464 6520 7207 5506 9408 6936 7300 4760
Malawi 600* 200* 170 360* 1256 120* 301 100*
Mauritius 48 59 266 30 93 178 118 400
Mozambique 1430 810 813 718 477 293 3160 0
Namibia 120 53 115 100 0 0 0 0
South Africa 13,573 8863 27,641 29,968 33,335 45,755 31,321 35,760
Uganda 0 0 0 508* 900 2* 0 300*
U.R.Tanzania 275 777 827 1302 1498 1259* 1439* 1067*
Zambia 12,238* 14,299 23,448 19,906
* 20,887 22,259 28,019 26,353
Zimbabwe
54,037 (46,456
? )
45,654 (40,720
? )
68,230 (63,064
? )
74,567*
(82,168? )
59,096*
(76,657? )
69,075*
(79,932? )
70,378 (73,707
? )
60,185 (68,263
? )
Total 89,568 79,717 133,339
147,240
150,757
159,953
148,407
140,343
Key: * Figure derived partly or in full from import data ? Data supplied by CFAZ 4.5. Crocodylus novaeguineae novaeguineae / New Guinea crocodile Table 3 shows the total number of skins of this species exported by the main producers, Indonesia and Papua New Guinea, between 1996 and 2004. - Indonesia: exports in 2002 amounted to 11,951 skins, decreased to 8826 skins in
2003 and then increased again to 10,481 in 2004. The main destinations in earlier years were Japan and Singapore, however all the 2003 production appears to have gone to Japan. The proportion of wild collected skins increased from 28 per cent of the total in 2002 to 35 per cent in 2003.
- Papua New Guinea: exports of 18,798 skins were reported in 2002 and a further 18,482 in 2003. In 2004 trade increased dramatically to 29,315 skins and this is confirmed by data from the importing countries.

42
- The majority of the skins were exported to Japan with smaller quantities being imported by Australia, France and Singapore. In 2000 wild-collected skins accounted for 83 per cent of the production, increasing to 93 per cent in 2001 and to 100 per cent in 2002 and 2003. In 2004 only four skins of animals bred in captivity were exported.
Table 3. Reported trade in Crocodylus novaeguineae novaeguineae skins, 1996-2004
Country 1996 1997 1998 1999 2000 2001 2002 2003 2004
Indonesia 0 100 8506 6574 7215 9946 11,951 8826 10,481
Papua New Guinea
14,234 32,912 16,985 15,617 16,018 20,688 18,798 18,482 29,315
Total 14,234 33,012 25,491 22,191 23,233 30,634 30,749 27,308 39,796 4.6. Crocodylus porosus / Saltwater crocodile - Australia: reported exports in 2002 amounted to 7205 however import country
data suggested this figure should have been higher and it is known that there were severe problems with new computer software used to produce the Australian report. Close examination of both importer and exporter data suggest the real figure to be in the region of 10,423. In 2003 Australia reported exports of 14,544 skins and in 2004 12,322 skins. The destinations were mainly France, Japan and Singapore with smaller quantities going to Indonesia, Italy, the Republic of Korea and the United States.
- Indonesia: exports of 3277 skins to Japan and Singapore were reported in 2002 and 2732 skins to the same destinations in 2003. In 2004 reported exports increased to 3968. Whereas the majority of skins exported in 2002 were reported to be from animals bred in captivity, most of those exported in 2003 and 2004 were reported to be from ranching operations.
- Malaysia: Singapore reported importing 662 skins in 2002 and 618 in 2003, all from registered breeding operations of which Malaysia has five. In 2004 the number of skins had apparently increased to 1450. From the sparse export data available, it appears that Malaysia may have difficulty in collecting the information which may be the result of having three separate CITES Management Authorities responsib le for Peninsular Malaysia, Sabah and Sarawak respectively.
- Papua New Guinea reported exporting 9332 skins in 2002,a further 8000 in 2003 and 11,043 in 2004 The proportion of wild-sourced skins was reported to be 25 per cent in 2002 but increased to 39 per cent in 2003 and to 42 per cent in 2004.
- Singapore reported commercial exports of 584 skins from registered captive-breeding operations in 2002, 470 in 2003 and 1136 in 2004. The sole importer in 2002 and 2003 was Japan but exports also went to Australia, France and Thailand in 2004.
- Thailand: reported exporting 805 skins to Japan in 2001 and a further 300 in 2004.

43
Table 4. Reported trade in Crocodylus porosus skins, 1997-2004
Country 1997 1998 1999 2000 2001 2002 2003 2004
Australia 8777 9896 5048 13,296 11,849 10,423* 14,544 12,322
Indonesia 150 3141 1087 3172 3397 3277 2732 3968
Malaysia 120* 320* 320* 559* 675* 662* 618* 1450*
Papua New Guinea
8771 10,255 9396 8336 10,676 9332 8000 11,043
Singapore 296 211 60 438 762 584 470 1136
Thailand 440 300 60 0 805 0 0 300
Total 18,554 24,123 15,971 25,791 28,164 24,278 26,364 30,219 Key: * Figure derived from import data 4.7. Crocodylus rhombifer / Cuban crocodile No trade has been reported for this species since 1998 apart from one skin reported as a personal import by Denmark in 2004. 4.8. Crocodylus siamensis Siamese crocodile Cambodia: Singapore reported importing 30 skins from Cambodia in 2001, the first reported trade involving that country. The skins were subsequently re-exported to Japan in 2002 but no further trade in skins from that country has been reported. Cambodia has six crocodile farms registered with the CITES Secretariat for the commercial production of this species. Thailand: has 17 crocodile farms registered with the CITES Secretariat for commercial production. Reported exports were 5459 skins in 1999, 2417 in 2000, 4392 in 2001 and 3580 in 2002. However, reported exports increased dramatically to 10,982 in 2003 and further to 20,105 in 2004. The main importer in both 2003 and 2004 was Japan, with smaller quantities going to China, Germany, France, Hong Kong, Italy and the Republic of Korea. 4.9. Crocodylus siamensis x C. porosus / Crocodile hybrid No international trade in skins of this hybrid species has been reported since 1995 when Thailand exported 250 to Singapore, however Thailand does export meat and a small quantity of manufactured items annually. 4.10. Osteolaemus tetraspis / West African dwarf crocodile There is no international trade in skins of this Appendix-I species, however seizures of small numbers of manufactured items, mainly emanating from Nigeria, are reported

44
annually. Unfortunately very few of these seizures are reported to species level so it is impossible to estimate the scale of the problem, or even if it is this species that is involved. 4.11. Alligator mississippiensis / American alligator Only gross export data reported by the United States have been used for this analysis as it has been demonstrated previously that using data reported by importing countries can lead to a significant overestimate of trade volume. Figure 3 shows reported exports between 1986 and 2004 and indicates a steady increase from around 30,000 skins in 1986 to 210,000 in 1994. Exports then appear to have declined to around 160,000 in 1996 and have then increased steadily to a peak of over 340,000 in 2001. Exports fell to 237,840 in 2002 but increased to nearly 343,000 in 2003 and further to nearly 370,000 the following year. The reasons for the high level of exports in 2001, 2003 and 2004 are as yet not understood.
Table 5. Exports of Alligator mississippiensis reported by USA 1986-2004
1986 1987 1988 1989 1990 1991 1992 1993 1994 1995
31,235 45,177 50,303 76,963 120,419 128,447 155,264 192,286 210,236 185,929
1996 1997 1998 1999 2000 2001 2002 2003 2004
163,936 198,649 206,620 239,519 248,922 343,110 237,840 341,734 368,409
Four countries, France, Germany, Italy and Singapore import 95 per cent of production with smaller quantities being imported by Mexico and Panama. It has been noted in the IACTS reports since 2003 an that the compilers of the CITES annual report of the United States were probably using the code ‘C’ (bred in captivity) for ranched animals rather than the more correct ‘R’. Other codes used are ‘F’ – animals born in captivity, (F1 or subsequent generations) that do not fulfil the definition of ‘bred in captivity’ in Resolution Conf. 10.16 (Rev.), and ‘W’ – wild. This appears to have continued in the annual report for 2004 where 58 per cent of exports were reported as coming from captive-bred individuals. A breakdown of the reported source of skins between 1997 and 2004 is shown in Figure 4. This species is also bred in captivity in Israel who reported exporting 233 skins to France in 2000. Only six skins were exported, again to France, in 2001 and none have been reported subsequently.

45
0
50000
100000
150000
200000
250000
300000
350000
400000
86 87 88 89 90 91 92 93 94 95 96 97 98 99 00 01 02 03 04
Year
Qua
ntity
Figure 3. Gross exports of A. mississippiensis skins from the United States of America 1986-2004
0%
20%
40%
60%
80%
100%
P e r c e n t a g e
97 98 99 00 01 02 03Year
W
RF
C
Figure 4. Reported source of alligator skins from the United States of America 1997-2004
46
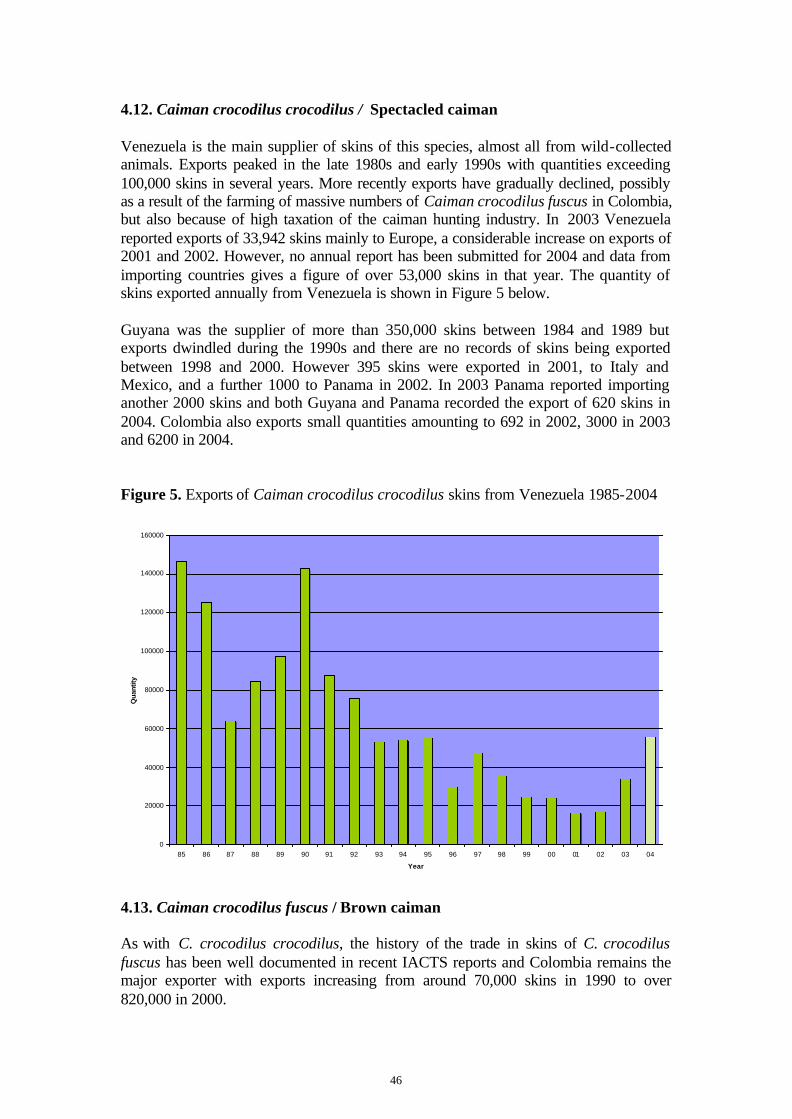
4.12. Caiman crocodilus crocodilus / Spectacled caiman Venezuela is the main supplier of skins of this species, almost all from wild-collected animals. Exports peaked in the late 1980s and early 1990s with quantities exceeding 100,000 skins in several years. More recently exports have gradually declined, possibly as a result of the farming of massive numbers of Caiman crocodilus fuscus in Colombia, but also because of high taxation of the caiman hunting industry. In 2003 Venezuela reported exports of 33,942 skins mainly to Europe, a considerable increase on exports of 2001 and 2002. However, no annual report has been submitted for 2004 and data from importing countries gives a figure of over 53,000 skins in that year. The quantity of skins exported annually from Venezuela is shown in Figure 5 below. Guyana was the supplier of more than 350,000 skins between 1984 and 1989 but exports dwindled during the 1990s and there are no records of skins being exported between 1998 and 2000. However 395 skins were exported in 2001, to Italy and Mexico, and a further 1000 to Panama in 2002. In 2003 Panama reported importing another 2000 skins and both Guyana and Panama recorded the export of 620 skins in 2004. Colombia also exports small quantities amounting to 692 in 2002, 3000 in 2003 and 6200 in 2004. Figure 5. Exports of Caiman crocodilus crocodilus skins from Venezuela 1985-2004
0
20000
40000
60000
80000
100000
120000
140000
160000
85 86 87 88 89 90 91 92 93 94 95 96 97 98 99 00 01 02 03 04
Year
Qua
ntity
4.13. Caiman crocodilus fuscus / Brown caiman As with C. crocodilus crocodilus, the history of the trade in skins of C. crocodilus fuscus has been well documented in recent IACTS reports and Colombia remains the major exporter with exports increasing from around 70,000 skins in 1990 to over 820,000 in 2000.

47
In 2001, exports dropped by 125,000 to 698,413 and again to 540,579 in 2002. A very slight increase occurred in 2003 to 552,219 and again to 605,841 in 2004. Exports from Colombia between 1990 and 2004 are shown in Figure 6. Details of the countries reportedly exporting this species from 1994 to 2002 are shown in Table 6.
Table 6. Reported trade in Caiman crocodilus fuscus skins, 1995-2004
Exporter 1995 1996 1997 1998 1999 2000 2001 2002 2003 2004 Colombia 764,358 646,832 451,307 669,269 777,529 824,303 698,413 540,579 552,219 605,841 Costa Rica 0 0 0 40 0 0 0 0 0 0 Cuba 12 302 500 5 2 0 0 0 0 0 El Salvador 1 0 0 0 0 0 0 0 0 0 Guatemala 0 0 0 0 0 0 0 0 0 0 Honduras 2,000 5,656 22,000 18,104 0 0 0 0 0 0 Nicaragua 4328 3795 1246 3927 250 6440 0 0 0 0 Panama 0 0 0 0 10 10,250 11,700 11,047* 19,840 15,850 Total 770,609 656,585 475,053 691,345 777,791 840,993 710,113 551,626 572,059 621,691
Key: * Figure derived from import data.
No exports have been reported from Honduras since 1998 and it seems likely that the reported exports between 1995 and 1997 were in fact re-exports. Nicaraguan production has fluctuated from year to year and exports in 2000 of 6440 went to Panama and Spain. No report was submitted by Nicaragua for 2001 or 2004 and there were no imports from Nicaragua reported in those years; no exports of skins were recorded in Nicaragua’s 2002 report. Although an important entrepôt State, Panama clearly distinguishes between exports and re-exports in its annual report. Exports of 10,250 skins were reported in 2000 and 11,700 in 2001. No report has been received from Panama for 2002 but importers data suggest this was again around 11,000. Exports were reported in both 2003 and 2004 amounting to some 19,840 and 15,850 skins, all from captive-breeding operations.
Figure 6. Exports of Caiman crocodilus fuscus from Colombia 1990-2004
0
100000
200000
300000
400000
500000
600000
700000
800000
900000
90 91 92 93 94 95 96 97 98 99 00 01 02 03 04
Year
Qua
ntity
48
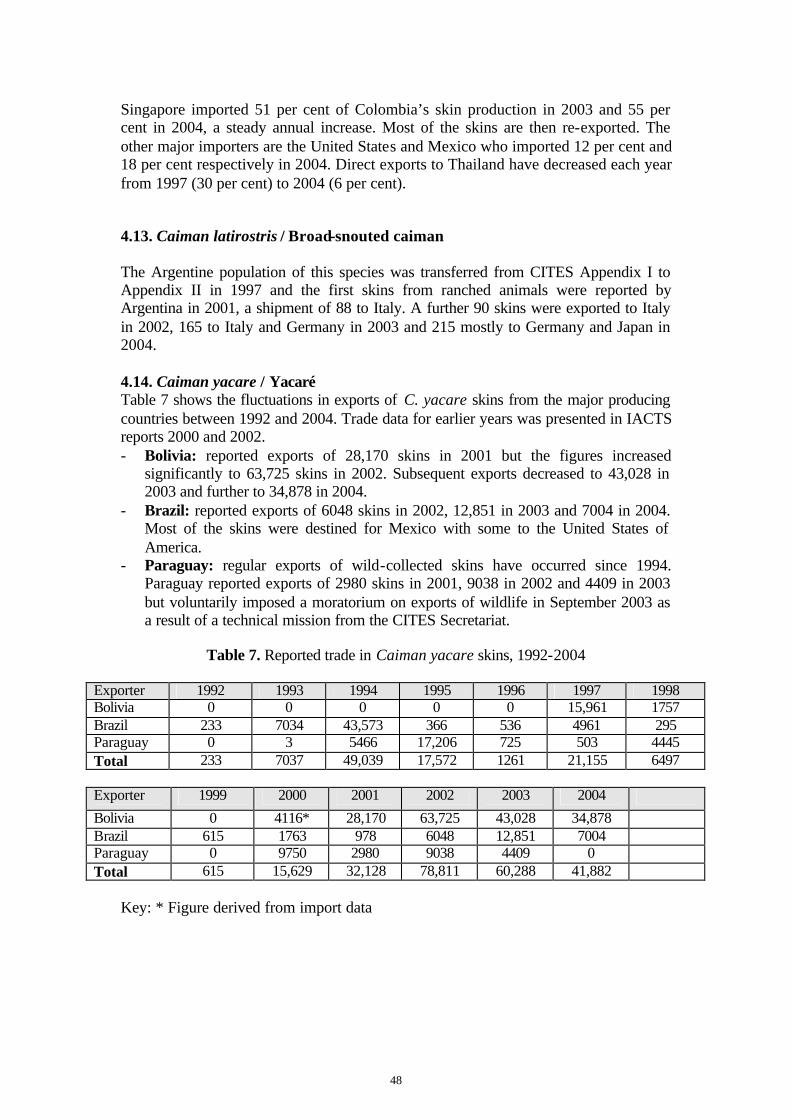
Singapore imported 51 per cent of Colombia’s skin production in 2003 and 55 per cent in 2004, a steady annual increase. Most of the skins are then re-exported. The other major importers are the United States and Mexico who imported 12 per cent and 18 per cent respectively in 2004. Direct exports to Thailand have decreased each year from 1997 (30 per cent) to 2004 (6 per cent). 4.13. Caiman latirostris / Broad-snouted caiman The Argentine population of this species was transferred from CITES Appendix I to Appendix II in 1997 and the first skins from ranched animals were reported by Argentina in 2001, a shipment of 88 to Italy. A further 90 skins were exported to Italy in 2002, 165 to Italy and Germany in 2003 and 215 mostly to Germany and Japan in 2004. 4.14. Caiman yacare / Yacaré Table 7 shows the fluctuations in exports of C. yacare skins from the major producing countries between 1992 and 2004. Trade data for earlier years was presented in IACTS reports 2000 and 2002. - Bolivia: reported exports of 28,170 skins in 2001 but the figures increased
significantly to 63,725 skins in 2002. Subsequent exports decreased to 43,028 in 2003 and further to 34,878 in 2004.
- Brazil: reported exports of 6048 skins in 2002, 12,851 in 2003 and 7004 in 2004. Most of the skins were destined for Mexico with some to the United States of America.
- Paraguay: regular exports of wild-collected skins have occurred since 1994. Paraguay reported exports of 2980 skins in 2001, 9038 in 2002 and 4409 in 2003 but voluntarily imposed a moratorium on exports of wildlife in September 2003 as a result of a technical mission from the CITES Secretariat.
Table 7. Reported trade in Caiman yacare skins, 1992-2004
Exporter 1992 1993 1994 1995 1996 1997 1998 Bolivia 0 0 0 0 0 15,961 1757 Brazil 233 7034 43,573 366 536 4961 295 Paraguay 0 3 5466 17,206 725 503 4445 Total 233 7037 49,039 17,572 1261 21,155 6497
Exporter 1999 2000 2001 2002 2003 2004
Bolivia 0 4116* 28,170 63,725 43,028 34,878 Brazil 615 1763 978 6048 12,851 7004 Paraguay 0 9750 2980 9038 4409 0 Total 615 15,629 32,128 78,811 60,288 41,882
Key: * Figure derived from import data

49
4.15. Other Species There has been no reported commercial exports from origin countries between 2000 and 2002 of skins of the following species: Crocodilus cataphractus, C. intermedius, C. palustris, Alligator sinensis, Melanosuchus niger, Palaeosuchus palpebrosus, P. trigonatus, Gavialis gangeticus or Tomistoma schlegelii. The United States of America reported the seizure of one skin of Crocodylus cataphractus from France, of unknown origin, in 2000, and Gabon exported one skin, two stuffed specimens and four leather items of that species as personal items to France in 2002. 5. Trade in Live Animals As noted in previous IACTS reports, the commercial export of live crocodilians outside of their range States poses a potential threat to the natural biological diversity of the importing countries. The effect these alien animals may have on native populations of crocodilians is inestimable should they establish breeding populations, a serious possibility given suitable environmental conditions and habitat. It has also noted that the continued growth of the crocodilian farming industry would probably mean that such exports would continue for the time being. Live crocodilians are traded for many reasons. Enthusiasts popularly keep young animals as personal pets; circuses and zoos regularly exhibit such creatures, farms and ranches import animals to supplement their gene pool and some are imported in order to strengthen wild populations. This variety of use, and the limited number of possible purpose codes used in CITES annual reports, means that some conclusions drawn from analysis of CITES data are only tentative. For example, the purpose code ‘T’ which indicates a commercial transaction would apply equally if the animals were destined for either the pet trade or the farming industry. Below we consider the reported trade on a species by species basis. 5.1. Alligator mississippiensis Israel reported exporting nine animals to Spain in 2002 and a further 94 in 2003. Spain similarly reported importing nine animals in 2002 but 105 in 2003. In 2004 Spain reported importing 151 from Israel whereas Israel only reported 94. Another 10 animals were reported by Israel as being exported to Ukraine in both 2003 and 2004. There were limited exports (< 50 per annum) from the United States of America during the period under study, mostly destined for zoos. 5.2. Alligator sinensis China reported exporting 30 to Japan in 2000, 64 to Czech Republic, Denmark and Spain in 2001, 10 to Japan in 2002 and a further 16 to Japan in 2003. The only trade in 2004 was two imported by Canada from the United States. All were captive-bred specimens. 5.3. Caiman crocodilus - Guatemala reported exporting 3300 Caiman crocodilus crocodilus to the United
States in 2000 and 470 C. c. fuscus to Spain in 2003. All specimens were reported to have been bred in captivity. In 2002 Guatemala reported exporting 205 hybrid C. c. crocodilus x C. c. fuscus to the United States.

50
- Guyana reported exporting 4161 animals in 2001, 4298 in 2002, a further 3373 in 2003 and 2797 in 2004, all presumably destined for the pet industry. All were wild-caught and the main destinations were Europe, Japan and North America.
- Suriname regularly exports wild-caught animals for the pet industry: 94 in 2001, 420 in 2002, 102 in 2003 and 39 in 2004. The main destinations used to be Europe and North America, however in 2002, 2003 and 2004 most of the animals were destined for the Russian Federation.
- Venezuela reported exporting 3000 to Thailand and 4500 to Taiwan, Province of China, in 2000, all of ranched stock. Exports to the latter destination increased to 11,100 in 2001, 10,512 in 2002 and 11,140 in 2003. The United States reported importing animals from Venezuela in 2001 and 2003. China reported importing 4000 live captive-bred specimens of C. c. crocodilus from Thailand in 2000 but it is not known if they originated in Venezuela and it has not been possible to confirm the transaction via the annual reports of Thailand.
5.4. Caiman yacare Guatemala reported exporting 50 captive-bred specimens to the United States in 2000 and Paraguay reported exporting 200 wild caught specimens to Canada, who also reported the import, in 2002. 5.5. Melanosuchus niger Fifteen captive-bred specimens were exported from Ecuador to Denmark in 2004. 5.6. Palaeosuchus palpebrosus Guyana has an export quota of 500 live wild specimens annually and reported exporting 352 in 2002, 480 in 2003 and 381 in 2004. The animals all appear to be for the pet industry with the main importing country being the United States. Smaller quantities go to Canada, Europe, Japan, Malaysia, Mexico, the Republic of Korea, the Russian Federation and Ukraine. 5.7. Palaeosuchus trigonatus As with P. palpebrosus, Guyana has an export quota of 500 live wild specimens annually and reported exports of 224 in 2002, 354 in 2003 and 210 in 2004. The main importing country was the United States, with smaller quantities going to Canada, Europe, Japan, Malaysia and Thailand. 5.8. Crocodylus mindorensis In 2002 the Philippines reported exporting six animals to Australia for breeding purposes, their source being listed as ‘F’. No further trade in this species has been reported. 5.9. Crocodylus moreletii In 2000 Mexico reported exporting 100 captive-bred animals to Spain and a further 10 to Germany. Four more were reported being exported to Spain in 2001 and in 2003 five were exported to Canada and another 10 to Indonesia. Twelve were exported to Morocco in 2004.

51
5.10. Crocodylus niloticus South Africa is the main importer of live specimens of this species, importing mainly from the neighbouring range States of Botswana, Mozambique and Namibia. Although 2003 saw the first major import from Kenya, this was not repeated in 2004. Details are shown in Table 8.
Table 8. South Africa’s imports of live Crocodylus niloticus 1997-2004
1997 1998 1999 2000 2001 2002 2003 2004 Botswana 1700 2050 3827 3300 3670 720 0 Kenya 0 0 0 0 0 0 4000 0 Mozambique 0 4000 0 49 0 7000 5600 25,000 Namibia 800 2150 0 2603 1000 1100 1000 Zimbabwe 0 0 0 0 0 50 6 0 Total 2500 8200 3827 5952 4670 8870 9606 26,000 The 2005 annual report has already been received from Mozambique and indicates exports of 24,200 animals to South Africa in that year. Zimbabwe reported exporting 120 wild-caught specimens to Mauritius in 2003 and there are exports from South Africa numbering several hundreds to Spain and the Republic of Korea in 2004. 5.11. Crocodylus porosus China was the main destination for this species in 2000 with 65 reported as exports by Malaysia, 210 by Myanmar and 330 by Thailand. In 2001 Singapore reported exporting 299 to Thailand but trade has declined since then. In 2003 Thailand reported exporting a total of 30 to Japan (20) and the Republic of Korea (10) and in 2004 Bangladesh reported importing 75 from Malaysia. 5.12. Crocodylus siamensis China began importing this species from Thailand in 1997 and from Cambodia in 2000 and, as shown in Table 9, has imported over 220,000 live specimens from Cambodia, Thailand and Viet Nam in the eight-year period to 2004. Imports decreased in 2003 but increased again in 2004. The annual reports for 2003 and 2004 from Viet Nam, an important producer of this species, have not yet been received. Thailand also reported exporting 1000 animals to Viet Nam in 2004. As noted in the section on skins, Cambodia has six crocodile farms, and Thailand 17, registered with the CITES Secretariat for the commercial production of this species
Table 9. China’s imports of live Crocodylus siamensis 1997-2004
Exporter 1997 1998 1999 2000 2001 2002 2003 2004 Cambodia (direct) 0 0 0 10,000 6272 26,746 0 5000 Cambodia (via Viet Nam)
0 0 0 3000 10,300 8333 640 0
Thailand (direct) 2128 5078 44,622 26,475 12,679 10,148 17,300 30,250 Thailand (via Viet Nam)
0 0 0 0 500 750 0 0
Viet Nam (direct) 0 0 0 0 0 0 300 3100 Total 2128 5078 44,622 39,475 29,751 45,977 18,240 38,350

52
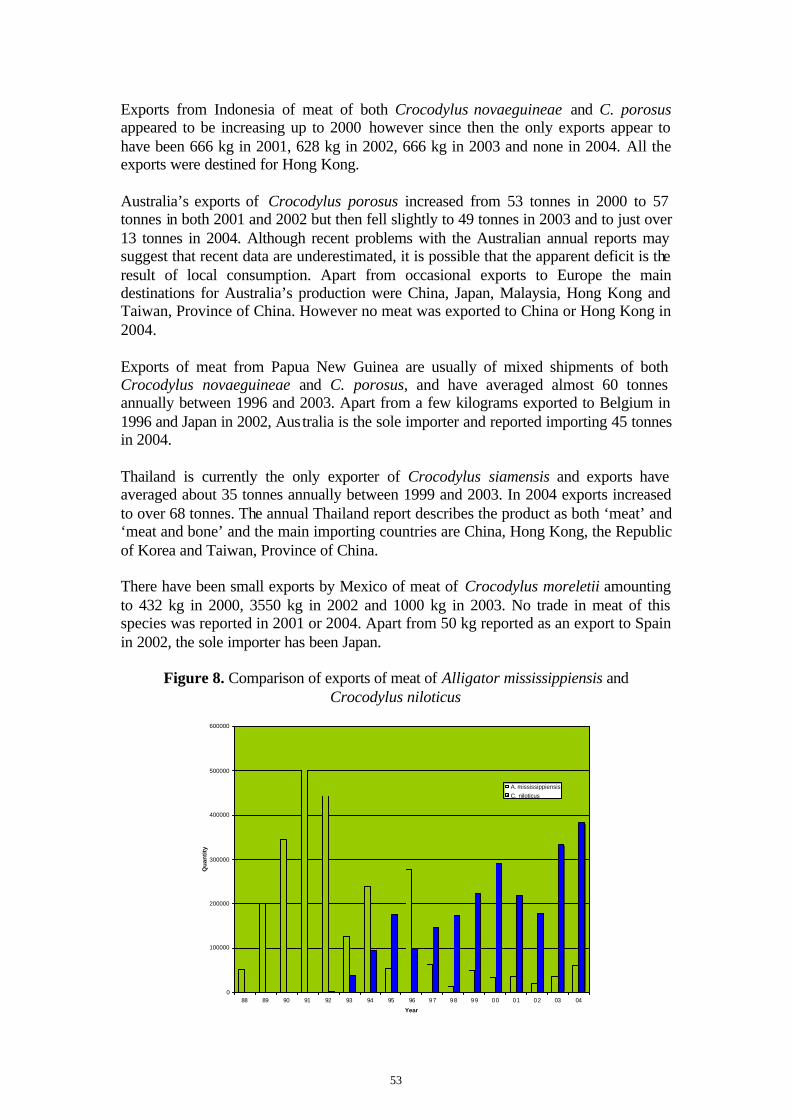
6. Trade in other by-products 6.1. Meat Figure 7 shows total world exports as reported in CITES annual reports from 1988 to 2004 and indicates that since 1989 the amount traded globally has averaged almost 400 tonnes yearly and over that period has fluctuated between 250 tonnes in 1989 to 595 tonnes in 2004. Apart from an apparent peak in 1996 and an apparent decrease in 2002, there has been a steady year on year increase since 1995. However, since 1988 there have been major fluctuations in the countries and species involved. Until 1992 the main species in trade was Alligator mississippiensis from the United States, particularly to Taiwan, Province of China, Japan, Canada and the United Kingdom. No exports to Taiwan, Province of China, have been reported since 1994 and export levels have fallen since 1995 (see Figure 8) with the main importers currently being Canada, China and Hong Kong. Since 1993, exports of Crocodylus niloticus from South Africa, Zambia and Zimbabwe have increased steadily from less than two tonnes in 1992 to a peak of over 380 tonnes in 2004. Initial analysis suggested a decrease to 230 tonnes in 2004, however this was the result of severe under-reporting by Zimbabwe. The figure reported in the Zimbabwe annual report for 2004 was of seven shipments weighing 102 tonnes, while importing countries reported importing 18 shipments weighing 256 tonnes, a figure close to that reported by CFAZ (251 tonnes). The main destinations for the African production are Europe (particularly Belgium, Germany, Netherlands, Switzerland and the United Kingdom), Hong Kong and China, however in 2004 25 tonnes went to Japan. It appears that all of Zambia’s production is exported via South Africa. Some imports from Israel and the United Republic of Tanzania have been reported but not since 1996. Figure 8 compares the exports from North America with those of Africa.
Figure 7. Global exports of crocodilian meat 1988 – 2004
0
100000
200000
300000
400000
500000
600000
700000
88 89 90 91 92 93 94 95 96 97 98 99 00 01 02 03 04
Year
Qua
ntity
53
0
100000
200000
300000
400000
500000
600000
88 89 90 91 92 93 94 95 96 97 98 99 00 01 02 03 04
Year
Qu
anti
ty
A. mississippiensisC. niloticus
Exports from Indonesia of meat of both Crocodylus novaeguineae and C. porosus appeared to be increasing up to 2000 however since then the only exports appear to have been 666 kg in 2001, 628 kg in 2002, 666 kg in 2003 and none in 2004. All the exports were destined for Hong Kong. Australia’s exports of Crocodylus porosus increased from 53 tonnes in 2000 to 57 tonnes in both 2001 and 2002 but then fell slightly to 49 tonnes in 2003 and to just over 13 tonnes in 2004. Although recent problems with the Australian annual reports may suggest that recent data are underestimated, it is possible that the apparent deficit is the result of local consumption. Apart from occasional exports to Europe the main destinations for Australia’s production were China, Japan, Malaysia, Hong Kong and Taiwan, Province of China. However no meat was exported to China or Hong Kong in 2004. Exports of meat from Papua New Guinea are usually of mixed shipments of both Crocodylus novaeguineae and C. porosus, and have averaged almost 60 tonnes annually between 1996 and 2003. Apart from a few kilograms exported to Belgium in 1996 and Japan in 2002, Australia is the sole importer and reported importing 45 tonnes in 2004. Thailand is currently the only exporter of Crocodylus siamensis and exports have averaged about 35 tonnes annually between 1999 and 2003. In 2004 exports increased to over 68 tonnes. The annual Thailand report describes the product as both ‘meat’ and ‘meat and bone’ and the main importing countries are China, Hong Kong, the Republic of Korea and Taiwan, Province of China. There have been small exports by Mexico of meat of Crocodylus moreletii amounting to 432 kg in 2000, 3550 kg in 2002 and 1000 kg in 2003. No trade in meat of this species was reported in 2001 or 2004. Apart from 50 kg reported as an export to Spain in 2002, the sole importer has been Japan.
Figure 8. Comparison of exports of meat of Alligator mississippiensis and
Crocodylus niloticus

54
6.2. Teeth Australia is the most important user of crocodile teeth and between 1999 and 2004 imported nearly 285,000. Most of the teeth were Crocodylus porosus from the operations in Malaysia, Papua New Guinea and Singapore. In 2003 Australia imported over 3000 teeth of Alligator mississippiensis from the United States, and another 8967 in 2004.
7. Declared dollar value Although CITES annual reports do not usually contain information concerning the value of the trade or of individual shipments, the United States has included this information since 1997. This figure is not necessarily accurate but can used by UNEP-WCMC to identify typographic errors in the report, for example where it is suspected that a decimal point has been omitted. There is great fluctuation amongst the reported values as may be expected and no indication of the size or quality of the skins is provided, indeed for caiman species flanks may have been reported as whole skins to further complicate the issue. Many of the values are nonsensical and may be the result of a typographic error in that field of the report; these have been ignored in the analysis below. Table 10 shows the average declared value per skin (in $US) of exports of Alligator mississippiensis and the reported value of re-imports of these skins from Europe, Mexico and Asia after tanning. Although the original value of exports fluctuates from year to year, the value of the re- imports has been considerably higher, as one would expect. Table 10. Reported US dollar value of Alligator mississippiensis skins 1997-2004 1997 1998 1999 2000 2001 2002 2003 2004 Exports from USA 103.7 77.8 97.6 102.9 100.8 101.4 106.4 112.5 Re-imports by USA 143.0 116.3 140.0 179.4 169.5 108.6 124.6 144.9
Table 11 compares the reported average value per skin of Colombian Caiman crocodilus fuscus imported directly from Colombia and via third countries. The source of re-exported skins varies from year to year but the majority are imported directly from Colombia or via Singapore. It is interesting to note that India was first reported as a re-exporter in 2004. The declared value of the direct imports from Colombia increased in both 2001 and 2002 but has dropped back a little since then, while the value of skins from Singapore has fluctuated between $US 48.9 in 1997 and $US 39.9 in 2002. Table 11. Reported US dollar value of Colombian Caiman crocodilus fuscus skins 1997-2004
Exporter/Re-exporter 1997 1998 1999 2000 2001 2002 2003 2004 Colombia 39.3 38.6 39.7 37.4 43.5 50.7 49.9 46.8 European Community 53.2 81.3 25.2 68.5 24.7 63.8 - - Mexico - - 52.4 43.5 49.1 41.5 38.0 - Panama 52.0 27.1 - 20.2 59.2 - 54.4 - Singapore 48.9 48.6 44.7 42.5 43.8 39.9 47.8 43.4 Switzerland 24.3 - 61.4 28.6 29.5 25.0 - 29.5 Thailand - 48.6 49.4 45.8 52.2 56.5 32.6 54.0

55
8. Infractions of CITES Information on seizures are supposed to be recorded in CITES annual reports but is frequently omitted, perhaps because the relevant authorities involved, i.e. the Customs officers making the seizures and the CITES Management Authorities producing the annual reports seldom liaise closely. Furthermore, the data recorded by Customs rarely allows the goods to be identified at the species level. Most of the seizures that are reported are of tourist items such as dried heads, whole stuffed baby crocodiles, etc. and personal imports of manufactured leather goods. It should be noted that most of the data reflect the diligence of Customs officers inspecting tourist luggage and do not indicate problem areas for the crocodilian industry. In addition, many of the items seized on import are subsequently released to the importer when adequate permits have been obtained. Of the more significant items reported in recent years, the United States reported seizures of 10 back skins of Crocodylus niloticus from Zimbabwe and 150 Appendix-I C. porosus skins from Singapore in 2000, 2000 skins of Caiman crocodilus fuscus from Colombia and a further 399 from Panama in 2001. The United States also reported seizures of two skulls of Crocodylus rhombifer from Cuba, four bodies of C. siamensis from Cambodia and eight manufactured items of Osteolaemus tetraspis from Equatorial Guinea and Nigeria in 2004. Spain reported the seizure of 300 skins of Caiman crocodilus fuscus from Colombia in 2002 and Luxembourg reported a seizure of 650 backskins of Crocodylus niloticus from Zimbabwe in 2003. In 2002 the United Kingdom seized a shipment of 10 live Osteolaemus tetraspis from Niger.
9. Discussion and recommendations The overall volume of world trade in classic crocodilian skins and caimans from 1996 to 2004 is summarised in Table 12 and based, wherever possible, on country of export data. There are uncertainties regarding the overall total figures because of the lack of annual report data from certain key countries, particularly Kenya, Nicaragua, Uganda and Venezuela. However it is hoped that the estimates made using import country data are sufficient to indicate close approximations to actual exports. Some diversification in the trade began in 2001 with two different species entering the market, captive-bred Crocodylus acutus from Colombia and Caiman latirostris from Argentina. Trade in these species continued in 2002 and 2003 and the first exports of C. acutus from Honduras were reported in 2003. The first exports in recent years of wild Caiman crocodilus crocodilus skins from Guyana occurred in 2001 and continued through 2004. The increase in exports of Alligator mississippiensis from the United States of America noticed in 2001 was not sustained the following year and dropped back towards the level seen in the late 1990s. However exports in 2003 and 2004 saw the quantities increase again. The possible reasons for these fluctuations are discussed in the relevant section of this report. Exports of Crocodylus niloticus increased steadily up to 2002 with Madagascar, South Africa, Zambia and Zimbabwe being the main suppliers. However, 2003 saw a reduction to the level of 2000,and this trend continued in 2004 with most of the major exporters showing decreased exports.

56
Crocodylus novaeguineae form Papua New Guinea appeared to increase in 2004 according to both exporters and importers data, and C. porosus trade continued to be stable. Thailand’s exports of C. siamensis, which had ranged between 1679 and 5459 between 1996 and 2002 showed a sharp increase to almost 11,000 in 2003 and to over 20,000 in 2004. Trade in caiman skins peaked in 2000 but fell by 30 per cent between 2001 and 2002. A slight recovery was observed in 2003 and 2004 as a result of increased exports from Bolivia and Colombia. Overall the total number of skins entering international trade in 2004 appears to have been in excess of 1.3 million, higher than in 2002 and 2003 but still less than in three years before that. This figure may be need adjustment when more annual reports are received.
Table 12. Reported trade in crocodilian skins 1996-2004
Species 1996 1997 1998 1999 2000 2001 2002 2003 2004
Alligator mississippiensis
163,936 198,649 206,620 239,944 249,155 343,116 237,840 341,734 368,409
Crocodylus acutus 0 0 0 0 0 100 630 830 197
C. johnsoni 1641 194 309 45 10 0 2 0 0
C. moreletii 20 146 193* 2 1228 3643 1588 1037 609
C. niloticus >67,528 89,568 79,717 133,339 147,240 150,757 159,953 148,407 140,343
C. novaeguineae 14,234 33,012 25,491 22,191 23,233 30,634 30,749 27,308 39,796
C. porosus 19,651 18,554 24,123 15,971 25,791 28,164 24,278 26,364 30,219
C. rhombifer 40 0 2 0 0 0 0 0 2
C. siamensis 3186 5452 1679 5459 2417 4422 3580 10,982 20,105
subtotal 270,236 345,575 338,134 416,951 423,283 560,836 458,620 556,662 599,680*
Species 1996 1997 1998 1999 2000 2001 2002 2003 2004
Caiman crocodilus crocodilus
26,346 37,084 35,580 32,571 38,155 25,510* 22,709 34,636 55,841*
C. crocodilus fuscus 656,585 475,053 691,348 777,791 840,993 710,113 551,626 572,059 621,691
C. latirostris 0 0 0 0 0 88 90 165 225
C. yacare 1261 21,115 6497 615 15,629 32,128 78,811 60,288 41,882
subtotal 684,192 533,252 733,425 810,977 894,777 767,839 653,236 667,148 719,639
Grand total 954,428 878,827 1,071,559 1,227,928 1,318,060 1,328,675 1,111,856 1,223,810 1,319,319
* = data deficient
-----

57
Fall Of The Wild? Captive Crocodilian Production
And The Shaping Of Conservation Incentives1
James MacGregor
Researcher, International Institute for Environment and Development IIED, 3 Endsleigh Street, London WC1H 0DD, UK
[email protected] 1. Background This presentation reported on the research into the economics of the crocodilian skin industry and its incentives for conservation since 2001. A lack of systematic economic analysis of the global trade in crocodilian skins has been an obstacle to assessing the full potential for the conservation of crocodilians from a market-driven perspective. The means to address this gap were considered by members of the Crocodile Specialist Group (CSG) of the Species Survival Commission of IUCN, resulting in the commissioning of an initial study into the broad economics issues and linkages between industry and conservation2, and a subsequent study (reported here) to assess:
? the impacts on markets for crocodilians of the shift away from their wild harvest towards captive production; and,
? the impacts on conservation of wild crocodilians of this shift. To inform the study, research focussed on Colombia, the largest supplier of crocodilian skins to the international market; Zimbabwe, also a prime supplier of crocodilian skins; and France, Italy and Japan, as major consumer countries. Interviews with crocodilian skin industry participants in the latter countries were conducted from November 2002 to May 2004 and further information was obtained from literature, international trade data and members of the CSG. 2. Production, conservation, economics and the industry Many crocodilians were subject to uncontrolled exploitation in the past when sub-adult and adult crocodiles were hooked, speared, shot or otherwise killed, largely for their skins for international trade. Subsequently, species and populations began to be protected and over time several successful commercial crocodilian conservation initiatives have been established.
1 The full report that this presentation is taken from can be found on http://www.traffic.org. MacGregor, J (2006). Call of the wild: captive crocodilian production and the shaping of conservation incentives. TRAFFIC On-line report, 57pp. All tables and figures unless stated are taken from this report. 2 MacGregor, J (2002). International Trade in Crocodilian Skins: Review and Analysis of the Trade and Industry Dynamics for Market-based Conservation. Report for the Crocodile Specialist Group. www.flmnh.ufl.edu/herpetology/CROCS/MacGregorFinalDec2002.doc.

58
Some of these are still based on the off-take of wild animals, many are based on the off-take of eggs from the wild, but increasingly crocodilians are captive-bred. Current ‘best practice’ in market-based conservation points to the clearest route for appropriation of conservation values being through wild harvests and ranching. This trend towards captive-bred production of leather is part of the dynamic processes at work in the crocodilian leather industry. Table 1 presents some of the chief changes to supply characteristics since 1975 and Figure 1 illustrates the global production trends.
Table 1: Changes in supply characteristics of crocodilian skins to international trade since 1975

59
Figure 1: Trade trends in crocodilian skin by method of production
(including caiman production), 1983–99, estimated
Source: MacGregor, 2002 Colombian caiman production illustrates these industry-management linkages. Crocodilian skin production in Colombia today is predominately from captive-bred crocodilians, where the breeding stock is captive. It has an assured place in the market, including in new and growing markets, for example, in Asia. Colombia’s crocodilian skin production comprises, almost exclusively, caiman skin. This leather is now prized as high quality, having previously taken second place to the widely favoured ‘classic’ leather from crocodiles and alligators. See Figure 2.
0
200000
400000
600000
800000
1000000
1200000
1400000
1600000
1983 1984 1985 1986 1987 1988 1989 1990 1991 1992 1993 1994 1995 1996 1997 1998 1999
No.
of
skin
s in
inte
rnat
iona
l tra
de
Wild
Ranched
Captive-bred
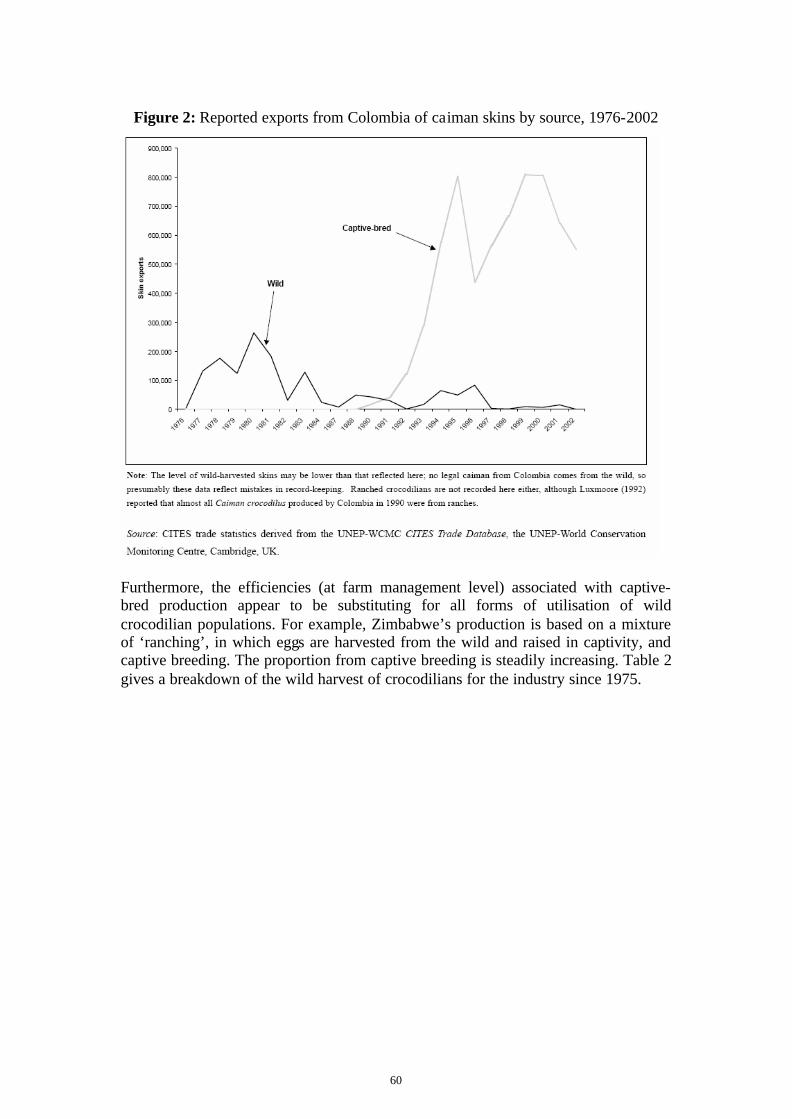
60
Figure 2: Reported exports from Colombia of caiman skins by source, 1976-2002
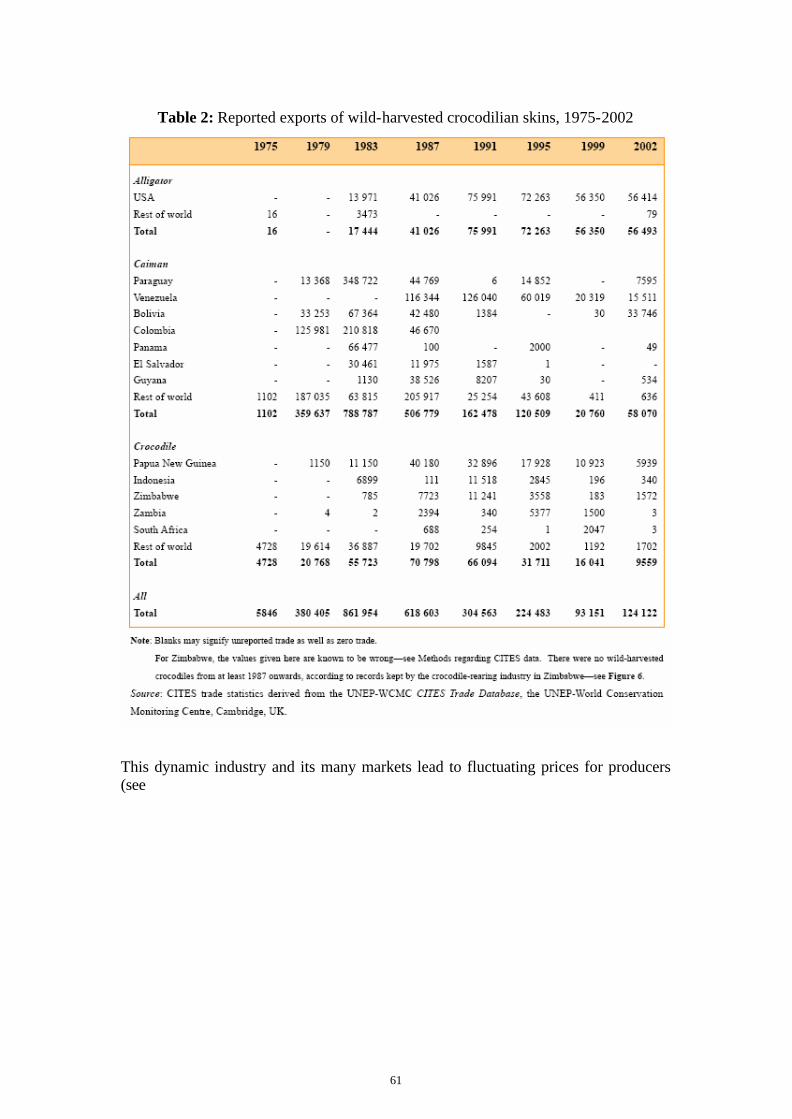
Furthermore, the efficiencies (at farm management level) associated with captive-bred production appear to be substituting for all forms of utilisation of wild crocodilian populations. For example, Zimbabwe’s production is based on a mixture of ‘ranching’, in which eggs are harvested from the wild and raised in captivity, and captive breeding. The proportion from captive breeding is steadily increasing. Table 2 gives a breakdown of the wild harvest of crocodilians for the industry since 1975.
61
Table 2: Reported exports of wild-harvested crocodilian skins, 1975-2002
This dynamic industry and its many markets lead to fluctuating prices for producers (see

62
Figure 3). Pre-export prices for wild skins fluctuate over time in rough concert with the prices for other skins. Conservation, world events, fashion, new and emerging markets, technology, climate, retailer concentration and CITES regulations all play significant roles in defining production volumes and values. However, these data need to be differentiated further by grade and market to discern the full dynamics of the industry, and to associate the inherent conservation values better with industry incentives.

63
Figure 3: Pre-export values of wild alligator skins, 1981-2005,
constant blended (pre-export) values, estimated
0
10
20
30
40
50
60
70
1981 1983 1985 1987 1989 1991 1993 1995 1997 1999 2001 2003 2005
(U$/
ft)
Source: Data from: MacGregor (2002); Don Ashley pers comm. 18/6/06. 3. Consumption, conservation, economics and the industry The falling significance of wild harvested skins in Colombia and Zimbabwe is mirrored by the imports of the major crocodilian skin consumer countries surveyed, which chart a decline in demand for wild-harvested crocodilian skin, to the point of its virtual exclusion from the trade (see Figure 4). Study of the crocodilian skin industry in these countries reflects the upward drift of caiman skin in terms of quality and the consequent blurring of the caiman/classics divide. It also reveals a restructured industry, with a newly-dominant retail sector, partly governed by powerful fashion-brand conglomerates with global reach. Conservation principles are reported to be absent from retailing strategies and consumers’ buying decisions. Where conservation is considered, judgements are simplistic and favour captive-reared crocodilians, without any distinction between ranched and captive-bred sources.

64
Figure 4: Reported imports of wild-harvested caiman skins to France, Italy and Japan, 1975-2002
Following some private sector research by the Japan Leather Importers’ Association (see Table 3), some intriguing new data has emerged about who the Japanese customer of crocodilian handbags is. This shows that the typical consumer of large crocodilian products is over 40, while the ‘average consumer’ is over 50 and female. Table 3: Estimated age structure of purchasers of large crocodilian leather products,
Japan, 2002 (n=12,274)
Age group Frequency Proportion of market
(approx. %)
<19 74 1% 20-29 802 7% 30-39 1,594 13% 40-49 2,714 22% 50-59 4,241 35% 60-69 2,175 18% 70> 674 5%
Source: Japan Leather Importers’ Association Initial drivers for the shift away from wild-harvested crocodilian production included conservation motives. The premise on which those motives were based, however, has become outdated by the far-reaching changes the crocodilian skin industry has witnessed since the establishment of the first ranching and captive breeding operations. Largely as a result of the success of these, the industry has come to depend upon the quality and reliability of skins from their captive stock and, indeed,

65
has restructured in parallel and in concert with the development of captive-reared crocodilian production to the point where attributes of captive crocodilian skins coincide with those valued by the crocodilian skin industry and are what the market wants. 4. The future of crocodilian conservation The rationale for market-driven conservation, on which much crocodilian conservation has been founded, is that the financial benefits of commercial exploitation of the species can be harnessed within a management and regulatory framework to provide strong incentives for conservation. This study suggests that the link between commerce and the incentive for conservation is declining since the links between the crocodilian skin industry and wild populations of crocodilians are increasingly tenuous. The conservation motive for re-stimulating trade in wild crocodilian skin was clear. Wild crocodilians could once again be given a trade value and, furthermore, one which outweighed their nuisance factor and the value of other potential uses of their habitat. The author suggests that wild-harvested crocodilians once again need to be valued by the exotic skin industry, so that sustainable harvesting of wild crocodilians (i.e. hunting or ranching) will increase. What is less clear is how this might be achieved. But satisfaction of both the conservation requirement for a revival of use of wild crocodilians and market criteria could be achieved, and in this regard it is worth considering that:
? the crocodilian skin industry, or any industry founded on wild resources, is unwise to turn its back on the wild supply;
? wild crocodilian skins retain some advantages in today’s market—wild classic skins remain at the vanguard of the strategy of luxury brands;
? conservation messages are not precluded from the fashion world and, with careful planning and development, conservation and brand messages could be synchronized and complementary; and,
? captive breeding has a role to play in any crocodilian skin industry based on increased use of wild crocodilians and should not be viewed as a production method that needs stamping out.
From an economic viewpoint the restructuring within the industry over the past 30 years is typical of increasingly retailer-driven procurement strategies across all products. Figure 5 illustrates the key changes to the industry since the 1970s (bottom right) to the 2000s (top right). Quality shifts have expanded certain markets (e.g. watchstrap), created new markets (other branded goods) and, importantly, ensured that quality standards are the entry ticket for all industry participants.
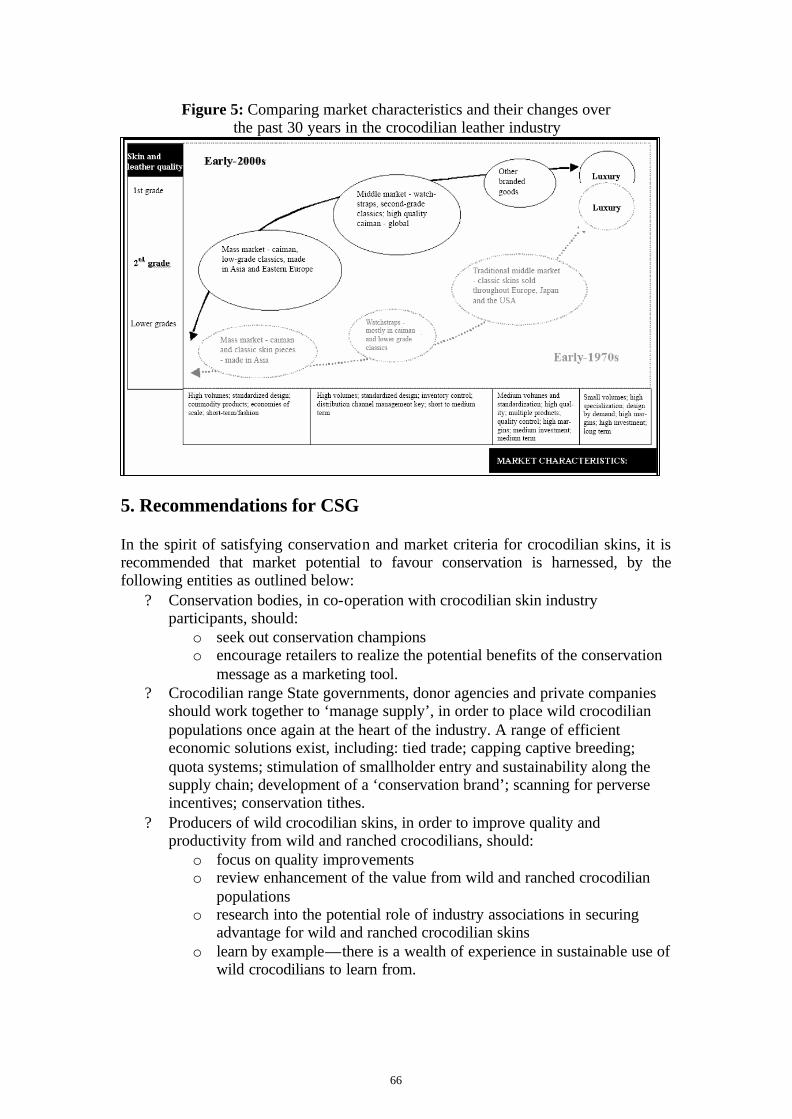
66
Figure 5: Comparing market characteristics and their changes over the past 30 years in the crocodilian leather industry
5. Recommendations for CSG In the spirit of satisfying conservation and market criteria for crocodilian skins, it is recommended that market potential to favour conservation is harnessed, by the following entities as outlined below:
? Conservation bodies, in co-operation with crocodilian skin industry participants, should:
o seek out conservation champions o encourage retailers to realize the potential benefits of the conservation
message as a marketing tool. ? Crocodilian range State governments, donor agencies and private companies
should work together to ‘manage supply’, in order to place wild crocodilian populations once again at the heart of the industry. A range of efficient economic solutions exist, including: tied trade; capping captive breeding; quota systems; stimulation of smallholder entry and sustainability along the supply chain; development of a ‘conservation brand’; scanning for perverse incentives; conservation tithes.
? Producers of wild crocodilian skins, in order to improve quality and productivity from wild and ranched crocodilians, should:
o focus on quality improvements o review enhancement of the value from wild and ranched crocodilian
populations o research into the potential role of industry associations in securing
advantage for wild and ranched crocodilian skins o learn by example—there is a wealth of experience in sustainable use of
wild crocodilians to learn from.

67
? To maximize potential usefulness of trade data, CITES Parties should improve data, so that it more keenly supports conservation requirements.
-----
Safety Evaluation of Crocodile Blood Diet
Win Chaeychomsri1, Jindawan Siruntawineti1 , Boongeua Vajarasathira1 and
Yosapong Temsiripong2,3.
1Department of Zoology, Faculty of Science, Kasetsart University, Bangkok 10900, Thailand
2Sriracha Moda Co., Ltd., Chonburi 20110, Thailand; 3Crocodile Management Association of Thailand (CMAT)
Abstract: The safety for consuming crocodile blood as traditional medicine has not been scientifically reported. To evaluate the effect of crocodile blood consumption on hematological valves, biochemical values and histopathological changes, both sexes of Wistar rats were devided in 5 groups. The crocodile blood, either in fresh or in freeze-dried form, was orally administered for 7 weeks. The blood ingestion had no effect on rat behavior and survival. After taking the crocodile blood 2, 4, 8, 12 and 24 weeks, the rat blood was collected from tail-vein for hematological investigations. The hematological values did not reveal differences between the treated and the control groups. The significantly lower hematocrit values were found in females treated with freeze-dried blood. However, these changes were within normal range. The rat sera were collected before having the blood 12 and 24 weeks after feeding. The biochemical values including alkaline phosphatase (ALP), aspartate transaminase (AST), alanine transaminase (ALT), blood glucose, blood urea nitrogen (BUN) and albumin were not significantly different among experimental groups throughout the study time. These results indicated no adverse effects of crocodile blood on liver and kidney functions. These data suggest the safety of crocodile blood as food supplement in animal.
1. Introduction Siamese crocodiles, Crocodylus siamensis, are one of economic animals of Thailand. They were reared for several purposes including meat marketing, slaughtering, tanning, and making genuine crocodile leather products. People in Asian countries such as in China, Taiwan, Hong Kong, and Korea traditionally believed that crocodile meat is nourishing food. Crocodile blood and organs can served as medicines for curing illness such as allergy, asthma, and may also prolong their life. There are several reports showed that the crocodile blood has ability to inhibit bacterial growth in vitro (Chaeychomsri, et al., 2003; Siruntawineti, et al., 2003, Siruntawineti, et al., 2004 and 0 HUFKDQWHW�DO . However, the safety for crocodile blood consumption has never been reported.

68
Blood is important tissue that is responsible to carry all metabolic products. As a result hematological alterations can lead to significant immunological effects. The practice of consuming crocodile blood for improving human health is found in the traditions of many Asian cultures (Pichiensuntara and Geeravocks, 2003). To ensure safety in crocodile blood consumption, this experiment was performed to observe hematological, biochemical and histopathological changes in serum of Wistar rats.
2. Material and methods 2.2 Preparation of Crocodile Blood The blood was collected from Siamese crocodiles (Crocodylus siamensis) raised at Sriracha Crocodile Farm and Sriracha Moda Farm, Chonburi, Thailand using sterile technique. Fresh crocodile blood was weekly taken and kept at 4oC in sterile containers. The freeze-dried blood was prepared in sterile conditions, packed under vacuum and stored at 4oC until use.
2.2. Laboratory animals The Animal Ethics Committee of Kasetsart University, Thailand approved the use of laboratory animals in this study. Wistar rats, twenty-five of each sex, were purchased from The National Laboratory Animal Center, Mahidol University, Salaya, Thailand. They aged 6-8 weeks with weight ranging from 240 to 320 g for male and 180 to 225 g for female. They were housed in animal facility at the Department of Zoology, Kasetsart University. The animals were allowed to have free access to food and clean water under standard conditions of 12:12 h dark- light period, with 30-70 % relative humidity and at temperature of 25-29 oC. The rats were divided into 5 groups per sex. Group 1 (water control) received treated water (C). Group 2 received 300 ? l of fresh crocodile blood/day (Bd). Group 3 received 300 ? l of fresh crocodile blood/week (Bw). Group 4 received 50 mg of freeze dry crocodile blood/day (FBd). Group 5 received 50 mg of freeze dry crocodile blood/week (FBw). Four groups of treatment (Bd, FBd, Bw and FBw) were fed with crocodile blood as food supplements, either in fresh or in freeze-dried forms, for 45 days. Rats were observed for the sign of abnormalities throughout the study and their body weights were weekly measured.
2.3. Blood Collection and Hematological Study After supplementing with crocodile blood, rat blood was sampled at 2, 4, 8, 12 and 24 weeks for hematological studies. The blood was withdrawn from tail vein using ethylene diamine tetraacetic acid (EDTA) as anticoagulant. A complete blood count (CBC) with a WBC differential was performed on blood samples. Hematocrit (Hct) was determined according to the standard microcentrifugation method. White blood cell (WBC) was manually counted. The hemoglobin concentration (Hb) was examined by the cyanmethemoglobin method. Thin blood smears were prepared and stained with commercial Dip-Quick® stain (Clinical Diagnostics, Bangkok, Thailand) for WBC differential count. All values were compared to that of untreated control animals and to the standard range for rats.
69
2.4. Biochemical study The blood was sampled prior to the experiment 12 and 24-weeks after housing. The blood was taken by drawing from the tail vein and kept in dry centrifuge tubes. The biochemical values of serum, alkaline phosphatase (ALP), aspartate transaminase (AST), alanine transaminase (ALT), blood glucose, blood urea nitrogen (BUN) and albumin were measured by using an automatic biochemistry analyzer (Hitachi model 219).
2.5. Histopathological study The specimens were taken from intestine, kidney, and liver of rat after 24 weeks of treatment. These organs were then collected, weighted to determine relative organ weights and fixed with Bouin’s fixative. Tissues slides were prepared and stained with hematoxylin and eosin. The slides were examined by a pathologist.
2.6. Statistical Analysis The data were analyzed by one-way ANOVA. The significant differences between the experimental groups, at p<0.05, were compared by Duncan multiple range test to distinguish significant differences between groups at p<0.05. Each value represents mean+SD.
5 HV ults, discussion and conclusion Throughout the experiment rats appeared healthy, inquisitive and active. No illness or death occurred. The body weight of male rat received fresh and freeze-dry crocodile in all groups (Bd, FBd, Bw and FBw) were significant higher than control group from first week until the end of the study (Figure 1). In addition, the body weight of only female rat recieved freeze–dried blood groups (FBd and FBw) and fresh crocodile blood per week (Bw) were significant higher than control and fresh crocodile blood per day (Bd). Male rat fed fresh crocodile blood per day (Bd) and freeze-dried crocodile blood per day FBd have significant lower relative weight of kidney than control group, Bw and FBw. Female rat have different relative weight of kidney than male. These results indicated that male rat have higher growth rate after fed crocodile blood in all form than male rat that have normal diet. Although, female rat fed freeze-dried crocodile blood per day and per week and freeze-dried crocodile blood per day have higher growth rate than the rat fed fresh crocodile blood and control, this may in part due to the initial body weight which were significant higher than those of control and FBd from the beginning of the study.

70
100
150
200
250
300
350
400
450
1 2 3 4 5 6 7 8 9 10 11 12 13 14 15 16 17
BdM
BwM
CM
FBdM
FBwM
BdF
BwF
CF
FBdF
FBwF
Figure 1 Growth curve of male and female Wistar rat fed fresh and freeze dry crocodile blood for 17 weeks.
The hematological parameters of Bd- and FBd-treated groups did not differ from that of the control in both sexes (Table 1 and Table 2). Basophil was not found during WBC differential counts. The female rats receiving freeze-dried blood had significantly lower hematocrit than those of the control group (p<0.05). These were probably due to changes during female reproductive cycle. However, all hematological values were comparable with the normal values reported in literatures (Siruntawineti, et al., 2004; Chaeychomsri, et al., 2004). This result indicated that administration of the crocodile blood as food supplements, either in fresh or in freeze-dried forms, for 45 days to Wistar rats, did not have any adverse effects on hematological values. Moreover, our previous studies confirmed that the crocodile blood was free from parasites (Flecknell, 1995 and Matsuda, et al., 2000.). Therefore crocodile blood should be safe for consumption as food supplement.
Bod
y w
eigh
t (g)
Duration of treatment (weeks)

71
Table 1 Hematological examination results of male rat fed crocodile blood before treatment
0 wk 12 wks 24 wks Control Bd FBd Control Bd FBd Control Bd FBd
Hematocrit (%) 50.80+ 2.16
47.87+1.93
51.00+1.22
52.90+2.72
48.50+2.42
47.90+2.63
46.16+1.75
49.66+0.57
48.66+0.76
Hemoglobin (g/dl)
17.37+0.74
16.60+0.79
18.24+0.45
16.88+1.35
16.24+1.06
17.92+2.11
15.54+1.14
16.60+0.46
16.50+0.18
Hem
atol
ogic
al
Val
ues
WBC (x103/? l) 8.47+ 1.59
8.22+ 1.25
9.28+ 2.26
6.53+ 3.44
6.81+ 2.24
7.13+ 1.81
7.27+ 1.31
7.34+ 1.39
5.81+ 0.72
% Neutrophil 11.60+4.44
11.60+4.21
9.50+ 4.98
15.80+8.41
12.60+2.38
10.37+3.14
20.66+3.25
17.33+2.56
14.16+4.19
% Lymphocyte
83.30+4.32
84.00+5.55
89.70+4.82
83.00+8.28
85.20+2.70
88.37+3.90
79.16+3.51
82.66+2.56
85.83+4.19
% Eosinophil 0.70+ 0.27
0.90+ 0.82
0.10+ 0.22
0.70+ 0.57
2.00+ 0.79
0.37+ 0.47 0 0 0
Mal
e
Dif
fere
ntia
l cou
nt
% Monocyte 4.40+ 0.82
3.5+ 1.90
0.70+ 0.83
O.50+ 0.61
0.20+0.27
0.87+ 0.85
0.16+ 0.28
0 0
Significant different from control group (p<0.05)
Table 2 Hematological examination results of female rat fed crocodile blood before treatment.
0 wk 12 wks 24 wks Control Bd FBd Control Bd FBd Control Bd FBd
Hematocrit (%) 48.66+0.57
45.25+2.06
45.62+1.97*
45.60+0.96
47.10+2.32
43.20+3.05
47.16+2.56
48.16+2.71
48.16+2.02
Hemoglobin (g/dl)
17.38+0.54
16.36+0.47
16.09+1.08
15.37+0.81
16.37+3.51
14.33+0.77
16.23+0.58
16.22+0.90
16.31+0.21
Hem
atol
ogic
al
Val
ues
WBC (x103/? l) 7.36+ 1.74
5.35+ 2.52
8.41+ 3.61
5.28+ 1.73
4.72+ 1.31
3.42+ 5.02
5.74+ 1.62
6.18+ 1.74
6.34+ 0.60
% Neutrophil 4.70+ 1.98
7.60+ 3.94
8.90+ 1.91
9.60+ 2.70
10.90+6.50
10.50+3.06
16.50+1.50
14.16+1.75
14.50+3.27
% Lymphocyte
92.40+2.48
90.10+35.20
89.90+2.51
88.10+2.13
87.40+7.30
87.70+3.13
83.33+1.52
85.50+2.29
83.83+2.02
% Eosinophil 0.20+ 0.27
0.70+0.75
0.20+0.44
1.50+ 1.45
0.60+ 0.54
1.00+ 0.61 0
0.33+ 0.57
0.83+ 1.44
Fem
ale
Dif
fere
ntia
l cou
nt
% Monocyte 3.10+ 2.51
1.6+ 1.63
1.00+ 1.00
0.80+1.03
1.10+ 0.96
0.80+ 0.67
0.16+ 0.28 0
0.83+ 1.44
*Significant different from control group (p<0.05)
Biochemical parameters of treated rats, ALP, AST, ALT, BUN, glucose and albumin, were not significantly different from the control (Table 3 and Table 4). However, the blood ALT and ALP of the females, receiving fresh blood crocodile 300 ? l/day, had a tendency to be lower than those in the control group. These results indicated that crocodile blood had no detrimental effect on the liver and kidney function in all treatments.

72
Table 3 Blood chemistry results of male rats fed crocodile blood for 0, 12 and 24 weeks
Before treatment Wk After Treatment (12 wks) After Treatment (24 wks) Biochemical valve Control Bd) Bw FBd FBw Control Bd Bw FBd FBw Control Bd Bw FBd FBw
Glucose (mg/dL) 173.00+18.60
168.60+19.16
176.40+20.58
175.20+16.58
171.80+23.05*
129.80+11.98
119.20+13.36
121.60+10.59
112.20+7.72
109.40+5.54
135.66+8.08
129.66+14.36
ND 119.0+7.0
ND
Bun (mg/dL) 24.60+1
.51 27.40+3
.28 24.00+3
.53 26.00+4
.47 26.20+1
.92 29.95+0
.13 29.60+2
.60 28.60+2
.07 30.40+1
.81 31.20+1
.64 26.0+2.
64 25.33+1
.15 ND 24.33+1
.15 ND
Alb (g/dL) 4.90+0.
24 4.84+0.
19 4.90+0.
18 5.04+0.
16 5.06+0.
23 4.84+0.
16 4.78+0.
19 4.74+0.
05 4.36+0.
15 4.3+0.1
7 ND 4.53+0.
15 ND
ALP (U/L) 145.20+15.67
125.80+5.54
139.60+18.92
140.20+17.22
130.20+12.37
83.80+11.32
90.40+10.50
107.60+21.24
72.0+5.0
64.0+0.57
ND 67.66+12.5
ND
AST (U/L) 161.20+12.31
91.40+5.17*
92.80+10.52*
95.60+19.03*
122.00+10.07*
114.80+5.76
117.20+10.84
117.20+10.84
132.33+25.5
139.33+16.04
ND 151.66+11.59
ND
ALT (U/L) 40.40+5
.72 29.40+5
.02 34.80+5
.76 36.80+5
.02 29.20+4
.08 44.20+2
.49 39.20+4
.60 48.00+1
2.58 45.66+6
.5 38.66+4
.93 ND 39.0+1.73 ND
Significant different from control group (p<0.05)
Table 4 Blood chemistry results of female rats fed crocodile blood for 0, 12 and 24 weeks
Before treatment Wk After Treatment (12 wks) After Treatment (24 wks) Biochemical valve Control Bd) Bw FBd FBw Control Bd Bw FBd FBw Control Bd Bw FBd FBw
Glucose (mg/dL) 100.80+
6.61 141.20+21.98
155.60+29.30
152.60+5.02
170.80+23.31
100.60+20.88
127.60+12.54
130.80+7.69
109.20+9.44
122.00+18.46
145.3+4.04
129.66+18.7
ND 142.5+2.12
ND
Bun (mg/dL) 24.40+3.
64 24.60+2.
40 21.40+2.
96 36.80+6.
90 32.00+5.
70* 25.20+1.
78 26.20+2.
16 31.60+1.
34* 29.00+5.
33 28.20+3.
19 23.66+4
.04 22.0+3.
0 ND 22.5+0.70 ND
Alb (g/dL) 4.96+0.
25 ND
ND
ALP (U/L) 92.20+1
2.55 .
44.33+1
5.5 ND
ND
AST (U/L) 181.60+23.56
101.33+1.03
ND
ND
ALT (U/L) 43.80+5.
06 43.66+6
.42 ND ND
Significant different from control group (p<0.05)
Treated rats exhibited no alteration of liver and kidney after 12-week of daily feeding either by fresh or by freeze dry crocodile blood. Similar results were observed in rats that were fed weekly either by fresh or by freeze dry crocodile blood. These results indicated that crocodile blood had no detrimental effect on histological change in intestine kidney and liver in all treatments. However, chronic effects of crocodile blood should be considered from biochemical change after 24 weeks consumption which have no effect on liver function.

73
Figure 2 Relative of kidney weight of Wistar rat after fed crocodile blood 18 weeks
0
0.001
0.002
0.003
0.004
0.005
C Bd Bw FBd FBw
Female Male
Rat
io o
f kid
ney
wei
ght /
Bod
y w
eigh
t

74
Figure 3 Histopathological examination of liver kidney and intestinal of Wistar rat after 7 weeks of crocodile blood consumtion (A) Liver cell of control group (B) normal sign of liver cell from fresh crocodile blood consumption.
(C) Kidney cell of control group (D) normal signs of kidney cells from fresh crocodile blood consumption.
(E) Intestinal cell of control group (F) normal signs of intestinal cells from fresh crocodile blood consumption.
4. Acknowledgments The authors acknowledge the support from the Public-private Technology Development and Transfer Center, Kasetsart University, Thailand, Sriracha Crocodile Farm , Sriracha MODA Farm, Sriracha, Chonburi , Thailand ..
A B
D C
F E

75
5. Literature Cited Chaeychomsri W., J. Siruntawineti, B. Vajarasathira, K. Komoljindakul, T. Ong-aat
and Y.Temsiripong. 2004. Intestinal Parasites of Freshwater Crocodiles, Crocodylus siamensis, in Thailand. In: Proceeding of the 17th Working Meeting of the Crocodile Specialist Group. 24-29 May 2004. Darwin, Australia.
Chaeychomsri, W., J. Siruntawineti, B. Vajarasathira, M. Tuntirungkij, S. Chaeychomsri, Y. Temsiripong, and R. Sappapan. 2003. Bactericidal Efficiency of the Thai Freshwater Crocodile Serum. J. Med. Tech. & Phys. Therapy, 15 supp 1: S120.
Flecknell, P.A. 1995. Non-surgical Experimental Procedures. In: Laboratory Animals-An Introduction for Experimenters, 2nd ed., A.A. Tuffery (ed). John Wiley & Sons Ltd.: England. pp 255-294.
Matsuda, H., A. Tanaka, and A. Itakura. 2000. Immunology and hematology. In: The Laboratory Rat, G.J. Krinke (ed). Academic Press: California. pp. 437-446.
Merchant, M., Roche, C., Elsey, R. M. and Prudhomme, J. (2003). Antibacterial properties of serum from the American alligator (Alligator mississippiensis). Comp. Biochem. Physiol., B. 136: 505-513.
Pichiensuntara, C., and V. Geeravocks. 2003. Handbook of Thai Traditional Pharmacy, Vol.3: Animal Material-Pharmacological Constituents. Amarin Publishing: Bangkok. pp 150-167.
Siruntawineti J., W. Chaeychomsri, B. Vajarasathira, A. Ritwichai, T. Ong-aat and Y. Temsiripong. 2004. Blood Parasites of Crocodylus siamensis in Thailand. In: Proceeding of the 17th Working Meeting of the Crocodile Specialist Group. 24-29 May 2004. Darwin, Australia.
Siruntawineti J., W. Chaeychomsri, B. Vajarasathira, T. Ong-aat, and Y. Temsiripong. 2004. Efficacy of Siamese Crocodile (Crocodylus siamensis) Serum on Bacterial Growth Inhibition. In: Proceeding of the 17th Working Meeting of the Crocodile Specialist Group. 24-29 May 2004. Darwin, Australia.
Siruntawineti, J., W. Chaeychomsri, B. Vajarasathira, M. Tuntirungkij, and Y.Temsiripong. 2003. Complement Activity of Thai Freshwater Crocodile (Crocodylus siamensis) serum. In: Proceeding of the 29th Congress on Science and Technology of Thailand. 20-22 October, 2003.
-----
76
Development And Evaluation Of Dried Siamese Crocodile Blood Product As Supplemented Food.
Jindawan Siruntawineti1, Win Chaeychomsri1, Choosak Sathsumpun1,
Piyarat Tungsathian1, Boongeua Vajarasathira1 and Yosapong Temsiripong 2,3.
1Department of Zoology, Faculty of Science, Kasetsart University, Bangkok 10900, Thailand, ([email protected]);
2Sriracha Moda Co., Ltd., Chonburi 20110, Thailand; 3Crocodile Management Association of Thailand (CMAT)
Abstract: Two methods for collecting and drying Siamese crocodile blood were compared. Crocodile blood was either collected by a conventional method or by using apparatus designed by our group. The blood was then processed by either heat drying or by freeze drying. Both heat dried blood (HD-product) and freeze dried blood (FzD-product) products were packed in capsule and kept at three storage conditions for three months. After storage for 0, 1, 2 and 3 months, microbial contamination in dried blood products was determined by the total bacterial plate count. There were no coliform bacteria Escherichia coli, and Samonella spp. in the products indicating no contamination of gastrointestinal tract and typhoid pathogens. Despite storage conditions and storing times, fewer bacteria were found in FzD- products than in HD-products. The relative suitability for storing FzD-products, in descending order, were at 4? C, at room temperature (26.7? C) with dried condition, and at room temperature with 39.5% r.h. The optimal storage condition for HD-products was at room temperature with dried condition. 1. Introduction Siamese crocodile, Crocodylus siamensis, is the economically important animal of Thailand. It is primarily captive for the leather industry. Other crocodile products including meat, bone, internal organs and blood are also exported. In Thailand, approximately twenty to sixty crocodiles are slaughtered daily in the middle to large scale farms such as Sriracha crocodile farms, Chonburi province (Temsiripong Y., 2005. personal communication). During the crocodile slaughter, crocodile blood is discarded as waste. Recently, it has been collected and processed as heat dried blood for exporting to the Chinese Hong Kong and Taiwan markets.
Crocodile blood have been consumed as supplemented food and used in traditional medicine by Thai and other Asian people (Pichiensuntara and Geeravocks, 2003).
The crocodile blood was traditionally used to treat a variety of locally diagnosed ailments. This belief may derive from the crocodile behavior and its powerful immune system. For instance, the crocodile blood hemoglobin has more effective structure than that of humans (Komiyama et al., 1995). Therefore crocodiles are able to remain under water for more than one hour without surfacing to breathe.
77
In addition, the components of crocodile blood, involving in immune system, prevent life-threatening infections after savage territorial fights that often leave it with gaping wounds. Although crocodiles live in environment contaminated with microbes, they heal up very rapidly and almost without infection.
Siruntawineti et al. (2003; 2004a; 2005) reported the efficacy of Siamese crocodile (C. siamensis) serum on bacterial growth inhibition. Merchant et al. (2003, 2004, 2005a, 2005b), moreover, found that serum of the American alligator (Alligator mississippiensis) demonstrated antibacterial, amoebacidal, and antiviral activities. Recently, these activities follow distinct taxonomical crocodilian lineages were showed (Merchant et al., 2006).
To add up the value of crocodile blood, the crude crocodile blood was processed as dried crocodile blood products. In previous studies, we found that there are no blood and intestinal parasites in captive freshwater crocodile, C. siamensis, in Thailand (Chaeychomsri et al., 2004a; Siruntawineti et al., 2004b). Furthermore, food safety tests in animal laboratory scale were performed. It was shown that when the rats consumed either fresh- or dried- forms of crocodile blood as supplemented food, there are no adverse effects of crocodile blood consumption on biochemical and haematological values (Chaeychomsri et al., 2004b; Siruntawineti et al., 2004c). Besides, the histopathological observation revealed no toxicological changes (Chaeychomsri et al., 2005). These data suggest safety of crocodile blood as food supplement in animal. The objectives of this study were to develop freeze-dried crocodile blood processing and to evaluate microbiological quality of dried crocodile blood products for ensuring the human food safety as edible animal products. 2. Material and methods
2.1. Crocodile blood samples
Crocodile blood was collected at Sriracha Moda Co., Ltd. Chonburi, Thailand. The blood was sampled from Siamese crocodiles (C. siamensis), aged 2- to 3-year-old and weighed 25-30 kg.
2.2. Microbiological analyses of fresh crocodile blood
Crocodile blood was collected with sterile technique from the post-occipital venous sinus of Siamese crocodiles. Total plate count or standard plate count, coliforms, E. coli and Salmonella spp. were evaluated from one milliliter of crocodile blood sample.

78
2.3. Heat-dried crocodile blood
Crocodile blood was collected into a sterile container, placed on a tray and heat-dried at temperatures in the range from 60 to 80oC for periods of up to 72 hr. Drying was terminated when no further mass changes were observed. Subsequently, the heat-dried blood was powdered and 250 mg of it was put in each capsule. This product was assigned as “HD-product”. All processes were conducted at Sriracha Moda Co., Ltd., Chonburi, Thailand.
2.4. Freeze-dried crocodile blood
The large volume of blood was withdrawn from the post-occipital venous sinus of Siamese crocodile with sterile technique using blood collecting apparatus developed by our research group. The blood was collected in close container. The blood was freezed and dried by freeze dryer (Flexi-Dry, FTS System, USA), operating 3 liters per 24 hr at maximum low condenser temperature of -55oC. Dried blood sample was blend and then packed in capsules (FzD-product), 250 mg per capsule, with semi-automatic capsule packaging equipment. Every step was done under sterile condition.
2.5. Dried blood products storage & microbiological tests
Both types of dried blood, HD- and FzD-product, were kept in zip-bags. These products were stored separately in three conditions: (1) at room temperature 26.7oC with general humidity 39.5%r.h., (2) at room temperature 26.7oC with dried condition (using desiccators) and (3) at 4oC refrigerator. The blood capsules were weekly determined for their appearances. After storage for 0, 1, 2 and 3 months, one gram of dried blood was examined for total plate count, coliforms, E. coli and Salmonella spp.
2.6. Statistical analysis All statistics presented in this study were mean ? SD. The data were analyzed by one-way ANOVA. Duncan’s multiple-range test was applied to distinguish significant differences between groups at p< 0.05. 3. Results and discussion
Bacteria were not observed in fresh crocodile blood. This result indicates that crocodile, with closed circulation system, does not have bacterial infection. In addition, there is no bacterial contamination in crocodile blood before being processed as dried crocodile blood product. The conventional blood collection has limitation in volume of blood that depended on size of collected syringe. It is not practical and expensive when used in large volume blood collection from crocodile in industrial scale.
The collection of crocodile blood in large volume has been conducted before slaughter. After being killed, blood is released from crocodile head to the collected container. Then, the large volume of collected blood were kept or processed. By this procedure, blood is easy to be contaminated with bacteria and unexpected agents.

79
Blood should be collected in hygienic way for food with or without anticoagulants. In this study, the designed apparatus was used with sterile method in closed container for large volume of crocodile blood collection. This blood collection developed process ensures the quality of collected blood before drying process.
In the past, the crocodile blood was placed on a tray and dried under sunlight (solar drying). Blood-drying process was subsequently improved by convection drying using hot-air incubator usually at temperature over 60oC. However, high temperature adversely affects protein structures. Moreover, heat-dried blood is subject to bacterial contamination because it was operated in the open system. By contrast, most protein structures in crocodile blood that has been dried by freeze-drying or lyophilization should be preserved because the permitting dehydration of bioactive peptides from blood proteins at low temperature (Gatlin and Nail, 1994).
After storage, both heat- and freeze-dried blood products were in good appearances at all storage conditions. No incidence of coliforms, E. coli and Salmonella spp. found in the both products during storages. These results indicate no contamination of enteric and typhoid pathogens that cause the food-borne diseases. The capsules of dried crocodile blood products, in our study, were stored in zip-sealed plastic bags. In order to facilitate consumer and to increase product value, the product packaging should be evolved.
The numbers of aerobic and facultative anaerobic bacteria present in dried blood samples are shown in Table 1. The number of microorganisms in crocodile blood was influenced by drying and storing procedures. One month after storage, significantly fewer bacteria were observed in FzD-products than in HD-products (p< 0.05) at all storage conditions. Similar trend was detected when crocodile blood products were kept for 2 and 3 months. These results suggest that FzD-products are safer to consumer than HD-products because less bacterial contamination was noticed. Storage times did not affect the number of microbes in FzD-products. On the contrary, the number of bacteria in HD-products was significantly altered by the storing times (p< 0.05). For example, the number of bacteria in HD-room temperature significantly decreased as storage times increased (p< 0.05). Conversely, the number of bacteria in HD-4oC temperature significantly increased with storage times (p< 0.05). Effects of longer storage time on quality of dried blood products should be monitored.
Bacteria l contamination may occur during the capsule packaging by semi-automatic equipment. These bacteria were endospore-forming bacteria, bacilli, which their spores are resistant to drying and heating (Jay et al., 2005) processes. Employing sterilized packaging technique could solve such problem.
In conclusion, freeze-drying method was more applicable than heat-drying procedure for commercially preparing dried crocodile blood products. In three-month period, the optimal condition for storage of FzD-product was at 4oC and for HD- product was at room temperature with dried condition.

80
Table 1 Microbial population in freeze-dried (FzD) and heat-dried (HD) Siamese crocodile blood products after storage at three conditions and different periods
Microbial Population (cfu/ gm) Storage Period
Drying Process- Temperature and
condition 0- month 1- month 2- month 3- month
FzD- RT 10.0 + 5.4 0 Aa 12.0 + 7.3 Aa 0 Aa
HD- RT 363.0 + 16.0 240.0 + 44.0 Ba 61.0 + 29.0 Aa 70.0 + 30.0 Aa
FzD- RT, dry ND 2.5 + 2.5 Aa 3.3 + 3.3 Aa 2.0 + 2.0 Aa
HD- RT, dry ND 97.0 + 2.6 Aa 145.0 + 6.4 Aab 4.06 +23.0 Aa
FzD- 4C ND 0 Aa 0 Aa 2.5 + 2.5 Aa
HD- 4C ND 1646.0 + 177.0 Ab
1425.0 + 140.0 ABc
2278.0 + 359.0 Bb
ND = not determined; RT = room temperature; RT, dry = room temperature at dry condition; 4C = 4°C temperature Data follow by different capital letter superscripts in horizontal row are significantly different (p< 0.05) Data follow by different letter superscripts in vertical column are significantly different (p< 0.05)
4. Acknowledgments This research was financially supported by the Thailand Research Fund, the industrial program (IPUS, Research project No. I4803024). We also thank T. Ong-aat for their technical assistance.
5. Literature cited Pichiensuntara, C. and Geeravocks, V. (2003). Animal material-pharmacological
constituents. Pp. 150-167 in Handbook of Thai traditional pharmacy, Vol. 3. Amarin Publishing: Bangkok.
Chaeychomsri,W., Siruntawineti, J., Vajarasathira, B., Komoljindakul, K., Ong-aat, T., Temsiripong, Y. (2004a). Intestinal parasites of freshwater crocodile, Crocodylus siamensis, in Thailand. Pp. 461-464 in Proceeding of the 17th Working Meeting of the IUCN-SSC Crocodile Specialist Group. Darwin, Australia, 24–29 May 2004. IUCN: Gland.
Chaeychomsri, W., Siruntawineti, J., Pokharatsiri, A., Vajarasathira, B., Chitchuankij, N. and Temsiripong, Y. (2004b). Effects of crocodile blood consumption on biochemical changes in Wistar rats. Pp 1-4, F0018 in Proceeding of the 30th Congress on Science and Technology of Thailand. Bangkok Thailand, 19-21 October 2004.
Chaeychomsri, Siruntawineti, J., Chitchuankij, N., Tuntirungkij, M., Vajarasathira, B. and Temsiripong, Y. (2005). Efficiency of Siamese crocodile blood to strengthen immunity. Final 1st Year Project Report of to Kasetsart University Research and Development Institute (KURDI), Kasetsart University.