Embed Size (px)
Citation preview
Épidémiologie et tendances de la mortalité par mésothéliome aux États-Unis,1999‒2016
Epidemiology and Trends in Mesothelioma Mortality in the United States, 1999‒2016
Jacek Mazurek, MD, PhD
Journées Annuelles de Santé PubliqueDecember 4-5, 2018
Nouvelles perspectives en surveillance et contrôle des maladies pulmonaires professionnelles
National Institute for Occupational Safety and Health
Respiratory Health Division
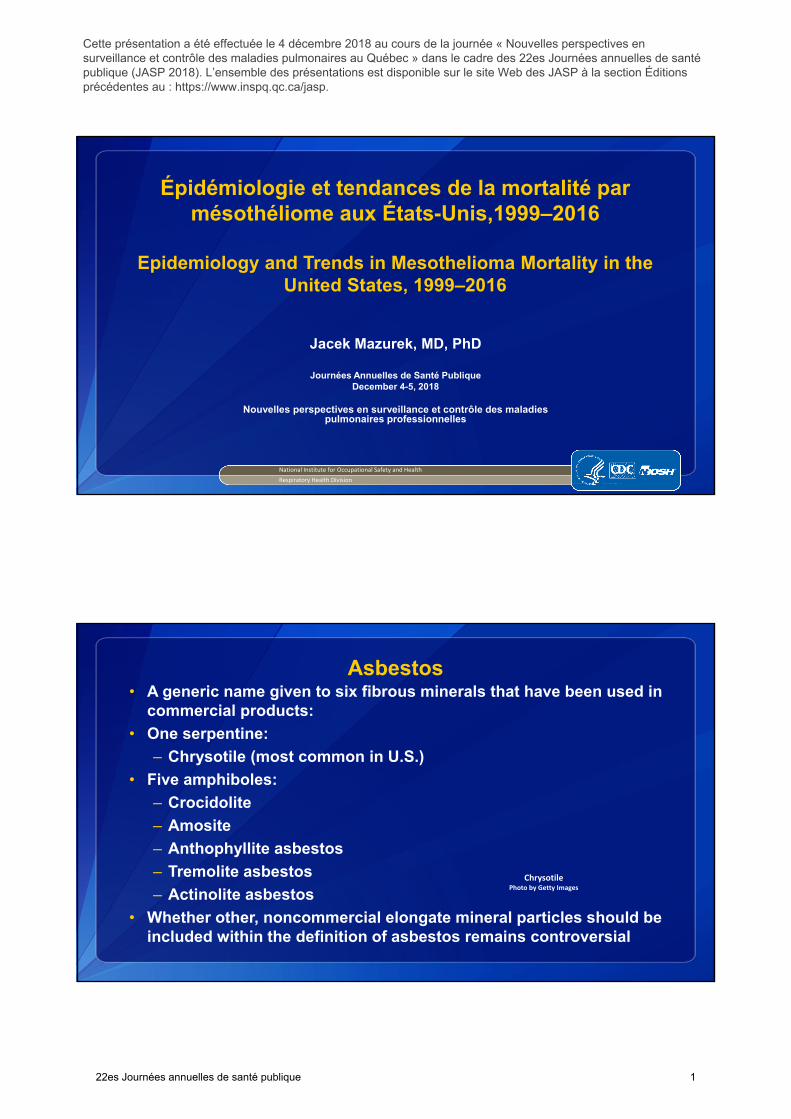
Asbestos• A generic name given to six fibrous minerals that have been used in
commercial products:
• One serpentine:
– Chrysotile (most common in U.S.)
• Five amphiboles:
– Crocidolite
– Amosite
– Anthophyllite asbestos
– Tremolite asbestos
– Actinolite asbestos
• Whether other, noncommercial elongate mineral particles should beincluded within the definition of asbestos remains controversial
ChrysotilePhoto by Getty Images
22es Journées annuelles de santé publique 1
Cette présentation a été effectuée le 4 décembre 2018 au cours de la journée « Nouvelles perspectives en surveillance et contrôle des maladies pulmonaires au Québec » dans le cadre des 22es Journées annuelles de santé publique (JASP 2018). L’ensemble des présentations est disponible sur le site Web des JASP à la section Éditions précédentes au : https://www.inspq.qc.ca/jasp.
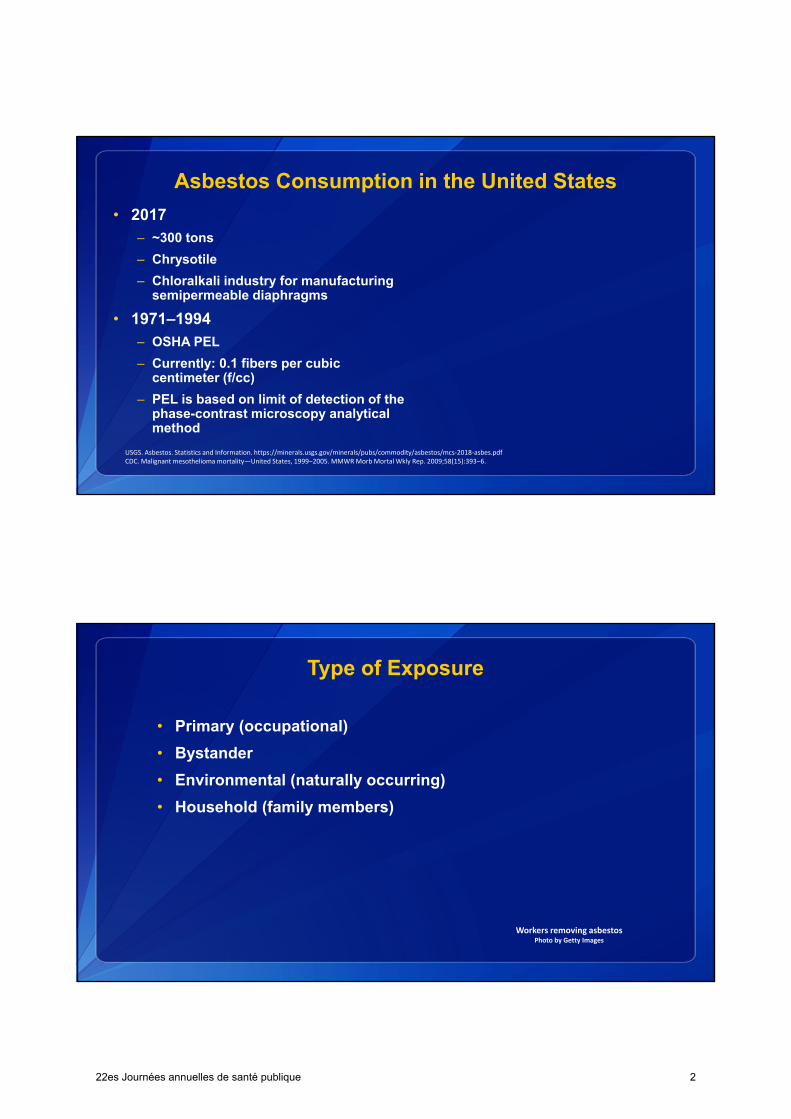
Asbestos Consumption in the United States
• 2017– ~300 tons
– Chrysotile
– Chloralkali industry for manufacturing semipermeable diaphragms
• 1971‒1994– OSHA PEL
– Currently: 0.1 fibers per cubic centimeter (f/cc)
– PEL is based on limit of detection of the phase-contrast microscopy analytical method
USGS. Asbestos. Statistics and Information. https://minerals.usgs.gov/minerals/pubs/commodity/asbestos/mcs‐2018‐asbes.pdfCDC. Malignant mesothelioma mortality—United States, 1999‒2005. MMWR MorbMortal Wkly Rep. 2009;58(15):393‒6.
Type of Exposure
• Primary (occupational)
• Bystander
• Environmental (naturally occurring)
• Household (family members)
Workers removing asbestos Photo by Getty Images
22es Journées annuelles de santé publique 2
Asbestos Exposure• Asbestos mining and milling
• Construction work, including bricklaying, plastering, painting, welding, electrical work, demolition and cleanup
• Installing insulation
• Textile workers in Italy
• Ship building, repair, or demolition
• Plumbing, pipefitting, or heating repair
• Chemical and petroleum workers
• Vehicle body workers (asbestos-containing autobody filler, brake or clutch repair)
• Non-asbestos miners
Health Effects• Benign pleural reactions:
– Effusions
– Plaques
– Diffuse pleural fibrosis
– Rounded atelectasis
• Asbestosis
• Mesothelioma
• Bronchogenic lung cancer
• Laryngeal cancer
• Ovarian cancer
X‐ray of lung with mesothelioma Photo by Getty Images
22es Journées annuelles de santé publique 3
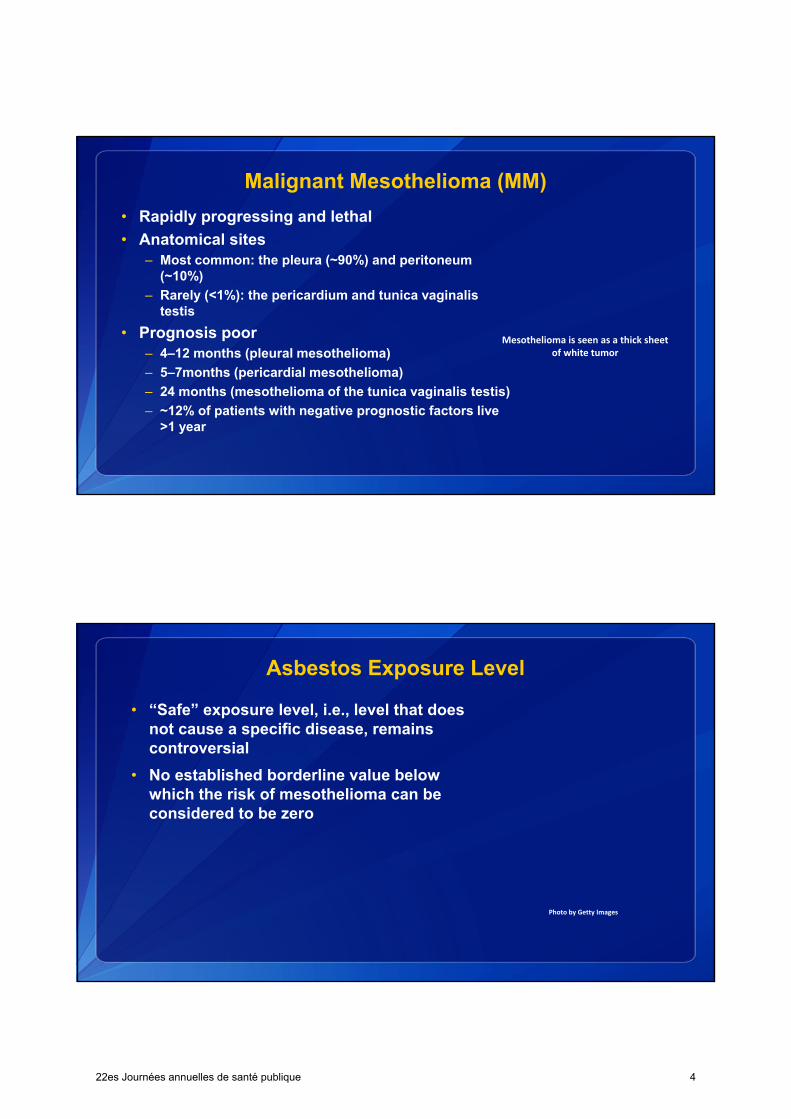
Malignant Mesothelioma (MM)
• Rapidly progressing and lethal
• Anatomical sites– Most common: the pleura (~90%) and peritoneum
(~10%)
– Rarely (<1%): the pericardium and tunica vaginalistestis
• Prognosis poor– 4–12 months (pleural mesothelioma)
– 5–7months (pericardial mesothelioma)
– 24 months (mesothelioma of the tunica vaginalis testis)
– ~12% of patients with negative prognostic factors live >1 year
Mesothelioma is seen as a thick sheet of white tumor
Asbestos Exposure Level
• “Safe” exposure level, i.e., level that does not cause a specific disease, remains controversial
• No established borderline value below which the risk of mesothelioma can be considered to be zero
Photo by Getty Images
22es Journées annuelles de santé publique 4
Mesothelioma: Latency and Population Attributable Fraction (PAR)
• The latency period:
– 20–50 years
• PAR:
– 85% for men
– 23% for women (90% considering household exposure)
Source: Antao VC et al. Asbestosis mortality in the USA: facts and predictions. Occup Environ Med. 2009;66:335‐8.
Figure. US asbestos consumption per capita, actual and projected deaths from asbestosis.
Steenland K, et al. Dying for work: The magnitude of US mortality from selected causes of death associated with occupation. Am J Ind Med. 2003;43:461‐82.
Objective
To provide information on malignant mesothelioma
mortality in the United States for 1999–2016
22es Journées annuelles de santé publique 5
Data Source
US National Vital Statistics System’s multiple cause-of-death
data for 1999–2016 from NCHS
• Available from CDC’s Wide-ranging Online Data for
Epidemiologic Research system at https://wonder.cdc.gov/
Study Population and Definitions
– International Classification of Diseases, 10th Revision codes C45.0–C45.2, C45.7, and C45.9 assigned as either the underlying or contributing cause of death
– Persons aged ≥25 years
– Industry and occupation information available from 6,519 death certificates provided by Vital Statistics Offices from 26 states (CO, GA, HI, ID, IN, KS, KY, LA, MI, NE, NV, NH, NJ, NM, NC, ND, OH, RI, SC, TX, UT, VT, WA, WV, WI) for 1999, 2003, 2004, and 2007–2013
– Job titles match the 2000 U.S. Bureau of Census Occupations Classification System codes
22es Journées annuelles de santé publique 6
Measures
• Age-adjusted rate per 1 million (2000 U.S. standard population)
• Proportionate Mortality Ratio (PMR) = observed number of deaths from MM in a specified industry/occupation, divided by the expected number of deaths from MM
– The expected number of deaths was the total number of deaths in industry or occupation of interest multiplied by a proportion defined as the number of MM deaths in all industries and/or occupations, divided by the total number of deaths in all industries/occupations. The MM PMRs for each sex were internally adjusted by 5-year age groups and race.
– PMRs calculated using industry and occupation data provided by the 26 states
Results
22es Journées annuelles de santé publique 7
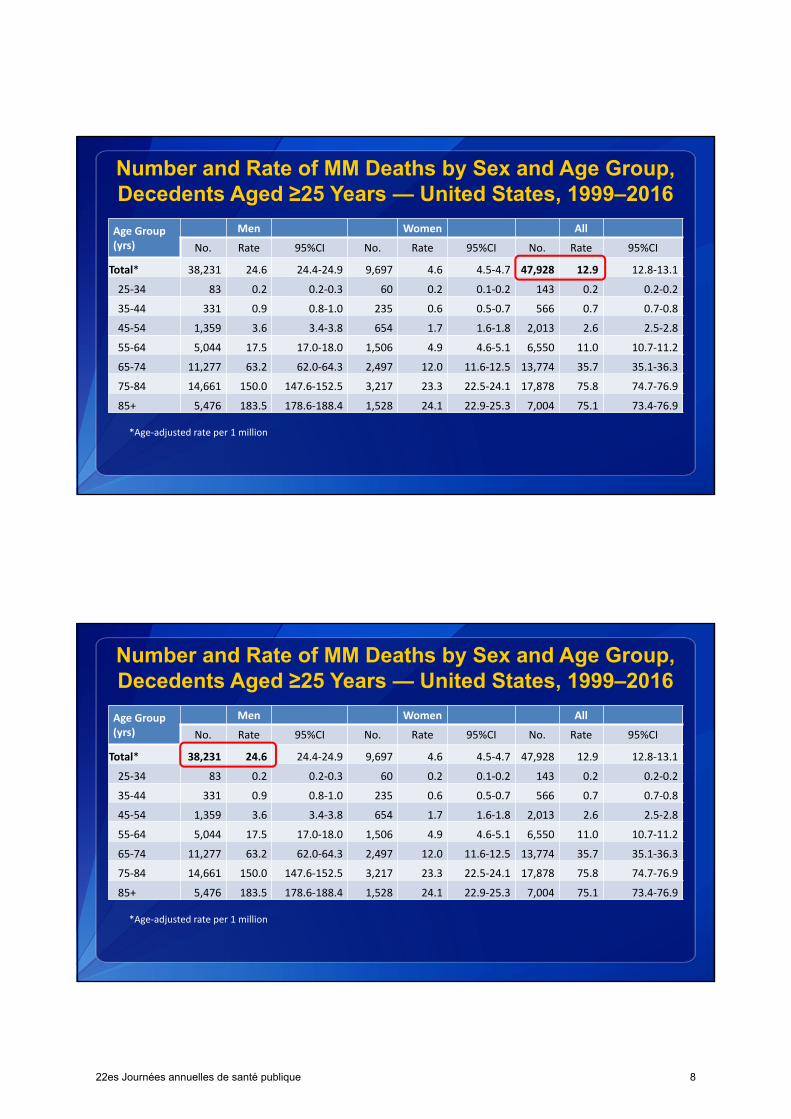
Number and Rate of MM Deaths by Sex and Age Group, Decedents Aged ≥25 Years — United States, 1999–2016
14.1
*Age‐adjusted rate per 1 million
Age Group (yrs)
Men Women All
No. Rate 95%CI No. Rate 95%CI No. Rate 95%CI
Total* 38,231 24.6 24.4‐24.9 9,697 4.6 4.5‐4.7 47,928 12.9 12.8‐13.1
25‐34 83 0.2 0.2‐0.3 60 0.2 0.1‐0.2 143 0.2 0.2‐0.2
35‐44 331 0.9 0.8‐1.0 235 0.6 0.5‐0.7 566 0.7 0.7‐0.8
45‐54 1,359 3.6 3.4‐3.8 654 1.7 1.6‐1.8 2,013 2.6 2.5‐2.8
55‐64 5,044 17.5 17.0‐18.0 1,506 4.9 4.6‐5.1 6,550 11.0 10.7‐11.2
65‐74 11,277 63.2 62.0‐64.3 2,497 12.0 11.6‐12.5 13,774 35.7 35.1‐36.3
75‐84 14,661 150.0 147.6‐152.5 3,217 23.3 22.5‐24.1 17,878 75.8 74.7‐76.9
85+ 5,476 183.5 178.6‐188.4 1,528 24.1 22.9‐25.3 7,004 75.1 73.4‐76.9
22es Journées annuelles de santé publique 8

Number and Rate of MM Deaths by Sex and Age Group, Decedents Aged ≥25 Years — United States, 1999–2016
14.1
*Age‐adjusted rate per 1 million
Age Group (yrs)
Men Women All
No. Rate 95%CI No. Rate 95%CI No. Rate 95%CI
Total* 38,231 24.6 24.4‐24.9 9,697 4.6 4.5‐4.7 47,928 12.9 12.8‐13.1
25‐34 83 0.2 0.2‐0.3 60 0.2 0.1‐0.2 143 0.2 0.2‐0.2
35‐44 331 0.9 0.8‐1.0 235 0.6 0.5‐0.7 566 0.7 0.7‐0.8
45‐54 1,359 3.6 3.4‐3.8 654 1.7 1.6‐1.8 2,013 2.6 2.5‐2.8
55‐64 5,044 17.5 17.0‐18.0 1,506 4.9 4.6‐5.1 6,550 11.0 10.7‐11.2
65‐74 11,277 63.2 62.0‐64.3 2,497 12.0 11.6‐12.5 13,774 35.7 35.1‐36.3
75‐84 14,661 150.0 147.6‐152.5 3,217 23.3 22.5‐24.1 17,878 75.8 74.7‐76.9
85+ 5,476 183.5 178.6‐188.4 1,528 24.1 22.9‐25.3 7,004 75.1 73.4‐76.9
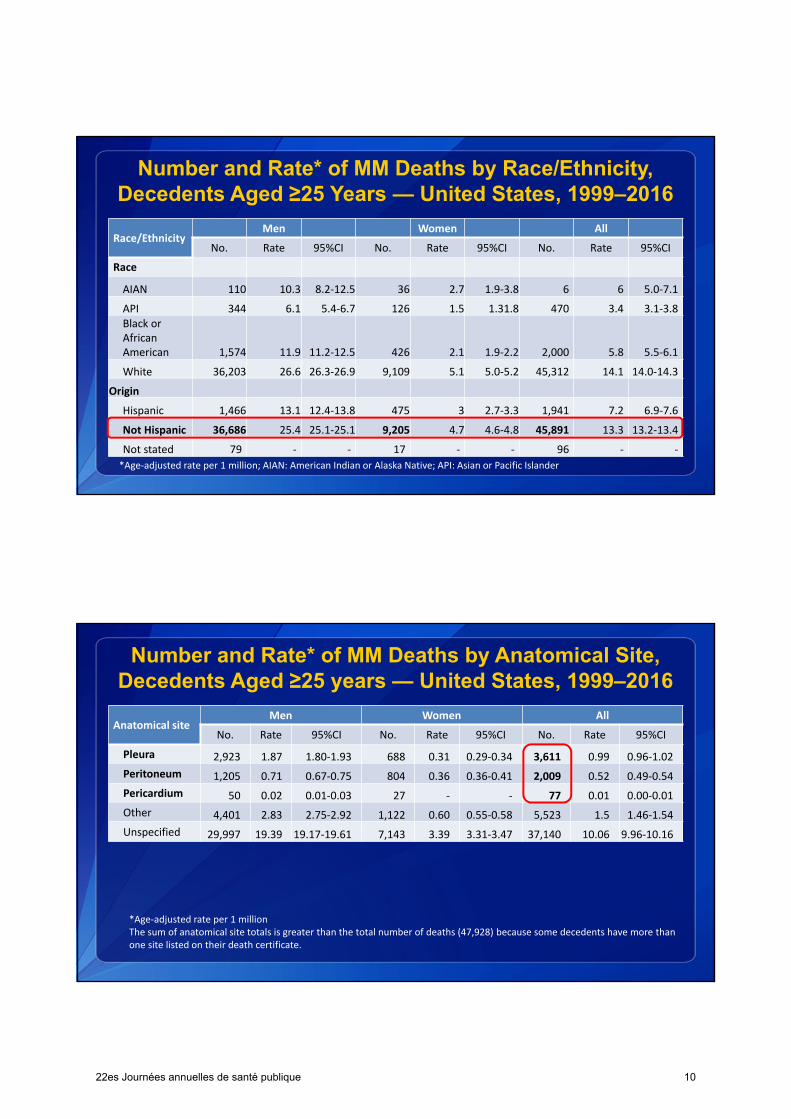
Number and Rate* of MM Deaths by Race/Ethnicity, Decedents Aged ≥25 Years — United States, 1999–2016
14.1
*Age‐adjusted rate per 1 million; AIAN: American Indian or Alaska Native; API: Asian or Pacific Islander
Race/EthnicityMen Women All
No. Rate 95%CI No. Rate 95%CI No. Rate 95%CI
Race
AIAN 110 10.3 8.2‐12.5 36 2.7 1.9‐3.8 6 6 5.0‐7.1
API 344 6.1 5.4‐6.7 126 1.5 1.31.8 470 3.4 3.1‐3.8Black or African American 1,574 11.9 11.2‐12.5 426 2.1 1.9‐2.2 2,000 5.8 5.5‐6.1
White 36,203 26.6 26.3‐26.9 9,109 5.1 5.0‐5.2 45,312 14.1 14.0‐14.3
Origin
Hispanic 1,466 13.1 12.4‐13.8 475 3 2.7‐3.3 1,941 7.2 6.9‐7.6
Not Hispanic 36,686 25.4 25.1‐25.1 9,205 4.7 4.6‐4.8 45,891 13.3 13.2‐13.4
Not stated 79 ‐ ‐ 17 ‐ ‐ 96 ‐ ‐
22es Journées annuelles de santé publique 9
Number and Rate* of MM Deaths by Race/Ethnicity, Decedents Aged ≥25 Years — United States, 1999–2016
14.1
*Age‐adjusted rate per 1 million; AIAN: American Indian or Alaska Native; API: Asian or Pacific Islander
Race/EthnicityMen Women All
No. Rate 95%CI No. Rate 95%CI No. Rate 95%CI
Race
AIAN 110 10.3 8.2‐12.5 36 2.7 1.9‐3.8 6 6 5.0‐7.1
API 344 6.1 5.4‐6.7 126 1.5 1.31.8 470 3.4 3.1‐3.8Black or African American 1,574 11.9 11.2‐12.5 426 2.1 1.9‐2.2 2,000 5.8 5.5‐6.1
White 36,203 26.6 26.3‐26.9 9,109 5.1 5.0‐5.2 45,312 14.1 14.0‐14.3
Origin
Hispanic 1,466 13.1 12.4‐13.8 475 3 2.7‐3.3 1,941 7.2 6.9‐7.6
Not Hispanic 36,686 25.4 25.1‐25.1 9,205 4.7 4.6‐4.8 45,891 13.3 13.2‐13.4
Not stated 79 ‐ ‐ 17 ‐ ‐ 96 ‐ ‐
Number and Rate* of MM Deaths by Anatomical Site, Decedents Aged ≥25 years — United States, 1999–2016
14.1
*Age‐adjusted rate per 1 millionThe sum of anatomical site totals is greater than the total number of deaths (47,928) because some decedents have more than one site listed on their death certificate.
Anatomical siteMen Women All
No. Rate 95%CI No. Rate 95%CI No. Rate 95%CI
Pleura 2,923 1.87 1.80‐1.93 688 0.31 0.29‐0.34 3,611 0.99 0.96‐1.02
Peritoneum 1,205 0.71 0.67‐0.75 804 0.36 0.36‐0.41 2,009 0.52 0.49‐0.54
Pericardium 50 0.02 0.01‐0.03 27 ‐ ‐ 77 0.01 0.00‐0.01
Other 4,401 2.83 2.75‐2.92 1,122 0.60 0.55‐0.58 5,523 1.5 1.46‐1.54
Unspecified 29,997 19.39 19.17‐19.61 7,143 3.39 3.31‐3.47 37,140 10.06 9.96‐10.16
22es Journées annuelles de santé publique 10
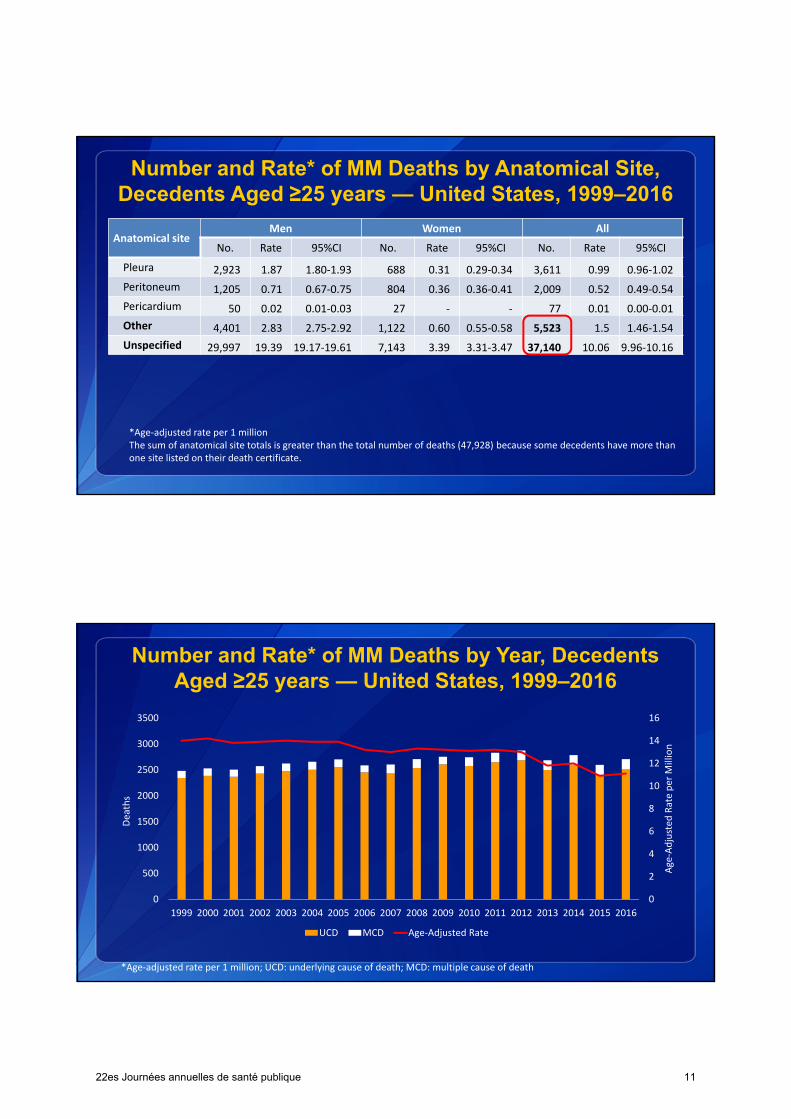
Number and Rate* of MM Deaths by Anatomical Site, Decedents Aged ≥25 years — United States, 1999–2016
14.1
*Age‐adjusted rate per 1 millionThe sum of anatomical site totals is greater than the total number of deaths (47,928) because some decedents have more than one site listed on their death certificate.
Anatomical siteMen Women All
No. Rate 95%CI No. Rate 95%CI No. Rate 95%CI
Pleura 2,923 1.87 1.80‐1.93 688 0.31 0.29‐0.34 3,611 0.99 0.96‐1.02
Peritoneum 1,205 0.71 0.67‐0.75 804 0.36 0.36‐0.41 2,009 0.52 0.49‐0.54
Pericardium 50 0.02 0.01‐0.03 27 ‐ ‐ 77 0.01 0.00‐0.01
Other 4,401 2.83 2.75‐2.92 1,122 0.60 0.55‐0.58 5,523 1.5 1.46‐1.54
Unspecified 29,997 19.39 19.17‐19.61 7,143 3.39 3.31‐3.47 37,140 10.06 9.96‐10.16
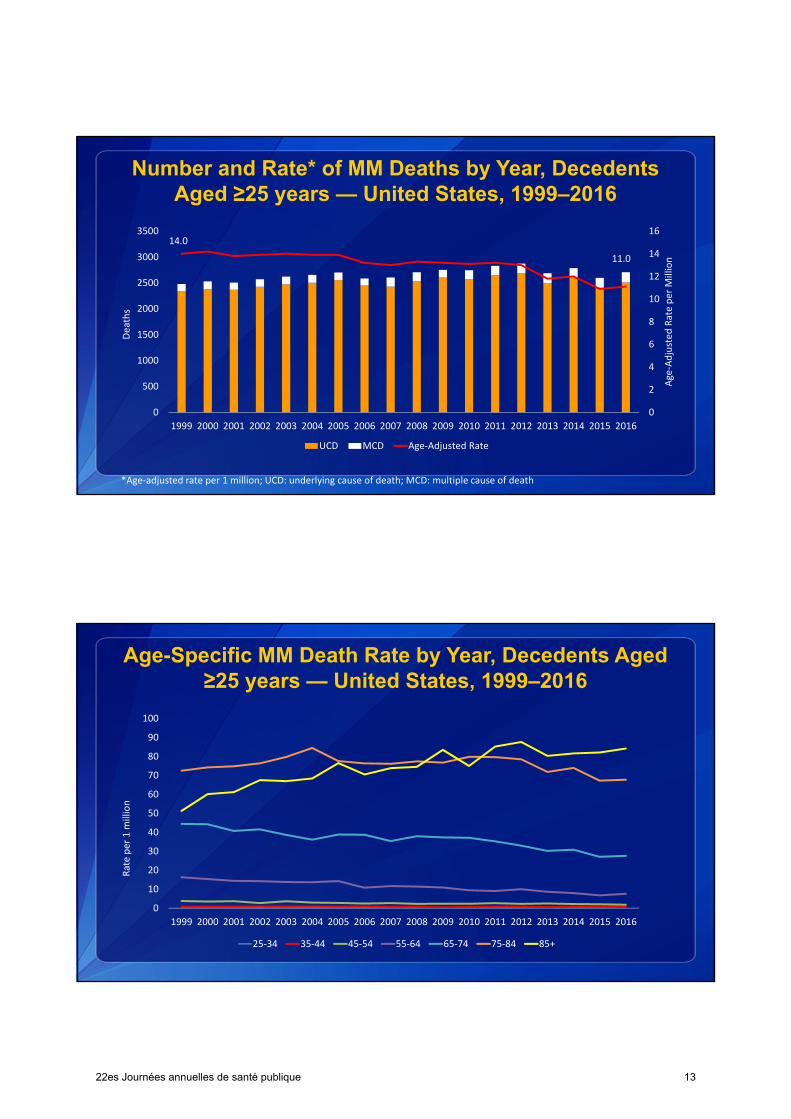
Number and Rate* of MM Deaths by Year, Decedents Aged ≥25 years — United States, 1999–2016
0
2
4
6
8
10
12
14
16
0
500
1000
1500
2000
2500
3000
3500
1999 2000 2001 2002 2003 2004 2005 2006 2007 2008 2009 2010 2011 2012 2013 2014 2015 2016
Age‐Adjusted
Rate per M
illion
Deaths
UCD MCD Age‐Adjusted Rate
*Age‐adjusted rate per 1 million; UCD: underlying cause of death; MCD: multiple cause of death
22es Journées annuelles de santé publique 11
Number and Rate* of MM Deaths by Year, Decedents Aged ≥25 years — United States, 1999–2016
0
2
4
6
8
10
12
14
16
0
500
1000
1500
2000
2500
3000
3500
1999 2000 2001 2002 2003 2004 2005 2006 2007 2008 2009 2010 2011 2012 2013 2014 2015 2016
Age‐Adjusted
Rate per M
illion
Deaths
UCD MCD Age‐Adjusted Rate
*Age‐adjusted rate per 1 million; UCD: underlying cause of death; MCD: multiple cause of death
N=2,479
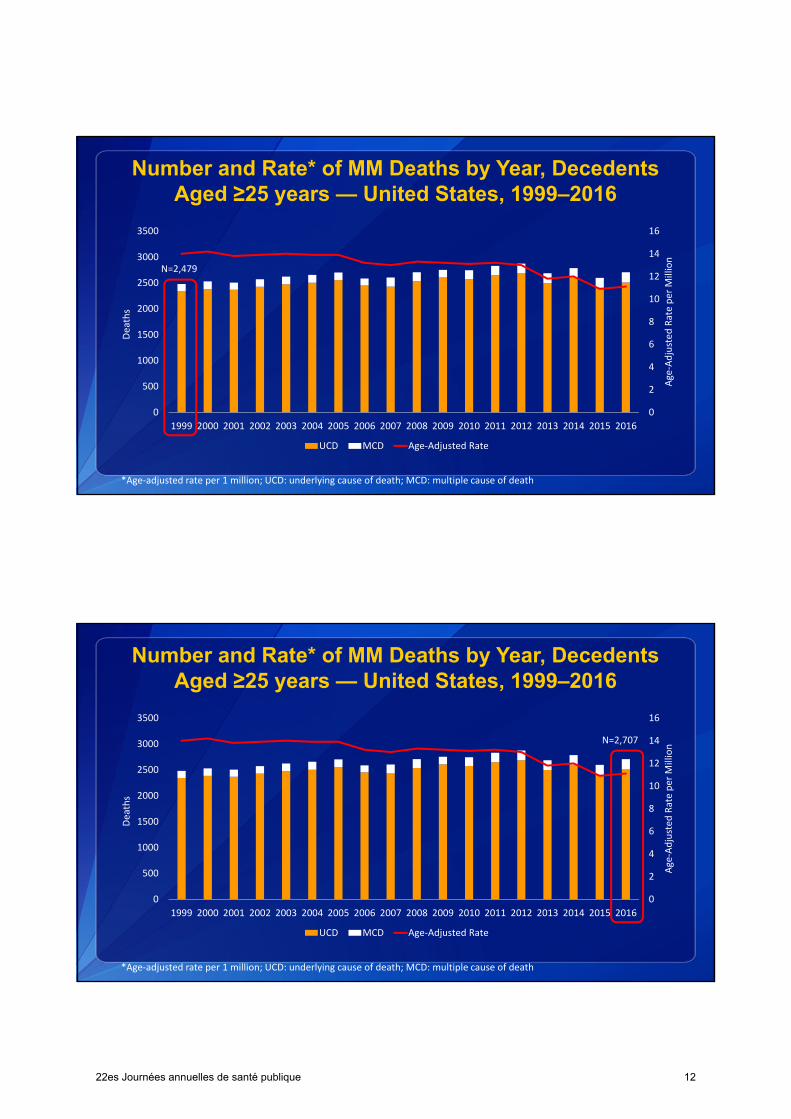
Number and Rate* of MM Deaths by Year, Decedents Aged ≥25 years — United States, 1999–2016
0
2
4
6
8
10
12
14
16
0
500
1000
1500
2000
2500
3000
3500
1999 2000 2001 2002 2003 2004 2005 2006 2007 2008 2009 2010 2011 2012 2013 2014 2015 2016
Age‐Adjusted
Rate per M
illion
Deaths
UCD MCD Age‐Adjusted Rate
*Age‐adjusted rate per 1 million; UCD: underlying cause of death; MCD: multiple cause of death
N=2,707
22es Journées annuelles de santé publique 12
Number and Rate* of MM Deaths by Year, Decedents Aged ≥25 years — United States, 1999–2016
0
2
4
6
8
10
12
14
16
0
500
1000
1500
2000
2500
3000
3500
1999 2000 2001 2002 2003 2004 2005 2006 2007 2008 2009 2010 2011 2012 2013 2014 2015 2016
Age‐Adjusted
Rate per M
illion
Deaths
UCD MCD Age‐Adjusted Rate
*Age‐adjusted rate per 1 million; UCD: underlying cause of death; MCD: multiple cause of death
14.0
11.0
Age-Specific MM Death Rate by Year, Decedents Aged ≥25 years — United States, 1999–2016
0
10
20
30
40
50
60
70
80
90
100
1999 2000 2001 2002 2003 2004 2005 2006 2007 2008 2009 2010 2011 2012 2013 2014 2015 2016
Rate per 1 m
illion
25‐34 35‐44 45‐54 55‐64 65‐74 75‐84 85+
22es Journées annuelles de santé publique 13
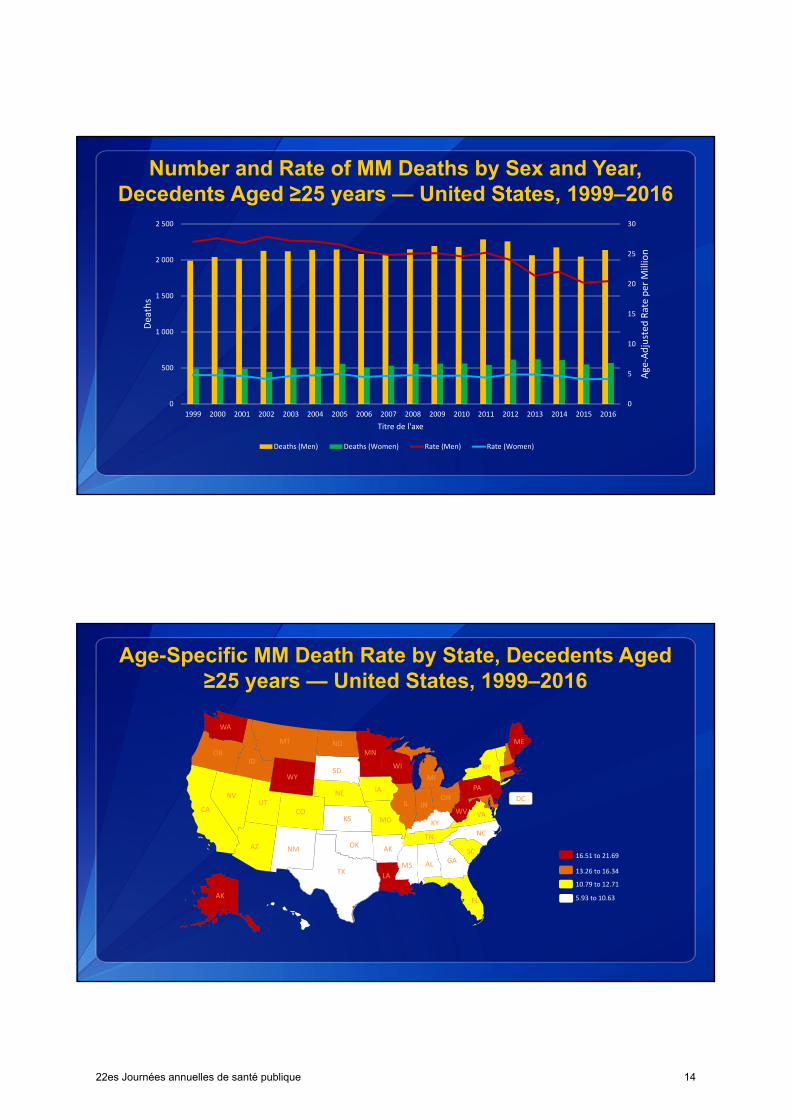
Number and Rate of MM Deaths by Sex and Year, Decedents Aged ≥25 years — United States, 1999–2016
0
5
10
15
20
25
30
0
500
1 000
1 500
2 000
2 500
1999 2000 2001 2002 2003 2004 2005 2006 2007 2008 2009 2010 2011 2012 2013 2014 2015 2016
Age‐Adjusted
Rate per M
illion
Deaths
Titre de l'axe
Deaths (Men) Deaths (Women) Rate (Men) Rate (Women)
Age-Specific MM Death Rate by State, Decedents Aged ≥25 years — United States, 1999–2016
AKFL
MI
ME
NY
PA
VAWV
OHINIL
WI
NCTN
AK
MO
GASC
KY
AL
LA
MS
IA
MN
OK
TX
NM
KS
NE
SD
ND
WY
MT
CO
ID
UT
AZ
NV
OR
WA
CA
5.93 to 10.63
10.79 to 12.71
13.26 to 16.34
16.51 to 21.69
DC
22es Journées annuelles de santé publique 14
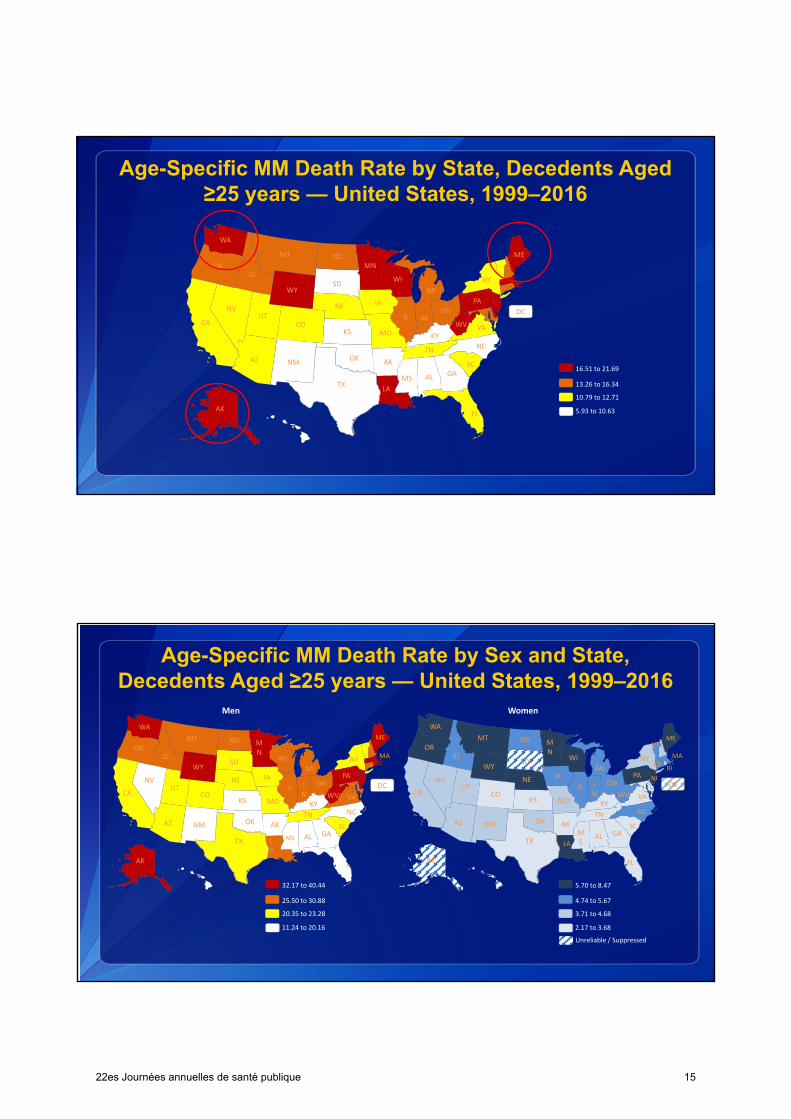
Age-Specific MM Death Rate by State, Decedents Aged ≥25 years — United States, 1999–2016
AKFL
MI
ME
NY
PA
VAWV
OHINIL
WI
NCTN
AK
MO
GASC
KY
AL
LA
MS
IA
MN
OK
TX
NM
KS
NE
SD
ND
WY
MT
CO
ID
UT
AZ
NV
OR
WA
CA
5.93 to 10.63
10.79 to 12.71
13.26 to 16.34
16.51 to 21.69
DC
Age-Specific MM Death Rate by Sex and State, Decedents Aged ≥25 years — United States, 1999–2016
AKFL
MINY
PA
VAWV
OHIN
IL
WI
NCTNAK
MO
GASC
KY
ALLA
MS
IA
MN
OK
TX
NM
KS
NE
SD
ND
WY
MT
CO
ID
UT
AZ
NV
OR
WA
CA
11.24 to 20.16
20.35 to 23.28
25.50 to 30.88
32.17 to 40.44
DC
AK
MI
ME
NY
PA
VAWV
OHIN
IL
WI
NCTNAK
MO
GASC
KY
ALMS
IA
MN
OK
TX
NM
KS
NE
SD
ND
WY
MT
CO
ID
UT
AZ
NV
OR
WA
CA
2.17 to 3.68
3.71 to 4.68
4.74 to 5.67
5.70 to 8.47
DC
Unreliable / Suppressed
Men Women
LA
FL
ME
MAMA
RICT
VT
NJ
22es Journées annuelles de santé publique 15
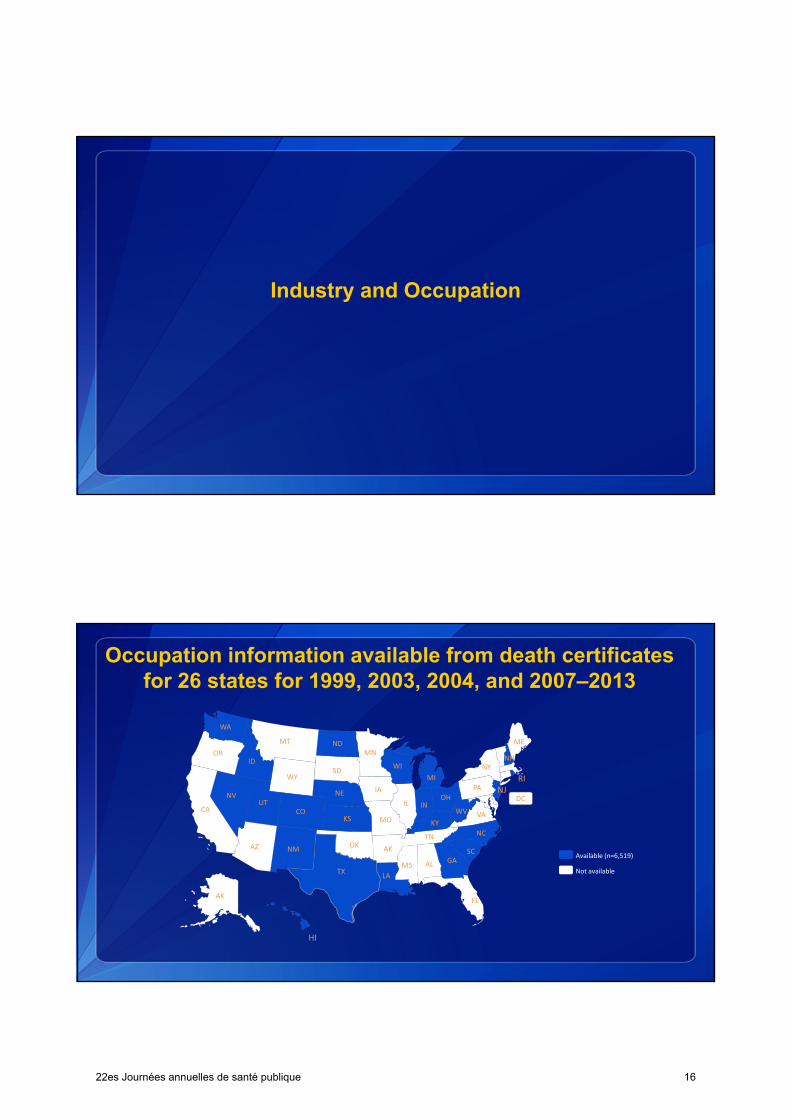
Industry and Occupation
Occupation information available from death certificates for 26 states for 1999, 2003, 2004, and 2007–2013
AKFL
MI
ME
NY
PA
VAWV
OHINIL
WI
NCTN
AK
MO
GASC
KY
AL
LA
MS
IA
MN
OK
TX
NM
KS
NE
SD
ND
WY
MT
CO
ID
UT
AZ
NV
OR
WA
CA
Not available
Available (n=6,519)
DC
RINJ
NH
HI
22es Journées annuelles de santé publique 16

Malignant Mesothelioma Deaths Among Men Aged ≥25 Years, by Usual Industry Group* — 26 states, 1999, 2003, 2004, and
2007–2013 (n=5,201)
931434
101104107111116161179179185188
296301329373
944
0 500 1000 1500 2000
UnknownAll other industries
Agriculture, forestry, fishing and huntingHealth care
Repair and MaintenanceWholesale tradeOther retail trade
Professional, scientific, technical and management servicesPrimary metal industries
UtilitiesEducational services
ChemicalMiscellaneous manufacturing
Public administration
Transportation and warehousingTransportation equipment
Construction
*2‐digit BoC codes; With at least 100 deaths
Malignant Mesothelioma Deaths Among Women Aged ≥25 Years, by Usual Industry Group* — 26 states, 1999, 2003,
2004, and 2007–2013 (n=1,318)
10
466
50
53
65
131
132
411
0 100 200 300 400 500
Unknown
All other industries
Public administration
Finance and Insurance
Other retail trade
Educational services
Health care
Retired, unemployed, or non‐paid worker
*2‐digit BoC codes ; With at least 50 deaths
22es Journées annuelles de santé publique 17
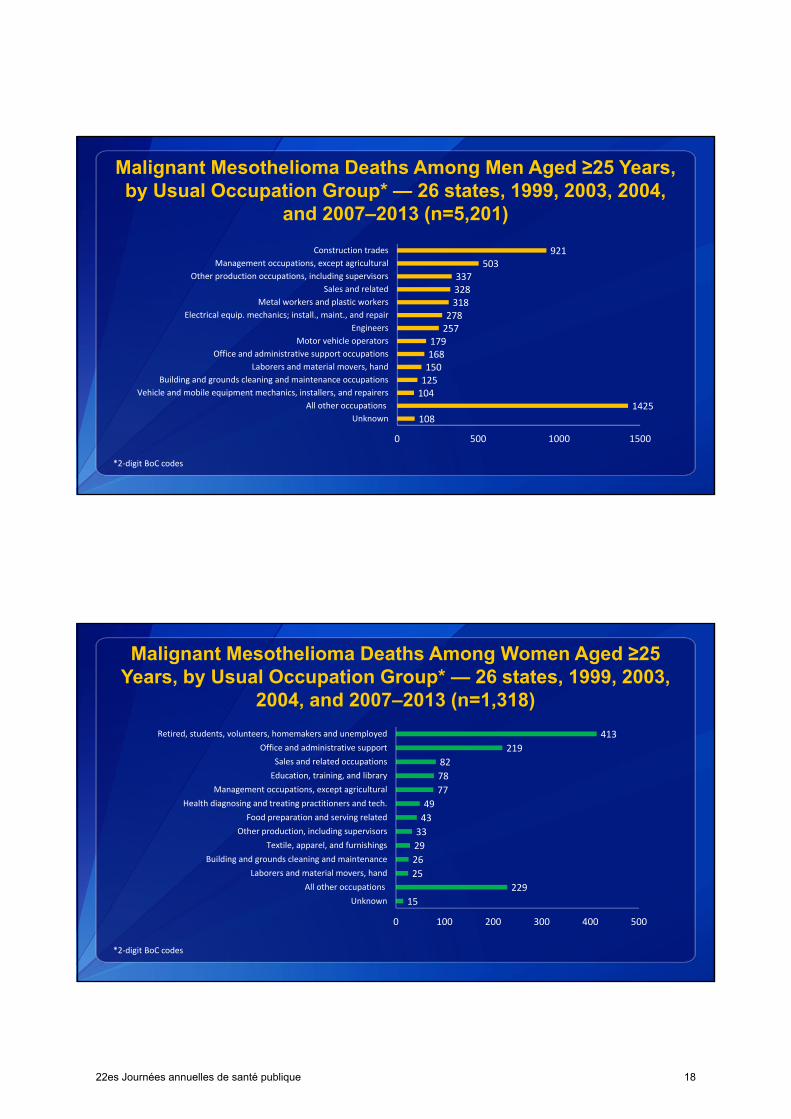
Malignant Mesothelioma Deaths Among Men Aged ≥25 Years, by Usual Occupation Group* — 26 states, 1999, 2003, 2004,
and 2007–2013 (n=5,201)
1081425
104125150168179
257278318328337
503921
0 500 1000 1500
Unknown
All other occupations
Vehicle and mobile equipment mechanics, installers, and repairers
Building and grounds cleaning and maintenance occupations
Laborers and material movers, hand
Office and administrative support occupations
Motor vehicle operators
Engineers
Electrical equip. mechanics; install., maint., and repair
Metal workers and plastic workers
Sales and related
Other production occupations, including supervisors
Management occupations, except agricultural
Construction trades
*2‐digit BoC codes
Malignant Mesothelioma Deaths Among Women Aged ≥25 Years, by Usual Occupation Group* — 26 states, 1999, 2003,
2004, and 2007–2013 (n=1,318)
15
229
25
26
29
33
43
49
77
78
82
219
413
0 100 200 300 400 500
Unknown
All other occupations
Laborers and material movers, hand
Building and grounds cleaning and maintenance
Textile, apparel, and furnishings
Other production, including supervisors
Food preparation and serving related
Health diagnosing and treating practitioners and tech.
Management occupations, except agricultural
Education, training, and library
Sales and related occupations
Office and administrative support
Retired, students, volunteers, homemakers and unemployed
*2‐digit BoC codes
22es Journées annuelles de santé publique 18
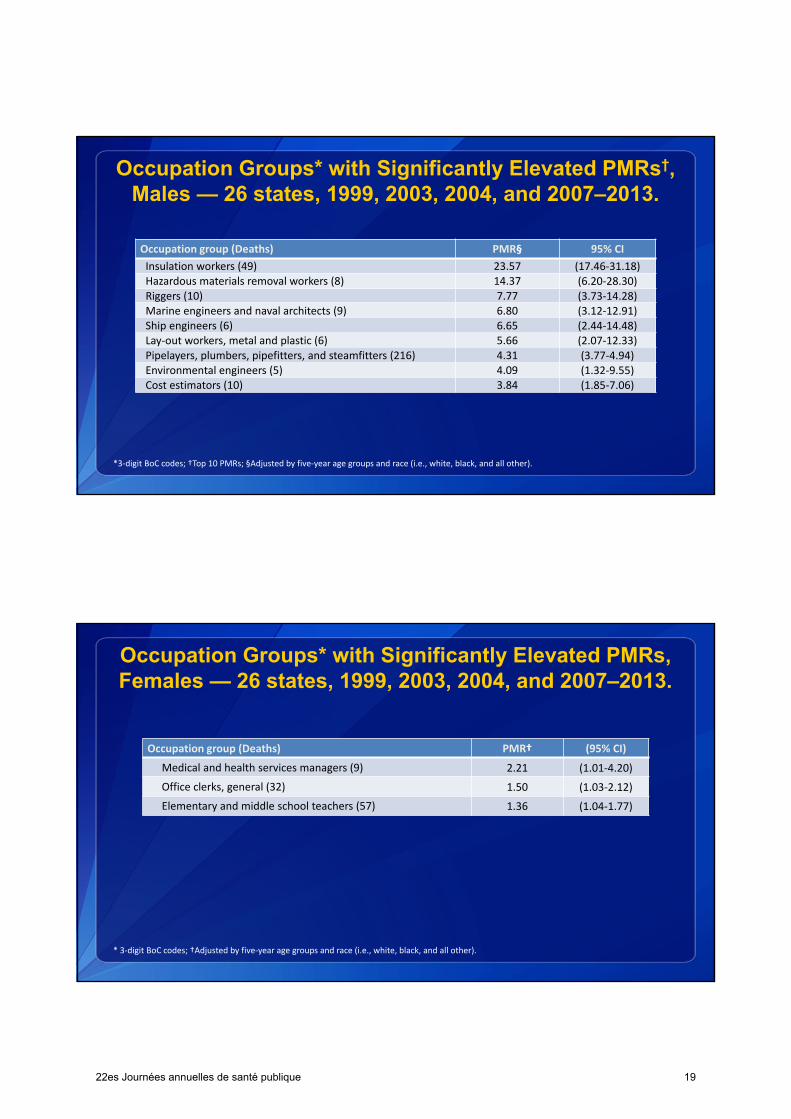
Occupation Groups* with Significantly Elevated PMRs†, Males — 26 states, 1999, 2003, 2004, and 2007–2013.
Occupation group (Deaths) PMR§ 95% CI
Insulation workers (49) 23.57 (17.46‐31.18)Hazardous materials removal workers (8) 14.37 (6.20‐28.30)Riggers (10) 7.77 (3.73‐14.28)Marine engineers and naval architects (9) 6.80 (3.12‐12.91)Ship engineers (6) 6.65 (2.44‐14.48)Lay‐out workers, metal and plastic (6) 5.66 (2.07‐12.33)Pipelayers, plumbers, pipefitters, and steamfitters (216) 4.31 (3.77‐4.94)Environmental engineers (5) 4.09 (1.32‐9.55)Cost estimators (10) 3.84 (1.85‐7.06)
*3‐digit BoC codes; †Top 10 PMRs; §Adjusted by five‐year age groups and race (i.e., white, black, and all other).
Occupation Groups* with Significantly Elevated PMRs, Females — 26 states, 1999, 2003, 2004, and 2007–2013.
Occupation group (Deaths) PMR† (95% CI)
Medical and health services managers (9) 2.21 (1.01‐4.20)
Office clerks, general (32) 1.50 (1.03‐2.12)
Elementary and middle school teachers (57) 1.36 (1.04‐1.77)
* 3‐digit BoC codes; †Adjusted by five‐year age groups and race (i.e., white, black, and all other).
22es Journées annuelles de santé publique 19
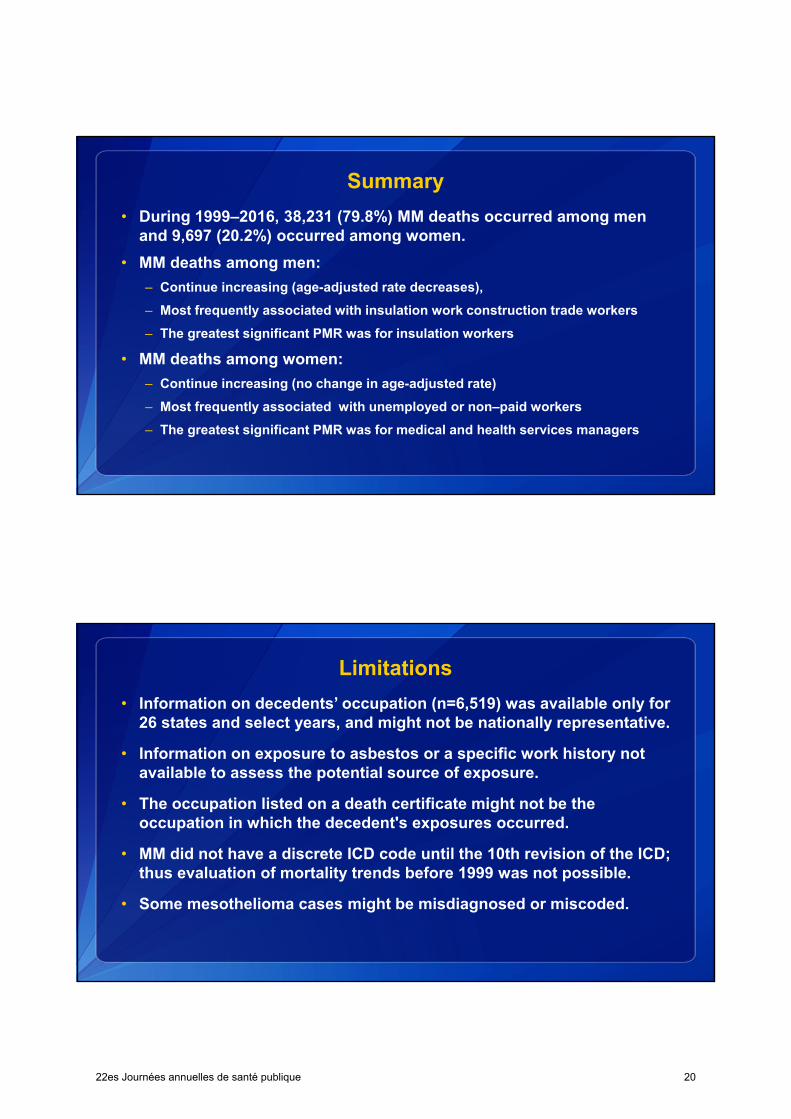
Summary
• During 1999–2016, 38,231 (79.8%) MM deaths occurred among men and 9,697 (20.2%) occurred among women.
• MM deaths among men:
– Continue increasing (age-adjusted rate decreases),
– Most frequently associated with insulation work construction trade workers
– The greatest significant PMR was for insulation workers
• MM deaths among women:
– Continue increasing (no change in age-adjusted rate)
– Most frequently associated with unemployed or non–paid workers
– The greatest significant PMR was for medical and health services managers
Limitations
• Information on decedents’ occupation (n=6,519) was available only for 26 states and select years, and might not be nationally representative.
• Information on exposure to asbestos or a specific work history not available to assess the potential source of exposure.
• The occupation listed on a death certificate might not be the occupation in which the decedent's exposures occurred.
• MM did not have a discrete ICD code until the 10th revision of the ICD; thus evaluation of mortality trends before 1999 was not possible.
• Some mesothelioma cases might be misdiagnosed or miscoded.
22es Journées annuelles de santé publique 20
Conclusions
• These results support previous findings that most men with MM had worked in industries and occupations where asbestos exposure would be expected, while most women with MM did not have work in such industries and occupations listed on their death certificates.
• Primary preventive efforts should be concentrated on exposure elimination through exposure controls accompanied by educational programs.
• Because of the continuing occurrence of mesothelioma deaths, ongoing surveillance to monitor temporal trends is warranted.
Acknowledgements
CDC, NIOSH:
John Wood, MS
David N. Weissman, MD
22es Journées annuelles de santé publique 21

Thank You!
For more information please contact: Jacek Mazurek, MD
1095 Willowdale Road, Morgantown, WV 26505Telephone, 304-285-5983Email: [email protected] Web: www.cdc.gov/niosh/
The findings and conclusions in this presentation are those of the authors and do not necessarily represent the official views of NIOSH or CDC.
22es Journées annuelles de santé publique 22


![Practical use of Partially Homomorphic Cryptography · system’s website, it is now used, or has inspired software from companies such as SAP, Microsoft, and Google [18]. CryptDB](https://img.pdfslide.tips/doc/110x75/5be6340f09d3f2d8348ce042/practical-use-of-partially-homomorphic-systems-website-it-is-now-used-or.jpg)