Embed Size (px)
Citation preview
po
UNIVERSIDADE ESTADUAL DE CAMPINAS
INSTITUTO DE BIOLOGIA
LIANA GONDIM BORGES
ESTRUTURA GENÉTICA ESPACIAL DE UMA POPULAÇÃO DE
BAMBUS EM HOTSPOT DE BIODIVERSIDADE
SPATIAL GENETIC STRUCTURE OF A POPULATION OF
BAMBOOS IN A BIODIVERSITY HOTSPOT
Campinas, 2018

LIANA GONDIM BORGES
ESTRUTURA GENÉTICA ESPACIAL DE UMA
POPULAÇÃO DE BAMBUS EM HOTSPOT DE
BIODIVERSIDADE
SPATIAL GENETIC STRUCTURE OF A POPULATION
OF BAMBOOS IN A BIODIVERSITY HOTSPOT
Dissertação apresentada ao Instituto
de Biologia da Universidade Estadual
de Campinas como parte dos
requisitos exigidos para a obtenção do
Título de Mestra em Biologia Vegetal
Dissertation presented to the Institute
of Biology of the University of
Campinas in partial fulfillment of the
requirements for the degree of Master
in Plant Biology
Orientador: Prof. Dr. André Olmos Simões
Co-orientadora: Profa. Dra. Anete Pereira Souza
Campinas
2018
ESTE ARQUIVO DIGITAL CORRESPONDE À
VERSÃO FINAL DA DISSERTAÇÃO
DEFENDIDA PELA ALUNA LIANA GONDIM
BORGES E ORIENTADA PELO PROF. DR.
ANDRÉ OLMOS SIMÕES
Campinas, 30 de Julho de 2018
COMISSÃO EXAMINADORA
Prof. Dr. André Olmos Simões
Dra. Débora Cristina ROTHER
Profa. Dra. Maria Imaculada Zucchi
Os membros da Comissão Examinadora acima assinaram a Ata de Defesa, que se
encontra no processo de vida acadêmica do aluno.
AGRADECIMENTOS
Agradeço primeiramente aos meus pais, Linda e Luíz, por me apoiarem durante essa
longa trajetória que já dura quase 27 anos. Sem a presença de vocês nada disso teria
sido possível.
À família estendida, Marcinha, Fátima, Marcela, Jamila, tias, primos e primas dos
quatro cantos do Brasil.
Ao meu querido companheiro, namorado e melhor amigo Thomas. Obrigada por todo o
apoio, amor, carinho e compreensão nesse longo processo de aprendizado que não tem
sido nada simples para nós dois.
Aos amigos maravilhosos, novos e antigos, que me fizeram companhia e me ajudaram
de tantas formas ao longo desses dois anos de UNICAMP: Rafael, Raquel, Luciana,
Rodrigo, Jessica...
Aos amigos de Fortaleza que, mesmo à distância, sempre me apoiaram com um
conselho ou simplesmente uma piada engraçada para animar um dia cansativo: Yuri,
Lucas, Tito, Jean Michel.
Ao professor André, por ter me acolhido em um momento tão difícil e me ajudado a
atravessar esses derradeiros e tempestuosos momentos.
À profa. Anete por ser não somente uma orientadora fora de série, mas uma mulher
inspiradora cujo exemplo pretendo levar para minha vida profissional e pessoal.
À Maíra, por ter me ensinado tantas coisas sobre bambus e florestas tropicais, além de
ter sido uma peça tão importante na minha formação como pesquisadora.
A toda a família CBMEG – Carlinha, Lívia, Aline, Danilo, Luciano, Alessandro,
Yohans, e especialmente ao Fábio, por terem me acolhido calorosamente com café, bolo
e risadas, e me ensinado tantas coisas que vão além da bancada de laboratório.
À equipe do projeto BIOTA/FAPESP, especialmente o Wagner e o Pezão, cuja ajuda
foi imprescindível para a execução desse trabalho.
À UNICAMP pelo apoio logístico e infraestrutura.
Às agências financiadoras CAPES/CNPq pela bolsa e pelo financiamento do projeto
PELD/FGAF (403710/2012-0) para manutenção das áreas onde foram realizadas as
coletas.
À FAPESP pelo financiamento dos projetos BIOTA/Gradiente Funcional (03/12595-7)
e BIOTA/Ecofor (NERC/FAPESP 12/51872-9) que possibilitou a implantação das
parcelas de estudos e subsidiaram as atividades de campo deste projeto.
RESUMO
A diversidade genética é um dos três níveis de organização da biodiversidade, sendo a
força motriz por trás do surgimento e adaptação das espécies a diferentes habitats. A
interação entre a variabilidade genética presente no seio de uma população e elementos
do ambiente onde esta ocorre eventualmente se traduzirá sob a forma de uma estrutura
genética espacial, i.e., a distribuição espacial não-aleatória dos genótipos. Informações
acerca da estrutura genética espacial de uma população constituem uma valiosa
ferramenta para o estudo de populações e também da história evolutiva de uma espécie.
O objetivo do presente trabalho foi investigar como a estrutura genética de uma
população está organizada através de diferentes escalas espaciais, e de que maneira
essas escalas relacionam-se entre si. Para tanto, escolhemos como modelo de estudo o
bambu lenhoso Merostachys neesii Rupr. (Poaceae: Bambusideae), uma espécie
endêmica da Mata Atlântica cujo ciclo de vida e características da história de vida as
tornam um excelente modelo para estudos sobre estrutura genética espacial. No
primeiro capítulo, descrevemos os marcadores moleculares utilizados nas análises
genéticas dos capítulos subsequentes. No segundo capítulo, analisamos a estrutura
genética espacial de uma população de M. neesii localizada na Floresta Ombrófila
Densa Montana no Parque Estadual da Serra do Mar (PESM), SP, e discutimos quais
processos podem estar por trás da geração desses padrões em diferentes escalas. No
terceiro capítulo, estendemos nossa análise da estrutura genética espacial à escala do
interior das moitas e discutimos como os processos ecológicos que determinam a
estrutura genética espacial em maiores escalas podem afetar também a organização
interna das moitas de bambu. As análises revelaram a existência de uma acentuada
estrutura genética espacial em fina escala, em que o grau de parentesco entre indivíduos
é significativo até um limite de 11m de distância. Esse padrão pode ser explicado pela
ausência de adaptações à dispersão a longa distância em espécies de bambu, um
fenômeno que leva à agregação espacial de genótipos aparentados. Também foi
observada a existência de duas subpopulações cujo padrão de distribuição
possivelmente está ligado à ocorrência de assimetrias na distribuição de condições e
recursos ao longo da paisagem. Nossos resultados demonstram que os processos ligados
à estruturação genética espacial repercutem igualmente na organização interna das
moitas de bambu: em mais da metade dos casos, as moitas analisadas não constituem
um indivíduo único, mas contêm uma coleção de genótipos intimamente aparentados.
Esse padrão também pode ser compreendido como resultado da limitação de dispersão e

pode estar relacionado a uma estratégia evolutiva mais ampla deste grupo de plantas.
Nosso estudo revelou que diversas forças podem atuar simultaneamente determinando a
estrutura genética espacial de uma população em diferentes escalas espaciais: enquanto
a limitação da dispersão constitui o fenômeno determinante em escalas de alguns
centímetros até poucos metros, a heterogeneidade ambiental parece ser o fator
governando a distribuição de grupos genéticos mais amplos.
Palavras-chave: Bambus, Merostachys neesii, microssatélites, isolamento-por-
distância, heterogeneidade espacial, clonalidade.

ABSTRACT
Genetic diversity is one of the three levels of biodiversity and constitutes the driving
force behind the emergence and adaptation of species to their habitats. The interaction
between the genetic variability present within a population and elements from the
environment where it occurs will eventually be translated into a spatial genetic
structure; i.e., the non-random distribution of genotypes in space. Information about a
population’s spatial genetic structure represents a valuable tool to better understand
population dynamics and the evolutionary history of a species. The aim of this study
was to investigate how the genetic structure of a population is organized across different
spatial scales and how these scales relate to each other. We chose as a study model the
woody bamboo Merostachys neesii (Poaceae: Bambusideae), a species endemic to the
Atlantic Forest whose life cycle, reproductive traits, clonal habit and organization in
clumps renders an excellent model to test hypothesis about genetic structure in different
spatial scales. In the first chapter, we describe the molecular markers used in the genetic
analyses of the subsequent chapters. In the second chapter, we analyse the spatial
genetic structure of a M. neesii population localized in a portion of Montane Atlantic
Forest at Serra do Mar State Park – SP, Brazil, and discuss which process may be
behind the generation of such patterns in different scales. In the third chapter, we extend
our analysis of spatial genetic structure to the interior of the clumps and discuss how
ecological process that determine genetic structure in broader scales may also affect the
internal organization of bamboo clumps. Our analysis revealed the existence of a strong
fine-scale spatial genetic structure, in which kinship levels between individuals are
significant up to a 11m distance threshold. This pattern may be explained by the
absence of adaptations to seed dispersal in bamboo species, which leads to the spatial
aggregation of related genotypes. We also observed the occurrence of two broader
subpopulations whose distribution across the plot is most likely related to assymmetries
in the distribution of conditions and resources across the landscape. At last, our results
demonstrate that the processes related to spatial genetic structuring in broader scales
also affect the internal structure of bamboo clumps: in more than half the cases,
analysed clumps did not constitute a single individual, but rather a collection of closely
related genotypes. This pattern may also be explained as a result of the limited dispersal
typical of bamboo species and may be related to a broader evolutionary strategy present
in this group of plants. Our study revealed that several forces may act simultaneously to
determine the genetic structure of a population in different spatial scales: while limited

dispersal is the main determinant phenomenon in the scale of a few centimeter up to a
few meters, environmental heterogeneity seems to be the factor governing the
distribution of broader genetic groups in this population.
Key-words: Bamboos, Merostachys neesii, microssatelites, isolation-by-distance,
spatial heterogeneity, clonality.
SUMARIO
AGRADECIMENTOS ................................................................................................................ 5
RESUMO ..................................................................................................................................... 7
ABSTRACT ................................................................................................................................. 9
INTRODUÇÃO GERAL .......................................................................................................... 12
CAPÍTULO 1 ............................................................................................................................ 23
CAPÍTULO 2 ............................................................................................................................. 32
CAPÍTULO 3 ............................................................................................................................. 49
DISCUSSÃO .............................................................................................................................. 60
CONCLUSÃO ........................................................................................................................... 60
REFERENCIAS ........................................................................................................................ 61
ANEXOS .................................................................................................................................... 72
12
INTRODUÇÃO GERAL
“[...] argumentarei que qualquer pequena
migalha de diversidade biológica é
inestimável, e deve ser conhecida e
acalentada. Não podemos renunciar a ela
sem luta.”
(Edward O. Wilson, 1992)
A diversidade genética é considerada pela International Union for Conservation
of Nature (IUCN) como um dos três níveis que compõem a biodiversidade na natureza
(MCNEELY et al., 1990). É através da manutenção da variabilidade alélica que as
populações são capazes de responder a variações ambientais e persistir em suas
comunidades, interagindo com outras espécies e mantendo a estabilidade e a resiliência
do ecossistema (HUGHES et al., 2008; SCHABERG et al., 2008). Nesse sentido, deve-
se compreender a diversidade genética não como um atributo fixo das populações, mas
como um elemento dinâmico que se estrutura no espaço e no tempo em resposta às
condições e aos recursos em constante mudança do ambiente (LOVELESS &
HAMRICK, 1984). Em organismos sésseis como as plantas, o componente espacial da
estruturação genética é particularmente importante, pois estas se encontram
completamente dependentes das condições locais do ambiente em que estão inseridas e,
não podendo mover-se, estabelecem com este uma interação íntima e permanente
(ABREU et al., 2014). À distribuição espacial não aleatória dos genótipos de uma
população dá-se o nome de Estrutura Genética Espacial (SGS – do inglês Spatial
Genetic Structure).
Essa íntima relação entre genoma e ambiente constitui a matéria-prima para os
fenômenos evolutivos (EPPERSON , 2003). Por isso, informações sobre a SGS de uma
população podem ajudar na compreensão de aspectos-chave da história evolutiva das
espécies, tais como fluxo gênico, seleção e deriva (EPPERSON , 2000). Essas análises
também são essenciais para se definir estratégias de conservação que visem a
manutenção das dinâmicas ecológicas e evolutivas naturais da comunidade
(ESCUDERO et al., 2003).
Uma das causas mais comuns da SGS em populações de plantas é a restrição do
fluxo gênico causada pela limitação de dispersão dos propágulos (VEKEMANS &
HARDY, 2004). Nesses casos, os padrões e a intensidade da SGS dependerão da
13
interação entre as estratégias de dispersão da espécie e os elementos da paisagem na
qual a população está inserida – tais como variações de altitude, padrões
microtopográficos ou ocorrência de fragmentação ou outros distúrbios (LOVELESS &
HAMRICK, 1984; YOUNG & MERRIAM, 1994; TROUPIN et al., 2006; REIS et al.,
2015). Espécies cujos propágulos não alcançam longas distâncias – seja porque o
agente dispersor move-se pouco ou porque estão presentes barreiras físicas ao
movimento – e que, portanto, permanecem próximos à planta-mãe, acabarão por exibir
uma tendência à agregação espacial de genótipos aparentados (HARDY &
VEKEMANS, 1999). O processo de deriva genética, através do qual as frequências
alélicas variam de forma aleatória ao longo do tempo, terminará por determinar a
existência de grupos genéticos distintos, tão diferentes entre si quanto maior for a
distância geográfica que os separa (SEXTON et al., 2014).
O padrão de fluxo gênico dentro de uma população também pode ser
determinado por assimetrias nas características do ambiente em que a população se
encontra inserida (TEMUNOVIĆ et al., 2012). Quando as diferenças ambientais entre
porções da comunidade são suficientemente importantes, um processo de adaptação
local pode vir a acontecer, levando à formação de grupos genéticos que se organizam de
acordo com os padrões de distribuição diferenciada de condições e recursos ao longo da
paisagem (ORSINI et al., 2013). Neste cenário, imigrantes e híbridos oriundos de outros
ambientes e adaptados a outras condições serão negativamente selecionados e terão
grande dificuldade em se estabelecer, o que em última instância representa uma barreira
significativa ao fluxo gênico entre subpopulações e reforça o padrão de SGS (SEXTON
et al., 2014). Embora essa distribuição diferenciada de genótipos na paisagem possa
ocorrer em resposta a fenômenos em larga escala (p.ex., atividade vulcânica)
(TSUMURA et al., 2014), especial atenção tem sido dada à importância de fatores
microambientais na formação da estrutura genética de populações naturais de plantas,
tais como variações locais na profundidade, saturação hídrica e pH do solo, fatores
microtopográficos e a existência de padrões irregulares de distribuição de nutrientes à
escala de poucos metros ou até centímetros (LECHOWICZ & BELL, 1991; LINHART
& GRANT, 1996; HUBER et al., 2004).
Outros fenômenos, como a seleção diferencial ao longo dos estádios
ontogenéticos, a ocorrência de reprodução clonal, taxas elevadas de mutação somática
ou eventos estocásticos podem deixar suas marcas na SGS de uma população de plantas

14
(ABREU et al., 2014; HUBER et al., 1999). O importante é que a diversidade genética
estrutura-se ao longo de diversas escalas espaço-temporais, e que diferentes processos
podem estar na origem dos padrões observados em cada escala (ESCUDERO et al.,
2003). Entender de que maneira essas escalas se relacionam e quais os fenômenos mais
importantes para a manutenção da diversidade genética em cada uma delas é um passo
essencial não só para se desvendar a história evolutiva de uma espécie ou conservá-la,
mas para compreender como ela se relaciona com o meio em que está estabelecida e
como se conecta com outros processos ecológicos que se ocorrem simultaneamente no
seio da comunidade.
Os marcadores
Informações baseadas em medidas genéticas podem ser obtidas de diversas
maneiras, desde os métodos baseados na observação sistemática dos fenótipos de
diversas gerações, até os métodos baseados em marcadores moleculares (SUNNOCKS,
2000). Marcadores moleculares são segmentos únicos de DNA cujos polimorfismos são
representativos da variação presente no genoma de um organismo (AGARWAL et al.,
2008). Mutações aleatórias no código genético dos indivíduos – acumuladas ao longo
do tempo e submetidas aos efeitos de deriva e seleção – eventualmente desdobram-se
em padrões populacionais passíveis de análise. O uso de marcadores moleculares
adequados, preferencialmente aliado a modelos de genética de populações, é então
capaz de fornecer informações de qualidade sobre a história de vida, evolução e relações
entre os organismos (SUNNOCKS, 2000; AVISE, 2004). Sendo assim, é importante
escolher o marcador molecular mais adequado para o tipo de pergunta que se pretende
responder, levando-se em consideração a escala da análise e os parâmetros a serem
medidos (SUNNOCKS, 2000).
Microssatélites (em inglês, Simple Sequence Repeat, SSR) são sequências de um
a seis nucleotídeos repetidos em tandem, presentes tanto em regiões codificadoras
quanto não-codificadoras dos genomas de eucariotos e procariotos (ZANE et al., 2002).
São marcadores particularmente úteis devido ao seu alto grau de polimorfismo,
codominância e relativa facilidade e baixo custo de desenvolvimento e utilização
(MCCOUCH et al., 1997). A cada evento de reprodução sexuada os microssatélites
sofrem um rearranjo que torna a nova geração genotipicamente diferente da geração
parental de uma maneira que é facilmente identificável. Por isso, são marcadores

15
importantes em estudos de análise genética em fina escala, como identificação
individual e determinação de parentesco (SUNNOCKS, 2000). Ainda, se analisados
como genes individuais, os microssatélites prestam-se perfeitamente ao cálculo de
frequências gênicas e a análises de distribuição e correlação espacial, o que os torna
marcadores eficientes para o cálculo de fluxo gênico, estruturação e diversidade
genética, bem como outros parâmetros de genética de populações (SUNNOCKS, 2000).
Bambus: modelo de estudo versátil
Bambus (Poaceae: Bambusoideae) são um grupo de ampla distribuição global,
mas cuja ocorrência concentra-se principalmente em florestas tropicais e subtropicais
(SODERSTROM & CALDERÓN 1979; MCNEELY, 1995). Em muitas partes do
mundo, os bambus lenhosos (Tribo Bambuseae) são parte crucial da economia e da
cultura local: seus colmos lignificados permitem a construção de casas e utensílios
domésticos; barcos, varas de pescar e instrumentos musicais (MCNEELY, 1999)
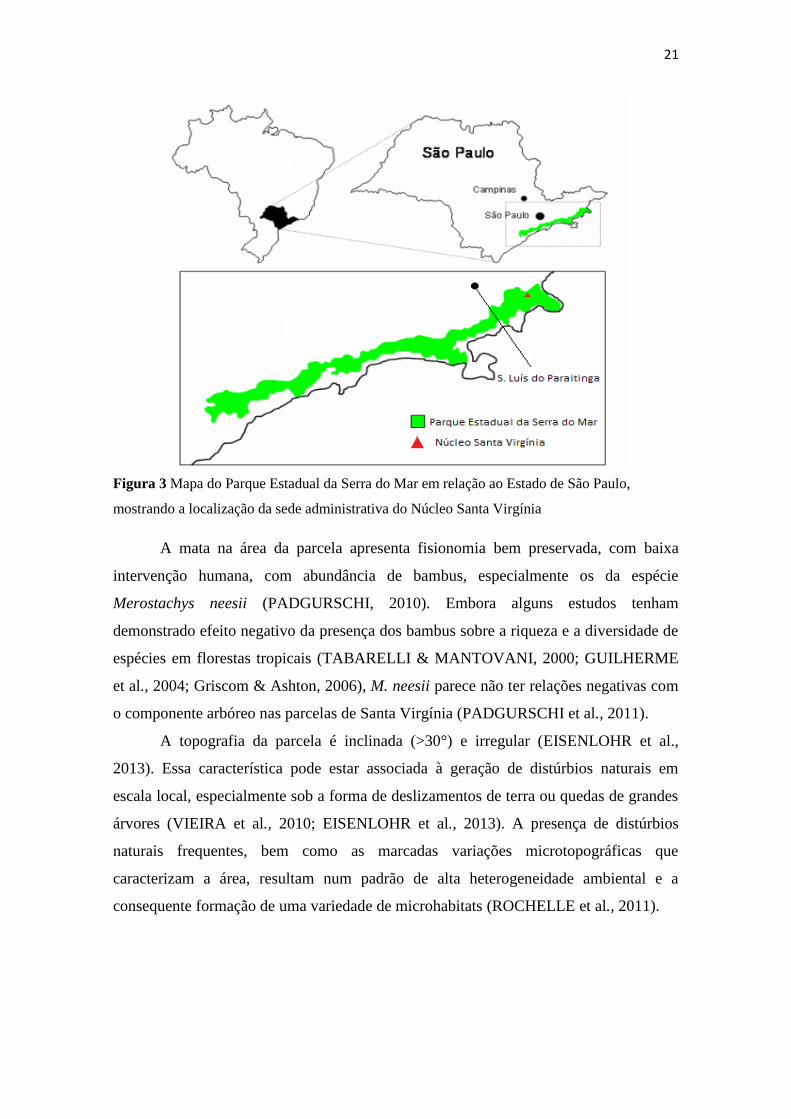
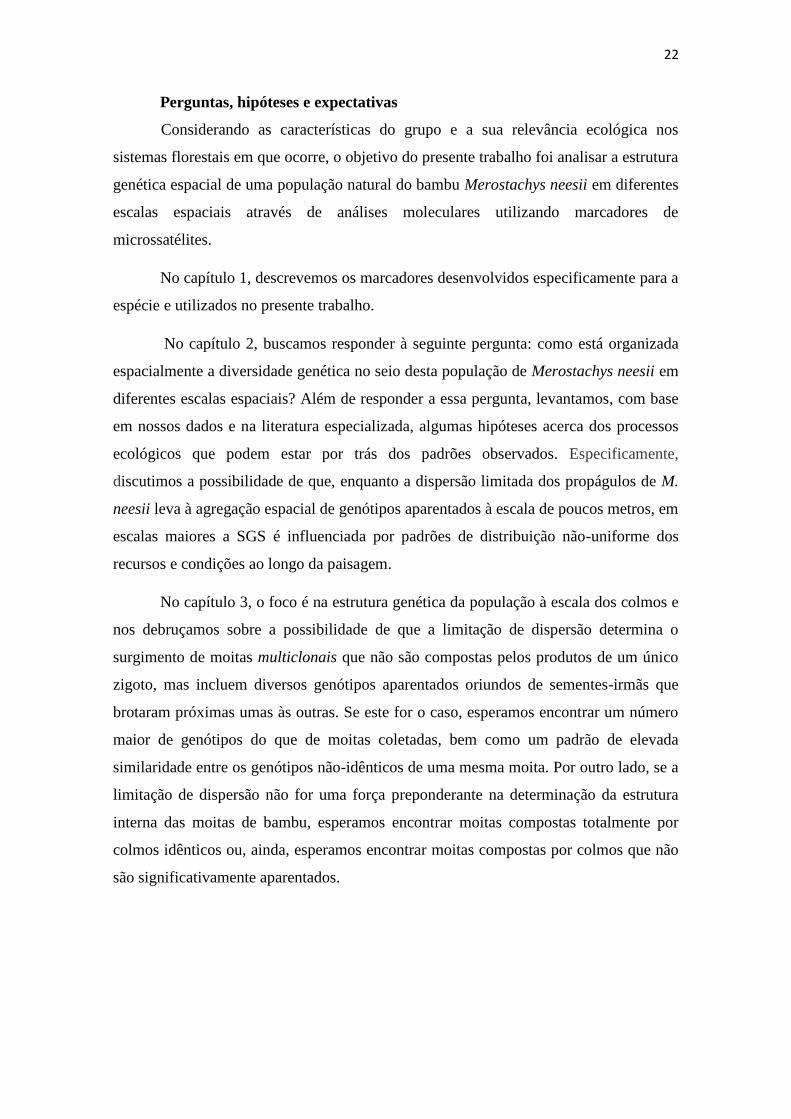
(Figura 1). Sua importância é também ecológica: florestas de bambu desempenham um
papel fundamental na ciclagem de nutrientes em florestas tropicais, e, em nível global,
representam um importante sumidouro de carbono – uma propriedade ainda mais
relevante diante do atual cenário de aquecimento global (ZHOU et al., 2005;
PADGURSCHI et al., in review). Além disso, representam importante fonte de
nutrientes e abrigo para populações animais como insetos e pequenos mamíferos
(LOUTON et al., 1996; HILÁRIO & FERRARI, 2010; CESTARI & BERNARDI,
2011).
Figura 1 Distribuição da tribo Bambuseae (bambus lenhosos). Fonte:
http://www.eeob.iastate.edu/research/bamboo/maps.html
16
Os efeitos da presença de bambus na estrutura da comunidade devem-se a uma
série de características de história de vida e ciclo reprodutivo próprios desse grupo de
plantas (TABARELLI & MANTOVANI, 1999). Esses mesmos atributos que os fazem
ecologicamente relevantes também tornam os bambus um modelo extremamente
versátil de estudos de genética populacional. Tipicamente, os bambus alternam longos
períodos de propagação vegetativa – que podem durar décadas (JANZEN, 1976)-, com
eventos de floração gregária e monocárpica, ou seja, todos os indivíduos florescem ao
mesmo tempo e morrem logo após a dispersão das sementes (JUDZIEWICZ et al.,
1999).
Durante o período vegetativo, os bambus propagam-se clonalmente através de
rizomas subterrâneos que dão origem a inúmeros colmos, os quais permanecem unidos
dando origem a densas moitas (JUDZIEWICZ et al., 1999) (Figura 2). Moitas e
touceiras de plantas clonais, como bambus, tradicionalmente têm sido consideradas
como correspondendo a um indivíduo geneticamente único (geneta) formado por
módulos (rametas) oriundos do mesmo zigoto e, portanto, idênticos entre si
(ERIKSSON, 1993). Entretanto, estudos recentes têm demonstrado que este nem
sempre é o caso (FRANKLIN et al., 2008). O fenômeno da multiclonalidade; i.e., a
presença de múltiplos genótipos em moitas discretas de plantas clonais, tem sido
observado com frequência em estudos moleculares de plantas clonais, incluindo os
bambus (KREHER et al., 2000; FRANKLIN et al., 2008, LI et al., 2012). Embora a
ocorrência da multiclonalidade esteja relativamente bem documentada, poucos estudos
têm se preocupado em explorar os padrões de parentesco entre os rametas e de que
modo a estrutura genética intra-moita é afetada pelos processos ecológicos que moldam
a SGS em outras escalas espaciais (HÄMMERLI & REUSCH, 2003). Uma das
explicações para a existência de moitas multiclonais é o entremeamento de rametas de
moitas vizinhas; entretanto, esse fenômeno só foi observado em espécies com rizoma
longo (tipo leptomófico) (ISAGI et al., 2004). Em espécies clonais de rizoma curto, que
tendem a formar moitas ou touceiras compactas, outros fatores podem influenciar a
estrutura interna das moitas: a dispersão limitada e/ou agregada das sementes – p.ex.,
inflorescências que contendo grande abundância de sementes – pode igualmente dar
origem um padrão de moitas multiclonais (LI et al., 2012).

17
Durante os eventos de reprodução sexuada, os bambus produzem flores
pequenas, inconspícuas e adaptadas à polinização por vento (JUDZIEWICZ et al.,
1999). Os frutos são pequenas cariopses nutritivas que não apresentam nenhum tipo de
adorno que favoreça a dispersão a longas distâncias e, por isso, tendem a cair
massivamente sob a planta-mãe (SODERSTROM & CALDERON, 1979; KEELEY &
BOND, 1999; PADGURSCHI, 2014). A dispersão limitada das sementes pode ser parte
de uma estratégia reprodutiva mais ampla dos bambus, que inclui a disponibilização de
nichos adequados à germinação mediante a morte do indivíduo parental (JANZEN,
1976; PADGURSCHI, 2014). A limitação de dispersão também tem repercussões
genéticas: diante da ausência de dispersores que as transportam para longe da planta-
mãe, a agregação espacial das sementes levará necessariamente à formação de uma forte
estrutura genética espacial (HARDY et al., 2006). No caso de plantas clonais, a escala
de percepção da SGS vai depender também da escala na qual se concebe o indivíduo
durante as análises: este pode ser uma moita inteira ou um único colmo (HÄMMERLI
& REUSCH, 2003). Nesse sentido, bambus revelam-se modelos particularmente úteis
em estudos genéticos porque permitem análises simultâneas em diversas escalas
espaciais, que podem ou não ser governadas pelos mesmos processos ecológicos e
evolutivos.
Após a floração e a liberação das sementes, os indivíduos reprodutivos morrem,
abrindo clareiras na floresta (JUDZIEWICZ et al., 1999). Esse evento pode ter
importante repercussão na dinâmica de sucessão da mata ao representar uma janela de
oportunidade para o estabelecimento de outras espécies (WIDMER, 1997; TAYLOR et
al., 2004; GIORDANO et al., 2009). Para além das repercussões ecológicas que possam
ter na comunidade, a combinação dos eventos de floração gregária seguida de
mortalidade dos adultos e germinação massiva das sementes também tem outra
consequência digna de nota: a ausência de sobreposição de gerações nas populações
(STERN et al., 1999).
Posto que as condições ambientais naturalmente variam ao longo do tempo, cada
nova coorte que emerge no seio de uma população possui uma estrutura genética que é
reflexo do momento em que foi gerada. Em populações onde diferentes gerações
coexistem, portanto, parte da variabilidade genética observada entre os indivíduos
advém precisamente das respostas às condições ambientais diferenciadas dos diversos
momentos em que estes foram gerados (ELLNER & HAIRSTON, 1994). Por outro
18
lado, a utilização de espécies sem sobreposição de gerações, tais como os bambus, torna
desnecessária a inclusão da variação temporal no rol de variáveis passíveis de
influenciar a SGS. Em outras palavras, ao utilizar bambus como modelo de estudo,
estamos olhando para um registro histórico de como certos processos moldaram a
estrutura genética de uma geração em um momento preciso, sem ter de nos
preocuparmos com o ruído de fundo representado pela existência de outras gerações –
cada uma submetida a uma combinação particular de condições.
Portanto, além da inegável importância ecológica, cultural e econômica que
representam para as comunidades naturais e humanas em que ocorrem, os bambus
também constituem um importante modelo biológico através dos quais podemos testar
hipóteses ecológicas e evolutivas. Sua versatilidade também se reflete na variedade de
escalas espaciais em que podem ser analisados. Os resultados desses estudos certamente
contribuirão com a construção de um arcabouço de conhecimento a respeito do papel da
interação entre a diversidade genética e o ambiente na manutenção da biodiversidade
em sistemas florestais tropicais.
A espécie
No Brasil ocorre a maior diversidade de bambus das Américas e uma das
maiores do mundo. Aqui registram-se pelo menos 232 espécies, dentre as quais 174 são
endêmicas (FILGUEIRAS & GONÇALVES, 2004). A maioria dessas espécies ocorre
na região da Mata Atlântica, que é o principal centro de diversidade Neotropical de
bambus (JUDZIEWICZ et al., 1999). Em algumas dessas florestas, os bambus chegam a
dominar a fisionomia da comunidade, afetando processos de regeneração e sucessão
ecológica, bem como influenciando os padrões de diversidade e abundância de árvores
(TABARELLI & MANTOVANI 2000; GUILHERME et al., 2004; GRISCOM &
ASHTON 2006; LIMA et al., 2012; VINHA et al., 2017).
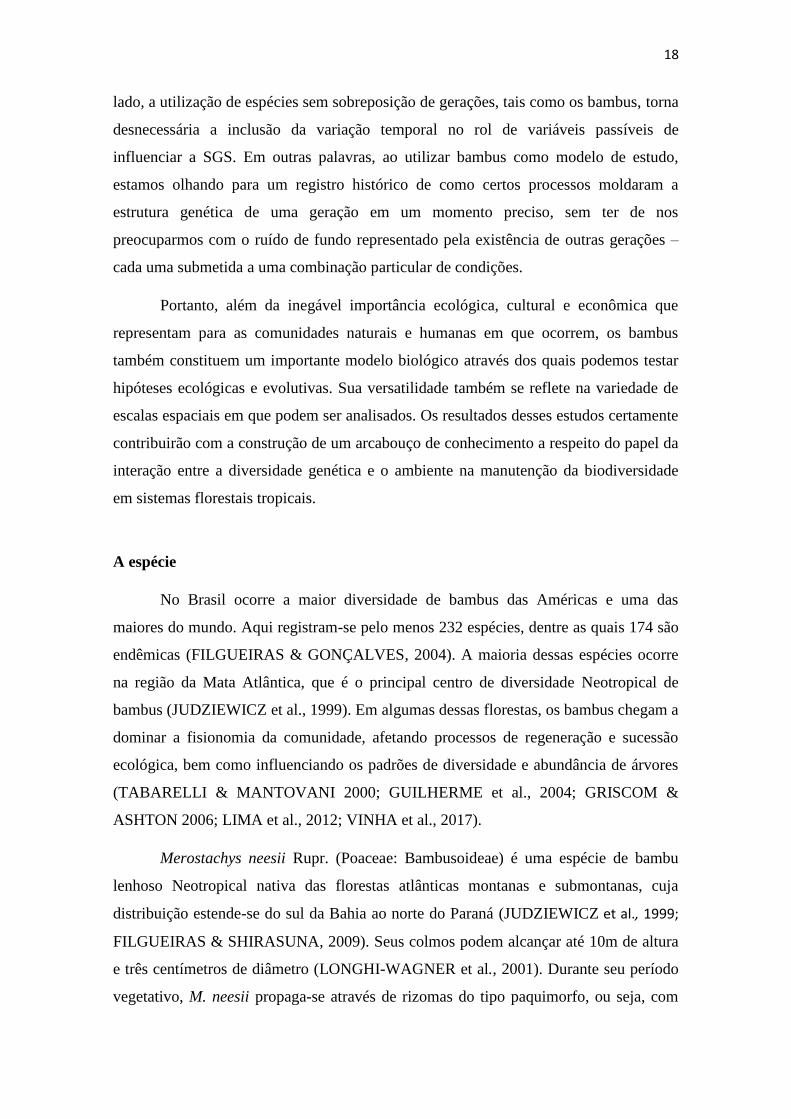
Merostachys neesii Rupr. (Poaceae: Bambusoideae) é uma espécie de bambu
lenhoso Neotropical nativa das florestas atlânticas montanas e submontanas, cuja
distribuição estende-se do sul da Bahia ao norte do Paraná (JUDZIEWICZ et al., 1999;
FILGUEIRAS & SHIRASUNA, 2009). Seus colmos podem alcançar até 10m de altura
e três centímetros de diâmetro (LONGHI-WAGNER et al., 2001). Durante seu período
vegetativo, M. neesii propaga-se através de rizomas do tipo paquimorfo, ou seja, com
19
pouco espaço entre os nós dos quais emergem os colmos (JUDZIEWICZ et al., 1999)
(Figura 2) dando origem a densas moitas compostas por um número variável de colmos
(PADGURSCHI et al., in prep.). Devido à sua presença massiva e influência na
dinâmica da comunidade florestal – um fenômeno bem registrado para outras espécies
de bambu tropical -, M. neesii faz-se um candidato perfeito ao desenvolvimento de
estudos de diversidade genética dentro de um contexto ecológico, visando tanto a
elaboração de estratégias de conservação quanto uma melhor compreensão da história
evolutiva desse importante grupo de plantas (OLIVEIRA-FILHO et al., 1994; ROTHER
et al., 2009; LIMA et al., 2012).
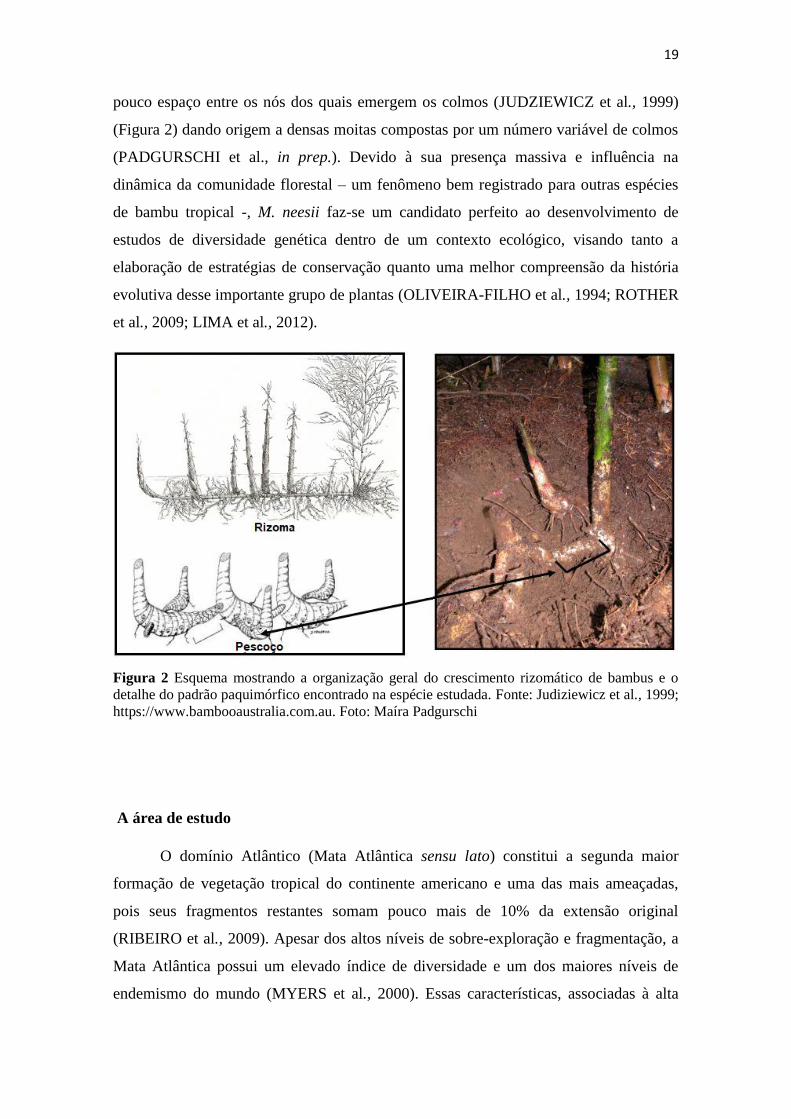
Figura 2 Esquema mostrando a organização geral do crescimento rizomático de bambus e o
detalhe do padrão paquimórfico encontrado na espécie estudada. Fonte: Judiziewicz et al., 1999;
https://www.bambooaustralia.com.au. Foto: Maíra Padgurschi
A área de estudo
O domínio Atlântico (Mata Atlântica sensu lato) constitui a segunda maior
formação de vegetação tropical do continente americano e uma das mais ameaçadas,
pois seus fragmentos restantes somam pouco mais de 10% da extensão original
(RIBEIRO et al., 2009). Apesar dos altos níveis de sobre-exploração e fragmentação, a
Mata Atlântica possui um elevado índice de diversidade e um dos maiores níveis de
endemismo do mundo (MYERS et al., 2000). Essas características, associadas à alta
20
produtividade e à grande extensão territorial, tornam a Mata Atlântica um dos mais
importantes hotspots de biodiversidade do planeta (TABARELI et al., 2005). Dentro
desse contexto, e com o intuito de investigar de maneira multidisciplinar os fenômenos
geradores e mantenedores da biodiversidade e do equilíbrio ecossistêmico da Mata
Atlântica, teve início em 2005 o Projeto Temático Biota Gradiente Funcional (FAPESP
03/12595-7, atualmente parte do Programa PELD/CNPq – sítio FGAF). Através do
projeto, foram estabelecidas 18 parcelas permanentes de 1ha cada ao longo de um
gradiente altitudinal (0-1100 m) no Parque Estadual da Serra do Mar (núcleos
Picinguaba, Santa Virgínia e Cunha), local onde está concentrada a maior parte dos
remanescentes de Mata Atlântica do Estado de São Paulo (JOLY et al., 2012). O
estabelecimento de parcelas permanentes e da infraestrutura facilitam a execução de
estudos sobre a composição e a dinâmica do ecossistema, bem como permite avaliar as
mudanças nesses padrões ao longo do tempo (PHILLIPS et al., 1998).
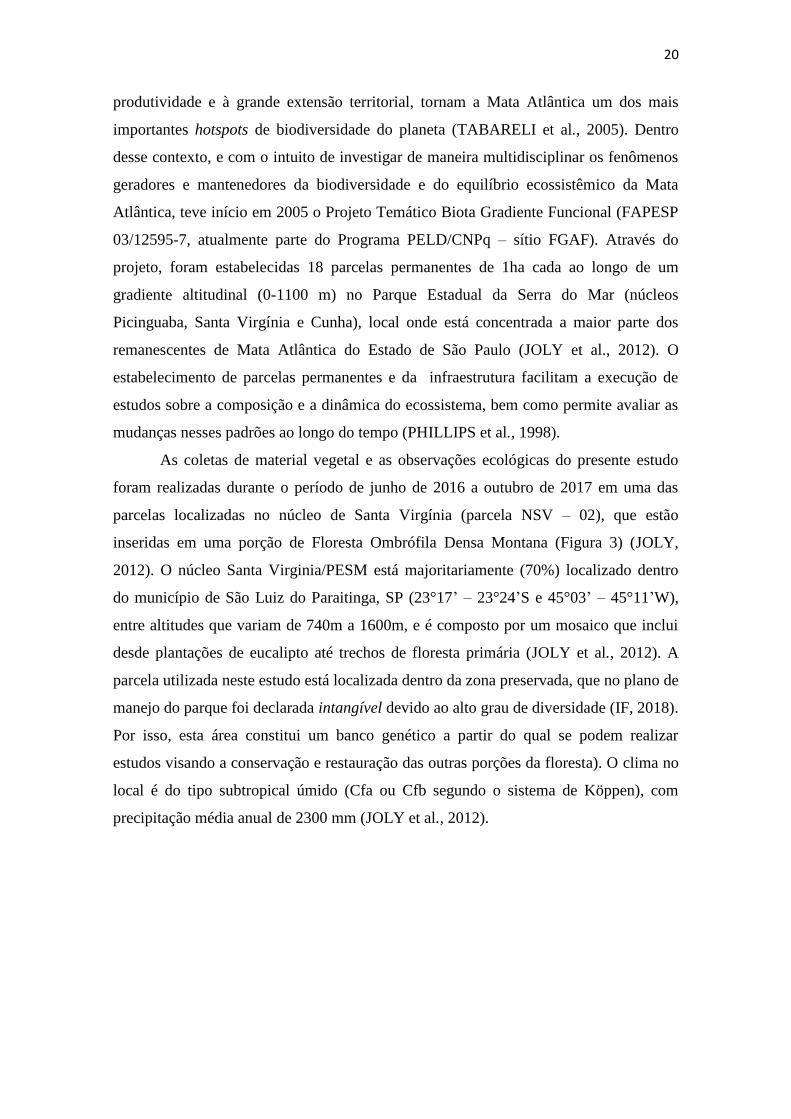
As coletas de material vegetal e as observações ecológicas do presente estudo
foram realizadas durante o período de junho de 2016 a outubro de 2017 em uma das
parcelas localizadas no núcleo de Santa Virgínia (parcela NSV – 02), que estão
inseridas em uma porção de Floresta Ombrófila Densa Montana (Figura 3) (JOLY,
2012). O núcleo Santa Virginia/PESM está majoritariamente (70%) localizado dentro
do município de São Luiz do Paraitinga, SP (23°17’ – 23°24’S e 45°03’ – 45°11’W),
entre altitudes que variam de 740m a 1600m, e é composto por um mosaico que inclui
desde plantações de eucalipto até trechos de floresta primária (JOLY et al., 2012). A
parcela utilizada neste estudo está localizada dentro da zona preservada, que no plano de
manejo do parque foi declarada intangível devido ao alto grau de diversidade (IF, 2018).
Por isso, esta área constitui um banco genético a partir do qual se podem realizar
estudos visando a conservação e restauração das outras porções da floresta). O clima no
local é do tipo subtropical úmido (Cfa ou Cfb segundo o sistema de Köppen), com
precipitação média anual de 2300 mm (JOLY et al., 2012).
21
Figura 3 Mapa do Parque Estadual da Serra do Mar em relação ao Estado de São Paulo,
mostrando a localização da sede administrativa do Núcleo Santa Virgínia
A mata na área da parcela apresenta fisionomia bem preservada, com baixa
intervenção humana, com abundância de bambus, especialmente os da espécie
Merostachys neesii (PADGURSCHI, 2010). Embora alguns estudos tenham
demonstrado efeito negativo da presença dos bambus sobre a riqueza e a diversidade de
espécies em florestas tropicais (TABARELLI & MANTOVANI, 2000; GUILHERME
et al., 2004; Griscom & Ashton, 2006), M. neesii parece não ter relações negativas com
o componente arbóreo nas parcelas de Santa Virgínia (PADGURSCHI et al., 2011).
A topografia da parcela é inclinada (>30°) e irregular (EISENLOHR et al.,
2013). Essa característica pode estar associada à geração de distúrbios naturais em
escala local, especialmente sob a forma de deslizamentos de terra ou quedas de grandes
árvores (VIEIRA et al., 2010; EISENLOHR et al., 2013). A presença de distúrbios
naturais frequentes, bem como as marcadas variações microtopográficas que
caracterizam a área, resultam num padrão de alta heterogeneidade ambiental e a
consequente formação de uma variedade de microhabitats (ROCHELLE et al., 2011).
22
Perguntas, hipóteses e expectativas
Considerando as características do grupo e a sua relevância ecológica nos
sistemas florestais em que ocorre, o objetivo do presente trabalho foi analisar a estrutura
genética espacial de uma população natural do bambu Merostachys neesii em diferentes
escalas espaciais através de análises moleculares utilizando marcadores de
microssatélites.
No capítulo 1, descrevemos os marcadores desenvolvidos especificamente para a
espécie e utilizados no presente trabalho.
No capítulo 2, buscamos responder à seguinte pergunta: como está organizada
espacialmente a diversidade genética no seio desta população de Merostachys neesii em
diferentes escalas espaciais? Além de responder a essa pergunta, levantamos, com base
em nossos dados e na literatura especializada, algumas hipóteses acerca dos processos
ecológicos que podem estar por trás dos padrões observados. Especificamente,
discutimos a possibilidade de que, enquanto a dispersão limitada dos propágulos de M.
neesii leva à agregação espacial de genótipos aparentados à escala de poucos metros, em
escalas maiores a SGS é influenciada por padrões de distribuição não-uniforme dos
recursos e condições ao longo da paisagem.
No capítulo 3, o foco é na estrutura genética da população à escala dos colmos e
nos debruçamos sobre a possibilidade de que a limitação de dispersão determina o
surgimento de moitas multiclonais que não são compostas pelos produtos de um único
zigoto, mas incluem diversos genótipos aparentados oriundos de sementes-irmãs que
brotaram próximas umas às outras. Se este for o caso, esperamos encontrar um número
maior de genótipos do que de moitas coletadas, bem como um padrão de elevada
similaridade entre os genótipos não-idênticos de uma mesma moita. Por outro lado, se a
limitação de dispersão não for uma força preponderante na determinação da estrutura
interna das moitas de bambu, esperamos encontrar moitas compostas totalmente por
colmos idênticos ou, ainda, esperamos encontrar moitas compostas por colmos que não
são significativamente aparentados.
23
CAPÍTULO 1
CHARACTERIZATION OF NINE MICROSATELLITE LOCI FOR
MEROSTACHYS NEESII RUPR. (POACEAE: BAMBUSOIDEA)
Liana G.Borges 1
, Fábio M. Alves1, Anete P. Souza
1,2 , Maíra de C. G. PADGURSCHI
1
1Departamento de Biologia Vegetal, Instituto de Biologia, Universidade Estadual de
Campinas, P.O. Box 6109, 13083-970 Campinas, São Paulo, Brazil
2Centro de Biologia Molecular e Engenharia Genética, Universidade Estadual de
Campinas, P.O. Box 6010, 13083-875 Campinas, São Paulo, Brazil
Email addresses: LGB: [email protected], MCGP: [email protected],
FMA: [email protected], APS: [email protected],
24
ABSTRACT
● Premise of the study: Genetic diversity studies are essential to the understanding
of how species interact and persist in their environment, contributing to the
stability and resilience of the community. Merostachys neesii is a Neotropical
woody bamboo species native to the Atlantic Forest whose abundance and
distinctive life cycle bear great consequence to the structure and dynamics of the
community. We thus aim to develop molecular markers that will allow assessment
of population genetics parameters as well as eventually serve as tools to futher
infer ecological and evolutionary processes.
● Methods and Results: We developed a set of nuclear microssatelite markers for M.
neesii, of which 13 were successfully amplified and 9 were polymorphic. We
analised a total of 31 individual genotypes. Number of bands per locus ranged
from two to 17. An overall multibanding pattern was observed, with some loci
displaying up to six simultaneous bands per individual, strongly suggesting that
M. neesii is a polyploid species, possibly hexaploid. Polymorphic Information
Content values for each locus ranged from 0.37 to 0.89, indicating that these
markers are highly informative.
● Conclusions: These are among the first microssatelite primers developed for a
Neotropical bamboo species, and the first for the Merostachys genus. Their highly
informative nature makes them useful tools for both conservation genetics and
ecological studies.

25
INTRODUCTION
Genetic diversity is regarded as one of the three levels that make up biodiversity
(MCNEELY et al., 1990). It is through the maintenance of allelic variability that
populations are capable of responding to envrionmental variations and persist in their
communities, interacting with other species and maintaining stability and resilience of
the ecossystem. This also means that the study of genetic diversity patterns of a
population may offer a generous insight on how a species interact with its surroundings,
as well as shed some light on the evolutionary mechanisms behind the surge of certain
reproductive traits.
Merostachys neesii Rupr. (Poaceae) is a Neotropical woody bamboo endemic to
the Atlantic Forest, mostly occupying montane and submontane altitudes across Bahia,
São Paulo and Paraná states (Flora do Brasil 2018). Merostachys neesii typically
inhabits forests where it plays important roles in many ecosystem processes, providing
food and habitat resources for animal species (LOUTON et al., 1996; HILÁRIO &
FERRARI 2010; CESTARI & BERNARDI 2011), as well as having a direct impact
over forest physiognomies, species composition and overall regeneration patterns
(TABARELLI & MANTOVANI, 2000; GRISCOM & ASHTON 2003; LIMA et al.,
2012).
This species shows an unusual reproductive cycle, typical of bamboos, with a
vegetative growth phase characterized by the production of short subterranean
rhizomes, resulting in a dense cluster of culms that, after a long period – about 30 years
-, undergoes a synchronous flowering event followed by a massive release of seeds and
the subsequent death of all reproductive culms (JUDZIEWICZ et al., 1999; LONGHI-
WAGNERet al., 2001). We believe that this reproductive pattern may lead to interesting
genetic and ecological repercussions, thus justifying the development of molecular tools
to assess levels of genetic diversity and evaluate genetic structure. Furthermore,
knowledge of the genetic status of a population is essential for the development of better
conservation strategies, especially in the context of a threatened ecosystem such as the
Atlantic rainforest (RIBEIRO et al., 2009; PEÑAS et al., 2016).
In this sense, microsatellite markers (SSRs) have proved themselves particularly
useful. They are relatively cheap and easy to implement, have higher reproducibility
compared to other molecular markers, and because they have a high mutation rate and
codominant nature, are considered one of the most informative molecular markers
available (VIEIRA et al., 2016). In fact, SSR markers have become the go-to molecular
26
marker to genotype both cultivated and wild species. In the latter case, the genotypic
information thus generated may serve not only to describe basic population parameters,
but also to estimate gene flow patterns, kinship coefficients and even evolutionary
relations (SUNNOCKS, 2000; VIEIRA et al., 2016).
In this work, we report the development and characterization of nine
polymorphic SSR microsatellite loci for Merostachys neesii. We hope that these tools
lay the groundwork for furthering our understanding not only of this species genetic
status and diversity, but also how it interacts with elements of the environment in which
it is established and contributes to its balance.
METHODS & RESULTS
We randomly sampled leaves from one M. neesii culm from previously
established 1-ha plot in Santa Virginia protected area, located within Serra do Mar State
Park (PESM in Portuguese), São Paulo, Brazil (see JOLY et al., 2012). Genomic DNA
was extracted from leaf tissue with BioPur DNA extraction kit (Biometrix
Biotecnologia), and was used to develop a microsatellite-enriched library following the
Billotte et al., protocol (1999). DNA sample was digested with AfaI restriction enzyme
and the resulting fragments were ligated to Rsa21 adapters. The fragments containing
microsatellites were selected by hybridization with (CT)8- and (GT)8-biotinylated
probes, followed by capture with Streptavidin MagneSphere Paramagnetic Particles
(Promega). The resulting fragments were amplified through Polymerase Chain Reaction
(PCR) in 100-µL final volume containing 20µL of selected fragments, 1x PCR buffer,
1.5 mM MgCl2, 200µM dNTPs, 0.4 µmol of primer Rsa21, and 2.5 U of Taq DNA
polymerase. A C100 Touch thermocycler (BioRad) was used with the following
program: 95°C for 1 min for initial denaturation, 25 cycles of denaturation at 94°C for
40 s, primer annealing at 60°C for 1 min; extension at 72°C for 2 min, and a final
extension of 72°C for 5 min. The amplicons were cloned into pGEM-T (Promega)
vectors. Plasmids were then transformed into Escherichia coli XL1-Blue competent
cells by electroporation, using a Bio-Rad E. coli Pulser (BioRad). The clones were
grown in a LB medium containing ampicillin and tetracyclin (both at a 100 mg/L
concentration). X-Gal was added to the plate to allow for white-blue screening of
clones. Positive clones were selected through their inability to produce functional β-
galactosidase and the resultant white color of positive colonies. After DNA extraction
27
and purification, a total of 192 positive clones were bi-directionally sequenced using an
automated ABI 3500xLsequencer (Applied Biosystems).
The sequences were edited to remove vector sequences and low-quality regions
using Chromatogram Explorer software (Heracle BioSoft S.R.L., Romania).
Cap3software (HUANG & MADAN, 1999) was then used to assemble contigs
generated by the bi-directional sequencing. To assure the identity of the samples, the
consensus-sequences were then comparatively aligned with sequences from the
Genbank database through the BLASTn online tool (ALTSCHUL et al., 1990).
Microsatellite sequences were identified with SSRIT – Simple Sequence Repeat
Identification Tool (TEMNYKH et al., 2001). Corresponding primers were designed
with Primer3Plus tool (UNTERGASSERET al., 2012).
Subsequent DNA samples were extracted using the CTAB method (DOYLE &
DOYLE, 1990). Temperature tests were carried out to establish the optimal annealing
temperature (Ta) for each pair of primers. PCR amplifications were performed in a
9.8μL volume containing 20 ng DNA, 0.75x PCR buffer, 0.1 mM dNTP, 0.2 mM each
primer, 0.04% BSA, 1.5 mM MgCl2, and 0.4μL Taq DNA polymerase.A. C100 Touch
thermocycler (BioRad) was used with the following program: 94°C for 4 min, followed
by 30 cycles of denaturation at 94°C for 45 s, 1 min at a specific annealing temperature
(Ta), extension at 72°C for 75 s, followed by a final extension of 72°C for 10 min.
PCR products were first verified by electrophoresis on 3% agarose gels. Of 24
primers, 13 amplified at the expected region, nine yielded no visible bands and two
yielded blurred bands that were excluded from the analysis. The 13 amplifying, clear
primers were then assessed for polymorphism using the silver-stained 6% denaturing
polyacrylamide gel technique proposed by Creste et al., (2001) over 31 culms from
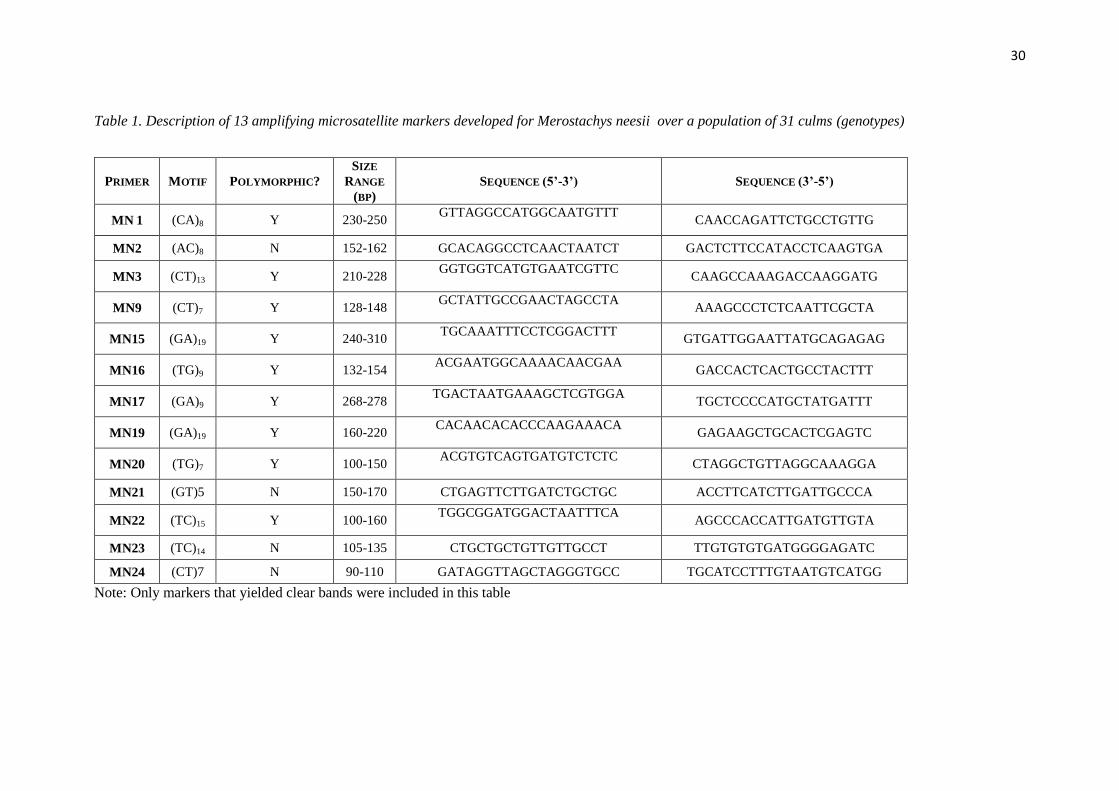
distinct clumps. Of these, 9 were polymorphic and 4 were monomorphic (Table 1); i.e,
69% of amplifying primers exhibited polymorphic patterns. All 13 band-yielding
microsatellite loci revealed multiband patterns, with each individual presenting up to six
simultaneous bands per locus. Lian et al., (2001) remarked that such banding pattern
usually implies that the species is polyploid, with each band representing a different
allele. For M. neesii, this means that the species is probably hexaploid. This finding is
consistent with the literature, which suggests that tropical woody bamboo species are
mostly hexaploid (SILVA, 2007; YEASMIN et al., 2015). Nevertheless, the exact
28
ploidy levels of M. neesii should be further investigated through more specific
cytogenetic methods.
Because of the assumed polyploidy of M. neesii, microssatelite markers were
treated as multilocus fingerprints and inserted into a binary matrix where each allele
was scored present or absent. A total of 83 bands were observed, with the mean number
of bands per locus being 9.2 (Table 2); minimum and maximum number of bands per
locus were 2 and 17, respectively. Polymorphism Information Content, which measures
a marker’s efficiency (ranging from zero to one) in terms of how informative they are,
ranged from 0.3726 to 0.8976, with a mean value of 0.7275 (±0.18). Markers with a PIC
value of over 0.5 are usually considered to be highly informative, while markers with
values ranging between 0.25 and 0.5 are considered reasonably informative
(BOTSTEIN et al., 1980). Because a polyploid genome presents a significant challenge
in determining allelic dosage, we chose not to include heterozygosity calculations in our
description of the markers (MCGREGOR et al., 2000). Instead, as proposed by Bussel
(1999), we calculated Shannon-Weaver’s information index (I) for each locus. This
approach enables a comparison among the different levels of diversity detected by each
SSR marker. We also calculated gene diversity per locus (H) as proposed by Nei (1973).
This index is analogous to the expected heterozygosity and can be interpreted as a
mismatch coefficient, i.e., the probability that, for a given marker, two randomly chosen
bands are different in the population (KOSMAN, 2003; BONIN et al., 2007). Although
there seems to be no direct correlation between the number of alleles and PIC values for
SSR markers, PIC, H and I values suggest that, for this population, the more
polymorphic markers tend to also be those that convey the more information (PRASAD
et al., 2000). Finally, we calculated the number of effective alleles (Ae) per locus, which
may serve as an estimate of the prevalence of low-frequency (rare) alleles (PÉTIT et al.,
1998). We found that number of effective alleles differed greatly from the number of
observed bands, which indicates the presence of several rare alleles in all but one SSR
marker.
CONCLUSION
The microsatellite markers described in this work are among the first developed
specifically for a Neotropical bamboo species. The multiple banding patterns strongly
suggests hexaploidy, which is consistent with findings for other bamboo species. PIC, H

29
and I values indicate that these primers constitute highly informative molecular markers
that may be used in all kinds of population genetics studies, including ecological ones.
The marked difference between the number of observed bands per locus and the number
of effective alleles suggests the existence of many rare alleles. This reinforces the
importance of preserving natural populations and their genetic potential, which may be
lost if population is reduced or fragmented.
ACKNOWLEDGMENTS
We thank the students and technicians engaged in labwork, in special Lívia Souza,
Carla Silva and Aline Moraes; the Serra do Mar State Park, Santa Virgínia Nucleus, for
logistical support; and to the field technician Renato Belinelo for his empirical
knowledge of Atlantic Forest which helped us during all the field trips. The research was
performed with permits COTEC/IF 010.323/2013, 002.766/2013 and 010.631/2013 and
IBAMA/SISBIO #33217. This research was supported by the São Paulo Research
Foundation (Fapesp) via Biota/Fapesp Program grants (2003/12595-7, 2008/50824-1,
2012/51509-8, 2012/51872-5 and CNPq/PELD 403710/2012-0); by the CNPq/CAPES
via M.Sc. fellowship to the first author; and by the University of Campinas (Unicamp).
We acknowledge helpful comments from two reviewers, which have improved the
manuscript.
30
Table 1. Description of 13 amplifying microsatellite markers developed for Merostachys neesii over a population of 31 culms (genotypes)
PRIMER MOTIF POLYMORPHIC?
SIZE
RANGE
(BP)
SEQUENCE (5’-3’) SEQUENCE (3’-5’)
MN 1 (CA)8 Y 230-250 GTTAGGCCATGGCAATGTTT
CAACCAGATTCTGCCTGTTG
MN2 (AC)8 N 152-162 GCACAGGCCTCAACTAATCT GACTCTTCCATACCTCAAGTGA
MN3 (CT)13 Y 210-228 GGTGGTCATGTGAATCGTTC
CAAGCCAAAGACCAAGGATG
MN9 (CT)7 Y 128-148 GCTATTGCCGAACTAGCCTA
AAAGCCCTCTCAATTCGCTA
MN15 (GA)19 Y 240-310 TGCAAATTTCCTCGGACTTT
GTGATTGGAATTATGCAGAGAG
MN16 (TG)9 Y 132-154 ACGAATGGCAAAACAACGAA
GACCACTCACTGCCTACTTT
MN17 (GA)9 Y 268-278 TGACTAATGAAAGCTCGTGGA
TGCTCCCCATGCTATGATTT
MN19 (GA)19 Y 160-220 CACAACACACCCAAGAAACA
GAGAAGCTGCACTCGAGTC
MN20 (TG)7 Y 100-150 ACGTGTCAGTGATGTCTCTC
CTAGGCTGTTAGGCAAAGGA
MN21 (GT)5 N 150-170 CTGAGTTCTTGATCTGCTGC ACCTTCATCTTGATTGCCCA
MN22 (TC)15 Y 100-160 TGGCGGATGGACTAATTTCA
AGCCCACCATTGATGTTGTA
MN23 (TC)14 N 105-135 CTGCTGCTGTTGTTGCCT TTGTGTGTGATGGGGAGATC
MN24 (CT)7 N 90-110 GATAGGTTAGCTAGGGTGCC TGCATCCTTTGTAATGTCATGG
Note: Only markers that yielded clear bands were included in this table

31
Table 2: Descriptive statistics of nine polymorphic loci, estimated over 31 M. neesii culms
Locus NBI NBL PIC I H Ae
MN 1 1-3 4 0.5062 1.03 0.60 2.45
MN3 2-4 6 0.6772 1.55 0.76 5.59
MN9 2-4 9 0.8176 1.94 0.84 6.14
MN15 1-4 14 0.8518 2.28 0.88 7.39
MN16 1-4 4 0.6974 1.38 0.76 3.9
MN17 1-2 2 0.3726 0.69 0.51 1.98
MN19 1-2 13 0.8669 2.30 0.90 8.21
MN20 2-6 14 0.8603 2.42 0.91 7.87
MN22 1-5 17 0.8976 2.65 0.93 10.5
Mean value
(SD) 9.2 (5.45) 0.72 (0.18) 1.8 (0.67) 0.78 (0.14) 6 (2.8)
NBI= Number of simultaneous bands for one individual; NBL= Number of bands per locus; PIC =
Polymorphic Information Content index; I = Shannon’s genetic diversity index; H = Gene diversity index
(Nei, 1973); Ae= Number of effective alleles.
32
CAPÍTULO 2
SPATIAL GENETIC STRUCTURE OF A NEOTROPICAL BAMBOO
SPECIES: DIFFERENT PATTERNS AT DIFFERENT SCALES
Liana G. Borges 1
, Maíra de C. G. Padgurschi 1, Fábio A. Matos
2, Anete P. Souza
1,2
1Departamento de Biologia Vegetal, Instituto de Biologia, Universidade Estadual de
Campinas, P.O. Box 6109, 13083-970 Campinas, São Paulo, Brazil
2Centro de Biologia Molecular e Engenharia Genética, Universidade Estadual de
Campinas, P.O. Box 6010, 13083-875 Campinas, São Paulo, Brazil
Email addresses: LGB: [email protected], MCGP: [email protected],
FMA: [email protected], APS: [email protected],
33
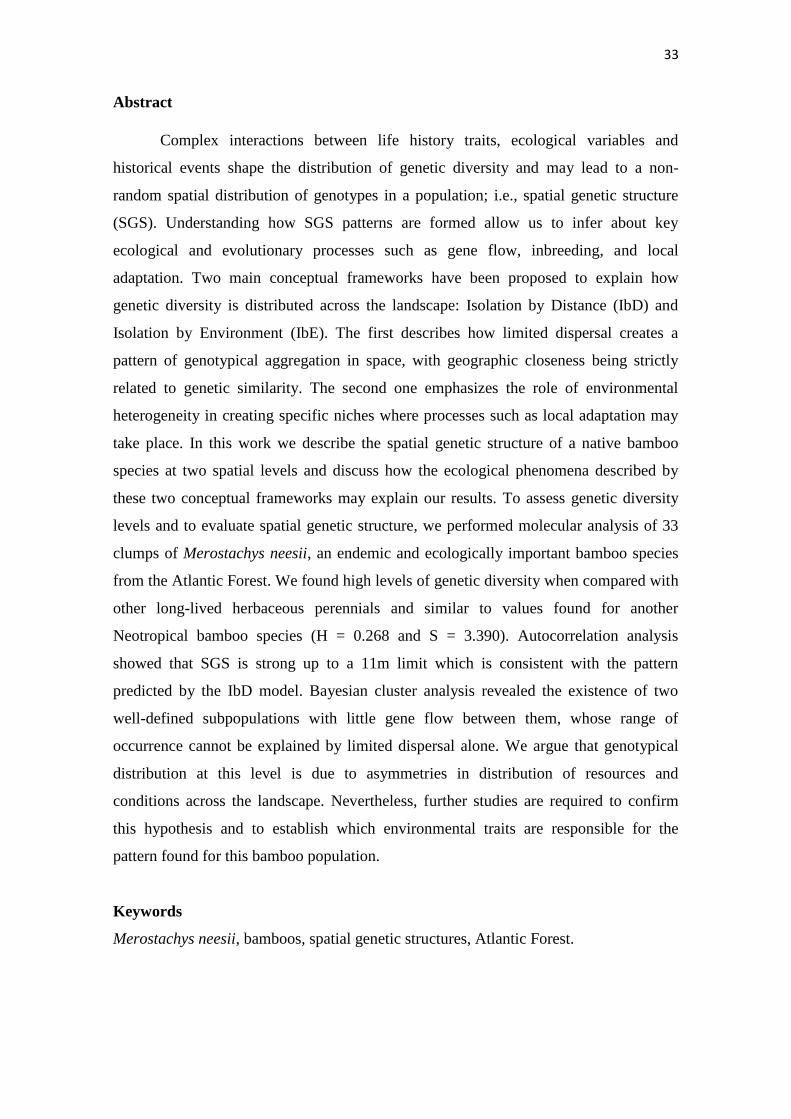
Abstract
Complex interactions between life history traits, ecological variables and
historical events shape the distribution of genetic diversity and may lead to a non-
random spatial distribution of genotypes in a population; i.e., spatial genetic structure
(SGS). Understanding how SGS patterns are formed allow us to infer about key
ecological and evolutionary processes such as gene flow, inbreeding, and local
adaptation. Two main conceptual frameworks have been proposed to explain how
genetic diversity is distributed across the landscape: Isolation by Distance (IbD) and
Isolation by Environment (IbE). The first describes how limited dispersal creates a
pattern of genotypical aggregation in space, with geographic closeness being strictly
related to genetic similarity. The second one emphasizes the role of environmental
heterogeneity in creating specific niches where processes such as local adaptation may
take place. In this work we describe the spatial genetic structure of a native bamboo
species at two spatial levels and discuss how the ecological phenomena described by
these two conceptual frameworks may explain our results. To assess genetic diversity
levels and to evaluate spatial genetic structure, we performed molecular analysis of 33
clumps of Merostachys neesii, an endemic and ecologically important bamboo species
from the Atlantic Forest. We found high levels of genetic diversity when compared with
other long-lived herbaceous perennials and similar to values found for another
Neotropical bamboo species (H = 0.268 and S = 3.390). Autocorrelation analysis
showed that SGS is strong up to a 11m limit which is consistent with the pattern
predicted by the IbD model. Bayesian cluster analysis revealed the existence of two
well-defined subpopulations with little gene flow between them, whose range of
occurrence cannot be explained by limited dispersal alone. We argue that genotypical
distribution at this level is due to asymmetries in distribution of resources and
conditions across the landscape. Nevertheless, further studies are required to confirm
this hypothesis and to establish which environmental traits are responsible for the
pattern found for this bamboo population.
Keywords
Merostachys neesii, bamboos, spatial genetic structures, Atlantic Forest.
34
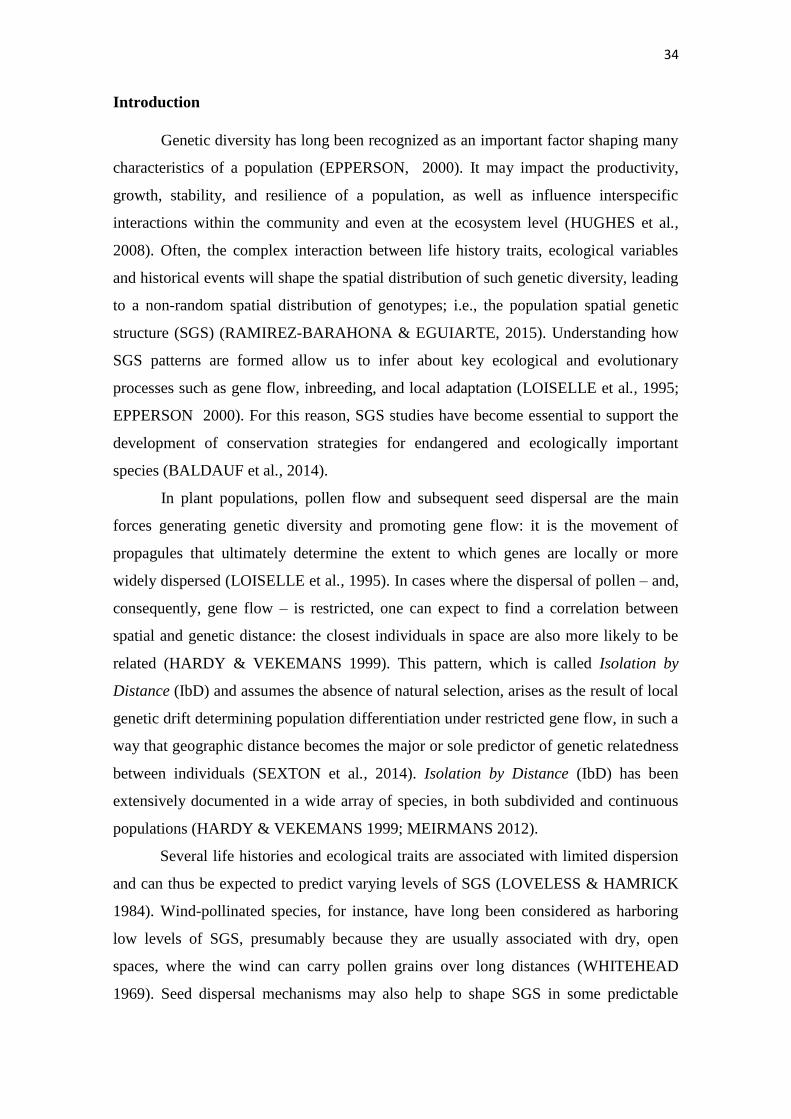
Introduction
Genetic diversity has long been recognized as an important factor shaping many
characteristics of a population (EPPERSON, 2000). It may impact the productivity,
growth, stability, and resilience of a population, as well as influence interspecific
interactions within the community and even at the ecosystem level (HUGHES et al.,
2008). Often, the complex interaction between life history traits, ecological variables
and historical events will shape the spatial distribution of such genetic diversity, leading
to a non-random spatial distribution of genotypes; i.e., the population spatial genetic
structure (SGS) (RAMIREZ-BARAHONA & EGUIARTE, 2015). Understanding how
SGS patterns are formed allow us to infer about key ecological and evolutionary
processes such as gene flow, inbreeding, and local adaptation (LOISELLE et al., 1995;
EPPERSON 2000). For this reason, SGS studies have become essential to support the
development of conservation strategies for endangered and ecologically important
species (BALDAUF et al., 2014).
In plant populations, pollen flow and subsequent seed dispersal are the main
forces generating genetic diversity and promoting gene flow: it is the movement of
propagules that ultimately determine the extent to which genes are locally or more
widely dispersed (LOISELLE et al., 1995). In cases where the dispersal of pollen – and,
consequently, gene flow – is restricted, one can expect to find a correlation between
spatial and genetic distance: the closest individuals in space are also more likely to be
related (HARDY & VEKEMANS 1999). This pattern, which is called Isolation by
Distance (IbD) and assumes the absence of natural selection, arises as the result of local
genetic drift determining population differentiation under restricted gene flow, in such a
way that geographic distance becomes the major or sole predictor of genetic relatedness
between individuals (SEXTON et al., 2014). Isolation by Distance (IbD) has been
extensively documented in a wide array of species, in both subdivided and continuous
populations (HARDY & VEKEMANS 1999; MEIRMANS 2012).
Several life histories and ecological traits are associated with limited dispersion
and can thus be expected to predict varying levels of SGS (LOVELESS & HAMRICK
1984). Wind-pollinated species, for instance, have long been considered as harboring
low levels of SGS, presumably because they are usually associated with dry, open
spaces, where the wind can carry pollen grains over long distances (WHITEHEAD
1969). Seed dispersal mechanisms may also help to shape SGS in some predictable
35
ways: while a gravity-dispersed species will tend to display a strong SGS because
propagules tend to stay close to their parent tree, plants dispersed by birds and large
mammals will show weak genetic structure, because the regular long-distance transport
of seeds tend to promote homogeneity (LOVELESS& HAMRICK, 1984; HARDY et
al., 2006). Other factors related to phenology, breeding system, and floral morphology
may also indirectly impact SGS patterns because they influence how and when gametes
will encounter and what levels of genetic diversity will be generated (LOVELESS &
HAMRICK, 1984).
While IbD remains an important conceptual framework through which we can
formulate and test hypothesis, we must not forget that geography is only one of the
factors shaping a population’s SGS (WANG & BRADBURD, 2014). Landscape
features have been shown to influence spatial distribution of genetic diversity in many
levels – from small variations in soil composition and resource availability, up to
mountain ranges and climatic gradients (TROUPIN et al., 2006; HUBER et al., 2004;
REIS et al., 2015). In fact, the subject of local differentiation of genetic subsets of a
sympatric population that varies according to environmental differences is not recent
(CLAUSEN & HIESEY, 1958; ANTONOVICS 1971). The development of molecular
tools and its constant improvements have allowed analysis at finer scales, sometimes
smaller than few meters or even centimeters (LINHART & GRANT 1996; BIZOUX &
MAHY 2007; MATESANZ et al., 2011). Because plants are sessile organisms, they
rely heavily upon small-scale patterns of variations in soil chemistry, nutrient
availability and light conditions (HUBER et al., 2004). This idea that environmental
variations may shape how genetic diversity is distributed in space; i.e., that genetic
differentiation increases with environmental differences, irrespective of geographic
distance, has been called Isolation by Environment (IbE) (WANG & BRADBURD,
2014).
The link between spatial heterogeneity and genetic diversity is only one of the
many consequences of being a plant, as described by Bradshaw (1972). Other important
consequences that bear importance to this study include their propensity to show
considerable chromosomal flexibility, which often results in polyploid patterns, and
their flexible breeding systems, that allow them to display varying levels of sexual and
asexual reproduction, including the ability to propagate clonally (LINHART & GRANT
1996). The many unfoldings of these traits often have important genetic and ecological
repercussions: the polyploidy can be a major source of genetic novelties, and it can act

36
as a force behind the adaptative prowess of certain plant groups such as Poaceae (Levin
1983; LEVY & FELDMAN 2002). In its turn, clonality and clonal architecture is being
increasingly considered as an important force driving the evolution of certain
reproductive traits such as the delayed flowering of bamboos (TACHIKI et al., 2015).
Given the diversity and complexity of the processes involved in structuring
genetic diversity across a population, it is often advised to researchers that one must
carefully chose in which spatial scale to conduct analysis. Different ecological processes
may be acting simultaneously at different spatial and temporal scales, and may even
influence one another (WIDEN et al., 1994; ESCUDERO et al., 2003). In this sense,
clonal species may be of special relevance when testing hypothesis about SGS because
their very existence takes place in two scales: the genetic entity (genet), that may
sometimes spread across thousands of kilometers, and the vegetative modules of the
genetic individual (ramets) (HÄMMERLI & REUSCH 2003).
Merostachys neesii Rupr. (Poaceae) is a Neotropical bamboo species native to
montane and submontane tropical Atlantic forests (JUDZIEWICZ et al., 1999; Filgueiras
& Shirasuna 2009). As it is typical of many bamboo species, M. neesii has a life cycle
that is characterized by long vegetative periods – of around 30 years – punctuated by
monocarpic gregarious sexual events (JUDZIEWICZ et al., 1999; LONGHI-
WAGNERet al., 2001). During the vegetative phase, M. neesii grows clonally through
short, clump-forming underground rhizomes; during the flowering events, it produces
typical wind-pollinated inconspicuous flowers with an abundance of dust-like pollen
(JUDZIEWICZ et al., 1999; PADGURSCHI et al., unpublished data.). Seeds lack
adaptations to biotic dispersal and tend to fall massively under the parent clump
(Liebsch & Reginato 2009; PADGURSCHI 2014). After seed setting, reproductive
individuals die, opening gaps whose colonisation is a major promoter of diversity in
many communities (WIDMER 1997; GUILHERME et al., 2004). This distinctive series
of events – mass flowering and seed setting followed by the death of the reproductive
individuals – also means that there is almost to none generational overlapping in this
species (STERN et al., 1999). This is a specially interesting property because whatever
SGS is observable in this population will be the reflex of a specific set of ecological
conditions found during the seedling recruitment phase, instead of being the sum of
several overlapping SGS reflecting the processes that took place during the recruitment
of each cohort (ELLNER & HAIRSTON, 1994).

37
Notwithstanding their important role in the community dynamics and their
suitability as genetic models, there is a shortage of information on the reproductive
biology of bamboos, mainly because sexual events are just so rare (JANZEN 1976).
Likewise, there is little available genetic data for this group, and most genetic studies on
tropical grasses focus on a few crop species that have been thoroughly selected by men
(GLAZMANn et al.,1997; GLÉMIN & BATAILLON, 2009). The aim of this study is
to assess genetic diversity of a natural population of an ecologically important bamboo
species, as well as investigate how different ecological processes interact to give rise to
patterns of SGS at different scales. Given the species limited dispersal, we expect to
find a pattern of Isolation by Distance at small spatial scales. We also expect to find
some level of local genetic differentiation at a broader scale, related to the high levels of
heterogeneity typically found in tropical forests. Finally, we expect to find some degree
of polyploidy, which is a pattern commonly reported for bamboos and most grass
species.
Material and Methods
Study site – The study was conducted within 1-ha permanent plot (plot M; see JOLY et
al., 2012), in a portion of Montane Atlantic Forest at the Serra do Mar state park,
municipality of São Luís do Paraitinga, São Paulo state (23º 13’ 18” S, 45º 18’ 36” W).
Altitudes within the plot range from 990 to 1093m (JOLY et al., 2012). The area is
covered by dense ombrophilous vegetation dominated by bamboo clumps
(PADGURSCHI et al., 2011). The climate corresponds to Köppen’s Cfb type, mean
rainfall exceeds 2200mm per year and soil is classified as a dystrophic haplic cambisol
(SALEMI et al., 2013; MARTINS et al., 2015). Topography is very steep (> 30°),
marked by numerous slopes and valleys, including scars of landslides (EISENLOHR et
al., 2013). Although there have been reports of selective logging during the early XX
century, the area displays a physiognomy typical of well preserved forests
(PADGURSCHI et al., 2011).
Study species – Merostachys neesii R. (Poaceae:Bambusoideae) is an endemic bamboo
species of the Bambuseae tribe that occupies montane and submontane Atlantic forests
across a range that goes from southern Bahia state to northern Paraná (Flora do Brasil
2018). It occurs naturally in Neotropical forests, where it may sometimes dominate the
38
landscape and affect density, diversity and local richness of pioneer species
(TABARELLI & MANTOVANI 1999; OLIVEIRA-FILHO et al., 1994). M. neesii
grows clonally through short underground rhizomes of the pachymorph type, with short
internodes through which culms emerge and give rise to tightly packed clumps
(PADGURSCHI 2014). Culms can reach up to 10m of length and 3cm of diameter
(LONGHI-WAGNERet al., 2001). After about 30 years of vegetative growth, a massive
sexual event occurs, and culms produce abundant, albeit inconspicuous, flowers of the
spiklet type. These flowers, as do typically wind-pollinated species, produce copious
amounts of fine, light weight pollen (JUDZIEWICZ et al., 1999). Seeds are small,
gravity-dispersed caryopsis that are sometimes eaten by rodents (CESTARI &
BERNARDI, 2011; Shirasuna & Filgueiras, 2013). After seed setting, all reproductive
culms die, an event that has been described as ‘large-scale disturbances’ and bears great
importance to forest dynamics (GONZÁLEZ et al., 2002).
Sampling – We conducted an asystematic sampling of 31 clumps across the whole plot.
We considered that culms that disted less than 0.5m from one another were part of the
same genet (clump) (PADGURSCHI et al., in prep.), and that culms apart more than 1m
from another one as different individuals. Ortogonal coordinates were taken for each
clump. We collected leaf tissue samples from one random culm within each clump. All
samples were brought to the laboratory within 12-hours after collected and kept in a bio-
freezer at -80°C until DNA extraction.
Molecular analysis – DNA samples were extracted using the CTAB method (DOYLE
& DOYLE 1990). Genetic variation and structure were assessed using nine polymorphic
microssatelite markers developed specifically for M. neesii following the Billote et al.,
(1999) protocol. Primer characterization and detailed procedures can be seen in Borges
et al., (Chapter 1). Samples were previously analyzed through agarose gel
electrophoresis to confirm SSR amplification and then genotyped using the silver-
stained 6% denaturing polyacrylamide gel technique proposed by Creste et al., (2001),
using a 10 pb ladder to allow for accurate determination of band size.
Statistical analysis – Because of the challenges involved in determining exact allelic
dosages in polyploid species such as M. neesii, microssatelite markers were treated as
multilocus fingerprints and inserted into a binary matrix where each allele -hence

39
referred to as markers – was scored present or absent. For this same reason, we did not
test for Hardy-Weinberg equilibrium. We chose to calculate the following basic genetic
diversity indexes: number of multilocus genotypes, Nei’s gene diversity (H), Shannon-
Wiener diversity index (S) and Simpson’s diversity index (D). While D simply
represents the probability that two randomly chosen bands are identical, S also takes
into account the evenness of genetic variation within the population; that is, if a single
genotype dominates most of the samples or if genotypes are evenly distributed.
Diversity indexes were calculated using the poppr statistical package inside the R
environment (KAMVAR et al., 2014).
In order to verify the existence of genetic differentiation patterns that might be
related to spatial discontinuities in resource distribution, a Bayesian cluster analysis was
performed using the STRUCTURE software (PRITCHARD et al., 2000) based on
haploid (presence/absence of bands) data. Ten independent runs were performed for
each of six values of K (number of clusters), with 250000 burn-in periods and 500000
Markov Chain Monte Carlo iterations. We then used the program Structure Harvester
(EARL & VONHOLDT 2012) to determine the most reasonable K, based on ΔK
values.
To further explore how genetic variation of the population is distributed, we
calculated genetic distances for each pair of individuals as suggested by Bruvo et al.,
(2004) – an approach that takes into account mutation events and is better suited to
polyploid species -, and used the resulting data matrix to run a Principal Component
Analysis (PCA). To estimate the relationship between genetic and geographic distances,
we performed a Mantel test whose significance was assessed through 19999
permutations of rows and columns, also based on Bruvo’s distance. Genetic distance
calculations, Mantel test and PCA were performed using the Polysat R package
(CLARK & JASIENIUk 2011). Gst value, calculated based on the results of both
Bayesian and PCA analysis, was also determined using Polysat package.
Then, in order to investigate fine-scale genetic structure and test for Isolation by
Distance, we used the software SPAGEDI to draw an autocorrelogram between kinship
values and geographic distance for all pairs of individuals (LOISELLE et al., 1995;
HARDY & VEKEMANS 2002). In order to refine our analysis to the smallest scale
possible, we established 54 distance classes whose upper limits ranged from 3m to
107m. These limits were chosen in order to create homogeneous distance classes; that
is, classes that contain the similar number of pairs each.

40
Results
Of the 13 amplified primers that yielded clear bands, nine were polymorphic,
which means a 69% rate of polymorphism. A total of 83 bands were observed, with an
average of 9.2 bands per locus. A persistent pattern of multi-banding was detected in all
loci, with up to six bands per sample in some cases, which suggests a highly polyploid
species. Upon analysis with all nine polymorphic markers, we were able to detect 30
multilocus genotypes at the clump level, which is a slight departure from the number of
total sampled clumps. Nei’s gene diversity (H) for these samples was 0.268, while
Shannon-Wiener diversity index (S) reached 3.390 and the complement of Simpson’s
diversity index (D) totaled 0.966.
Autocorrelation analysis between kinship coefficients and geographic distance
revealed a strong fine-scale genetic structure in this population, with maximum kinship
values occurring within the first distance class (1.0m – 3.2m). From then on, this
tendency towards genetic structure plummets steeply and ceases to exist in a significant
manner around 12m of distance (Figure 1). Kinship values were not significantly
different from zero beyond these distance limits, except for a slight positive correlation
at 15.5m and negative correlations at 80.9 and 92.2m.
Figure 1 Autocorrelogram showing the relationship between Kinship values and
pairwise distance class
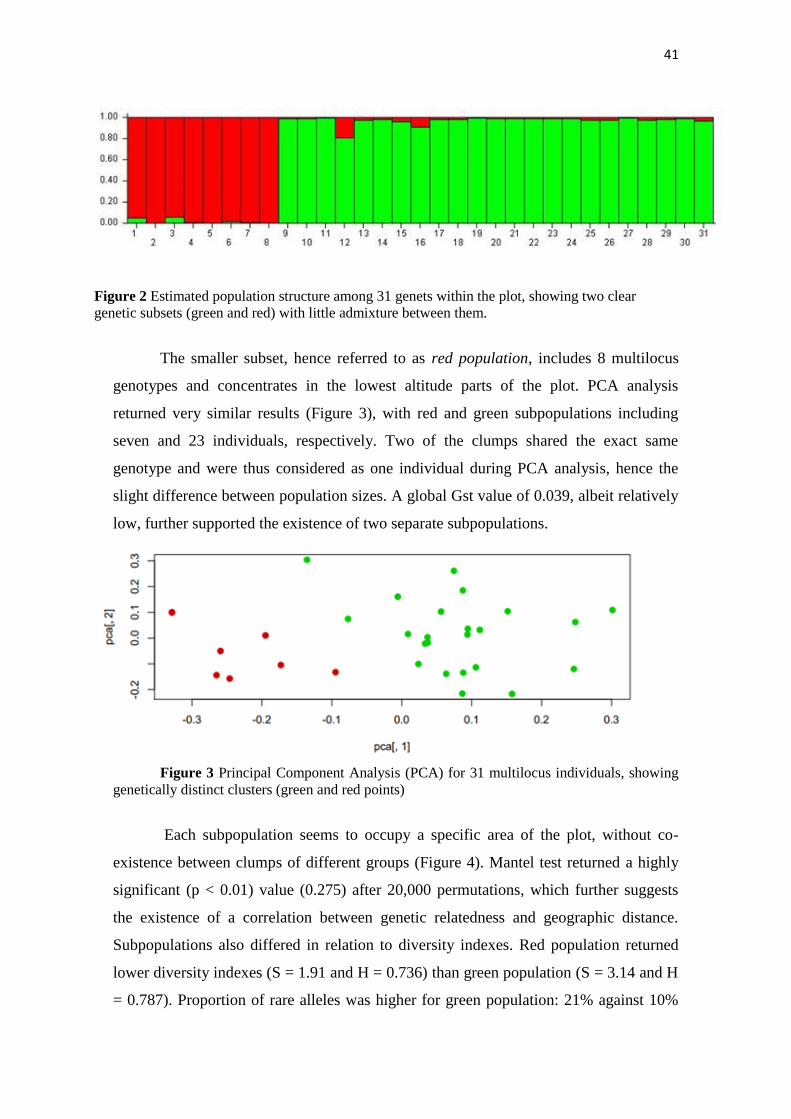
Bayesian likelihood analysis of population structure at the genet level supported
the existence of two well-defined subpopulations with little gene flow between them
(Figure 2). This was supported by the fact that the highest ΔK value was found when K
= 2. The biggest subset, hence referred to as green population, included 23 individual
multilocus genotypes and spreads throughout most of the plot.
41
Figure 2 Estimated population structure among 31 genets within the plot, showing two clear
genetic subsets (green and red) with little admixture between them.
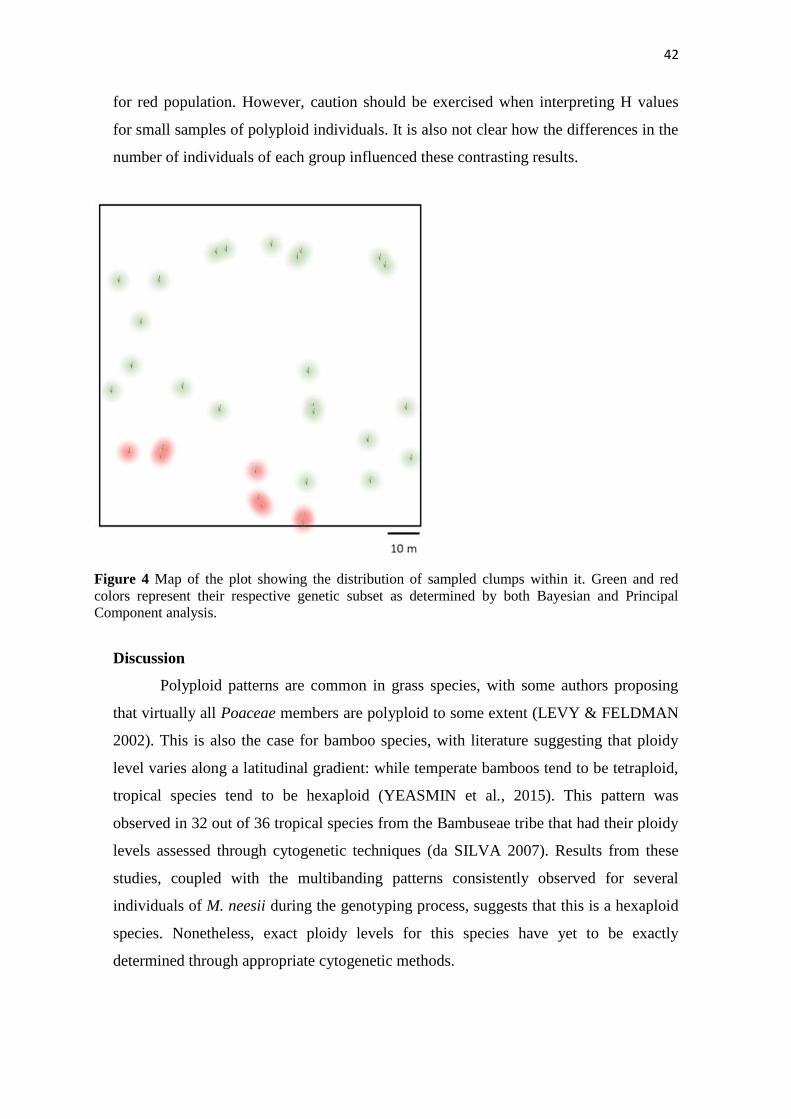
The smaller subset, hence referred to as red population, includes 8 multilocus
genotypes and concentrates in the lowest altitude parts of the plot. PCA analysis
returned very similar results (Figure 3), with red and green subpopulations including
seven and 23 individuals, respectively. Two of the clumps shared the exact same
genotype and were thus considered as one individual during PCA analysis, hence the
slight difference between population sizes. A global Gst value of 0.039, albeit relatively
low, further supported the existence of two separate subpopulations.
Figure 3 Principal Component Analysis (PCA) for 31 multilocus individuals, showing
genetically distinct clusters (green and red points)
Each subpopulation seems to occupy a specific area of the plot, without co-
existence between clumps of different groups (Figure 4). Mantel test returned a highly
significant (p < 0.01) value (0.275) after 20,000 permutations, which further suggests
the existence of a correlation between genetic relatedness and geographic distance.
Subpopulations also differed in relation to diversity indexes. Red population returned
lower diversity indexes (S = 1.91 and H = 0.736) than green population (S = 3.14 and H
= 0.787). Proportion of rare alleles was higher for green population: 21% against 10%
42
for red population. However, caution should be exercised when interpreting H values
for small samples of polyploid individuals. It is also not clear how the differences in the
number of individuals of each group influenced these contrasting results.
Figure 4 Map of the plot showing the distribution of sampled clumps within it. Green and red
colors represent their respective genetic subset as determined by both Bayesian and Principal
Component analysis.
Discussion
Polyploid patterns are common in grass species, with some authors proposing
that virtually all Poaceae members are polyploid to some extent (LEVY & FELDMAN
2002). This is also the case for bamboo species, with literature suggesting that ploidy
level varies along a latitudinal gradient: while temperate bamboos tend to be tetraploid,
tropical species tend to be hexaploid (YEASMIN et al., 2015). This pattern was
observed in 32 out of 36 tropical species from the Bambuseae tribe that had their ploidy
levels assessed through cytogenetic techniques (da SILVA 2007). Results from these
studies, coupled with the multibanding patterns consistently observed for several
individuals of M. neesii during the genotyping process, suggests that this is a hexaploid
species. Nonetheless, exact ploidy levels for this species have yet to be exactly
determined through appropriate cytogenetic methods.

43
The high ploidy level of M. neesii has both ecological and methodological
consequences: polyploidy is often associated with invasive and overall early
successional species, which may explain the success of M. neesii in dominating the
physiognomy of this part of the forest (STEBBINS 1985; OLIVEIRA-FILHO et al.,
1994). It also means that we must pay close attention to the ploidy of the species when
analyzing genetic data because traditional diversity indexes were mainly developed for
diploid models and may not be applicable to polyploids (OBBARD et al., 2006).
Few studies assessing genetic diversity of bamboo species have been published
to date, making it difficult to establish a pattern against which to compare the data
obtained for M. neesii. Nei’s gene diversity (H) for the whole M. neesii population,
0.268, is similar to the genetic diversity value found for another Neotropical bamboo
species (He = 0.273) (ABREU et al., 2014). The value of the complement of Simpson’s
diversity index for Merostachys neesii (D= 0.966) is also higher then the average value
for several self-compatible clonal species (D=0.86; HONNAY & JACQUEMYN 2008).
Although to date there has been no study comparing genetic diversity levels of species
with overlapping versus nonoverlapping generations, the role of overlapping
generations in maintaining genetic variation in fluctuating environments is well
established (ELLNER & HAIRSTON, 1994). The fact that a single cohort may harbour
as much – if not more – genetic diversity than populations comprised of several
overlapping generations, suggests that Neotropical bamboo species have some
combination of ecological traits that maximize their levels of genetic diversity.
High genetic diversity levels have been reported for several clonal species,
sometimes as high as strictly sexual ones, especially in cases where there is alternation
between vegetative growth and sexual events (WIDEN et al., 1994). Mixed-mating
woody perennial species have also been shown to harbor more genetic diversity than
their non-woody counterparts (Hamrick et al., 1994; BROADHURST et al., 2016).
Furthermore, in clonal plants, somatic mutations may arise in some individuals and
spread throughout the population by means of assexual propagation (WHITHAM &
SLOBODCHIKOFF, 1981; KING & SCHAAL, 1990). However, while very important
in promoting genetic diversity in long-lived and/or manly assexual species, the extent to
which somatic mutations may impact the genetic diversity of M. neesii is not clear
(KING & SCHAAL 1990; GROSS et al., 2012). Finally, hybridisation events may also
contribute to a greater genetic diversity by combining different genomes and generating
novel genetic combinations (VALLEJO-MARÍN & LYE, 2013). In a recent study,

44
Triplett & Clark (2010) presented numerous evidence that hybridization among bamboo
genera is not only possible, but that it constitutes a major force driving evolution and
speciation across the temperate clade. The same has been found for tropical bamboo
species, albeit mainly paleotropical (THAKUR ET AL., 2016) In fact, hybridisation
events have been proposed as the main mechanism behind the much prevalent
polyploidy observed among grass species (STEBBINS, 1956). All these factors may
explain the prevalence of high levels of genetic diversity in Merostachys neesii, as well
as other bamboo and clonal grass species (GUTIERREZ-OZUNA et al., 2009; ABREU
et al., 2014).
High levels of genetic diversity are commonly associated with improved
adaptability to new environments and an overall increment in a species’ fitness (REED
& FRANKAN 2003). It is also a common measure of a population’s ability to persist in
the community, specially under stressfull or changing environments (LAVERGNE &
MOLOFSKY, 2007; HUGHES et al., 2008). Our findings regarding the genetic
diversity levels of this population of M. neesii may thus partially explain the abundance
of this species in such an heterogeneous patch of tropical forest. Other ecological
processes may also be impacted by the high level of genetic diversity observed for M.
neesii: Crutsinger et al.,(2008) and Hughes & Stachovicz (2004) demonstrated that
genetic diversity of dominant species enhances the resistance of the ecossystem to
disturbance and establishment of invasive species, and genotypic richness of a plant
species have been showed to positively affect species richness levels of herbivore
species such as arthropods (CRUTSINGER, 2006). Further studies are nevertheless
needed to direclty test the effects of the genetic diversity of M. neesii on the community.
The strong pattern of fine-scale genetic structure is probably a result of restricted
seed dispersion and pollen flow such as predicted by the Isolation by Distance model
(LOISELLE, 1995). Although, as mentioned above, wind-pollinated species tend to
exhibit lower levels of SGS, this may not be the case when they occur inside rainforests:
its dense structure forming a tapestry of leaves and trunks serves as a barrier to pollen
flow, and the intense, year-round humidity renders pollen grains damp and heavy,
making it difficult for them to be carried away by the wind (WHITEHEAD, 1969;
DICK, 2008). Restricted pollen flow, combined with gravity-dispersed seeds, will
naturally result in neighboring clumps being genetically closer than clumps far apart, as
is clearly shown by the autocorrelogram.

45
The existence of two distinct, spatially-segregated subpopulations within a 1-ha
plot naturally presupposes the existence of an obstacle that prevents gene flow between
members of different groups, or at least an important enough environmental factor that
would restrict certain genotypes to specific sites (ORSINI et al., 2013). While
geographically close clumps of M. neesii are more likely to belong to the same group,
restricted dispersal alone cannot explain the existence of two well defined
subpopulations. It also cannot explain what confines each cluster to their range of
occurrence beyond the 11m limit of significant kinship.
In tropical forests, microtopographic variation seems to be an important source
of environmental heterogeneity, as it is generally associated with differences in soil
depth and composition, water content, drainage and light availability (CAMPOS et al.,
2011). In another study also conducted with M. neesii, Padgurschi (2014) noticed that
pronounced irregularities in the terrain caused a decrease in luminosity in the lower
parts of the plot, where density of individuals is also smaller and where our red
population is mostly contained. The soil in this lower part of the plot also displayed
lower effective porosity, which may translate into higher water saturation – a factor that
may negatively impact the establishment of bamboo clumps (KIEHL, 1979;
FRANKLIN & BOWMAN, 2003; PADGURSCHI, 2014). Differences in both light
conditions and water availability have been shown to represent a strong enough force to
drive significant population differentiation at genetic levels (JACQUEMYN et al.,
2005). Furthermore, in a 2012 study, Lima et al. noted that Gadua tagora, a native
bamboo species, occurs more frequently in clayey soils, probably due to preferential
establishment of clumps in these areas.
Whichever environmental variations may exist between different sites of the
plot, they may be enough to represent a significant selective pressure, preventing the
establishment of immigrants of a certain genotype into a site that is dominated by
another set of genes, reinforcing a tendency towards environment-based genetic
structuration (ORSINI et al., 2013). This pattern of spatial differentiation in microscale
has been extensively documented for several plant species; one of the most elegant and
detailed of such studies involved plants that occupy extreme soil conditions such as
those contaminated with heavy metals (ANTONOVICS, 1971). In his classical paper,
the author demonstrated that under this harsh scenario, a continuous population will be
structured in such a way that individuals that are tolerant to a certain contaminant will
only occupy sites that have high levels of this particular contaminant, not being able to
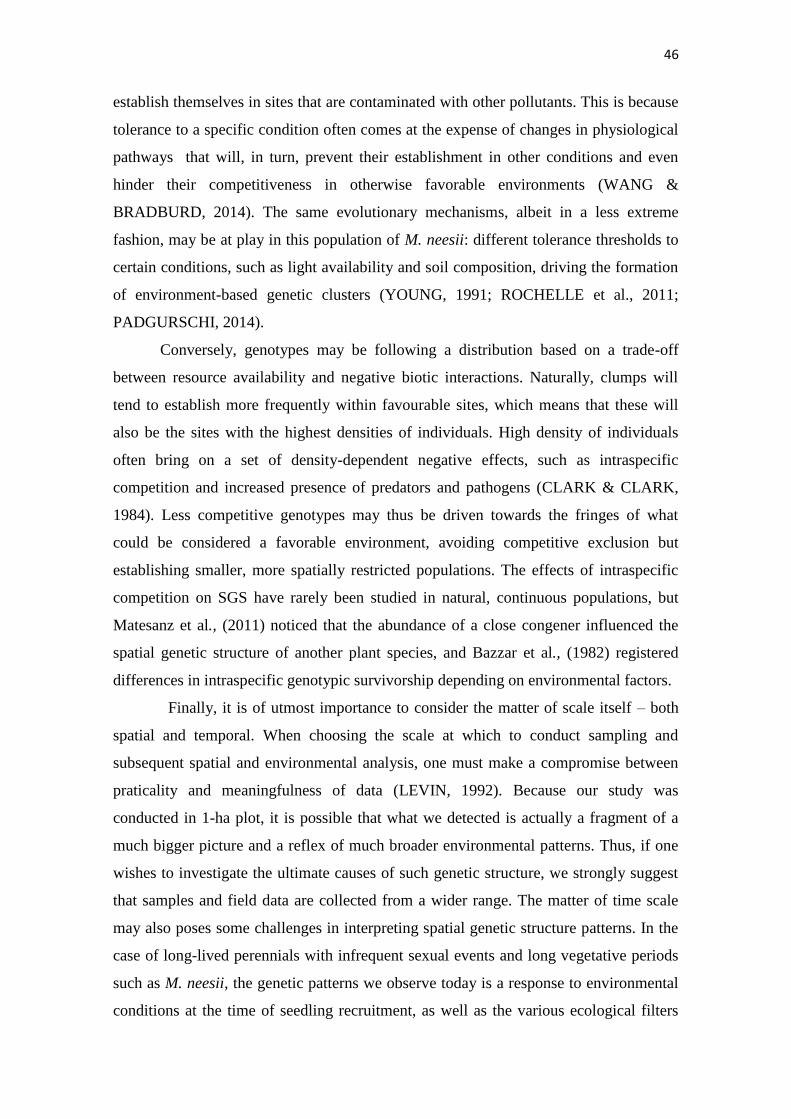
46
establish themselves in sites that are contaminated with other pollutants. This is because
tolerance to a specific condition often comes at the expense of changes in physiological
pathways that will, in turn, prevent their establishment in other conditions and even
hinder their competitiveness in otherwise favorable environments (WANG &
BRADBURD, 2014). The same evolutionary mechanisms, albeit in a less extreme
fashion, may be at play in this population of M. neesii: different tolerance thresholds to
certain conditions, such as light availability and soil composition, driving the formation
of environment-based genetic clusters (YOUNG, 1991; ROCHELLE et al., 2011;
PADGURSCHI, 2014).
Conversely, genotypes may be following a distribution based on a trade-off
between resource availability and negative biotic interactions. Naturally, clumps will
tend to establish more frequently within favourable sites, which means that these will
also be the sites with the highest densities of individuals. High density of individuals
often bring on a set of density-dependent negative effects, such as intraspecific
competition and increased presence of predators and pathogens (CLARK & CLARK,
1984). Less competitive genotypes may thus be driven towards the fringes of what
could be considered a favorable environment, avoiding competitive exclusion but
establishing smaller, more spatially restricted populations. The effects of intraspecific
competition on SGS have rarely been studied in natural, continuous populations, but
Matesanz et al., (2011) noticed that the abundance of a close congener influenced the
spatial genetic structure of another plant species, and Bazzar et al., (1982) registered
differences in intraspecific genotypic survivorship depending on environmental factors.
Finally, it is of utmost importance to consider the matter of scale itself – both
spatial and temporal. When choosing the scale at which to conduct sampling and
subsequent spatial and environmental analysis, one must make a compromise between
praticality and meaningfulness of data (LEVIN, 1992). Because our study was
conducted in 1-ha plot, it is possible that what we detected is actually a fragment of a
much bigger picture and a reflex of much broader environmental patterns. Thus, if one
wishes to investigate the ultimate causes of such genetic structure, we strongly suggest
that samples and field data are collected from a wider range. The matter of time scale
may also poses some challenges in interpreting spatial genetic structure patterns. In the
case of long-lived perennials with infrequent sexual events and long vegetative periods
such as M. neesii, the genetic patterns we observe today is a response to environmental
conditions at the time of seedling recruitment, as well as the various ecological filters
47
acting during the first years leading to plant establishment (PADGURSCHI, 2014).
These conditions may not be the same at the time of the sampling, making it difficult to
distinguish the actual forces acting in the genetic structure, as well as preventing us
from realizing the occurrence of any historical events or disturbances that may have
taken place during the initial stages of seedling recruitment and been a fundamental
force in causing the separation of the two clusters.
Our results thus suggest that, for this population, several ecological processes act
simoultaneously at different spatial and time scales. While genetic structure at the scale
of a few meters seems to be mostly a result of limited dispersal of propagules, such as
described in the classic model of Isolation-by-Distance, the exact forces behind the
formation of bigger genetic clusters are not completely clear. We nonetheless propose
that this broader geographic distribution of genotypes is related to differences in
resource availability and plant density, which may be generating a pattern of
environment-based genotypic distribution as described by the Isolation-by-Environment
model. Further studies are necessary to confirm this hypothesis and determine which
environmental variables or combination of variables are preventing gene flow between
subpopulations, as well as to verify the extent to which spatial and temporal scales
affect our perception of these genetic patterns.
The results generated in the present study represent an advancement in the
knowledge of genetic status of Neotropical bamboo species and contribute to further our
understanding of how they interact with their environment. This may help in
developping conservation strategies that aim to preserve not only one species in
particular, but to maintain the ecological interactions that promote the overall balance of
the community.
ACKNOWLEDGMENTS
We thank the students and technicians engaged in labwork, in special Lívia Souza,
Carla SILVA and Aline Moraes; Alessandro Alves for the critical help in the statistical
analysis of the data and its interpretation; the Serra do Mar State Park, Santa Virgínia
Nucleus, for logistical support; and to the field technician Renato Belinelo for his
empirical knowledge of Atlantic Forest which helped us during all the field trips. The
research was performed with permits COTEC/IF 010.323/2013, 002.766/2013 and
010.631/2013 and IBAMA/SISBIO #33217. This research was supported by the São
Paulo Research Foundation (Fapesp) via Biota/Fapesp Program grants (2003/12595-7,

48
2008/50824-1, 2012/51509-8, 2012/51872-5 and CNPq/PELD 403710/2012-0); by the
CNPq/CAPES via M.Sc. fellowship to the first author; and by the University of
Campinas (Unicamp). We acknowledge helpful comments from two reviewers, which
have improved the manuscript.

49
CAPÍTULO 3
FINE-SCALE GENETIC STRUCTURE OF MEROSTACHYS NEESII CLUMPS
Liana G.Borges 1
, Maíra de C. G. PADGURSCHI 1, Fábio A. Matos
2, Anete P. Souza
1,2
1Departamento de Biologia Vegetal, Instituto de Biologia, Universidade Estadual de
Campinas, P.O. Box 6109, 13083-970 Campinas, São Paulo, Brazil
2Centro de Biologia Molecular e Engenharia Genética, Universidade Estadual de
Campinas, P.O. Box 6010, 13083-875 Campinas, São Paulo, Brazil
Email addresses: LGB: [email protected], MCGP:[email protected], FMA:
[email protected] APS: [email protected]
To be submitted to the journal Plant Ecology

50
Abstract
Clonal organisms may be perceived in two levels: the genet, composed of all tissues
originating from one zygote, and their modular shoots, or ramets. This organization is at
the core of what makes clonality an ecologically important life history trait; on the other
hand, it also means that individuality is an ambiguous concept among these species.
This fact should be considered when studying populations of clonal plants because what
may be perceived as one macroscopic individual may include several separate
genotypes. Here we use microssatelite markers to examine the inter-ramet genetic
structure of a native bamboo, Merostachys neesii. Our aim was to investigate the
prevalence of multiclonality among clumps of this Neotropical species and discuss the
most probable mechanisms through which this phenomenon may arise. We collected
two to five culms from each of 17 clumps from a portion of Montane Atlantic Forest in
Southeastern Brazil. Each individual culm was genotyped and inserted into a binary
matrix, after which we performed an UPGMA analysis of Jaccard’s distance to examine
the genetic relationship between the ramets. The results revealed that while over 70% of
the clumps were multiclonal, non-identical ramets belonging to the same clump were
genetically much closer among themselves than their neighbors were. We propose that
the most likely mechanism that explains this pattern is the limited dispersal of
propagules observed in this species, which results in siblings establishing very close to
each other. This process may be related to a broader evolutionary strategy that has been
proposed to explain the life cycle of bamboos.
Key-words: Woody bamboos, inter-ramet, clonality
51
Introduction
Clonality is a life history trait associated with sessile organisms from a wide
array of taxa and habitats, and is defined as the capacity to produce vegetative offspring
from a single ancestor (BECHELER et al., 2014; DONG et al., 2014). Species may be
asexual, relying only on vegetative growth to establish populations, or they may possess
a mixed system that combines, at varying levels, both vegetative growth and sexual
recombination (BECHELER et al., 2014). In both cases, clonal individuals are
organized in two levels: the genetic individual, or genet, composed of all tissues
originating from one zygote, and the modular shoots, or ramets, that are more or less
independent parts of the genet (ERIKSSON, 1993). Because clonal individuals may be
recognized at these two levels, the very concept of individuality itself is a complex,
ambiguous one when dealing with such species (SANTELICES, 1999).
The ecological benefits of clonal growth are related precisely to these species’
ability to create what has been called cooperative extensions of their individuality
(FRANKLIN, 2008). Through ramet extension, clonal plants can better harvest patchily
distributed resources and share the mortality risks to the genet among several ramets,
and even buffer themselves from spatial and temporal variations in resource availability
– abilities that are especially useful in highly heterogeneous habitats (CHESSON &
PETERSON, 2002). Therefore, clonal populations may benefit from the improved
fitness brought by this life strategy to succeed in highly heterogeneous and/or disturbed
environments (OLIVEIRA-FILHO et al.,1994), sometimes up to the point of becoming
ecological threats (GUTIERREZ-OZUNA et al., 2009).
Merostachys neesii Rupr. (Poaceae: Bambusoideae) is a Neotropical bamboo
species native to montane and submontane tropical Atlantic forests, where it forms large
clumps that may influence species richness and diversity in those communities
(TABARELLI & MANTOVANI 2000). Its life cycle is characterized by long
vegetative periods punctuated by massive gregarious flowering events (JUDZIEWICZ
et al., 1999; PADGURSCHI, 2014). During its vegetative phase, M. neesii propagates
through short underground rhizomes that give rise to dense, tightly aggregated clumps
of culms that remain physiologically connected, as in a typical phalanx strategy
(FISCHER et al., 2004). The actual physical limits of each genet, however, are not so
straightforward: because rhizomes are buried underground, one has to rely on eyesight
to infer where a clump ends and the next one starts; i.e., they must rely on a
52
macroscopic perception of individuality (SANTELICES, 1999). This approach, while
intuitive, may not reflect the reality that clumps perceived as one genet may sometimes
actually be a collection of several different genotypes (a multiclonal clump).
Franklin (2008) observed this phenomenon in a study conducted with Bambusa
arnhemica, a tropical bamboo species, whose clumps were found to include up to five
different genotypes – thus contradicting the idea that one clump equals one genotype. LI
et al., (2012) found the same result for another grass species, and this pattern of
multiclonality have been observed repeatedly for a multitude of clonal plants
(WAYCOTT 1995; DEMCHIK et al., 2016). The possibility of multiclonality is
especially important in studies looking into genetic diversity levels at small scales: if
clumps that contain several genotypes are sampled as one genetic individual, a great
deal of information is being left out of the analysis, thus artificially altering diversity
indexes. Analysing within-clump structure may also help to shed light on the biological
and ecological function of the clumping habit and how it relates to other reproductive
traits (WHITHAM & SLOBODCHIKOFF, 1981; FRANKLIN, 2008).
In this work, we use microsatellite markers to examine the genetic structure of
M. neesii clumps to determine if their macrostructure resonates with their genetic
identity; i.e., if what is perceived as a clump is one genetic individual or a composite of
genotypes. We also explore the genetic relation among genets and how this relates to
the mechanisms through which multiclonal clumps may arise in a population. Our
results may help future ecological and genetic studies in clonal plants by further
clarifying the limits between each level of clonal identity, allowing researchers to make
an informed choice on which type of analysis they want to pursue. Finally, we hope to
improve the understanding about the evolution of some of the traits that make the life
cycle of bamboos such a peculiar matter.
Material and methods
Study species
Merostachys neesii Rupr. (Poaceae: Bambusoideae) is a Neotropical bamboo
species whose range of occurrence spans from southern Bahia to Paraná state,
occupying mostly montane and submontane altitudes. After around 30 years of
vegetative propagation through short (<50cm) underground rhizomes of the

53
pachymorph type, massive synchronous flowering ensues (PADGURSCHI - not
published data). Flowers are typical grass spikelets without adaptations to biotic
pollination and produce an abundance of fine, dust-like pollen. Seeds are small,
nutritious caryopsis that falls massively under the parent tree, seemingly lacking
dispersal agents (JUDZIEWICZ et al., 1999; PADGURSCHI 2014). After seed setting,
parent plants quickly die, causing the opening of gaps in the canopy (JANZEN 1976;
JUDZIEWICZ et al., 1999), an event that has been shown to bear great importance to
the forest structure and diversity (OLIVEIRA-FILHO et al., 1994).
Study area
The present study was conducted within 1-ha permanent plot (JOLY et al., 2012)
in a portion of Montane Atlantic Forest at the Serra do Mar state park (PESM, in
Portuguese), São Paulo state, Brazil. The plot is covered by dense ombrophilous
vegetation, mostly dominated by bamboo clumps of varying sizes (PADGURSCHI et
al., 2011; JOLY et al., 2012). Topography is very steep and irregular, traits that are
directly linked to the high rates of disturbance and environmental heterogeneity that
characterize this part of the forest (EISENLOHR et al., 2013). The climate is of
highland subtropical variety (Cfb type), and annual rainfall exceeds 2200mm per year.
Sampling
Following Padgurschi (2014), we assumed that the neighboring culms that were
less than 50cm apart belonged to the same clump. To avoid re-sampling of genets, we
established a minimal distance limit of 1m between sampled clumps, which were
random selected within the plot. Leaf tissue samples were collected from two to five
individual culms from each of 17 clumps. Orthogonal coordinates were taken from each
discrete clump; culms from a same clump were considered as having the same
coordinates. Each ramet received an ID number, which was used to identify the samples
during analysis.
Molecular & statistical analysis
DNA samples were extracted using the CTAB method (DOYLE & DOYLE,
1990). Genetic variation among ramets was assessed using nine polymorphic
microsatellite markers developed specifically for M. neesii following the Billote et al.,
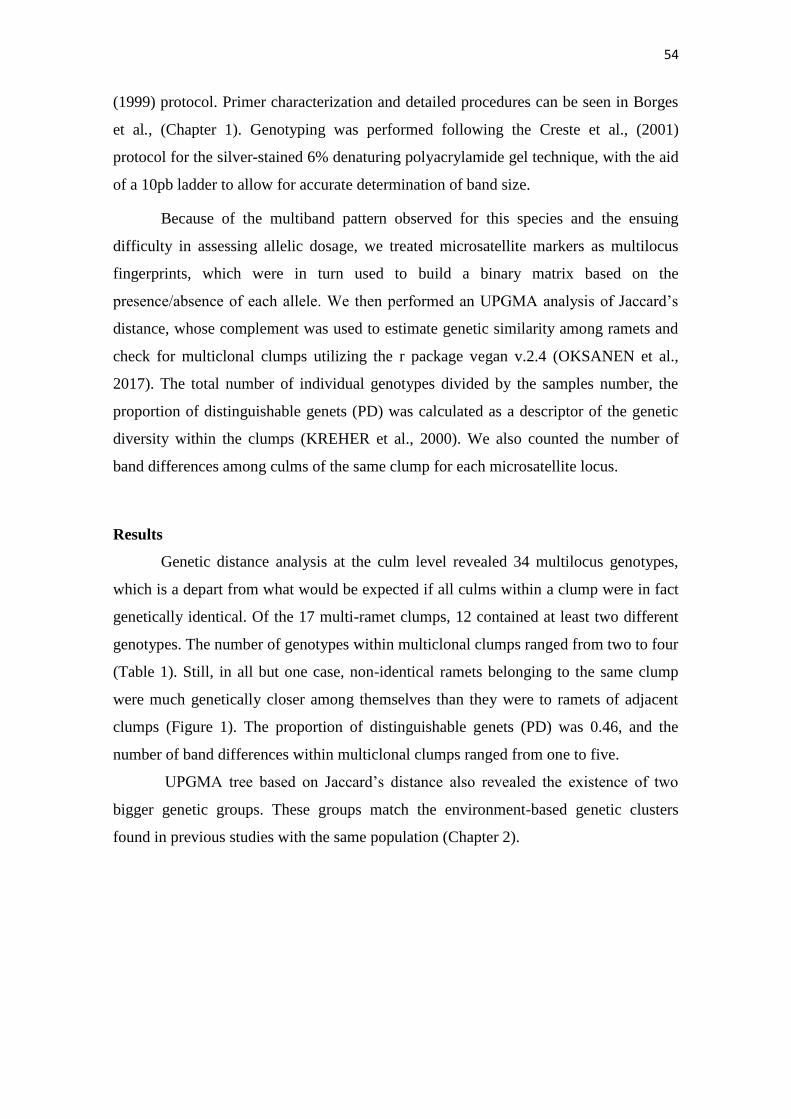
54
(1999) protocol. Primer characterization and detailed procedures can be seen in Borges
et al., (Chapter 1). Genotyping was performed following the Creste et al., (2001)
protocol for the silver-stained 6% denaturing polyacrylamide gel technique, with the aid
of a 10pb ladder to allow for accurate determination of band size.
Because of the multiband pattern observed for this species and the ensuing
difficulty in assessing allelic dosage, we treated microsatellite markers as multilocus
fingerprints, which were in turn used to build a binary matrix based on the
presence/absence of each allele. We then performed an UPGMA analysis of Jaccard’s
distance, whose complement was used to estimate genetic similarity among ramets and
check for multiclonal clumps utilizing the r package vegan v.2.4 (OKSANEN et al.,
2017). The total number of individual genotypes divided by the samples number, the
proportion of distinguishable genets (PD) was calculated as a descriptor of the genetic
diversity within the clumps (KREHER et al., 2000). We also counted the number of
band differences among culms of the same clump for each microsatellite locus.
Results
Genetic distance analysis at the culm level revealed 34 multilocus genotypes,
which is a depart from what would be expected if all culms within a clump were in fact
genetically identical. Of the 17 multi-ramet clumps, 12 contained at least two different
genotypes. The number of genotypes within multiclonal clumps ranged from two to four
(Table 1). Still, in all but one case, non-identical ramets belonging to the same clump
were much genetically closer among themselves than they were to ramets of adjacent
clumps (Figure 1). The proportion of distinguishable genets (PD) was 0.46, and the
number of band differences within multiclonal clumps ranged from one to five.
UPGMA tree based on Jaccard’s distance also revealed the existence of two
bigger genetic groups. These groups match the environment-based genetic clusters
found in previous studies with the same population (Chapter 2).
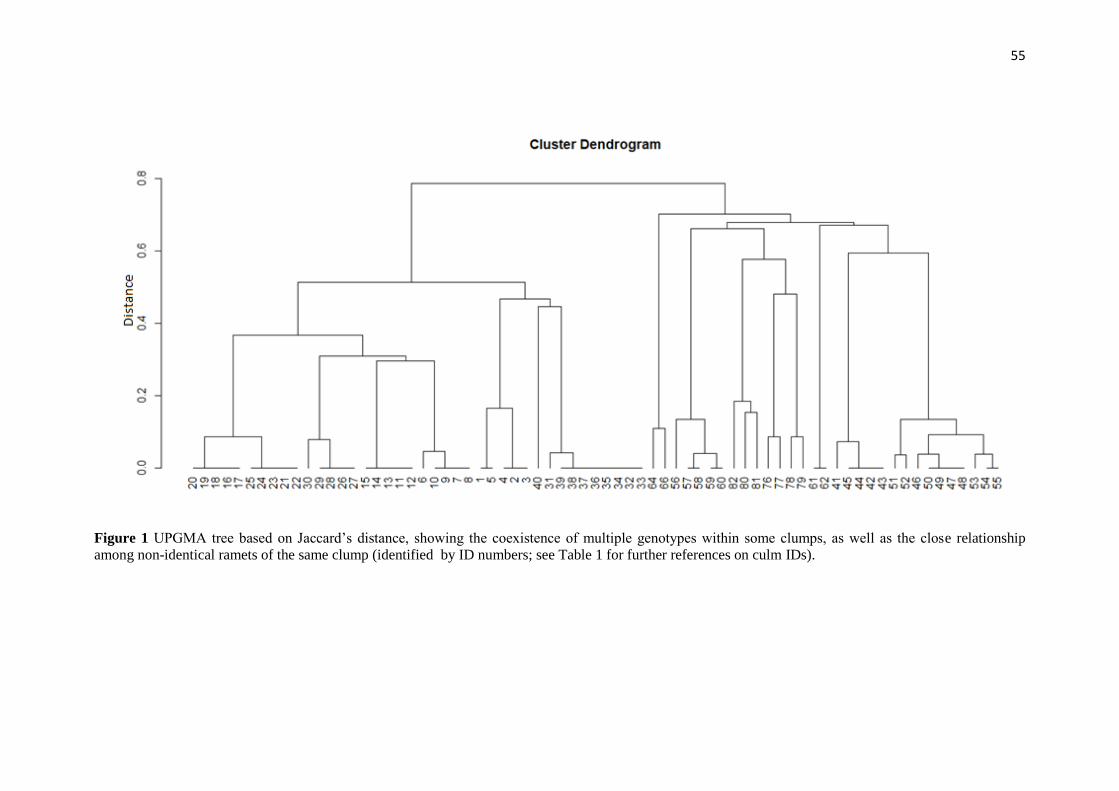
55
Figure 1 UPGMA tree based on Jaccard’s distance, showing the coexistence of multiple genotypes within some clumps, as well as the close relationship
among non-identical ramets of the same clump (identified by ID numbers; see Table 1 for further references on culm IDs).
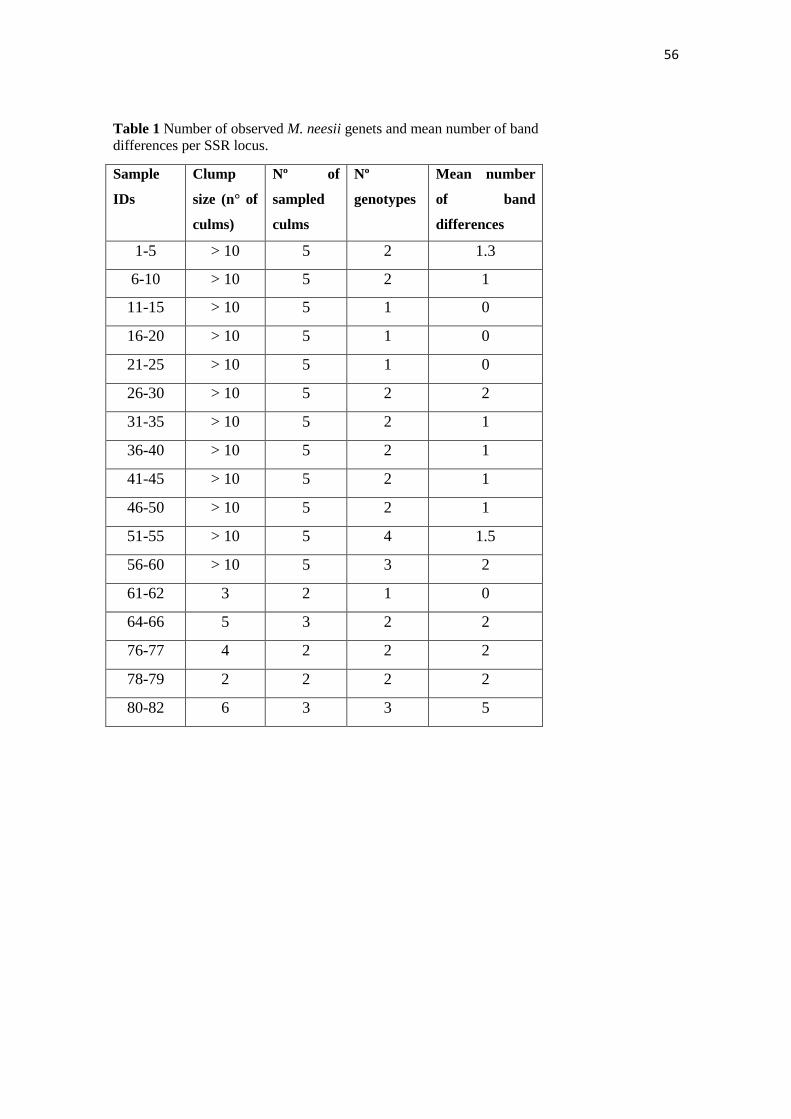
56
Table 1 Number of observed M. neesii genets and mean number of band
differences per SSR locus.
Sample
IDs
Clump
size (n° of
culms)
Nº of
sampled
culms
Nº
genotypes
Mean number
of band
differences
1-5 > 10 5 2 1.3
6-10 > 10 5 2 1
11-15 > 10 5 1 0
16-20 > 10 5 1 0
21-25 > 10 5 1 0
26-30 > 10 5 2 2
31-35 > 10 5 2 1
36-40 > 10 5 2 1
41-45 > 10 5 2 1
46-50 > 10 5 2 1
51-55 > 10 5 4 1.5
56-60 > 10 5 3 2
61-62 3 2 1 0
64-66 5 3 2 2
76-77 4 2 2 2
78-79 2 2 2 2
80-82 6 3 3 5
57
Discussion
This population of M. neesii displays a high level of genetic variation within
clumps (PD value 0.46) much higher than the average of 0.17 calculated for 27 clonal
species using allozyme markers (ELLSTRAND & ROOSE, 1987). However, more
recent studies using nuclear markers, such as RAPD and SSR, have revealed overall
higher values of PD (CHEN et al., 2006; HONG & LEe, 2015). KREHER et al., (2000)
suggest a possible relationship between the mode of clonal spread and the number of
genets observed in a population, such that rhizome propagated species tend to show
higher PD values than species that spread by other means such as severed twigs and
buds.
Multiple mechanisms have been suggested to explain the existence of several
genotypes within discrete clumps or patches (TORIMARU & TOMARU, 2005).
Somatic mutations have been showed to be an important force promoting genetic
diversity in clonal plants (SÁNCHEZ-VILAS et al., 2010). Fernando & Cass (1996)
proposed that single band differences between the genetic profiles of Butomus
umbellatus could have been due to somatic mutations. O’Connell & Ritland (2004) also
showed that single-band differences between genotypes based on microsatellite markers
were due to somatic mutation. In seven of the 13 multiclonal clumps, culms differed
among themselves by more than one band. While microsatellite mutation rates are
considerably higher than in coding regions, they still range between 10-2
to 10-6
events
per locus per generation (LIAN et al., 2004). As such, it seems highly unlikely that
somatic mutations could account for such amount of variation within the clumps
(KREHER et al., 2000).
Furthermore, assuming that slipped-strand mispairing is the main cause of
changes in microsatellite length – and thus, that single-step mutations are considerably
more frequent than changes involving two or more steps –, if somatic mutations were in
fact responsible for inter-ramet variation in M. neesii, we would expect to see a pattern
of mostly small variations in the number of microsatellite repeats among culms of the
same clump (BRUVO et al., 2004; LIAN et al., 2004). Instead, we noted that, among
non-identical culms belonging to the same clump, band size differences were such that
would require several steps of mutation.
The abundant clonal diversity within M. neesii clumps may also be explained by
seedling recruitment patterns (TORIMARU & TOMARU, 2005). This might have taken
58
the form of several founding events occurring within strict spatial limits, with genets
originating from seeds arriving and establishing in several distinct moments over time
(PADGURSCHI, 2014). On the other hand, as evidenced by genetic distance data,
culms that belong to the same clump are more related to each other than to culms in
other clumps. This suggests that either clump founders were systematically related to
each other, or, more likely, that seedling recruits did not migrate far from the mother
plant, and what we experience as a discrete clump is, in fact, a cluster of siblings that
established themselves around the same time (KREHER et al., 2000).
While the timing of seed recruitment in M. neesii is not yet entirely clear, the
latter hypothesis is further supported by the fact that, as many bamboos, M. neesii seeds
lack adaptations to dispersal – which, in turn, gives rise to a distinct pattern of isolation-
by-distance. The closer two genets are in space, the more closely related they tend to be
(ORSINI et al., 2013). This pattern was confirmed through a genetic analysis performed
at the clump level, in which kinship values are highest below 3m of distance (Chapter
2). It is possible that the isolation-by-distance pattern extrapolates into the genet level: if
genetic and geographic distances are directly correlated, what greater closeness is there
than sibling genets occupying the same clump?
The finding that some bamboo clumps are constituted of several closely-related
genets also resonates with literature regarding the evolution of this group’s distinct life
cycle. It has been proposed by some authors that the death of reproductive individuals
following seed setting improves seedling survival rates by causing the opening of gaps
in the canopy – which allows the entrance of sunlight -, and by providing nutrients in
the form of litter (NICHOLSON, 1922; PADGURSCHI, 2014). However, according to
Janzen (1976), this would require limited dispersion of seeds, otherwise the individual
parent would be dying to open a site for the offspring of other individuals. Given that
genets belonging to the same clump were found to be very closely related – possibly
originating from the same mother –, the gap-opening strategy may constitute an
evolutionary strategy akin to kin selection, where the mother plant dies to improve the
survival odds of its offspring (FILE et al., 2012).
In this sense, bamboo clumps combine both sexual and assexual reproduction in
order to succesfully colonize large portions of the forest. Massive – albeit infrequent –
sexual events assure the maintainance of high levels of genetic diversity, which in turn
contributes to the species’ adaptability (FRANKHAM, 2005). At the same time, the
59
gap-opening strategy assures adequate sites for seedling establishment. Subsequent
clonal propagation, in its turn, further contributes to the colonising prowess of this
species. All of these traits may explain the predominance of bamboo stands in large
portions of the forest.
In summary, this research has revealed that there can be genetic diversity inside
M. neesii clumps and that clumps do not always equal one genotype. It also showed that
the most likely mechanism that drove the appearance of multiclonal clumps is the
limited dispersion of seeds, which results in siblings establishing close to each other
along favorable patches created by the death of their mother plant. Nevertheless, more
thorough genetic and ecological analyses are necessary to clarify the roles of both
somatic mutations and multiple founding events in the formation of multiclonal clumps,
as well as to further explore the connection between this phenomenon and the evolution
of certain reproductive strategies. The knowledge generated in the present study, as well
as future developments on the subject, may help conservation policy-makers make
informed decisions on how to manage bamboo populations – either to minimize its
negative impact on some communities, or simply to preserve a much important element
of the forest’s ecological balance.
60
DISCUSSÃO
A limitação na dispersão dos propágulos resulta, conforme previsto pelo modelo
clássico de Isolamento por Distância, em uma acentuada estrutura genética espacial em
fina escala; i.e., genótipos aparentados tendem a permanecer próximos uns dos outros.
Por outro lado, as análises também revelaram a existência de duas subpopulações com
quase nenhum fluxo gênico entre si, cujo arranjo espacial não pode ser explicado
somente pela dispersão limitada dos propágulos. A existência desses agrupamentos
genéticos distintos provavelmente está ligada ao padrão de distribuição diferenciada de
condições e recursos ao longo da paisagem, um fenômeno que, por sua vez, está
relacionado ao alto grau de heterogeneidade ambiental típico de florestas tropicais e ao
padrão microtopográfico irregular do local onde a população está estabelecida. Estudos
mais aprofundados são necessários para estabelecer exatamente quais condições
ambientais estão por trás do estabelecimento diferenciado de genótipos no espaço e da
consequente limitação do fluxo gênico entre as subpopulações de M. neesii. As análises
também foram eficientes em determinar o nível de identidade clonal dentro das moitas.
Nossos resultados evidenciam que os colmos dentro de uma mesma moita discreta não
são necessariamente clones oriundos do mesmo zigoto (rametas); ao contrário, estes
podem diferir entre si e vir a formar moitas multiclonais. No entanto, colmos não-
idênticos que integram a mesma moita multiclonal demonstram ser significativamente
mais aparentados entre si do que em relação a colmos de moitas vizinhas. Esse padrão
também pode estar ligado à limitação na dispersão das sementes e, em última instância,
ser reflexo de uma estratégia evolutiva mais ampla relacionada ao ciclo de vida próprio
dos bambus. Estudos futuros se fazem necessários para testar essa última hipótese, bem
como esclarecer o papel de outros mecanismos geradores de variabilidade genética no
surgimento da multiclonalidade.
CONCLUSÃO
Os marcadores de microssatélites, bem como as análises estatísticas empregadas,
foram eficientes em sua tarefa de revelar a existência de estrutura genética espacial em
diversas escalas nesta população do bambu Merostachys neesii. Os processos ligados à
geração de estrutura genética espacial repercutem, inclusive, na percepção da
individualidade na espécie. Estudos posteriores se fazem necessarios para confirmar
algumas das hipoteses levantadas no presente trabalho.

61
REFERENCIAS
ABREU, A. G.; GROMBONE-GUARATINI, M. T.; VAL, T. M.; ZUCCHI, M. I.
Genetic diversity and age class structure of seedlings and saplings after a mast
flowering of bamboo in the Brazilian Atlantic forest. International Journal of
Plant Sciences, v. 175, p. 319–327, 2014.
AGARWAL, M.; SHRIVASTAVA, N.; PADH, H. Advances in molecular marker
techniques and their applications in plant sciences. Plant Cell Reports, v. 27, n. 4,
p. 617-631, 2008.
ALTSCHUL, S.F.; GISH, W.; MILLER, W.; MYERS, E. W.; LIPMAN, D. J. Basic
local alignment search tool. Journal of Molecular Biology, v. 215, p. 403-410,
1990.
ALVES, L., VIEIRA-SCARANELLO, M. et al. Forest structure and live aboveground
biomass variation along an elevational gradient of tropical Atlantic moist forest
(Brazil). Forest Ecology and Management, v. 260, p. 679-691, 2010.
ANTONOVICS, J.; BRADSHAW, A; TURNER, R. Heavy metal tolerance in plants.
Advancements in Ecological Research, v. 7, p. 1-85, 1971.
ATTIGALA, L.; GALLAHER, T.; NASON, J.; CLARK, L.G. Genetic diversity and
population structure of the threatened temperate woody bamboo Kuruna debilis
(Arundinarieae) from Sri Lanka based on microsatellite analysis. Journal of the
National Science Foundation of Sri Lanka, v. 45, p. 53–65, 2017.
AVISE, J. Molecular markers, natural history, and evolution. Sunderland (Mass.):
Sinauer. 2004.
BALDAUF, C.; CIAMPI-GUILLARDI MAGUIRRA, T. et al. Genetic diversity,
spatial genetic structure and realised seed and pollen dispersal of Himatanthus
drasticus (Apocynaceae) in the Brazilian savanna. Conservation Genetics, v. 15,
p. 1073-1083, 2014.
BAZZAZ, F. A.; LEVIN, D. A.; SCHMIERBACH, M. R. Differential survival of
genetic variants in crowded populations of Phlox. Journal of Applied Ecology, v.
19, p. 891-900, 1982.
BECHELER, R.; BENKARA, E.; MOALIC, Y.; HILY, C.; ARNAUD-HAOND, S.
Scaling of processes shaping the clonal dynamics and genetic mosaic of seagrasses
through temporal genetic monitoring. Heredity, v. 112, n. 2, p. 114-121, 2014.
BILLOTTE, N., LAGODA, P. J. L.; RISTERUCCI A. M.; BAURENS, F. C.
Microsatellite-enriched libraries: applied methodology for the development of SSR
markers in tropical crops. Fruits, v. 54, p. 277-288, 1999
BIZOUX, J. & MAHY, G. Within-population genetic structure and clonal diversity of a
threatened endemic metallophyte, Viola calaminaria (Violaceae). American
Journal Of Botany, v. 94, n. 5, p. 887-895, 2007.
BOTSTEIN, D.; WHITE, R.; SKOLNICK, M.; DAVIS, R. Construction of a Genetic
Linkage Map in Man Using Restriction Fragment Length
Polymorphisms. American Journal of Human Genetics, n. 32, p. 314-331, 1980.
62
BRADSHAW, A. D. Some of the evolutionary consequences of being a plant.
Evolutionary Biology, v. 5, p. 25-47, 1972.
BROADHURST, L.; BREED, M.; LOWE, A.; BRAGG, J.; CATULLO, R.; COATES,
D.; et al. Genetic diversity and structure of the Australian flora. Diversity and
Distributions, p. 23, n. 1, p. 41-52, 2016.
BRUVO, R.; MICHIELS, N. K.; D’SOUZA, T. G.; SCHULENBURG, H. A simple
method for the calculation of microsatellite genotype distances irrespective of
ploidy level. Molecular Ecology, v. 13, p. 2101–2106, 2004.
CAMPOS, M. C. R. Relação da composição e estrutura do componente arbóreo
com variáveis microtopográficas e edáficas da Floresta Ombrófila Densa do
Núcleo Picinguaba/PESM, Ubatuba/SP. Tese de Doutorado. Universidade
Estadual de Campinas, São Paulo, 2008.
CAMPOS, M.; TAMASHIRO, J.; ASSIS, M.; JOLY, C. Florística e fitossociologia do
componente arbóreo da transição Floresta Ombrófila Densa das Terras Baixas -
Floresta Ombrófila Densa Submontana do Núcleo Picinguaba/PESM, Ubatuba,
sudeste do Brasil. Biota Neotropica, v. 11, n. 2, p. 301-312, 2011.
CESTARI, C. & BERNARDI, C. Predation of the Buffy-fronted Seedeater Sporophila
frontalis (Aves: Emberizidae) on Merostachys neesii (Poaceae: Babusoideae) seeds
during a masting event in the Atlantic forest. Biota Neotropica, v. 11, n. 3, p. 407-
411, 2011.
CHEN, J.M.; GITURU, W.R.; WANG, Y.H.; WANG, Q.F. The extent of clonality and
genetic diversity in the rare Caldesia grandis (Alismataceae): Comparative results
for RAPD and ISSR markers. Aquatic Botany, v. 84, p. 301-307, 2006.
CHESSON, P.; PETERSON, A.G. The quantitative assessment of the benefits of
physiological integration in clonal plants. Evol. Ecol. Res., v. 4, p. 1153–1176,
2002.
CHRISTANTY, L.; MAILLY, D.; KIMMINS, J. P. Without bamboo, the land dies:
nutrient cycling and biogeochemistry of a Javanese bamboo talun-kebun system.
Forest Ecology and Management, v. 91, n. 2–3, p. 155–173, 1997.
CLARK, D.A.; CLARK, D.B. Spacing dynamics of a tropical rain forest tree:
evaluation of the Janzen-Connell model. American Naturalist, v. 124, p. 769-788,
1984.
CLARK, L.V.; JASIENIUK, M. Polysat: An R package for polyploid microsatellite
analysis. Mol Ecological Resources, v. 11, p. 562–566, 2011.
CLAUSEN, J.; HIESEY, W. M. Experimental studies on the nature of species. IV.
Genetic structure of ecological races. Publication 520, Carnegie Institute of
Washington, Washington, D.C., USA, 1958.
CRESTE, S.; NETO, A.T.; FIGUEIRA, A. Detection of single sequence repeat
polymorphisms in denaturing polyacrylamide sequencing gels by silver staining.
Plant Mol Biol Report, v. 19, p. 299–306, 2001.
CRUTSINGER, G. M.; COLLINS, M. D.; FORDYCE, J. A.; GOMPERT, Z.; NICE, C.
C.; ANDERS, N. J. Plant genotypic diversity predicts community structure and
governs an ecosystem process. Science, v. 313, p. 966–968, 2006.
63
DEMCHIK, M.; FISCHBACH, J.; KERN, A.; TURNQUIST, K.; PALMER, I. Using
microsatellite DNA to determine whether American Hazelnut clumps are
multiclonal. Agrofor. Syst., v. 90, p. 927–931, 2016.
DONG, M.; YU, F. H.; ALPERT, P. Ecological consequences of plant clonality.
Annals of Botany, v. 114, p. 367, 2014.
DOYLE, J. J.; DOYLE. J. L. Isolation of plant DNA from fresh tissue. Focus, v. 12, p.
13-15, 1990.
EISENLOHR, P. V.; ALVES, L. F.; BERNACCI, L. C. et al. Disturbances, elevation,
topography and spatial proximity drive vegetation patterns along an altitudinal
gradient of a top biodiversity hotspot. Biodiversity Conservation, v. 22, p. 2767–
2783, 2013.
ELLNER, S. & HAIRSTON, N. Role of Overlapping Generations in Maintaining
Genetic Variation in a Fluctuating Environment. The American Naturalist, v.
143, p. 403-417, 1994.
ELLSTRAND, N. C. & ROOSE, M. L. Patterns of genotypic diversity in clonal plant
species Am. J. Bot., v. 74, p. 123–131, 1987.
EPPERSON, B. Spatial genetic structure and non-equilibrium demographics within
plant populations. Plant Species Biology, v. 15, p. 269-279, 2000.
ERIKSSON, O. Dynamics of genets in clonal plants. Time, v. 8, p. 313–316, 1993.
ESCUDERO, A.; IRIONDO, J. M.; TORRES, M. E. Spatial analysis of genetic
diversity as a tool for plant conservation. Biological Conservation, v. 113, n. 3, p.
351–365, 2003.
FERNANDO, D. D.; CASS, D. D. Genotypic differentiation in Butomus umbellatus
(Butomaceae) using isozymes and random amplified polymorphic dnas. Can J Bot
Can Bot, v. 74, p. 647–652, 1996.
FILE, A. L.; MURPHY, G. P.; DUDLEY, S. A. Fitness consequences of plants growing
with siblings: reconciling kin selection, niche partitioning and competitive ability.
Proc. R. Soc. B. Biol. Sci., v. 279, p. 209–218, 2012.
FILGUEIRAS, T. & SHIRASUNA, R. Redescoberta de espécies presumivelmente
extintas de Poaceae da Flora de São Paulo, Brasil. Hoehnea, v. 36, n. 3, p. 507-
509, 2009.
FILGUEIRAS, T. S. & GONÇALVES, A. P. S. A Checklist of the Basal Grasses and
Bamboos in Brazil (POACEAE). The Journal of the American Bamboo Society,
v. 18, n. 1, p. 7-18, 2004.
FISCHER, M.; VAN KLEUNEN, M.; SCHMID, B. Experimental life-history
evolution: Selection on growth form and its plasticity in a clonal plant. J Evol
Biol, v. 17, p. 331–341, 2004.
Flora do Brasil 2020 em construção. Merostachys Jardim Botânico do Rio de Janeiro.
Disponível em: http://floradobrasil.jbrj.gov.br/reflora/floradobrasil/FB13340.
Acesso em: 23 Mar. 2018
FRANKHAM, R. Genetics and Extinction. Bio Cons, v. 126, p. 131-140, 2005.

64
FRANKLIN, D. C.; BOWMAN, D. J. M. S. Bamboo, fire and flood: regeneration of
Bambusa arnhemica (Bambuseae: Poaceae) after mass-flowering and die-off at
contrasting sites in monsoonal northern Australia. Australian Journal of Botany,
n. 51, p. 529-542, 2003.
FRANKLIN, D. C.; KANEKO, S.; YAMASAKI, N.; ISAGI, Y.; Some wild bamboo
clumps contain more than one genet. Aust J Bot, v. 56, p. 433-436, 2008.
GIORDANO, C.; SÁNCHEZ, R.; AUSTIN, A. Gregarious bamboo flowering opens a
window of opportunity for regeneration in a temperate forest of Patagonia. New
Phytologist, v. 181, n. 4, p. 880-889, 2008.
GLÉMIN, S. & BATAILLON, T. A comparative view of the evolution of grasses under
domestication. New Phytologist, v. 183, n. 2, p. 273-290, 2009
GONZÁLEZ, M.E.; VEBLEN, T. T.; DONOSO, C.; VALERIA, L. Tree regeneration
responses in a lowland Nothofagus-dominated forest after bamboo dieback in
South-Central Chile. Plant Ecology, v. 161, p. 59–73, 2002.
GRISCOM, B. W. & ASHTON, P. M. S. A self-perpetuating bamboo disturbance cycle
in a Neotropical forest. Journal of Tropical Ecology, v. 22, n. 5, p. 587–597,
2006.
GROSS, C. L.; NELSON, P. A.; HADDADCHI, A.; FATEMI, M. Somatic mutations
contribute to genotypic diversity in sterile and fertile populations of the threatened
shrub, Grevillea rhizomatosa (Proteaceae). Annals of Botany, v. 109, p. 331–342,
2012.
GUILHERME, F. A. G.; OLIVEIRA-FILHO, A. T.; APPOLINÁRIO, V.; BEARZOTI,
E. Effects of flooding regime and woody bamboos on tree community dynamics in
a section of tropical semideciduous forest in South-Eastern Brazil. Plant Ecology,
v. 174, p. 19–36, 2004.
GUTIERREZ-OZUNA, R., EGUIARTE, L. E.; MOLINA-FREANER, F. Genotypic
diversity among pasture and roadside populations of the invasive buffelgrass
(Pennisetum ciliare L.) in north-western Mexico. Journal of Arid Environments,
v. 73, p. 26–32, 2009.
HÄMMERLI, A. & REUSCH, T. B. H. Genetic neighbourhood of clone structures in
eelgrass meadows quantified by spatial autocorrelation of microsatellite markers.
Heredity, v. 91, n. 5, p. 448–455, 2003.
HAMRICK J, LINHART Y, MITTON J Relationships Between Life History
Characteristics and Electrophoretically Detectable Genetic Variation in Plants.
Annual Review of Ecology and Systematics, v. 10, p. 173-200, 1979.
HAMRICK, J. L.; GODT, M. J. W.; SHERMAN-BROYLES S. L. Factor influencing
levels of genetic diversity in woody plant species. New Forests, v. 6, p. 95-124,
1992.
HARDY, O. J.; MAGGIA, L.; BANDOU, E. et al. Fine-scale genetic structure and gene
dispersal inferences in 10 Neotropical tree species. Molecular Ecology, v. 15, p.
559–571, 2006.
HARDY, O. J.; MAGGIA, L.; BANDOU, E.; BREYNE, P.; CARON, H.;
CHEVALLIER, M. H. et al. Fine-scale genetic structure and gene dispersal
65
inferences in 10 Neotropical tree species. Molecular Ecology, v. 15, n. 2, p. 559–
571, 2006.
HARDY, O. J.; VEKEMANS, X. Isolation by distance in a continuous population:
reconciliation between spatial autocorrelation analysis and population genetics
models. Heredity, v. 83, p. 145–154, 1999.
HILÁRIO, R. & FERRARI, S. Feeding ecology of a group of buffy‐headed marmosets
(Callithrix flaviceps): fungi as a preferred resource. American Journal of
Primatology: Official Journal of the American Society of Primatologists, v. 72,
n. 6, p. 515-521, 2010.
HONNAY, O. & JACQUEMYN, H. A meta-analysis of the relation between mating
system, growth form and genotypic diversity in clonal plant species. Evolutionary
Ecology, v. 22, p. 299–312, 2008.
HUBER, H.; KANE, N.C.; HESCHEL, M. S. Frequency and microenvironmental
pattern of selection on plastic shade‐avoidance traits in a natural population of
Impatiens capensis. American Naturalist, v. 163, p. 548–563, 2004.
HUBER, H.; LUKÁCS, S.; WATSON, M. A. 1999). Spatial structure of stoloniferous
herbs: an interplay between structural blue-print, ontogeny and phenotypic
plasticity. Plant Ecology, v. 141, n. 2, p. 107–115, 1999.
HUGHES, A. R.; BRIAN, D.; JOHNSON, M. T. J.; UNDERWOOD, N. Ecological
consequences of genetic diversity. Ecological Letters, v. 11, p. 609–623, 2008.
ISAGI, Y., SHIMADA, K., KUSHIMA, H., TANAKA, N., NAGAO, A., ISHIKAWA,
et al. Clonal structure and flowering traits of a bamboo [Phyllostachys pubescens
(Mazel) Ohwi] stand grown from a simultaneous flowering as revealed by AFLP
analysis. Molecular Ecology, v. 13, n. 7, p. 2017–2021, 2004.
JACQUEMYN, H.; BRYS, R.; HONNAY, O. Local forest environment largely affects
below-ground growth, clonal diversity and fine-scale spatial genetic structure in
the temperate deciduous forest herb Paris quadrifolia. Molecular Ecology, v. 14,
p. 4479–4488, 2005.
JANZEN, D. H. Why Bamboos Wait So Long To Flower. Annual Review of Ecology,
Evolution and Systematics, v. 137, p. 349-391, 1976.
JOLY, C. A.; ASSIS, M. A.; BERNACCI, L. C.; TAMASHIRO, J. Y.; CAMPOS, M.
C. R. DE; GOMES, J. A. M. A. et al. Florística e fitossociologia em parcelas
permanentes da Mata Atlântica do sudeste do Brasil ao longo de um gradiente
altitudinal. Biota Neotropica, v. 12, n. 1, 125–145, 2012.
JUDZIEWICZ, E. J.; CLARK, L. G.; LONDOÑO, X.; STERN, M. J. American
bamboos. Washington, D.C.: Smithsonian Institution Press, 1999.
KEELEY, J. E. & BOND, W. J. Mast Flowering and Semelparity in Bamboos: The
Bamboo Fire Cycle Hypothesis. The American Naturalist, v. 154, n.3, p. 383–
391, 1999.
KIEHL, E.J. Manual de edafologia. São Paulo: Agronômica Ceres, 1979.
KING, L. M.; SCHAAL, B. A. Genotypic variation within asexual lineages of
Taraxacum officinale (rRNA-encoding DNA/alcohol dehydrogenase/evolution).
66
Evolution, v. 87, p. 998–1002, 1990.
KREHER, S. A., FORÉ, S. A., COLLINS, B. S. Genetic variation within and among
patches of the clonal species, Vaccinium stamineum L. Mol. Ecol., v. 9, p. 1247–
1252, 2000.
KYUNG, N. H. & JEI W. L. Fine-scale spatial genetic and clonal structure of
Eleutherococcus senticosus populations in South Korea. Forest Science and
Technology, v. 11, n. 3, p. 160-165, 2015.
LAVERGNE, S.; MOLOFSKY, J. Increased genetic variation and evolutionary
potential drive the success of an invasive grass. Proceedings of the National
Academy of Sciences, v. 104, n. 10, p. 3883-3888, 2007.
LEVIN, D. A. Polyploidy and novelty in flowering plants American Naturalist, v. 122,
p. 1-25, 1983.
LEVIN, S. A. The problem of pattern and scale in Ecology. Ecology, v. 73, p. 1943–
1967, 1992.
LEVY, A.; FELDMAN, M. The impact of polyploidy on grass genome evolution. Plant
Physiology, n. 130, p. 1587–1593, 2002.
LI, J. M.; ALPERT, P.; YU, F. H. Multiclonal tussocks in the grass Achnatherum
splendens (Trinius) Nevskia (Poaceae). Flora, v. 207, p. 581–585, 2012.
LIAN, C.; OISHI, R.; MIYASHITA, N.; HOGETSU, T. High somatic instability of a
microsatellite locus in a clonal tree, Robinia pseudoacacia. Theor. Appl. Genet.,
v. 108: p. 836–841, 2004.
LIEBSCH, D.; REGINATO, M.; Florescimento e frutificação de Merostachys
skvortzovii Sendulsky (taquara-lixa) no estado do Paraná. Iheringia, Série
Botânica, v. 64, 53–56, 2009.
LIMA, R. A. F.; ROTHER, D. C.; MULER, A. E.; LEPSCH, I. F.; RODRIGUES, R. R.
Bamboo overabundance alters forest structure and dynamics in the Atlantic Forest
hotspot. Biological Conservation, v. 147, p. 32–39, 2012.
LINHART, Y. B., GRANT, M. C. Evolutionary significance of local genetic
differentiation in plants. Annual Review of Ecology, Evolution and Systematics,
v. 27, p. 237–277, 1996.
LOBO, A.; HANSEN, J.; HANSEN, L.; DAHL-KJAER, E. Differences among six
woody perennials native to Northern Europe in their level of genetic differentiation
and adaptive potential at fine local scale. Ecology And Evolution, p. 2231-2239,
2018.
LOISELLE, B.; SORK, V.; NASON, J.; GRAHAM, C. Spatial Genetic Structure of a
Tropical Understory Shrub, Psychotria officinalis (Rubiaceae). American Journal
of Botany, v. 82, p. 1420, 1995.
LONGHI-WAGNER, H. M.; BITTRICH, V.; WANDERLEY, M. G. L.; SHEPHERD,
G. J. Poaceae. In: . S o Paulo:
FAPESP & Hucitec. 2001
67
LOUTON, J.; GELHAUS, J.; BOUCHARD, R. The Aquatic Macrofauna of water-filled
bamboo (Poaceae: Bambusoideae: Guadua) internodes in a Peruvian Lowland
Tropical Forest. Biotropica, v. 28, n. 2, p. 228, 1996.
LOVELESS, M.; HAMRICK, J. Ecological Determinants of Genetic Structure in Plant
Populations. Annual Review of Ecology, Evolution and Systematics, v. 151, p.
65–95, 1984.
MATESANZ, S.; GIMENO, T.; DE LA CRUZ, M.; ESCUDERO, A.; VALLADARES,
F.; Competition may explain the fine-scale spatial patterns and genetic structure of
two co-occurring plant congeners. Journal of Ecology, v. 99, p. 838-848, 2011.
MCCOUCH, S.R.; CHEN, X.; PANAUD, O.; TEMNYKH, S.; XU, Y.; CHO, Y.G.;
HUANG, N.; ISHII, T.; BLAIR, M.; Microsatellite marker development, mapping
and applications in rice genetics and breeding. Plant Molecular Biology, v. 35, p.
89–99, 1997.
MCNEELY, J. A. Biodiversity and bamboo genetic resources in Asia: in situ
community-based and ex situ approaches to conservation. Chinese Biodiversity,
v. 7, n. 1, p. 38–51, 1999.
MEDEIROS, M. C. M. P. DE Caracterização fitofisionômica e estrutural de áreas
de Floresta Ombrófila Densa Montana no Parque Estadual da Serra do Mar,
SP, Brasil. Tese de doutorado. Universidade Estadual de Campinas, São Paulo,
2009.
MEDEIROS, M. C. M. P. DE; MATTOS, I. F. D. A.; KANASHIRO, M. M.;
TAMASHIRO, J. Y.; AIDAR, M. P. M. Vegetation mapping in an area of
Ombrophilous Dense Forest at Parque Estadual da Serra do Mar, São Paulo State,
Brazil, and floristic composition of the tree component of some physiognomies.
Hoehnea, v. 39, p. 219–233, 2012.
MEIRMANS, P. G. The trouble with isolation by distance. Molecular Ecology 21, p.
2839–2846, 2012.
MYERS, N.; MITTERMEIER, R. A.; MITTERMEIER, C. G.; DA FONSECA, G. A.
B.; KENT, J. Biodiversity hotspots for conservation priorities. Nature, v. 403, n.
6772, p. 853–858, 2000.
NICHOLSON, J. W. Note on the distribution and habit of Dendrocalamus strictus and
Bambusa arundinacea in Orissa. Ind. For., v. 48, p. 425-428, 1922.
O’CONNELL, L. M.; RITLAND, K. Somatic mutations at Microsatellite Loci in
Western Redcedar (Thuja plicata: Cupressaceae). J Hered, v. 95, p. 172–176,
2004.
OBBARD, D. J.; HARRIS, S. A.; PANNELL, J. R. Simple allelic-phenotype diversity
and differentiation statistics for allopolyploids. Heredity (Edinb), v. 97; p. 296–
303, 2006.
OKSANEN, J.; GUILLAUME-BLANCHET, F.; FRIENDLY, M.; KINDT, R.;
LEGENDRE, P.; MCGLINN, D.; MINCHIN, P. R.; O’HARA, R. B.; SIMPSON,
G. L.; SOLYMUS, P.; STEVENS, M. H. H.; SZOECS E, WAGNER H (2017).
vegan: Community Ecology Package. R package version 2.4-3. 2017.
OLIVEIRA-FILHO, A. T.; VILELA, E. A.; GAVILANES, M. L.; CARVALHO, D. A.
68
Effect of flooding regime and understorey bamboos on the physionomy and tree
speacies composition of a tropical semideciduous forest in Southeastern Brazil.
Vegetatio, v. 113, p. 99–124, 1994.
ORSINI, L.; VANOVERBEKE, J.; SWILLEN, I.; Drivers of population genetic
differentiation in the wild: Isolation by dispersal limitation, isolation by adaptation
and isolation by colonization. Molecular Ecology, v. 22, p. 5983–5999, 2013.
PADGURSCHI, M. Composição e estrutura arbórea de um trecho de Floresta
Ombrófila Densa Montana com taquaras na Mata Atlântica. Dissertação de
Mestrado. Universidade Estadual de Campinas, São Paulo, 2010.
PADGURSCHI, M. Padrão espacial de taquaras (Poaceae: Bambusoideae) em uma
floresta Neotropical do sudeste do Brasil. Tese de doutorado. Universidade
Estadual de Campinas, São Paulo, 2014.
PEREIRA, L, DE S. Composição florística e estrutura de um trecho de floresa
ombrófila densa montana do Parque Estadual da Serra do Mar. Tese de
doutorado. Universidade Estadual de Campinas, Campinas, 2011.
PHILLIPS, O. L.; MALHI, Y.; HIGUCHI, N.; LAURANCE, W. F.; PERCY, V.;
VÁSQUEZ, R. M.; et al. Changes in the Carbon Balance of Tropicat Forests :
Evidence from Long-Term Plots, Science, v. 282 n. 5388, p. 439–442, 1998.
POHL, R. W.; DURING, R. Blooming history of the Costa Rican bamboos. Revista de
Biologia Tropical, v. 39, n.1, p. 111–124, 1991.
PRASAD, M.; VARSHNEY, R. K.; BALYAN, H. S.; GUPTA, P. K.; ROY, J. K. The
use of microsatellites for detecting DNA polymorphism, genotype identification
and genetic diversity in wheat. TAG Theor Appl Genet, v. 100, p. 584–592,
2000.
RAMIREZ-BARAHONA, S.; EGUIARTE, L. E. Spatial genetic analyses reveal strong
genetic structure in two populations of the outcrossing tree fern Alsophila firma
(Cyatheaceae). Botanical Journal of the Linnean Society, v. 177, p. 439–449,
2015.
REED, D. H., FRANKHAM, R. Correlation between fitness and genetic diversity.
Conservation Biology, v. 17, p. 230-237, 2003.
REIS, T. S.; CIAMPI-GUILLARDI, M.; BAJAY, M. M. et al. Elevation as a barrier:
Genetic structure for an Atlantic rain forest tree (Bathysa australis) in the Serra do
Mar mountain range, SE Brazil. Ecology and Evolution, v. 5, p. 1919–1931,
2015.
RIBEIRO, M. C.; METZGER, J. P.; MARTENSEN, A. C.; PONZONI, F. J.; HIROTA,
M. M. The Brazilian Atlantic Forest: How much is left, and how is the remaining
forest distributed? Implications for conservation. Biological Conservation, v. 142,
n. 6, 1141–1153, 2009.
ROCHELLE, A. L. C.; CIELO-FILHO, R.; MARTINS F. R. Florística e estrutura de
um trecho de Floresta Ombrófila Densa Atlântica Submontana no Parque Estadual
da Serra do Mar, em Ubatuba/SP, Brasil. Biota Neotropica, v. 11, p. 338-346,
2011.
69
ROTHER, D. C.; RODRIGUES, R. R.; PIZO, M. Effects of bamboo stands on seed rain
and seeds limitation in a rainforest. Forest Ecology and Management. v. 257, n.
3, p. 885-892, 2009.
SÁNCHEZ-VILAS, J.; PHILIPP, M.; RETUERTO, R. Unexpectedly high genetic
variation in large unisexual clumps of the subdioecious plant Honckenya peploides
(Caryophyllaceae). Plant. Biol., v. 12, p. 518–525, 2010.
SANTELICES, B. How many kinds of individual are there? Trends Ecol Evol, v. 14,
p. 152–155, 1999.
SCHABERG, P. G.; DEHAYES, D. H.; HAWLEY, G. J.; NIJENSOHN, S. E.
Anthropogenic alterations of genetic diversity within tree populations: Implications
for forest ecosystem resilience. Forest Ecology and Management, v. 256, n. 5, p.
855-862, 2008.
SEXTON, J. P.; HANGARTNER, S. B.; HOFFMANN, A. A. Genetic isolation by
environment or distance: Which pattern of gene flow is most common? Evolution,
v. 68, n. 1, p. 1–15, 2014.
SODERSTROM, T.; CALDERON C. A Commentary on the Bamboos (Poaceae:
Bambusoideae). Biotropica, v. 11, n. 3, p. 161–172, 1979.
STEBBINS, G. Cytogenetics and Evolution of The Grass Family. American Journal
Of Botany, v. 43, p. 890-905, 1956.
STEBBINS, G. Polyploidy, hybridization, and the invasion of new habitats. Annals of
the Missouri Botanical Garden, v. 72, n. 824-832, 1985.
STERN, M. J.; GOODELL, K.; KENNARD, D. K. Local distribution of Chusquea
tomentosa (Poaceae: Bambusoideae) before and after a flowering event.
Biotropica, v. 31, n. 2, p. 365–368, 1999.
SUNNUCKS, P. Efficient genetic markers for population biology. Trends in Ecology
and Evolution, v. 15, p. 199–203, 2000.
TABARELLI M. Clareiras naturais e a riqueza de espécies pioneiras em uma floresta
atlântica montana. Revista Brasileira de Biologia, v. 59, p. 251–261, 1999.
TABARELLI, M., MANTOVANI, W. Gap-Phase Regeneration in a Tropical Montane
Forest: The Effects of Gap Structure and Bamboo Species, Plant Ecology, v. 148,
n. 2, 149–155, 2000.
TACHIKI, Y.; MAKITA. A.; SUYAMA, Y.; SATAKE, A. A spatially explicit model
for flowering time in bamboos: Long rhizomes drive the evolution of delayed
flowering. Journal of Ecology v. 103, p. 585–593, 2015.
TAYLOR, A. H.; JINYAN, H.; SHIQIANG, Z. Canopy tree development and
undergrowth bamboo dynamics in old-growth Abies-Betula forests in southwestern
China: A 12-year study. Forest Ecology and Management, v. 200, n. 1–3, p.
347–360, 2004.
TEMUNOVIĆ, M.; FRANJIĆ, J.; SATOVIC, Z.; GRGUREV, M.; FRASCARIA-
LACOSTE, N.; FERNÁNDEZ-MANJARRÉS, J. F. Environmental heterogeneity
explains the genetic structure of continental and mediterranean populations of
Fraxinus angustifolia Vahl. PLoS ONE, v. 7, n. 8, p. 1–13, 2012.
70
THAKUR, A.; GINWAL, H. S.; BARTHWAL, S. Genetic Diversity In Bamboos:
Conservation And Improvement For Productivity. In Bamboos in India Delhi:
ENVIS Centre on Forestry, 2016.
TORIMARU, T.; TOMARU, N. Fine-scale clonal structure and diversity within patches
of a clone-forming dioecious shrub, Ilex leucoclada (Aquifoliaceae). Ann Bot, v.
95, p. 295–304, 2004.
TRIPLETT, J.; CLARK, L. Phylogeny of the Temperate Bamboos (Poaceae:
Bambusoideae: Bambuseae) with an Emphasis on Arundinaria and
Allies. Systematic Botany, v. 35, p. 102-120, 2010.
TROUPIN, D.; NATHAN, R.; VENDRAMIN, G. G. Analysis of spatial genetic
structure in an expanding Pinus halepensis population reveals development of fine-
scale genetic clustering over time. Molecular Ecology, v. 15, p. 3617–3630, 2006.
VALLEJO-MARIN, M. & LYE, G. C. Hybridisation and Genetic Diversity in
Introduced Mimulus (Phrymaceae). Heredity, v. 110, p. 111-122, 2012.
VEKEMANS, X. & HARDY, O. J. New insights from fine-scale spatial genetic
structure analyses in plant populations. Molecular Ecology, v. 13, n. 4, p. 921–
935, 2004.
VIEIRA, B. C.; FERNANDES, N. F.; FILHO, O. A. Shallow landslide prediction in the
Serra do Mar, São Paulo, Brazil. Natural Hazards and Earth System Science, v.
10, n. 9, p. 1829–1837, 2010.
VINHA, D.; ALVES, LUCIANA F. ; ZAIDAN, LILIAN B.P., GROMBONE-
GUARATINI, MARIA T. Influência da superabundância por Aulonemia aristulata
(Bambuseae) sobre o banco de sementes transitório em um fragmento de Floresta
Atlântica. Rodriguesia, v. 68, p. 1177-1186, 2017.
WANG, I. J.; BRADBURD, G. S. Isolation by environment. Molecular Ecology, v. 23,
p. 5649–5662, 2014.
WAYCOTT, M. Assessment of genetic variation and clonality in the seagrsas
Posidonia australis (Hook.) F. Using RAPD and allozyme analysis. Mar. Ecol.
Prog. Ser., v. 116, p. 289–295, 1995.
WIDEN, B.; CRONBERG, N.; WIDEN, M.; Genotypic diversity, molecular markers
and spatial-distribution of genets in clonal plants, a literature survey. Folia
Geobotanica et Phytotaxonomica, v. 29, p. 245–263, 1994.
WIDMER, Y. Pattern and Performance of Understory Bamboos (Chusquea spp.) under
Different Canopy Closures in Old-Growth Oak Forests in Costa Rica. Biotropica,
v. 30, n. 3, p. 400-415, 1998.
YEASMIN, L.; ALI, N.; GANTAIT, S. Bamboo: an overview on its genetic diversity
and characterization. Biotech, v. 5, p. 1–11, 2015.
YOUNG, A. G.; MERRIAM, H. G. Effects of forest fragmentation on the spatial
genetic structure of Accer saccharum Marsh. (sugar maple) populations. Heredity,
v. 72, p. 201-208, 1994.
YOUNG, K. R. Natural History of an Understory Bamboo (Chusquea sp) in a Tropical
Timberline Forest. Biotropica, v. 23, n. 4, p. 542–554, 1991.

71
ZANE, L.; BARGELLONI, L.; PATARNELLO, T. Strategies for microsatellite
isoloation: a review. Molecular Ecology, v. 11, p. 1–16, 2002.
ZEQUI, J. A. C. & LOPES, J. Culicideofauna (Diptera) encontrada em entrenós de
taquara de uma mata residual na área urbana de Londrina, Paraná, Brasil. Revista
Brasileira de Zoologia, v. 18, n. 2, p. 429–438, 2001.
ZHOU, B. Z.; MAO-YI, F.; XIE, J. Z.; XIAO-SHENG, Y.; LI, Z. C. Ecological
functions of bamboo forest: Research and Application. Journal of Forestry
Research, v. 16, n. 2, p. 143–147, 2005.

72
ANEXOS
73


![[Resenha]Said, Edward. Estilo Tardio Said, Edward. Estilo Tardio](https://img.pdfslide.tips/doc/110x75/55cf9065550346703ba58bbe/resenhasaid-edward-estilo-tardio-said-edward-estilo-tardio.jpg)