Embed Size (px)
Citation preview
Copyright ©2010 by Pearson Education, Inc.Upper Saddle River, New Jersey 07458
All rights reserved.
Statistics and Data Analysis for Nursing Research, Second EditionDenise F. Polit
Statistics and Data Analysisfor Nursing Research
Second Edition
CHAPTER
Factor Analysis and Internal Consistency Reliability Analysis
13
Copyright ©2010 by Pearson Education, Inc.Upper Saddle River, New Jersey 07458
All rights reserved.
Statistics and Data Analysis for Nursing Research, Second EditionDenise F. Polit
Factor Analysis Purpose
• Factor analysis is a complex statistical procedure that has been somewhat controversial
• Purpose: To illuminate the underlying dimensionality of a set of measures—to shed light on how variables cluster together into factors that represent constructs of theoretical interest
Copyright ©2010 by Pearson Education, Inc.Upper Saddle River, New Jersey 07458
All rights reserved.
Statistics and Data Analysis for Nursing Research, Second EditionDenise F. Polit
Exploratory Factor Analysis
• Exploratory factor analysis (EFA) does not test hypotheses about factor structures (confirmatory factor analysis does this)
• EFA is not driven by underlying theory—It is a means of answering the question: Does this set of variables have an underlying structure?
Copyright ©2010 by Pearson Education, Inc.Upper Saddle River, New Jersey 07458
All rights reserved.
Statistics and Data Analysis for Nursing Research, Second EditionDenise F. Polit
Uses of EFA
• Data reduction—To reduce a large set of variables to a smaller, more manageable number for subsequent analysis
• Scale development—To identify items that “go together” to form a scale
• Construct validation—To use as a form of evidence of construct validity for a new scale
Copyright ©2010 by Pearson Education, Inc.Upper Saddle River, New Jersey 07458
All rights reserved.
Statistics and Data Analysis for Nursing Research, Second EditionDenise F. Polit
What is a Factor?
• A factor is a linear combination in a data matrix
• A factor can be defined as: F = b1X1 + b2X2 + ... bkXk
• Factor analysis solves for the b weights (called factor loadings) for each variable (X1 to Xk) in the analysis
Copyright ©2010 by Pearson Education, Inc.Upper Saddle River, New Jersey 07458
All rights reserved.
Statistics and Data Analysis for Nursing Research, Second EditionDenise F. Polit
Matrixes in Factor Analysis
• Two-dimensional arrays of numerical values (matrixes) are a fundamental aspect of factor analysis; mathematical operations via matrix algebra are required
• Factor analysis involves analyzing interrelated variance within a correlation matrix
Copyright ©2010 by Pearson Education, Inc.Upper Saddle River, New Jersey 07458
All rights reserved.
Statistics and Data Analysis for Nursing Research, Second EditionDenise F. Polit
Factor Matrix
• Matrixes are also the product of factor analysis—Results are shown in a factor matrix
• A factor matrix presents original variables on one dimension (rows) and factors on the other (columns)
• Entries in the factor matrix are factor loadings that indicate the relationship between variables and factors
Copyright ©2010 by Pearson Education, Inc.Upper Saddle River, New Jersey 07458
All rights reserved.
Statistics and Data Analysis for Nursing Research, Second EditionDenise F. Polit
Example of a Factor Matrix
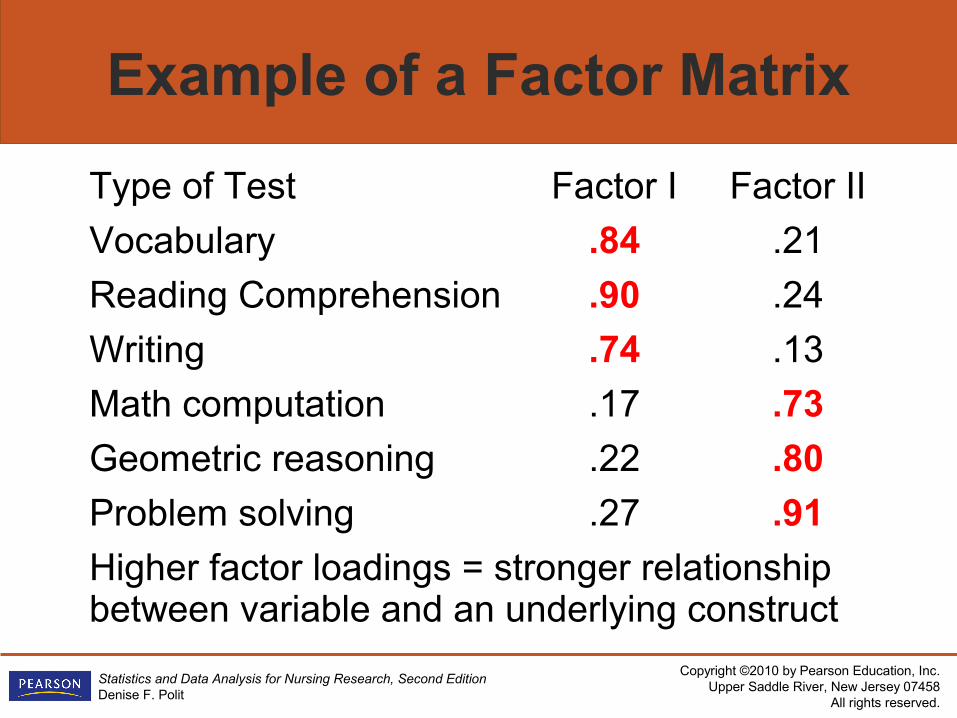
Type of Test Factor I Factor II
Vocabulary .84 .21
Reading Comprehension .90 .24
Writing .74 .13
Math computation .17 .73
Geometric reasoning .22 .80
Problem solving .27 .91
Higher factor loadings = stronger relationship between variable and an underlying construct
Copyright ©2010 by Pearson Education, Inc.Upper Saddle River, New Jersey 07458
All rights reserved.
Statistics and Data Analysis for Nursing Research, Second EditionDenise F. Polit
Common Factor Variance
• Shared variance among variables is what factor analysis seeks to identify
• The total variance (VTOTAL) of a variable = common factor variance + variance specific to the variable + error variance
• Common factor variance is the variance that two or more variables (e.g., items in a scale) share in common
Copyright ©2010 by Pearson Education, Inc.Upper Saddle River, New Jersey 07458
All rights reserved.
Statistics and Data Analysis for Nursing Research, Second EditionDenise F. Polit
Communality
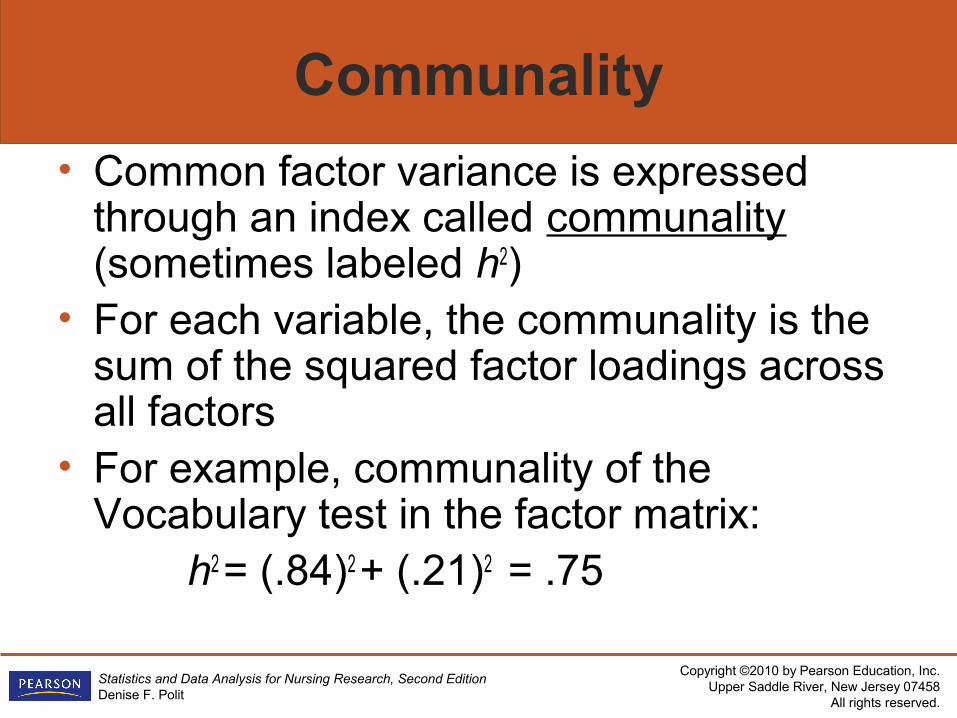
• Common factor variance is expressed through an index called communality (sometimes labeled h2)
• For each variable, the communality is the sum of the squared factor loadings across all factors
• For example, communality of the Vocabulary test in the factor matrix:
h2 = (.84)2 + (.21)2 = .75
Copyright ©2010 by Pearson Education, Inc.Upper Saddle River, New Jersey 07458
All rights reserved.
Statistics and Data Analysis for Nursing Research, Second EditionDenise F. Polit
Eigenvalues
• An eigenvalue represents the amount of shared variance accounted for by a factor
• The eigenvalue is the sum of squared loadings for a specific factor
Copyright ©2010 by Pearson Education, Inc.Upper Saddle River, New Jersey 07458
All rights reserved.
Statistics and Data Analysis for Nursing Research, Second EditionDenise F. Polit
Example of Eigenvalues and h2
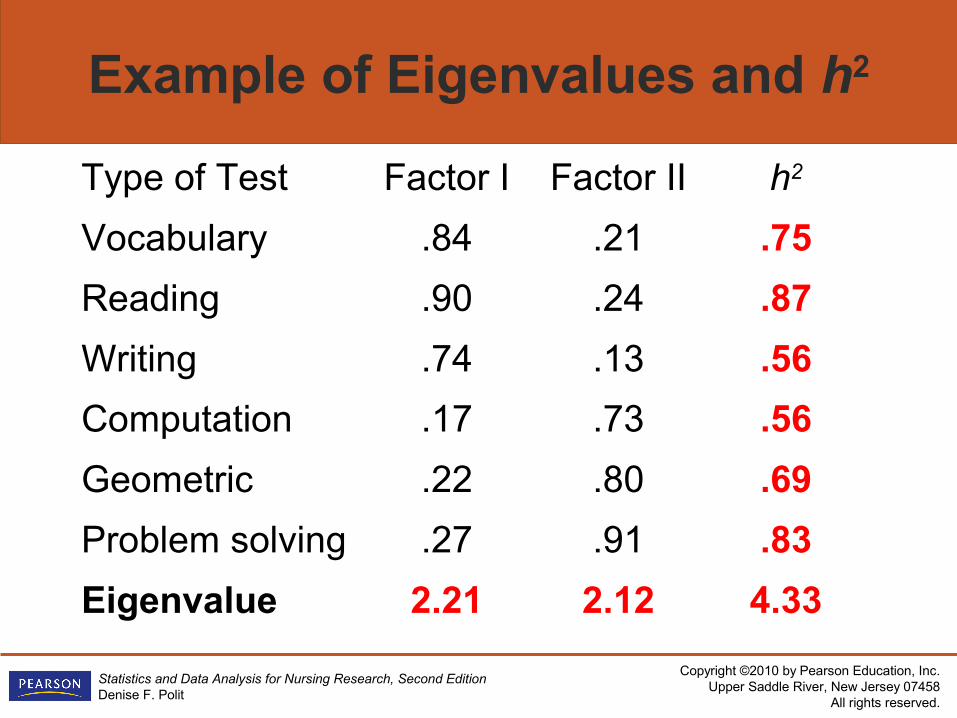
Type of Test Factor I Factor II h2
Vocabulary .84 .21 .75
Reading .90 .24 .87
Writing .74 .13 .56
Computation .17 .73 .56
Geometric .22 .80 .69
Problem solving .27 .91 .83
Eigenvalue 2.21 2.12 4.33
Copyright ©2010 by Pearson Education, Inc.Upper Saddle River, New Jersey 07458
All rights reserved.
Statistics and Data Analysis for Nursing Research, Second EditionDenise F. Polit
Requirements/Assumptions for Factor Analysis
• All requirements for correlation coefficients are relevant (e.g., no outliers)
• Each pair of variables should be linearly correlated
• Variables should be interval or ratio (or approximately interval level)
• The correlation matrix cannot be an identity matrix (1s on the diagonal, but 0s off-diagonal, indicating no correlations)
Copyright ©2010 by Pearson Education, Inc.Upper Saddle River, New Jersey 07458
All rights reserved.
Statistics and Data Analysis for Nursing Research, Second EditionDenise F. Polit
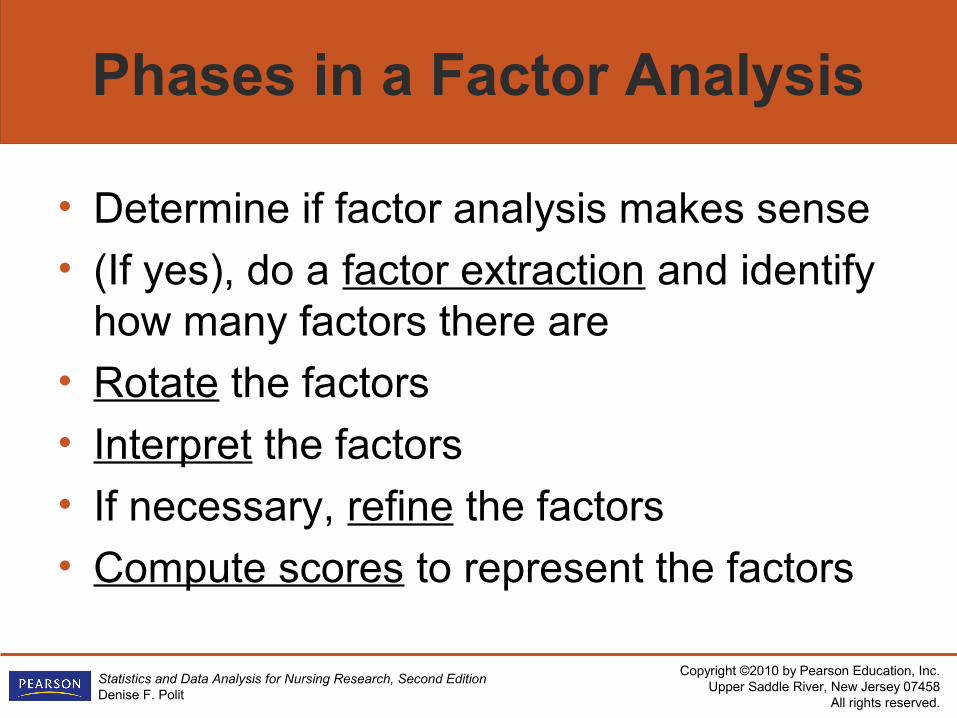
Phases in a Factor Analysis
• Determine if factor analysis makes sense• (If yes), do a factor extraction and identify
how many factors there are• Rotate the factors• Interpret the factors• If necessary, refine the factors• Compute scores to represent the factors
Copyright ©2010 by Pearson Education, Inc.Upper Saddle River, New Jersey 07458
All rights reserved.
Statistics and Data Analysis for Nursing Research, Second EditionDenise F. Polit
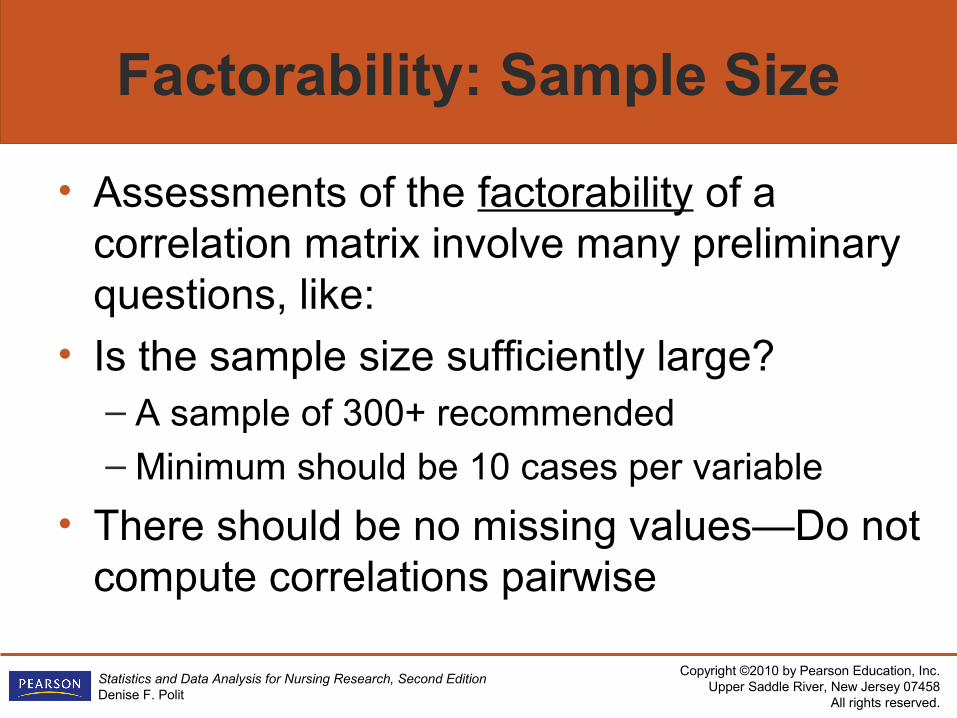
Factorability: Sample Size
• Assessments of the factorability of a correlation matrix involve many preliminary questions, like:
• Is the sample size sufficiently large?– A sample of 300+ recommended– Minimum should be 10 cases per variable
• There should be no missing values—Do not compute correlations pairwise
Copyright ©2010 by Pearson Education, Inc.Upper Saddle River, New Jersey 07458
All rights reserved.
Statistics and Data Analysis for Nursing Research, Second EditionDenise F. Polit
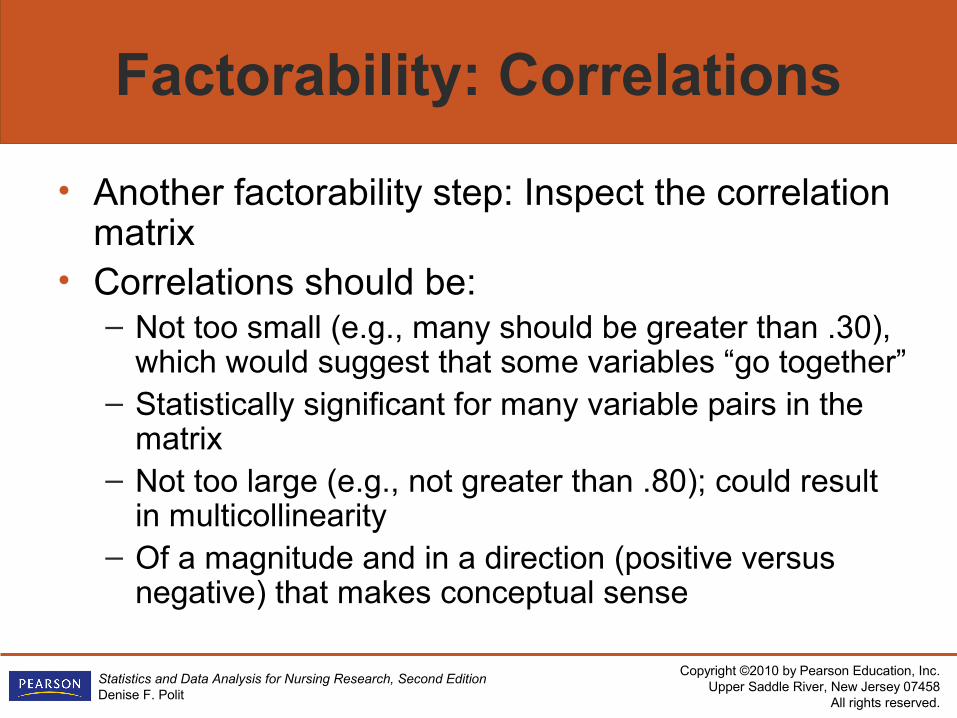
Factorability: Correlations
• Another factorability step: Inspect the correlation matrix
• Correlations should be:– Not too small (e.g., many should be greater than .30),
which would suggest that some variables “go together”– Statistically significant for many variable pairs in the
matrix– Not too large (e.g., not greater than .80); could result
in multicollinearity– Of a magnitude and in a direction (positive versus
negative) that makes conceptual sense
Copyright ©2010 by Pearson Education, Inc.Upper Saddle River, New Jersey 07458
All rights reserved.
Statistics and Data Analysis for Nursing Research, Second EditionDenise F. Polit
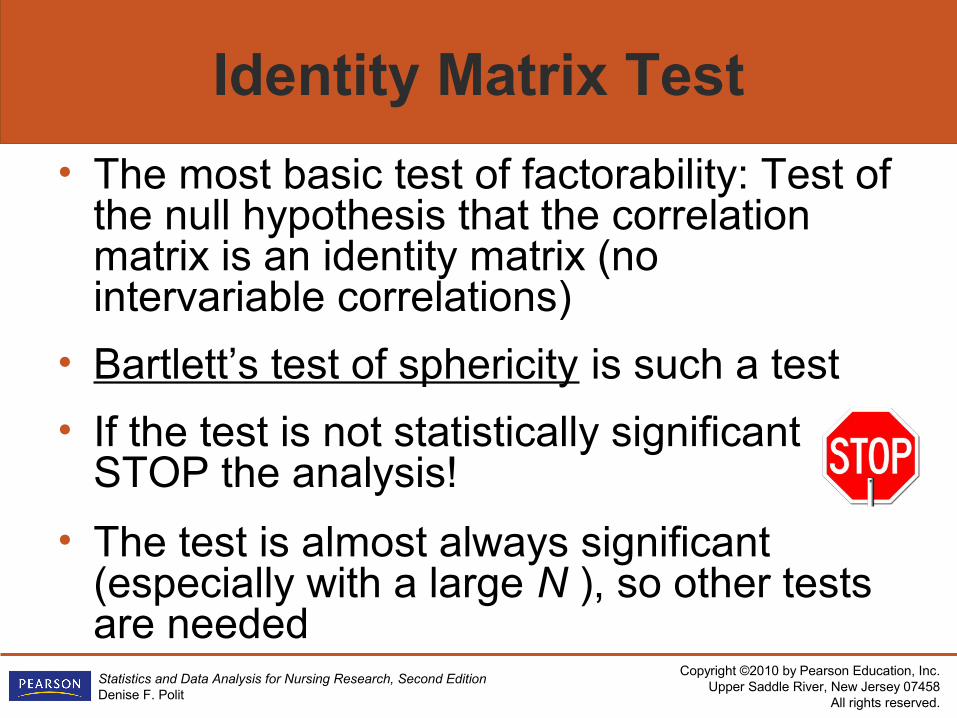
Identity Matrix Test
• The most basic test of factorability: Test of the null hypothesis that the correlation matrix is an identity matrix (no intervariable correlations)
• Bartlett’s test of sphericity is such a test
• If the test is not statistically significant STOP the analysis!
• The test is almost always significant (especially with a large N ), so other tests are needed
Copyright ©2010 by Pearson Education, Inc.Upper Saddle River, New Jersey 07458
All rights reserved.
Statistics and Data Analysis for Nursing Research, Second EditionDenise F. Polit
Sampling Adequacy
• In a factor analytic context, sampling adequacy refers to the adequacy of the sample of variables to represent the underlying construct
• The most widely used measure of sampling adequacy is the Kaiser-Meyer-Olkin test
Copyright ©2010 by Pearson Education, Inc.Upper Saddle River, New Jersey 07458
All rights reserved.
Statistics and Data Analysis for Nursing Research, Second EditionDenise F. Polit
Kaiser-Meyer-Olkin Test
• The Kaiser-Meyer-Olkin (KMO) test compares values of correlation coefficients to partial correlation coefficients (with the effects of other variables partialled out)
• Values of KMO can range from 0 to 1.0.
• The bigger the value of the KMO index, the better; – If KMO > .80, factorability is excellent– If KMO < .50, factorability is poor—STOP!
Copyright ©2010 by Pearson Education, Inc.Upper Saddle River, New Jersey 07458
All rights reserved.
Statistics and Data Analysis for Nursing Research, Second EditionDenise F. Polit
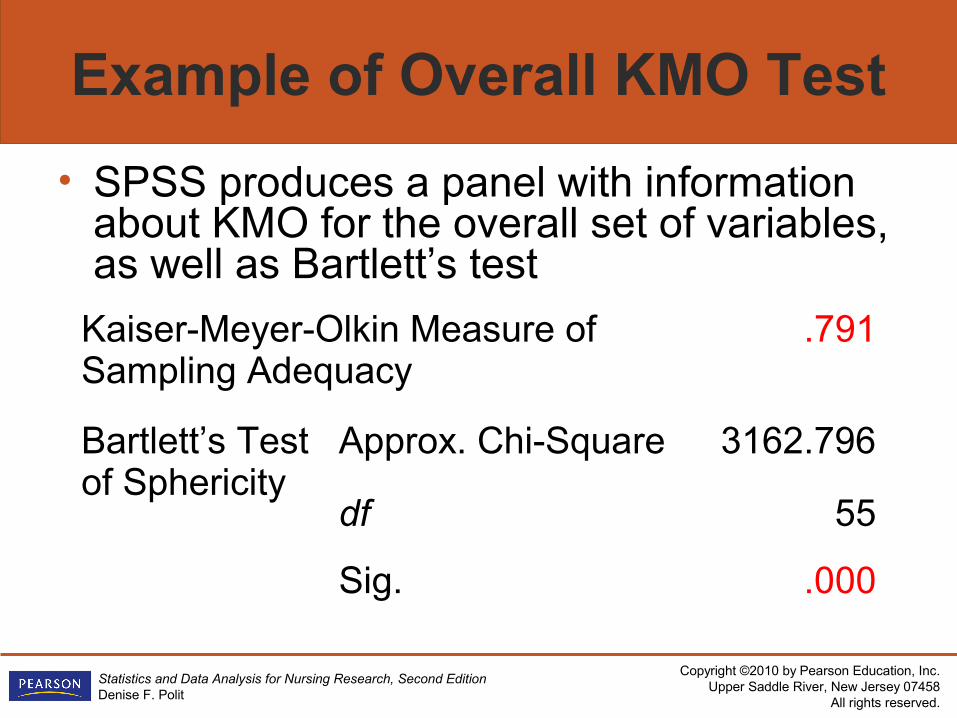
Example of Overall KMO Test
• SPSS produces a panel with information about KMO for the overall set of variables, as well as Bartlett’s test
Kaiser-Meyer-Olkin Measure of Sampling Adequacy
.791
Bartlett’s Test of Sphericity
Approx. Chi-Square 3162.796
df 55
Sig. .000
Copyright ©2010 by Pearson Education, Inc.Upper Saddle River, New Jersey 07458
All rights reserved.
Statistics and Data Analysis for Nursing Research, Second EditionDenise F. Polit
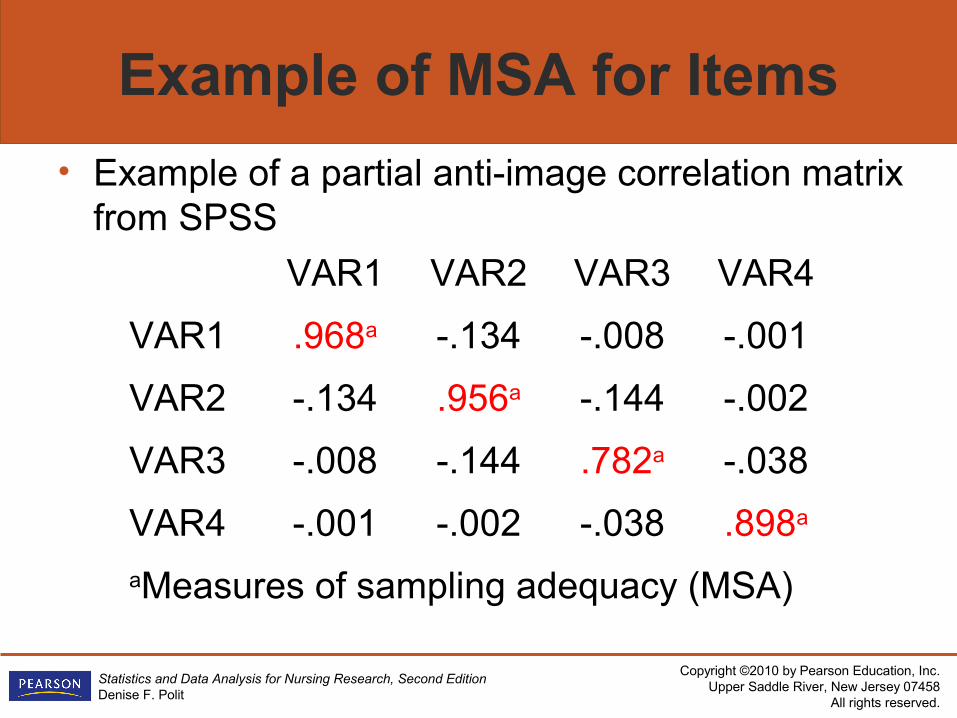
MSA for Items
• A measure of sampling adequacy (MSA) is also computed for individual items
• Information appears on the diagonal of the anti-image correlation matrix – This is a matrix of the negatives of partial
correlations among variables after factor analysis, partialling out all other variables
Copyright ©2010 by Pearson Education, Inc.Upper Saddle River, New Jersey 07458
All rights reserved.
Statistics and Data Analysis for Nursing Research, Second EditionDenise F. Polit
Example of MSA for Items
• Example of a partial anti-image correlation matrix from SPSS
VAR1 VAR2 VAR3 VAR4
VAR1 .968a -.134 -.008 -.001
VAR2 -.134 .956a -.144 -.002
VAR3 -.008 -.144 .782a -.038
VAR4 -.001 -.002 -.038 .898a
aMeasures of sampling adequacy (MSA)
Copyright ©2010 by Pearson Education, Inc.Upper Saddle River, New Jersey 07458
All rights reserved.
Statistics and Data Analysis for Nursing Research, Second EditionDenise F. Polit
Factor Extraction
• After establishing factorability, the next step is factor extraction
• Factor extraction seeks clusters of intercorrelated variables in the correlation matrix and extracts as much variance as possible from the common factors
• Two basic approaches:– Principal components analysis– Common factor analysis
Copyright ©2010 by Pearson Education, Inc.Upper Saddle River, New Jersey 07458
All rights reserved.
Statistics and Data Analysis for Nursing Research, Second EditionDenise F. Polit
Principal Components Analysis
• Principal components analysis (PCA) differs from other approaches, and some do not call it factor analysis
• At issue is what is placed on the diagonal of the correlation matrix
• PCA analyzes all variance in the variables, not just common factor variance– Thus, in PCA, all diagonal values are 1s
Copyright ©2010 by Pearson Education, Inc.Upper Saddle River, New Jersey 07458
All rights reserved.
Statistics and Data Analysis for Nursing Research, Second EditionDenise F. Polit
How PCA Works
• PCA creates successive linear combinations of observed variables (which are standardized to have a mean = 0 and a variance = 1)
• First factor (component) accounts for the largest amount of variance, using the least-squares criterion
Copyright ©2010 by Pearson Education, Inc.Upper Saddle River, New Jersey 07458
All rights reserved.
Statistics and Data Analysis for Nursing Research, Second EditionDenise F. Polit
How PCA Works (cont’d)
• Next factor (component) is extracted from residual correlations—It accounts for the second largest amount of variance that is uncorrelated with first factor
Copyright ©2010 by Pearson Education, Inc.Upper Saddle River, New Jersey 07458
All rights reserved.
Statistics and Data Analysis for Nursing Research, Second EditionDenise F. Polit
How PCA Works (cont’d)
• Successive extraction continues until 100% of total variance is accounted for
• This means that there are as many factors as variables in PCA, but only the first few account for much variance
Copyright ©2010 by Pearson Education, Inc.Upper Saddle River, New Jersey 07458
All rights reserved.
Statistics and Data Analysis for Nursing Research, Second EditionDenise F. Polit
PCA Communalities for Six Cognitive Tests
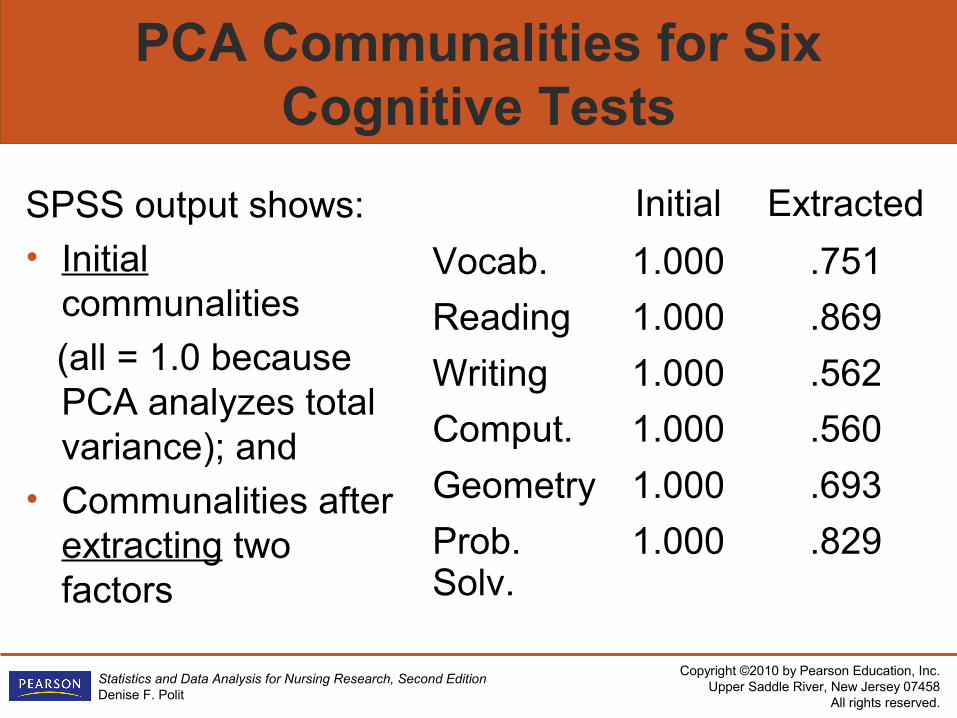
SPSS output shows:• Initial
communalities
(all = 1.0 because PCA analyzes total variance); and
• Communalities after extracting two factors
Initial Extracted
Vocab. 1.000 .751
Reading 1.000 .869
Writing 1.000 .562
Comput. 1.000 .560
Geometry 1.000 .693
Prob. Solv.
1.000 .829
Copyright ©2010 by Pearson Education, Inc.Upper Saddle River, New Jersey 07458
All rights reserved.
Statistics and Data Analysis for Nursing Research, Second EditionDenise F. Polit
PCA Table of Eigenvalues
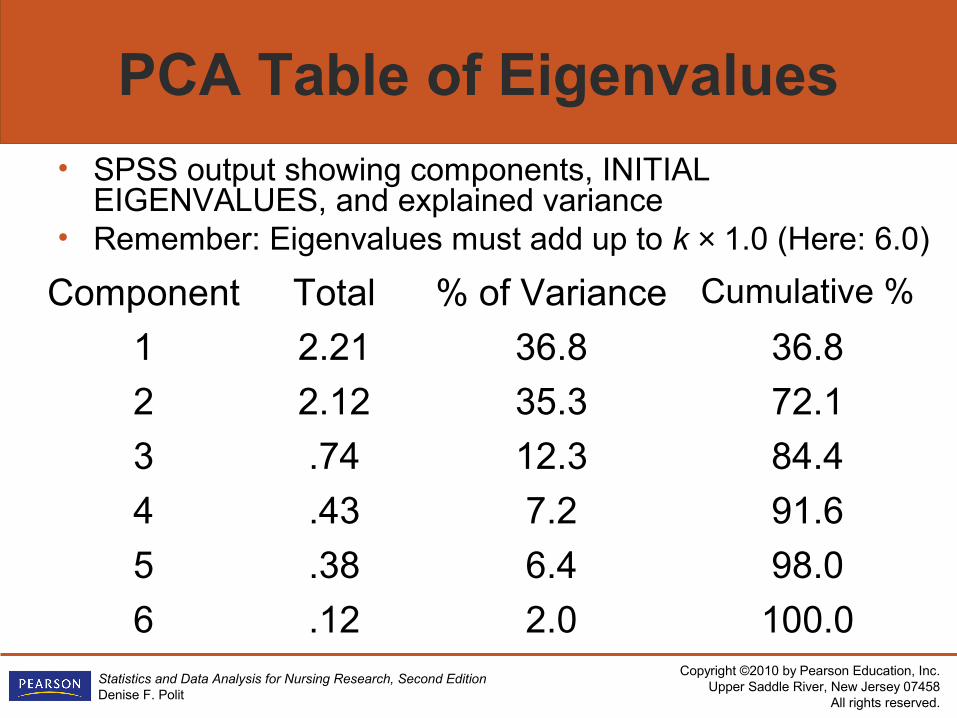
• SPSS output showing components, INITIAL EIGENVALUES, and explained variance
• Remember: Eigenvalues must add up to k × 1.0 (Here: 6.0)
Component Total % of Variance Cumulative %
1 2.21 36.8 36.8
2 2.12 35.3 72.1
3 .74 12.3 84.4
4 .43 7.2 91.6
5 .38 6.4 98.0
6 .12 2.0 100.0
Copyright ©2010 by Pearson Education, Inc.Upper Saddle River, New Jersey 07458
All rights reserved.
Statistics and Data Analysis for Nursing Research, Second EditionDenise F. Polit
Common Factor Variance Analysis
• In “real” factor analysis, only common factor variance is factor analyzed; unique variance (error + variable specific variance) is excluded
• In common factor variance analysis, the diagonals of the correlation matrix are not 1s
Copyright ©2010 by Pearson Education, Inc.Upper Saddle River, New Jersey 07458
All rights reserved.
Statistics and Data Analysis for Nursing Research, Second EditionDenise F. Polit
Methods of Common Factor Extraction
• There are many alternative methods; six are available in SPSS, all using different mathematical solutions:– Principal factor – Maximum likelihood– Alpha– Unweighted least squares– Generalized least squares– Image
Copyright ©2010 by Pearson Education, Inc.Upper Saddle River, New Jersey 07458
All rights reserved.
Statistics and Data Analysis for Nursing Research, Second EditionDenise F. Polit
Principal Axis Factoring
• The most widely used common factor variance method is principal factors (often called principal-axis factoring):– With this method, estimates of communalities, not 1s,
are placed on the diagonal
– Initial estimates are the values of R2 for a specified variable, with all other variables as predictors
– As with PCA, the goal is to extract the largest possible amount of variance with each successive factor
Copyright ©2010 by Pearson Education, Inc.Upper Saddle River, New Jersey 07458
All rights reserved.
Statistics and Data Analysis for Nursing Research, Second EditionDenise F. Polit
Number of Factors to Extract
• Key decision in factor analysis: How many factors should be extracted?
• Two competing goals in making this decision:– Maximizing amount of explained variance– Achieving a parsimonious structure
Copyright ©2010 by Pearson Education, Inc.Upper Saddle River, New Jersey 07458
All rights reserved.
Statistics and Data Analysis for Nursing Research, Second EditionDenise F. Polit
Criteria for Number of Factors
• Various criteria have been proposed for deciding on number of factors:– The Kaiser-Guttman rule: Initial eigenvalue
from a PCA > 1.0– Exclusion of any factors that account for less
than 5.0% of variance– The scree test—Plot of eigenvalues shows
sharp discontinuity, change of slope of line; is not always clear cut
Copyright ©2010 by Pearson Education, Inc.Upper Saddle River, New Jersey 07458
All rights reserved.
Statistics and Data Analysis for Nursing Research, Second EditionDenise F. Polit
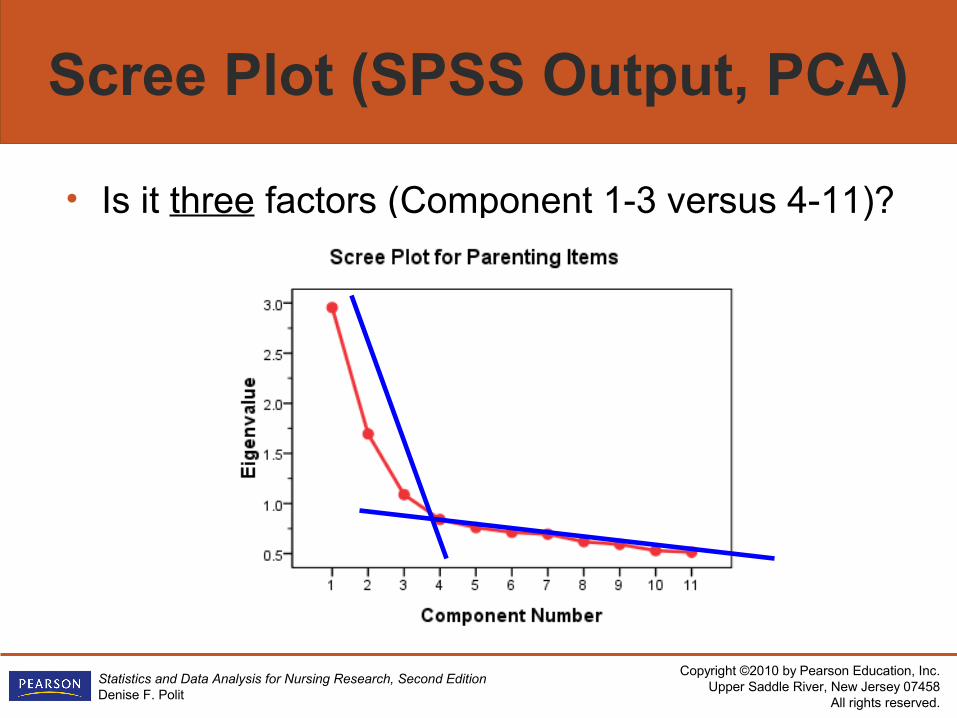
Scree Plot (SPSS Output, PCA)
• Is it three factors (Component 1-3 versus 4-11)?
Copyright ©2010 by Pearson Education, Inc.Upper Saddle River, New Jersey 07458
All rights reserved.
Statistics and Data Analysis for Nursing Research, Second EditionDenise F. Polit
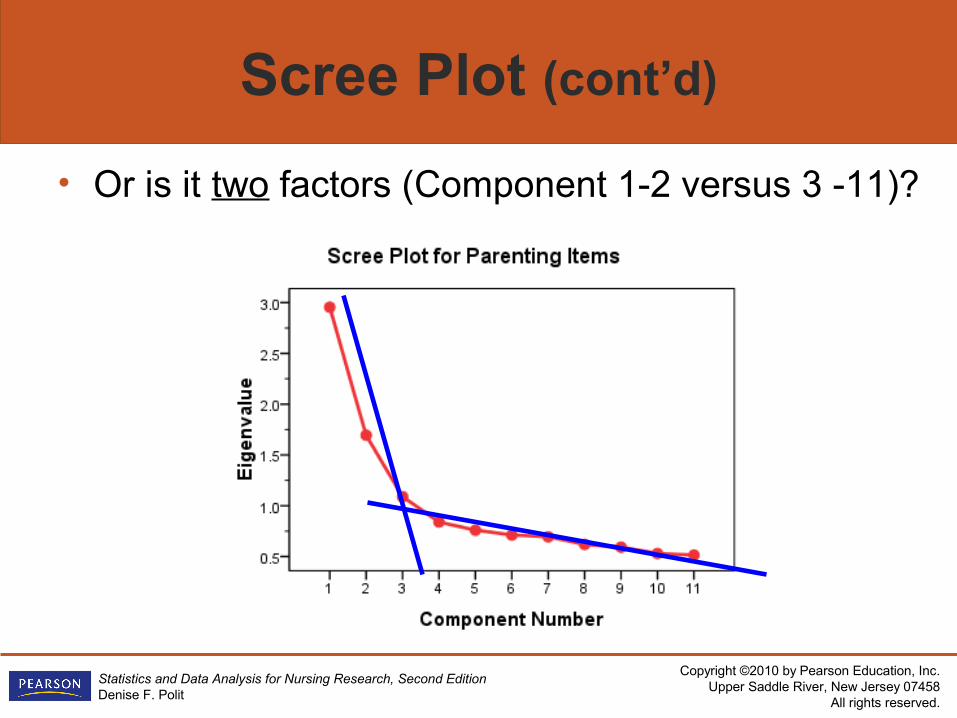
Scree Plot (cont’d)
• Or is it two factors (Component 1-2 versus 3 -11)?
Copyright ©2010 by Pearson Education, Inc.Upper Saddle River, New Jersey 07458
All rights reserved.
Statistics and Data Analysis for Nursing Research, Second EditionDenise F. Polit
Factor Rotation
• Once the number of factors has been decided, next step is factor rotation
• Original (unrotated) factor matrixes are often difficult to interpret; the goal of factor rotation is to make factors more interpretable
• Rotated factors are mathematically equivalent to unrotated ones
Copyright ©2010 by Pearson Education, Inc.Upper Saddle River, New Jersey 07458
All rights reserved.
Statistics and Data Analysis for Nursing Research, Second EditionDenise F. Polit
Basic Principles of Rotation
• Rotation is easiest to explain graphically• The factor loadings are graphed against
a set of axes; in this illustration (next slide), assume we have six tests, labeled A-F, and two factors (verbal abilities and mathematic ability)
• Factor loadings can be read against the values on the axis:– In the unrotated space, all six tests have
high values on both axes
Copyright ©2010 by Pearson Education, Inc.Upper Saddle River, New Jersey 07458
All rights reserved.
Statistics and Data Analysis for Nursing Research, Second EditionDenise F. Polit
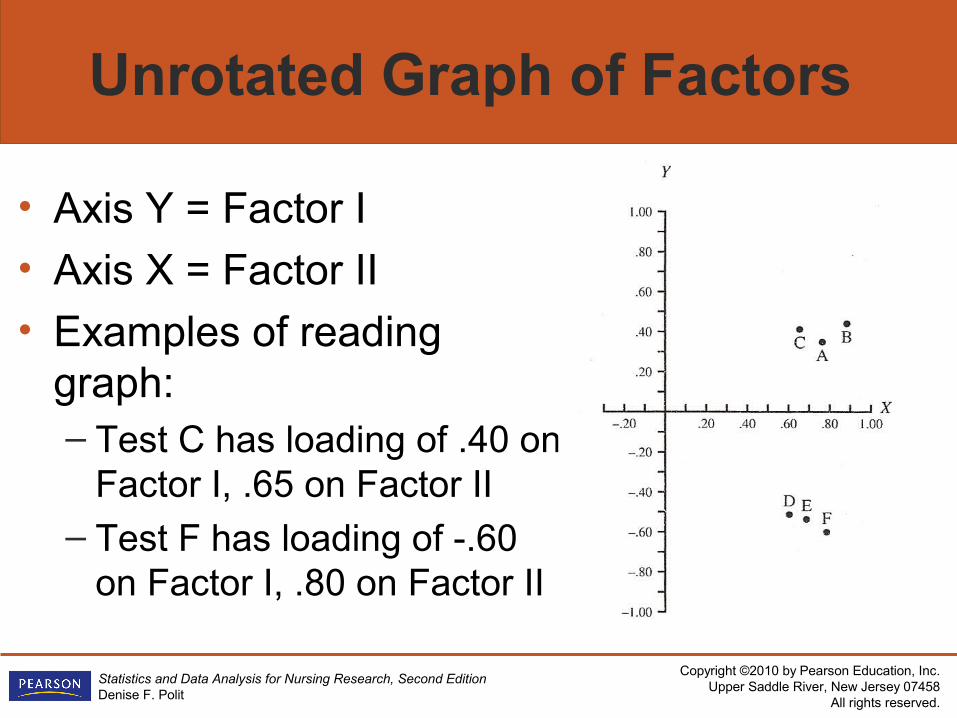
Unrotated Graph of Factors
• Axis Y = Factor I• Axis X = Factor II• Examples of reading
graph:– Test C has loading of .40 on
Factor I, .65 on Factor II– Test F has loading of -.60
on Factor I, .80 on Factor II
Copyright ©2010 by Pearson Education, Inc.Upper Saddle River, New Jersey 07458
All rights reserved.
Statistics and Data Analysis for Nursing Research, Second EditionDenise F. Polit
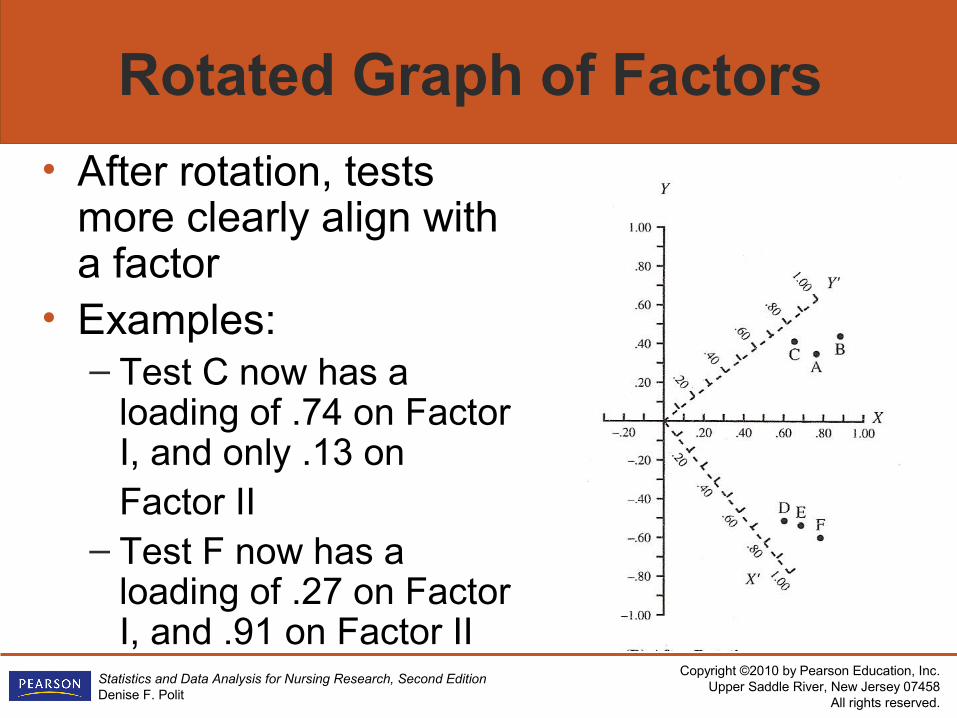
Rotated Graph of Factors
• After rotation, tests more clearly align with a factor
• Examples:– Test C now has a
loading of .74 on Factor I, and only .13 on Factor II
– Test F now has a loading of .27 on Factor I, and .91 on Factor II
Copyright ©2010 by Pearson Education, Inc.Upper Saddle River, New Jersey 07458
All rights reserved.
Statistics and Data Analysis for Nursing Research, Second EditionDenise F. Polit
Methods of Rotation
• Researchers must also decide on a method of rotation
• Two approaches:– Orthogonal rotation– Oblique rotation
Copyright ©2010 by Pearson Education, Inc.Upper Saddle River, New Jersey 07458
All rights reserved.
Statistics and Data Analysis for Nursing Research, Second EditionDenise F. Polit
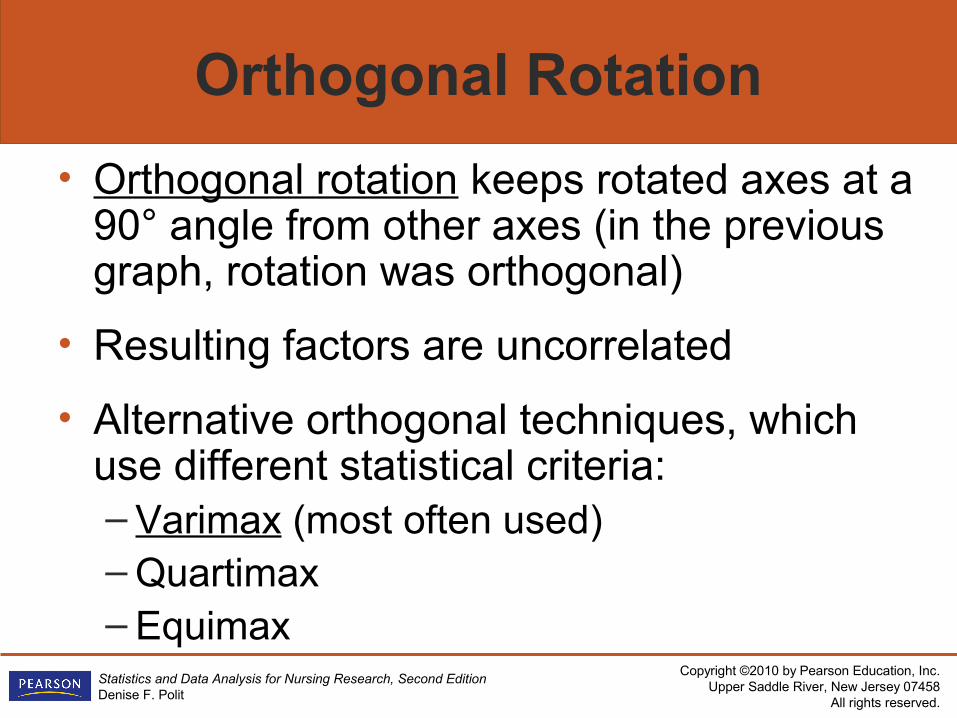
Orthogonal Rotation
• Orthogonal rotation keeps rotated axes at a 90° angle from other axes (in the previous graph, rotation was orthogonal)
• Resulting factors are uncorrelated
• Alternative orthogonal techniques, which use different statistical criteria:– Varimax (most often used)– Quartimax– Equimax
Copyright ©2010 by Pearson Education, Inc.Upper Saddle River, New Jersey 07458
All rights reserved.
Statistics and Data Analysis for Nursing Research, Second EditionDenise F. Polit
Orthogonal Rotation Product
• The product of orthogonal rotation is a rotated factor matrix
• The loadings in a factor matrix represent the correlation between each variable and the underlying factor
Copyright ©2010 by Pearson Education, Inc.Upper Saddle River, New Jersey 07458
All rights reserved.
Statistics and Data Analysis for Nursing Research, Second EditionDenise F. Polit
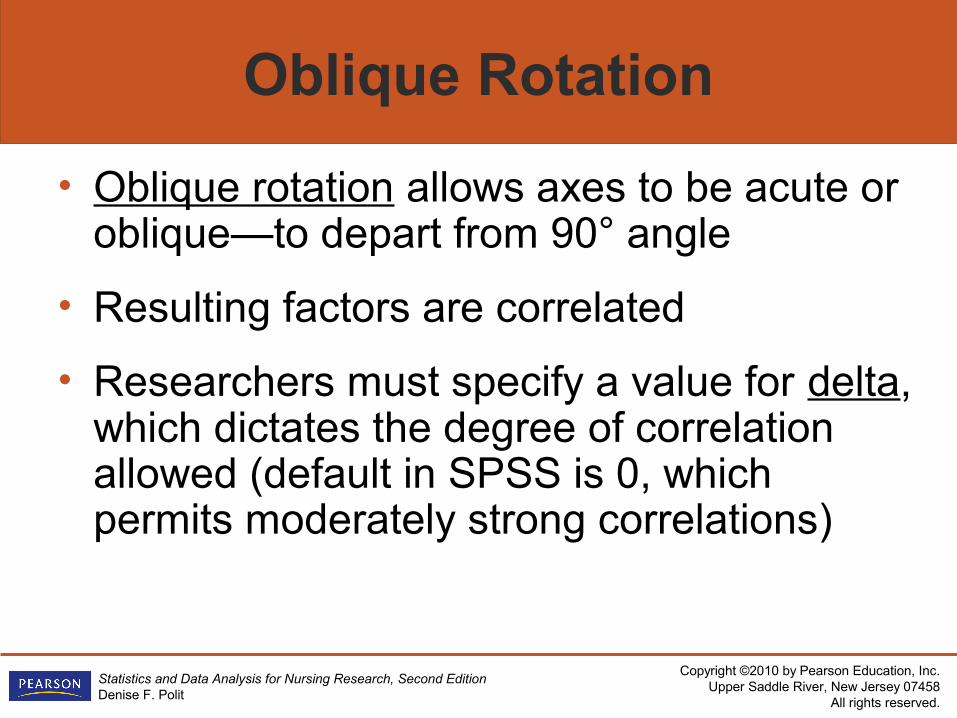
Oblique Rotation
• Oblique rotation allows axes to be acute or oblique—to depart from 90° angle
• Resulting factors are correlated
• Researchers must specify a value for delta, which dictates the degree of correlation allowed (default in SPSS is 0, which permits moderately strong correlations)
Copyright ©2010 by Pearson Education, Inc.Upper Saddle River, New Jersey 07458
All rights reserved.
Statistics and Data Analysis for Nursing Research, Second EditionDenise F. Polit
Oblique Rotation (cont’d)
• Alternative oblique techniques that use different statistical criteria:– Direct oblimin (most often used)– Promax
Copyright ©2010 by Pearson Education, Inc.Upper Saddle River, New Jersey 07458
All rights reserved.
Statistics and Data Analysis for Nursing Research, Second EditionDenise F. Polit
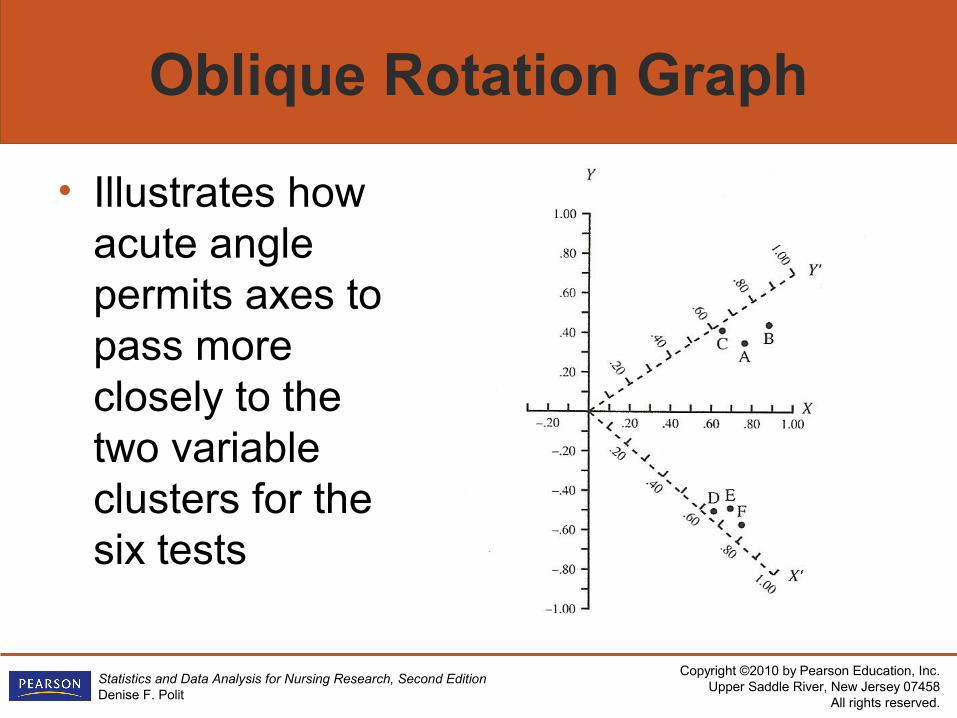
Oblique Rotation Graph
• Illustrates how acute angle permits axes to pass more closely to the two variable clusters for the six tests
Copyright ©2010 by Pearson Education, Inc.Upper Saddle River, New Jersey 07458
All rights reserved.
Statistics and Data Analysis for Nursing Research, Second EditionDenise F. Polit
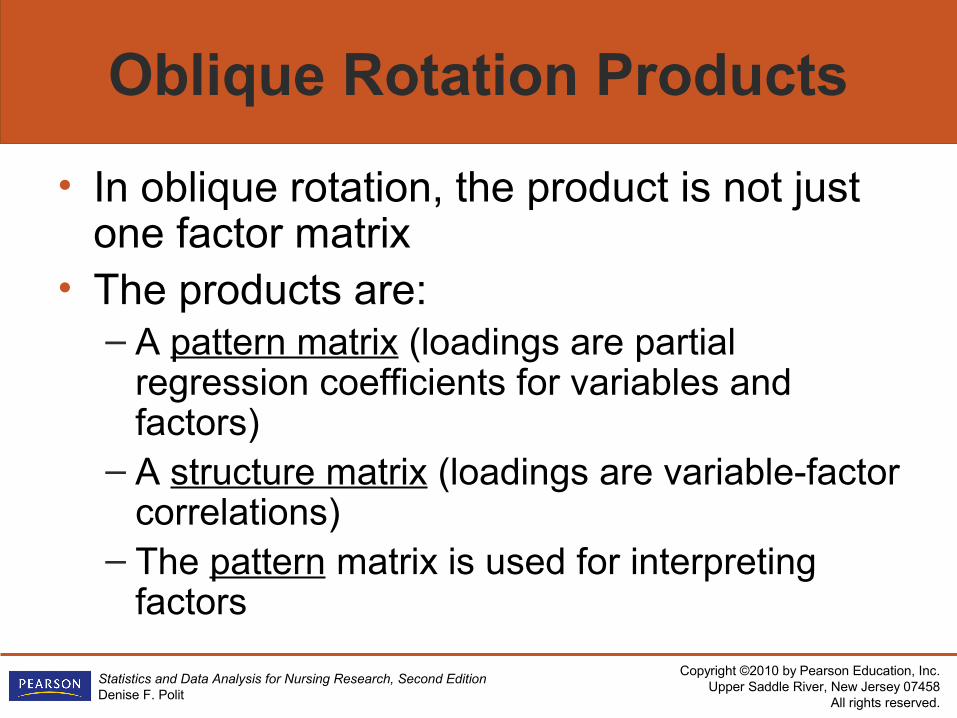
Oblique Rotation Products
• In oblique rotation, the product is not just one factor matrix
• The products are:– A pattern matrix (loadings are partial
regression coefficients for variables and factors)
– A structure matrix (loadings are variable-factor correlations)
– The pattern matrix is used for interpreting factors
Copyright ©2010 by Pearson Education, Inc.Upper Saddle River, New Jersey 07458
All rights reserved.
Statistics and Data Analysis for Nursing Research, Second EditionDenise F. Polit
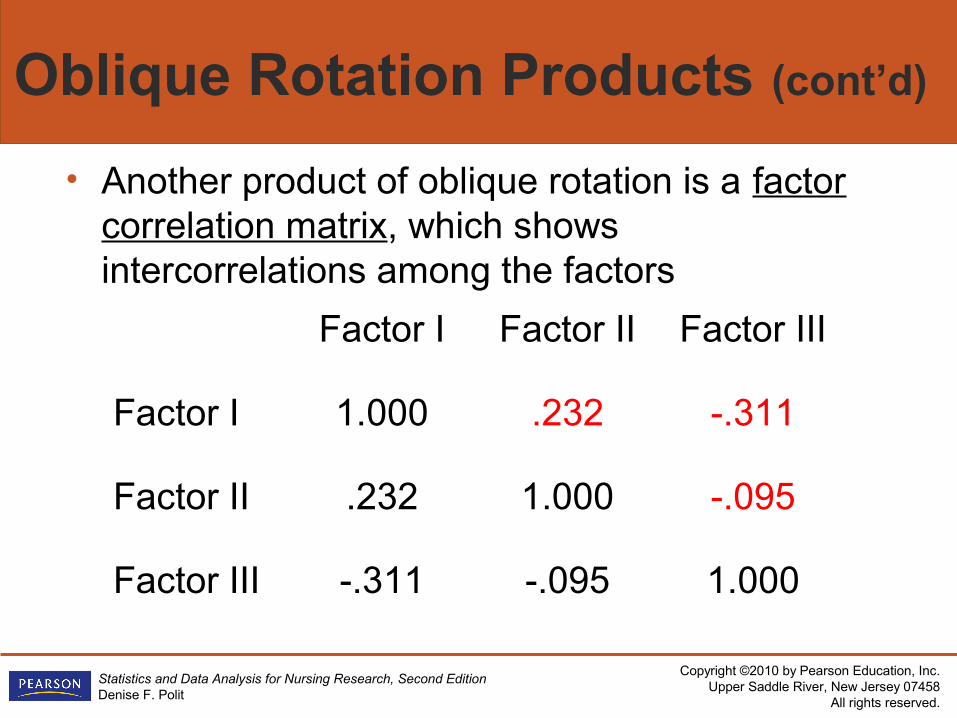
Oblique Rotation Products (cont’d)
• Another product of oblique rotation is a factor correlation matrix, which shows intercorrelations among the factors
Factor I Factor II Factor III
Factor I 1.000 .232 -.311
Factor II .232 1.000 -.095
Factor III -.311 -.095 1.000
Copyright ©2010 by Pearson Education, Inc.Upper Saddle River, New Jersey 07458
All rights reserved.
Statistics and Data Analysis for Nursing Research, Second EditionDenise F. Polit
Orthogonal Versus Oblique
• Controversial—Not in 100% agreement• Orthogonal advantages—Greater theoretical
clarity; easier to compare factor structures across studies; often, easier to interpret
Copyright ©2010 by Pearson Education, Inc.Upper Saddle River, New Jersey 07458
All rights reserved.
Statistics and Data Analysis for Nursing Research, Second EditionDenise F. Polit
Orthogonal Versus Oblique (cont’d)
• Oblique advantage—Better correspondence to “the real world” where constructs are intercorrelated
• Advice: If correlations among obliquely rotated factors are low (< .30), stick with orthogonal
Copyright ©2010 by Pearson Education, Inc.Upper Saddle River, New Jersey 07458
All rights reserved.
Statistics and Data Analysis for Nursing Research, Second EditionDenise F. Polit
Interpretation in Factor Analysis
• Interpretation (and naming a factor) involves inferring what it is that variables with high loadings on a factor have in common
• What is a high loading? A minimum of .30, but .40 is considered a better criterion
• A marker variable is useful for interpretation—It has very high loadings on one factor (e.g., > .70), and does not load on other factors
Copyright ©2010 by Pearson Education, Inc.Upper Saddle River, New Jersey 07458
All rights reserved.
Statistics and Data Analysis for Nursing Research, Second EditionDenise F. Polit
Interpretation Problems
• Interpretive problems arise when:– Some variables have high loadings on two or
more factors
– Some factors have only one or two variables with high loadings
– The + or – signs on the loadings do not make sense conceptually
– There is a method factor—A factor reflecting not a substantive construct but a methodological one
Copyright ©2010 by Pearson Education, Inc.Upper Saddle River, New Jersey 07458
All rights reserved.
Statistics and Data Analysis for Nursing Research, Second EditionDenise F. Polit
Refinements in Factor Analysis
• Interpretive problems are not uncommon, and are usually addressed by using preliminary evidence from the original analysis to guide further exploration and refinements, such as:– Eliminating one or more variable/item– Changing the number of factors to extract and
rotate
– Using a different extraction method– Using a different rotation method
Copyright ©2010 by Pearson Education, Inc.Upper Saddle River, New Jersey 07458
All rights reserved.
Statistics and Data Analysis for Nursing Research, Second EditionDenise F. Polit
Factor Scores
• Once the factor analysis is finalized, researchers can immediately use the results to create factor scores—Numerical values assigned to each sample member to quantify “how much” of each abstract construct each person has
• Factor scores are then used in lieu of the original variables as independent or dependent variables in subsequent analyses
Copyright ©2010 by Pearson Education, Inc.Upper Saddle River, New Jersey 07458
All rights reserved.
Statistics and Data Analysis for Nursing Research, Second EditionDenise F. Polit
Factor Scores (cont’d)
• Factor scores are computed using the factor loadings to “weight” each original item, and then summing all weighted values
• There are three methods of creating factor scores in SPSS: – Regression – Anderson-Rubin– Bartlett
Copyright ©2010 by Pearson Education, Inc.Upper Saddle River, New Jersey 07458
All rights reserved.
Statistics and Data Analysis for Nursing Research, Second EditionDenise F. Polit
Unit-Scoring of New Scales
• Most often, researchers do not develop loading-weighted factor scores
• Typical procedure:– Identify which items (variables) belong to a factor (have high
loadings)– Sum the original data values for each person on those high
loading items—Do not weight items by the magnitude of the loadings
– Do not include variables with low loadings on a specified factor
– May need to reverse score some variables so that all items are scored in a consistent direction
Copyright ©2010 by Pearson Education, Inc.Upper Saddle River, New Jersey 07458
All rights reserved.
Statistics and Data Analysis for Nursing Research, Second EditionDenise F. Polit
SPSS and Factor Analysis
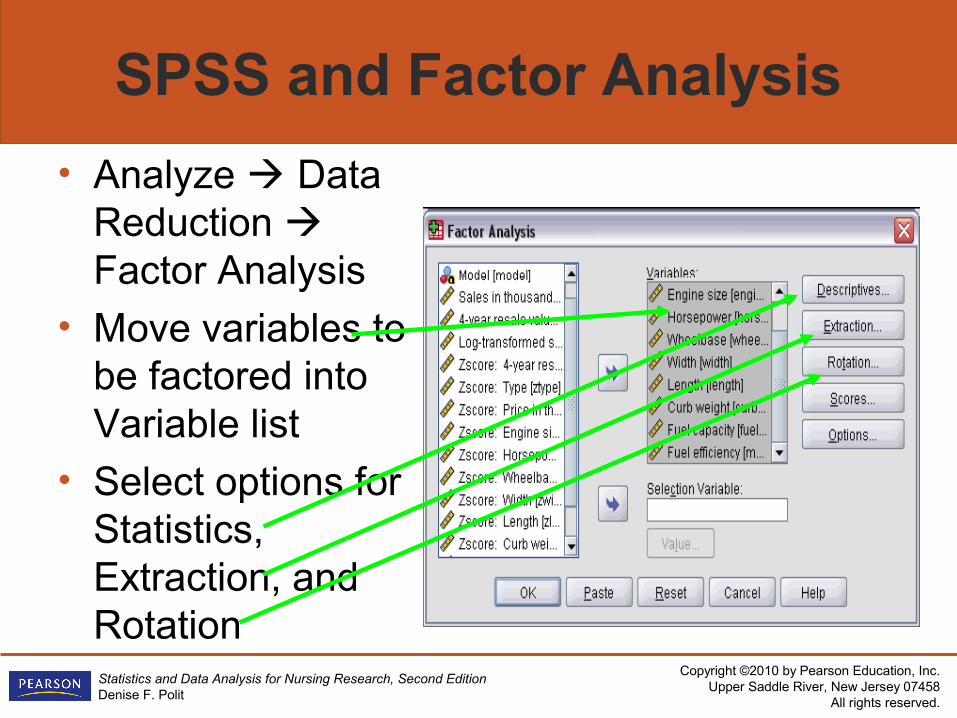
• Analyze Data Reduction Factor Analysis
• Move variables to be factored into Variable list
• Select options for Statistics, Extraction, and Rotation
Copyright ©2010 by Pearson Education, Inc.Upper Saddle River, New Jersey 07458
All rights reserved.
Statistics and Data Analysis for Nursing Research, Second EditionDenise F. Polit
SPSS and Factor Analysis (cont’d)
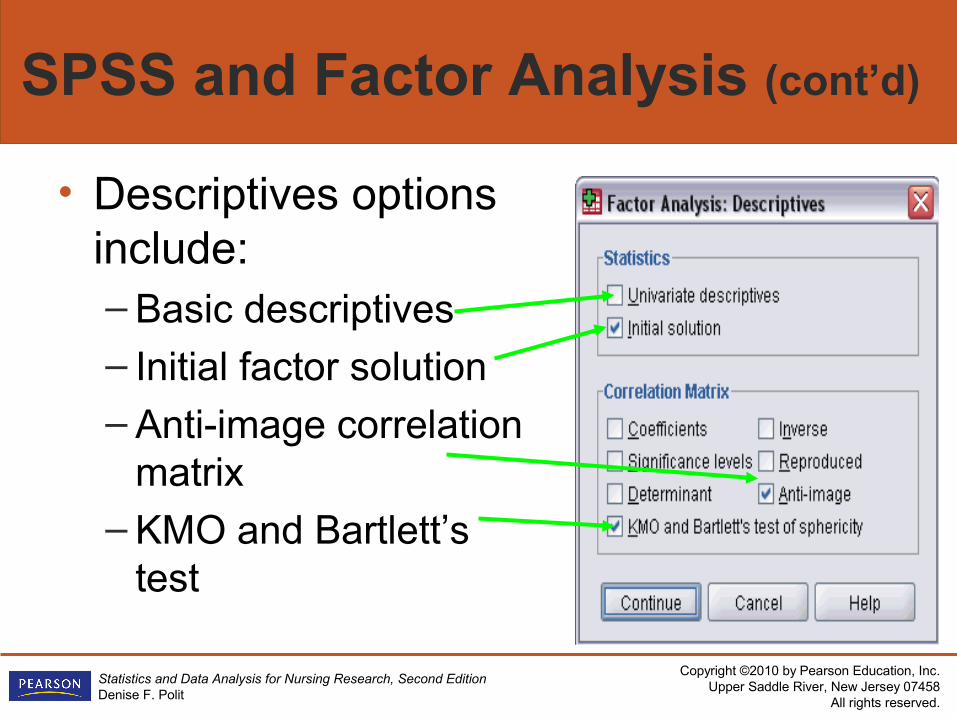
• Descriptives options include:– Basic descriptives– Initial factor solution– Anti-image correlation
matrix
– KMO and Bartlett’s test
Copyright ©2010 by Pearson Education, Inc.Upper Saddle River, New Jersey 07458
All rights reserved.
Statistics and Data Analysis for Nursing Research, Second EditionDenise F. Polit
SPSS and Factor Analysis (cont’d)
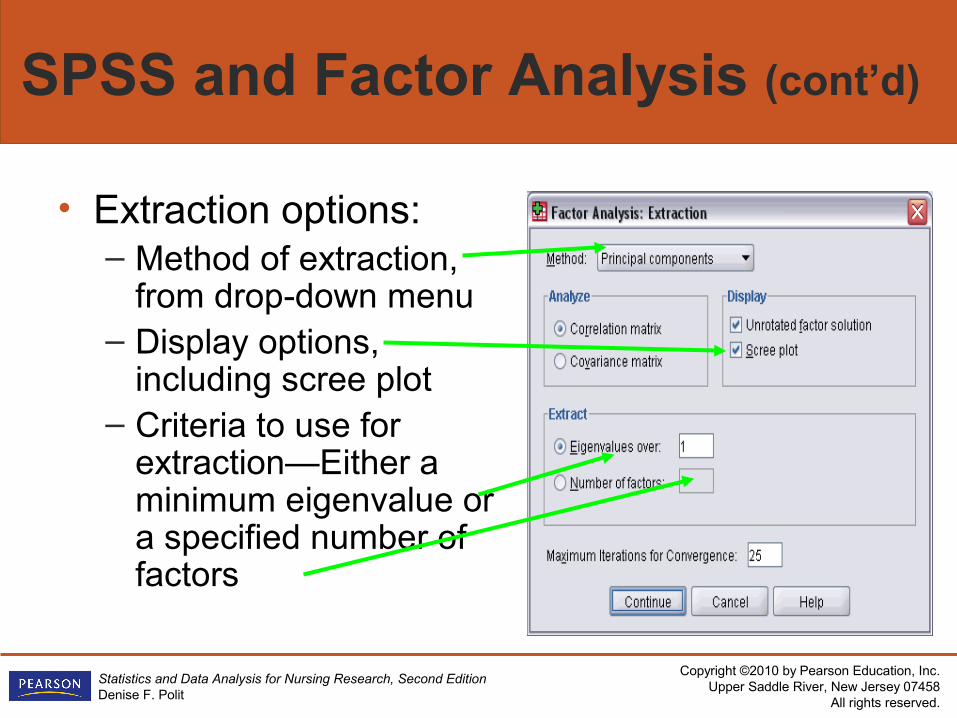
• Extraction options:– Method of extraction,
from drop-down menu– Display options,
including scree plot– Criteria to use for
extraction—Either a minimum eigenvalue or a specified number of factors
Copyright ©2010 by Pearson Education, Inc.Upper Saddle River, New Jersey 07458
All rights reserved.
Statistics and Data Analysis for Nursing Research, Second EditionDenise F. Polit
SPSS and Factor Analysis (cont’d)
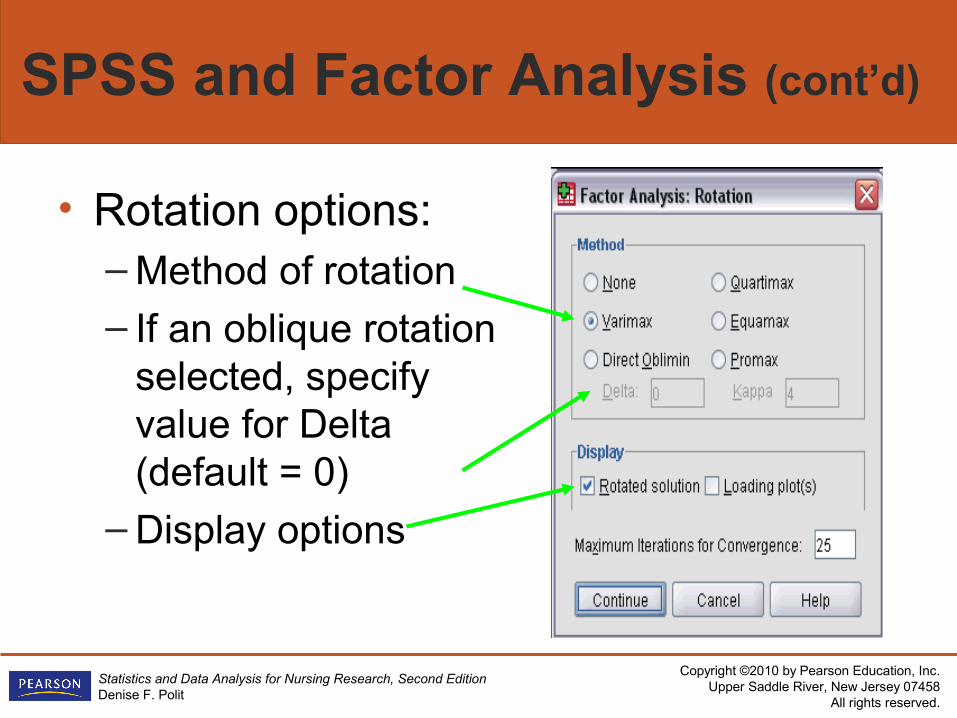
• Rotation options:– Method of rotation
– If an oblique rotation selected, specify value for Delta (default = 0)
– Display options
Copyright ©2010 by Pearson Education, Inc.Upper Saddle River, New Jersey 07458
All rights reserved.
Statistics and Data Analysis for Nursing Research, Second EditionDenise F. Polit
SPSS and Factor Analysis (cont’d)
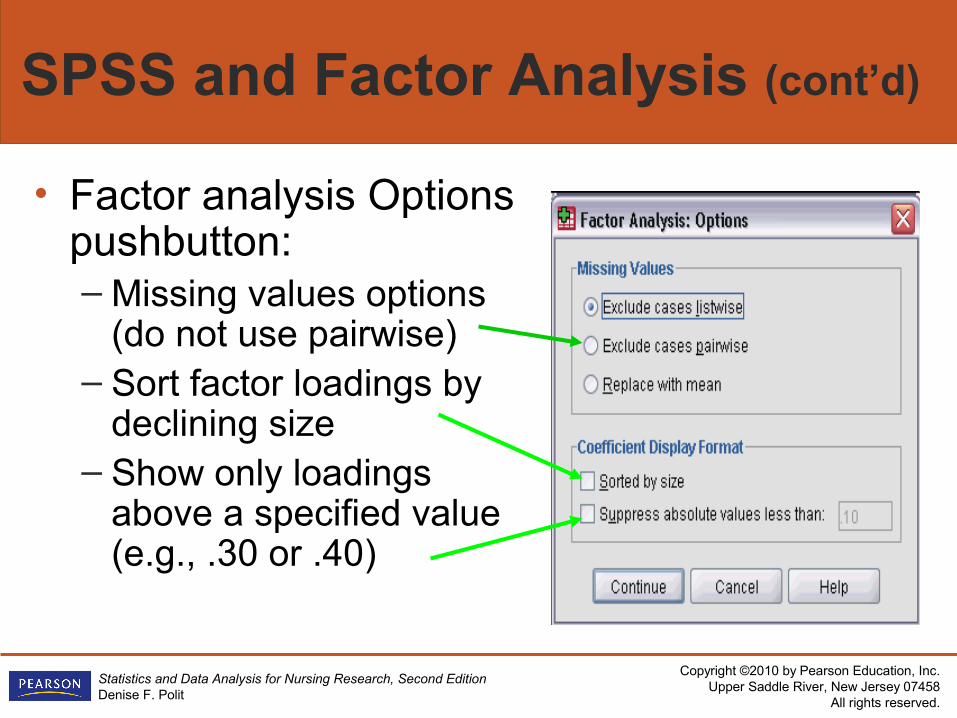
• Factor analysis Options pushbutton:– Missing values options
(do not use pairwise) – Sort factor loadings by
declining size– Show only loadings
above a specified value (e.g., .30 or .40)
Copyright ©2010 by Pearson Education, Inc.Upper Saddle River, New Jersey 07458
All rights reserved.
Statistics and Data Analysis for Nursing Research, Second EditionDenise F. Polit
Basic Reliability Concepts
• Scores on multi-item, factor-analyzed scales should be evaluated for their reliability (their accuracy in measuring the target attribute)
• Perfectly reliable instruments would yield measurements of a person’s true score on an attribute– But true scores are hypothetical, not real
Copyright ©2010 by Pearson Education, Inc.Upper Saddle River, New Jersey 07458
All rights reserved.
Statistics and Data Analysis for Nursing Research, Second EditionDenise F. Polit
Basic Reliability Concepts (cont’d)
• Errors of measurement are factors that make it impossible to obtain a true score– Measurement errors could reflect a
respondent’s failure to understand the item, fatigue, boredom, poorly worded items, etc.
– In multi-item scales, a major source of measurement error concerns the sampling of items from a hypothetical universe of all items that could measure a construct
Copyright ©2010 by Pearson Education, Inc.Upper Saddle River, New Jersey 07458
All rights reserved.
Statistics and Data Analysis for Nursing Research, Second EditionDenise F. Polit
Internal Consistency Reliability
• Internal consistency reliability is the extent to which the different subparts of the scale (items) are reliably and consistently measuring the critical attribute—The degree to which the items are converging on the underlying construct
Copyright ©2010 by Pearson Education, Inc.Upper Saddle River, New Jersey 07458
All rights reserved.
Statistics and Data Analysis for Nursing Research, Second EditionDenise F. Polit
Cronbach’s Alpha
• The most widely used index for estimating internal consistency reliability is Cronbach’s alpha (coefficient alpha)
• Alpha is an index that compares the sum of all item variances to the variance of the entire scale– If the items are all measuring the same
underlying construct, scale variance is much greater than the variance of individual items
Copyright ©2010 by Pearson Education, Inc.Upper Saddle River, New Jersey 07458
All rights reserved.
Statistics and Data Analysis for Nursing Research, Second EditionDenise F. Polit
Cronbach’s Alpha (cont’d)
• Alpha ranges from .00 to 1.00, and high values are desirable—Preferably .80 or higher
• The more items there are in a scale, the greater the value of alpha tends to be (at least up to a point)– It is difficult to achieve adequate reliability on
scales with only three to four items• Alpha can be interpreted as the proportion
of true variability to total variability in scores

Copyright ©2010 by Pearson Education, Inc.Upper Saddle River, New Jersey 07458
All rights reserved.
Statistics and Data Analysis for Nursing Research, Second EditionDenise F. Polit
Reliability Analysis
• IN SPSS, reliability analysis will compute both alpha and standardized alpha (the value for item scores standardized to a mean of 0 and a variance of 1.0)
• The printout includes a lot of diagnostic information to help you evaluate whether it makes sense to retain all items on the scale
Copyright ©2010 by Pearson Education, Inc.Upper Saddle River, New Jersey 07458
All rights reserved.
Statistics and Data Analysis for Nursing Research, Second EditionDenise F. Polit
Reliability Output: Item-Total Info
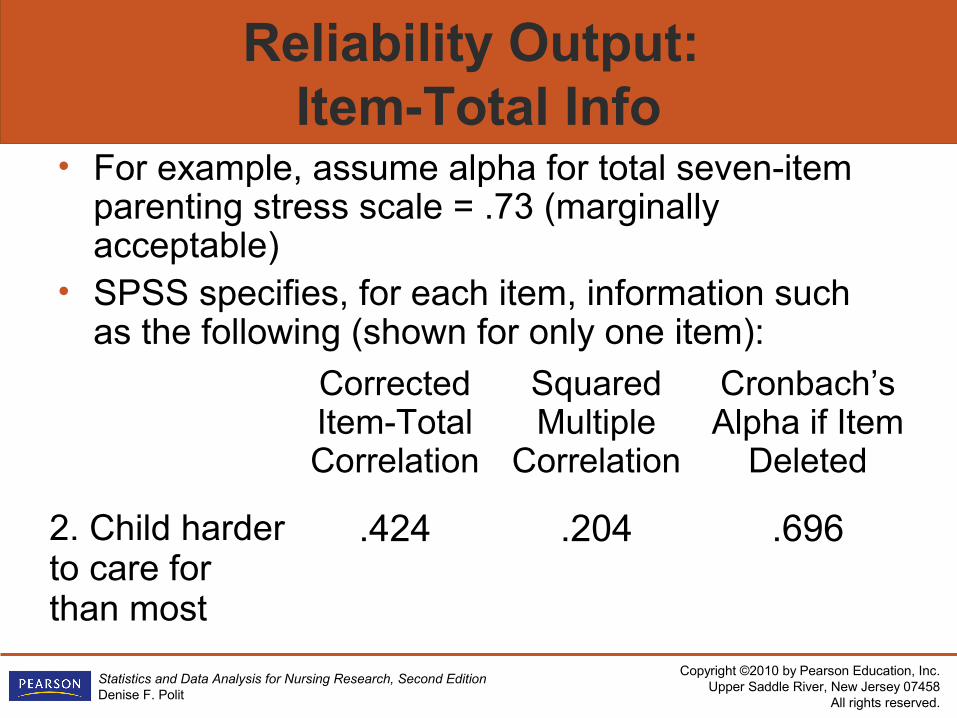
• For example, assume alpha for total seven-item parenting stress scale = .73 (marginally acceptable)
• SPSS specifies, for each item, information such as the following (shown for only one item):
Corrected Item-Total Correlation
Squared Multiple
Correlation
Cronbach’s Alpha if Item
Deleted
2. Child harder to care for than most
.424 .204 .696
Copyright ©2010 by Pearson Education, Inc.Upper Saddle River, New Jersey 07458
All rights reserved.
Statistics and Data Analysis for Nursing Research, Second EditionDenise F. Polit
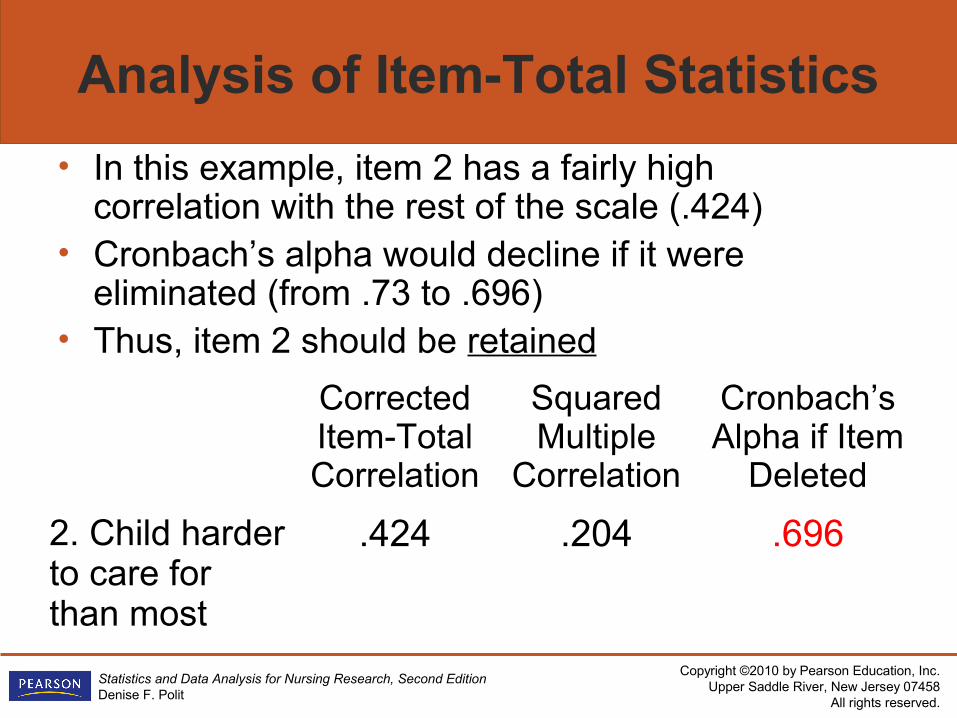
Analysis of Item-Total Statistics
• In this example, item 2 has a fairly high correlation with the rest of the scale (.424)
• Cronbach’s alpha would decline if it were eliminated (from .73 to .696)
• Thus, item 2 should be retained
Corrected Item-Total Correlation
Squared Multiple
Correlation
Cronbach’s Alpha if Item
Deleted
2. Child harder to care for than most
.424 .204 .696
Copyright ©2010 by Pearson Education, Inc.Upper Saddle River, New Jersey 07458
All rights reserved.
Statistics and Data Analysis for Nursing Research, Second EditionDenise F. Polit
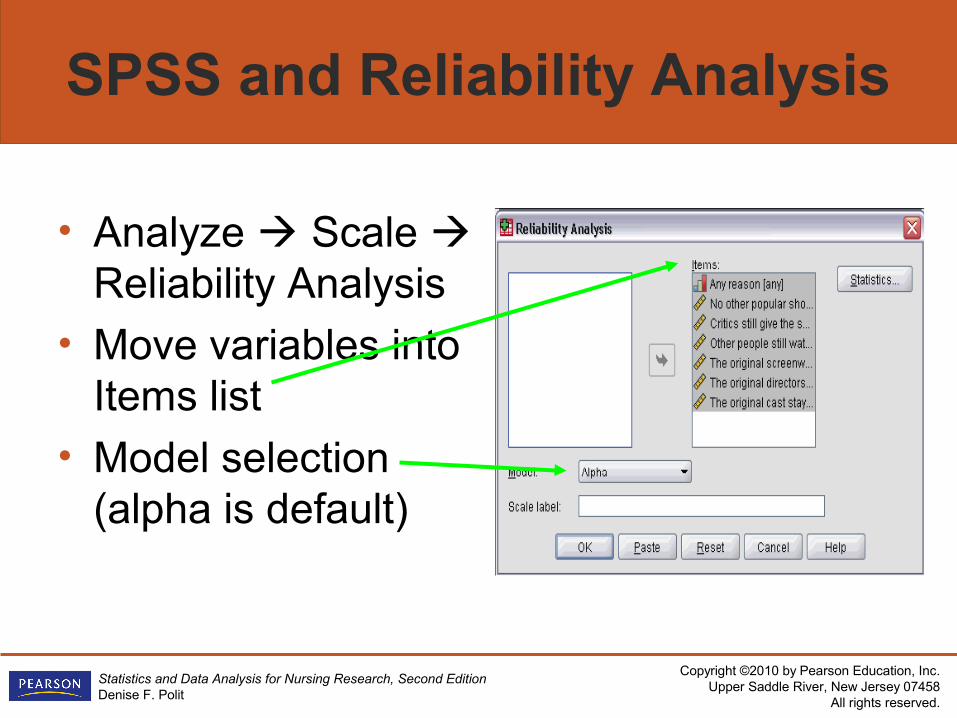
SPSS and Reliability Analysis
• Analyze Scale Reliability Analysis
• Move variables into Items list
• Model selection (alpha is default)
Copyright ©2010 by Pearson Education, Inc.Upper Saddle River, New Jersey 07458
All rights reserved.
Statistics and Data Analysis for Nursing Research, Second EditionDenise F. Polit
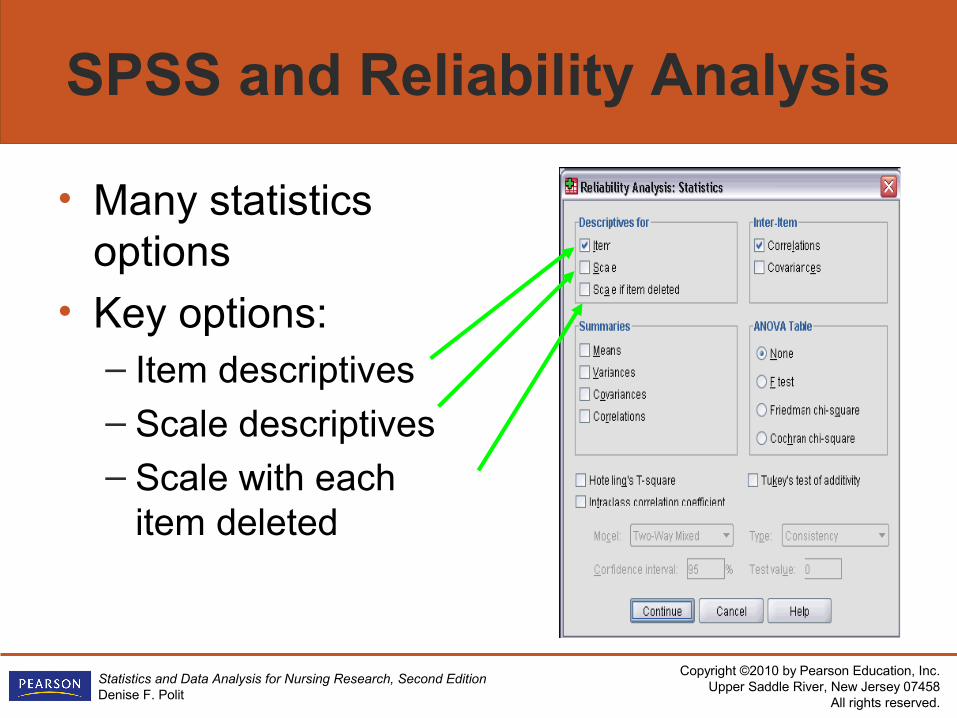
SPSS and Reliability Analysis
• Many statistics options
• Key options:– Item descriptives– Scale descriptives– Scale with each
item deleted