Embed Size (px)
Citation preview

Pollen Tube Model
Speaker: Chun-hui Cai
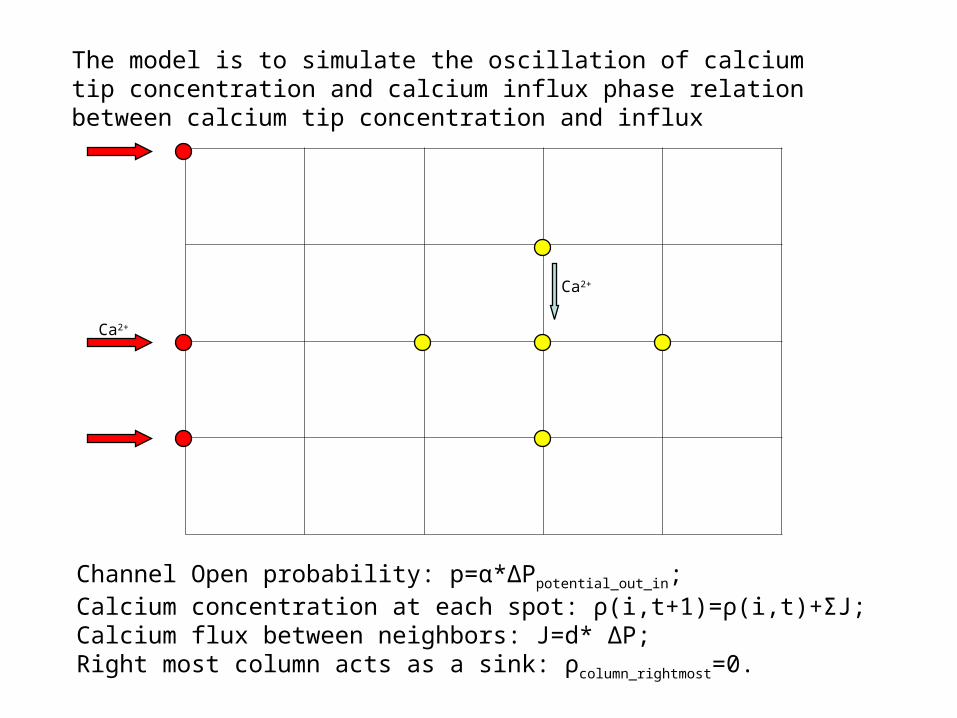
Channel Open probability: p=α*ΔPpotential_out_in;Calcium concentration at each spot: ρ(i,t+1)=ρ(i,t)+ΣJ;Calcium flux between neighbors: J=d* ΔP;Right most column acts as a sink: ρcolumn_rightmost=0.
Ca2+
Ca2+
The model is to simulate the oscillation of calcium tip concentration and calcium influx phase relation between calcium tip concentration and influx
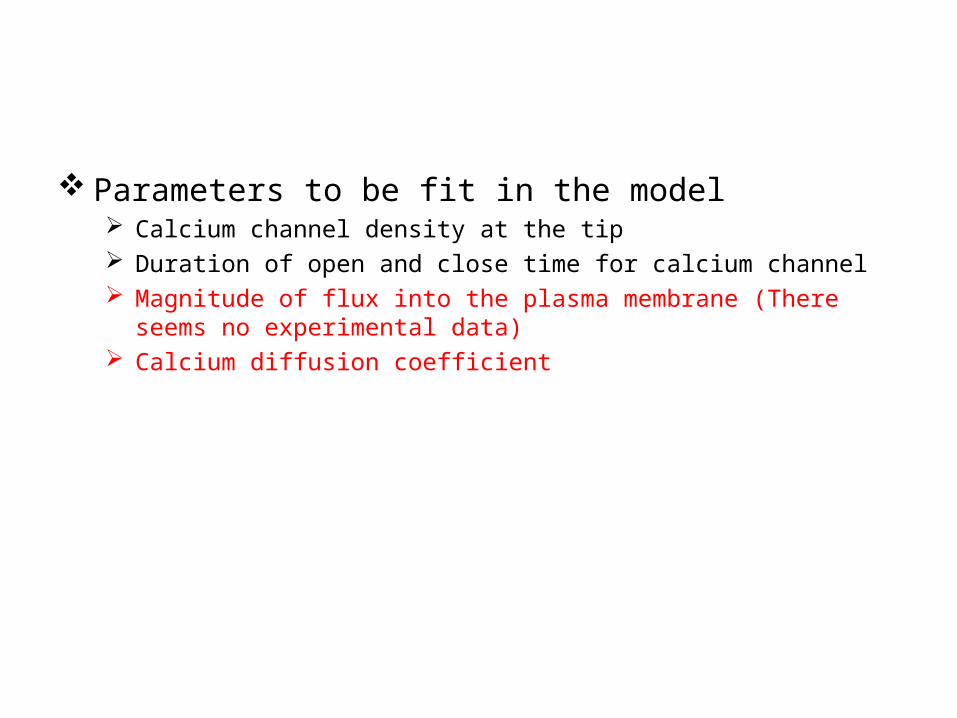
Parameters to be fit in the model Calcium channel density at the tip Duration of open and close time for calcium channel Magnitude of flux into the plasma membrane (There seems no
experimental data) Calcium diffusion coefficient
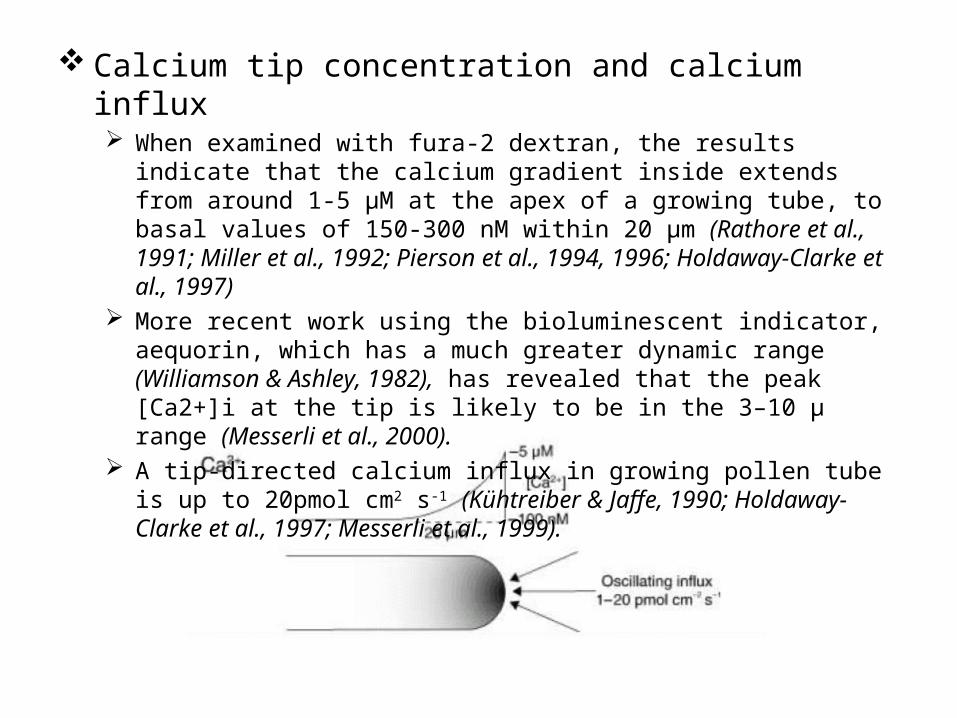
Calcium tip concentration and calcium influx When examined with fura-2 dextran, the results indicate that the calcium
gradient inside extends from around 1-5 μM at the apex of a growing tube, to basal values of 150-300 nM within 20 μm (Rathore et al., 1991; Miller et al., 1992; Pierson et al., 1994, 1996; Holdaway-Clarke et al., 1997)
More recent work using the bioluminescent indicator, aequorin, which has a much greater dynamic range (Williamson & Ashley, 1982), has revealed that the peak [Ca2+]i at the tip is likely to be in the 3–10 µ range (Messerli et al., 2000).
A tip-directed calcium influx in growing pollen tube is up to 20pmol cm2 s-1 (Kühtreiber & Jaffe, 1990; Holdaway-Clarke et al., 1997; Messerli et al., 1999).
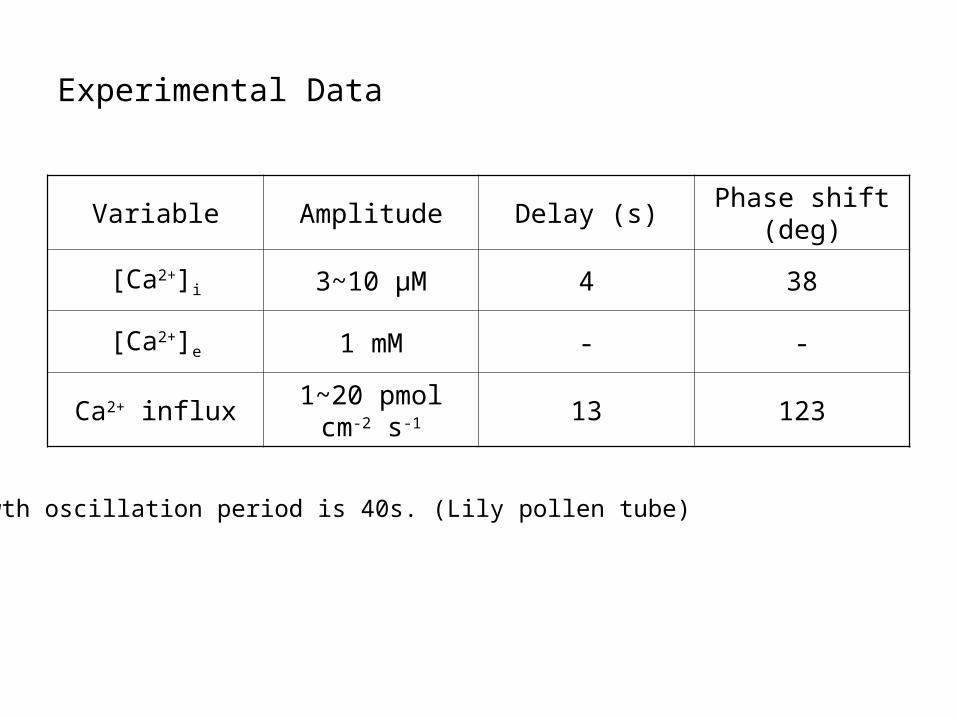
Experimental Data
Variable Amplitude Delay (s)Phase shift
(deg)
[Ca2+]i 3~10 μM 4 38
[Ca2+]e 1 mM - -
Ca2+ influx1~20 pmol cm-2
s-1 13 123
Growth oscillation period is 40s. (Lily pollen tube)
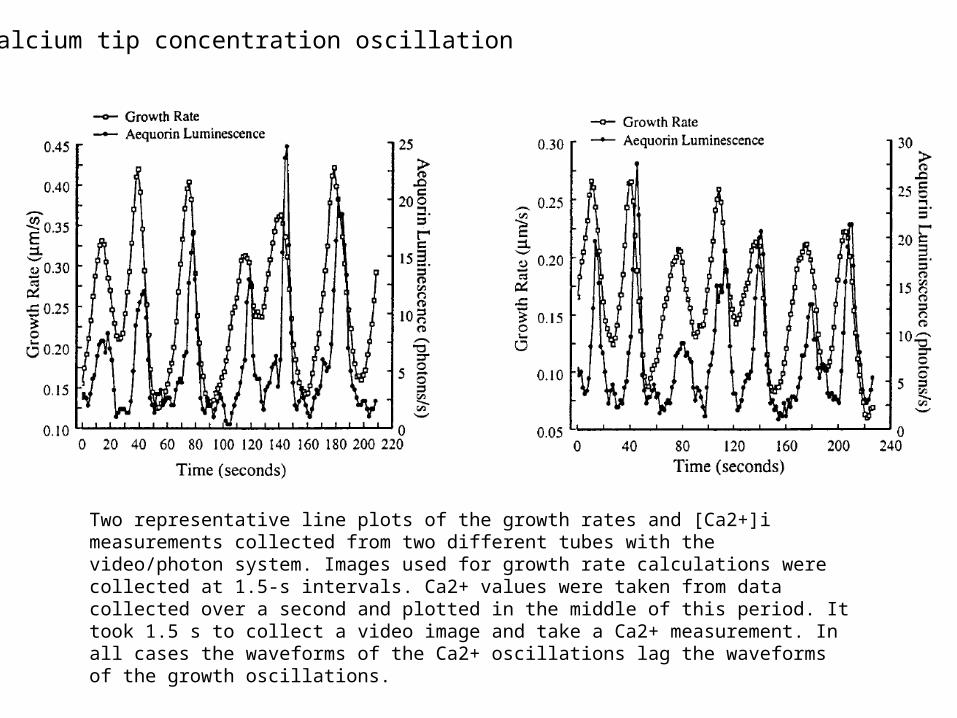
Two representative line plots of the growth rates and [Ca2+]i measurements collected from two different tubes with the video/photon system. Images used for growth rate calculations were collected at 1.5-s intervals. Ca2+ values were taken from data collected over a second and plotted in the middle of this period. It took 1.5 s to collect a video image and take a Ca2+ measurement. In all cases the waveforms of the Ca2+ oscillations lag the waveforms of the growth oscillations.
Calcium tip concentration oscillation
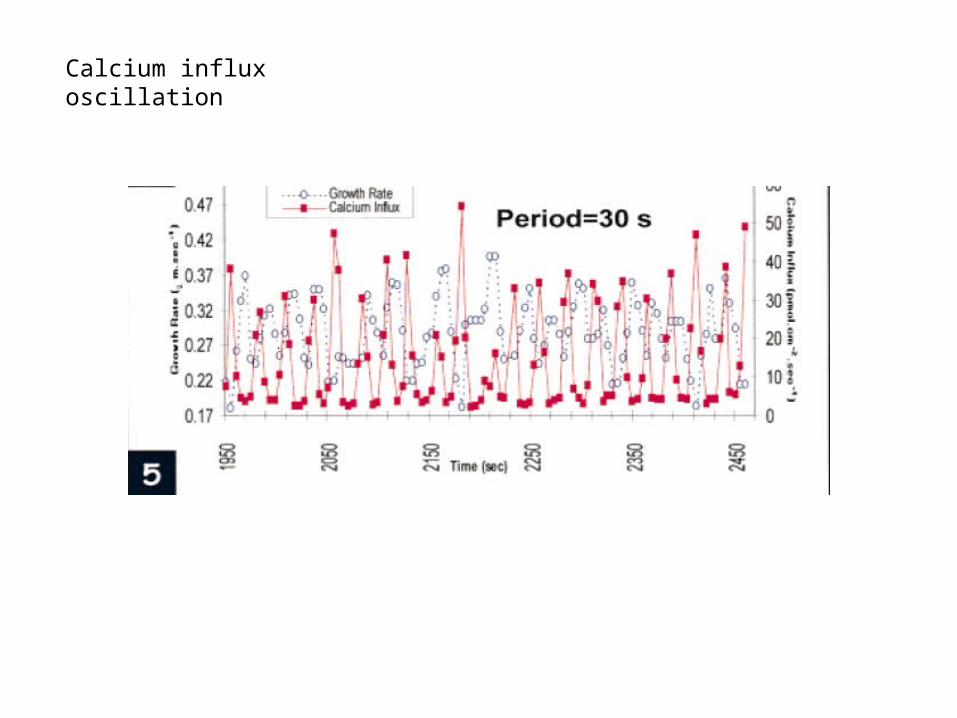
Calcium influx oscillation
Simple calculations suggest that the magnitude of the calcium influx may be substantially greater than that needed to account for the observed [Ca2+]i gradient (Holdaway-Clarke et al., 1997); even if the high value of 10 μM is used, the flux required (1-2pmol cm2 s-1) would appear to be much less than the value that have been measured.
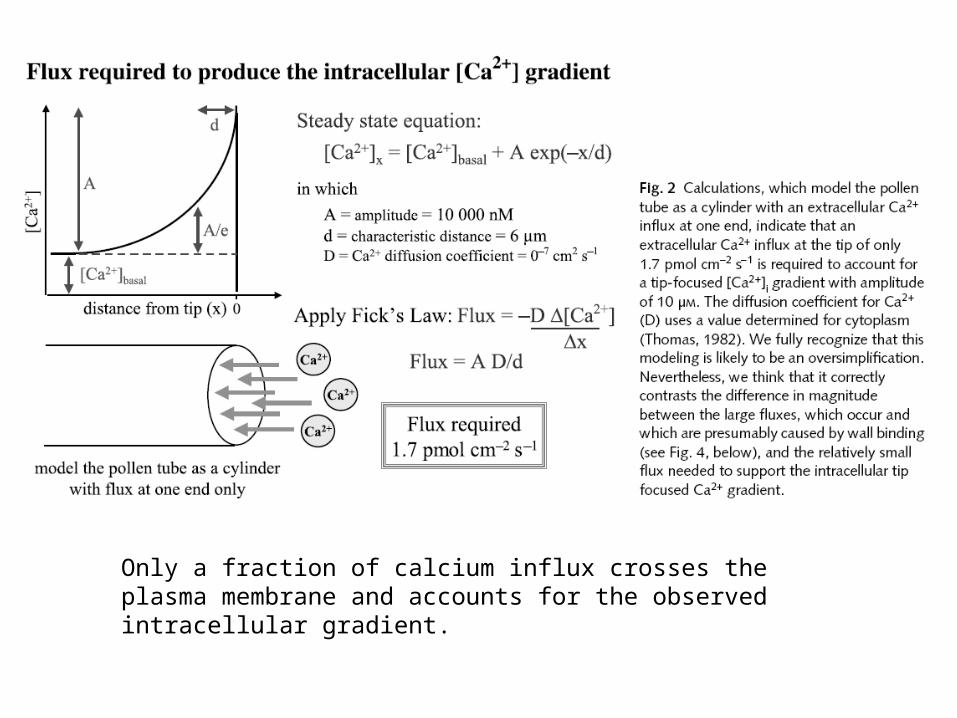
Only a fraction of calcium influx crosses the plasma membrane and accounts for the observed intracellular gradient.
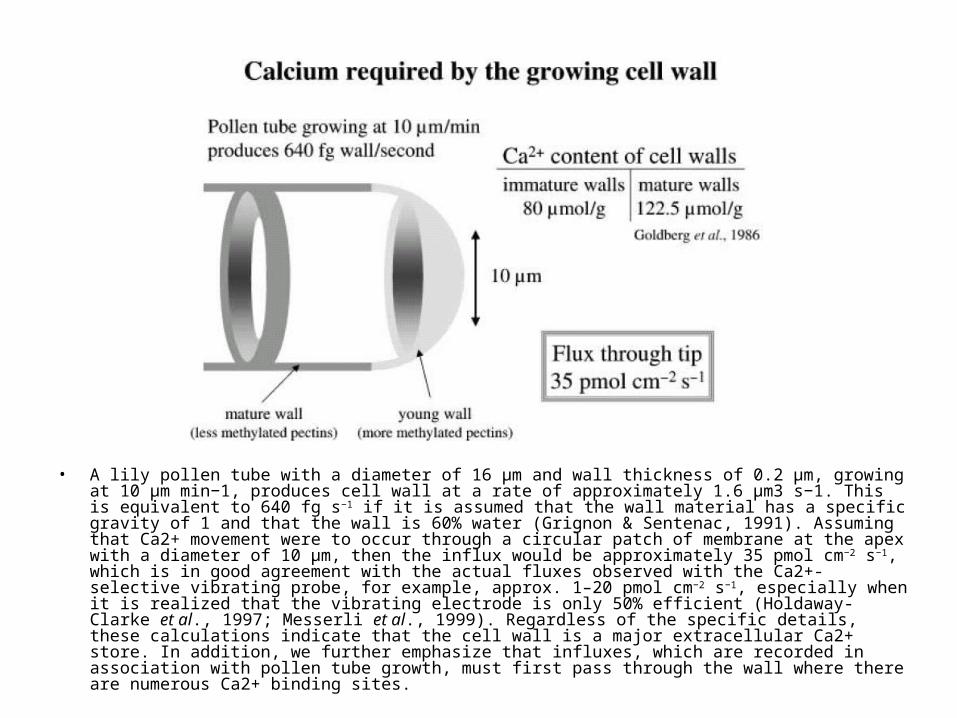
• A lily pollen tube with a diameter of 16 µm and wall thickness of 0.2 µm, growing at 10 µm min−1, produces cell wall at a rate of approximately 1.6 µm3 s−1. This is equivalent to 640 fg s−1 if it is assumed that the wall material has a specific gravity of 1 and that the wall is 60% water (Grignon & Sentenac, 1991). Assuming that Ca2+ movement were to occur through a circular patch of membrane at the apex with a diameter of 10 µm, then the influx would be approximately 35 pmol cm−2 s−1, which is in good agreement with the actual fluxes observed with the Ca2+-selective vibrating probe, for example, approx. 1–20 pmol cm−2 s−1, especially when it is realized that the vibrating electrode is only 50% efficient (Holdaway-Clarke et al., 1997; Messerli et al., 1999). Regardless of the specific details, these calculations indicate that the cell wall is a major extracellular Ca2+ store. In addition, we further emphasize that influxes, which are recorded in association with pollen tube growth, must first pass through the wall where there are numerous Ca2+ binding sites.
Magnitude of influx for each individual calcium channel
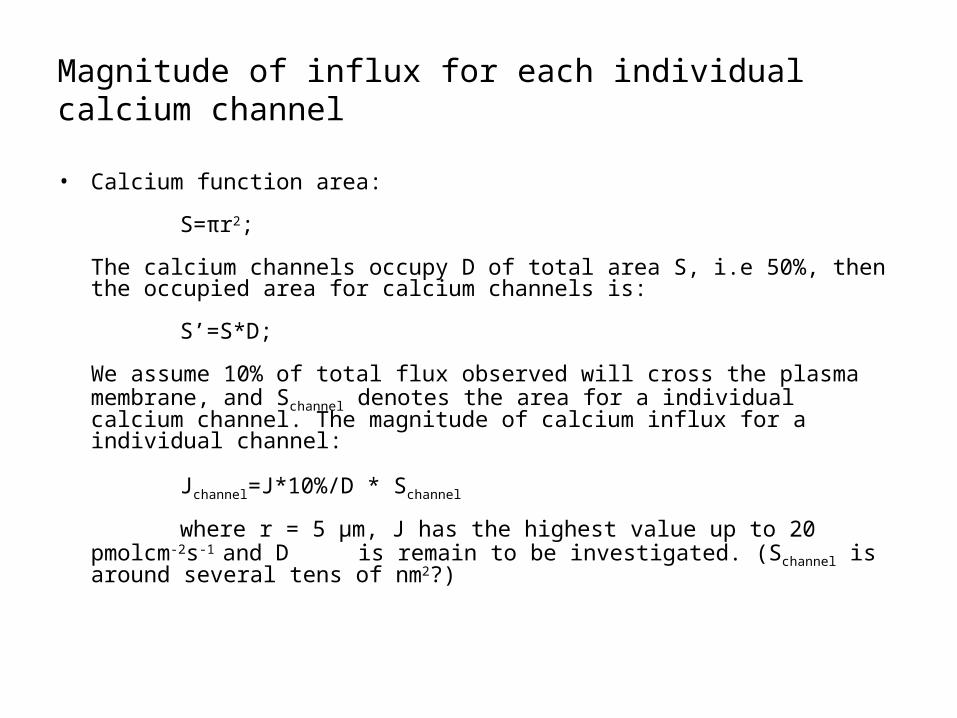
• Calcium function area:
S=πr2;
The calcium channels occupy D of total area S, i.e 50%, then the occupied area for calcium channels is:
S’=S*D;
We assume 10% of total flux observed will cross the plasma membrane, and Schannel denotes the area for a individual calcium channel. The magnitude of calcium influx for a individual channel:
Jchannel=J*10%/D * Schannel
where r = 5 μm, J has the highest value up to 20 pmolcm-2s-1 and D is remain to be investigated. (Schannel is around several tens of
nm2?)
Channel properties
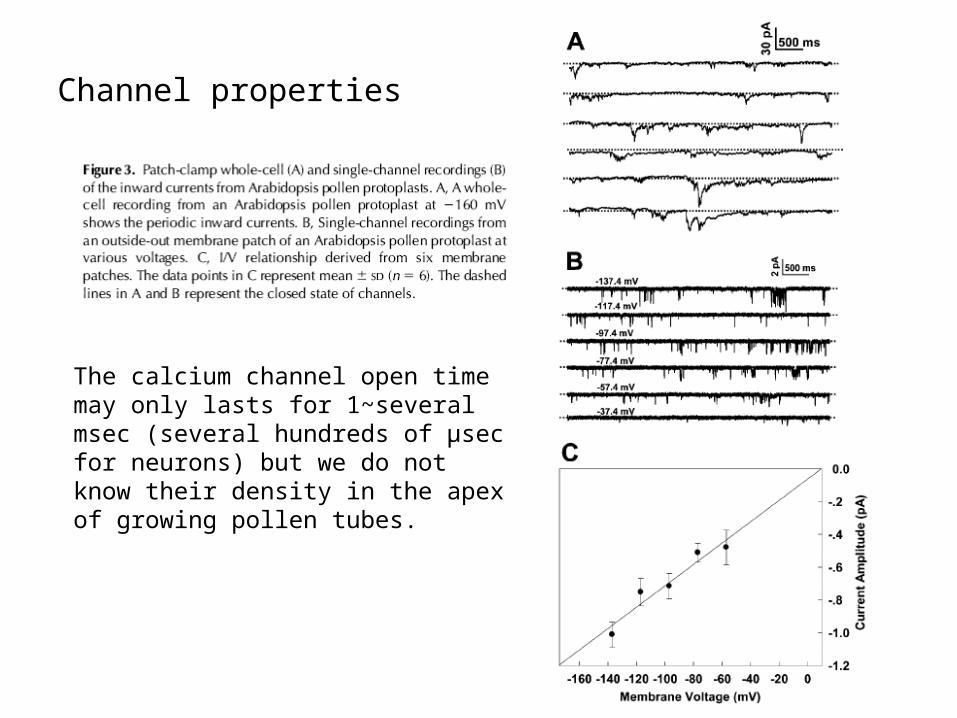
The calcium channel open time may only lasts for 1~several msec (several hundreds of μsec for neurons) but we do not know their density in the apex of growing pollen tubes.
Parameters for the program
• Calcium external concentration• Diffusion constant (longitudinal & transverse)• Size of the pollen tube(no_rows, no_columns)• No of calcium channels in tip (uniformly distributed or randomly
distributed)• Channel open & close time• Calcium flux constant• Runtime
Discussion (Phase relation between [Ca2+]i oscillation and calcium influx oscillation)
• Internal stores– Although we think it is most likely that the tip calcium gradient derived from influx
of extracellular calcium, internal compartments could be also involved. Thus, internal stores have been suggested as being involved in the production of the tip-focused [Ca2+]i gradient, with their continual filling and emptying resulting in the observed oscillations in animal cells (Trewavas & Malhó, 1997).
– In animal cells Ca2+ entry across the plasma membrane may be regulated by the degree to which an intracellular Ca2+ store is depleted (Parekh & Penner, 1997); also a detectable [Ca2+]I gradient is not always seen in the cytoplasm as stores are filled (Mogami et al., 1997).
– We note that [Ca2+]i oscillations can occur in the complete absence of growth, which is interpreted as strong support for release from internal stores (Messerli & Robinson,2003).