Embed Size (px)
Citation preview
Population Dynamics of Bacterial
Persistence
Kumulative Dissertation
zur Erlangung des akademischen Grades
“doctor rerum naturalium”
(Dr. rer. nat.)
in der Wissenschaftsdisziplin “Theoretische Biologische Physik”
eingereicht an der
Mathematisch-Naturwissenschaftlichen Fakultat
der Universitat Potsdam
angefertigt in der
Abteilung Theorie und Bio-Systeme
des Max-Planck-Institut fur Kolloid- und Grenzflachenforschung
von
Pintu Patra
Potsdam, September 2013
This work is licensed under a Creative Commons License: Attribution - Noncommercial - Share Alike 3.0 Germany To view a copy of this license visit http://creativecommons.org/licenses/by-nc-sa/3.0/de/ Published online at the Institutional Repository of the University of Potsdam: URL http://opus.kobv.de/ubp/volltexte/2014/6925/ URN urn:nbn:de:kobv:517-opus-69253 http://nbn-resolving.de/urn:nbn:de:kobv:517-opus-69253
Abstract
The life of microorganisms is characterized by two main tasks, rapid growth under con-
ditions permitting growth and survival under stressful conditions. The environments, in
which microorganisms dwell, vary in space and time. The microorganisms innovate di-
verse strategies to readily adapt to the regularly fluctuating environments. Phenotypic
heterogeneity is one such strategy, where an isogenic population splits into subpopu-
lations that respond differently under identical environments. Bacterial persistence is
a prime example of such phenotypic heterogeneity, whereby a population survives un-
der an antibiotic attack, by keeping a fraction of population in a drug tolerant state,
the persister state. Specifically, persister cells grow more slowly than normal cells un-
der growth conditions, but survive longer under stress conditions such as the antibiotic
administrations.
Bacterial persistence is identified experimentally by examining the population survival
upon an antibiotic treatment and the population resuscitation in a growth medium.
The underlying population dynamics is explained with a two state model for reversible
phenotype switching in a cell within the population. We study this existing model with
a new theoretical approach and present analytical expressions for the time scale observed
in population growth and resuscitation, that can be easily used to extract underlying
model parameters of bacterial persistence. In addition, we recapitulate previously known
results on the evolution of such structured population under periodically fluctuating
environment using our simple approximation method. Using our analysis, we determine
model parameters for Staphylococcus aureus population under several antibiotics and
interpret the outcome of cross-drug treatment.
Next, we consider the expansion of a population exhibiting phenotype switching in a
spatially structured environment consisting of two growth permitting patches separated
by an antibiotic patch. The dynamic interplay of growth, death and migration of cells in
different patches leads to distinct regimes in population propagation speed as a function
of migration rate. We map out the region in parameter space of phenotype switching
and migration rate to observe the condition under which persistence is beneficial.
1
2
Furthermore, we present an extended model that allows mutation from the two pheno-
typic states to a resistant state. We find that the presence of persister cells may enhance
the probability of resistant mutation in a population. Using this model, we explain the
experimental results showing the emergence of antibiotic resistance in a Staphylococcus
aureus population upon tobramycin treatment.
In summary, we identify several roles of bacterial persistence, such as help in spatial
expansion, development of multidrug tolerance and emergence of antibiotic resistance.
Our study provides a theoretical perspective on the dynamics of bacterial persistence
in different environmental conditions. These results can be utilized to design further
experiments, and to develop novel strategies to eradicate persistent infections.
Zusammenfassung
Das Leben von Mikroorganismen kann in zwei charakteristische Phasen unterteilt werde,
schnelles Wachstum unter Wachstumsbedingungen und Uberleben unter schwierigen Be-
dingungen. Die Bedingungen, in denen sich die Mikroorganismen aufhalten, verandern
sich in Raum und Zeit. Um sich schnell an die standig wechselnden Bedingungen anzu-
passen entwickeln die Mikroorganismen diverse Strategien. Phanotypische Heterogenitat
ist eine solche Strategie, bei der sich eine isogene Population in Untergruppen aufteilt,
die unter identischen Bedingungen verschieden reagieren. Bakterielle Persistenz ist ein
Paradebeispiel einer solchen phanotypischen Heterogenitat. Hierbei uberlebt eine Popu-
lation die Behandlung mit einem Antibiotikum, indem sie einen Teil der Bevolkerung in
einem, dem Antibiotikum gegenuber tolerant Zustand lasst, der sogenannte ”persister
Zustand”. Persister-Zellen wachsen unter Wachstumsbedingungen langsamer als nor-
male Zellen, jedoch uberleben sie langer in Stress-Bedingungen, wie bei Antibiotikaap-
plikation.
Bakterielle Persistenz wird experimentell erkannt indem man uberpruft ob die Popula-
tion eine Behandlung mit Antibiotika uberlebt und sich in einem Wachstumsmedium
reaktiviert. Die zugrunde liegende Populationsdynamik kann mit einem Zwei-Zustands-
Modell fur reversibles Wechseln des Phanotyps einer Zelle in der Bevolkerung erklart wer-
den. Wir untersuchen das bestehende Modell mit einem neuen theoretischen Ansatz und
prasentieren analytische Ausdrucke fur die Zeitskalen die fur das Bevolkerungswachstums
und die Reaktivierung beobachtet werden. Diese konnen dann einfach benutzt werden
um die Parameter des zugrunde liegenden bakteriellen Persistenz-Modells zu bestim-
men. Daruber hinaus rekapitulieren wir bisher bekannten Ergebnisse uber die Entwick-
lung solch strukturierter Bevolkerungen unter periodisch schwankenden Bedingungen
mithilfe unseres einfachen Naherungsverfahrens. Mit unserer Analysemethode bestim-
men wir Modellparameter fur eine emphStaphylococcus aureus-Population unter dem
Einfluss mehrerer Antibiotika und interpretieren die Ergebnisse der Behandlung mit zwei
Antibiotika in Folge.
3

4
Als nachstes betrachten wir die Ausbreitung einer Population mit Phanotypen-Wechsel
in einer raumlich strukturierten Umgebung. Diese besteht aus zwei Bereichen, in denen
Wachstum moglich ist und einem Bereich mit Antibiotikum der die beiden trennt. Das
dynamische Zusammenspiel von Wachstum, Tod und Migration von Zellen in den ver-
schiedenen Bereichen fuhrt zu unterschiedlichen Regimen der Populationsausbreitungs-
geschwindigkeit als Funktion der Migrationsrate. Wir bestimmen die Region im Param-
eterraum der Phanotyp Schalt-und Migrationsraten, in der die Bedingungen Persistenz
begunstigen.
Daruber hinaus prasentieren wir ein erweitertes Modell, das Mutation aus den beiden
phanotypischen Zustanden zu einem resistenten Zustand erlaubt. Wir stellen fest, dass
die Anwesenheit persistenter Zellen die Wahrscheinlichkeit von resistenten Mutationen in
einer Population erhoht. Mit diesem Modell, erklaren wir die experimentell beobachtete
Entstehung von Antibiotika- Resistenz in einer Staphylococcus aureus Population infolge
einer Tobramycin Behandlung.
Wir finden also verschiedene Funktionen bakterieller Persistenz. Sie unterstutzt die
raumliche Ausbreitung der Bakterien, die Entwicklung von Toleranz gegenuber mehreren
Medikamenten und Entwicklung von Resistenz gegenuber Antibiotika. Unsere Beschrei-
bung liefert eine theoretische Betrachtungsweise der Dynamik bakterieller Persistenz bei
verschiedenen Bedingungen. Die Resultate konnten als Grundlage neuer Experimente
und der Entwicklung neuer Strategien zur Ausmerzung persistenter Infekte dienen.
Contents
1 Introduction 9
1.1 Population dynamics and Evolution . . . . . . . . . . . . . . . . . . . . . 10
1.2 Bacterial persistence . . . . . . . . . . . . . . . . . . . . . . . . . . . . . . 12
1.2.1 Persistence: a cause of antibiotic failures . . . . . . . . . . . . . . . 14
1.2.2 Molecular mechanism of persistence . . . . . . . . . . . . . . . . . 15
1.2.3 Persistence against multiple drugs . . . . . . . . . . . . . . . . . . 16
1.2.4 Other examples of phenotypic heterogeneity . . . . . . . . . . . . 17
1.3 Overview of theoretical work . . . . . . . . . . . . . . . . . . . . . . . . . 18
1.4 Motivation . . . . . . . . . . . . . . . . . . . . . . . . . . . . . . . . . . . 19
1.4.1 Temporal dynamics of bacterial persistence . . . . . . . . . . . . . 20
1.4.2 Spatial dynamics of bacterial persistence . . . . . . . . . . . . . . . 20
1.4.3 Population dynamics of multidrug tolerance . . . . . . . . . . . . . 21
1.4.4 Role of persisters in the emergence of antibiotic resistance . . . . . 21
1.5 List of publications . . . . . . . . . . . . . . . . . . . . . . . . . . . . . . . 23
1.6 Author contributions . . . . . . . . . . . . . . . . . . . . . . . . . . . . . . 23
2 Population dynamics of bacterial persistence 25
2.1 Introduction . . . . . . . . . . . . . . . . . . . . . . . . . . . . . . . . . . 27
2.2 Phenotype switching . . . . . . . . . . . . . . . . . . . . . . . . . . . . . . 28
2.3 Dynamics in constant environment . . . . . . . . . . . . . . . . . . . . . . 32
2.4 Response to environment shift . . . . . . . . . . . . . . . . . . . . . . . . . 33
2.4.1 Characteristic time scales of the population dynamics . . . . . . . 33
2.4.2 Time-dependent growth rates . . . . . . . . . . . . . . . . . . . . 36
2.4.3 Growth of the total population . . . . . . . . . . . . . . . . . . . . 37
2.5 Dynamics in periodically switching environment . . . . . . . . . . . . . . . 38
2.6 Concluding remarks . . . . . . . . . . . . . . . . . . . . . . . . . . . . . . 41
2.7 Supporting information . . . . . . . . . . . . . . . . . . . . . . . . . . . . 42
2.7.1 Average growth rate in periodic environmental conditions . . . . . 42
2.7.2 Steady state ratio of sub populations . . . . . . . . . . . . . . . . . 43
3 Phenotypically heterogeneous populations in spatially heterogeneousenvironments 45
3.1 Introduction . . . . . . . . . . . . . . . . . . . . . . . . . . . . . . . . . . . 47
3.2 Model . . . . . . . . . . . . . . . . . . . . . . . . . . . . . . . . . . . . . . 48
3.3 Growth dynamics in the first patch. . . . . . . . . . . . . . . . . . . . . . 49
3.4 Migration through the second patch . . . . . . . . . . . . . . . . . . . . . 50
3.4.1 Dynamics with multiple antibiotic patches. . . . . . . . . . . . . . 53
5
6
3.5 Concluding remarks . . . . . . . . . . . . . . . . . . . . . . . . . . . . . . 54
4 Interplay between Population Dynamics and Drug Tolerance of Staphy-lococcus aureus Persister Cells 57
4.1 Introduction . . . . . . . . . . . . . . . . . . . . . . . . . . . . . . . . . . . 59
4.2 Results and Discussion . . . . . . . . . . . . . . . . . . . . . . . . . . . . . 60
4.2.1 Mathematical Analysis of Killing Curves Indicates the Existenceof Multiple S. aureus Persister Types . . . . . . . . . . . . . . . . 60
4.2.2 Degree of Drug Tolerance of Isolated S. aureus Persisters Is De-pendent on the Kind and Duration of Antibiotic Treatment . . . . 63
4.2.3 Mono- and Multi-Drug Tolerance Is Not Necessarily Correlated inS. aureus Persisters . . . . . . . . . . . . . . . . . . . . . . . . . . 64
4.2.4 Delay in Resuscitation and Subsequent CFU Doubling Times AreDependent on the Kind and Duration of Antibiotic Treatment . . 65
4.3 Conclusion . . . . . . . . . . . . . . . . . . . . . . . . . . . . . . . . . . . 68
4.4 Experimental Procedures . . . . . . . . . . . . . . . . . . . . . . . . . . . 69
4.4.1 Bacterial Strains, Media, and Culture Conditions . . . . . . . . . . 69
4.4.2 Antibiotics . . . . . . . . . . . . . . . . . . . . . . . . . . . . . . . 69
4.4.3 Reexposure and Resuscitation Experiments . . . . . . . . . . . . . 69
4.4.4 Theoretical Analysis . . . . . . . . . . . . . . . . . . . . . . . . . . 70
4.4.5 Acknowledgements . . . . . . . . . . . . . . . . . . . . . . . . . . . 71
5 Role of persisters in antibiotic resistance 73
5.1 Introduction . . . . . . . . . . . . . . . . . . . . . . . . . . . . . . . . . . . 75
5.2 Experimental results and motivation . . . . . . . . . . . . . . . . . . . . . 75
5.3 Model : Deterministic dynamics . . . . . . . . . . . . . . . . . . . . . . . . 77
5.4 Stochastic simulation . . . . . . . . . . . . . . . . . . . . . . . . . . . . . . 78
5.5 Model : Stochastic dynamics . . . . . . . . . . . . . . . . . . . . . . . . . 79
5.5.1 Single population . . . . . . . . . . . . . . . . . . . . . . . . . . . . 80
5.5.2 Subpopulation of normal cells and persisters . . . . . . . . . . . . 82
5.6 Simulation Results & Comparisons . . . . . . . . . . . . . . . . . . . . . . 83
5.6.1 First passage time . . . . . . . . . . . . . . . . . . . . . . . . . . . 85
5.7 Conclusion . . . . . . . . . . . . . . . . . . . . . . . . . . . . . . . . . . . 89
6 Discussion & Summary 91
6.1 Overview of the main results . . . . . . . . . . . . . . . . . . . . . . . . . 92
6.2 Outlook . . . . . . . . . . . . . . . . . . . . . . . . . . . . . . . . . . . . . 95
6.3 Summary . . . . . . . . . . . . . . . . . . . . . . . . . . . . . . . . . . . . 96
A Appendix 97
A.1 Phenotypically heterogeneous population in spatially heterogeneous envi-ronments . . . . . . . . . . . . . . . . . . . . . . . . . . . . . . . . . . . . 97
A.1.1 Stochastic dynamics in the second patch . . . . . . . . . . . . . . 99
A.1.2 Mean first arrival time (MFAT) . . . . . . . . . . . . . . . . . . . . 100
A.2 Measuring persistence . . . . . . . . . . . . . . . . . . . . . . . . . . . . . 101

7
Acknowledgements 105
Bibliography 107

Chapter 1
Introduction
Organisms find numerous ways to survive, as well as to flourish, in the surrounding
environment. For example, organisms adapt to the daily light cycles by using internal
circadian clocks, echolocating animals, such as bats and dolphins, use sonic response
for navigation and for foraging, chameleon camouflage to blend with the surroundings
to hide from predators as well as to target their prey. Understanding how organisms
adapt, in the presence of various interactions with their environments, is often complex
and challenging. Microbes, the most abundant form of life on earth that have adapted to
survive under diverse environments, provide model systems for qualitative understanding
of the general principles of evolution [66]. Short replication time, small genome size and
the possibility of genetic manipulation of these microorganisms make them convenient
for the quantitative studies of evolution within laboratory experiments. For example,
several ecological interactions such as competition, cooperation, predator prey dynam-
ics, etc., have been realized in microbial populations [5, 36, 44, 85]. Additionally, the
arrival of modern techniques such as single cell genome sequencing and microfluidic de-
vices, allow to integrate and inspect multiple aspects of evolution in cellular dimensions,
for example, controlling microenvironments, measuring single cell dynamics, analyzing
signaling pathways, etc [13, 86, 136]. The study of evolution in microorganisms can
boost the understanding of the development of antibiotic resistance, which is emerging
as a serious problem in medicine [94, 117].
An important feature of microbial life is population heterogeneity that affects the re-
sponse of a population to heterogeneous environments [69, 74, 121]. Population hetero-
geneity, where cells within a population display a wide range of physiological properties,
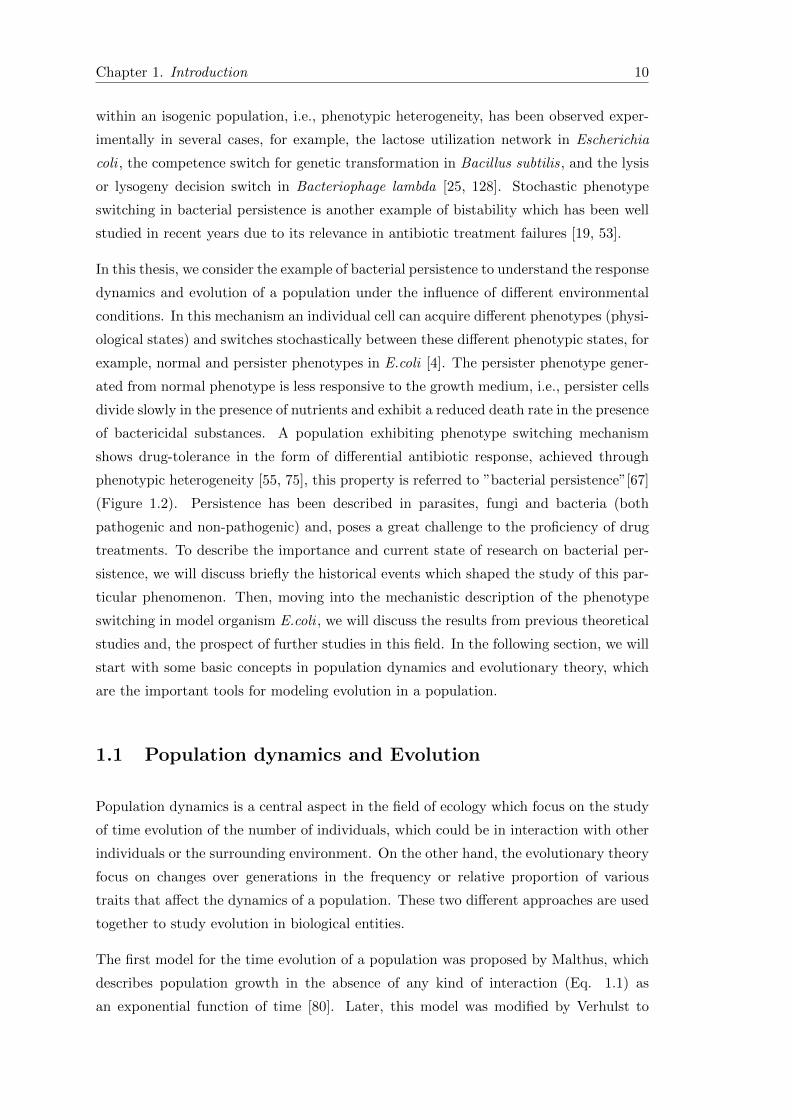
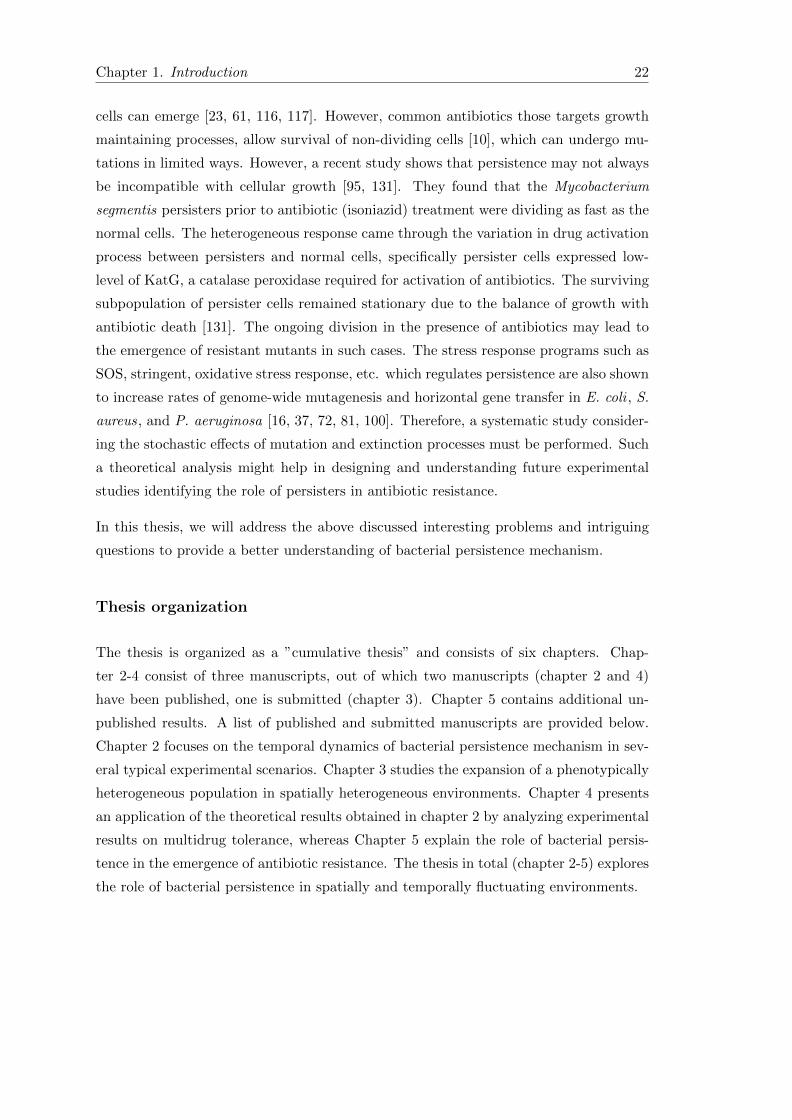
can occur in the form of monomodal (Fig. 1.1(a)) or bimodal (Fig. 1.1(b)) or even
multimodal distribution in physiological traits [13, 19]. Heterogeneity in cellular traits
9
Chapter 1. Introduction 10
within an isogenic population, i.e., phenotypic heterogeneity, has been observed exper-
imentally in several cases, for example, the lactose utilization network in Escherichia
coli , the competence switch for genetic transformation in Bacillus subtilis, and the lysis
or lysogeny decision switch in Bacteriophage lambda [25, 128]. Stochastic phenotype
switching in bacterial persistence is another example of bistability which has been well
studied in recent years due to its relevance in antibiotic treatment failures [19, 53].
In this thesis, we consider the example of bacterial persistence to understand the response
dynamics and evolution of a population under the influence of different environmental
conditions. In this mechanism an individual cell can acquire different phenotypes (physi-
ological states) and switches stochastically between these different phenotypic states, for
example, normal and persister phenotypes in E.coli [4]. The persister phenotype gener-
ated from normal phenotype is less responsive to the growth medium, i.e., persister cells
divide slowly in the presence of nutrients and exhibit a reduced death rate in the presence
of bactericidal substances. A population exhibiting phenotype switching mechanism
shows drug-tolerance in the form of differential antibiotic response, achieved through
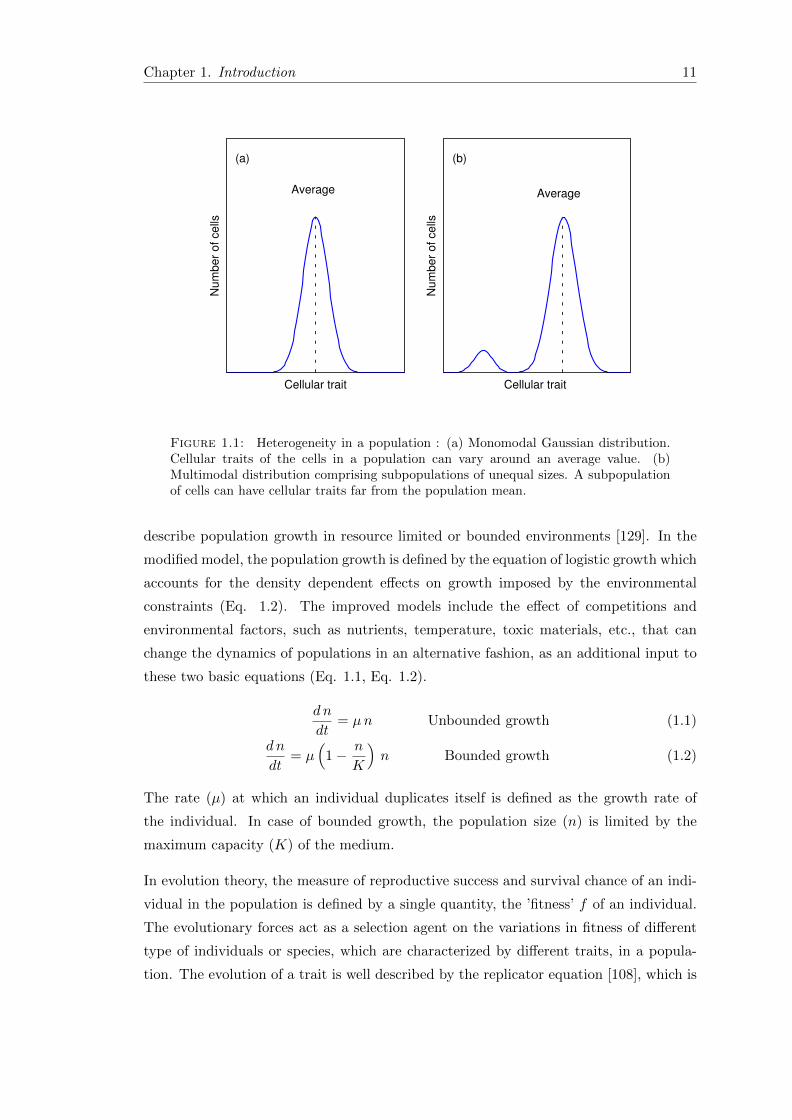
phenotypic heterogeneity [55, 75], this property is referred to ”bacterial persistence”[67]
(Figure 1.2). Persistence has been described in parasites, fungi and bacteria (both
pathogenic and non-pathogenic) and, poses a great challenge to the proficiency of drug
treatments. To describe the importance and current state of research on bacterial per-
sistence, we will discuss briefly the historical events which shaped the study of this par-
ticular phenomenon. Then, moving into the mechanistic description of the phenotype
switching in model organism E.coli , we will discuss the results from previous theoretical
studies and, the prospect of further studies in this field. In the following section, we will
start with some basic concepts in population dynamics and evolutionary theory, which
are the important tools for modeling evolution in a population.
1.1 Population dynamics and Evolution
Population dynamics is a central aspect in the field of ecology which focus on the study
of time evolution of the number of individuals, which could be in interaction with other
individuals or the surrounding environment. On the other hand, the evolutionary theory
focus on changes over generations in the frequency or relative proportion of various
traits that affect the dynamics of a population. These two different approaches are used
together to study evolution in biological entities.
The first model for the time evolution of a population was proposed by Malthus, which
describes population growth in the absence of any kind of interaction (Eq. 1.1) as
an exponential function of time [80]. Later, this model was modified by Verhulst to
Chapter 1. Introduction 11
Num
ber
of c
ells
Cellular trait
Average
(a)
Num
ber
of c
ells
Cellular trait
Average
(b)
Figure 1.1: Heterogeneity in a population : (a) Monomodal Gaussian distribution.Cellular traits of the cells in a population can vary around an average value. (b)Multimodal distribution comprising subpopulations of unequal sizes. A subpopulationof cells can have cellular traits far from the population mean.
describe population growth in resource limited or bounded environments [129]. In the
modified model, the population growth is defined by the equation of logistic growth which
accounts for the density dependent effects on growth imposed by the environmental
constraints (Eq. 1.2). The improved models include the effect of competitions and
environmental factors, such as nutrients, temperature, toxic materials, etc., that can
change the dynamics of populations in an alternative fashion, as an additional input to
these two basic equations (Eq. 1.1, Eq. 1.2).
dn
dt= µn Unbounded growth (1.1)
dn
dt= µ
(1− n
K
)n Bounded growth (1.2)
The rate (µ) at which an individual duplicates itself is defined as the growth rate of
the individual. In case of bounded growth, the population size (n) is limited by the
maximum capacity (K) of the medium.
In evolution theory, the measure of reproductive success and survival chance of an indi-
vidual in the population is defined by a single quantity, the ’fitness’ f of an individual.
The evolutionary forces act as a selection agent on the variations in fitness of different
type of individuals or species, which are characterized by different traits, in a popula-
tion. The evolution of a trait is well described by the replicator equation [108], which is
Chapter 1. Introduction 12
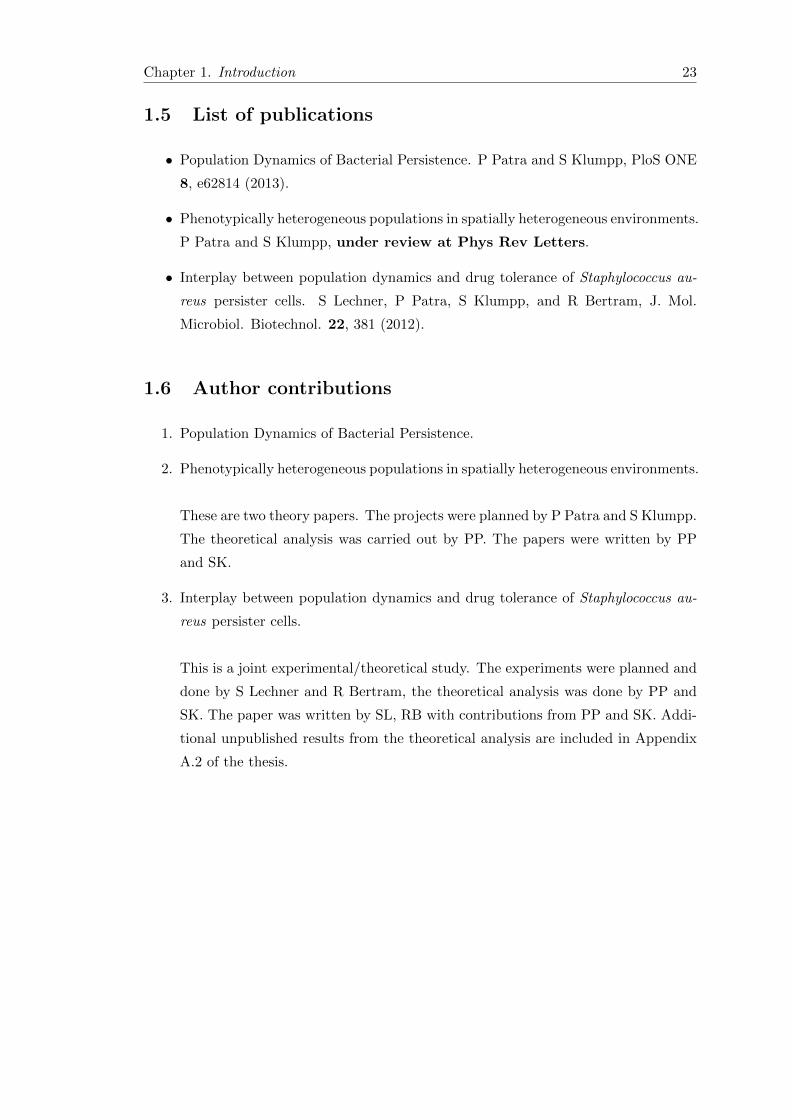
Figure 1.2: Bacterial Persistence. A bacterial population of treated with an antibioticdisplays a biphasic decay or two-time scale decay. Most of the cells are killed in thefast decay phase, whereas a tiny fraction (10−3 − 10−5) survives even after a couple ofhours of antibiotic administration. These surviving cells are named Persisters. ( Note:Colony forming unit (CFU) is a count of viable bacterial numbers)
shown below,
d xidt
= xi(fi − 〈fi〉). (1.3)
The equation defines the rate of change of a particular trait (i) within a population as a
function of the fitness difference between the fraction (xi) of population exhibiting this
trait (fi) and the total population (〈fi〉). In the simplest case, when individuals in a
population duplicates with variable growth rates, the individuals with higher growth rate
(≡ fitness) will be selected against the others and eventually will spread over the whole
population. The evolutionary selection can act on various levels from genes to individuals
as the fitness of an individual is the sum of all physical traits (phenotype) which is
specified by the genomic information (genotype) in the DNA sequence of the individual
[122]. The growth or duplication rate (µ) is determined by genetic contents [60] and taken
as the measure of fitness of an individual [84]. Therefore, growth dynamics together with
evolutionary selection completes the mathematical description of an evolving population
[83].
1.2 Bacterial persistence
The phenomenon of bacterial persistence against antibiotics was first observed by Joseph
W. Bigger in 1944 while studying the failure of antibiotic penicillin to sterilize a staphy-
lococcal infection [7]. He found that a fraction of cells always survives the killing by
penicillin. He named these cells ”persisters”. He proposed that persisters are in dormant
Chapter 1. Introduction 13
or non-dividing phase, and survive because penicillin inhibits cell wall formation only in
growing cells. He found that these cells were pre-existing as persisters in the population,
but could be induced to normal state when in contact with a new environment. The
offspring produced by the surviving persisters consisted only a small fraction of popula-
tion that could once again survive the treatment with penicillin. Hence, the persisters
were very different from traditionally observed resistant cells, those can even grow in
the presence of antibiotics and generate offspring which are permanently immune to the
treated antibiotic. The surviving population fraction during antibiotic treatment, being
very small, did not get much attention by the researchers because the discovery of an-
tibiotics was of prime importance in that era. Thus, the physiological role and molecular
mechanism of bacterial persistence against antibiotics remained undiscovered for about
four decades.
In 1980s, Harris Moyed started to look again into the problem of persistence [88]. He
selected for mutants with high level of persisters, the hip (high persister) mutants, by
repeatedly exposing growing E.coli cultures with ampicillin. He found the fraction of
surviving cells upon antibiotic treatment in hip mutants was about 100-1000 fold larger
than the wild type population. He looked for the mutations in hip mutants, and identified
a new gene hipA, causing the increase in persister frequency. This experiment gave the
first evidence that persistence has a genetic basis.
The next breakthrough came in the form of a single cell microfluidics experiment show-
ing microscopic images of pre-existing persister cells in a growing culture of E. coli
wild type and hip mutants [4]. The experiment showed that bacterial persistence or
persister formation is an outcome of the phenotype switching mechanism of a single
cell. Phenotype switching generates a mixed population containing normal and persis-
ter cells, which upon addition of an antibiotic, decays with different time scales leading
to a biphasic killing curve as observed in several previous studies. Once the antibiotic
is removed, surviving persister cells can switch back to the normal phenotype, which
again generates a new population that is genetically identical and susceptible as the
original culture. They found that the persisters are either in a non-growing state or
slow growing state and generated with very small switching rates from normal cells,
such that they always represent a small fraction in the population. The generation of
persisters in the absence of any stress (i.e. during growth) suggests that the mechanism
of phenotype switching might have evolved as a regulatory mechanism for responding to
inappropriate environmental conditions. Numerous studies have shown that persistence
is not only limited to E. coli and Staphylococcus aureus cells, but most bacteria exhibit
the persister phenotype [58].
Chapter 1. Introduction 14
The molecular mechanism and the control of persistence has become a prime target
of experimental studies in the last few years [33, 78]. Several studies were performed
addressing basic questions like, whether the persister formation is solely controlled by
molecular reaction within the cell, can persistence be induced or enhanced by envi-
ronmental factors, etc. Several studies found that persister numbers are regulated or
induced in many conditions that lead to growth reduction, such as amino acid depriva-
tion, biofilm formation, stress induction, and entry into stationary phase [21, 63, 79, 105].
The generation of persister cells is shown to be growth dependent in E. coli and Pseu-
domonas aeruginosa [9, 53, 114]. In the lag phase or early exponential phase, where cells
adapt to their growth medium and are unable to divide, there is no persisters generation.
In the exponential growing phase, where the cells begin to divide and the population
grows exponentially, persisters are generated in constant proportions. The fraction of
persisters reaches maximum in the stationary phase, where all the essential nutrients
are depleted.
Another important aspect of bacterial persistence, the physiological state of persister
cells, has been investigated by several researchers. These studies indicated that persisters
are non-growing cells having reduced rates of DNA replication, translation, cell-wall syn-
thesis and metabolism, and thereby are insensitive to antibiotics relying on these growth
dependent processes. Further, gene sequence analysis also supported the dormant state
hypothesis as several genes involved in intracellular metabolism were downregulated in
persisters [63]. On the contrary, a few recent studies reported that persistence may not
always be associated with the dormant or the slow growing fraction of the population
and, moreover, the cells growing normally prior to the antibiotic treatment could behave
as persisters upon antibiotic treatment [95, 131].
1.2.1 Persistence: a cause of antibiotic failures
Persistence has been characterized in several pathogenic microbes such as Mycobacterium
tuberculosis, Staphylococcus aureus, Candida albicans, Pseudomonas aeruginosa and E.
coli [19]. These pathogens are the known cause of various chronic infections, such as
tuberculosis and cystic fibrosis, which often recur in spite of proper antibiotic treatments.
However, these pathogens do not show any sign of genetic resistance when observed
under controlled laboratory experiments. This indicates that the drug tolerant persister
cells are the main culprit behind such recalcitrance to antibiotic treatments [115]. For
instance, patients suffering from Cystic fibrosis (CF), a genetic disorder characterized by
an imbalance in chloride and sodium levels in epithelial tissues in the lungs and intestines,
are highly susceptible to emphPseudomonas aeruginosa infections, which is the leading
cause of many deaths. The cause of the inadequacy in curing a P. aeruginosa infection
Chapter 1. Introduction 15
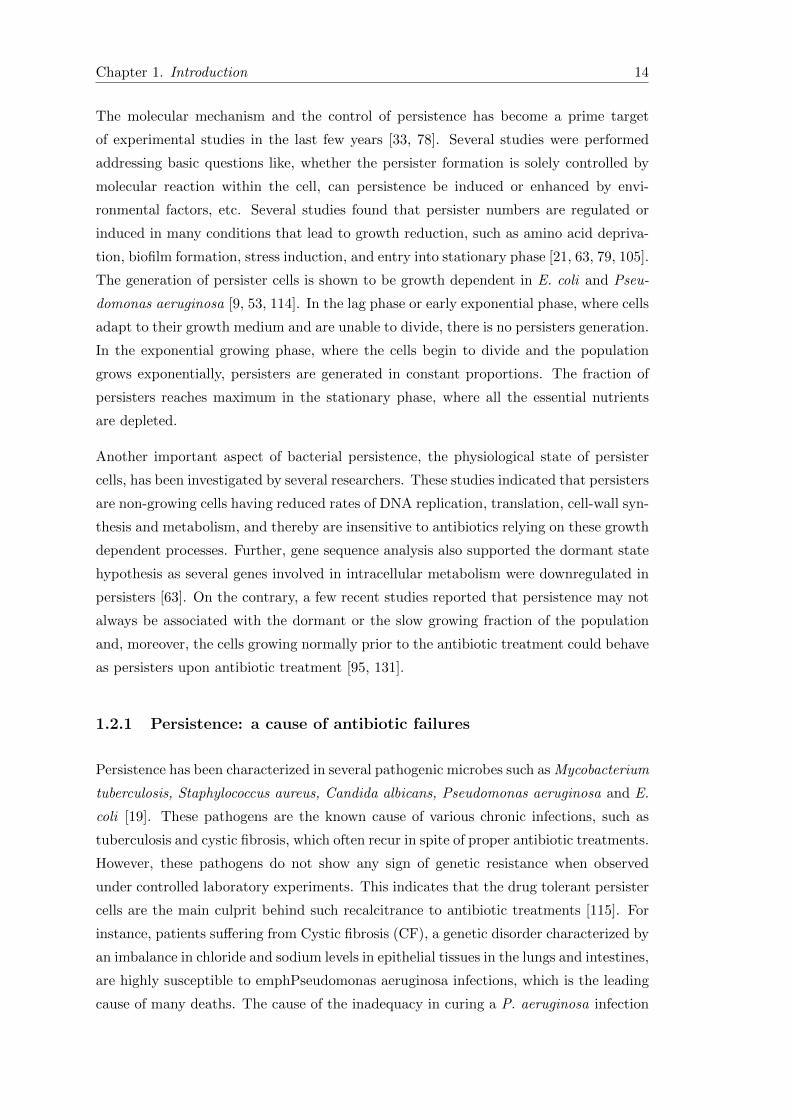
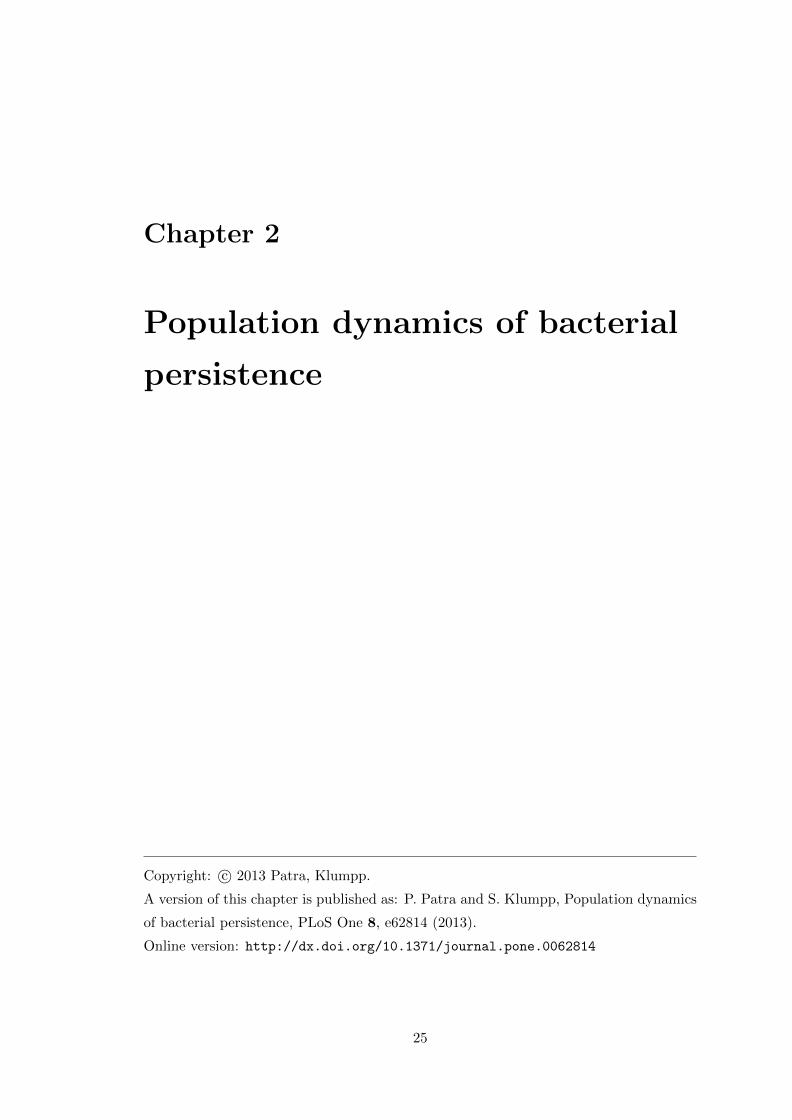
Figure 1.3: Examples of bistable gene circuits: Genes (indicated by thick arrows)produces proteins (indicated by ellipse) which regulate negatively (thin blunt arrow) orpositively ( thin point arrow) the activity of either its own promoter (thick rectangles)or promoter of other genes. (a) Bistable switch with single positive feedback loop. (b)Bistable switch with double-positive feedback loop. (c) Bistable switch with double-negative feedback loop. (d) Toxin Antitoxin network in E. coli.
is again the presence of drug-tolerant persister cells [28, 75]. A direct correspondence
between persister cells and recurrence of chronic infection has been observed in clinical
isolates from CF patients [91]. In this study, the fraction of drug tolerant persister
cells in a clinical isolate from the lungs of a patient in the late stage of infection (96
months) is found to be 100-fold more than the clinical isolates at the onset of chronic
infection. This observation suggests that the high persister mutant has been selected by
the periodic administration of antibiotics. The association of persisters with antibiotic
treatment failure has also been recognized in several other studies [19, 75].
1.2.2 Molecular mechanism of persistence
The first experiment showing that persistence has a genetic basis was performed by
Moyed et al. [88]. In this experiment, they isolated a mutant of E. coli K-12 strain
that displays 100 fold increase in persistence against several antibiotics (phosphomycin,
cycloserine, and ampicillin). The genetic analysis of high persister (hip) mutant revealed
a mutation in a new gene, named ’hip A’ gene. Further studies found that hipA locus
belong to a class of loci in the genome, the toxin-antitoxin (TA) locus. Several studies
have shown the direct connection between TA loci and persistence formation [79, 105].
The TA locus codes for two proteins, a toxin and antitoxin protein, where a toxin is
a stable protein that inhibits cell growth and an antitoxin is an unstable protein [135].
Chapter 1. Introduction 16
The antitoxin regulates the toxin by forming a tight complex with it [107], which repress
the gene expression (Figure 1.3 (d)). The overproduction of toxin inhibits important
cellular processes which are potential targets for many antibiotics, thereby may produce
antibiotic tolerant persister [63]. Therefore, the variation of toxin antitoxin ratio in a
cell defines the phenotypic state [105]. In the absence of any stress, such variation could
be induced by the intrinsic stochasticity in biomolecular reactions at transcription and
translation level [25]. Furthermore, during stress conditions or in the presence of bacteri-
cidal substances, the uneven balance of toxin and antitoxin may also induce persistence.
Recent experiments [21, 22] have shown active generation of persisters (i.e. increase
in persister fractions) in E. coli cells when treated with antibiotics that trigger SOS
response (a global response to DNA damage) such as ciprofloxacin. The SOS response
induced persistence was shown to be dependent on the production of tisB toxin. The
mutants lacking the SOS response or tisB deleted strains displayed significantly reduced
level of persisters when treated with DNA-damaging antibiotics. Thus, clearly the pro-
duction of toxins could drive a cell from a normal growing state into a persister state.
In E. coli , there are about 36 TA loci and, in the pathogenic bacterium Mycobacterium
tuberculosis about 100 TA locus [76, 135]. The deletion of several TA loci reduced the
level of persisters in a biofilm [76] and the induced persistence during SOS response [22].
The toxin-Antitoxins (TA) loci are divided into three classes. In Type I TA loci, the an-
titoxins are anti-sense RNAs that repress the translation of the toxin encoding mRNA,
whereas in type II TA loci, an antitoxin protein neutralizes the activity of encoding
gene as well as the toxin proteins. Type III TA loci code for small RNA antitoxins that
neutralizes the toxin proteins by establishing a direct protein-RNA contact. A recent
study showed that the deletion of Type II TA loci (in E. coli K-12 strain consisting
10 TA loci ) progressively reduced the levels of persisters, while the growth rate and
minimum inhibitory concentrations (MICs) of the antibiotics (ciprofloxacin and ampi-
cillin) were unaffected [79]. This result confirms the direct proportionality between TA
loci and persister fractions. However, the deletion of all 10 TA loci did not lead to zero
persistence, suggesting that TA loci is not the sole key to persistence, there could be
other unknown genes which have not been characterized yet.
1.2.3 Persistence against multiple drugs
Persister generation does not follow a universal single scheme. There are multiple
pathways through which persister formation can be achieved and modulated. Some
of these pathways are inherently present in the genome and some are regulated or in-
duced through various environmental interactions. Several pathways were identified in
genetic screening of persister cells in E. coli [76]. However, the complete knockout of
Chapter 1. Introduction 17
these identified candidate genes never achieved zero persistence, although reduced sig-
nificantly the level of persisters. Similarly, in another independent experiment, deletion
of multiple toxin-antitoxin loci could not lead to zero persistence [79]. This suggests that
there are several redundant pathways, some of them still to be identified, through which
persistence can be achieved. Antibiotics of differing action mechanism target different
processes and pathways in the cell, which might lead to variable levels of persistence in
a population. The variability in persistence against different antibiotic is termed as mul-
tidrug tolerance. Multidrug tolerance has been observed in E. coli and S. aureus cells
against several antibiotics [45, 71, 72, 133]. This is another important area of research
where several labs have worked on recently.
1.2.4 Other examples of phenotypic heterogeneity
Phenotypic heterogeneity, specifically bistability, in populations has been observed in
numerous bacterial species and eukaryotes under diverse conditions. Phenotype diversity
is found to be a direct consequence of multistability of the gene expression in a cell,
which arises due to feedback and nonlinear responses within a gene regulatory network
of the cell. In a regulatory network, the smallest unit, i.e., the gene expresses specific
proteins which either regulate itself or other genes, and are continuously degraded. As
the protein level passes a certain threshold value the gene expression is driven towards
one of the stable states, this property is called multistability of the regulated gene.
Such regulatory networks or motifs has been identified in several species, furthermore
their underlying properties have been realized using synthetic networks [30, 40, 57]. For
example, a simple genetic circuit composed of a positively autoregulated gene or two
mutually auto activating genes (double positive feedback) or two mutually repressing
genes (double negative feedback) [60] can demonstrate a bistable output (Figure 1.3). A
population exhibiting bistability bifurcates into subpopulation of cells having one of the
two stable states of gene expression, which is typically observed as a bimodal distribution
in the population gene expression ( as shown in figure 1.1(b)). For example, sporulation
and competence in B. subtilis cells, lac operon network in E. coli and lysis-lysogeny
switch in phage λ [25, 128], etc., are well studied cases of such bistability. The fate
of a single cell ending in one of the two stable phenotypic states has also been linked
with the stochastic fluctuations or noises in cellular components in several stages during
a cell cycle [124]. Noise can be generated by the inherent stochasticity in biochemical
reactions maintaining gene expression (intrinsic noise) or due to the fluctuations in other
regulating factors that influence gene expression (extrinsic noise). It has been shown,
in E. coli , that both intrinsic and extrinsic noise contribute to phenotype variability
[27, 118].
Chapter 1. Introduction 18
1.3 Overview of theoretical work
The population dynamics of bacterial persistence or the reversible phenotype switching
mechanism is proposed and well studied in the last decade by several independent re-
search groups [4, 67–69, 121]. These studies focus on the measurement of the phenotypic
switching and its evolution in different environments. The inheritablilty of phenotype
switching, i.e., transmission to newer generations raise questions about the evolutionary
adaptation or selection of this trait.
The basic idea is that phenotype switching allow cells to generate different phenotypes,
which are maladapted to the present conditions, but when the condition changes, one of
the maladapted phenotype becomes best suited to the new condition and hence, provides
a benefit to the population. This phenomenon is termed as a bet-hedging strategy in
the field of ecology, where the population allocates some individual in a protective state
as its insurance policy to survive under adverse environmental conditions [67]. In a
fluctuating environment, the interplay between insurance cost and benefit determine
the circumstances under which phenotype switching is advantageous. Lachmann et al.
[69] found that inheritance of a phenotype switching is advantageous in a periodically
fluctuating environment with cycle length much longer than the replication time of
the organism. The best strategy or the optimal phenotype transition rate under such
cyclic environment is inversely proportional to the length of the environmental cycle.
Therefore, it was suggested that the environmental conditions may act as selective agent
that can select the organisms having an optimal transition rate or allow a directional
process by which a population can achieve the optimal transition rate.
Balaban et al. showed that the biexponential decay of a bacterial population observed
during the antibiotic killing is a signature of phenotype switching [4]. The normally grow-
ing cells generate persister cells through phenotype switching, which leads to a mixed
population during growth. This mixed population decays, upon antibiotic treatment,
with two time scales as the persister subpopulation is not killed as fast as the normal
subpopulation. The surviving persister subpopulation on reinoculation grows as fast as
the normal cells after an initial lag period (associated with slow growth of persisters),
which leads to a biexponential population growth. They proposed a two-state model to
describe the biexponential kinetics of the population and, evaluated phenotype switching
rates by fitting the model with experimental data [4]. The two state model was further
used to study the temporal evolution of a population in a fluctuating environment [67].
This analysis showed that in slow varying periodic environments, there exist an optimal
phenotype switching rate between the two phenotypes which maximizes the long-term
growth rate of the population. The optimal switching rate is given by the frequency of
environmental variation, specifically, the duration of growth and stress determines the
Chapter 1. Introduction 19
optimal switching from normal to persister and persister to normal state, respectively
[67]. Using experimentally measured phenotype switching rates for two different strains,
they showed that in a periodically fluctuating environment with characteristic growth
and stress duration, one bacterial strain can overtake the other strain if its phenotype
switching is tuned close to the optimal phenotype switching rates.
A more general description was put forward by E. Kussell et al.[68] describing phenotype
switching as a macroscopic information processing mechanism in fluctuating environ-
ments. The underlying idea is that a population can carry information about an envi-
ronment through its internal state (using subpopulation allocation) that is determined
by the current environmental conditions and phenotype switching rates. This subpopu-
lation allocation can then be optimized for maximum growth in repetitive environmental
conditions by regulating phenotype switching rates in accordance to environmental fluc-
tuations. They found that in slowly fluctuating environments, the optimal switching
rate from a given phenotype (X) to another phenotype (Y) is directly proportional to
the probability that the environment changes from the state favoring phenotype (X) to
the state favoring phenotype (Y) and, inversely proportional to the average duration
of environmental state favoring phenotype (X). In simple words, this means that the
switching to a phenotype will be favored if the environmental state favoring this pheno-
type occurs more frequently and the switching back from this phenotype will be favored
if the mean residence time of environmental state favoring this phenotype is smaller than
in the other states.
1.4 Motivation
The experimental study of bacterial persistence focus on two main objectives, namely,
the description of molecular mechanism of phenotype switching in single cells and the
understanding of antibiotic tolerance in populations. On the other hand, theoretical
studies develop a mechanistic understanding of the molecular mechanism as well as the
population dynamics and evolution of bacterial persistence. These approaches help in
understanding the properties of drug tolerant persisters and in developing new thera-
peutics designs to prevent antibiotic failures. The present work focus on the population
dynamics and evolution of bacterial persistence in spatially and temporally varying en-
vironments. The main objective of this thesis is to integrate results and obtain model
parameters from experimental observations and, to develop theoretical framework to
analyze the dynamics in realistic scenarios under which population evolves.
Chapter 1. Introduction 20
1.4.1 Temporal dynamics of bacterial persistence
Previous theoretical studies on the evolutionary dynamics of bacterial persistence or
phenotype switching are based on numerical simulation and rigorous theoretical analysis
within certain limits. A common assumption in previous theories is that the environ-
mental duration is large or that the environment fluctuates very slowly. This assumption
has been used to predict the evolutionary dynamics of phenotype switching in fluctuat-
ing environments [29, 67–69]. If an environment occurs rarely or has a short duration,
this approach cannot predict the evolutionary behavior or the long term growth rate.
Although it is expected that in a short environmental period phenotype switching, being
harmful to the population, might not evolve. However, a simple analytical approach that
can explain the evolutionary dynamics in both short and long environmental duration,
even in the simple case of two state population model, is missing. The relation between
experimental observations and the model parameters of persistence mechanism has been
overlooked because most studies focus on the long term evolutionary dynamics rather
than short term transient dynamics. Therefore, a simple theoretical approach is neces-
sary which can connect experimental observables with the model parameters and explain
the transient as well as the evolutionary dynamics in both short and long environmental
duration.
1.4.2 Spatial dynamics of bacterial persistence
Most theoretical and experimental studies exploit temporally changing environments
to understand the role of bacterial persistence. Spatially structured environments are
also used to study evolution in bacterial populations [41, 56, 70, 102–104, 137], but
have not been considered in the study of persistence. In the human body antibiotic
distribution is usually uneven due to complex flow patterns inside the body, such as
different diffusion rates into tissues, local binding, inactivation of antibiotics, etc. The
spatial heterogeneity in drug concentration is shown to have direct consequences in
the emergence of antibiotic resistance [35, 42, 43, 137]. On the other hand, in the
human body, bacterial population form biofilms, a protected region or compartment
where antibiotics cannot penetrate and bacteria can remain viable. These cells have to
migrate through a region of high antibiotic concentrations or other stressful environments
to find a region of low antibiotic concentration to form another biofilm or to infect other
organs in the body [51, 65] or to infect an untreated individual [20, 77]. Therefore, the
antibiotic tolerant persister cells might help a population to propagate between growth
permitting regions by minimizing the chance of extinction while crossing a region of
high antibiotic concentration. Therefore, the dynamics of bacterial persistence under
Chapter 1. Introduction 21
such spatial environments might help in understanding its role in antibiotic resistance
and designing experiments to study spatial evolution.
1.4.3 Population dynamics of multidrug tolerance
Bacterial persistence was first reported in S. aureus populations [7]. Since then it has
been an important model organism other than E. coli to understand the relevance of
persister cells in antibiotic treatment failures. E. coli cells have shown partial drug
tolerance or persistence to several drugs such as ciprofloxacin, amplicin and streptomycin
[8, 45, 53]. Likewise, S. aureus cells, over a long time, have developed resistance against
several antibiotics with differing killing mechanism. Several studies found that failure in
antibiotic treatment against staphylococcal infection is associated with the persistence
mechanism [31, 49]. Hence, a systematic study of characterizing persistence of S. aureus
against different antibiotics is necessary for the development of new drugs and multidrug
therapies to eliminate persisters [71]. An important question with respect to multidrug
therapy is whether persisters selected by different antibiotics are identical or different
in their physiology and numbers. The efficacy of cross drug treatment relies on whether
or not the surviving population from one antibiotic treatment can be killed by the
addition of another antibiotic with dissimilar mechanism. These intriguing questions
must be answered at least for the very first organisms that displayed persistence. Such
study will also provide model parameter such as switching rates and growth rates for S.
aureus that can be compared with other model organisms like E. coli , P. aeruginosa,
etc.
1.4.4 Role of persisters in the emergence of antibiotic resistance
Another important feature of bacterial evolution is antibiotic resistance, whereby bac-
teria become resistant and continue to multiply in the presence of antibiotics designed
to kill them [61, 94, 117]. Childhood diseases such as pneumonia and dysentery are
no longer curable by earlier discovered drugs because the responsible pathogens have
developed resistance against them. A large percentage of deaths in hospital are caused
by infections from highly resistant bacteria such as methicillin-resistant Staphylococcus
aureus (MRSA) and vancomycin-resistant Enterococci . Antibiotic resistance is a serious
issue that is undermining the health care industry and threatens to become worse in the
absence of serious concerns. Therefore, the understanding of the role of persister cells
in the emergence of antibiotic resistance is crucial to cultivate therapeutic strategies
to prevent treatment failures. Several studies speculated that persister cells surviving
longer upon antibiotic treatment might provide a pool from which antibiotic resistant
Chapter 1. Introduction 22
cells can emerge [23, 61, 116, 117]. However, common antibiotics those targets growth
maintaining processes, allow survival of non-dividing cells [10], which can undergo mu-
tations in limited ways. However, a recent study shows that persistence may not always
be incompatible with cellular growth [95, 131]. They found that the Mycobacterium
segmentis persisters prior to antibiotic (isoniazid) treatment were dividing as fast as the
normal cells. The heterogeneous response came through the variation in drug activation
process between persisters and normal cells, specifically persister cells expressed low-
level of KatG, a catalase peroxidase required for activation of antibiotics. The surviving
subpopulation of persister cells remained stationary due to the balance of growth with
antibiotic death [131]. The ongoing division in the presence of antibiotics may lead to
the emergence of resistant mutants in such cases. The stress response programs such as
SOS, stringent, oxidative stress response, etc. which regulates persistence are also shown
to increase rates of genome-wide mutagenesis and horizontal gene transfer in E. coli , S.
aureus, and P. aeruginosa [16, 37, 72, 81, 100]. Therefore, a systematic study consider-
ing the stochastic effects of mutation and extinction processes must be performed. Such
a theoretical analysis might help in designing and understanding future experimental
studies identifying the role of persisters in antibiotic resistance.
In this thesis, we will address the above discussed interesting problems and intriguing
questions to provide a better understanding of bacterial persistence mechanism.
Thesis organization
The thesis is organized as a ”cumulative thesis” and consists of six chapters. Chap-
ter 2-4 consist of three manuscripts, out of which two manuscripts (chapter 2 and 4)
have been published, one is submitted (chapter 3). Chapter 5 contains additional un-
published results. A list of published and submitted manuscripts are provided below.
Chapter 2 focuses on the temporal dynamics of bacterial persistence mechanism in sev-
eral typical experimental scenarios. Chapter 3 studies the expansion of a phenotypically
heterogeneous population in spatially heterogeneous environments. Chapter 4 presents
an application of the theoretical results obtained in chapter 2 by analyzing experimental
results on multidrug tolerance, whereas Chapter 5 explain the role of bacterial persis-
tence in the emergence of antibiotic resistance. The thesis in total (chapter 2-5) explores
the role of bacterial persistence in spatially and temporally fluctuating environments.
Chapter 1. Introduction 23
1.5 List of publications
• Population Dynamics of Bacterial Persistence. P Patra and S Klumpp, PloS ONE
8, e62814 (2013).
• Phenotypically heterogeneous populations in spatially heterogeneous environments.
P Patra and S Klumpp, under review at Phys Rev Letters.
• Interplay between population dynamics and drug tolerance of Staphylococcus au-
reus persister cells. S Lechner, P Patra, S Klumpp, and R Bertram, J. Mol.
Microbiol. Biotechnol. 22, 381 (2012).
1.6 Author contributions
1. Population Dynamics of Bacterial Persistence.
2. Phenotypically heterogeneous populations in spatially heterogeneous environments.
These are two theory papers. The projects were planned by P Patra and S Klumpp.
The theoretical analysis was carried out by PP. The papers were written by PP
and SK.
3. Interplay between population dynamics and drug tolerance of Staphylococcus au-
reus persister cells.
This is a joint experimental/theoretical study. The experiments were planned and
done by S Lechner and R Bertram, the theoretical analysis was done by PP and
SK. The paper was written by SL, RB with contributions from PP and SK. Addi-
tional unpublished results from the theoretical analysis are included in Appendix
A.2 of the thesis.

Chapter 2
Population dynamics of bacterial
persistence
Copyright: c© 2013 Patra, Klumpp.
A version of this chapter is published as: P. Patra and S. Klumpp, Population dynamics
of bacterial persistence, PLoS One 8, e62814 (2013).
Online version: http://dx.doi.org/10.1371/journal.pone.0062814
25
Chapter 2. Population dynamics of bacterial persistence 26
Abstract
Persistence is a prime example of phenotypic heterogeneity, where a microbial population
splits into two distinct subpopulations with different growth and survival properties as
a result of reversible phenotype switching. Specifically, persister cells grow more slowly
than normal cells under unstressed growth conditions, but survive longer under stress
conditions such as the treatment with bactericidal antibiotics. We analyze the popula-
tion dynamics of such a population for several typical experimental scenarios, namely
a constant environment, shifts between growth and stress conditions, and periodically
switching environments. We use an approximation scheme that allows us to map the
dynamics to a logistic equation for the subpopulation ratio and derive explicit analytical
expressions for observable quantities that can be used to extract underlying dynamic pa-
rameters from experimental data. Our results provide a theoretical underpinning for the
study of phenotypic switching, in particular for organisms where detailed mechanistic
knowledge is scarce.
Chapter 2. Population dynamics of bacterial persistence 27
2.1 Introduction
The life of microorganisms is characterized by two main tasks, rapid growth and prolif-
eration under conditions permitting growth and survival under stressful conditions [93].
One strategy to cope with such varying environmental conditions is phenotypic hetero-
geneity, the splitting of a genetically homogeneous population into subpopulations that
execute different strategies for survival [19, 25, 113]. Phenotypic tolerance to antibiotics
(persistence) is a prime example of such phenotypic heterogeneity: When a bacterial
culture is treated with an antibiotic, typically a small fraction of the population, the
persisters, survives and allows the culture to grow back once the antibiotic has been
removed (Fig. 2.1), thus making it difficult to eradicate the population [7, 73, 75]. The
re-grown culture remains susceptible to the antibiotic with the exception of yet again
a small fraction of persisters, indicating that, in contrast to resistance, persistence is a
phenotypic effect. Indeed observations at a single cell level have shown that cell switch in
a stochastic fashion between the persister state and the normal state [4]. Moreover these
experiments have shown that persistence is not an adaptive response to the antibiotics,
but rather that persisters are present in the population before the antibiotic treatment
[4] (there is however evidence that adaptive responses also play a role in some situations
[21, 22]). The persister cells present in the population before treatment were shown
to grow much more slowly than normal cells [4, 110], indicating that persistence while
providing a fitness benefit (survival advantage) under stress conditions also invokes a
fitness cost under unstressed conditions. Persistence is thus based on the coexistence
of subpopulations growing with different growth rates. Mechanistically, the formation
of persisters has been linked to the expression of chromosomal toxin-antitoxin systems
[62, 79, 88, 89], which are believed to give rise to a genetic circuit that exhibits bistable
behavior resulting in subpopulations with different phenotypes characterized by differ-
ent growth rates [15, 60, 78, 105]. Indeed, experimental and theoretical studies of the
coupling of gene expression and cell growth indicate that such growth bistability should
be considered a rather generic phenomenon that can arise when gene circuits modulate
cell growth [60, 119].
The molecular mechanisms for the generation of persisters are currently a topic of very
active research. Persistence has been observed in a wide range of bacterial species
[73, 75, 115], but on the mechanistic level, so far relatively little is known for bacteria
other than the model organism E. coli. In the absence of detailed mechanistic knowl-
edge, the main window into persistence is the study of the population dynamics upon
antibiotic treatment, in particular, the survival upon administration of the drug and
the re-growth of the population upon removal of the drug. Here we study a theoretical
model for this dynamics that was originally proposed by Balaban et al. [4]. We make
Chapter 2. Population dynamics of bacterial persistence 28
use of an excellent approximation (based on the assumption that the rates of phenotype
switching are small, which is typically the case) to derive explicit analytical expression
for a number of observable quantities for several typical experimental scenarios: con-
stant environment, shift from growth to stress conditions or vice versa and periodically
switching environments. Our analysis is similar to previous theoretical studies on pheno-
type switching [67, 68]. A small but important difference to the systematic perturbative
approach used in Ref. [68] is that our theory is based on the approximation of small
phenotype switching rates (as compared to the growth and death rates), while the ap-
proximation of Ref. [68] is based on long durations of environmental durations, such
that populations structures reach their steady state before the environment changes.
The latter is not required in our approximation and our approach thus allows us to
study both short and long environmental durations (while long durations are expected
to be typical for the natural environment, and thus appropriate for an evolutionary
comparison of different modes of phenotype switching, such as stochastic and adaptive
[68], short durations may be of importance for some experimental situations, such as
resuscitation experiments after short periods of antibiotic treatment). We also note that
while the mathematics of ours and the previous study are closely related, the scope
of the studies is different. Rather than aiming at a general theoretical framework for
phenotype switching phenomena, our goal here is to obtain simple explicit expression
for measurable quantities. These expressions can be used to analyze experimental data
for population growth and decay to provide insights into the mechanism of persistence
based on simple population-scale experiments.
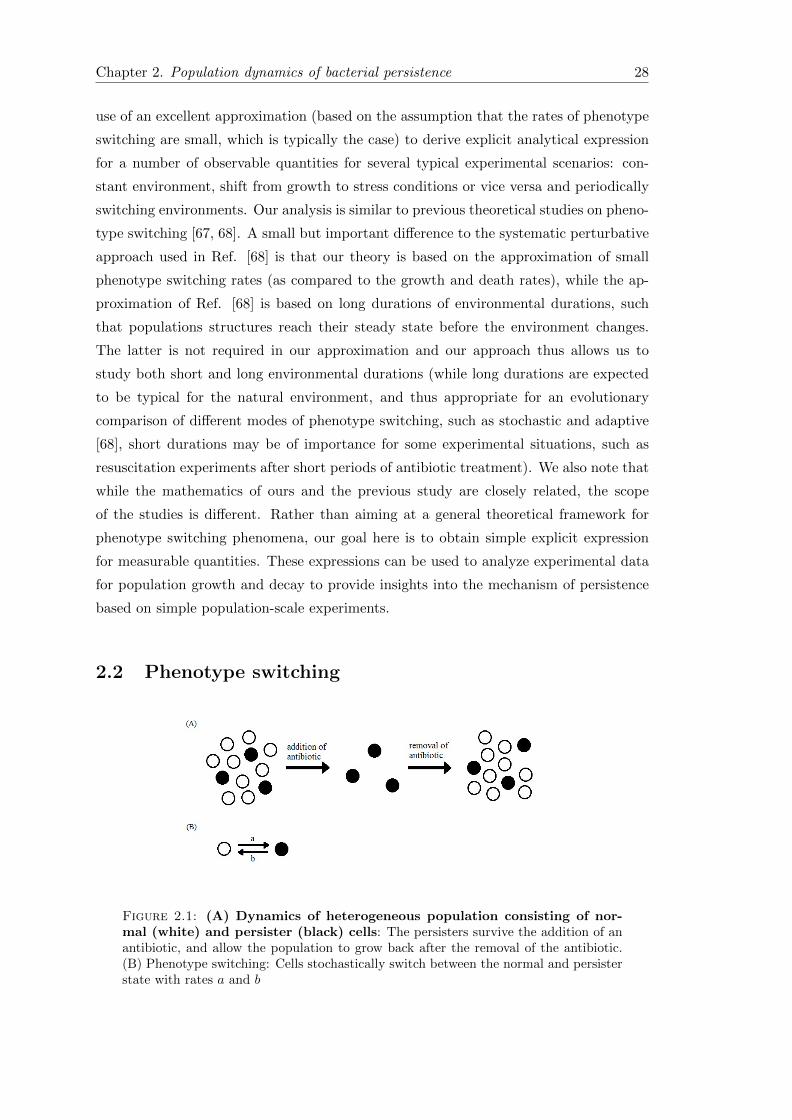
2.2 Phenotype switching
Figure 2.1: (A) Dynamics of heterogeneous population consisting of nor-mal (white) and persister (black) cells: The persisters survive the addition of anantibiotic, and allow the population to grow back after the removal of the antibiotic.(B) Phenotype switching: Cells stochastically switch between the normal and persisterstate with rates a and b
Chapter 2. Population dynamics of bacterial persistence 29
We consider a bacterial population where an individual cell can have two distinct pheno-
typic states (Fig. 2.1) which are characterized by different sensitivities to given environ-
mental conditions. The environmental sensitivity is reflected in growth and decay rates
of the subpopulation in the given environment. For instance, in the case of persister cell
on which we focus, normal cells are more sensitive to various stresses, i.e. they decay
faster under various stress conditions such as antibiotic treatment [4] and phage attack
[99], but also grow faster in unstressed conditions.
A cell in the normal state can switch to the persister state with rate a and a cell in
the persister state can switch back to the normal state with rate b. The instantaneous
switching between phenotypic states leads to distinct subpopulation of normal and per-
sister cells which compose the total population. We denote the growth rate of normal
cells (n) and persister cells (p) by µmn and µmp respectively, where m indicates the growth
medium or, more generally the growth conditions. Below we will use indices ’g’ and ’s’
to denote unstressed growth and stress conditions, respectively (e.g., growth medium
not containing or containing an antibiotic). The resulting population dynamics can be
described by the following system of equations [4],
dn
dt= µmn n− an+ bp
dp
dt= µmp p+ an− bp. (2.1)
In order to determine the steady state of these dynamical equations, we consider the
time evolution of the subpopulation ratio f = n/p, which is given by
df
dt= b− af2 + ∆mf = −a(f − f ′)(f − f∗), (2.2)
where
f∗ =∆m +
√(∆m)2 + 4ab
2a,
f′
=∆m −
√(∆m)2 + 4ab
2a(2.3)
and ∆m = (µmn − a)− (µmp − b).
f∗ and f ′ are fixed points of Eq. (2.2): f ′ is an unstable fixed point (which moreover
can be negative) and f∗ is a stable fixed point and always positive. Thus, the steady
state population ratio is given by f∗.
In conditions of unstressed growth, ∆m is positive. When the switching rates are small
compared to the growth rates, as it is typically the case (Table 2.1), the steady state
Chapter 2. Population dynamics of bacterial persistence 30
ratio can be approximated by f∗ ≈ ∆m/a or
n∗
p∗≈
(µmn − µmp )
a. (2.4)
The last equation has a simple, but instructive interpretation: the steady state popula-
tion structure with a certain ratio of normal and persister cells in conditions of unstressed
growth is determined by a balance of two processes: The fast-growing normal cells out-
grow the slow-growing persisters (with ∆m ≈ µmn − µmp ), but they also replenish the
persister population via switching to the persistent state (with rate a). We linearize
Eq. (2.2) around the fixed point f∗ to determine the time scale in which the steady state
is approached,
df
dt≈ −
√∆2m + 4ab (f − f∗). (2.5)
This equation shows that the subpopulation ratio f approaches the steady state f∗
with rate ([(µmn − a)− (µmp − b)]2 + 4ab)1/2, which, for small switching rates a and b, is
approximately equal to the growth rate difference between the two subpopulations.
Likewise, the same approximation applied to stress condition (with ∆m < 0), leads to
the steady state f∗ ≈ −b/∆m or
p∗
n∗≈
(µmp − µmn )
b. (2.6)
In this case, the steady state population structure is determined by the balance of
persisters outlasting the normal population (with −∆m ≈ µmp − µmn ) and reproducing it
through phenotype switching (with rate b).
The existence of a finite steady state in the subpopulation ratio indicates a stable co-
existence of the two cells types that grow (or decay) with different rates. It is worth
noting that such coexistence is an effect of phenotype switching, as normally a faster
growing subpopulation will outgrow a slow-growing one, so that the subpopulation ratio
will approach either zero or infinity. Here however, switching of cells between the two
phenotypes that correspond to the two subpopulations can replenish the slower-growing
(or faster-decaying) subpopulation and balance the outgrowth effect.
So far we have only considered the subpopulation ratio or the fractions of total popula-
tion that belong to the two phenotypes. Within the model of Eqs. (2.1), these fractions
approach a steady state, while the overall population always grows or decays exponen-
tially on long time scales. Thus, both subpopulations grow or decay with the same
average rate in the steady state, which corresponds to the effective growth rate (or de-
cay rate) of the total population. The steady state growth rate of the total population
Chapter 2. Population dynamics of bacterial persistence 31
(µst) is obtained from Eqs. (2.1) by substituting Eq. (2.3) and is given by
µst =(µmn − a) + (µmp − b) +
√∆2m + 4ab
2. (2.7)
We use again an approximation of small switching rates and neglect terms of quadratic
order in the switching rates (terms proportional to ab). With this approximation the
steady state growth rate is simplified to
µst ' µgn − a (2.8)
in unstressed growth (µgn > µgp > 0) and to
µst ' µsn − b (2.9)
under stress conditions (µsn < µsp < 0).
The comparison of these two approximate expressions shows that the presence of per-
sister cells causes a small reduction in the steady state growth rate under unstressed
conditions (of order a), but leads to a significant reduction in the steady state death
rate of the total population under stress conditions as compared to a population with-
out any persister cells. Therefore one can expect the presence of persister cells to be
beneficial provided that stress conditions do regularly occur.
Table 2.1: Rates for switching between the normal and persister phenotype.
organism switching rate a switching rate b reference(n→ p) (p→ n)[hr−1] [hr−1]
E. coli 10−6 − 10−3 10−6 − 10−1 [4]S. aureus 10−5 − 10−3 10−2 − 10−1 [72]
The balance between phenotype switching and outgrowing of one subpopulation by the
other that we have discussed above is intricately linked to the exponential growth or
decay of the total population. While exponential growth phase is the main focus of
our study, we want to briefly address the case where the population reaches a stationary
phase due to a finite carrying capacity (K) of the growth environment, a typical situation
in both natural habitats and in the test tube. To this end, we modify the growth
terms in Eq. (2.1) by multiplying them with [1− (n+ p)/K]. In a growth environment
(with positive growth rates), the total population will then reach a steady-state value
of n + p = K for long times. The ratio between persisters and normal cells is then
determined not by a balance of one-way phenotype switching and growth, but by a
balance between switching in both directions, given by an− bp = 0. As a consequence,
the ratio f is given by f = n/p ≈ b/a and is thus several orders of magnitude smaller
Chapter 2. Population dynamics of bacterial persistence 32
than the corresponding value obtained for exponential growth, Eq. (2.4), because of the
small switching rates. This result is consistent with the observation that typically the
fraction of persisters in the population is larger in stationary phase than in exponential
growth phase (e.g., a 100-fold effect in E. coli) [75].
2.3 Dynamics in constant environment
In the following we will discuss the time evolution of the two subpopulation in more
detail. We start by considering a constant environment. To solve the time-dependence
of the coupled equations in Eqs. (2.1), we make once more use of the approximation for
small switching rates (∆2m � ab).
If the constant environment is one of unstressed growth (with ∆m > 0), the fixed
points can be approximated by f′ ≈ 0 and f∗ ≈ ∆g
a . The differential equation for the
subpopulation ratio (f) is thereby reduced to a logistic equation,
df
dt= ∆gf
(1− af
∆g
), (2.10)
where ∆g = (µgn − a)− (µgp − b). Its solution has the following form:
f(t) =∆g
a+ (∆g/f0 − a)e−∆g t, (2.11)
where f0 is the initial ratio of normal to persister cells.
For ∆m < 0, i.e. in stress conditions, a similar differential equation like Eq. (2.2)
is obtained for the time evolution of ratio of the persister subpopulation to the normal
subpopulation, φ = p/n. The differential equation of φ has two fixed points φ∗ ≈ −∆m/b
and φ′ ≈ a/∆m, of which φ∗ = 1/f∗ is stable. In this case, using the approximation
φ′ ≈ 0, we obtain
dφ
dt= ∆sφ
(1− bφ
∆s
)(2.12)
with ∆s = (µsp − b)− (µsn − a). With an initial ratio φ0, the solution has the form
φ(t) =∆s
b+ (∆s/φ0 − b)e−∆s t. (2.13)
For large times, these expression approach the steady state results derived previously
and given in Eq. (2.4) and Eq. (2.6), respectively. As a consequence, under unstressed
growth conditions, the effective growth rate of the persister subpopulation approaches
the growth rate of the normal subpopulation in a logistic fashion and vice versa.
Chapter 2. Population dynamics of bacterial persistence 33
The functional form of f(t) and φ(t) derived here will be used as the basis for our further
analysis. Because of the symmetry between the two cases, we will calculate quantities in
only one condition (growth or stress). The results for the other condition are obtained by
simultaneously exchanging symbols and indices according to the rules g ↔ s, f0 ↔ φ0,
a↔ b, and p↔ n.
2.4 Response to environment shift
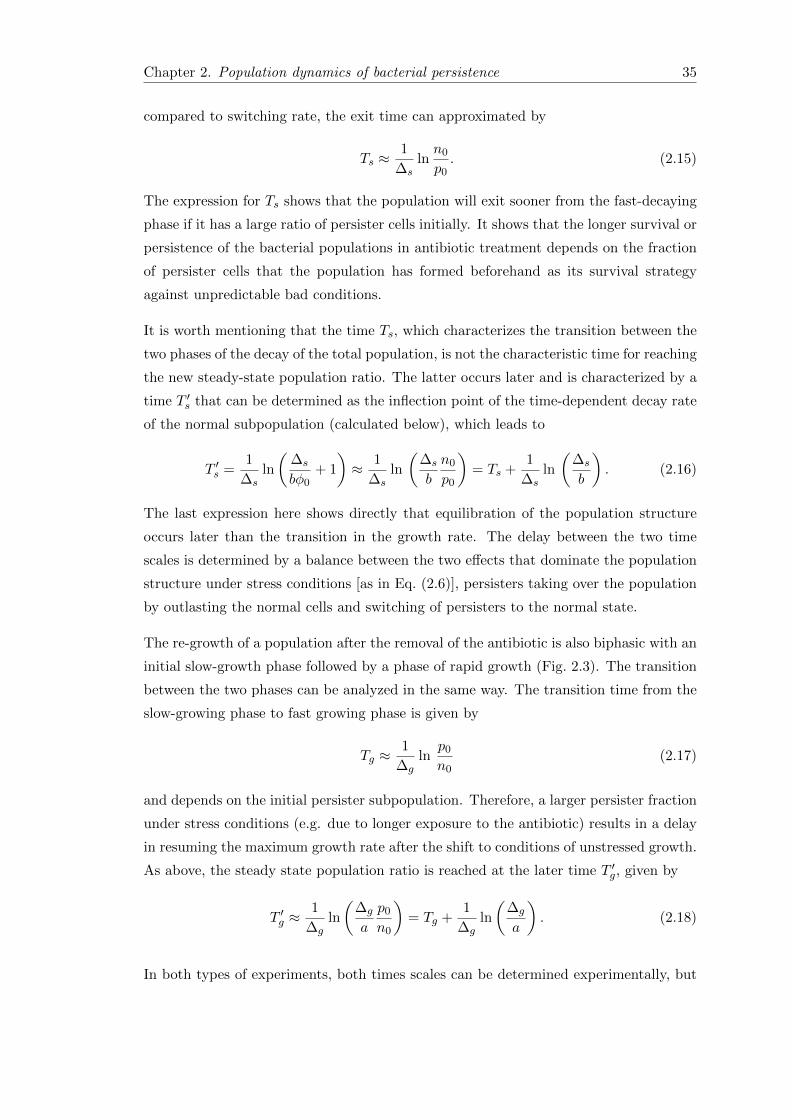
2.4.1 Characteristic time scales of the population dynamics
100
102
104
106
108
1010
1012
1014
1016
0 5 10 15 20 25 30
Pop
ulat
ion
Time [hours]
Ts
T′s
Normal subpopulationPersister subpopulation
Total population
Figure 2.2: Biphasic killing kinetics: Numerical integration of Eqs. (2.1) over agrowth period of 15 hours (with µg
n = 2 hr−1,µgp = 0.2 hr−1) followed by a stress
period (with µsn = −2 hr−1,µs
p = −0.2 hr−1) of another 15 hours. The switching rateswere chosen to be a = 0.001 hr−1 and b = 0.001 hr−1. The killing curve of totalpopulation show two distinct phases, a fast-decaying phase and a slow-decaying phase.The dynamics is characterized by two time scales Ts and T ′s (see text).
Next we turn to the dynamics after an environmental shift. Experimentally, one typi-
cally considers two situations [4, 19, 72]: (i) a population that has been growing under
unstressed conditions for a sufficiently long time is exposed to an antibiotic or (ii) a pop-
ulation that has been exposed to an antibiotic for some time is shifted back to a medium
without the antibiotic. In both cases, one typically observes a biphasic dynamics. For
instance, a population exposed to an antibiotic typically shows biphasic decay.
Such kinetics is obtained as a consequence of the coexistence of the two phenotypes and
the time at which the global decay rate changes provides an easily observable signature
of phenotype switching that allows to infer its microscopic parameters.
Chapter 2. Population dynamics of bacterial persistence 34
100
105
1010
1015
1020
1025
0 5 10 15 20 25 30
Pop
ulat
ion
Time [hours]
Tg
T′g
Normal subpopulationPersister subpopulation
Total population
Figure 2.3: Biphasic growth kinetics: Numerical integration of Eqs. (2.1) overa stress period of 15 hours followed by a regrowth period of another 15 hours. Theregrowth curve of the total population shows two distinct phases, a slow-growing phasefollowed by a fast-growing phase. The parameters are the same as in Fig. 2.2.
Fig. 2.2 shows a numerical example of such dynamics: Here Eqs. (2.1) have been inte-
grated to reach a steady population ratio under growth conditions with a small persister
fraction. At time t = 15 hours, the parameters were changed to those for stress con-
dition. After the shift to stress conditions (by the addition of an antibiotic), the total
population displays the biphasic decay behavior. In the fast-decaying phase, the decay
of the total population is dominated by the death of normal cells, while in the second,
slower-decaying phase, the total population consists predominantly of persister cells and
the decay rate is governed by the death rate of the persisters. The transition between the
two different phases occurs when both subpopulation becomes equal in size, i.e. at a time
Ts for which φ(Ts) = 1. Therefore, the transition time (Ts) from the fast-decay phase
to the slow-decay phase after the shift to stress conditions or to antibiotic-containing
medium is given by
Ts =1
∆sln
∆s/φ0 − b∆s − b
, (2.14)
where 1/φ0 is the initial ratio of normal cells to persister cells at the time antibiotic
treatment. During the growth phase, the normal cells make up the majority of the
population and persister cells account for only a small fraction of the total population,
which means 1/φ0 � b. In the limit ∆s � b, i.e. if the growth rate difference is larger
Chapter 2. Population dynamics of bacterial persistence 35
compared to switching rate, the exit time can approximated by
Ts ≈1
∆slnn0
p0. (2.15)
The expression for Ts shows that the population will exit sooner from the fast-decaying
phase if it has a large ratio of persister cells initially. It shows that the longer survival or
persistence of the bacterial populations in antibiotic treatment depends on the fraction
of persister cells that the population has formed beforehand as its survival strategy
against unpredictable bad conditions.
It is worth mentioning that the time Ts, which characterizes the transition between the
two phases of the decay of the total population, is not the characteristic time for reaching
the new steady-state population ratio. The latter occurs later and is characterized by a
time T ′s that can be determined as the inflection point of the time-dependent decay rate
of the normal subpopulation (calculated below), which leads to
T ′s =1
∆sln
(∆s
bφ0+ 1
)≈ 1
∆sln
(∆s
b
n0
p0
)= Ts +
1
∆sln
(∆s
b
). (2.16)
The last expression here shows directly that equilibration of the population structure
occurs later than the transition in the growth rate. The delay between the two time
scales is determined by a balance between the two effects that dominate the population
structure under stress conditions [as in Eq. (2.6)], persisters taking over the population
by outlasting the normal cells and switching of persisters to the normal state.
The re-growth of a population after the removal of the antibiotic is also biphasic with an
initial slow-growth phase followed by a phase of rapid growth (Fig. 2.3). The transition
between the two phases can be analyzed in the same way. The transition time from the
slow-growing phase to fast growing phase is given by
Tg ≈1
∆gln
p0
n0(2.17)
and depends on the initial persister subpopulation. Therefore, a larger persister fraction
under stress conditions (e.g. due to longer exposure to the antibiotic) results in a delay
in resuming the maximum growth rate after the shift to conditions of unstressed growth.
As above, the steady state population ratio is reached at the later time T ′g, given by
T ′g ≈1
∆gln
(∆g
a
p0
n0
)= Tg +
1
∆gln
(∆g
a
). (2.18)
In both types of experiments, both times scales can be determined experimentally, but
Chapter 2. Population dynamics of bacterial persistence 36
Ts and Tg are much more easily accessible than T ′s and T ′g, as they only require mea-
surements of the total population size, e.g. by colony counting, while measuring T ′s
or T ′g requires to determine the time-dependent persister fraction. We note that the
transition time Tg or Ts are closely related to the ”delay times” defined in Ref. [68]. In
fact these delay times are obtained from Tg or Ts by further approximating ∆g ≈ µn
and ∆s ≈ µp. The underlying picture of Ref. [68] is that after an environmental shift,
the population growth (or decays) exponentially with a new growth rate after a delay
during which the population structure adjusts to the new environment. In contrast, our
analysis indicates that the new steady state of the population structure is reached later
than the macroscopically observable delay or transition time.
If the subpopulation ratio has reached the steady state before the shift from one envi-
ronmental condition to the other, the expressions for the time scales Ts and Tg can be
further simplified using Eqs. (2.15) and (2.17). As a result the transition times of total
population growth or decay can be expressed in terms of the switching rates as
Ts ≈1
∆sln
∆g
aand Tg ≈
1
∆gln
∆s
b. (2.19)
With the exception of the switching rates a and b, all quantities entering these equations
are directly accessible though the time-dependence of the total population size (as shown
in Figs. 2.2 and 2.3) and discussed below in more detail). Thus, the phenotype switching
rates can be determined from time courses of the total population size in a set of two
shift experiments: (i) a sufficiently long period of of unstressed growth long followed
by stress (addition of the antibiotic) and (ii) a sufficiently long stress period followed
by a growth period (via shift to medium without the antibiotic). Then, the switching
rates a and b can be calculated from the parameters of the growth (or decay) curves by
inverting the two equations above,
b ≈ ∆s e−∆g Tg and a ≈ ∆g e
−∆s Ts . (2.20)
2.4.2 Time-dependent growth rates
The numerical integration of the population dynamics as plotted in Figs. 2.2 and 2.3
show that the growth of normal subpopulation under unstressed growth conditions is
exponential with growth rate approximately given by (µgn − a), as obtained from our
approximation for small switching rates above. By contrast, the growth of the persis-
ter subpopulation is biphasic and can be characterized by a time-dependent effective
growth rate p(t)/p(t). Note that this effective growth rate describes the overall growth
Chapter 2. Population dynamics of bacterial persistence 37
of the persister subpopulation and includes the effects of persister proliferation and of
phenotype switching.
Alternatively, it can be characterized by the average of that effective growth rate up to
time t,
〈µgp〉 =1
t
∫ t0+t
t0
p(τ)
p(τ)dτ. (2.21)
The latter quantity has the disadvantage to depend on a somewhat arbitrary initial time
t0, but can easily be determined experimentally from the overall increase of the persister
subpopulation. The growth rate can be calculated from Eqs. (2.1) by substituting n(t) =
p(t)f(t), where f(t) is the time-dependent subpopulation ratio that we have already
calculated in Eq. (2.11). Therefore, the average growth rate of the normal (n) and
persister (p) subpopulation over a growth period tg is
〈µgn〉 = (µgn − a)
〈µsp〉 = (µgn − a) +1
tglnaf0 + (∆g − af0)e−∆g tg
∆g. (2.22)
Likewise, the average growth rate for the normal (n) and persister (p) subpopulation
over a stress period ts is given by
〈µsp〉 = (µsp − b)
〈µsn〉 = (µsp − b) +1
tslnbφ0 + (∆s − bφ0)e−∆s ts
∆s. (2.23)
Note that in both cases the effective growth rates growth rate of both subpopulation
approach the same value for large times ts or tg.
2.4.3 Growth of the total population
Explicit expression for the effective growth rate and the time evolution of the total
population can also be computed using the the results of analytical approach. The time
evolution equation of total population P (t) = n+ p under unstressed growth conditions
can be expressed in terms of subpopulation ratio f(t) as
d
dtP =
(µn + (µp − µn)
1
1 + f(t)
)P. (2.24)
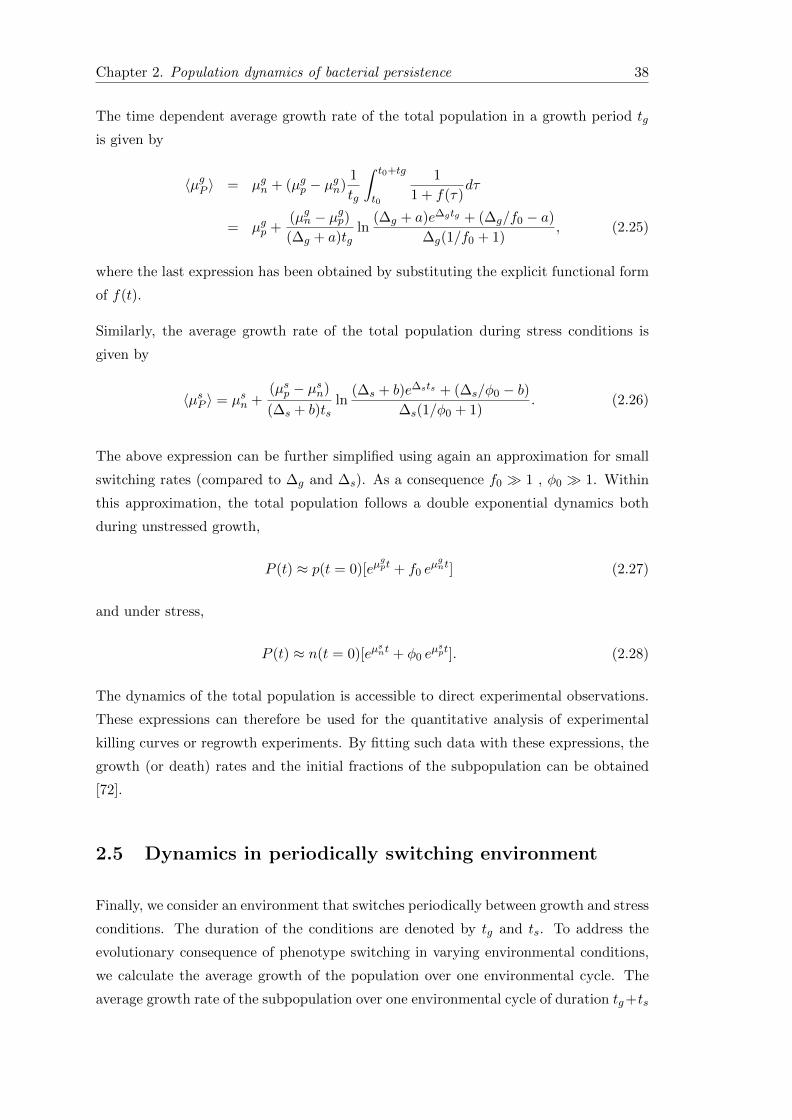
Chapter 2. Population dynamics of bacterial persistence 38
The time dependent average growth rate of the total population in a growth period tg
is given by
〈µgP 〉 = µgn + (µgp − µgn)1
tg
∫ t0+tg
t0
1
1 + f(τ)dτ
= µgp +(µgn − µgp)(∆g + a)tg
ln(∆g + a)e∆gtg + (∆g/f0 − a)
∆g(1/f0 + 1), (2.25)
where the last expression has been obtained by substituting the explicit functional form
of f(t).
Similarly, the average growth rate of the total population during stress conditions is
given by
〈µsP 〉 = µsn +(µsp − µsn)
(∆s + b)tsln
(∆s + b)e∆sts + (∆s/φ0 − b)∆s(1/φ0 + 1)
. (2.26)
The above expression can be further simplified using again an approximation for small
switching rates (compared to ∆g and ∆s). As a consequence f0 � 1 , φ0 � 1. Within
this approximation, the total population follows a double exponential dynamics both
during unstressed growth,
P (t) ≈ p(t = 0)[eµgpt + f0 e
µgnt] (2.27)
and under stress,
P (t) ≈ n(t = 0)[eµsnt + φ0 e
µspt]. (2.28)
The dynamics of the total population is accessible to direct experimental observations.
These expressions can therefore be used for the quantitative analysis of experimental
killing curves or regrowth experiments. By fitting such data with these expressions, the
growth (or death) rates and the initial fractions of the subpopulation can be obtained
[72].
2.5 Dynamics in periodically switching environment
Finally, we consider an environment that switches periodically between growth and stress
conditions. The duration of the conditions are denoted by tg and ts. To address the
evolutionary consequence of phenotype switching in varying environmental conditions,
we calculate the average growth of the population over one environmental cycle. The
average growth rate of the subpopulation over one environmental cycle of duration tg+ts
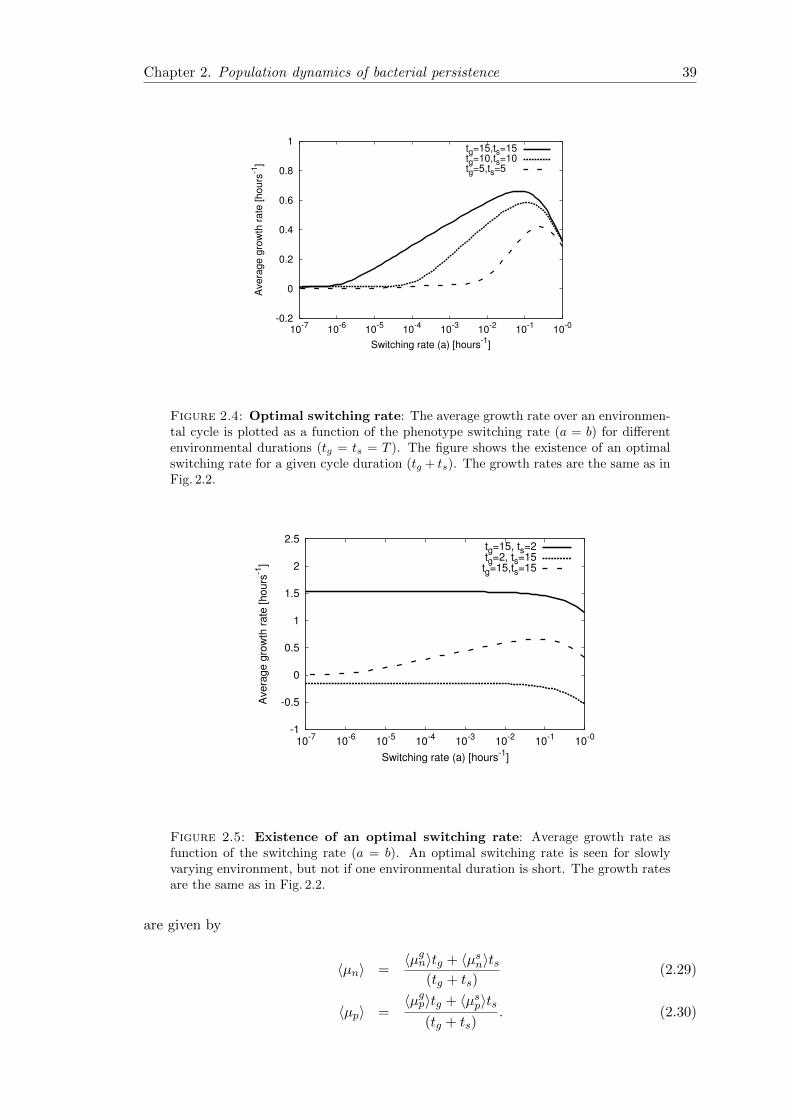
Chapter 2. Population dynamics of bacterial persistence 39
-0.2
0
0.2
0.4
0.6
0.8
1
10-010-110-210-310-410-510-610-7
Ave
rage
gro
wth
rat
e [h
ours
-1]
Switching rate (a) [hours-1]
tg=15,ts=15tg=10,ts=10tg=5,ts=5
Figure 2.4: Optimal switching rate: The average growth rate over an environmen-tal cycle is plotted as a function of the phenotype switching rate (a = b) for differentenvironmental durations (tg = ts = T ). The figure shows the existence of an optimalswitching rate for a given cycle duration (tg + ts). The growth rates are the same as inFig. 2.2.
-1
-0.5
0
0.5
1
1.5
2
2.5
10-010-110-210-310-410-510-610-7
Ave
rage
gro
wth
rat
e [h
ours
-1]
Switching rate (a) [hours-1]
tg=15, ts=2tg=2, ts=15tg=15,ts=15
Figure 2.5: Existence of an optimal switching rate: Average growth rate asfunction of the switching rate (a = b). An optimal switching rate is seen for slowlyvarying environment, but not if one environmental duration is short. The growth ratesare the same as in Fig. 2.2.
are given by
〈µn〉 =〈µgn〉tg + 〈µsn〉ts
(tg + ts)(2.29)
〈µp〉 =〈µgp〉tg + 〈µsp〉ts
(tg + ts). (2.30)
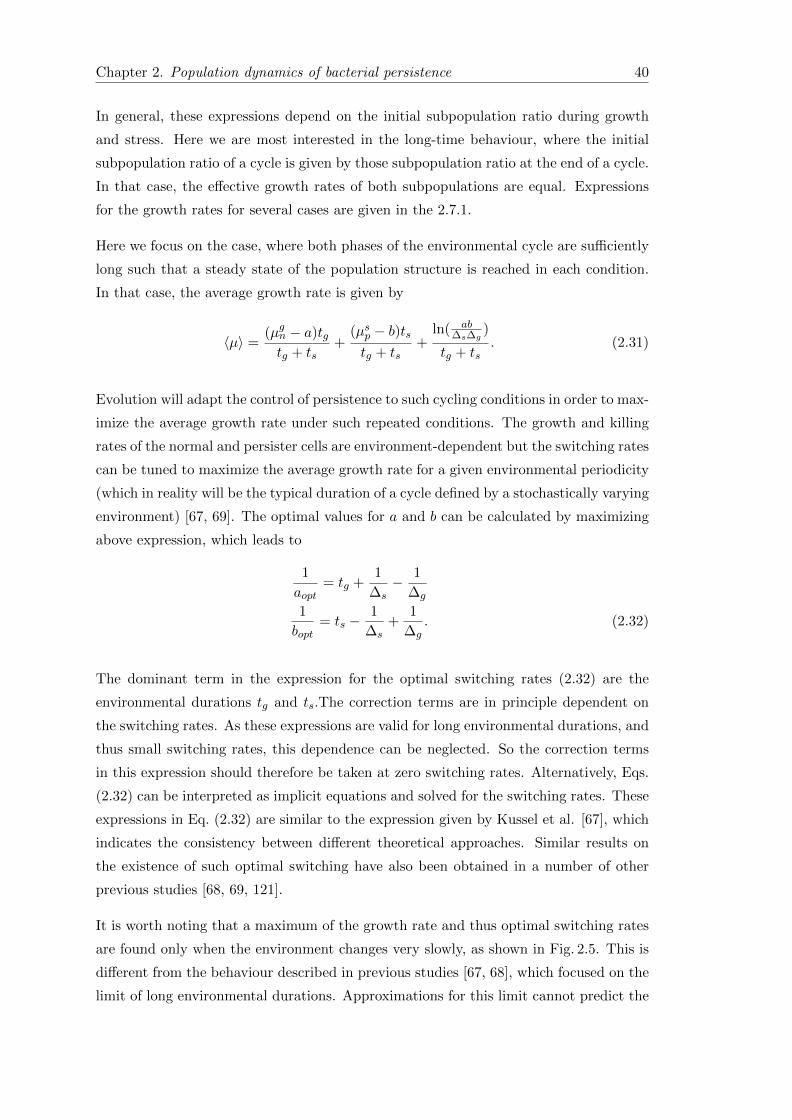
Chapter 2. Population dynamics of bacterial persistence 40
In general, these expressions depend on the initial subpopulation ratio during growth
and stress. Here we are most interested in the long-time behaviour, where the initial
subpopulation ratio of a cycle is given by those subpopulation ratio at the end of a cycle.
In that case, the effective growth rates of both subpopulations are equal. Expressions
for the growth rates for several cases are given in the 2.7.1.
Here we focus on the case, where both phases of the environmental cycle are sufficiently
long such that a steady state of the population structure is reached in each condition.
In that case, the average growth rate is given by
〈µ〉 =(µgn − a)tgtg + ts
+(µsp − b)tstg + ts
+ln( ab
∆s∆g)
tg + ts. (2.31)
Evolution will adapt the control of persistence to such cycling conditions in order to max-
imize the average growth rate under such repeated conditions. The growth and killing
rates of the normal and persister cells are environment-dependent but the switching rates
can be tuned to maximize the average growth rate for a given environmental periodicity
(which in reality will be the typical duration of a cycle defined by a stochastically varying
environment) [67, 69]. The optimal values for a and b can be calculated by maximizing
above expression, which leads to
1
aopt= tg +
1
∆s− 1
∆g
1
bopt= ts −
1
∆s+
1
∆g. (2.32)
The dominant term in the expression for the optimal switching rates (2.32) are the
environmental durations tg and ts.The correction terms are in principle dependent on
the switching rates. As these expressions are valid for long environmental durations, and
thus small switching rates, this dependence can be neglected. So the correction terms
in this expression should therefore be taken at zero switching rates. Alternatively, Eqs.
(2.32) can be interpreted as implicit equations and solved for the switching rates. These
expressions in Eq. (2.32) are similar to the expression given by Kussel et al. [67], which
indicates the consistency between different theoretical approaches. Similar results on
the existence of such optimal switching have also been obtained in a number of other
previous studies [68, 69, 121].
It is worth noting that a maximum of the growth rate and thus optimal switching rates
are found only when the environment changes very slowly, as shown in Fig. 2.5. This is
different from the behaviour described in previous studies [67, 68], which focused on the
limit of long environmental durations. Approximations for this limit cannot predict the
Chapter 2. Population dynamics of bacterial persistence 41
growth rates for cases, where one of the environmental durations is short (e.g., for very
brief exposures to antibiotics). Within our approximation this case can be addressed.
We find that if one of the environmental duration is short, the growth rate decreases
with the increasing phenotype switching rate, which suggests that phenotype switching
is unprofitable under such conditions (see the expressions for cases 2 and 3 given in the
2.7.1).
In our analysis, we have focused on exponentially growing cells, but as mentioned al-
ready, in natural environments, growth is usually limited by the carrying capacity of the
environment, so we want to briefly mention how the dynamics is affected by such carry-
ing capacity. We have shown above that, under constant conditions promoting growth,
the total population will eventually reach the carrying capacity and that in this steady
state the subpopulation ratio is determined by the phenotype switching rates, p/n = b/a.
In stress conditions, the dynamics is unaffected by the environmental carrying capacity.
The dynamics in periodically switching environments depends on whether the average
growth rate (in the absence of a carrying capacity) is positive or negative. In the case
of net decay, our analysis remains valid, as the carrying capacity is irrelevant. But if
there is net growth per environmental cycle, the population will eventually grow to the
carrying capacity during a growth period. From then on, the population will oscillate
between decaying away from the maximal population size during the stress period and
growing back to it in the growth period. The long term growth rate is zero in this case.
2.6 Concluding remarks
One way bacterial population cope with environmental stresses is by setting aside a small
fraction of the total population, the persister cells, in a slow-growing, but stress-tolerant
phenotypic state. These persisters provide a pool of cells from which the population
can recover via a phenotypic switch to the normal growth state after the environmental
conditions have improved. Here we have analyzed a simple mathematical model to un-
derstand the dynamics of phenotype switching. Typically, the fitness cost associated with
the switching of few normal cells to the persister phenotype under growth-permissible
conditions is small compared to the fitness benefit of the presence of persister cells un-
der stress conditions. We have used an approximation valid for small switching rates
that allows us to obtain explicit analytical expression for many quantities that are di-
rectly accessible to experiments. Within this approximation, the population dynamics
is mapped to a logistic equation for the ratio of the population fractions corresponding
to the two phenotypes. For constant environmental conditions, stable coexistence of
the two subpopulations that grow with different growth rates is achieved by a balance
Chapter 2. Population dynamics of bacterial persistence 42
between fast-growing cells outgrowing the slow-growing ones and phenotype switching,
by which the slow-growing subpopulation is replenished.
We have then considered shifts between environmental conditions as well as periodically
switching environments. Specifically, we have identified several characteristic time scales
for changes in the overall population growth or decay and for the approach to a constant
ratio between the two subpopulations. Simple analytical expressions for these time scales
provide a window into the phenotype switching process and more specifically allow
to determine the switching rates from population-scale shift experiments [72], which
are typically governed by double-exponential population growth or decay. Finally, we
determined the average growth rates for a periodically switching environment. If growth
and stress periods have long durations, the phenotype switching rates can be tuned for
optimal growth of the total population.
The results derived are based on the assumption that phenotype switching is a stochas-
tic process, independent of the environment. This assumption may not always be valid,
as in some cases, persistence may also involve an adaptive response to the stress condi-
tions. One case, where this has been demonstrated is persistence of E. coli cells upon
treatment with the antibiotic Ciprofloxacin, where persistence is actively induced via the
SOS response [21, 22]. Analysis of such cases with our model would lead to condition-
dependent apparent switching rates. In such cases, the model may be used as a ’null
model’ to identify deviations from the simple dynamics discussed here.
Finally, we want to emphasize that the analysis we have developed here, can also be ap-
plied to other cases of ’growth bistability’, i.e. cases of phenotypic heterogeneity, where
genetically identical subpopulations grow with different growth rates. One interesting
case is bacterial competence, a program for genetic transformation (quasi-sexual ex-
change of genetic material), which is typically activated in only a subpoulation [25]. In
this case, it has been proposed that phenotypic heterogeneity provides a evolutionary
advantage in a homogeneous environment [134]. Recent studies of growth effects on var-
ious genetic circuits suggest that growth bistability may be a rather generic consequence
of the coupling of gene expression and cell growth [59, 60, 109, 119].
2.7 Supporting information
2.7.1 Average growth rate in periodic environmental conditions
In this appendix, we give expression for the average growth rate of the total population
for several different cases beyond the case of slow environmental variation discussed in
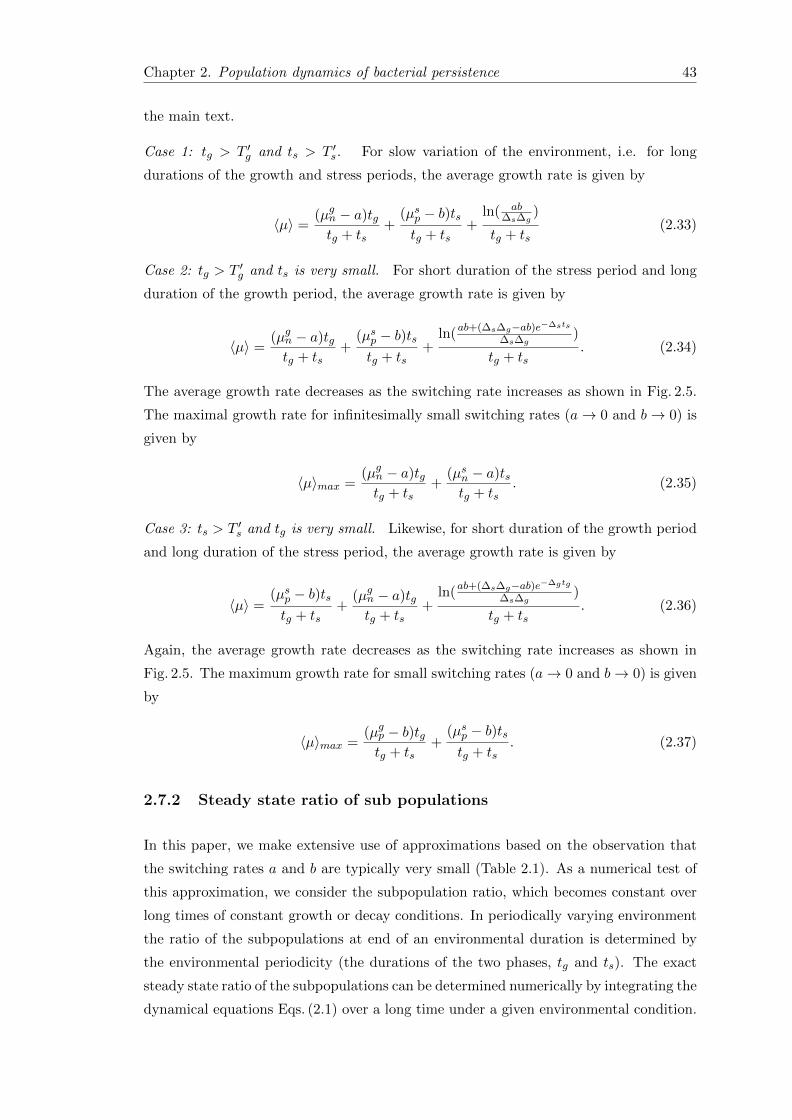
Chapter 2. Population dynamics of bacterial persistence 43
the main text.
Case 1: tg > T ′g and ts > T ′s. For slow variation of the environment, i.e. for long
durations of the growth and stress periods, the average growth rate is given by
〈µ〉 =(µgn − a)tgtg + ts
+(µsp − b)tstg + ts
+ln( ab
∆s∆g)
tg + ts(2.33)
Case 2: tg > T ′g and ts is very small. For short duration of the stress period and long
duration of the growth period, the average growth rate is given by
〈µ〉 =(µgn − a)tgtg + ts
+(µsp − b)tstg + ts
+ln(
ab+(∆s∆g−ab)e−∆sts
∆s∆g)
tg + ts. (2.34)
The average growth rate decreases as the switching rate increases as shown in Fig. 2.5.
The maximal growth rate for infinitesimally small switching rates (a→ 0 and b→ 0) is
given by
〈µ〉max =(µgn − a)tgtg + ts
+(µsn − a)tstg + ts
. (2.35)
Case 3: ts > T ′s and tg is very small. Likewise, for short duration of the growth period
and long duration of the stress period, the average growth rate is given by
〈µ〉 =(µsp − b)tstg + ts
+(µgn − a)tgtg + ts
+ln(
ab+(∆s∆g−ab)e−∆gtg
∆s∆g)
tg + ts. (2.36)
Again, the average growth rate decreases as the switching rate increases as shown in
Fig. 2.5. The maximum growth rate for small switching rates (a→ 0 and b→ 0) is given
by
〈µ〉max =(µgp − b)tgtg + ts
+(µsp − b)tstg + ts
. (2.37)
2.7.2 Steady state ratio of sub populations
In this paper, we make extensive use of approximations based on the observation that
the switching rates a and b are typically very small (Table 2.1). As a numerical test of
this approximation, we consider the subpopulation ratio, which becomes constant over
long times of constant growth or decay conditions. In periodically varying environment
the ratio of the subpopulations at end of an environmental duration is determined by
the environmental periodicity (the durations of the two phases, tg and ts). The exact
steady state ratio of the subpopulations can be determined numerically by integrating the
dynamical equations Eqs. (2.1) over a long time under a given environmental condition.
Chapter 2. Population dynamics of bacterial persistence 44
0
500
1000
1500
2000
2500
0 2 4 6 8 10 12 14
Φ(t
g,t s
)
Period duration (T) [hours]
NumericalTheory
Figure 2.6: Comparison of the approximation for small switching rates withthe exact numerical result: Steady-state ratio of the normal to the persister sub-population at the end of an environmental cycle (T = tg = ts). The parameters are thesame as in Fig. 2.2
Here, we compare the value of the subpopulation ratio φ(tg, ts) at the end of a stress
phase as obtained from our analytical approximation with the corresponding numerical
result. The analytical result is obtained by iterating the following recursion
f(tg, ts) =∆g
a+ [∆sφ(tg, ts)− a] e−∆gtg
φ(tg, ts) =∆s
b+ [∆gf(tg, ts)− b] e−∆sts. (2.38)
The comparison between the numerical and analytical results are plotted in Fig. 2.6,
which shows good agreement between the two methods.
Chapter 3
Phenotypically heterogeneous
populations in spatially
heterogeneous environments
A version of this chapter is submitted to Physical Review Letters as: P. Patra and S.
Klumpp, Phenotypically heterogeneous populations in spatially heterogeneous environ-
ments (2013).
45
Chapter 3. Phenotypically heterogeneous populations in spatially heterogeneousenvironments 46
Abstract
The spatial expansion of a population in a non-uniform environment may benefit from
phenotypic heterogeneity with interconverting subpopulations using different survival
strategies. We analyze the crossing of an antibiotic-containing environment by a bacte-
rial population consisting of rapidly growing normal cells and slow-growing, but antibiotic-
tolerant persister cells. The dynamics of crossing is characterized by mean first arrival
times and is found to be surprisingly complex. It displays three distinct regimes with
different scaling behavior that can be understood based on an analytical approximation.
Our results suggest that a phenotypically heterogeneous population has a fitness ad-
vantage in non-uniform environments and can spread more rapidly than a homogeneous
population.
Chapter 3. Phenotypically heterogeneous populations in spatially heterogeneousenvironments 47
3.1 Introduction
The development of populations of cells or organisms depends not only on these organ-
isms themselves, but also on their interactions with competing populations and with their
environment. Specifically, the spatial structure of the environment can play an impor-
tant role, for example by separating populations or providing barriers to the spreading
of a species [14, 123]. Recently, experimental techniques such as microfluidic habitats
[56, 137] and range expansion of microbial populations on plates [38, 41, 64] and com-
plex interactions between multiple species [104] have been used to study the influence of
spatial structures in a quantitative fashion using microbes (bacteria or yeast) as model
organisms. For example, it has been shown that spatial heterogeneity (different drug
concentrations in different organs or concentration gradients for locally administered
drugs [6, 12, 92]) can both speed up and slow down the emergence of antibiotic resis-
tance in bacteria [35, 42, 43, 52].
Another aspect of microbial survival under stressful conditions is phenotypic hetero-
geneity [19, 113], i.e. different behaviors (e.g. normal growth, sporulation, competence,
persistence) exhibited by genetically identical cells under identical conditions, a feature
usually attributed to multistability in the underlying genetic circuitry. A prime example
of phenotypic heterogeneity is bacterial persistence, phenotypic tolerance to antibiotics
[4, 19, 71, 72, 75]. A subpopulation of cells is tolerant against antibiotics or other stresses
and allows prolonged survival of the population under such conditions. The cells switch
stochastically between the normal and the persistent phenotype, thus after the stress
is removed, the population can grow back from the surviving persisters (in contrast to
resistant mutants, the re-grown population remains susceptible to the antibiotic). Per-
sistence has thus been characterized as a bet-hedging strategy, optimal for survival in
fluctuating environments [67–69].
In this letter, we address a related problem, namely the role of persisters in the spatial
expansion of a bacterial population. The basic idea is that just as persisters allow
a population to live through times of stress, they also allow the population to cross
regions in space in which the conditions are stressful. Specifically, we consider the
case of a population of bacteria expanding from a growth-sustaining environment into
another one that is separated from the first by an environment with a high antibiotic
concentration (Figure 3.1). We calculate the average time it takes for the cells to reach
the third environment and determine the conditions under which the presence of persister
cells is beneficial by speeding up the arrival. This dynamics is surprisingly complex
with several distinct regimes, which we identify by a combination of simulations and
an analytical theory. We conclude the paper with some remarks concerning possible
experiments and an analogy to the crossing of valleys in fitness landscapes.
Chapter 3. Phenotypically heterogeneous populations in spatially heterogeneousenvironments 48
Figure 3.1: Model for phenotype switching and migration in three connected microenvironments (patches): Bacteria switch between two phenotypic states, normal cells(ni) and persisters (pi) with rates a and b and migrate to a neighbouring patch withrate γ. While the first and third patch sustain growth of the population, the secondpatch contains antibiotics and does not allow for growth. Growth and death rates arephenotype dependent: persisters grow more slowly but survive longer in patch 2. Thered and blue arrows shows the two paths via which a cell can arrive in the third patch.
100101102103104105106
103 104 105 106
Pop
opul
atio
n
Time [hours]
(b)
a=b=0 hr-1
a=b=10-3 hr-1
0 2 4 6 8
10
103 104 105 106
No.
of A
rriv
als
Arrival Time [hours]
(a)
Figure 3.2: Population dynamics in the third patch with (red) and without (blue)phenotype switching: (a) Time dependent population size and (b) number of cells thathave arrived in the third patch. The rates are µn = 2 hr−1, µp = 0.2 hr−1, δn = 4hr−1, δp = 0.4 hr−1 as measured for E. coli cells [4] and γ = 3.2×10⁻⁵ hr−1 , K = 105.The thin lines are individual simulations and the thick lines are averages of severaltrajectories.
3.2 Model
We consider a population with two phenotypes (normal and persisters) in an environment
consisting of three connected patches (Figure 3.1). The numbers of normal cells and
persisters in patch i = 1, 2, 3 are denoted ni and pi. The first and third patch sustain
growth, described as logistic growth with rates µn and µp, respectively, and carrying
capacity K. The middle patch contains antibiotics, therefore cells migrating into this
patch are killed, with death rates, δn and δp, and δp < δn. Cells migrate between
Chapter 3. Phenotypically heterogeneous populations in spatially heterogeneousenvironments 49
the patches with rate γ, which we take to be independent of phenotype. Switching
between the phenotypes is described by rates a and b (normal to persister and vice
versa, respectively). These rates are taken to be independent of the environment.
Simulation results. We simulated this model and determined the time after which the
first cell crosses the antibiotic-containing environment and arrives in the third patch.
In a competitive situation [64], a population that arrives faster will obviously have a
fitness advantage compared to other populations. One may expect that the slowly dying
persister cells can cross a region of high antibiotic concentration more easily and hence
might speed up the population expansion in such a heterogeneous environment. Figure
3.2 shows results of simulations with realistic growth, death and switching rates that
start with a single normal cell in the first patch. Indeed, a population with persisters
(red) arrives faster in the third patch than a population without persisters (blue). One
also sees that on the time scale on which cells cross the antibiotic barrier, growth in the
third patch is very rapid, so it is fully populated by the offspring of the first arriving
cell.
For a systematic study, we next vary the migration rate γ. For simplicity, we assume for
the moment that only persisters arrive in the third patch (δp � δn). Surprisingly, the
dependence of the mean first arrival time (MFAT) on γ is quite complex (Figure 3a).
For small γ, the MFAT decreases as 1/γ2, as one might guess, because two migration
steps are required to reach the third patch; but for intermediate and large γ, it scales
as 1/γ and 1/γ1/2, respectively. In the following, we use an analytical approximation to
obtain a better understanding of these observations.
3.3 Growth dynamics in the first patch.
Typically growth in the first patch will be rapid compared to phenotype switching [4]
and migration [43]. Therefore, the population in the first patch can be described by the
steady state of the deterministic equations,
n1 = µn
(1− n1 + p1
K
)n1 − an1 + bp1 − γ(n1 − n2)
p1 = µp
(1− n1 + p1
K
)p1 + an1 − bp1 − γ(p1 − p2). (3.1)
The steady state can be solved exactly [98], but here two limiting cases are sufficient. If
migration is slow compared to phenotype switching (γ � a, b), the total population in
the first patch is given by the carrying capacityK and the subpopulations are determined
Chapter 3. Phenotypically heterogeneous populations in spatially heterogeneousenvironments 50
by a balance of phenotype switching,
n1 ≈ Kb
a+ b, p1 ≈ K
a
a+ b. (3.2)
For fast migration (γ � a, b), expansion of the exact result leads to
n1 ≈ K, p1 ≈ Kaµn
(µn − µp)γ. (3.3)
In this case, the balance of processes increasing and decreasing the population is different.
Cells of both phenotypes are lost by emigration. Because normal cells grow more rapidly,
the emigrants are quickly replaced by normal cells, while the persister population is
replenished by ”one-way” phenotype switching (with rate a) from the normal cells. This
situation is reminiscent of the population balance in an exponentially growing population
[97].
3.4 Migration through the second patch
Next, we consider the dynamics of the number m (= n2 or p2) of cells in the second patch.
This number is typically small, so a stochastic description is necessary. To this end, we
neglect phenotype switching in the second patch, so we can consider the migration of
normal cells and persisters separately (we therefore drop the indices p and n in that
calculation). The MFAT of a cell in the third patch can be calculated by adapting
a method that was used recently for the related problem of mutation and migration
[42, 43]. We define Pm as the probability that at time t no cell has yet migrated to the
third patch and there are m cells in the second. The master equation for this probability
is given by
dPmdt
= −(λ+ δ′m+ γm)Pm + λPm−1 + δ′(m+ 1)Pm+1 (3.4)
with initial condition P0(t = 0) = 1. Here λ = Nγ is the rate of immigration from
the first patch (with population size N , assumed to be constant and specified below),
δ′ = δ + γ is an effective death rate, into which we have absorbed backward migration.
The master equation can be solved [98] via the moment generating function G(s, t) =∑∞0 smPm(t), which is obtained as
G(s, t) = exp
[λ
δ′ + γ
(s− δ′
δ′ + γ
)(1− e−(δ′+γ)t
)]× exp
(− λγ
δ′ + γt
). (3.5)
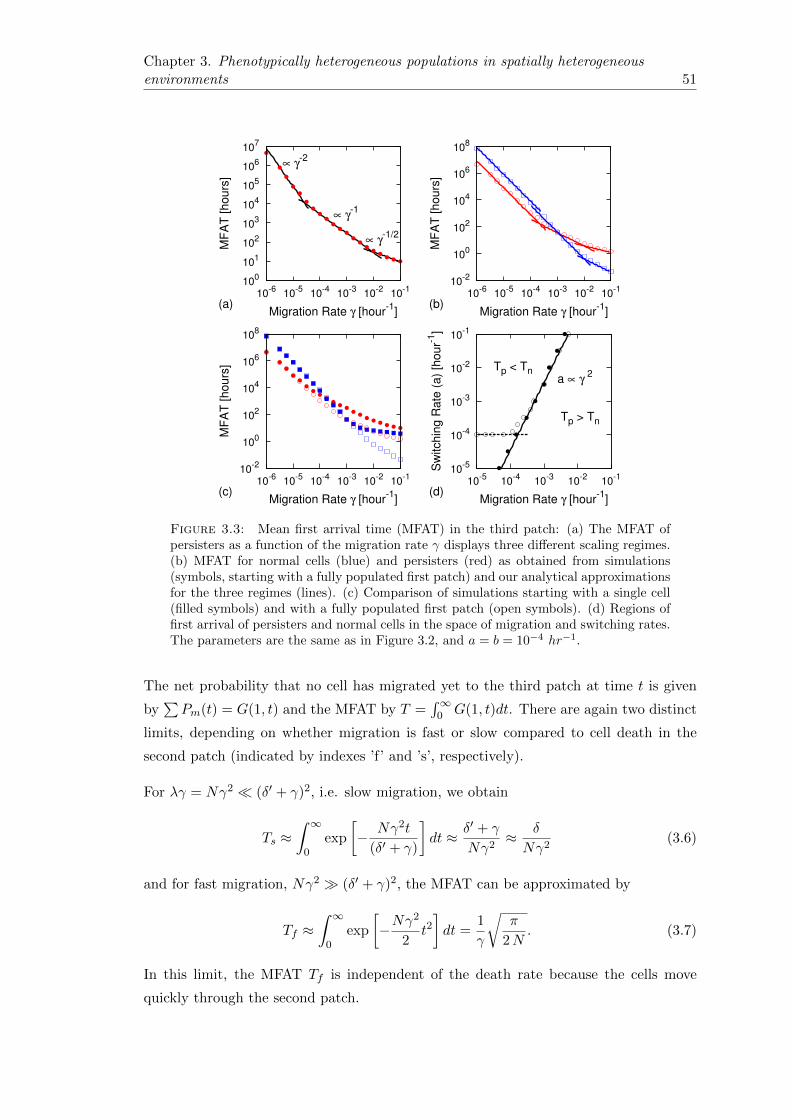
Chapter 3. Phenotypically heterogeneous populations in spatially heterogeneousenvironments 51
100
101
102
103
104
105
106
107
10-110-210-310-410-510-6
MF
AT
[hou
rs]
Migration Rate γ [hour-1](a)
∝ γ-1/2
∝ γ-1
∝ γ-2
10-2
100
102
104
106
108
10-110-210-310-410-510-6
MF
AT
[hou
rs]
Migration Rate γ [hour-1](b)
10-2
100
102
104
106
108
10-110-210-310-410-510-6
MF
AT
[hou
rs]
Migration Rate γ [hour-1](c)
10-1
10-2
10-3
10-4
10-5
10-110-210-310-410-5
Sw
itchi
ng R
ate
(a)
[hou
r-1]
Migration Rate γ [hour-1](d)
Tp < Tn
Tp > Tn
a ∝ γ 2
Figure 3.3: Mean first arrival time (MFAT) in the third patch: (a) The MFAT ofpersisters as a function of the migration rate γ displays three different scaling regimes.(b) MFAT for normal cells (blue) and persisters (red) as obtained from simulations(symbols, starting with a fully populated first patch) and our analytical approximationsfor the three regimes (lines). (c) Comparison of simulations starting with a single cell(filled symbols) and with a fully populated first patch (open symbols). (d) Regions offirst arrival of persisters and normal cells in the space of migration and switching rates.The parameters are the same as in Figure 3.2, and a = b = 10−4 hr−1.
The net probability that no cell has migrated yet to the third patch at time t is given
by∑Pm(t) = G(1, t) and the MFAT by T =
∫∞0 G(1, t)dt. There are again two distinct
limits, depending on whether migration is fast or slow compared to cell death in the
second patch (indicated by indexes ’f’ and ’s’, respectively).
For λγ = Nγ2 � (δ′ + γ)2, i.e. slow migration, we obtain
Ts ≈∫ ∞
0exp
[− Nγ2t
(δ′ + γ)
]dt ≈ δ′ + γ
Nγ2≈ δ
Nγ2(3.6)
and for fast migration, Nγ2 � (δ′ + γ)2, the MFAT can be approximated by
Tf ≈∫ ∞
0exp
[−Nγ
2
2t2]dt =
1
γ
√π
2N. (3.7)
In this limit, the MFAT Tf is independent of the death rate because the cells move
quickly through the second patch.
Chapter 3. Phenotypically heterogeneous populations in spatially heterogeneousenvironments 52
MFAT of Persister cells. The MFAT for persisters and normal cells can now be obtained
by combining, Eqs. (3.7) and (3.6) with the population sizes in the first patch given by
Eqs. (3.2) and (3.3). We first consider again the case that only persisters can reach the
third patch (δn very large). The three regimes seen in Figure 3.3(a) can now be under-
stood as reflecting the three different time scales for phenotype switching, migration,
and cell death: In the first regime (T1), migration is the slowest process, slower than
phenotype switching and cell death, γ � a, b � δp, so the population size is given by
N = p1 with p1 from Eq. (3.2) and the MFAT by Eq. (3.6). A second regime (T2) is
obtained when migration is rapid compared to phenotype switching, but slow compared
to cell death, a, b � γ � δp. In this case, Ts from Eq. (3.6) is combined with the
persister population size from Eq. (3.3). In the third regime (T3), migration is rapid
compared to both switching and cell death 1. We thus obtain
Tp,1 ≈(a+ b)δpaKγ2
, Tp,2 ≈(µn − µp)δpaµnKγ
and
Tp,3 ≈
√π(µn − µp)2Kaµnγ
(3.8)
corresponding to the three scaling regimes discussed above.
MFAT of normal cells and of the total population. In general, the death rate δn of
normal cells is finite, and therefore normal cells also have a chance to reach the third
patch. We thus repeat the analysis using the population size expressions for normal cells.
Here, the first and second regime both display the same 1/γ2 scaling, but with different
prefactors, Tn,1 ≈ (a + b)δn/(bKγ2) and Tn,2 ≈ δn/(Kγ
2). In the third regime, our
approximation leads to Tn,3 ≈ γ−1√π/2K. Our analytical expressions for both normal
cells and persisters are in quantitative agreement with the simulation results if we start
our simulations with a fully populated first patch (Figure 3b). If we start simulations
with a single cell in patch 1 as above and if γ is large, the first arrival to the third patch
can happen before the steady state in the first patch is reached. Thus the MFAT in
the third regime is longer than in simulations starting with a fully populated first patch
(Figure 3c, open and filled symbols, respectively). In this case, the MFAT is limited by
the exponential growth and the γ−1 scaling in regime 3 is not seen 2.
The MFAT for the population as a whole is given by the MFAT of the subpopulation that
arrives first. In the rapid migration regime, the MFAT is independent of the death rate,
so the normal cells arrive faster due to their larger number. In this regime, there is no
benefit due to the presence of persisters. For slow migration, however, persisters arrive
first, and the MFAT for the whole population is given by Tp,1. Clearly, if persister cells
1In principle, a fourth regime with δp � a, b � γ is possible, but measured parameter values [4, 71]indicate a, b < δp.
2The MFAT for persisters displays the same scaling with γ, but with a larger prefactor [98].
Chapter 3. Phenotypically heterogeneous populations in spatially heterogeneousenvironments 53
arrive faster than normal cells, the phenotypic splitting of the population is a beneficial
strategy. In this regime, the ratio of the arrival times of persisters and normal cells is
Tp,1/Tn,1 = (δp/δn)×b/a. Compared to a population without persisters, the arrival time
is reduced f -fold with
f ≡ Tn,1(a = 0)
Tp,1≈ δnδp× a
a+ b. (3.9)
Thus the fold-reduction in the arrival time of the population by the presence of persisters
is given by the ratio of the death rates of the two subpopulations times the persister
fraction in a stationary-phase population. We note that while persister fractions are
typically very small in exponentially growing populations, they can reach up to 10–50%
in stationary phase [71].
Things are more complex in the middle regime, where the crossover between persister-
dominated migration and normal-cell dominated migration to the third patch is expected
to occur. Because of the different death rates, the two cell types enter this regime at
different values of γ, so several different crossover scenarios are possible. In Figure
3.3(d), we plot the regions in the parameter space (a, γ) in which persisters or normal
cells arrive first in the third patch, respectively. The boundary separating distinct region
is found to be given by a ∝ γ2 with the assumption that the two switching rates are
equal (a = b, filled symbols). Persisters are faster and thus beneficial to the population
for migration rate smaller than this limiting value. If we take b as constant and vary a
(open symbols), there is another limiting condition: For persisters to arrive more rapidly,
a/b must not be smaller than the ratio of the death rates δp/δn.
3.4.1 Dynamics with multiple antibiotic patches.
The competitive advantage of populations with persisters is further enhanced if there
are multiple antibiotic patches in between two growth sustaining patches (Figure 4). In
the case of M antibiotic-containing patches, the MFAT to patch (1 + M + 1), which
supports growth, can be estimated as
TN (M) ≈ δ′
γ2
M∑1
1
Nj≈ δ′
N1γ2
(δ′/γ)M − 1
(δ′/γ)− 1, (3.10)
where Nj (= pj , nj) is the average population (= N(j−1)γ/δ′, for slow migration) in the
jth patch and δ′ is the effective death rate in the antibiotic patches.
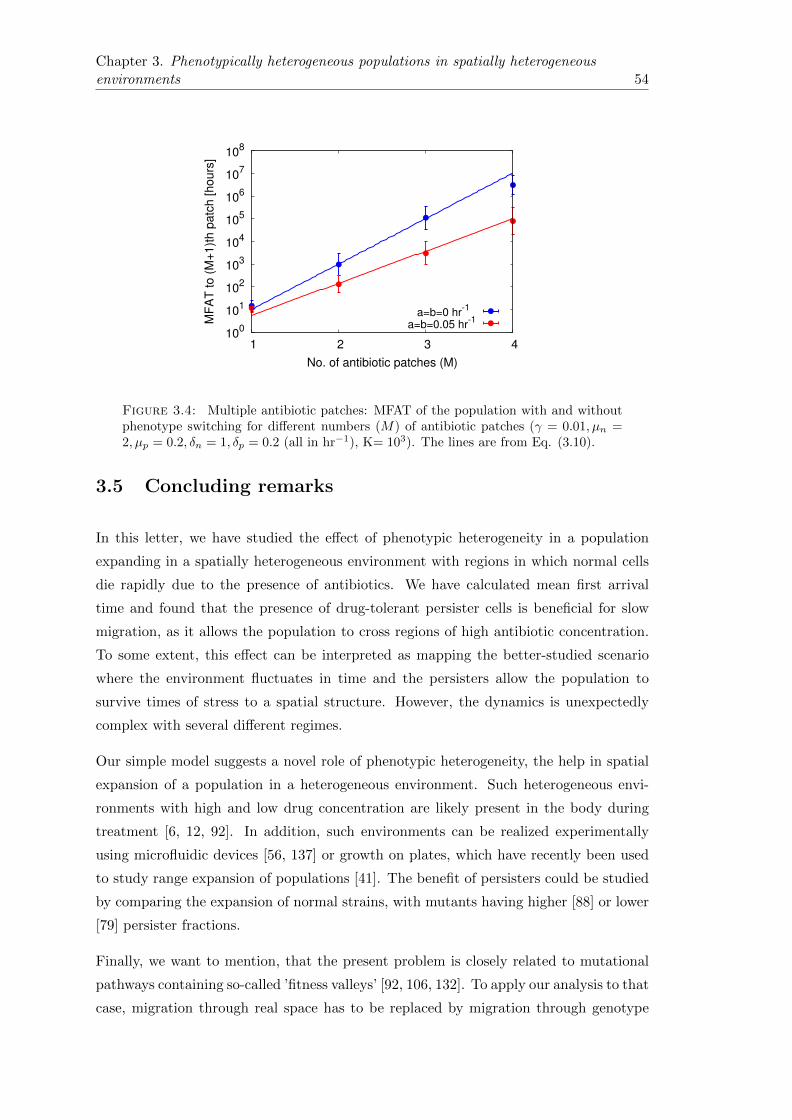
Chapter 3. Phenotypically heterogeneous populations in spatially heterogeneousenvironments 54
100
101
102
103
104
105
106
107
108
1 2 3 4
MF
AT
to (
M+
1)th
pat
ch [h
ours
]
No. of antibiotic patches (M)
a=b=0 hr-1 a=b=0.05 hr-1
Figure 3.4: Multiple antibiotic patches: MFAT of the population with and withoutphenotype switching for different numbers (M) of antibiotic patches (γ = 0.01, µn =2, µp = 0.2, δn = 1, δp = 0.2 (all in hr−1), K= 103). The lines are from Eq. (3.10).
3.5 Concluding remarks
In this letter, we have studied the effect of phenotypic heterogeneity in a population
expanding in a spatially heterogeneous environment with regions in which normal cells
die rapidly due to the presence of antibiotics. We have calculated mean first arrival
time and found that the presence of drug-tolerant persister cells is beneficial for slow
migration, as it allows the population to cross regions of high antibiotic concentration.
To some extent, this effect can be interpreted as mapping the better-studied scenario
where the environment fluctuates in time and the persisters allow the population to
survive times of stress to a spatial structure. However, the dynamics is unexpectedly
complex with several different regimes.
Our simple model suggests a novel role of phenotypic heterogeneity, the help in spatial
expansion of a population in a heterogeneous environment. Such heterogeneous envi-
ronments with high and low drug concentration are likely present in the body during
treatment [6, 12, 92]. In addition, such environments can be realized experimentally
using microfluidic devices [56, 137] or growth on plates, which have recently been used
to study range expansion of populations [41]. The benefit of persisters could be studied
by comparing the expansion of normal strains, with mutants having higher [88] or lower
[79] persister fractions.
Finally, we want to mention, that the present problem is closely related to mutational
pathways containing so-called ’fitness valleys’ [92, 106, 132]. To apply our analysis to that
case, migration through real space has to be replaced by migration through genotype
Chapter 3. Phenotypically heterogeneous populations in spatially heterogeneousenvironments 55
space, and γ is interpreted as the mutation rate. The case studied here corresponds
to one in which a single mutation leads to lower fitness, but two mutations increase
fitness. In such scenario, a population with persister cells can thus more easily cross a
fitness valley, which otherwise would, for example, slow down the emergence of antibiotic
resistance [35].

Chapter 4
Interplay between Population
Dynamics and Drug Tolerance of
Staphylococcus aureus Persister
Cells
Copyright: c© 2013 S. Karger AG, Basel.
A version of this chapter is published as: S. Lechner, P. Patra, S. Klumpp, and R.
Bertram, Interplay between population dynamics and drug tolerance of Staphylococcus
aureus persister cells, J. Mol. Microbiol. Biotechnol. 22, 381-391 (2012).
Online version: http://dx.doi.org/10.1159/000346073
57
Chapter 4. Interplay between Population Dynamics and Drug Tolerance ofStaphylococcus aureus Persister Cells 58
Abstract
Population dynamics parameters of Staphylococcus aureus strain SA113 were quantified
based on growth and killing experiments with batch culture cells in rich medium. Eradi-
cation kinetics and the concomitant isolation of a subpopulation of drug-tolerant SA113
persisters upon treatment with super-minimal inhibitory concentrations of antibiotics
such as ciprofloxacin, daptomycin, and tobramycin served as a basis for mathematical
analyses. According to a two-state model for stochastic phenotype switching, levels of
persister cells and their eradication rates were influenced by the antibiotics used for
isolation, clearly indicating a heterogeneous pool of S. aureus persisters. Judging from
time-dependent experiments, the persisters’ degree of drug tolerance correlated with
the duration of antibiotic challenge. Moreover, cross-tolerance experiments with cells
consecutively treated with two different antibiotics revealed that multi-drug tolerance
is not a necessary trait of S. aureus persisters isolated by antibiotic challenge. In some
cases, the results depended on the order of the two antibiotic treatments, suggesting
that antibiotic tolerance may be achieved by a combination of preexisting persisters and
an adaptive response to drug exposure. Counts of live cells which had endured drug
treatment increased only after lag phases of at least 3 h after the shift to non-selective
conditions. Thus, this study provides quantitative insights into population dynamics of
S. aureus persisters with regard to antibiotic challenge.
Chapter 4. Interplay between Population Dynamics and Drug Tolerance ofStaphylococcus aureus Persister Cells 59
4.1 Introduction
Bacterial persister cells are dormant variants of regular cells that neither grow nor die
in the presence of bactericidal compounds. Since persisters make up a small fraction
within a culture dominated by isogenic sibling cells, the persister state is a paradigm of
bacterial phenotypic heterogeneity [19, 124]. Wiuff et al. [133] noted that a decrease in
the overall bacterial mortality of a culture upon antibiotic challenge could be attributed
to drug-tolerant persisters. Our present understanding of the heterogeneous response to
antibiotics within a genetically uniform population is predicated on studies addressing
persistence on two different levels of description. One type of studies asks for the regu-
latory network motifs that enable the coexistence of persistent and non-persistent cells.
Positive feedback loop-mediated bistability and threshold amplification of intracellular
regulatory noise were identified as critical for bacterial persistence [2]. Genes associated
with altered persister levels clearly point towards toxin- antitoxin systems as a prime
instance [15, 55, 79, 88, 110, 127]. On a population scale, a mathematical analysis de-
fined the important parameters that control the dynamics of the normal and persistent
subpopulations to calculate switching rates between the two phenotypes [33]. Two types
of persisters can be discriminated dependent on whether or not a triggering signal to
enter the dormant state is required [2, 4, 19, 33]. Whereas the level of type I persisters
increases at the onset of stationary growth phase, type II persisters appear to be formed
continuously, irrespective of environmental stimuli [4, 19, 32, 33, 67]. It seems that not
one single mechanism is responsible for persister formation, but instead, the activation of
different stress modules results in growth arrest, and various different genetic pathways
may converge towards persistence [1, 19]. The change between the dormant and the
growing state is a hallmark of persister cells [11, 33, 48]. In variable environments, phe-
notype switching provides a bet-hedging strategy that has been proposed to be superior
to sensing as an adaptive mechanism to ensure the population’s survival [67, 68]. The
exit of bacteria from dormancy may be triggered by extracellular compounds [26, 90] or
in a stochastic manner [11] and may be accompanied by specific lag-phases during the
resuscitation process [33, 48]. Although the persister state was described for staphy-
lococci more than 65 years ago [7], only few studies addressed persisters in this genus
so far [55, 87, 111, 112]. Keren et al.[55] conjectured that a stationary culture might
exclusively consist of persisters, whereas we found that the pool of stationary phase
Staphylococcus aureus cells represents a mixture of persisters and drug-susceptible cells
[71]. Upon aminoglycoside treatment, selection of persister and small colony variant
(SCV) cells, representing another and possibly related dormant form of bacteria, was
observed [133]. S. aureus SCVs frequently have genetically manifested defects in their
electron transport chain or auxotrophies for hemine, menadione, or thymine (reviewed
by [101]). Most SCVs are inherently tolerant to aminoglycosides [130], and are capable
Chapter 4. Interplay between Population Dynamics and Drug Tolerance ofStaphylococcus aureus Persister Cells 60
of switching between the normal and the small colony phenotype, even during the course
of an infection [82, 125]. Based on our previous work on the identification of conditions
for S. aureus persister isolation [71], the present study aims at providing parameters
of population dynamics for S. aureus cells grown in liquid culture and challenged by
antibiotics. We analyzed persisters that were isolated by treatment with various antibi-
otics for cross-tolerance and resuscitation dynamics. Growth, death and switching rates
of normal and persister cells were calculated, and subpopulation fractions of these cell
types were defined. Our results demonstrate that the choice of antimicrobial compounds
applied for isolating drug-tolerant S. aureus persisters is critical for the behavior of the
population. The observed dependence on the choice of antibiotics suggests that there
may be multiple types of persisters with complex patterns of cross-tolerance and that
the response of the population to antibiotic challenge may be due to a combination of
selection for preexisting persisters and an adaptive response.
4.2 Results and Discussion
To provide a basis for modeling of staphylococcal persister dynamics, we first revisited
key results described in our previous study on S. aureus persisters [71]. Therein, a
number of S. aureus strains and mutants had been challenged with various antibiotics
applied at different magnitudes of the minimal inhibitory concentration (MIC; 1-fold,
10-fold and 100-fold) at exponential or stationary growth phase, and bacterial killing
had been monitored over time.
4.2.1 Mathematical Analysis of Killing Curves Indicates the Existence
of Multiple S. aureus Persister Types
Antibiotic treatment experiments indicated a variety of dynamic behaviors of S. aureus
cells of an isogenic inoculum in a common batch culture reflected by different killing
kinetics. Eradication of exponential phase cells had frequently been biphasic, as ex-
pected in the presence of two different subpopulations, normal cells and persisters [71].
We here analyzed mathematically the killing dynamics observed with the antimicro-
bials tobramycin, which inhibits translation, ciprofloxacin, which corrupts the function
of topoisomerase, or daptomycin, which targets the cell envelope. A model for pheno-
type switching (defined by Eq. 4.1 in ‘Methods’) was applied that describes isolation of
preexisting persisters by these antibiotics. To that end, killing curves of different exper-
iments using strain SA113 were fitted with a double-exponential expression (Eq. 4.2) to
obtain killing rates of the two subpopulations and the initial fraction of persister cells (

Chapter 4. Interplay between Population Dynamics and Drug Tolerance ofStaphylococcus aureus Persister Cells 61
Figure 4.1: Fitting of killing curves. (a) Example of a measured killing curve (datapoints, for strain SA113 taken from exponential growth phase and treated with 100-foldMIC of tobramycin) and a double-exponential fit to it (solid line). Fits like this onewere performed for individual experiments and the resulting parameters averaged overrepeat experiments to obtain the parameters given in Table 4.1. (b) Initial persisterfractions (i.e. fraction of persisters present in the population at the time of addition ofthe drug) obtained from the fits based on values obtained with ciprofloxacin (100-foldMIC), tobramycin (100-fold MIC) and daptomycin [10-fold MIC; mean plus standarddeviation of log(p0/n0), see Table 4.1]. Differences were found to be significant betweenciprofloxacin and daptomycin ( ∗∗ p = 0.01) and ciprofloxacin and tobramycin( ∗p =0.045).
Table 4.1: Parameters obtained from the fitting of killing curves.
Antibiotic Conc. No. Death rate of Death rate of Fraction of Switchingin of normal cells persister cells persisters rate:n→p
MIC exp. µ(AB)n (h−1) µ
(AB)p (h−1) log10f0 a(h−1)
Ciprofloxacin 10 3 −6.96± 0.20 −0.55± 0.12 −3.22± 0.21 7.4× 10⁻⁴
100 6 −4.37± 1.62 −0.56± 0.20 −2.71± 0.71 2.4× 10⁻⁴
Rifampicin 10 3 −7.05± 2.47 −0.81± 0.36 −2.62± 1.13 2.9× 10⁻³
Tobramycin 10 3 −9.87± 1.66 −0.14± 0.08 −3.83± 0.26 1.9× 10⁻⁴
100 6 −13.65± 4.82 −0.32± 0.22 −3.65± 0.58 2.8× 10⁻⁴
Daptomycin 10 6 −9.31± 0.81 −0.55± 0.55 −4.44± 0.98 4.6× 10⁻⁵
Dapto/Ca2+ 1 3 −3.13± 2.18 +0.22± 0.68 −2.31± 0.31 6.0× 10⁻³
All values are for strain SA113, mean ± standard deviation from three(1) or six(2)experiments as indicated. Calculations are based upon results of Lechner et al. [71].
Table 4.1 ; Fig. 4.1 ). The switching rate from the normal phenotype to the persister
phenotype was estimated from the persister fraction. Not surprisingly, the death rates of
the two subpopulations depended on the type and concentration of the antibiotic used,
as also shown in other bacteria [54, 55, 79]. In addition, considerable variation between
the initial persister fractions (and thus the switching rates) was obtained from these
fits, which argues against a single preexisting persister subpopulation isolated by the
antibiotics, also in agreement with previous reports [1, 133]. In many cases however, the
difference between persister levels observed in experiments with two different antibiotics
was similar to the variation in persister fraction between repeats of experiments with
the same antibiotic. Hence, we tested for the statistical significance of these differences
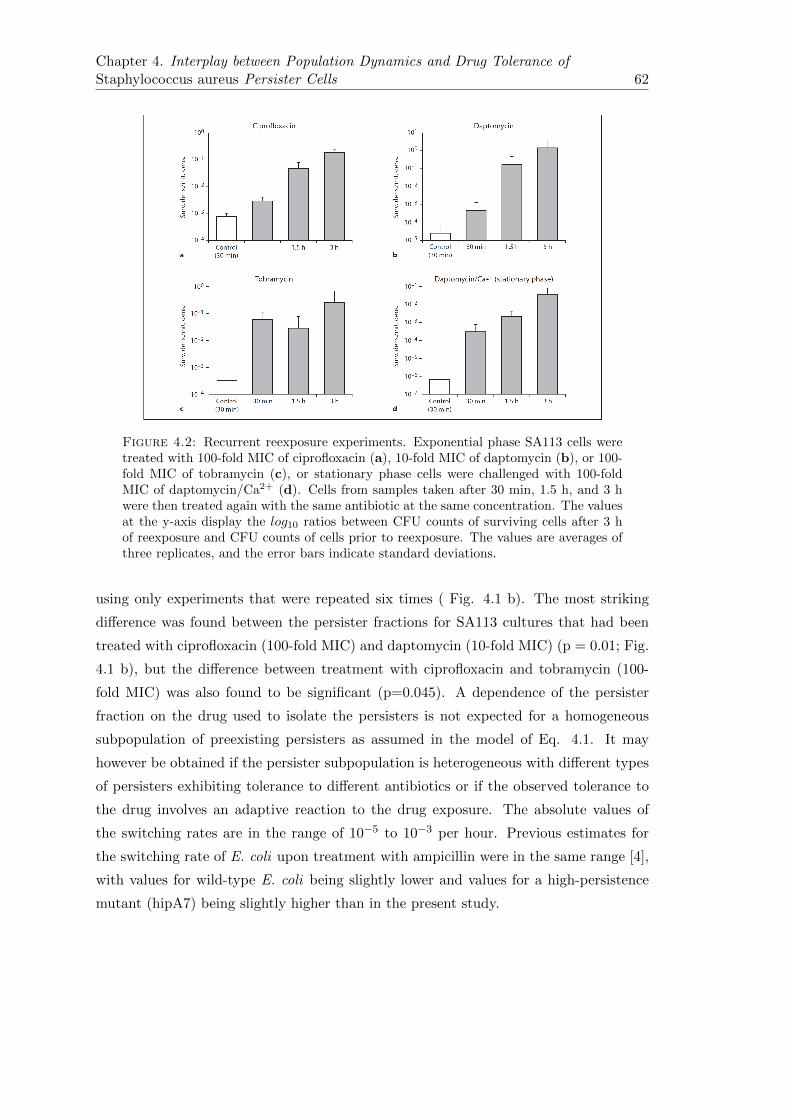
Chapter 4. Interplay between Population Dynamics and Drug Tolerance ofStaphylococcus aureus Persister Cells 62
Figure 4.2: Recurrent reexposure experiments. Exponential phase SA113 cells weretreated with 100-fold MIC of ciprofloxacin (a), 10-fold MIC of daptomycin (b), or 100-fold MIC of tobramycin (c), or stationary phase cells were challenged with 100-foldMIC of daptomycin/Ca2+ (d). Cells from samples taken after 30 min, 1.5 h, and 3 hwere then treated again with the same antibiotic at the same concentration. The valuesat the y-axis display the log10 ratios between CFU counts of surviving cells after 3 hof reexposure and CFU counts of cells prior to reexposure. The values are averages ofthree replicates, and the error bars indicate standard deviations.
using only experiments that were repeated six times ( Fig. 4.1 b). The most striking
difference was found between the persister fractions for SA113 cultures that had been
treated with ciprofloxacin (100-fold MIC) and daptomycin (10-fold MIC) (p = 0.01; Fig.
4.1 b), but the difference between treatment with ciprofloxacin and tobramycin (100-
fold MIC) was also found to be significant (p=0.045). A dependence of the persister
fraction on the drug used to isolate the persisters is not expected for a homogeneous
subpopulation of preexisting persisters as assumed in the model of Eq. 4.1. It may
however be obtained if the persister subpopulation is heterogeneous with different types
of persisters exhibiting tolerance to different antibiotics or if the observed tolerance to
the drug involves an adaptive reaction to the drug exposure. The absolute values of
the switching rates are in the range of 10−5 to 10−3 per hour. Previous estimates for
the switching rate of E. coli upon treatment with ampicillin were in the same range [4],
with values for wild-type E. coli being slightly lower and values for a high-persistence
mutant (hipA7) being slightly higher than in the present study.
Chapter 4. Interplay between Population Dynamics and Drug Tolerance ofStaphylococcus aureus Persister Cells 63
4.2.2 Degree of Drug Tolerance of Isolated S. aureus Persisters Is
Dependent on the Kind and Duration of Antibiotic Treatment
Deduced from our data and from studies in other bacteria [1, 32, 71, 75], an S. aureus
culture in the logarithmic phase was expected to mainly consist of susceptible cells and a
tiny subpopulation of bacteria (that may collectively be classified as type II persisters)
which exhibit different degrees of drug tolerance. The addition of an antibiotic should
then isolate cells gradually more tolerant over time to yield a population dominated by
highly robust persisters. To further corroborate this picture, we performed a test for
phenotypic tolerance to antibiotics proposed earlier [133], in which tolerant cells isolated
with an antibiotic are reexposed to fresh medium with the same antibiotic. To this end,
SA113 cells were treated at exponential growth phase with 100-fold MIC of ciprofloxacin,
10-fold MIC of daptomycin, or 100-fold MIC of tobramycin for 30 min, 1.5 h, and 3 h
(primary culture), and the washed pellets were transferred to fresh media supplemented
with the identical antibiotics at the same concentration (secondary culture). Cells grown
under nonselective conditions in the first culture, but exposed to the respective drugs
in the second culture served as controls. The same experiment was also conducted with
stationary-phase cells treated with 100-fold MIC of daptomycin/Ca2+. Generally, cells
taken from selective primary cultures were more tolerant to the respective antibiotics
than naıve cells first grown under antibiotic-free conditions. Killing rates of secondary
culture cells exposed to ciprofloxacin or daptomycin were reciprocally correlated with
the length of drug exposure in the primary culture ( Fig. 4.2 a, b, d), whereas this
was not the case for bacteria sampled from tobramycin-containing medium. There, the
slower colony-forming unit (CFU) decrease was independent of whether cells in the first
culture had been treated with the drug for 30 min or longer ( Fig. 4.2 c). Comparable
findings were described by Wiuff et al.[133] for E. coli . In line with data of our first
study [71], killing kinetics of secondary culture cells corroborate the assumption that a
highly tobramycin-tolerant pool of persisters was rapidly isolated by 100-fold MIC of the
drug. In contrast, sorting of robust persister cells appears to occur rather slowly (within
3 h) after addition of 100-fold MIC of ciprofloxacin or 10-fold MIC of daptomycin. Cells
with a lower degree of drug tolerance thus seem to be reprieved from killing at earlier
time points. A comparison with the model using the parameters obtained from Table
4.1 indicates that the reexposure experiments led to population sizes that were very
similar to what was obtained with continued exposure to that antibiotic (correlation
coefficients R ≥ 0.9). This observation provides further quantitative support for the
phenotypic tolerance model used to describe the killing assay above. Within the model,
the difference between the antibiotics in the kinetics of persister isolation were mostly due
to the death rate of the susceptible cells, which was significantly higher for tobramycin
at 100-fold MIC than for the other two conditions ( Table 4.1 ).
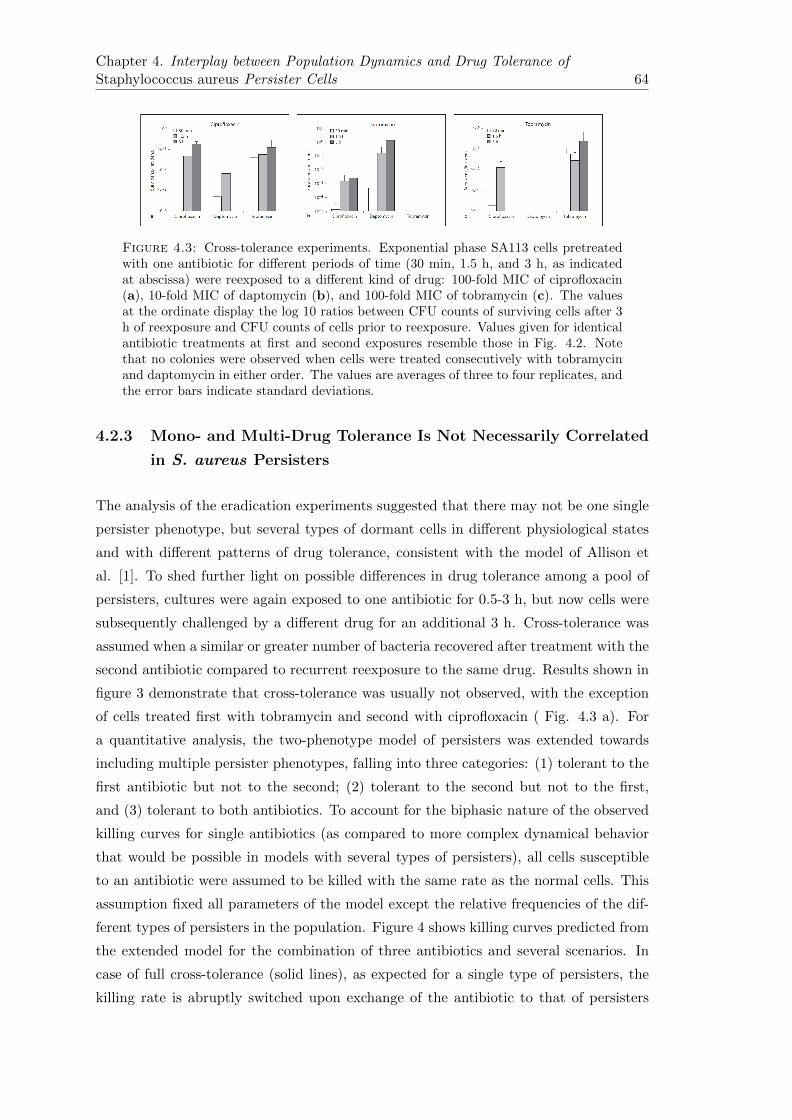
Chapter 4. Interplay between Population Dynamics and Drug Tolerance ofStaphylococcus aureus Persister Cells 64
Figure 4.3: Cross-tolerance experiments. Exponential phase SA113 cells pretreatedwith one antibiotic for different periods of time (30 min, 1.5 h, and 3 h, as indicatedat abscissa) were reexposed to a different kind of drug: 100-fold MIC of ciprofloxacin(a), 10-fold MIC of daptomycin (b), and 100-fold MIC of tobramycin (c). The valuesat the ordinate display the log 10 ratios between CFU counts of surviving cells after 3h of reexposure and CFU counts of cells prior to reexposure. Values given for identicalantibiotic treatments at first and second exposures resemble those in Fig. 4.2. Notethat no colonies were observed when cells were treated consecutively with tobramycinand daptomycin in either order. The values are averages of three to four replicates, andthe error bars indicate standard deviations.
4.2.3 Mono- and Multi-Drug Tolerance Is Not Necessarily Correlated
in S. aureus Persisters
The analysis of the eradication experiments suggested that there may not be one single
persister phenotype, but several types of dormant cells in different physiological states
and with different patterns of drug tolerance, consistent with the model of Allison et
al. [1]. To shed further light on possible differences in drug tolerance among a pool of
persisters, cultures were again exposed to one antibiotic for 0.5-3 h, but now cells were
subsequently challenged by a different drug for an additional 3 h. Cross-tolerance was
assumed when a similar or greater number of bacteria recovered after treatment with the
second antibiotic compared to recurrent reexposure to the same drug. Results shown in
figure 3 demonstrate that cross-tolerance was usually not observed, with the exception
of cells treated first with tobramycin and second with ciprofloxacin ( Fig. 4.3 a). For
a quantitative analysis, the two-phenotype model of persisters was extended towards
including multiple persister phenotypes, falling into three categories: (1) tolerant to the
first antibiotic but not to the second; (2) tolerant to the second but not to the first,
and (3) tolerant to both antibiotics. To account for the biphasic nature of the observed
killing curves for single antibiotics (as compared to more complex dynamical behavior
that would be possible in models with several types of persisters), all cells susceptible
to an antibiotic were assumed to be killed with the same rate as the normal cells. This
assumption fixed all parameters of the model except the relative frequencies of the dif-
ferent types of persisters in the population. Figure 4 shows killing curves predicted from
the extended model for the combination of three antibiotics and several scenarios. In
case of full cross-tolerance (solid lines), as expected for a single type of persisters, the
killing rate is abruptly switched upon exchange of the antibiotic to that of persisters
Chapter 4. Interplay between Population Dynamics and Drug Tolerance ofStaphylococcus aureus Persister Cells 65
under the influence of the second antibiotic. In the complete absence of cross-tolerance,
which is obtained if there are two mutually disjunct persister populations for the two
antibiotics, rapid eradication with a rate similar to killing of susceptible cells is expected
after the exchange of antibiotics (dotted lines). Finally, partial cross-tolerance with a
fraction of persisters tolerant to both antibiotics results in biphasic killing upon antibi-
otic exchange (dashed lines). The data for daptomycin and tobramycin ( Fig. 4.4 e, f)
clearly showed no cross-tolerance, as expected for two disjunct subpopulations consti-
tuted by persisters tolerant to either tobramycin or daptomycin. This in agreement with
our previous observations, when stationary-phase bacteria had been killed completely
upon simultaneous addition of both daptomycin and tobramycin at super-MICs [71]. In
the cross-tolerance experiments of either antibiotic with ciprofloxacin ( Fig. 4.4 a-d),
however, the order in which the antibiotics are applied was found to be crucial. This
observation suggests that the behavior of the isolated persisters was influenced by the
challenge with the first antibiotic and is inconsistent with models that assume preexist-
ing tolerant subpopulations, neglecting any response to the antibiotic challenge. It also
indicates that care must be taken to separate cellular responses due to the antibiotic
treatment from those characteristic for persisters, which underscores that methods for
persister isolation should be as gentle as possible to obtain unstressed (ideally naıve)
persisters for further characterization [50, 53, 110].
4.2.4 Delay in Resuscitation and Subsequent CFU Doubling Times
Are Dependent on the Kind and Duration of Antibiotic Treat-
ment
How long do S. aureus persisters, which have endured antibiotic treatment, require to
reassume growth, and what are the CFU doubling times within the first hours after re-
suscitation? To answer these questions, SA113 cells were challenged by single drugs for
0.5-3 h, and were then transferred to fresh non-selective media. Cells treated with 100-
fold MIC of ciprofloxacin exhibited a consistent increase in live counts approximately 4 h
after the shift to fresh media ( Fig. 4.5 a). Resulting cultures exhibited relatively similar
CFU doubling times (calculated on the basis of t = 10 h and t = 5 h values) ranging
between 43 and 67 min, irrespective of the duration of the ciprofloxacin pretreatment.
CFU values of cells challenged with 10-fold daptomycin also increased rather uniformly
(23 - 33 min doubling times) starting approximately 3 h after the shift ( Fig. 4.5 b).
By contrast, live counts of cultures treated for 30 min or 1.5 h with 100-fold tobramycin
rose after about 3 h, whereas those of cultures challenged with the drug for 3 h remained
constant for at least 9 h ( Fig. 4.5 c). This is reflected by doubling times of 37 min,
67 min or more than 6 h, respectively. Similar behavior as for the 3-hour exposure to
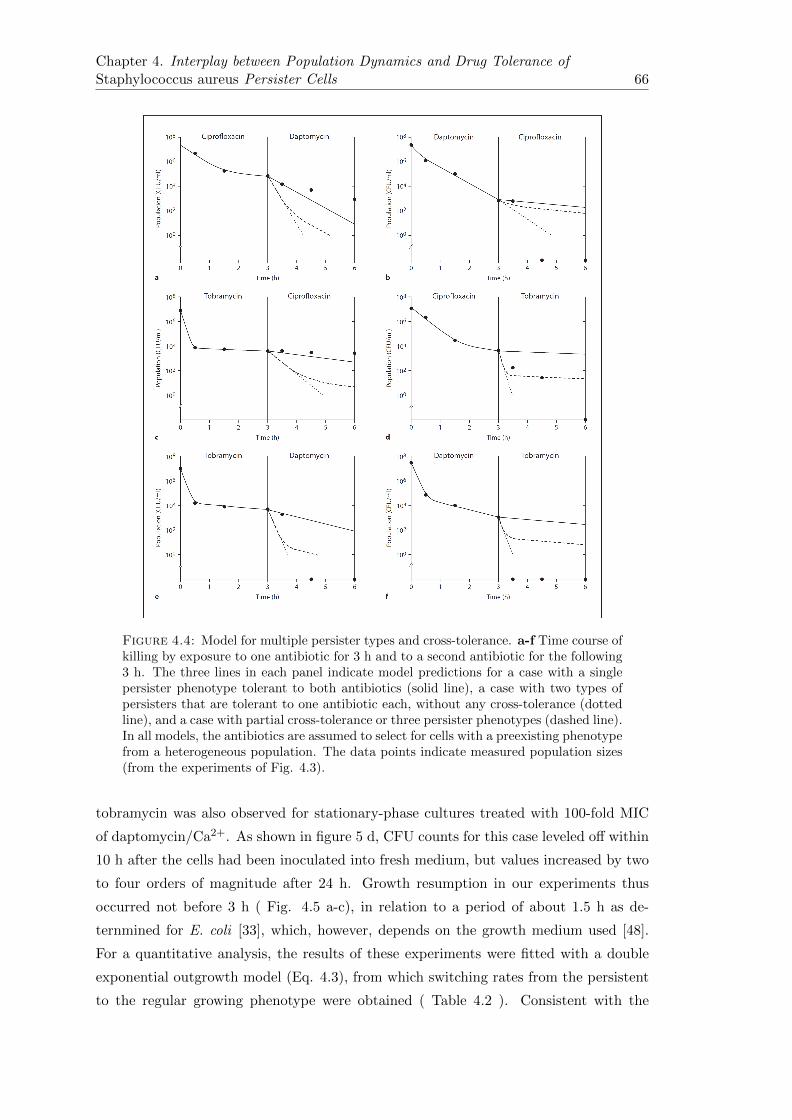
Chapter 4. Interplay between Population Dynamics and Drug Tolerance ofStaphylococcus aureus Persister Cells 66
Figure 4.4: Model for multiple persister types and cross-tolerance. a-f Time course ofkilling by exposure to one antibiotic for 3 h and to a second antibiotic for the following3 h. The three lines in each panel indicate model predictions for a case with a singlepersister phenotype tolerant to both antibiotics (solid line), a case with two types ofpersisters that are tolerant to one antibiotic each, without any cross-tolerance (dottedline), and a case with partial cross-tolerance or three persister phenotypes (dashed line).In all models, the antibiotics are assumed to select for cells with a preexisting phenotypefrom a heterogeneous population. The data points indicate measured population sizes(from the experiments of Fig. 4.3).
tobramycin was also observed for stationary-phase cultures treated with 100-fold MIC
of daptomycin/Ca2+. As shown in figure 5 d, CFU counts for this case leveled off within
10 h after the cells had been inoculated into fresh medium, but values increased by two
to four orders of magnitude after 24 h. Growth resumption in our experiments thus
occurred not before 3 h ( Fig. 4.5 a-c), in relation to a period of about 1.5 h as de-
ternmined for E. coli [33], which, however, depends on the growth medium used [48].
For a quantitative analysis, the results of these experiments were fitted with a double
exponential outgrowth model (Eq. 4.3), from which switching rates from the persistent
to the regular growing phenotype were obtained ( Table 4.2 ). Consistent with the
Chapter 4. Interplay between Population Dynamics and Drug Tolerance ofStaphylococcus aureus Persister Cells 67
Figure 4.5: Resuscitation experiments. Exponential phase SA113 cells were treatedwith 100-fold MIC of ciprofloxacin (a), 10-fold MIC of daptomycin (b), or 100-foldMIC of tobramycin (c), or stationary phase cells were challenged with 100-fold MICof daptomycin/Ca2+ (d). Cells from samples taken after 30 min, 1.5 h, and 3 h werethen cultured in fresh medium without antibiotic for 24 h to determine resuscitationtimes. The values are averages of two replicates, and the error bars indicate standarddeviations. The limit of detection was 100 CFU/ml.
observations described above, the parameters obtained for different exposure times to
either ciprofloxacin or daptomycin were very similar, while for tobramycin only the two
shorter exposure times could be described well with the model. The latter observation
suggests that prolonged exposure to tobramycin affects the cells beyond simple random
phenotype switching. Instead, it possibly induces a phenotype of ‘deep dormancy’ (with
an as of yet unknown molecular basis) that results in delayed wake-up kinetics. Param-
eters obtained for the longest exposure time for each antibiotic that is well described
by the model are summarized in Table 4.2. For all three antibiotics, the switching rates
from the persistent to the regular growing phenotype are in the same range as previ-
ously found for E. coli persisters [4]. For tobramycin, the switching rate is similar to the
killing rate of persisters during antibiotic treatment, consistent with the idea that the
observed killing of persisters is due to so-called ‘scout’ cells, persisters resuming growth
stochastically [11]. On the other hand, the switching rates observed using ciprofloxacin
and daptomycin are smaller than the killing rates of persisters exposed to these drugs,
indicating that these two drugs kill persisters independently of growth resumption. In-
triguingly, CFU doubling times of daptomycin-treated cells fell below usual generation
times of naive SA113 bacteria (which we determined as approximately 37 min under
comparable antibiotic-free conditions) after being shifted to non-selective media ( Fig.
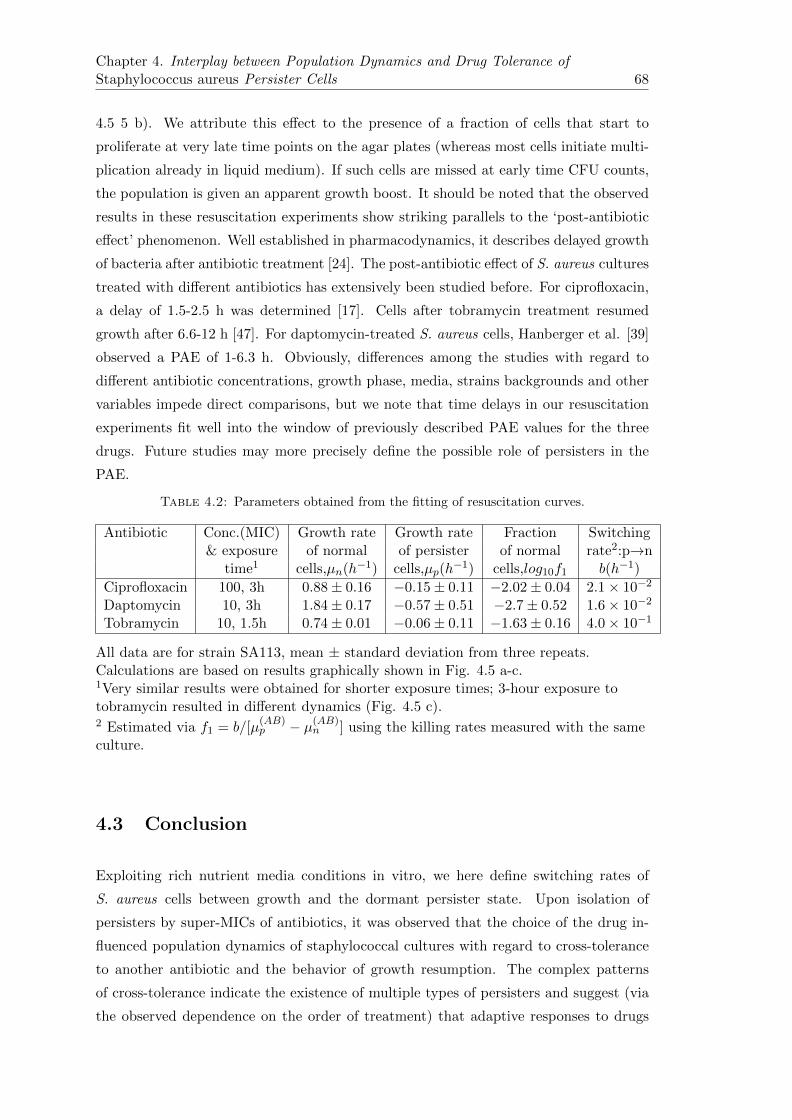
Chapter 4. Interplay between Population Dynamics and Drug Tolerance ofStaphylococcus aureus Persister Cells 68
4.5 5 b). We attribute this effect to the presence of a fraction of cells that start to
proliferate at very late time points on the agar plates (whereas most cells initiate multi-
plication already in liquid medium). If such cells are missed at early time CFU counts,
the population is given an apparent growth boost. It should be noted that the observed
results in these resuscitation experiments show striking parallels to the ‘post-antibiotic
effect’ phenomenon. Well established in pharmacodynamics, it describes delayed growth
of bacteria after antibiotic treatment [24]. The post-antibiotic effect of S. aureus cultures
treated with different antibiotics has extensively been studied before. For ciprofloxacin,
a delay of 1.5-2.5 h was determined [17]. Cells after tobramycin treatment resumed
growth after 6.6-12 h [47]. For daptomycin-treated S. aureus cells, Hanberger et al. [39]
observed a PAE of 1-6.3 h. Obviously, differences among the studies with regard to
different antibiotic concentrations, growth phase, media, strains backgrounds and other
variables impede direct comparisons, but we note that time delays in our resuscitation
experiments fit well into the window of previously described PAE values for the three
drugs. Future studies may more precisely define the possible role of persisters in the
PAE.
Table 4.2: Parameters obtained from the fitting of resuscitation curves.
Antibiotic Conc.(MIC) Growth rate Growth rate Fraction Switching& exposure of normal of persister of normal rate2:p→n
time1 cells,µn(h−1) cells,µp(h−1) cells,log10f1 b(h−1)
Ciprofloxacin 100, 3h 0.88± 0.16 −0.15± 0.11 −2.02± 0.04 2.1× 10⁻²
Daptomycin 10, 3h 1.84± 0.17 −0.57± 0.51 −2.7± 0.52 1.6× 10⁻²
Tobramycin 10, 1.5h 0.74± 0.01 −0.06± 0.11 −1.63± 0.16 4.0× 10⁻¹
All data are for strain SA113, mean ± standard deviation from three repeats.Calculations are based on results graphically shown in Fig. 4.5 a-c.1Very similar results were obtained for shorter exposure times; 3-hour exposure totobramycin resulted in different dynamics (Fig. 4.5 c).2 Estimated via f1 = b/[µ
(AB)p − µ(AB)
n ] using the killing rates measured with the sameculture.
4.3 Conclusion
Exploiting rich nutrient media conditions in vitro, we here define switching rates of
S. aureus cells between growth and the dormant persister state. Upon isolation of
persisters by super-MICs of antibiotics, it was observed that the choice of the drug in-
fluenced population dynamics of staphylococcal cultures with regard to cross-tolerance
to another antibiotic and the behavior of growth resumption. The complex patterns
of cross-tolerance indicate the existence of multiple types of persisters and suggest (via
the observed dependence on the order of treatment) that adaptive responses to drugs
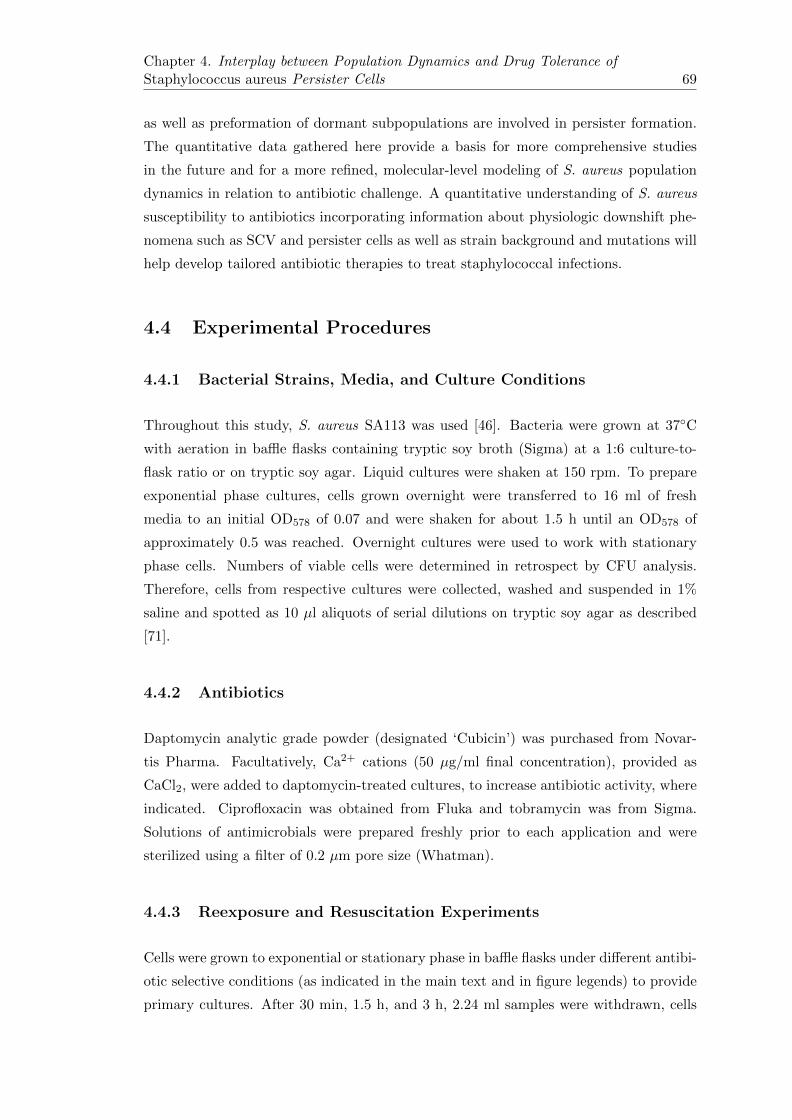
Chapter 4. Interplay between Population Dynamics and Drug Tolerance ofStaphylococcus aureus Persister Cells 69
as well as preformation of dormant subpopulations are involved in persister formation.
The quantitative data gathered here provide a basis for more comprehensive studies
in the future and for a more refined, molecular-level modeling of S. aureus population
dynamics in relation to antibiotic challenge. A quantitative understanding of S. aureus
susceptibility to antibiotics incorporating information about physiologic downshift phe-
nomena such as SCV and persister cells as well as strain background and mutations will
help develop tailored antibiotic therapies to treat staphylococcal infections.
4.4 Experimental Procedures
4.4.1 Bacterial Strains, Media, and Culture Conditions
Throughout this study, S. aureus SA113 was used [46]. Bacteria were grown at 37◦C
with aeration in baffle flasks containing tryptic soy broth (Sigma) at a 1:6 culture-to-
flask ratio or on tryptic soy agar. Liquid cultures were shaken at 150 rpm. To prepare
exponential phase cultures, cells grown overnight were transferred to 16 ml of fresh
media to an initial OD578 of 0.07 and were shaken for about 1.5 h until an OD578 of
approximately 0.5 was reached. Overnight cultures were used to work with stationary
phase cells. Numbers of viable cells were determined in retrospect by CFU analysis.
Therefore, cells from respective cultures were collected, washed and suspended in 1%
saline and spotted as 10 µl aliquots of serial dilutions on tryptic soy agar as described
[71].
4.4.2 Antibiotics
Daptomycin analytic grade powder (designated ‘Cubicin’) was purchased from Novar-
tis Pharma. Facultatively, Ca2+ cations (50 µg/ml final concentration), provided as
CaCl2, were added to daptomycin-treated cultures, to increase antibiotic activity, where
indicated. Ciprofloxacin was obtained from Fluka and tobramycin was from Sigma.
Solutions of antimicrobials were prepared freshly prior to each application and were
sterilized using a filter of 0.2 µm pore size (Whatman).
4.4.3 Reexposure and Resuscitation Experiments
Cells were grown to exponential or stationary phase in baffle flasks under different antibi-
otic selective conditions (as indicated in the main text and in figure legends) to provide
primary cultures. After 30 min, 1.5 h, and 3 h, 2.24 ml samples were withdrawn, cells
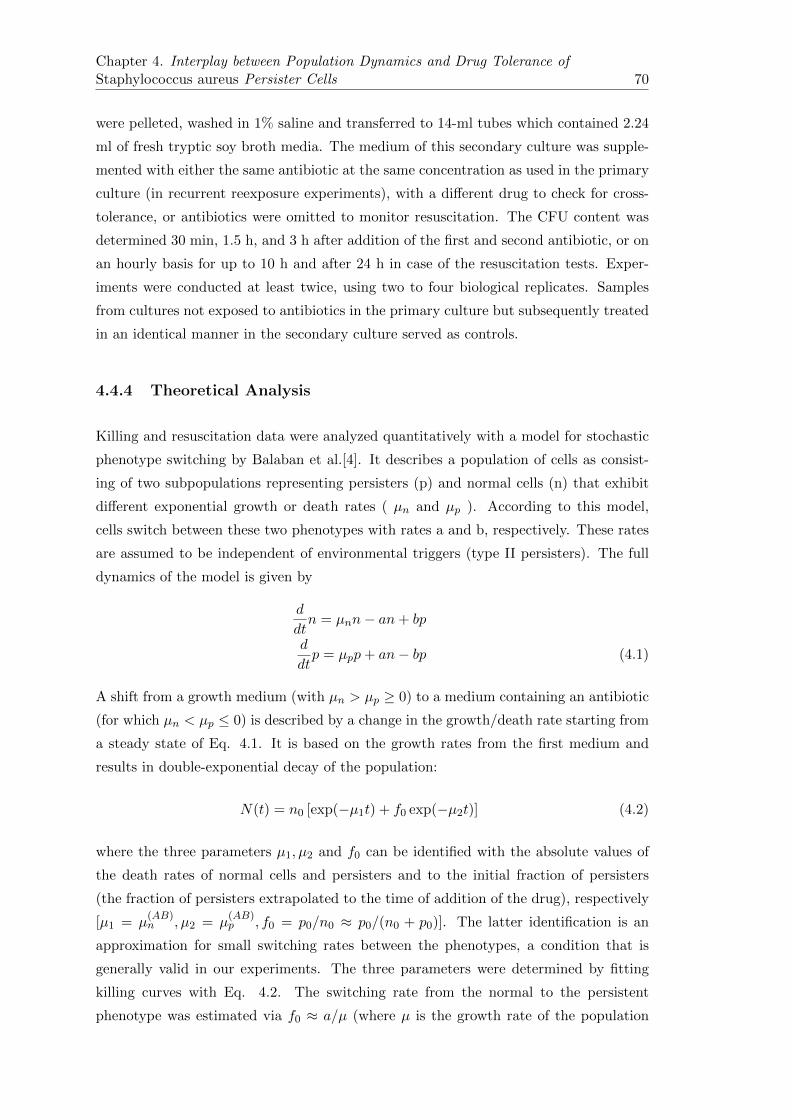
Chapter 4. Interplay between Population Dynamics and Drug Tolerance ofStaphylococcus aureus Persister Cells 70
were pelleted, washed in 1% saline and transferred to 14-ml tubes which contained 2.24
ml of fresh tryptic soy broth media. The medium of this secondary culture was supple-
mented with either the same antibiotic at the same concentration as used in the primary
culture (in recurrent reexposure experiments), with a different drug to check for cross-
tolerance, or antibiotics were omitted to monitor resuscitation. The CFU content was
determined 30 min, 1.5 h, and 3 h after addition of the first and second antibiotic, or on
an hourly basis for up to 10 h and after 24 h in case of the resuscitation tests. Exper-
iments were conducted at least twice, using two to four biological replicates. Samples
from cultures not exposed to antibiotics in the primary culture but subsequently treated
in an identical manner in the secondary culture served as controls.
4.4.4 Theoretical Analysis
Killing and resuscitation data were analyzed quantitatively with a model for stochastic
phenotype switching by Balaban et al.[4]. It describes a population of cells as consist-
ing of two subpopulations representing persisters (p) and normal cells (n) that exhibit
different exponential growth or death rates ( µn and µp ). According to this model,
cells switch between these two phenotypes with rates a and b, respectively. These rates
are assumed to be independent of environmental triggers (type II persisters). The full
dynamics of the model is given by
d
dtn = µnn− an+ bp
d
dtp = µpp+ an− bp (4.1)
A shift from a growth medium (with µn > µp ≥ 0) to a medium containing an antibiotic
(for which µn < µp ≤ 0) is described by a change in the growth/death rate starting from
a steady state of Eq. 4.1. It is based on the growth rates from the first medium and
results in double-exponential decay of the population:
N(t) = n0 [exp(−µ1t) + f0 exp(−µ2t)] (4.2)
where the three parameters µ1, µ2 and f0 can be identified with the absolute values of
the death rates of normal cells and persisters and to the initial fraction of persisters
(the fraction of persisters extrapolated to the time of addition of the drug), respectively
[µ1 = µ(AB)n , µ2 = µ
(AB)p , f0 = p0/n0 ≈ p0/(n0 + p0)]. The latter identification is an
approximation for small switching rates between the phenotypes, a condition that is
generally valid in our experiments. The three parameters were determined by fitting
killing curves with Eq. 4.2. The switching rate from the normal to the persistent
phenotype was estimated via f0 ≈ a/µ (where µ is the growth rate of the population
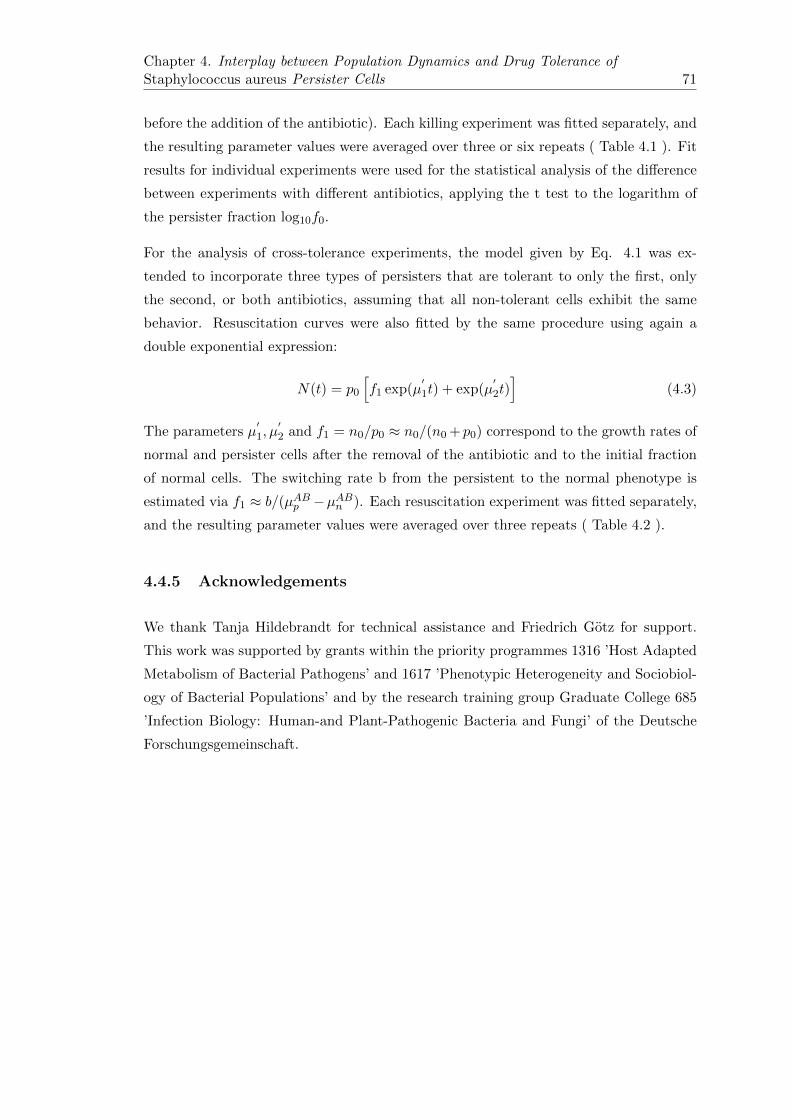
Chapter 4. Interplay between Population Dynamics and Drug Tolerance ofStaphylococcus aureus Persister Cells 71
before the addition of the antibiotic). Each killing experiment was fitted separately, and
the resulting parameter values were averaged over three or six repeats ( Table 4.1 ). Fit
results for individual experiments were used for the statistical analysis of the difference
between experiments with different antibiotics, applying the t test to the logarithm of
the persister fraction log10f0.
For the analysis of cross-tolerance experiments, the model given by Eq. 4.1 was ex-
tended to incorporate three types of persisters that are tolerant to only the first, only
the second, or both antibiotics, assuming that all non-tolerant cells exhibit the same
behavior. Resuscitation curves were also fitted by the same procedure using again a
double exponential expression:
N(t) = p0
[f1 exp(µ
′1t) + exp(µ
′2t)]
(4.3)
The parameters µ′1, µ
′2 and f1 = n0/p0 ≈ n0/(n0 + p0) correspond to the growth rates of
normal and persister cells after the removal of the antibiotic and to the initial fraction
of normal cells. The switching rate b from the persistent to the normal phenotype is
estimated via f1 ≈ b/(µABp −µABn ). Each resuscitation experiment was fitted separately,
and the resulting parameter values were averaged over three repeats ( Table 4.2 ).
4.4.5 Acknowledgements
We thank Tanja Hildebrandt for technical assistance and Friedrich Gotz for support.
This work was supported by grants within the priority programmes 1316 ’Host Adapted
Metabolism of Bacterial Pathogens’ and 1617 ’Phenotypic Heterogeneity and Sociobiol-
ogy of Bacterial Populations’ and by the research training group Graduate College 685
’Infection Biology: Human-and Plant-Pathogenic Bacteria and Fungi’ of the Deutsche
Forschungsgemeinschaft.

Chapter 5
Role of persisters in antibiotic
resistance
73
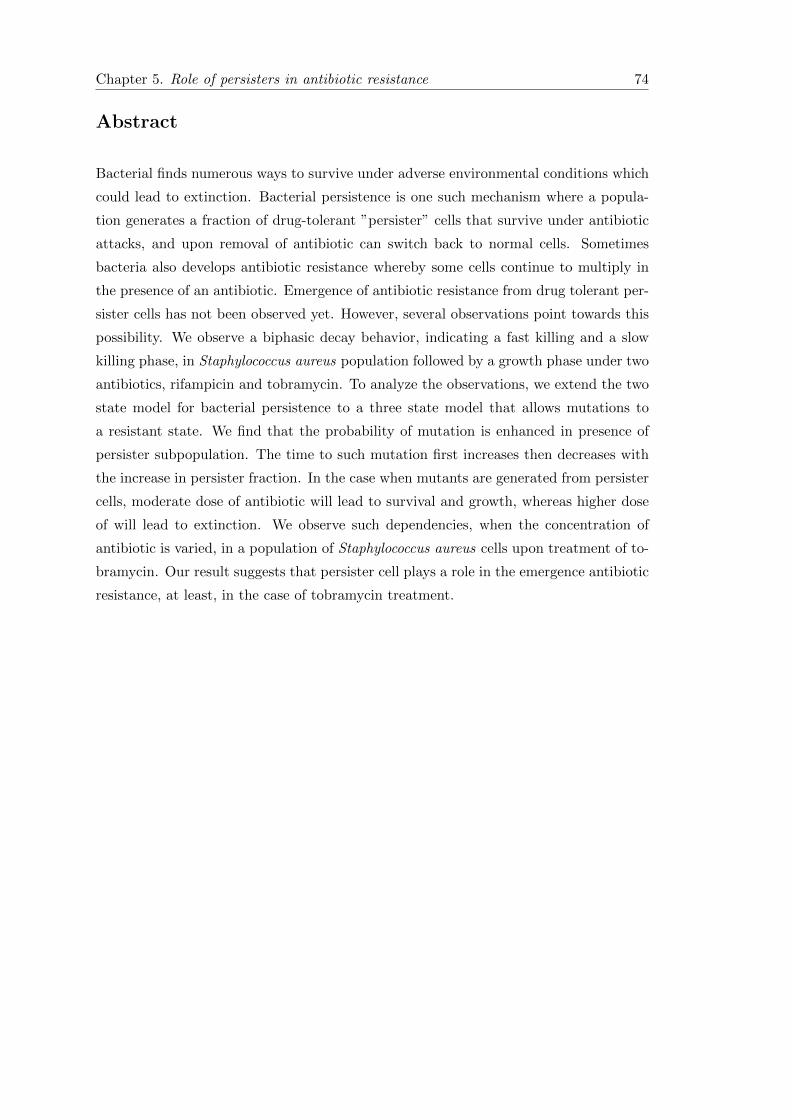
Chapter 5. Role of persisters in antibiotic resistance 74
Abstract
Bacterial finds numerous ways to survive under adverse environmental conditions which
could lead to extinction. Bacterial persistence is one such mechanism where a popula-
tion generates a fraction of drug-tolerant ”persister” cells that survive under antibiotic
attacks, and upon removal of antibiotic can switch back to normal cells. Sometimes
bacteria also develops antibiotic resistance whereby some cells continue to multiply in
the presence of an antibiotic. Emergence of antibiotic resistance from drug tolerant per-
sister cells has not been observed yet. However, several observations point towards this
possibility. We observe a biphasic decay behavior, indicating a fast killing and a slow
killing phase, in Staphylococcus aureus population followed by a growth phase under two
antibiotics, rifampicin and tobramycin. To analyze the observations, we extend the two
state model for bacterial persistence to a three state model that allows mutations to
a resistant state. We find that the probability of mutation is enhanced in presence of
persister subpopulation. The time to such mutation first increases then decreases with
the increase in persister fraction. In the case when mutants are generated from persister
cells, moderate dose of antibiotic will lead to survival and growth, whereas higher dose
of will lead to extinction. We observe such dependencies, when the concentration of
antibiotic is varied, in a population of Staphylococcus aureus cells upon treatment of to-
bramycin. Our result suggests that persister cell plays a role in the emergence antibiotic
resistance, at least, in the case of tobramycin treatment.
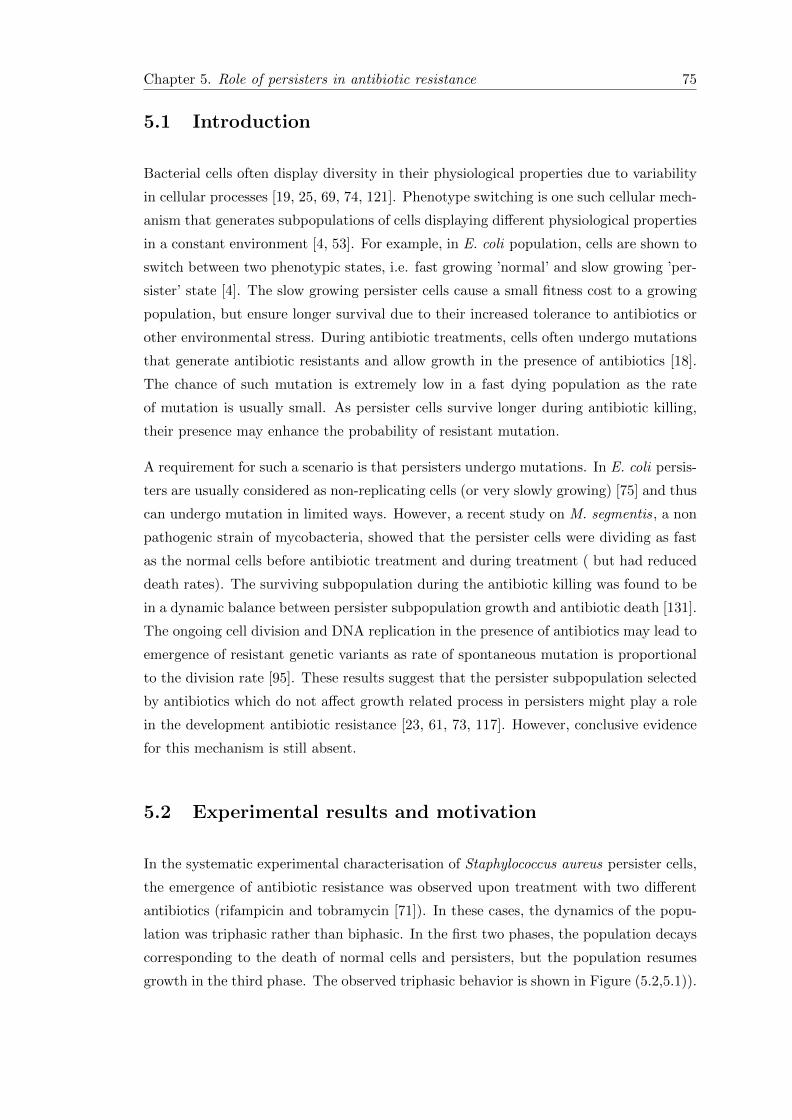
Chapter 5. Role of persisters in antibiotic resistance 75
5.1 Introduction
Bacterial cells often display diversity in their physiological properties due to variability
in cellular processes [19, 25, 69, 74, 121]. Phenotype switching is one such cellular mech-
anism that generates subpopulations of cells displaying different physiological properties
in a constant environment [4, 53]. For example, in E. coli population, cells are shown to
switch between two phenotypic states, i.e. fast growing ’normal’ and slow growing ’per-
sister’ state [4]. The slow growing persister cells cause a small fitness cost to a growing
population, but ensure longer survival due to their increased tolerance to antibiotics or
other environmental stress. During antibiotic treatments, cells often undergo mutations
that generate antibiotic resistants and allow growth in the presence of antibiotics [18].
The chance of such mutation is extremely low in a fast dying population as the rate
of mutation is usually small. As persister cells survive longer during antibiotic killing,
their presence may enhance the probability of resistant mutation.
A requirement for such a scenario is that persisters undergo mutations. In E. coli persis-
ters are usually considered as non-replicating cells (or very slowly growing) [75] and thus
can undergo mutation in limited ways. However, a recent study on M. segmentis, a non
pathogenic strain of mycobacteria, showed that the persister cells were dividing as fast
as the normal cells before antibiotic treatment and during treatment ( but had reduced
death rates). The surviving subpopulation during the antibiotic killing was found to be
in a dynamic balance between persister subpopulation growth and antibiotic death [131].
The ongoing cell division and DNA replication in the presence of antibiotics may lead to
emergence of resistant genetic variants as rate of spontaneous mutation is proportional
to the division rate [95]. These results suggest that the persister subpopulation selected
by antibiotics which do not affect growth related process in persisters might play a role
in the development antibiotic resistance [23, 61, 73, 117]. However, conclusive evidence
for this mechanism is still absent.
5.2 Experimental results and motivation
In the systematic experimental characterisation of Staphylococcus aureus persister cells,
the emergence of antibiotic resistance was observed upon treatment with two different
antibiotics (rifampicin and tobramycin [71]). In these cases, the dynamics of the popu-
lation was triphasic rather than biphasic. In the first two phases, the population decays
corresponding to the death of normal cells and persisters, but the population resumes
growth in the third phase. The observed triphasic behavior is shown in Figure (5.2,5.1)).
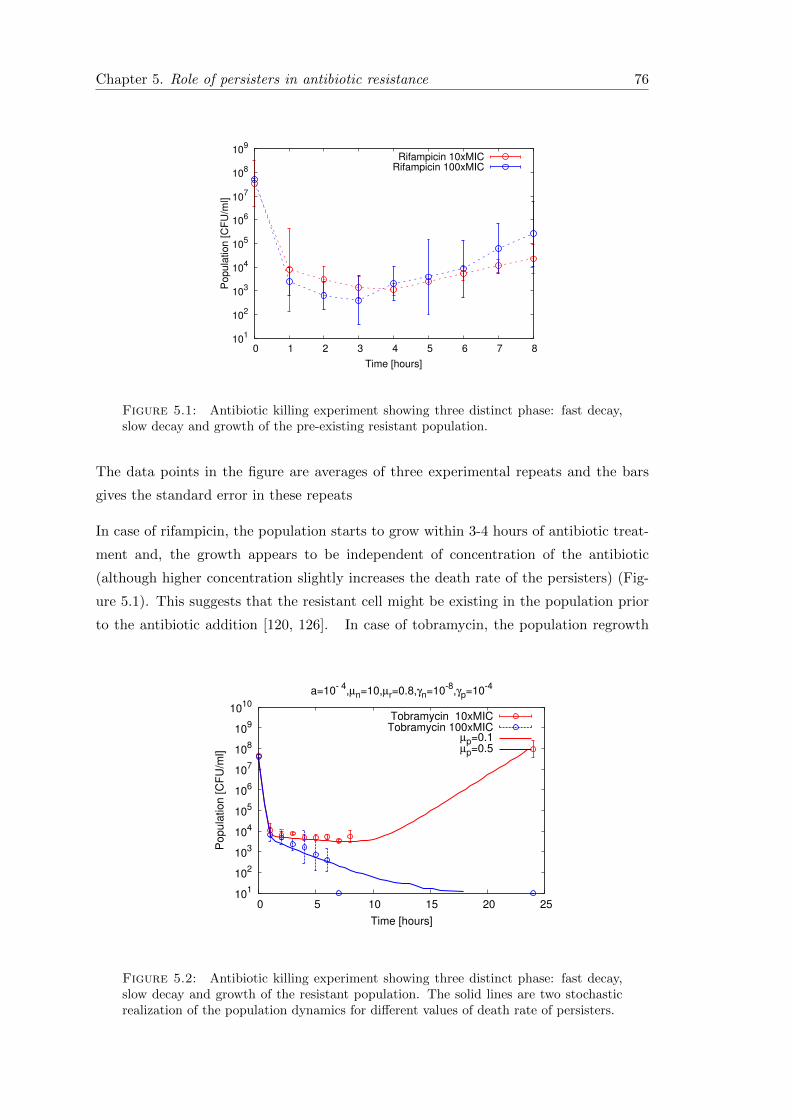
Chapter 5. Role of persisters in antibiotic resistance 76
101
102
103
104
105
106
107
108
109
0 1 2 3 4 5 6 7 8
Pop
ulat
ion
[CF
U/m
l]
Time [hours]
Rifampicin 10xMICRifampicin 100xMIC
Figure 5.1: Antibiotic killing experiment showing three distinct phase: fast decay,slow decay and growth of the pre-existing resistant population.
The data points in the figure are averages of three experimental repeats and the bars
gives the standard error in these repeats
In case of rifampicin, the population starts to grow within 3-4 hours of antibiotic treat-
ment and, the growth appears to be independent of concentration of the antibiotic
(although higher concentration slightly increases the death rate of the persisters) (Fig-
ure 5.1). This suggests that the resistant cell might be existing in the population prior
to the antibiotic addition [120, 126]. In case of tobramycin, the population regrowth
101
102
103
104
105
106
107
108
109
1010
0 5 10 15 20 25
Pop
ulat
ion
[CF
U/m
l]
Time [hours]
a=10- 4,µn=10,µr=0.8,γn=10-8,γp=10-4
Tobramycin 10xMICTobramycin 100xMIC
µp=0.1µp=0.5
Figure 5.2: Antibiotic killing experiment showing three distinct phase: fast decay,slow decay and growth of the resistant population. The solid lines are two stochasticrealization of the population dynamics for different values of death rate of persisters.
Chapter 5. Role of persisters in antibiotic resistance 77
after few hours of killing in presence of the antibiotics depends on the concentration.
At a moderate concentration (10 fold of minimum inhibitory concentration (MIC)) of
antibiotic, the population grows after 8 hours, whereas at high concentration (100 fold
MIC) the population goes extinct before 8 hours (Figure 5.2). The death rate of the
normal cells is equal in both concentrations, whereas the death rate of persister cell in-
creases with increase in antibiotic concentration. The population survival and growth is
dependent on the death rate of persister cells, which suggests that the resistant cells are
generated after antibiotic treatment due to longer survival. Therefore, we will focus only
on the second case, antibiotic resistance against tobramycin, for our further analysis and
comparisons. In this study, we investigate, using experimentally observed parameters,
the role of surviving persister cells in the emergence of antibiotic resistance during an
antibiotic treatment.
To understand the above results, we propose a three state population model consisting of
two phenotypic states and one resistant state. We study the deterministic and stochastic
dynamics of the population during antibiotic treatment using computer simulations and
analytic calculations. The deterministic description is useful in extracting death rates,
initial persister fraction and mutation rates from experimental data. The stochastic
description is necessary to evaluate the probability of survival and its dependence on
various parameters such as death rates, mutation rates and persister fraction. The time
to first mutation or extinction can be properly defined only in a stochastic description
due to small population numbers.
5.3 Model : Deterministic dynamics
Figure 5.3: Model : Two phenotypic (n & p) and a resistant state (r).
We consider a mixed population of normal (n) and persister (p) cells dying with rates
µn and µp, respectively in the presence of an antibiotic. Cells in the normal and the
persister state can mutate with rate γn and γp respectively to the resistant state (r), in
which cells can duplicate with rate µr (Figure 5.3). The population dynamics can be
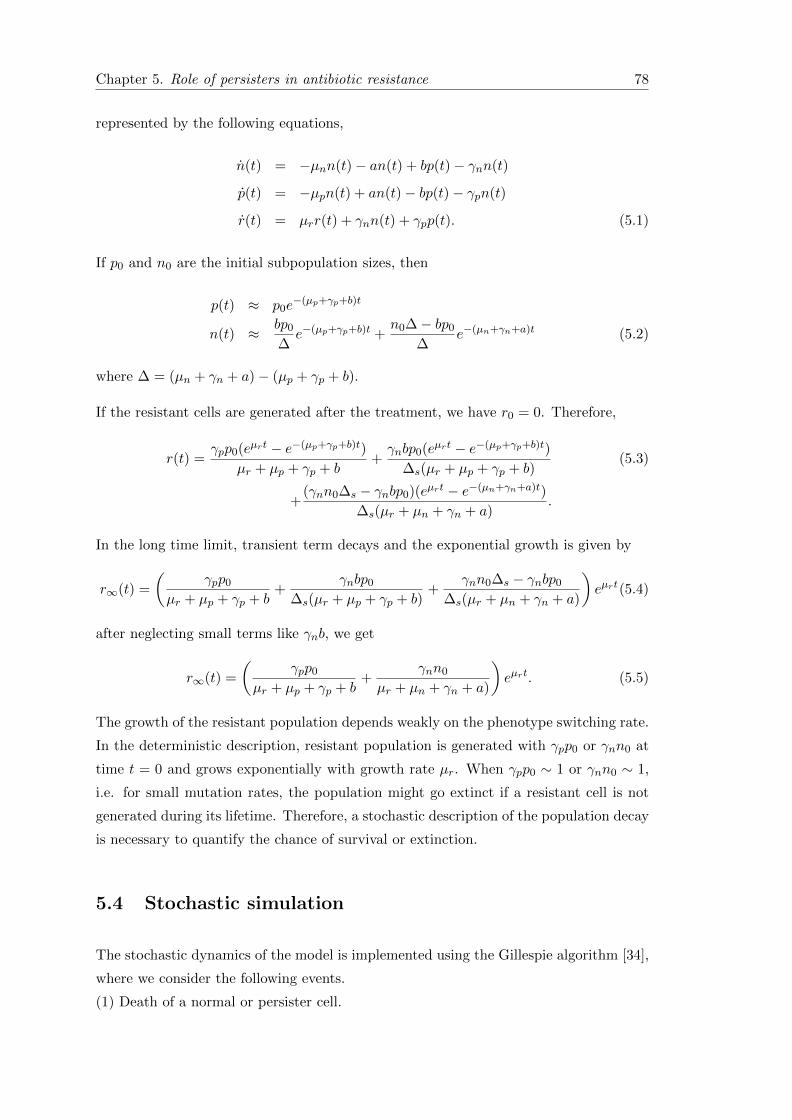
Chapter 5. Role of persisters in antibiotic resistance 78
represented by the following equations,
n(t) = −µnn(t)− an(t) + bp(t)− γnn(t)
p(t) = −µpn(t) + an(t)− bp(t)− γpn(t)
r(t) = µrr(t) + γnn(t) + γpp(t). (5.1)
If p0 and n0 are the initial subpopulation sizes, then
p(t) ≈ p0e−(µp+γp+b)t
n(t) ≈ bp0
∆e−(µp+γp+b)t +
n0∆− bp0
∆e−(µn+γn+a)t (5.2)
where ∆ = (µn + γn + a)− (µp + γp + b).
If the resistant cells are generated after the treatment, we have r0 = 0. Therefore,
r(t) =γpp0(eµrt − e−(µp+γp+b)t)
µr + µp + γp + b+γnbp0(eµrt − e−(µp+γp+b)t)
∆s(µr + µp + γp + b)(5.3)
+(γnn0∆s − γnbp0)(eµrt − e−(µn+γn+a)t)
∆s(µr + µn + γn + a).
In the long time limit, transient term decays and the exponential growth is given by
r∞(t) =
(γpp0
µr + µp + γp + b+
γnbp0
∆s(µr + µp + γp + b)+
γnn0∆s − γnbp0
∆s(µr + µn + γn + a)
)eµrt(5.4)
after neglecting small terms like γnb, we get
r∞(t) =
(γpp0
µr + µp + γp + b+
γnn0
µr + µn + γn + a)
)eµrt. (5.5)
The growth of the resistant population depends weakly on the phenotype switching rate.
In the deterministic description, resistant population is generated with γpp0 or γnn0 at
time t = 0 and grows exponentially with growth rate µr. When γpp0 ∼ 1 or γnn0 ∼ 1,
i.e. for small mutation rates, the population might go extinct if a resistant cell is not
generated during its lifetime. Therefore, a stochastic description of the population decay
is necessary to quantify the chance of survival or extinction.
5.4 Stochastic simulation
The stochastic dynamics of the model is implemented using the Gillespie algorithm [34],
where we consider the following events.
(1) Death of a normal or persister cell.
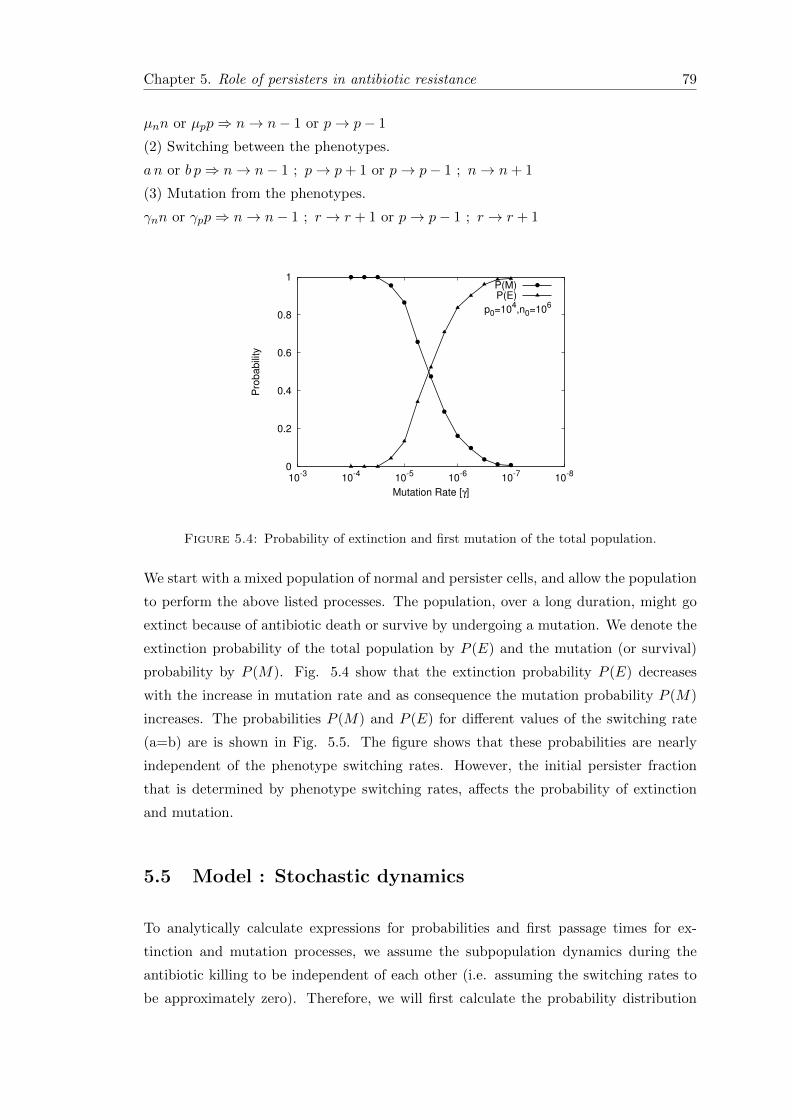
Chapter 5. Role of persisters in antibiotic resistance 79
µnn or µpp⇒ n→ n− 1 or p→ p− 1
(2) Switching between the phenotypes.
an or b p⇒ n→ n− 1 ; p→ p+ 1 or p→ p− 1 ; n→ n+ 1
(3) Mutation from the phenotypes.
γnn or γpp⇒ n→ n− 1 ; r → r + 1 or p→ p− 1 ; r → r + 1
0
0.2
0.4
0.6
0.8
1
10-3 10-4 10-5 10-6 10-7 10-8
Pro
babi
lity
Mutation Rate [γ]
p0=104,n0=106
P(M)P(E)
Figure 5.4: Probability of extinction and first mutation of the total population.
We start with a mixed population of normal and persister cells, and allow the population
to perform the above listed processes. The population, over a long duration, might go
extinct because of antibiotic death or survive by undergoing a mutation. We denote the
extinction probability of the total population by P (E) and the mutation (or survival)
probability by P (M). Fig. 5.4 show that the extinction probability P (E) decreases
with the increase in mutation rate and as consequence the mutation probability P (M)
increases. The probabilities P (M) and P (E) for different values of the switching rate
(a=b) are is shown in Fig. 5.5. The figure shows that these probabilities are nearly
independent of the phenotype switching rates. However, the initial persister fraction
that is determined by phenotype switching rates, affects the probability of extinction
and mutation.
5.5 Model : Stochastic dynamics
To analytically calculate expressions for probabilities and first passage times for ex-
tinction and mutation processes, we assume the subpopulation dynamics during the
antibiotic killing to be independent of each other (i.e. assuming the switching rates to
be approximately zero). Therefore, we will first calculate the probability distribution
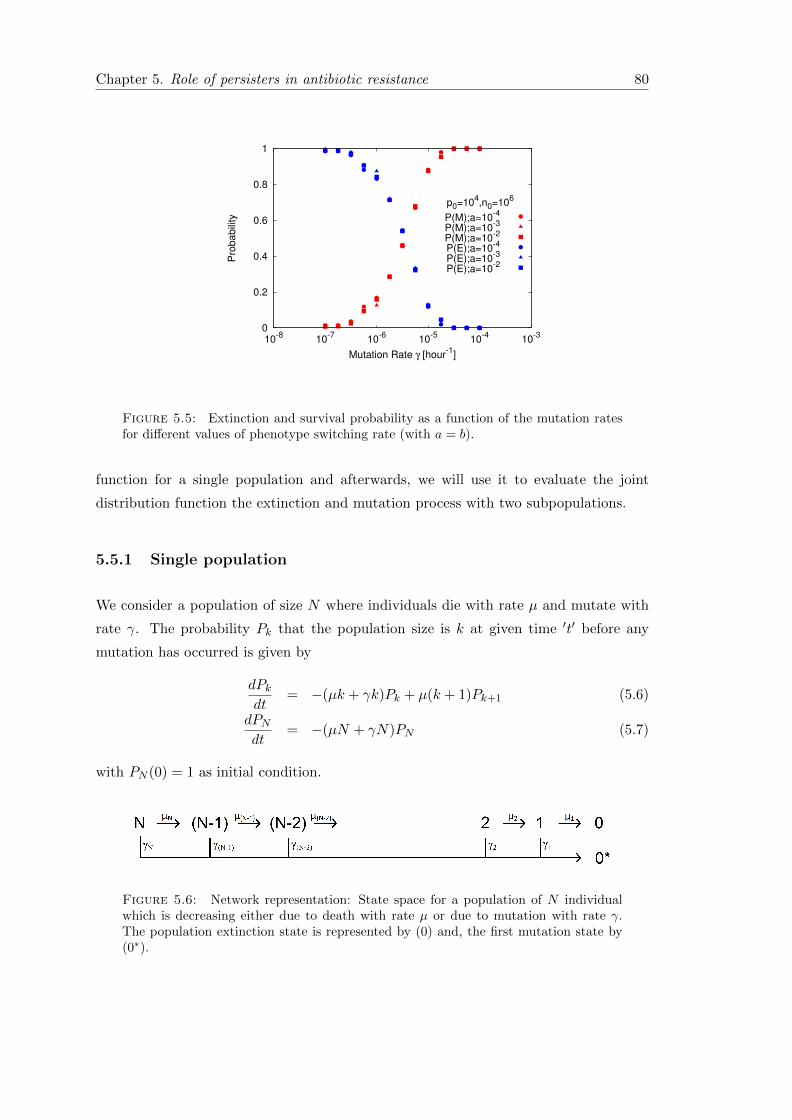
Chapter 5. Role of persisters in antibiotic resistance 80
0
0.2
0.4
0.6
0.8
1
10-310-410-510-610-710-8
Pro
babi
lity
Mutation Rate γ [hour-1]
p0=104,n0=106
P(M);a=10-4
P(M);a=10-3
P(M);a=10-2
P(E);a=10-4
P(E);a=10-3
P(E);a=10-2
Figure 5.5: Extinction and survival probability as a function of the mutation ratesfor different values of phenotype switching rate (with a = b).
function for a single population and afterwards, we will use it to evaluate the joint
distribution function the extinction and mutation process with two subpopulations.
5.5.1 Single population
We consider a population of size N where individuals die with rate µ and mutate with
rate γ. The probability Pk that the population size is k at given time ′t′ before any
mutation has occurred is given by
dPkdt
= −(µk + γk)Pk + µ(k + 1)Pk+1 (5.6)
dPNdt
= −(µN + γN)PN (5.7)
with PN (0) = 1 as initial condition.
Figure 5.6: Network representation: State space for a population of N individualwhich is decreasing either due to death with rate µ or due to mutation with rate γ.The population extinction state is represented by (0) and, the first mutation state by(0∗).
Chapter 5. Role of persisters in antibiotic resistance 81
The probability Pk can be calculated iteratively starting with PN = e−(µ+γ)Nt. The
probability of having a population size k before any mutation is
Pk(t) =
(µ
µ+ γ
)N−k N !
k!(N − k)!
(1− e−(µ+γ)t
)N−ke−(µ+γ)k t. (5.8)
The extinction probability of the population is
P0(t→∞) = P (E) =
(µ
µ+ γ
)N(5.9)
and consequently, the survival probability of the population is
P (M) = 1−(
µ
µ+ γ
)N. (5.10)
The distribution function of the first passage time to extinction is defined as follows,
FE(t) = µP1(t) = µN
(µ
µ+ γ
)N−1 (1− e−(µ+γ)t
)N−1e−(µ+γ)t. (5.11)
Hence, the mean time to extinction is given by
TE =1
ΠE
∫ ∞0
tFE(t)dt (5.12)
where ΠE =∫∞
0 FE(t)dt =(
µµ+γ
)Nis the total probability for extinction. Solving, we
get
TE =1
µ+ γ
N∑i=1
1
i≈ 1
µ+ γlogN. (5.13)
For γ = 0, TE reduces to the average extinction time for a population of size N .
Likewise, the first passage distribution function for mutation is defined as
FM (t) =
N∑k=1
γkPk(t) = γN
(µ
µ+ γ
)N−1(1 +
γ
µe−(µ+γ)t
)N−1
e−(µ+γ)t. (5.14)
The mean time of mutation is given by
TM =1
ΠM
∫ ∞0
tFM (t)dt (5.15)
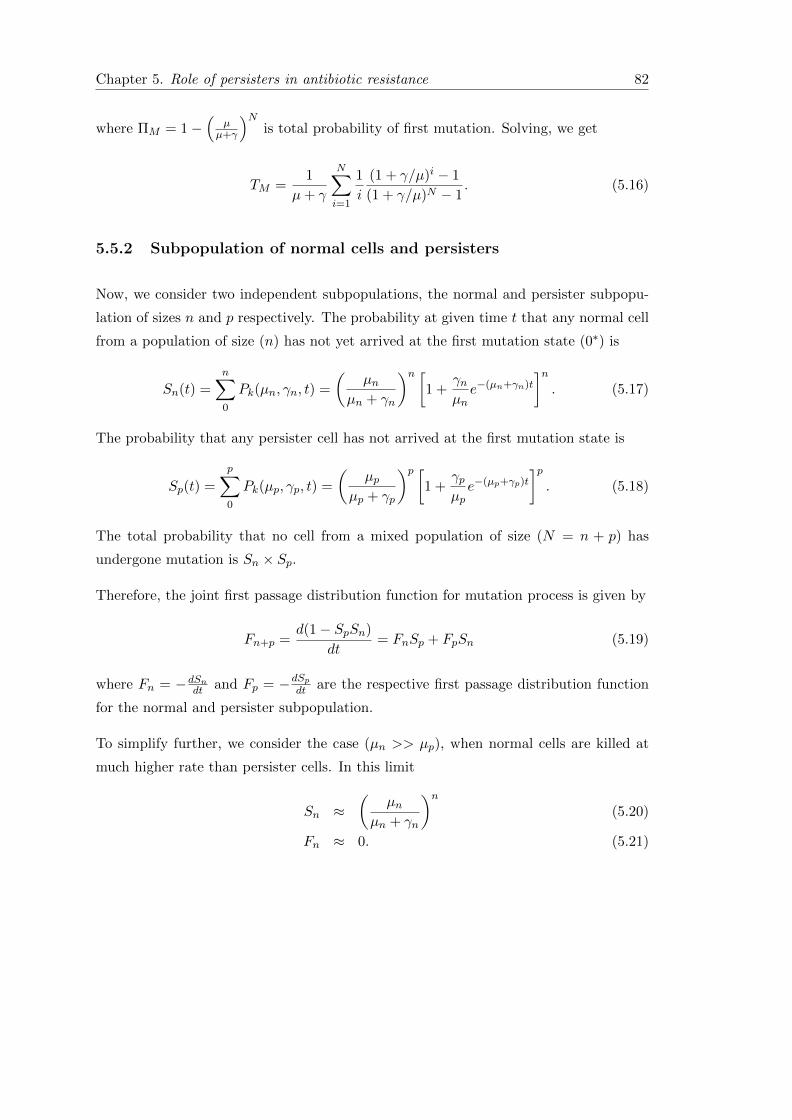
Chapter 5. Role of persisters in antibiotic resistance 82
where ΠM = 1−(
µµ+γ
)Nis total probability of first mutation. Solving, we get
TM =1
µ+ γ
N∑i=1
1
i
(1 + γ/µ)i − 1
(1 + γ/µ)N − 1. (5.16)
5.5.2 Subpopulation of normal cells and persisters
Now, we consider two independent subpopulations, the normal and persister subpopu-
lation of sizes n and p respectively. The probability at given time t that any normal cell
from a population of size (n) has not yet arrived at the first mutation state (0∗) is
Sn(t) =n∑0
Pk(µn, γn, t) =
(µn
µn + γn
)n [1 +
γnµne−(µn+γn)t
]n. (5.17)
The probability that any persister cell has not arrived at the first mutation state is
Sp(t) =
p∑0
Pk(µp, γp, t) =
(µp
µp + γp
)p [1 +
γpµpe−(µp+γp)t
]p. (5.18)
The total probability that no cell from a mixed population of size (N = n + p) has
undergone mutation is Sn × Sp.
Therefore, the joint first passage distribution function for mutation process is given by
Fn+p =d(1− SpSn)
dt= FnSp + FpSn (5.19)
where Fn = −dSndt and Fp = −dSp
dt are the respective first passage distribution function
for the normal and persister subpopulation.
To simplify further, we consider the case (µn >> µp), when normal cells are killed at
much higher rate than persister cells. In this limit
Sn ≈(
µnµn + γn
)n(5.20)
Fn ≈ 0. (5.21)
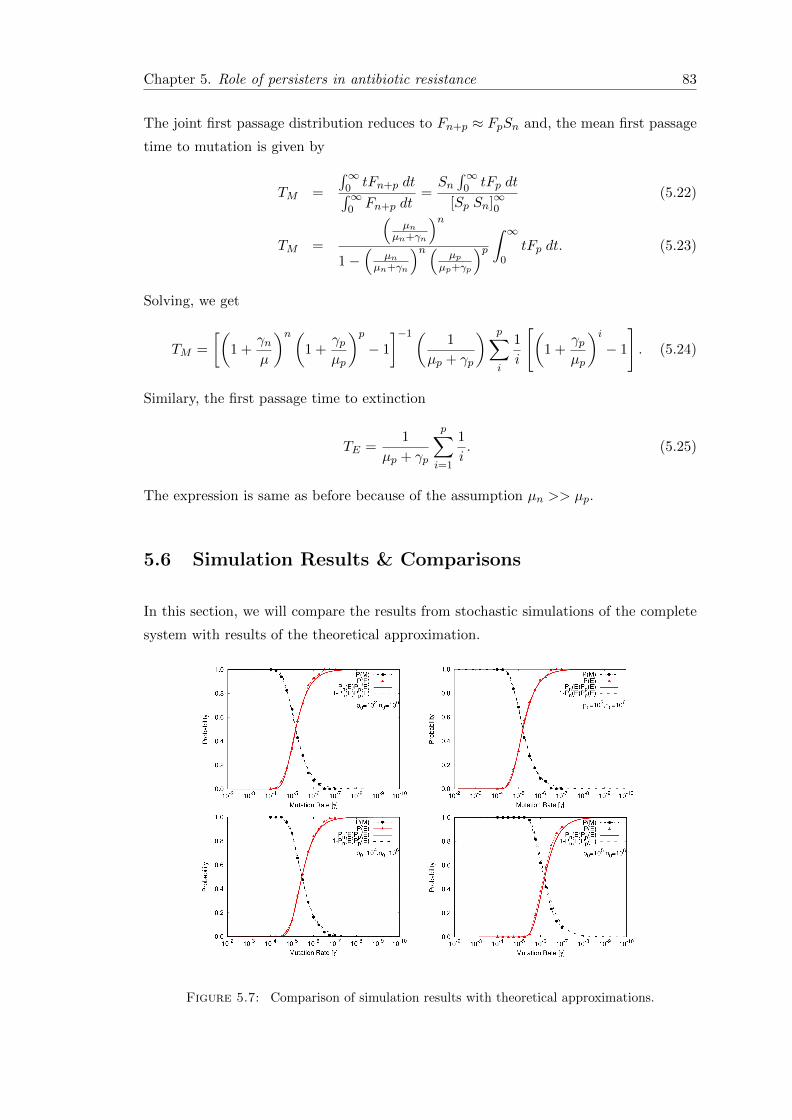
Chapter 5. Role of persisters in antibiotic resistance 83
The joint first passage distribution reduces to Fn+p ≈ FpSn and, the mean first passage
time to mutation is given by
TM =
∫∞0 tFn+p dt∫∞0 Fn+p dt
=Sn∫∞
0 tFp dt
[Sp Sn]∞0(5.22)
TM =
(µn
µn+γn
)n1−
(µn
µn+γn
)n ( µpµp+γp
)p ∫ ∞0
tFp dt. (5.23)
Solving, we get
TM =
[(1 +
γnµ
)n(1 +
γpµp
)p− 1
]−1(1
µp + γp
) p∑i
1
i
[(1 +
γpµp
)i− 1
]. (5.24)
Similary, the first passage time to extinction
TE =1
µp + γp
p∑i=1
1
i. (5.25)
The expression is same as before because of the assumption µn >> µp.
5.6 Simulation Results & Comparisons
In this section, we will compare the results from stochastic simulations of the complete
system with results of the theoretical approximation.
Figure 5.7: Comparison of simulation results with theoretical approximations.
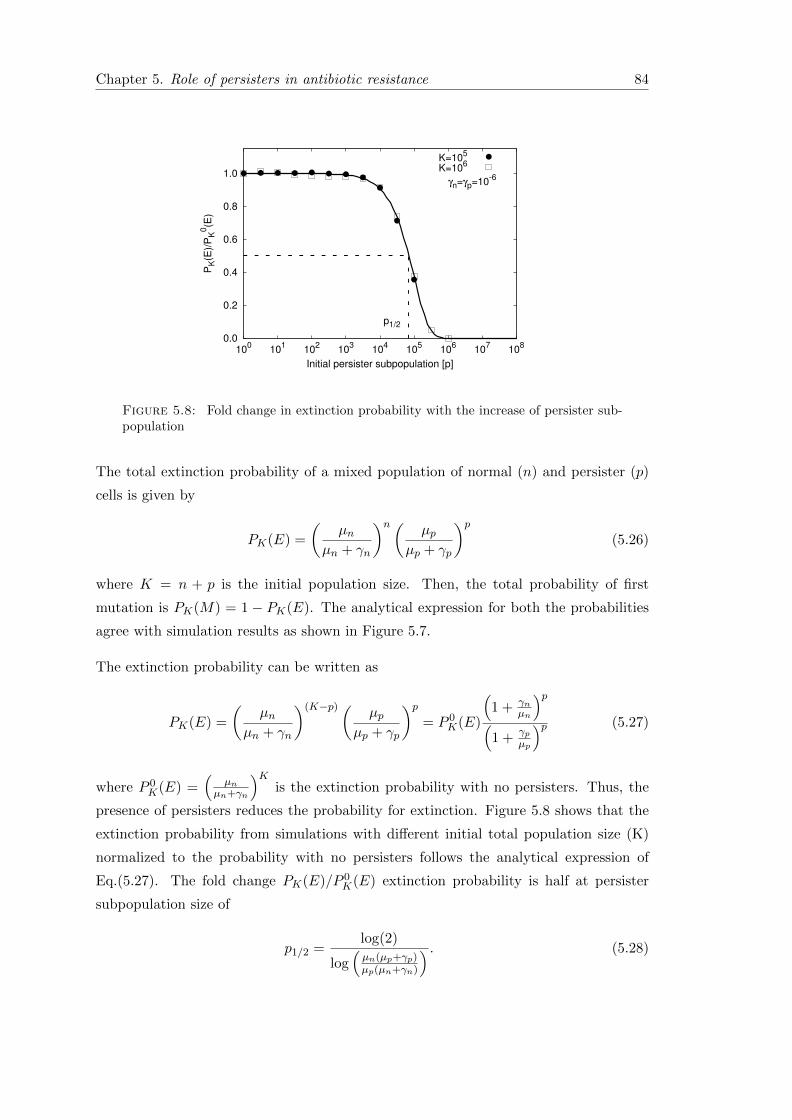
Chapter 5. Role of persisters in antibiotic resistance 84
0.0
0.2
0.4
0.6
0.8
1.0
100 101 102 103 104 105 106 107 108
PK(E
)/P
K0 (E
)
Initial persister subpopulation [p]
γn=γp=10-6
p1/2
K=105
K=106
Figure 5.8: Fold change in extinction probability with the increase of persister sub-population
The total extinction probability of a mixed population of normal (n) and persister (p)
cells is given by
PK(E) =
(µn
µn + γn
)n( µpµp + γp
)p(5.26)
where K = n + p is the initial population size. Then, the total probability of first
mutation is PK(M) = 1 − PK(E). The analytical expression for both the probabilities
agree with simulation results as shown in Figure 5.7.
The extinction probability can be written as
PK(E) =
(µn
µn + γn
)(K−p)( µpµp + γp
)p= P 0
K(E)
(1 + γn
µn
)p(1 +
γpµp
)p (5.27)
where P 0K(E) =
(µn
µn+γn
)Kis the extinction probability with no persisters. Thus, the
presence of persisters reduces the probability for extinction. Figure 5.8 shows that the
extinction probability from simulations with different initial total population size (K)
normalized to the probability with no persisters follows the analytical expression of
Eq.(5.27). The fold change PK(E)/P 0K(E) extinction probability is half at persister
subpopulation size of
p1/2 =log(2)
log(µn(µp+γp)µp(µn+γn)
) . (5.28)
Chapter 5. Role of persisters in antibiotic resistance 85
0
0.2
0.4
0.6
0.8
1
1.2
10-210-310-410-510-610-710-8
PK(E
)/P
K0 (E
)
Mutation rate of persister cells γp [hour-1]
γn=10-4,p=104
γn/γp>µn/µp γn/γp<µn/µp
K=105
Figure 5.9: Fold change in extinction probability with the increase of mutation rateof persisters.
The extinction probabilty of the total population will be reduced only if
γnγp
<µnµp. (5.29)
If mutation rate rate of persisters is decreased below the above limits, the probability
of extinction increases as shown in Figure 5.9. This increase in extinction probability is
due to lower rate of mutation from persister cells in the total population. In this case
the presence of persisters might increase the lifetime of the population but does not help
in developing resistance.
Now, we could understand the dependence of the emergence antibiotic resistance on
the antibiotic concentration. Figure 5.1 shows that the increase in the concentration
of tobramycin increase the death rate of persisters while death rate of normal cells
remain unaffected. This increase in death rate of persisters increases the probability of
extinction of the population (Eq. 5.27), which leads to population extinction.
5.6.1 First passage time
The first passage events to mutational state (0∗) and extinction state (0) defines the
time of first mutation (CMTM) before the normal and persister subpopulation goes
extinct and, the time of extinction (CMTE) of normal and persister subpopulation
before mutation.
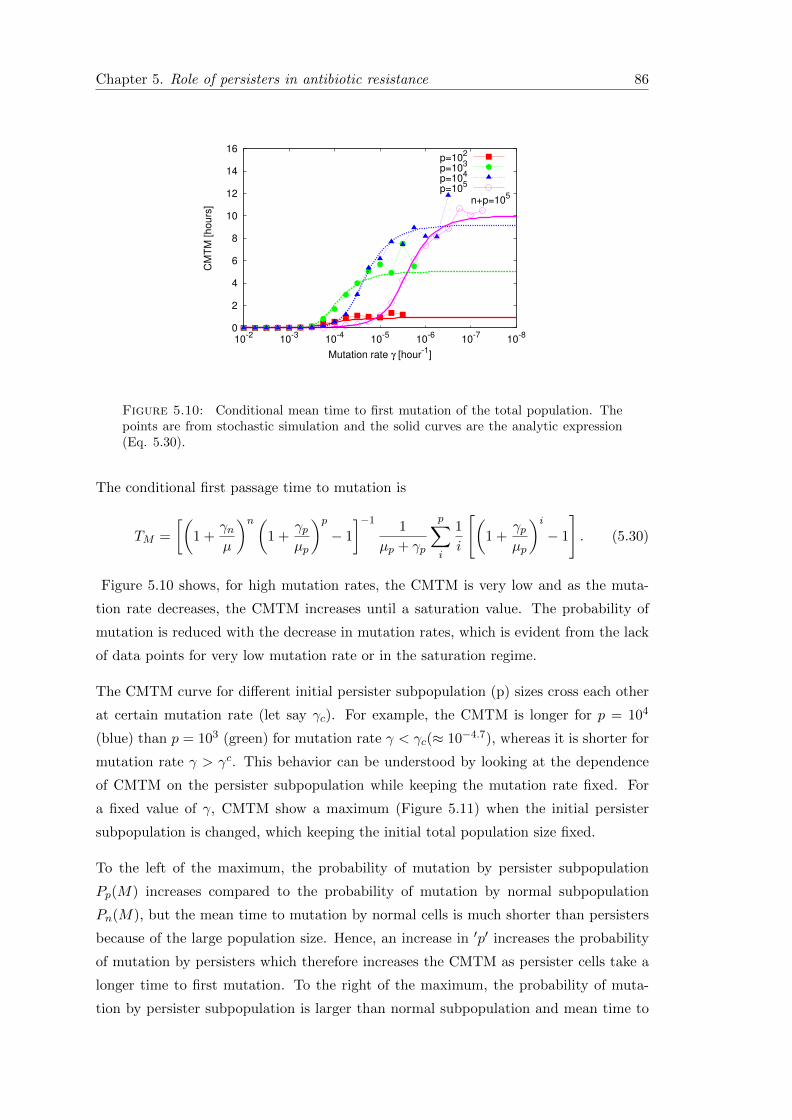
Chapter 5. Role of persisters in antibiotic resistance 86
0
2
4
6
8
10
12
14
16
10-2 10-3 10-4 10-5 10-6 10-7 10-8
CM
TM
[hou
rs]
Mutation rate γ [hour-1]
n+p=105
p=102
p=103
p=104
p=105
Figure 5.10: Conditional mean time to first mutation of the total population. Thepoints are from stochastic simulation and the solid curves are the analytic expression(Eq. 5.30).
The conditional first passage time to mutation is
TM =
[(1 +
γnµ
)n(1 +
γpµp
)p− 1
]−11
µp + γp
p∑i
1
i
[(1 +
γpµp
)i− 1
]. (5.30)
Figure 5.10 shows, for high mutation rates, the CMTM is very low and as the muta-
tion rate decreases, the CMTM increases until a saturation value. The probability of
mutation is reduced with the decrease in mutation rates, which is evident from the lack
of data points for very low mutation rate or in the saturation regime.
The CMTM curve for different initial persister subpopulation (p) sizes cross each other
at certain mutation rate (let say γc). For example, the CMTM is longer for p = 104
(blue) than p = 103 (green) for mutation rate γ < γc(≈ 10−4.7), whereas it is shorter for
mutation rate γ > γc. This behavior can be understood by looking at the dependence
of CMTM on the persister subpopulation while keeping the mutation rate fixed. For
a fixed value of γ, CMTM show a maximum (Figure 5.11) when the initial persister
subpopulation is changed, which keeping the initial total population size fixed.
To the left of the maximum, the probability of mutation by persister subpopulation
Pp(M) increases compared to the probability of mutation by normal subpopulation
Pn(M), but the mean time to mutation by normal cells is much shorter than persisters
because of the large population size. Hence, an increase in ′p′ increases the probability
of mutation by persisters which therefore increases the CMTM as persister cells take a
longer time to first mutation. To the right of the maximum, the probability of muta-
tion by persister subpopulation is larger than normal subpopulation and mean time to
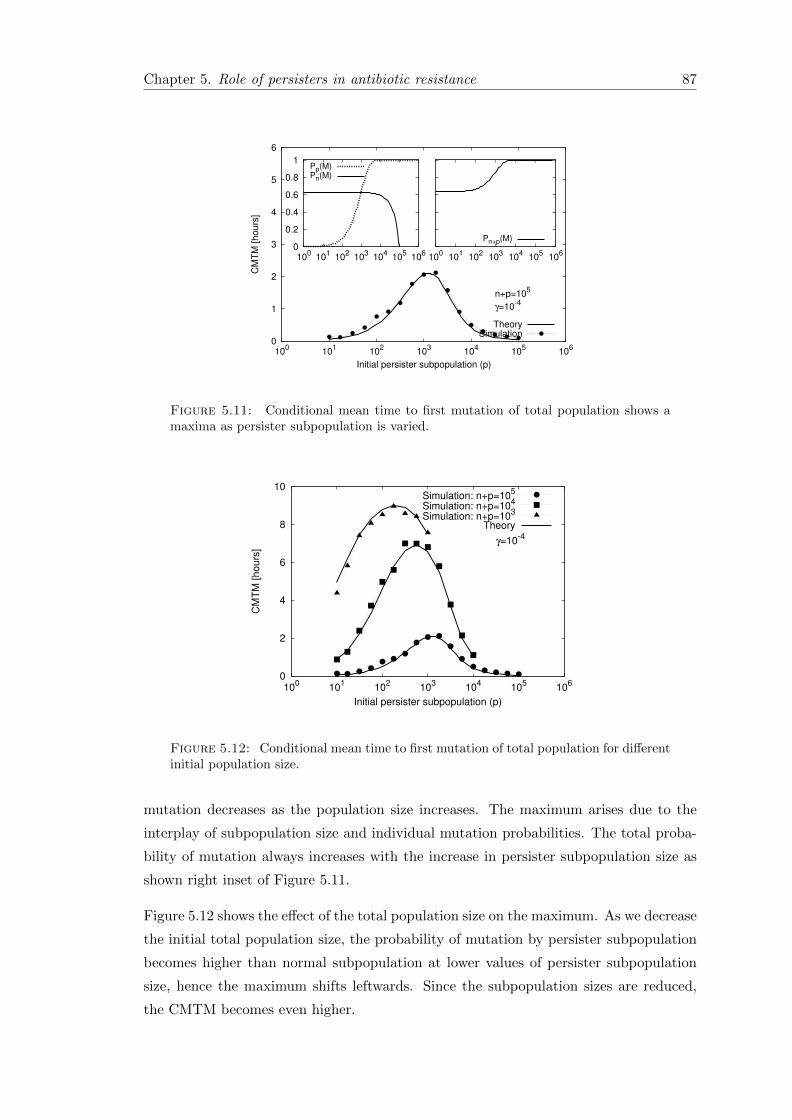
Chapter 5. Role of persisters in antibiotic resistance 87
0
1
2
3
4
5
6
100 101 102 103 104 105 106
CM
TM
[hou
rs]
Initial persister subpopulation (p)
n+p=105
γ=10-4
TheorySimulation
0
0.2
0.4
0.6
0.8
1
100 101 102 103 104 105 106
Pp(M)Pn(M)
100 101 102 103 104 105 106
Pn+p(M)
Figure 5.11: Conditional mean time to first mutation of total population shows amaxima as persister subpopulation is varied.
0
2
4
6
8
10
100 101 102 103 104 105 106
CM
TM
[hou
rs]
Initial persister subpopulation (p)
γ=10-4
Simulation: n+p=105
Simulation: n+p=104
Simulation: n+p=103
Theory
Figure 5.12: Conditional mean time to first mutation of total population for differentinitial population size.
mutation decreases as the population size increases. The maximum arises due to the
interplay of subpopulation size and individual mutation probabilities. The total proba-
bility of mutation always increases with the increase in persister subpopulation size as
shown right inset of Figure 5.11.
Figure 5.12 shows the effect of the total population size on the maximum. As we decrease
the initial total population size, the probability of mutation by persister subpopulation
becomes higher than normal subpopulation at lower values of persister subpopulation
size, hence the maximum shifts leftwards. Since the subpopulation sizes are reduced,
the CMTM becomes even higher.
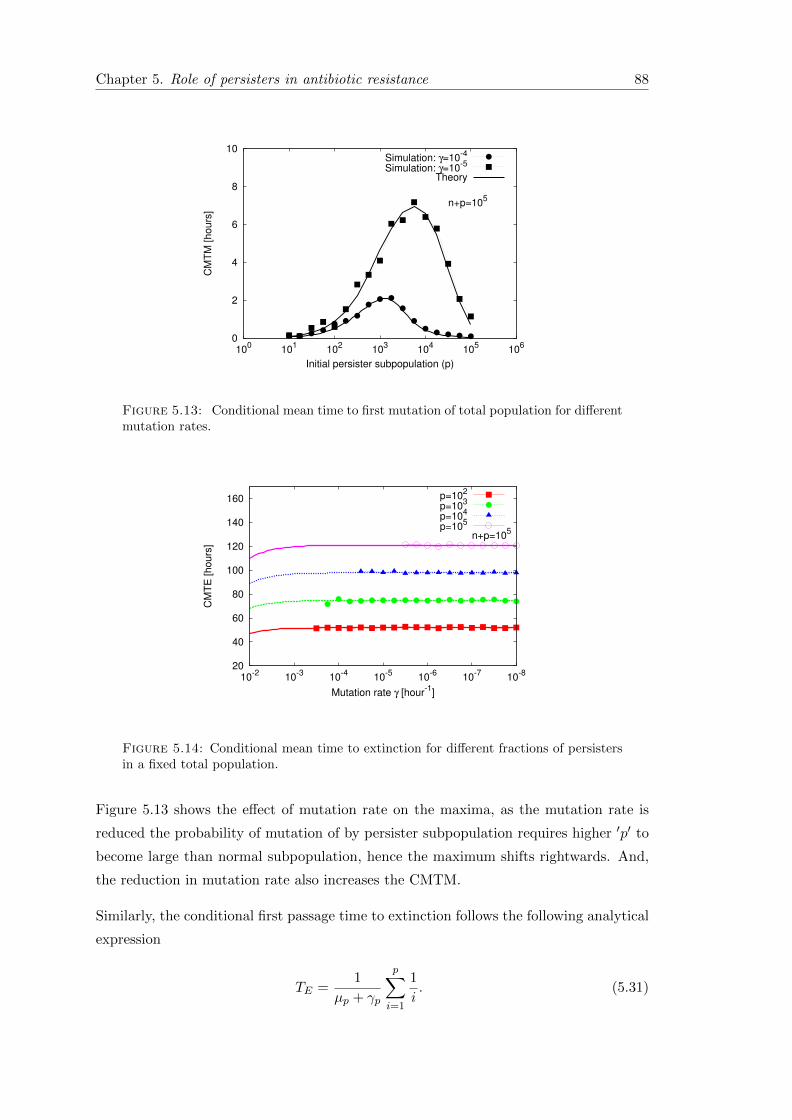
Chapter 5. Role of persisters in antibiotic resistance 88
0
2
4
6
8
10
100 101 102 103 104 105 106
CM
TM
[hou
rs]
Initial persister subpopulation (p)
n+p=105
Simulation: γ=10-4
Simulation: γ=10-5
Theory
Figure 5.13: Conditional mean time to first mutation of total population for differentmutation rates.
20
40
60
80
100
120
140
160
10-2 10-3 10-4 10-5 10-6 10-7 10-8
CM
TE
[hou
rs]
Mutation rate γ [hour-1]
n+p=105
p=102
p=103
p=104
p=105
Figure 5.14: Conditional mean time to extinction for different fractions of persistersin a fixed total population.
Figure 5.13 shows the effect of mutation rate on the maxima, as the mutation rate is
reduced the probability of mutation of by persister subpopulation requires higher ′p′ to
become large than normal subpopulation, hence the maximum shifts rightwards. And,
the reduction in mutation rate also increases the CMTM.
Similarly, the conditional first passage time to extinction follows the following analytical
expression
TE =1
µp + γp
p∑i=1
1
i. (5.31)
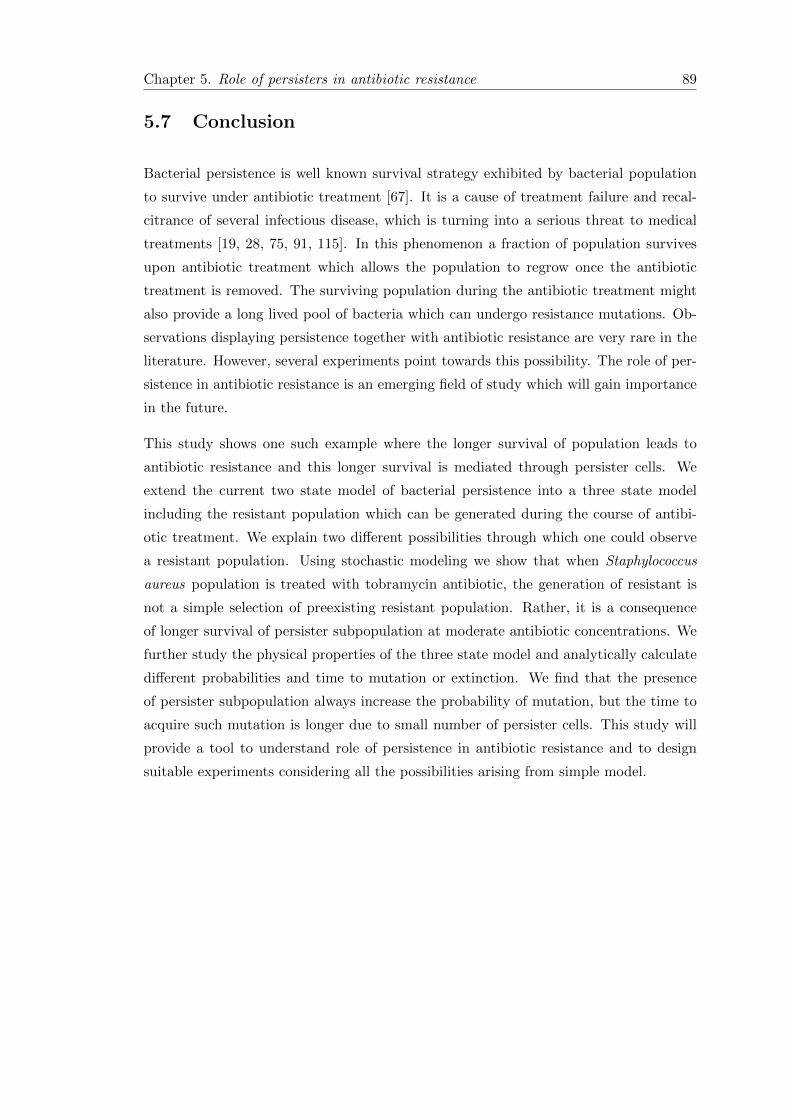
Chapter 5. Role of persisters in antibiotic resistance 89
5.7 Conclusion
Bacterial persistence is well known survival strategy exhibited by bacterial population
to survive under antibiotic treatment [67]. It is a cause of treatment failure and recal-
citrance of several infectious disease, which is turning into a serious threat to medical
treatments [19, 28, 75, 91, 115]. In this phenomenon a fraction of population survives
upon antibiotic treatment which allows the population to regrow once the antibiotic
treatment is removed. The surviving population during the antibiotic treatment might
also provide a long lived pool of bacteria which can undergo resistance mutations. Ob-
servations displaying persistence together with antibiotic resistance are very rare in the
literature. However, several experiments point towards this possibility. The role of per-
sistence in antibiotic resistance is an emerging field of study which will gain importance
in the future.
This study shows one such example where the longer survival of population leads to
antibiotic resistance and this longer survival is mediated through persister cells. We
extend the current two state model of bacterial persistence into a three state model
including the resistant population which can be generated during the course of antibi-
otic treatment. We explain two different possibilities through which one could observe
a resistant population. Using stochastic modeling we show that when Staphylococcus
aureus population is treated with tobramycin antibiotic, the generation of resistant is
not a simple selection of preexisting resistant population. Rather, it is a consequence
of longer survival of persister subpopulation at moderate antibiotic concentrations. We
further study the physical properties of the three state model and analytically calculate
different probabilities and time to mutation or extinction. We find that the presence
of persister subpopulation always increase the probability of mutation, but the time to
acquire such mutation is longer due to small number of persister cells. This study will
provide a tool to understand role of persistence in antibiotic resistance and to design
suitable experiments considering all the possibilities arising from simple model.

Chapter 6
Discussion & Summary
In the preceding chapters, we have presented some theoretical and experimental results
that identify several aspects of bacterial persistence in different environmental condi-
tions [72, 96, 97]. The first notion about the presence of drug tolerant persisters, the
culprit behind persistence against antibiotics, in a population was made 60 years ago
[7], nonetheless the present understanding about the physiology of persisters and, the
mechanism of their emergence is limited [3]. The main window into persistence is the
study of survival of populations over time upon antibiotic treatment [4, 53, 55, 71]. The
results from such studies are explained and interpreted using a model for stochastic
phenotype switching between two cellular states, namely the normal state and the per-
sister state. However, the existing analysis of this model does not provide an explicit
relation among experimental observations and model parameters. We analyzed an ex-
isting model using a simple approximation method to answer this issue, and calculated
analytic expressions for measuring model parameters for persistence in time-shift exper-
iments [97]. To illustrate our analysis, we computed model parameters for S. aureus
populations under multiple drugs at different concentrations. Further, we extended our
analysis to understand qualitatively the outcome of cross-drug treatment on a bacterial
population.
The previous theoretical studies have identified bacterial persistence as a survival mech-
anism that population has developed to deal with temporally fluctuating environments
[29, 66–68]. We showed that bacterial persistence also plays a significant role in several
other realistic situations, such as help in spatial expansion, emergence of antibiotic re-
sistance and development of multidrug tolerance in bacterial populations [72, 96, 97].
Thus, our results extend the current knowledge of bacterial persistence and, furthermore,
provide a toolbox for designing and analyzing experiments.
91
Chapter 6. Discussion & Summary 92
In the following sections, we will summarize the main results of the manuscripts included
in this thesis and give an outlook.
6.1 Overview of the main results
Bacterial persistence in temporally varying environments. Bacterial popula-
tions tackle sudden environmental stresses by keeping a small fraction of the total pop-
ulation, the persister cells, in a slow-growing but stress-tolerant phenotype state [67].
The persister cells cause a small fitness cost to the total population under growth sup-
porting conditions, but provide a large benefit by withstanding antibiotic attacks. Once
the growth conditions are restored, the population can recover from surviving persis-
ter cells via a phenotypic switch to normal growing state. The underlying population
dynamics is well described by a two state model, which considers exponential growth
of the subpopulations coupled with phenotype switching between the subpopulations
[4]. We analyzed this mathematical model using a simple approximation valid for small
phenotype switching rates that allows to map the dynamics of subpopulation ratio to
a logistic equation [97]. This indicates that under constant conditions, the effective
growth rate of the persister (slow-growing) subpopulation approaches the growth rate
of the normal (fast-growing) subpopulation in a logistic fashion. The steady state in
the subpopulation ratio is achieved by a balance between fast-growing cells outgrowing
the slow-growing ones and phenotype switching, by which the slow-growing cells are re-
plenished from the fast growing cells. Therefore, a primary determinant of the persister
fraction in a population is the switching rate from the normal to the persister state. A
recent study, characterizing persistence in three strains (SC552, SC649, MG1655) of E.
coli against three antibiotics (ampicilin, ciprofloxacin and nalidixic acid), observed this
dependence. The study showed that the fractions of persisters in a population and the
rate of switching from the normal to the persister state are strongly correlated across
both strains and antibiotics [45].
We then investigated the population dynamics during environment shifts from growth to
stress and vice-versa. We calculated analytical expression of the characteristic time scale
for changes in the total population growth or decay and for approaching a constant ratio
in subpopulations. These analytical expressions can be used to extract switching rates
by following the population dynamics in environment shift experiments. Moreover, using
our simple theoretical approach, we could also show that under periodically fluctuating
environment, when the growth and stress periods have long duration, the phenotype
switching rates can be tuned for optimal growth of the total population, confirming
results from previous studies [67–69]. Additionally, we showed that, in case when one of
Chapter 6. Discussion & Summary 93
the environmental duration (growth or stress) is brief, the phenotype switching cannot
be optimally tuned and the increase in phenotype switching progressively reduces the
growth rate of the total population [97]. In summary, using the basic model we could look
at various aspects of bacterial persistence mechanism which have not been considered
before.
Dynamics of phenotype switching in non-uniform spatial environments. Spa-
tially structured environments are often used to study evolution in bacterial populations,
they play, e.g., an important role in the emergence of drug resistance [41, 56, 70, 102,
103, 137]. In the highly compartmentalized human body, different organs and tissues
usually have different pharmacokinetic parameters that often lead to non-uniform dis-
tribution of antibiotics [6, 12, 92]. Persister cells being less sensitive to antibiotics, could
assist a population to cross a region of high antibiotic concentrations or other stress-
ful environments that otherwise might act as a bottleneck to population expansion in
non-uniform spatial environments. Therefore, to investigate the role of persister cells in
population expansion, we studied the expansion of a phenotypically heterogeneous pop-
ulation in a spatial environment consisting of two growth sustaining patches separated
by an antibiotic patch [96].
We have calculated the mean first arrival time (MFAT) of a cell to the third patch (i.e.
the growth supporting patch) in a population with and without persisters. We found that
the time to cross an antibiotic patch is reduced in the presence of drug tolerant persisters
in a population. Specifically, we observed that the MFAT of the subpopulations depends
on the phenotype switching and migration rates, and show three distinct scaling regimes
as the migration rate is varied. We explained these different regimes by means of an
analytical approximation. Furthermore, we identified regions in the parameter space
(of phenotype switching and migration rate), where phenotype switching is beneficial
to the population expansion. This basic model can be applied to several situations
where a population encounters adverse environmental conditions while expanding into
other growth permitting regions. For example, hospital acquired infections occur in
a similar fashion, where bacterial infection is transmitted from an infected individual
to an uninfected individual through several routes such as physical contacts, airborne
transmission, common equipment usage [20, 77], etc.
Multidrug-tolerance in Staphylococcus aureus. In Chapter 4 of the thesis, we
analyzed results from an experiment using the theoretical expressions obtained in Chap-
ter 2. We used the data from antibiotic killing and resuscitation experiments performed
on Staphylococcus aureus population under different antibiotics, to obtain important
parameters such as persister fraction, switching rates, death rates, etc. We found that
different antibiotics select different fraction of persisters. To test the importance of the
Chapter 6. Discussion & Summary 94
results, we performed a statistical hypothesis test (t-test) that quantifies how signifi-
cant is the difference between the survival persister fraction against different antibiotics
compared to the measurement error within the repeats of an experiment.
The survival of different fractions of populations indicates that the persisters selected
might have a different physiology. A test to determine the physiology was performed by
our collaborators through a cross-drug treatment experiment, where survivors from one
antibiotic treatment were exposed to another antibiotic. We extended our analysis to
predict the outcome of this cross-drug tolerance experiment. Specifically, we proposed
three possible outcomes, i.e., zero cross tolerance, full cross tolerance and partial cross
tolerance. We found that the persister cells selected by one antibiotic either show full tol-
erance or zero tolerance to the second antibiotic. Surprisingly, the fate of the population
was found out to be dependent on the order of antibiotic treatment, under one order the
population could survive and in another the population went extinct. This suggests that
persisters selected with some antibiotics may develop full tolerance to other antibiotics.
We also reported model parameters for several strains of S. aureus (menD, hemB, HG’s)
under different antibiotics (appendix A.2).
Role of persisters in the emergence of antibiotic resistance. Bacteria have
developed, over the years, mechanisms to survive attack from antibiotics designed to
eliminate them, one such mechanism is antibiotic resistance [61, 94, 117]. Most of the
earlier developed drugs against infectious diseases have lost potency because the targeted
pathogens became resistant against them [18]. Several studies have suggested that the
longer survival of a population due to the persister cells may help in the emergence of
antibiotic resistance [73, 117, 131]. Our collaborators observed the emergence of antibi-
otic resistant cells in Staphylococcus aureus populations upon treatment with antibiotics
rifampicin and tobramycin. In case of rifampicin treatment, the population started to
grow within 3-4 hours of treatment and the dynamics was unperturbed with the increase
in antibiotic concentration. This implies that the resistant cells might be pre-existing
in the population and, were selected upon antibiotic treatment [120, 126]. In case of
tobramycin, the population started to grow after 8 hours of antibiotic treatment and the
emergence of resistance was found to be dependent on the concentration of antibiotic.
This suggests that the resistant cells might have emerged from the population during
antibiotic treatment. To explain the experimental results, we extended the two state
model to a three state model consisting two phenotypic states and one resistant state.
We found that stochastic trajectories predicted by the model agree with the experimen-
tal results. We further performed a theoretical analysis of this model, and found that
the probability of mutation to the resistant state is enhanced in the presence of persister
subpopulation. We also observed that the time to mutation first increases, with the
increase in persister subpopulation, to a maximum and then decrease afterwards. Our
Chapter 6. Discussion & Summary 95
theoretical analysis presents a tool to develop further experiments to understand the
role of persister cells in emergence of antibiotic resistance.
6.2 Outlook
The present study on bacterial persistence can be extended in several directions. For
instance, the spatial structure that we have used to study spatial expansion of a het-
erogeneous population can be easily realized in experiments [70]. The benefit of having
persisters can be quantified, first by separately using different strains displaying either
lower [79] or higher [88] persister fraction to measure the arrival time and then compet-
ing them against each other [56]. Similarly, the theoretical analysis presented in chapter
5 can be used for further systematic studies to understand the role of persisters in the
emergence of antibiotic resistance. For example, one could study the effect of the change
in concentration of antibiotics, in a killing experiments, on the emergence time of the
resistant population and compare with the theoretical expressions.
The processes or conditions responsible for the evolution of persistence are unclear.
Most theoretical studies suggest that phenotype switching rates might evolve towards
an optimal value in periodically fluctuating conditions [29, 66–68]. Also, the fraction of
persisters is found to increase under repeated exposure of antibiotics [88, 91]. However,
a proper realization of this evolutionary process has not been achieved. Such a study
would provide the rate at which persister frequency evolves in a population, which could
help to control the dosage and duration of the antibiotics for efficient treatments.
The existing theoretical models for bacterial persistence considers phenotype switching
rates to be independent of environmental conditions. However, certain antibiotics are
known to induce the persister phenotype [21, 22], and growth limiting conditions, such
as nutrient depletion or entry to stationary phase, are also shown to increase persister
fraction [53]. These environmental effects must be considered while studying population
dynamics or understanding experimental results. The environmental effects such as
induced persistence and stress responses, in addition to selection pressure might influence
the evolutionary dynamics of a population. Therefore, a systematic study including all
these environmental interactions must be performed to understand the emergence of
persistence.
Chapter 6. Discussion & Summary 96
6.3 Summary
In this thesis, we studied a survival mechanism termed ’bacterial persistence’ exhibited
by most bacterial populations. This mechanism finds implication in antibiotic therapy
failures and emergence of drug resistance in several pathogenic bacteria such as Mycobac-
terium tuberculosis, Staphylococcus aureus, Pseudomonas aeruginosa, Escherichia coli
etc. We studied a known two state phenotype switching model for bacterial persistence
with a new theoretical approach valid only for small switching rate, which is usually the
case. Using our approximation method, we expressed the parameters of the model in
terms of experimentally observed time scales and recapitulated known results that show
the existence of an optimal switching which maximizes the population growth rate in
periodic fluctuating environments. Additionally, using this approach, we showed that if
one of the environmental duration is short in a periodic fluctuating environment, the in-
crease in phenotype switching decreases the overall growth rate and serves as a harmful
strategy for the population. Using our theoretical analysis we characterize the dynamics
of multidrug tolerance in S. aureus populations. We found that the population dynamics
in a cross antibiotic treatment is complex and, indicates that drug tolerance in S. aureus
populations is a combination of population selection and adaptive response to antibi-
otics. Next, we considered the expansion of a population exhibiting phenotype switching
in an environment with non-uniform antibiotic distribution and found that the presence
of persister cells can accelerate the population expansion rate by helping the population
to a cross region of high concentration faster. Further, we considered another important
aspect of bacterial persistence, i.e. the emergence of antibiotic resistance from persister
cells. We explained the experimental observations showing antibiotic resistance in S.
aureus against anitbiotic tobramycin, using stochastic analysis of an extended model
of bacterial persistence that allows mutation of cells to resistant state. In summary, in
this thesis we have analyzed several aspects of bacterial persistence mechanism under
changing environments, such as multidrug tolerance, population expansion and antibi-
otic resistance.
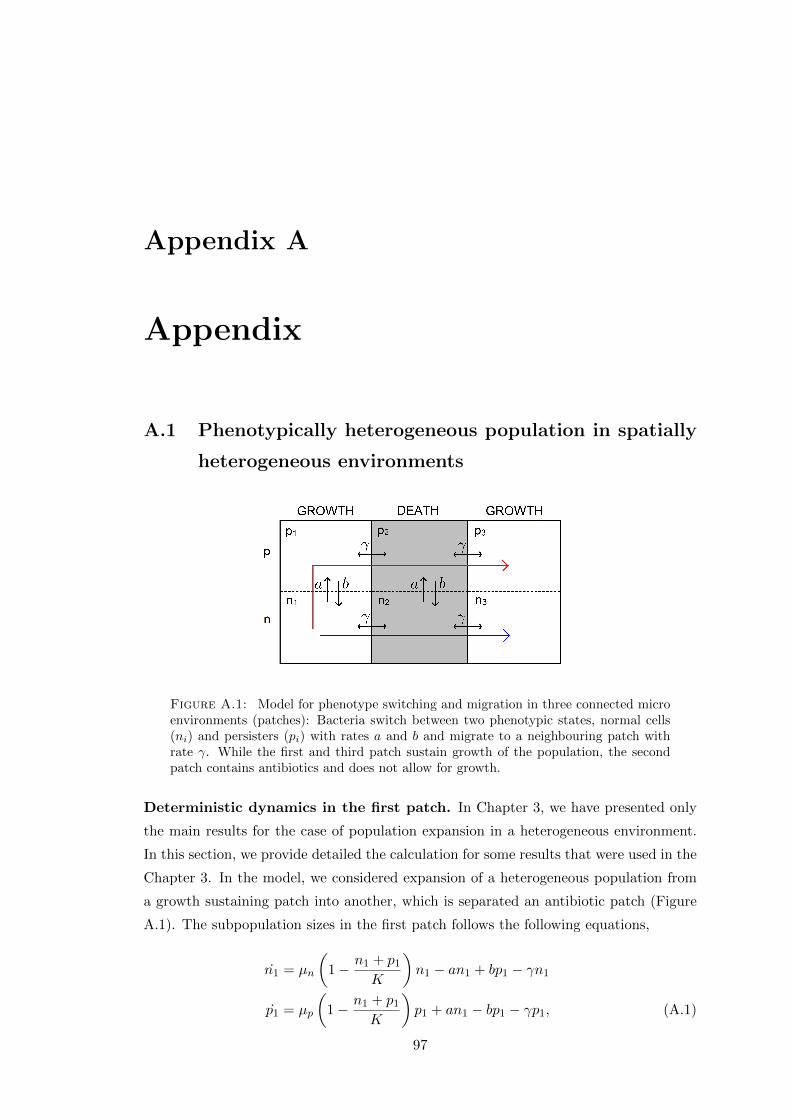
Appendix A
Appendix
A.1 Phenotypically heterogeneous population in spatially
heterogeneous environments
Figure A.1: Model for phenotype switching and migration in three connected microenvironments (patches): Bacteria switch between two phenotypic states, normal cells(ni) and persisters (pi) with rates a and b and migrate to a neighbouring patch withrate γ. While the first and third patch sustain growth of the population, the secondpatch contains antibiotics and does not allow for growth.
Deterministic dynamics in the first patch. In Chapter 3, we have presented only
the main results for the case of population expansion in a heterogeneous environment.
In this section, we provide detailed the calculation for some results that were used in the
Chapter 3. In the model, we considered expansion of a heterogeneous population from
a growth sustaining patch into another, which is separated an antibiotic patch (Figure
A.1). The subpopulation sizes in the first patch follows the following equations,
n1 = µn
(1− n1 + p1
K
)n1 − an1 + bp1 − γn1
p1 = µp
(1− n1 + p1
K
)p1 + an1 − bp1 − γp1, (A.1)
97
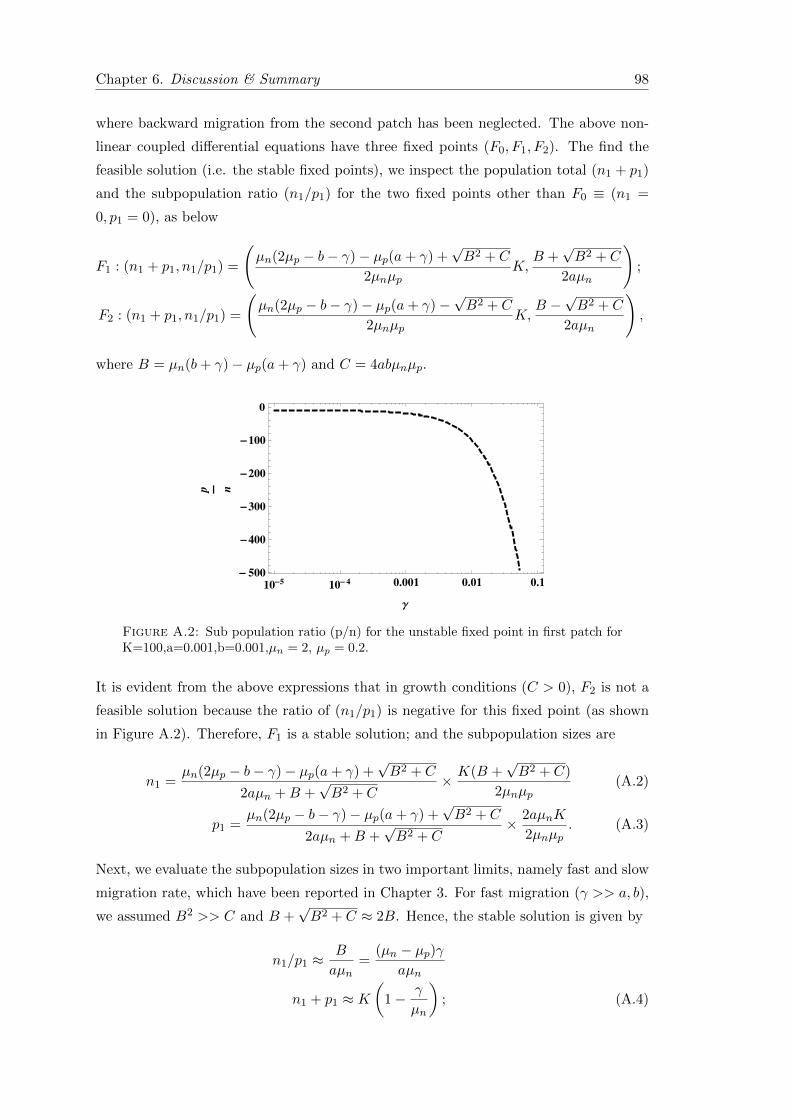
Chapter 6. Discussion & Summary 98
where backward migration from the second patch has been neglected. The above non-
linear coupled differential equations have three fixed points (F0, F1, F2). The find the
feasible solution (i.e. the stable fixed points), we inspect the population total (n1 + p1)
and the subpopulation ratio (n1/p1) for the two fixed points other than F0 ≡ (n1 =
0, p1 = 0), as below
F1 : (n1 + p1, n1/p1) =
(µn(2µp − b− γ)− µp(a+ γ) +
√B2 + C
2µnµpK,
B +√B2 + C
2aµn
);
F2 : (n1 + p1, n1/p1) =
(µn(2µp − b− γ)− µp(a+ γ)−
√B2 + C
2µnµpK,
B −√B2 + C
2aµn
),
where B = µn(b+ γ)− µp(a+ γ) and C = 4abµnµp.
10-5 10- 4 0.001 0.01 0.1- 500
-400
-300
-200
-100
0
Γ
p n
Figure A.2: Sub population ratio (p/n) for the unstable fixed point in first patch forK=100,a=0.001,b=0.001,µn = 2, µp = 0.2.
It is evident from the above expressions that in growth conditions (C > 0), F2 is not a
feasible solution because the ratio of (n1/p1) is negative for this fixed point (as shown
in Figure A.2). Therefore, F1 is a stable solution; and the subpopulation sizes are
n1 =µn(2µp − b− γ)− µp(a+ γ) +
√B2 + C
2aµn +B +√B2 + C
× K(B +√B2 + C)
2µnµp(A.2)
p1 =µn(2µp − b− γ)− µp(a+ γ) +
√B2 + C
2aµn +B +√B2 + C
× 2aµnK
2µnµp. (A.3)
Next, we evaluate the subpopulation sizes in two important limits, namely fast and slow
migration rate, which have been reported in Chapter 3. For fast migration (γ >> a, b),
we assumed B2 >> C and B +√B2 + C ≈ 2B. Hence, the stable solution is given by
n1/p1 ≈B
aµn=
(µn − µp)γaµn
n1 + p1 ≈ K(
1− γ
µn
); (A.4)
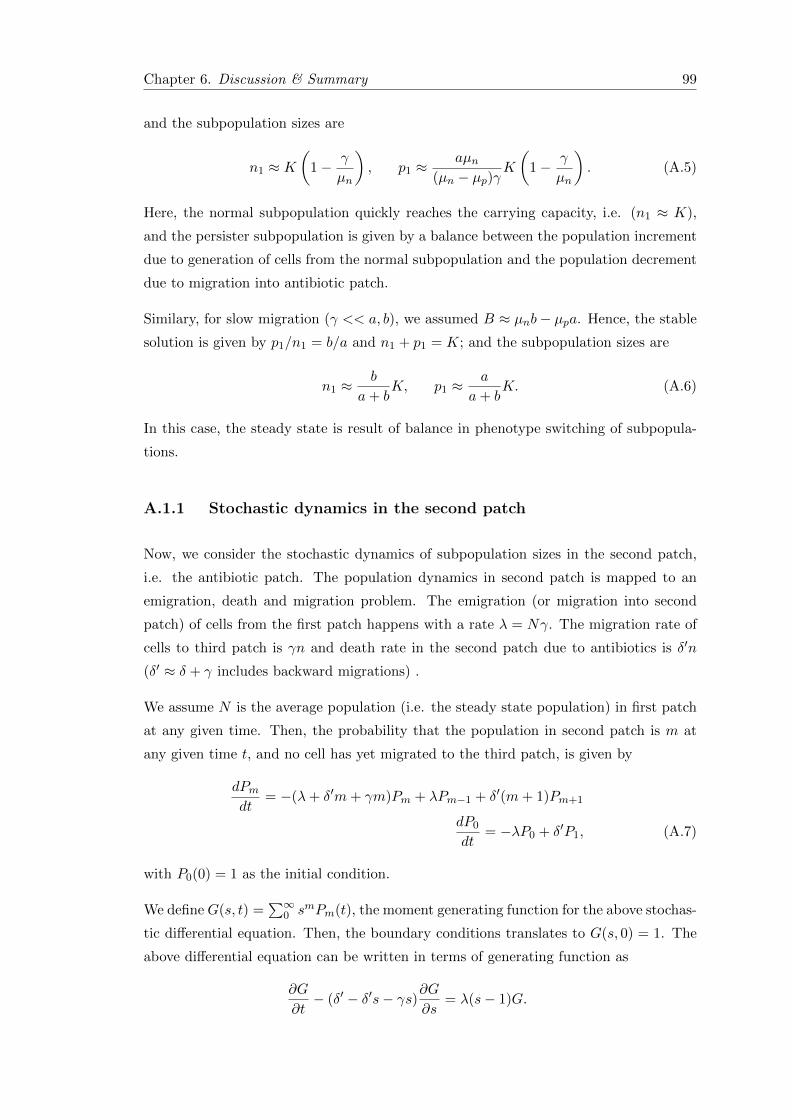
Chapter 6. Discussion & Summary 99
and the subpopulation sizes are
n1 ≈ K(
1− γ
µn
), p1 ≈
aµn(µn − µp)γ
K
(1− γ
µn
). (A.5)
Here, the normal subpopulation quickly reaches the carrying capacity, i.e. (n1 ≈ K),
and the persister subpopulation is given by a balance between the population increment
due to generation of cells from the normal subpopulation and the population decrement
due to migration into antibiotic patch.
Similary, for slow migration (γ << a, b), we assumed B ≈ µnb− µpa. Hence, the stable
solution is given by p1/n1 = b/a and n1 + p1 = K; and the subpopulation sizes are
n1 ≈b
a+ bK, p1 ≈
a
a+ bK. (A.6)
In this case, the steady state is result of balance in phenotype switching of subpopula-
tions.
A.1.1 Stochastic dynamics in the second patch
Now, we consider the stochastic dynamics of subpopulation sizes in the second patch,
i.e. the antibiotic patch. The population dynamics in second patch is mapped to an
emigration, death and migration problem. The emigration (or migration into second
patch) of cells from the first patch happens with a rate λ = Nγ. The migration rate of
cells to third patch is γn and death rate in the second patch due to antibiotics is δ′n
(δ′ ≈ δ + γ includes backward migrations) .
We assume N is the average population (i.e. the steady state population) in first patch
at any given time. Then, the probability that the population in second patch is m at
any given time t, and no cell has yet migrated to the third patch, is given by
dPmdt
= −(λ+ δ′m+ γm)Pm + λPm−1 + δ′(m+ 1)Pm+1
dP0
dt= −λP0 + δ′P1, (A.7)
with P0(0) = 1 as the initial condition.
We defineG(s, t) =∑∞
0 smPm(t), the moment generating function for the above stochas-
tic differential equation. Then, the boundary conditions translates to G(s, 0) = 1. The
above differential equation can be written in terms of generating function as
∂G
∂t− (δ′ − δ′s− γs)∂G
∂s= λ(s− 1)G.
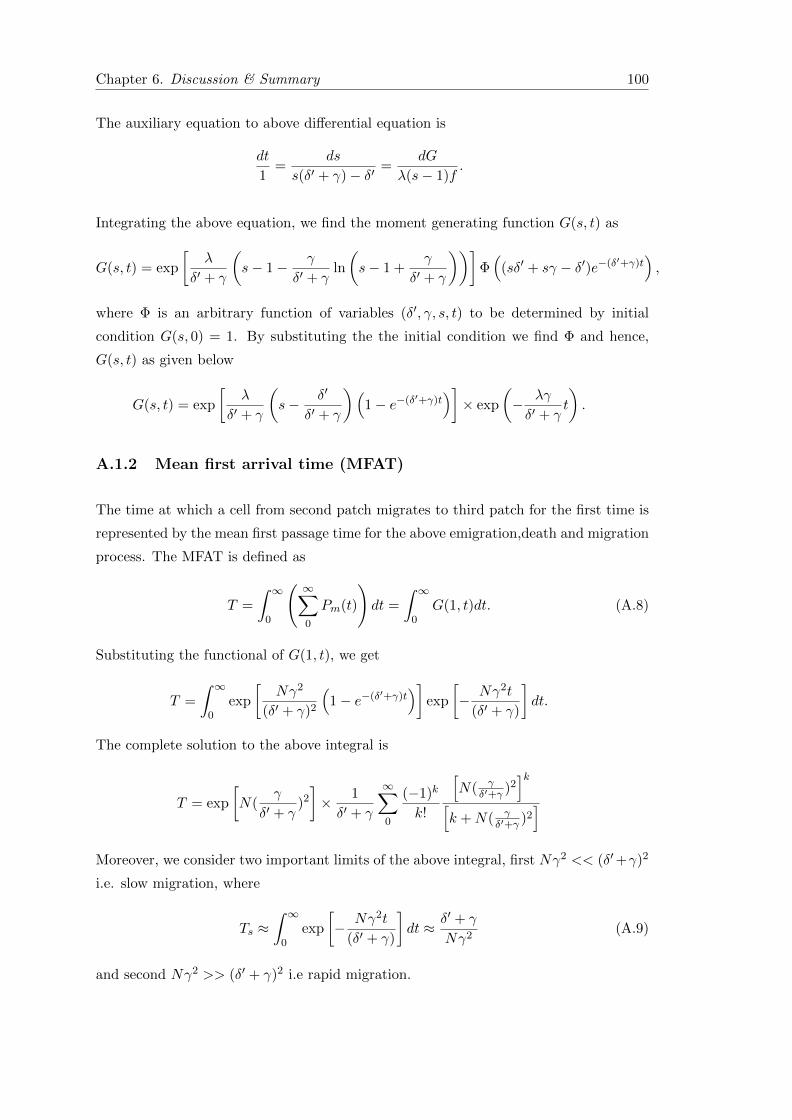
Chapter 6. Discussion & Summary 100
The auxiliary equation to above differential equation is
dt
1=
ds
s(δ′ + γ)− δ′=
dG
λ(s− 1)f.
Integrating the above equation, we find the moment generating function G(s, t) as
G(s, t) = exp
[λ
δ′ + γ
(s− 1− γ
δ′ + γln
(s− 1 +
γ
δ′ + γ
))]Φ(
(sδ′ + sγ − δ′)e−(δ′+γ)t),
where Φ is an arbitrary function of variables (δ′, γ, s, t) to be determined by initial
condition G(s, 0) = 1. By substituting the the initial condition we find Φ and hence,
G(s, t) as given below
G(s, t) = exp
[λ
δ′ + γ
(s− δ′
δ′ + γ
)(1− e−(δ′+γ)t
)]× exp
(− λγ
δ′ + γt
).
A.1.2 Mean first arrival time (MFAT)
The time at which a cell from second patch migrates to third patch for the first time is
represented by the mean first passage time for the above emigration,death and migration
process. The MFAT is defined as
T =
∫ ∞0
( ∞∑0
Pm(t)
)dt =
∫ ∞0
G(1, t)dt. (A.8)
Substituting the functional of G(1, t), we get
T =
∫ ∞0
exp
[Nγ2
(δ′ + γ)2
(1− e−(δ′+γ)t
)]exp
[− Nγ2t
(δ′ + γ)
]dt.
The complete solution to the above integral is
T = exp
[N(
γ
δ′ + γ)2
]× 1
δ′ + γ
∞∑0
(−1)k
k!
[N( γ
δ′+γ )2]k[
k +N( γδ′+γ )2
]Moreover, we consider two important limits of the above integral, first Nγ2 << (δ′+γ)2
i.e. slow migration, where
Ts ≈∫ ∞
0exp
[− Nγ2t
(δ′ + γ)
]dt ≈ δ′ + γ
Nγ2(A.9)
and second Nγ2 >> (δ′ + γ)2 i.e rapid migration.
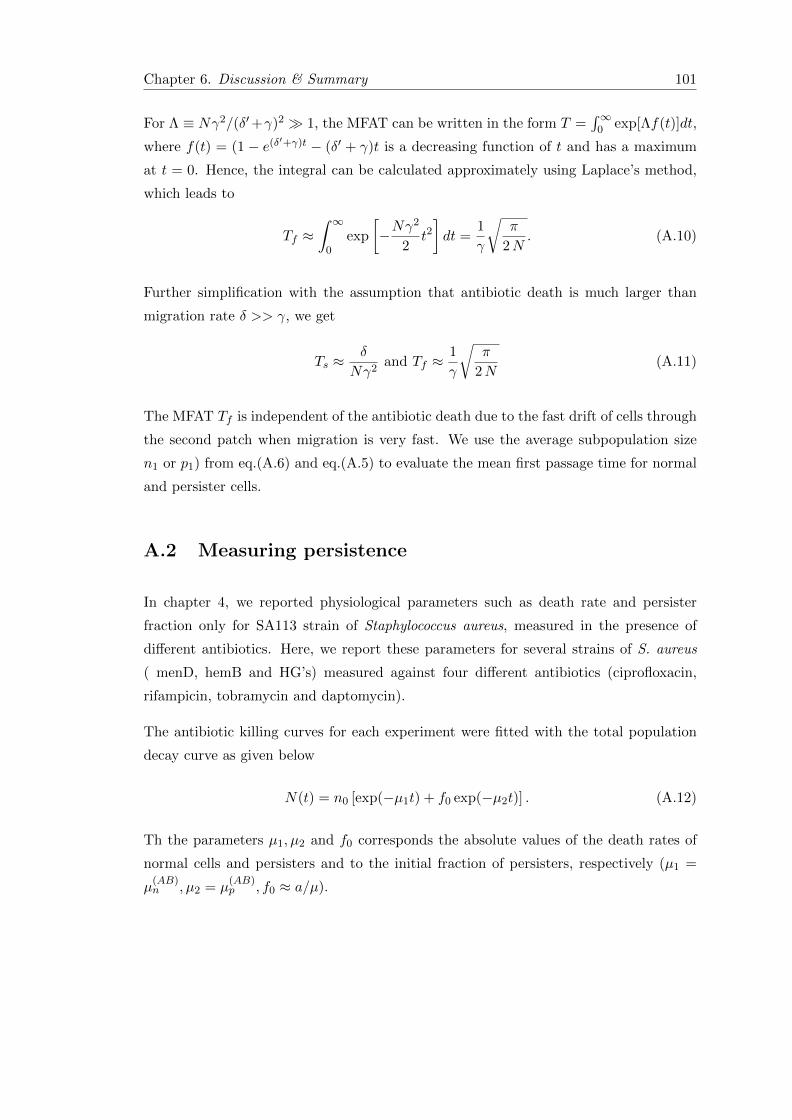
Chapter 6. Discussion & Summary 101
For Λ ≡ Nγ2/(δ′+γ)2 � 1, the MFAT can be written in the form T =∫∞
0 exp[Λf(t)]dt,
where f(t) = (1 − e(δ′+γ)t − (δ′ + γ)t is a decreasing function of t and has a maximum
at t = 0. Hence, the integral can be calculated approximately using Laplace’s method,
which leads to
Tf ≈∫ ∞
0exp
[−Nγ
2
2t2]dt =
1
γ
√π
2N. (A.10)
Further simplification with the assumption that antibiotic death is much larger than
migration rate δ >> γ, we get
Ts ≈δ
Nγ2and Tf ≈
1
γ
√π
2N(A.11)
The MFAT Tf is independent of the antibiotic death due to the fast drift of cells through
the second patch when migration is very fast. We use the average subpopulation size
n1 or p1) from eq.(A.6) and eq.(A.5) to evaluate the mean first passage time for normal
and persister cells.
A.2 Measuring persistence
In chapter 4, we reported physiological parameters such as death rate and persister
fraction only for SA113 strain of Staphylococcus aureus, measured in the presence of
different antibiotics. Here, we report these parameters for several strains of S. aureus
( menD, hemB and HG’s) measured against four different antibiotics (ciprofloxacin,
rifampicin, tobramycin and daptomycin).
The antibiotic killing curves for each experiment were fitted with the total population
decay curve as given below
N(t) = n0 [exp(−µ1t) + f0 exp(−µ2t)] . (A.12)
Th the parameters µ1, µ2 and f0 corresponds the absolute values of the death rates of
normal cells and persisters and to the initial fraction of persisters, respectively (µ1 =
µ(AB)n , µ2 = µ
(AB)p , f0 ≈ a/µ).
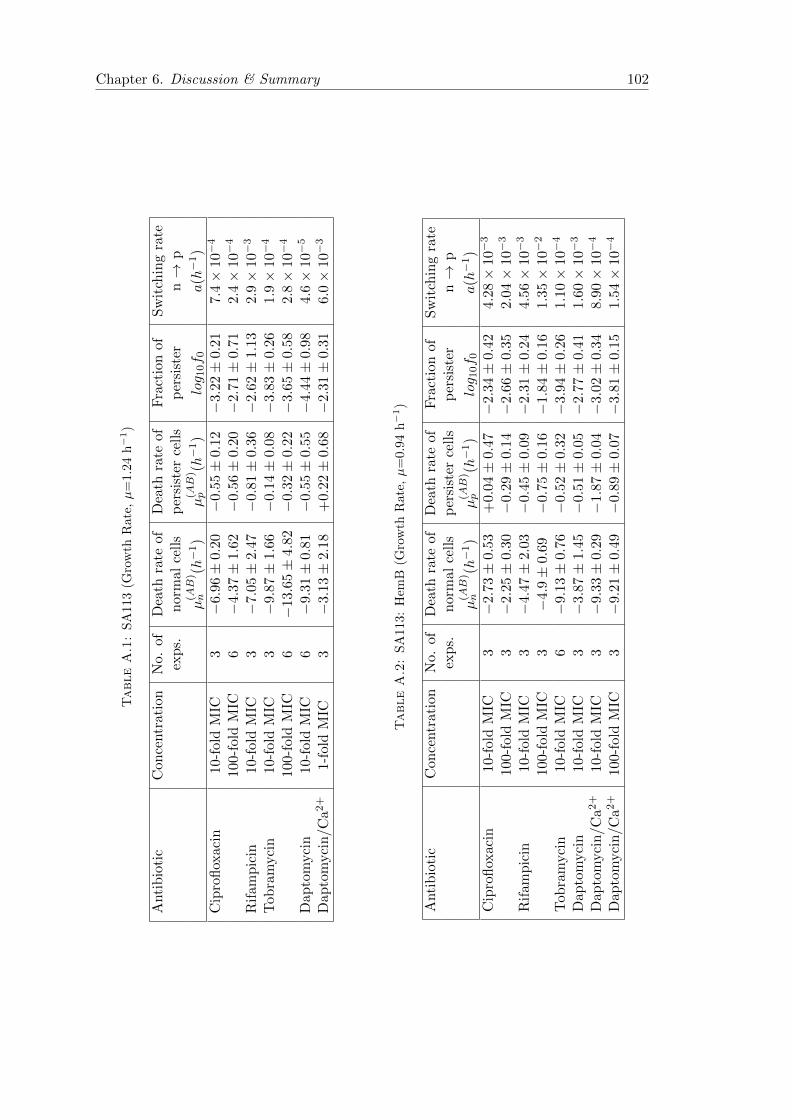
Chapter 6. Discussion & Summary 102
TableA.1:
SA
113
(Gro
wth
Rate
,µ
=1.2
4h−1)
Anti
bio
tic
Con
centr
atio
nN
o.of
Dea
thra
teof
Dea
thra
teof
Fra
ctio
nof
Sw
itch
ing
rate
exp
s.n
orm
alce
lls
per
sist
erce
lls
per
sist
ern→
p
µ(AB
)n
(h−
1)
µ(AB
)p
(h−
1)
log 1
0f 0
a(h−
1)
Cip
rofl
oxac
in10
-fol
dM
IC3
−6.9
6±
0.2
0−
0.55±
0.12
−3.
22±
0.21
7.4×
10−
4
100-
fold
MIC
6−
4.3
7±
1.6
2−
0.56±
0.20
−2.
71±
0.71
2.4×
10−
4
Rif
amp
icin
10-f
old
MIC
3−
7.0
5±
2.4
7−
0.81±
0.36
−2.
62±
1.13
2.9×
10−
3
Tob
ram
yci
n10
-fol
dM
IC3
−9.8
7±
1.6
6−
0.14±
0.08
−3.
83±
0.26
1.9×
10−
4
100-
fold
MIC
6−
13.6
5±
4.82
−0.
32±
0.22
−3.
65±
0.58
2.8×
10−
4
Dap
tom
yci
n10
-fol
dM
IC6
−9.3
1±
0.8
1−
0.55±
0.55
−4.
44±
0.98
4.6×
10−
5
Dap
tom
yci
n/C
a2+
1-fo
ldM
IC3
−3.1
3±
2.1
8+
0.22±
0.68
−2.
31±
0.31
6.0×
10−
3
TableA.2:
SA
113:
Hem
B(G
row
thR
ate
,µ
=0.9
4h−1)
Anti
bio
tic
Con
centr
atio
nN
o.of
Dea
thra
teof
Dea
thra
teof
Fra
ctio
nof
Sw
itch
ing
rate
exp
s.n
orm
alce
lls
per
sist
erce
lls
per
sist
ern→
p
µ(AB
)n
(h−
1)
µ(AB
)p
(h−
1)
log 1
0f 0
a(h−
1)
Cip
rofl
oxac
in10
-fol
dM
IC3
−2.7
3±
0.5
3+
0.0
4±
0.47
−2.3
4±
0.42
4.2
8×
10−
3
100-
fold
MIC
3−
2.2
5±
0.3
0−
0.2
9±
0.14
−2.6
6±
0.35
2.0
4×
10−
3
Rif
amp
icin
10-f
old
MIC
3−
4.4
7±
2.0
3−
0.4
5±
0.09
−2.3
1±
0.24
4.5
6×
10−
3
100-
fold
MIC
3−
4.9±
0.6
9−
0.7
5±
0.16
−1.8
4±
0.16
1.3
5×
10−
2
Tob
ram
yci
n10
-fol
dM
IC6
−9.1
3±
0.7
6−
0.5
2±
0.32
−3.9
4±
0.26
1.1
0×
10−
4
Dap
tom
yci
n10
-fol
dM
IC3
−3.8
7±
1.4
5−
0.5
1±
0.05
−2.7
7±
0.41
1.6
0×
10−
3
Dap
tom
yci
n/C
a2+
10-f
old
MIC
3−
9.3
3±
0.2
9−
1.8
7±
0.04
−3.0
2±
0.34
8.9
0×
10−
4
Dap
tom
yci
n/C
a2+
100-
fold
MIC
3−
9.2
1±
0.4
9−
0.8
9±
0.07
−3.8
1±
0.15
1.5
4×
10−
4
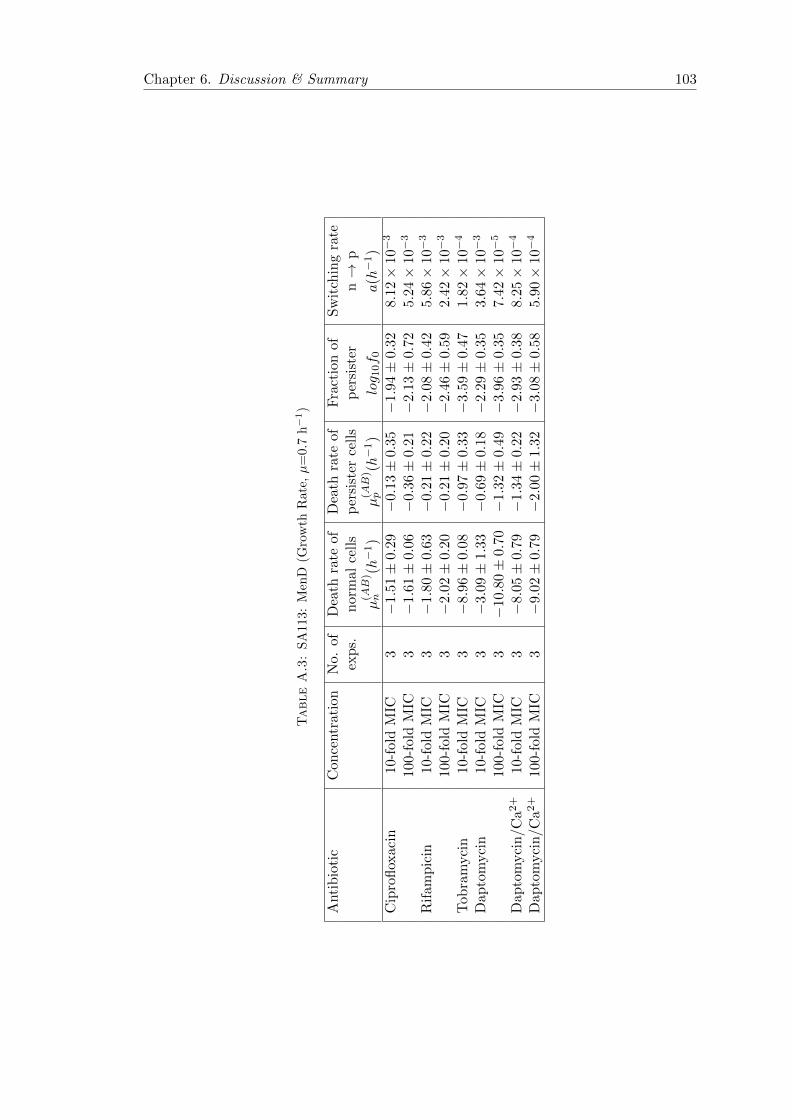
Chapter 6. Discussion & Summary 103
TableA.3:
SA
113:
Men
D(G
row
thR
ate
,µ
=0.7
h−1)
Anti
bio
tic
Con
centr
ati
onN
o.of
Dea
thra
teof
Dea
thra
teof
Fra
ctio
nof
Sw
itch
ing
rate
exp
s.n
orm
alce
lls
per
sist
erce
lls
per
sist
ern→
p
µ(AB
)n
(h−
1)
µ(AB
)p
(h−
1)
log 1
0f 0
a(h−
1)
Cip
rofl
oxaci
n10-
fold
MIC
3−
1.5
1±
0.2
9−
0.13±
0.35
−1.
94±
0.32
8.12×
10−
3
100-
fold
MIC
3−
1.6
1±
0.0
6−
0.36±
0.21
−2.
13±
0.72
5.24×
10−
3
Rif
amp
icin
10-
fold
MIC
3−
1.8
0±
0.6
3−
0.21±
0.22
−2.
08±
0.42
5.86×
10−
3
100-
fold
MIC
3−
2.0
2±
0.2
0−
0.21±
0.20
−2.
46±
0.59
2.42×
10−
3
Tob
ram
yci
n10-
fold
MIC
3−
8.9
6±
0.0
8−
0.97±
0.33
−3.
59±
0.47
1.82×
10−
4
Dap
tom
yci
n10-
fold
MIC
3−
3.0
9±
1.3
3−
0.69±
0.18
−2.
29±
0.35
3.64×
10−
3
100-
fold
MIC
3−
10.8
0±
0.70
−1.
32±
0.49
−3.
96±
0.35
7.42×
10−
5
Dap
tom
yci
n/C
a2+
10-
fold
MIC
3−
8.0
5±
0.7
9−
1.34±
0.22
−2.
93±
0.38
8.25×
10−
4
Dap
tom
yci
n/C
a2+
100-
fold
MIC
3−
9.0
2±
0.7
9−
2.00±
1.32
−3.
08±
0.58
5.90×
10−
4
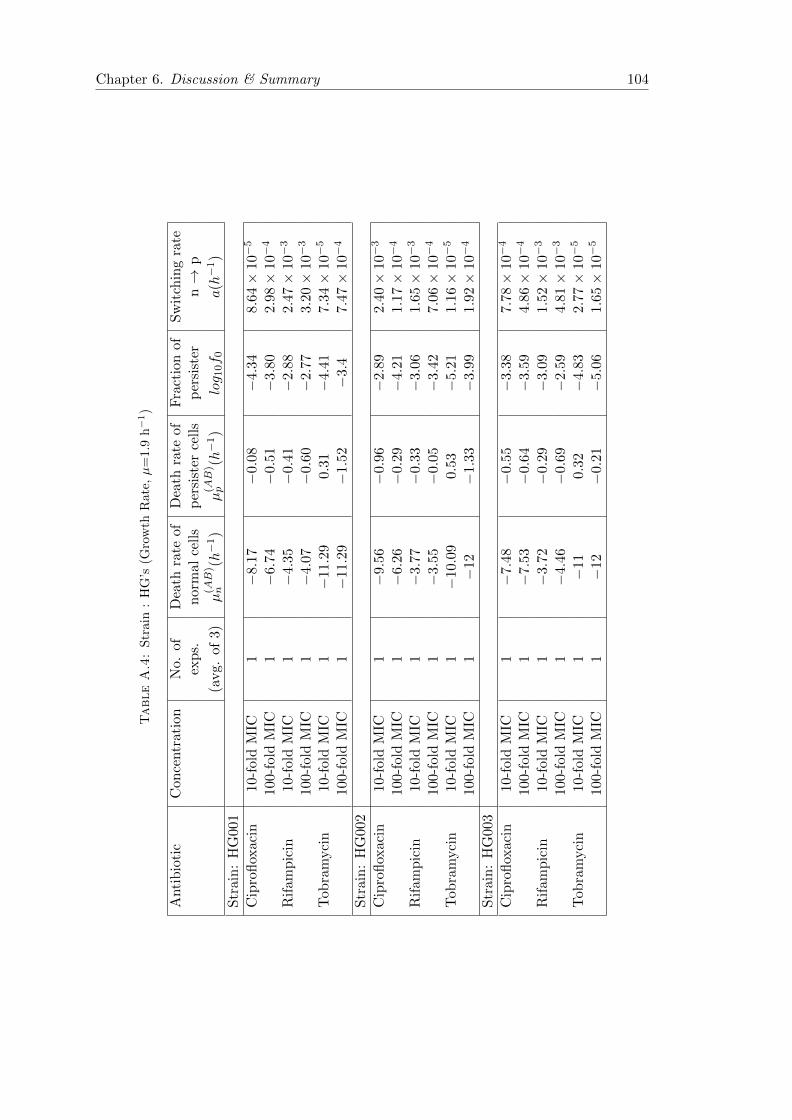
Chapter 6. Discussion & Summary 104
TableA.4:
Str
ain
:H
G’s
(Gro
wth
Rate
,µ
=1.9
h−1)
Anti
bio
tic
Con
centr
atio
nN
o.of
Dea
thra
teof
Dea
thra
teof
Fra
ctio
nof
Sw
itch
ing
rate
exp
s.n
orm
alce
lls
per
sist
erce
lls
per
sist
ern→
p
(avg.
of3)
µ(AB
)n
(h−
1)
µ(AB
)p
(h−
1)
log 1
0f 0
a(h−
1)
Str
ain
:H
G00
1
Cip
rofl
oxac
in10
-fol
dM
IC1
−8.
17−
0.0
8−
4.3
48.6
4×
10−
5
100-
fold
MIC
1−
6.74
−0.5
1−
3.8
02.9
8×
10−
4
Rif
amp
icin
10-f
old
MIC
1−
4.35
−0.4
1−
2.8
82.4
7×
10−
3
100-
fold
MIC
1−
4.07
−0.6
0−
2.7
73.2
0×
10−
3
Tob
ram
yci
n10
-fol
dM
IC1
−11.2
90.
31−
4.4
17.3
4×
10−
5
100-
fold
MIC
1−
11.2
9−
1.5
2−
3.4
7.4
7×
10−
4
Str
ain
:H
G00
2
Cip
rofl
oxac
in10
-fol
dM
IC1
−9.
56−
0.9
6−
2.8
92.4
0×
10−
3
100-
fold
MIC
1−
6.26
−0.2
9−
4.2
11.1
7×
10−
4
Rif
amp
icin
10-f
old
MIC
1−
3.77
−0.3
3−
3.0
61.6
5×
10−
3
100-
fold
MIC
1−
3.55
−0.0
5−
3.4
27.0
6×
10−
4
Tob
ram
yci
n10
-fol
dM
IC1
−10.0
90.
53−
5.2
11.1
6×
10−
5
100-
fold
MIC
1−
12−
1.3
3−
3.9
91.9
2×
10−
4
Str
ain
:H
G00
3
Cip
rofl
oxac
in10
-fol
dM
IC1
−7.
48−
0.5
5−
3.3
87.7
8×
10−
4
100-
fold
MIC
1−
7.53
−0.6
4−
3.5
94.8
6×
10−
4
Rif
amp
icin
10-f
old
MIC
1−
3.72
−0.2
9−
3.0
91.5
2×
10−
3
100-
fold
MIC
1−
4.46
−0.6
9−
2.5
94.8
1×
10−
3
Tob
ram
yci
n10
-fol
dM
IC1
−11
0.32
−4.8
32.7
7×
10−
5
100-
fold
MIC
1−
12−
0.2
1−
5.0
61.6
5×
10−
5
Acknowledgements
First and foremost, I would like to thank my supervisor Dr. Stefan Klumpp for giving
me the opportunity to do research in his group and giving me the freedom to pursue
my own ideas. I thank him for the continuous support, suggestions and encouragement
throughout these years.
I am grateful to our collaborators from University of Tubingen, Dr. Ralph Bertram and
Sabrina Lechner, for providing experimental data that provided some ideas for my work.
I am grateful to my group members Mamata, Marco, Michael, Rahul, David and Veron-
ica for always making life more enjoyable in the institute. Special thanks to Florian
Berger and Thomas Niedermeyer for giving their time for proofreading the thesis.
Finally, I thank my family for their strength and support throughout the years.
105

Bibliography
[1] Kyle R Allison, Mark P Brynildsen, and James J Collins. Heterogeneous bacterial
persisters and engineering approaches to eliminate them. Curr. Opin. Microbiol.,
14(5):593–8, October 2011.
[2] N Q Balaban. Persistence: mechanisms for triggering and enhancing phenotypic
variability. Curr. Opin. Genet. Dev., 21(6):768–75, December 2011.
[3] Nathalie Q Balaban, Kenn Gerdes, Kim Lewis, and John D McKinney. A problem
of persistence: still more questions than answers? Nat. Rev. Microbiol., 11(8):587–
91, July 2013.
[4] Nathalie Q. Balaban, Jack Merrin, Remy Chait, Lukasz Kowalik, and Stanislas
Leibler. Bacterial Persistence as a Phenotypic Switch. Science, 305(5690):1622–
1625, 2004.
[5] Frederick K Balagadde, Hao Song, Jun Ozaki, Cynthia H Collins, Matthew Barnet,
Frances H Arnold, Stephen R Quake, and Lingchong You. A synthetic Escherichia
coli predator-prey ecosystem. Mol. Syst. Biol., 4:187, 2008.
[6] F Baquero and M C Negri. Selective compartments for resistant microorganisms
in antibiotic gradients. Bioessays, 19(8):731–6, August 1997.
[7] JosephW Bigger. Treatment of staphylococcal infections with penicillin by inter-
mittent sterilisation. The Lancet, 244(6320):497–500, 1944.
[8] Matthew G Blango and Matthew A Mulvey. Persistence of uropathogenic Es-
cherichia coli in the face of multiple antibiotics. Antimicrob. Agents Chemother.,
54(5):1855–63, May 2010.
[9] A Brooun, S Liu, and K Lewis. A dose-response study of antibiotic resistance in
Pseudomonas aeruginosa biofilms. Antimicrob. Agents Chemother., 44(3):640–6,
March 2000.
107
Bibliography 108
[10] M R Brown, D G Allison, and P Gilbert. Resistance of bacterial biofilms to
antibiotics: a growth-rate related effect? J. Antimicrob. Chemother., 22(6):777–
80, December 1988.
[11] S Buerger, A Spoering, E Gavrish, C Leslin, L Ling, and S S Epstein. Microbial
scout hypothesis, stochastic exit from dormancy, and the nature of slow growers.
Appl. Environ. Microbiol., 78(9):3221–8, May 2012.
[12] Evan J Burkala, Jun He, John T West, Charles Wood, and Carol K Petito. Com-
partmentalization of HIV-1 in the central nervous system: role of the choroid
plexus. AIDS, 19(7):675–84, April 2005.
[13] Dino Di Carlo and Luke P Lee. Dynamic single-cell analysis for quantitative
biology. Anal. Chem., 78(23):7918–25, December 2006.
[14] Ted J Case, Mark L Taper, et al. Interspecific competition, environmental gradi-
ents, gene flow, and the coevolution of species’ borders. The American Naturalist,
155(5):583–605, 2000.
[15] Ilaria Cataudella, Ala Trusina, Kim Sneppen, Kenn Gerdes, and Namiko Mitarai.
Conditional cooperativity in toxin-antitoxin regulation prevents random toxin ac-
tivation and promotes fast translational recovery. Nucleic Acids Res., 40(14):6424–
34, August 2012.
[16] Ryan T Cirz, Bryan M O’Neill, Jennifer A Hammond, Steven R Head, and Floyd E
Romesberg. Defining the Pseudomonas aeruginosa SOS response and its role in
the global response to the antibiotic ciprofloxacin. J. Bacteriol., 188(20):7101–10,
October 2006.
[17] R J Davidson, G G Zhanel, R Phillips, and D J Hoban. Human serum enhances
the postantibiotic effect of fluoroquinolones against Staphylococcus aureus. An-
timicrob. Agents Chemother., 35(6):1261–3, June 1991.
[18] Julian Davies and Dorothy Davies. Origins and evolution of antibiotic resistance.
Microbiol. Mol. Biol. Rev., 74(3):417–33, September 2010.
[19] Neeraj Dhar and John D McKinney. Microbial phenotypic heterogeneity and
antibiotic tolerance. Curr. Opin. Microbiol., 10(1):30–8, February 2007.
[20] L G Donowitz, R P Wenzel, and J W Hoyt. High risk of hospital-acquired infection
in the ICU patient. Crit. Care Med., 10(6):355–7, June 1982.
[21] Tobias Dorr, Kim Lewis, and Marin Vulic. SOS response induces persistence to
fluoroquinolones in Escherichia coli. PLoS Genet., 5(12):e1000760, December 2009.
Bibliography 109
[22] Tobias Dorr, Marin Vulic, and Kim Lewis. Ciprofloxacin causes persister formation
by inducing the TisB toxin in Escherichia coli. PLoS Biol., 8(2):e1000317, February
2010.
[23] Eliana Drenkard and Frederick M Ausubel. Pseudomonas biofilm formation and
antibiotic resistance are linked to phenotypic variation. Nature, 416(6882):740–3,
April 2002.
[24] George L Drusano. Antimicrobial pharmacodynamics: critical interactions of ’bug
and drug’. Nat. Rev. Microbiol., 2(4):289–300, April 2004.
[25] David Dubnau and Richard Losick. Bistability in bacteria. Mol. Microbiol.,
61(3):564–72, August 2006.
[26] Jonathan Dworkin and Ishita M Shah. Exit from dormancy in microbial organisms.
Nat. Rev. Microbiol., 8(12):890–6, December 2010.
[27] Michael B Elowitz, Arnold J Levine, Eric D Siggia, and Peter S Swain. Stochastic
gene expression in a single cell. Science, 297(5584):1183–6, August 2002.
[28] Maarten Fauvart, Valerie N De Groote, and Jan Michiels. Role of persister cells in
chronic infections: clinical relevance and perspectives on anti-persister therapies.
J. Med. Microbiol., 60(Pt 6):699–709, June 2011.
[29] Bernadett Gaal, Jonathan W Pitchford, and A Jamie Wood. Exact results for the
evolution of stochastic switching in variable asymmetric environments. Genetics,
184(4):1113–9, April 2010.
[30] T S Gardner, C R Cantor, and J J Collins. Construction of a genetic toggle switch
in Escherichia coli. Nature, 403(6767):339–42, January 2000.
[31] Christian Garzoni and William L Kelley. Staphylococcus aureus: new evidence
for intracellular persistence. Trends Microbiol., 17(2):59–65, February 2009.
[32] Orit Gefen and Nathalie Q Balaban. The importance of being persistent: hetero-
geneity of bacterial populations under antibiotic stress. FEMS Microbiol. Rev.,
33(4):704–17, July 2009.
[33] Orit Gefen, Chana Gabay, Michael Mumcuoglu, Giora Engel, and Nathalie Q
Balaban. Single-cell protein induction dynamics reveals a period of vulnerability
to antibiotics in persister bacteria. Proc. Natl. Acad. Sci. U.S.A., 105(16):6145–9,
April 2008.
[34] Daniel T. Gillespie. A General Method for Numerically Simulating the Stochastic
Time Evolution of Coupled Chemical Reactions. J. Comput. Phys., 22:403, 1976.
Bibliography 110
[35] Philip Greulich, Bart lomiej Waclaw, and Rosalind J Allen. Mutational pathway de-
termines whether drug gradients accelerate evolution of drug-resistant cells. Phys.
Rev. Lett., 109(8):088101, August 2012.
[36] Ashleigh S. Griffin, Stuart A. West, and Angus Buckling. Cooperation and com-
petition in pathogenic bacteria. Nature, 430(7003):1024–1027, 2004.
[37] A Gutierrez, L Laureti, S Crussard, H Abida, A Rodrıguez-Rojas, J Blazquez,
Z Baharoglu, D Mazel, F Darfeuille, J Vogel, and I Matic. Beta-lactam antibi-
otics promote bacterial mutagenesis via an RpoS-mediated reduction in replication
fidelity. Nat Commun, 4:1610, 2013.
[38] Oskar Hallatschek, Pascal Hersen, Sharad Ramanathan, and David R. Nelson.
Genetic drift at expanding frontiers promotes gene segregation. PNAS 2007
104:19926-19930, December 2008.
[39] H Hanberger, L E Nilsson, R Maller, and B Isaksson. Pharmacodynamics of
daptomycin and vancomycin on Enterococcus faecalis and Staphylococcus aureus
demonstrated by studies of initial killing and postantibiotic effect and influence of
Ca2+ and albumin on these drugs. Antimicrob. Agents Chemother., 35(9):1710–6,
September 1991.
[40] Jeff Hasty, David McMillen, and J J Collins. Engineered gene circuits. Nature,
420(6912):224–30, November 2002.
[41] Matthew Hegreness, Noam Shoresh, Doris Damian, Daniel Hartl, and Roy
Kishony. Accelerated evolution of resistance in multidrug environments. Proc.
Natl. Acad. Sci. U.S.A., 105(37):13977–81, September 2008.
[42] Rutger Hermsen, J Barrett Deris, and Terence Hwa. On the rapidity of antibiotic
resistance evolution facilitated by a concentration gradient. Proc. Natl. Acad. Sci.
U.S.A., 109(27):10775–80, July 2012.
[43] Rutger Hermsen and Terence Hwa. Sources and sinks: a stochastic model of evolu-
tion in heterogeneous environments. Phys. Rev. Lett., 105(24):248104, December
2010.
[44] Michael E Hibbing, Clay Fuqua, Matthew R Parsek, and S Brook Peterson. Bac-
terial competition: surviving and thriving in the microbial jungle. Nat. Rev.
Microbiol., 8(1):15–25, January 2010.
[45] Niels Hofsteenge, Erik van Nimwegen, and Olin K Silander. Quantitative analysis
of persister fractions suggests different mechanisms of formation among environ-
mental isolates of E. coli. BMC Microbiol., 13(1):25, February 2013.
Bibliography 111
[46] S Iordanescu and M Surdeanu. Two restriction and modification systems in
Staphylococcus aureus NCTC8325. J. Gen. Microbiol., 96(2):277–81, October
1976.
[47] B Isaksson, R Maller, L E Nilsson, and M Nilsson. Postantibiotic effect of amino-
glycosides on staphylococci. J. Antimicrob. Chemother., 32(2):215–22, August
1993.
[48] Arvi Joers, Niilo Kaldalu, and Tanel Tenson. The frequency of persisters in Es-
cherichia coli reflects the kinetics of awakening from dormancy. J. Bacteriol.,
192(13):3379–84, July 2010.
[49] B Kahl, M Herrmann, A S Everding, H G Koch, K Becker, E Harms, R A Proctor,
and G Peters. Persistent infection with small colony variant strains of Staphylo-
coccus aureus in patients with cystic fibrosis. J. Infect. Dis., 177(4):1023–9, April
1998.
[50] Niilo Kaldalu, Rui Mei, and Kim Lewis. Killing by ampicillin and ofloxacin induces
overlapping changes in Escherichia coli transcription profile. Antimicrob. Agents
Chemother., 48(3):890–6, March 2004.
[51] J B Kaplan. Biofilm dispersal: mechanisms, clinical implications, and potential
therapeutic uses. J. Dent. Res., 89(3):205–18, March 2010.
[52] T B Kepler and A S Perelson. Drug concentration heterogeneity facilitates the evo-
lution of drug resistance. Proc. Natl. Acad. Sci. U.S.A., 95(20):11514–9, September
1998.
[53] Iris Keren, Niilo Kaldalu, Amy Spoering, Yipeng Wang, and Kim Lewis. Persister
cells and tolerance to antimicrobials. FEMS Microbiol. Lett., 230(1):13–8, January
2004.
[54] Iris Keren, Shoko Minami, Eric Rubin, and Kim Lewis. Characterization and tran-
scriptome analysis of Mycobacterium tuberculosis persisters. MBio, 2(3):e00100–
11, 2011.
[55] Iris Keren, Devang Shah, Amy Spoering, Niilo Kaldalu, and Kim Lewis. Special-
ized persister cells and the mechanism of multidrug tolerance in Escherichia coli.
J. Bacteriol., 186(24):8172–80, December 2004.
[56] Juan E Keymer, Peter Galajda, Guillaume Lambert, David Liao, and Robert H
Austin. Computation of mutual fitness by competing bacteria. Proc. Natl. Acad.
Sci. U.S.A., 105(51):20269–73, December 2008.
Bibliography 112
[57] Jongmin Kim, Kristin S White, and Erik Winfree. Construction of an in vitro
bistable circuit from synthetic transcriptional switches. Mol. Syst. Biol., 2:68,
2006.
[58] Cyrielle I Kint, Natalie Verstraeten, Maarten Fauvart, and Jan Michiels. New-
found fundamentals of bacterial persistence. Trends Microbiol., 20(12):577–85,
December 2012.
[59] S Klumpp. Growth-rate dependence reveals design principles of plasmid copy
number control. PLoS One, 6(5):e20403, 2011.
[60] Stefan Klumpp, Zhongge Zhang, and Terence Hwa. Growth Rate-Dependent
Global Effects on Gene Expression in Bacteria. Cell, 139(7):1366–1375, December
2009.
[61] M H Kollef and V J Fraser. Antibiotic resistance in the intensive care unit. Ann.
Intern. Med., 134(4):298–314, February 2001.
[62] S B Korch, T A Henderson, and T M Hill. Characterization of the hipA7 allele
of Escherichia coli and evidence that high persistence is governed by (p)ppGpp
synthesis. Mol Microbiol, 50(4):1199–1213, November 2003.
[63] Shaleen B Korch and Thomas M Hill. Ectopic overexpression of wild-type and
mutant hipA genes in Escherichia coli: effects on macromolecular synthesis and
persister formation. J. Bacteriol., 188(11):3826–36, June 2006.
[64] Kirill S Korolev, Melanie J I Muller, Nilay Karahan, Andrew W Murray, Oskar
Hallatschek, and David R Nelson. Selective sweeps in growing microbial colonies.
Phys Biol, 9(2):026008, 2012.
[65] Maria Kostakioti, Maria Hadjifrangiskou, and Scott J Hultgren. Bacterial biofilms:
development, dispersal, and therapeutic strategies in the dawn of the postantibiotic
era. Cold Spring Harb Perspect Med, 3(4), 2013.
[66] Edo Kussell. Evolution in microbes. Annu Rev Biophys, 42:493–514, May 2013.
[67] Edo Kussell, Roy Kishony, Nathalie Q Balaban, and Stanislas Leibler. Bacterial
persistence: a model of survival in changing environments. Genetics, 169(4):1807–
14, April 2005.
[68] Edo Kussell and Stanislas Leibler. Phenotypic diversity, population growth, and
information in fluctuating environments. Science, 309(5743):2075–8, September
2005.
Bibliography 113
[69] M Lachmann and E Jablonka. The inheritance of phenotypes: an adaptation to
fluctuating environments. J. Theor. Biol., 181(1):1–9, July 1996.
[70] Guillaume Lambert, David Liao, Saurabh Vyawahare, and Robert H Austin.
Anomalous spatial redistribution of competing bacteria under starvation condi-
tions. J. Bacteriol., 193(8):1878–83, April 2011.
[71] Sabrina Lechner, Kim Lewis, and Ralph Bertram. Staphylococcus aureus persisters
tolerant to bactericidal antibiotics. J. Mol. Microbiol. Biotechnol., 22(4):235–44,
2012.
[72] Sabrina Lechner, Pintu Patra, Stefan Klumpp, and Ralph Bertram. Interplay
between Population Dynamics and Drug Tolerance of Staphylococcus aureus Per-
sister Cells. J. Mol. Microbiol. Biotechnol., 22(6):381–91, 2012.
[73] Bruce R Levin and Daniel E Rozen. Non-inherited antibiotic resistance. Nat. Rev.
Microbiol., 4(7):556–62, July 2006.
[74] Richard Levins. Theory of fitness in a heterogeneous environment. I. The fitness
set and adaptive function. American Naturalist, pages 361–373, 1962.
[75] Kim Lewis. Persister cells, dormancy and infectious disease. Nature Reviews
Microbiology, 5(1):48–56, January 2007.
[76] Kim Lewis. Persister cells. Annu. Rev. Microbiol., 64:357–72, 2010.
[77] L L Livornese, S Dias, C Samel, B Romanowski, S Taylor, P May, P Pitsakis,
G Woods, D Kaye, and M E Levison. Hospital-acquired infection with vancomycin-
resistant Enterococcus faecium transmitted by electronic thermometers. Ann. In-
tern. Med., 117(2):112–6, July 1992.
[78] Chunbo Lou, Zhengyan Li, and Qi Ouyang. A molecular model for persister in E.
coli. J. Theor. Biol., 255(2):205–9, November 2008.
[79] Etienne Maisonneuve, Lana J. Shakespeare, Mikkel Girke Jørgensen, and Kenn
Gerdes. Bacterial persistence by RNA endonucleases. Proceedings of the National
Academy of Sciences, 108(32):13206–13211, 2011.
[80] T.R. Malthus. An Essay on the Principle of Population. J. Johnson, London,
1798.
[81] Abu Amar M Al Mamun, Mary-Jane Lombardo, Chandan Shee, Andreas M
Lisewski, Caleb Gonzalez, Dongxu Lin, Ralf B Nehring, Claude Saint-Ruf, Janet L
Gibson, Ryan L Frisch, Olivier Lichtarge, P J Hastings, and Susan M Rosenberg.
Identity and function of a large gene network underlying mutagenic repair of DNA
breaks. Science, 338(6112):1344–8, December 2012.
Bibliography 114
[82] R C Massey, A Buckling, and S J Peacock. Phenotypic switching of antibiotic
resistance circumvents permanent costs in Staphylococcus aureus. Curr. Biol.,
11(22):1810–4, November 2001.
[83] Anna Melbinger, Jonas Cremer, and Erwin Frey. Evolutionary game theory in
growing populations. Phys. Rev. Lett. 105, 178101 (2010), October 2010.
[84] J A Metz, R M Nisbet, and S A Geritz. How should we define ’fitness’ for general
ecological scenarios? Trends Ecol. Evol. (Amst.), 7(6):198–202, June 1992.
[85] M B Miller and B L Bassler. Quorum sensing in bacteria. Annu. Rev. Microbiol.,
55:165–99, 2001.
[86] P Mitchell. Microfluidics–downsizing large-scale biology. Nat. Biotechnol.,
19(8):717–21, August 2001.
[87] Nina Moker, Charles R Dean, and Jianshi Tao. Pseudomonas aeruginosa increases
formation of multidrug-tolerant persister cells in response to quorum-sensing sig-
naling molecules. J. Bacteriol., 192(7):1946–55, April 2010.
[88] H S Moyed and K P Bertrand. hipA, a newly recognized gene of Escherichia coli
K-12 that affects frequency of persistence after inhibition of murein synthesis. J.
Bacteriol., 155(2):768–75, August 1983.
[89] H S Moyed and S H Broderick. Molecular cloning and expression of hipA, a gene
of Escherichia coli K-12 that affects frequency of persistence after inhibition of
murein synthesis. J Bacteriol, 166(2):399–403, May 1986.
[90] G V Mukamolova, A S Kaprelyants, D I Young, M Young, and D B Kell. A
bacterial cytokine. Proc. Natl. Acad. Sci. U.S.A., 95(15):8916–21, July 1998.
[91] Lawrence R Mulcahy, Jane L Burns, Stephen Lory, and Kim Lewis. Emergence of
Pseudomonas aeruginosa strains producing high levels of persister cells in patients
with cystic fibrosis. J. Bacteriol., 192(23):6191–9, December 2010.
[92] Markus Muller, Amparo dela Pena, and Hartmut Derendorf. Issues in pharma-
cokinetics and pharmacodynamics of anti-infective agents: distribution in tissue.
Antimicrob. Agents Chemother., 48(5):1441–53, May 2004.
[93] F C Neidhardt, J L Ingraham, and M Schaechter. Physiology of the bacterial cell:
A molecular approach. Sinauer, Sunderland MA, May 1990.
[94] H C Neu. The crisis in antibiotic resistance. Science, 257(5073):1064–73, August
1992.
Bibliography 115
[95] Mehmet A Orman and Mark P Brynildsen. Dormancy is not necessary or sufficient
for bacterial persistence. Antimicrob. Agents Chemother., 57(7):3230–9, July 2013.
[96] Pintu Patra and Stefan Klumpp. Phenotypically heterogeneous populations in
spatially heterogeneous environments. Submitted.
[97] Pintu Patra and Stefan Klumpp. Population dynamics of bacterial persistence.
PLoS ONE, 8(5):e62814, 2013.
[98] Pintu Patra and Stefan Klumpp. unpublished data. to be published, xxxx.
[99] S Pearl, C Gabay, R Kishony, A Oppenheim, and N Q Balaban. Nongenetic
individuality in the host-phage interaction. PLoS Biol, 6(5):e120, May 2008.
[100] Joseph F Petrosino, Rodrigo S Galhardo, Liza D Morales, and Susan M Rosen-
berg. Stress-induced beta-lactam antibiotic resistance mutation and sequences
of stationary-phase mutations in the Escherichia coli chromosome. J. Bacteriol.,
191(19):5881–9, October 2009.
[101] Richard A Proctor, Christof von Eiff, Barbara C Kahl, Karsten Becker, Peter
McNamara, Mathias Herrmann, and Georg Peters. Small colony variants: a
pathogenic form of bacteria that facilitates persistent and recurrent infections.
Nat. Rev. Microbiol., 4(4):295–305, April 2006.
[102] P Rainey and K Rainey. Evolution of cooperation and conflict in experimental
bacterial populations. Nature, 425:72–74, 2003.
[103] P B Rainey and M Travisano. Adaptive radiation in a heterogeneous environment.
Nature, 394(6688):69–72, July 1998.
[104] Tobias Reichenbach, Mauro Mobilia, and Erwin Frey. Mobility promotes and jeop-
ardizes biodiversity in rock-paper-scissors games. Nature 448, 1046-1049 (2007),
April 2008.
[105] Eitan Rotem, Adiel Loinger, Irine Ronin, Irit Levin-Reisman, Chana Gabay, Noam
Shoresh, Ofer Biham, and Nathalie Q Balaban. Regulation of phenotypic variabil-
ity by a threshold-based mechanism underlies bacterial persistence. Proc. Natl.
Acad. Sci. U.S.A., 107(28):12541–6, July 2010.
[106] S J Schrag and V Perrot. Reducing antibiotic resistance. Nature, 381(6578):120–1,
May 1996.
[107] Maria A Schumacher, Kevin M Piro, Weijun Xu, Sonja Hansen, Kim Lewis, and
Richard G Brennan. Molecular mechanisms of HipA-mediated multidrug tolerance
and its neutralization by HipB. Science, 323(5912):396–401, January 2009.
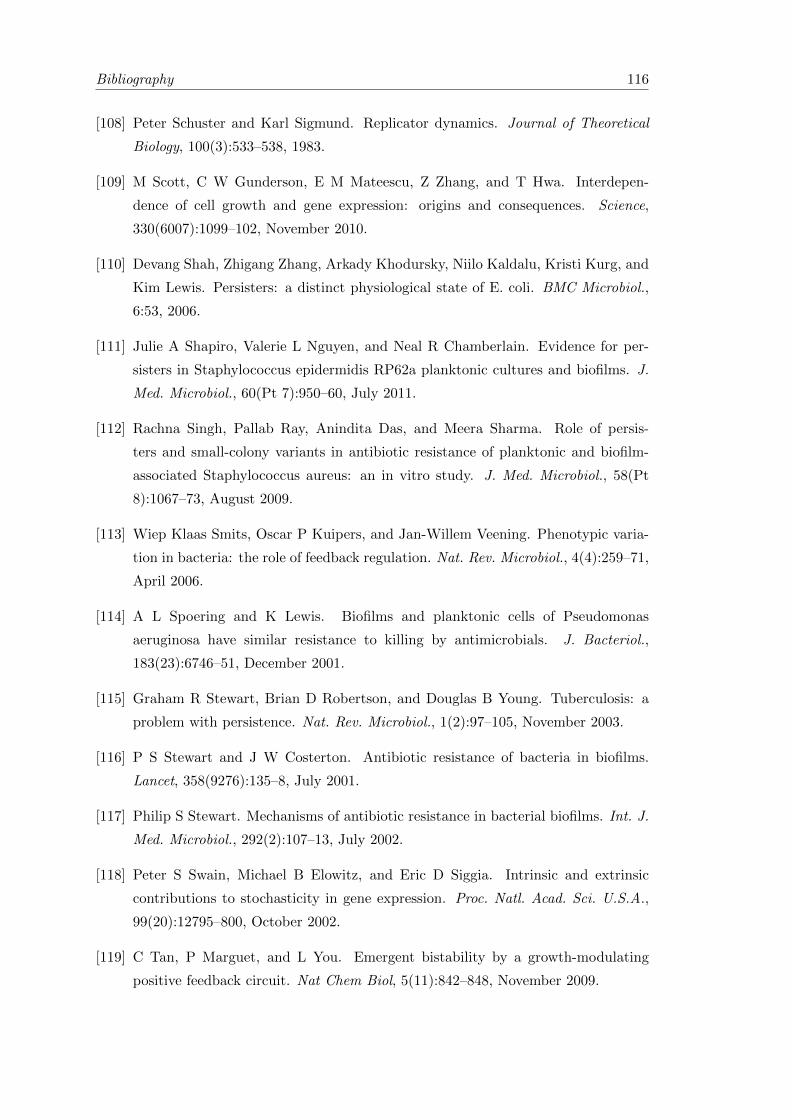
Bibliography 116
[108] Peter Schuster and Karl Sigmund. Replicator dynamics. Journal of Theoretical
Biology, 100(3):533–538, 1983.
[109] M Scott, C W Gunderson, E M Mateescu, Z Zhang, and T Hwa. Interdepen-
dence of cell growth and gene expression: origins and consequences. Science,
330(6007):1099–102, November 2010.
[110] Devang Shah, Zhigang Zhang, Arkady Khodursky, Niilo Kaldalu, Kristi Kurg, and
Kim Lewis. Persisters: a distinct physiological state of E. coli. BMC Microbiol.,
6:53, 2006.
[111] Julie A Shapiro, Valerie L Nguyen, and Neal R Chamberlain. Evidence for per-
sisters in Staphylococcus epidermidis RP62a planktonic cultures and biofilms. J.
Med. Microbiol., 60(Pt 7):950–60, July 2011.
[112] Rachna Singh, Pallab Ray, Anindita Das, and Meera Sharma. Role of persis-
ters and small-colony variants in antibiotic resistance of planktonic and biofilm-
associated Staphylococcus aureus: an in vitro study. J. Med. Microbiol., 58(Pt
8):1067–73, August 2009.
[113] Wiep Klaas Smits, Oscar P Kuipers, and Jan-Willem Veening. Phenotypic varia-
tion in bacteria: the role of feedback regulation. Nat. Rev. Microbiol., 4(4):259–71,
April 2006.
[114] A L Spoering and K Lewis. Biofilms and planktonic cells of Pseudomonas
aeruginosa have similar resistance to killing by antimicrobials. J. Bacteriol.,
183(23):6746–51, December 2001.
[115] Graham R Stewart, Brian D Robertson, and Douglas B Young. Tuberculosis: a
problem with persistence. Nat. Rev. Microbiol., 1(2):97–105, November 2003.
[116] P S Stewart and J W Costerton. Antibiotic resistance of bacteria in biofilms.
Lancet, 358(9276):135–8, July 2001.
[117] Philip S Stewart. Mechanisms of antibiotic resistance in bacterial biofilms. Int. J.
Med. Microbiol., 292(2):107–13, July 2002.
[118] Peter S Swain, Michael B Elowitz, and Eric D Siggia. Intrinsic and extrinsic
contributions to stochasticity in gene expression. Proc. Natl. Acad. Sci. U.S.A.,
99(20):12795–800, October 2002.
[119] C Tan, P Marguet, and L You. Emergent bistability by a growth-modulating
positive feedback circuit. Nat Chem Biol, 5(11):842–848, November 2009.
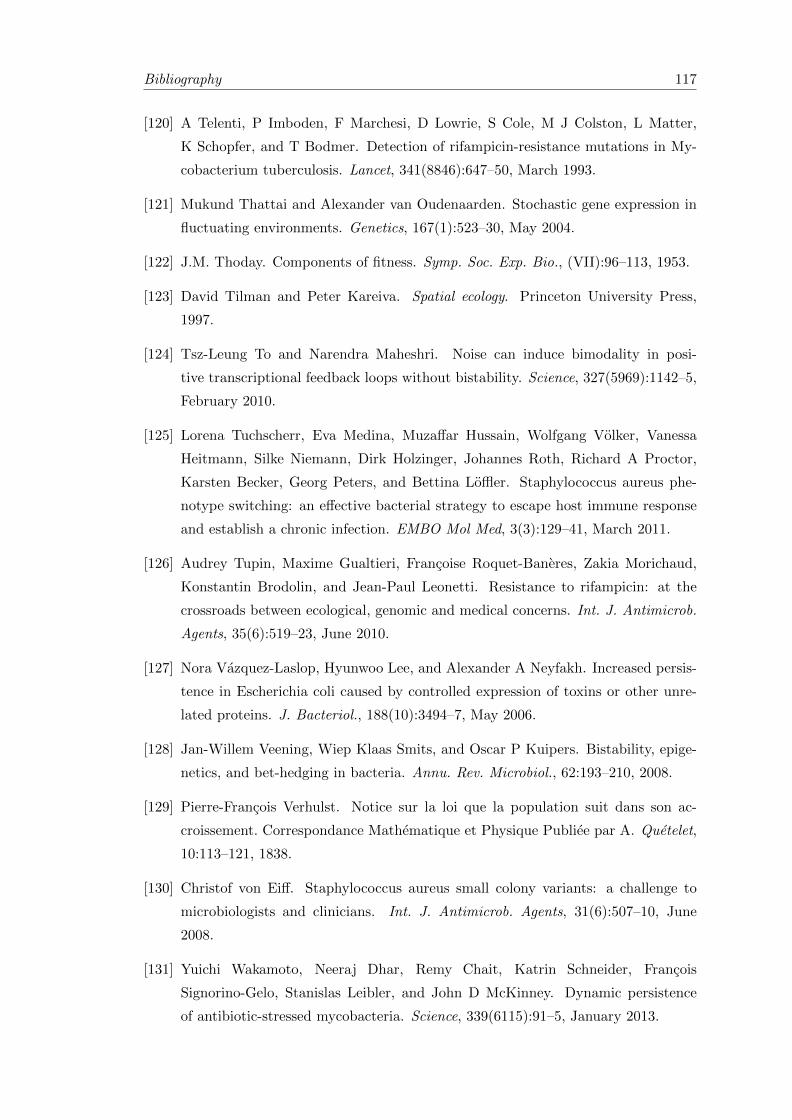
Bibliography 117
[120] A Telenti, P Imboden, F Marchesi, D Lowrie, S Cole, M J Colston, L Matter,
K Schopfer, and T Bodmer. Detection of rifampicin-resistance mutations in My-
cobacterium tuberculosis. Lancet, 341(8846):647–50, March 1993.
[121] Mukund Thattai and Alexander van Oudenaarden. Stochastic gene expression in
fluctuating environments. Genetics, 167(1):523–30, May 2004.
[122] J.M. Thoday. Components of fitness. Symp. Soc. Exp. Bio., (VII):96–113, 1953.
[123] David Tilman and Peter Kareiva. Spatial ecology. Princeton University Press,
1997.
[124] Tsz-Leung To and Narendra Maheshri. Noise can induce bimodality in posi-
tive transcriptional feedback loops without bistability. Science, 327(5969):1142–5,
February 2010.
[125] Lorena Tuchscherr, Eva Medina, Muzaffar Hussain, Wolfgang Volker, Vanessa
Heitmann, Silke Niemann, Dirk Holzinger, Johannes Roth, Richard A Proctor,
Karsten Becker, Georg Peters, and Bettina Loffler. Staphylococcus aureus phe-
notype switching: an effective bacterial strategy to escape host immune response
and establish a chronic infection. EMBO Mol Med, 3(3):129–41, March 2011.
[126] Audrey Tupin, Maxime Gualtieri, Francoise Roquet-Baneres, Zakia Morichaud,
Konstantin Brodolin, and Jean-Paul Leonetti. Resistance to rifampicin: at the
crossroads between ecological, genomic and medical concerns. Int. J. Antimicrob.
Agents, 35(6):519–23, June 2010.
[127] Nora Vazquez-Laslop, Hyunwoo Lee, and Alexander A Neyfakh. Increased persis-
tence in Escherichia coli caused by controlled expression of toxins or other unre-
lated proteins. J. Bacteriol., 188(10):3494–7, May 2006.
[128] Jan-Willem Veening, Wiep Klaas Smits, and Oscar P Kuipers. Bistability, epige-
netics, and bet-hedging in bacteria. Annu. Rev. Microbiol., 62:193–210, 2008.
[129] Pierre-Francois Verhulst. Notice sur la loi que la population suit dans son ac-
croissement. Correspondance Mathematique et Physique Publiee par A. Quetelet,
10:113–121, 1838.
[130] Christof von Eiff. Staphylococcus aureus small colony variants: a challenge to
microbiologists and clinicians. Int. J. Antimicrob. Agents, 31(6):507–10, June
2008.
[131] Yuichi Wakamoto, Neeraj Dhar, Remy Chait, Katrin Schneider, Francois
Signorino-Gelo, Stanislas Leibler, and John D McKinney. Dynamic persistence
of antibiotic-stressed mycobacteria. Science, 339(6115):91–5, January 2013.
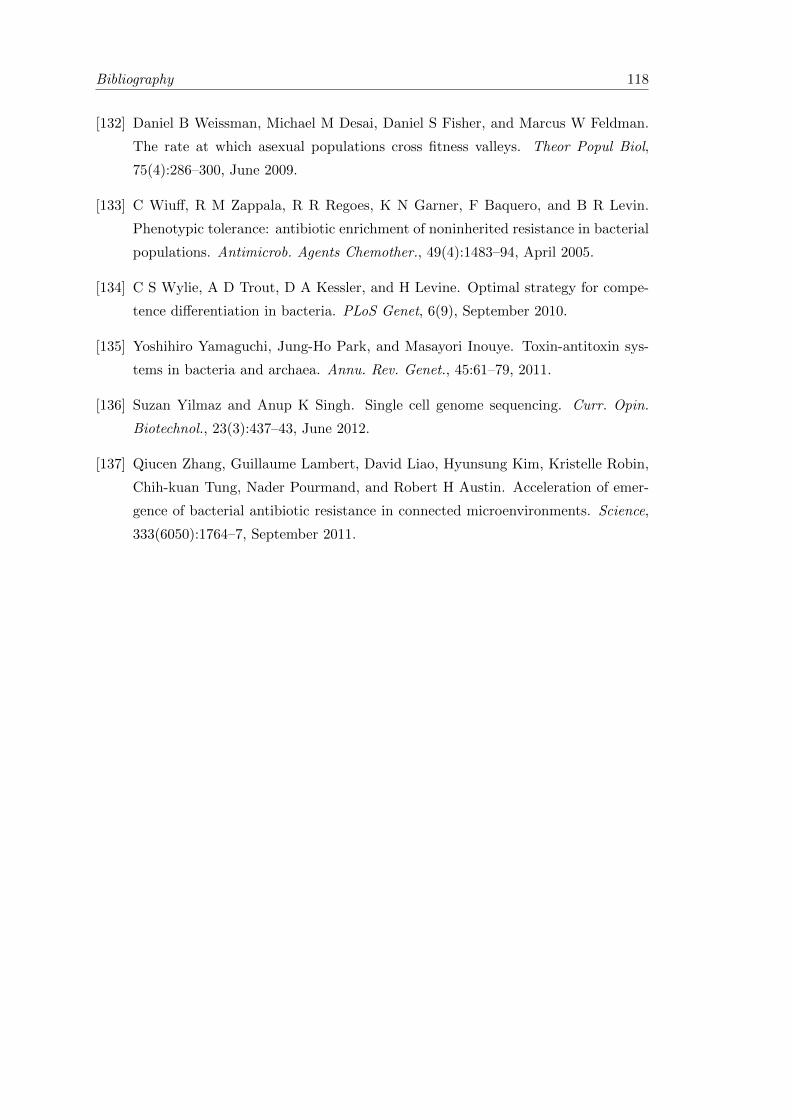
Bibliography 118
[132] Daniel B Weissman, Michael M Desai, Daniel S Fisher, and Marcus W Feldman.
The rate at which asexual populations cross fitness valleys. Theor Popul Biol,
75(4):286–300, June 2009.
[133] C Wiuff, R M Zappala, R R Regoes, K N Garner, F Baquero, and B R Levin.
Phenotypic tolerance: antibiotic enrichment of noninherited resistance in bacterial
populations. Antimicrob. Agents Chemother., 49(4):1483–94, April 2005.
[134] C S Wylie, A D Trout, D A Kessler, and H Levine. Optimal strategy for compe-
tence differentiation in bacteria. PLoS Genet, 6(9), September 2010.
[135] Yoshihiro Yamaguchi, Jung-Ho Park, and Masayori Inouye. Toxin-antitoxin sys-
tems in bacteria and archaea. Annu. Rev. Genet., 45:61–79, 2011.
[136] Suzan Yilmaz and Anup K Singh. Single cell genome sequencing. Curr. Opin.
Biotechnol., 23(3):437–43, June 2012.
[137] Qiucen Zhang, Guillaume Lambert, David Liao, Hyunsung Kim, Kristelle Robin,
Chih-kuan Tung, Nader Pourmand, and Robert H Austin. Acceleration of emer-
gence of bacterial antibiotic resistance in connected microenvironments. Science,
333(6050):1764–7, September 2011.

![(p)ppGpp and its role in bacterial persistence: New challenges · 66 antibiotic -sensitive cell type, resuming growth under drug -free conditions (5). 67 dZ u^ ]PP ] v _Z v v oÇ](https://img.pdfslide.tips/doc/110x75/5f9751412c1ee924d23abe39/pppgpp-and-its-role-in-bacterial-persistence-new-challenges-66-antibiotic-sensitive.jpg)


![Java persistence et hibernate []](https://img.pdfslide.tips/doc/110x75/55b9336dbb61eb076a8b461c/java-persistence-et-hibernate-wwwjilnetworkcom.jpg)