Embed Size (px)
Citation preview

PORT OF LOS ANGELESHARBOR DEPARTMENT OF THE CITY OF LOS ANGELES, CALIFORNIA
Comprehensive Annual Financial ReportJune 30, 2017 and 2016

PORT OF LOS ANGELES (HARBOR DEPARTMENT OF THE CITY OF LOS ANGELES, CALIFORNIA)
Comprehensive Annual Financial Report
For the Fiscal Years Ended June 30, 2017 and 2016
Table of Contents Page
Introductory Section
Letter of Transmittal…………………………………………………………………………………... 1
Organizational Chart………………………………………………………………………………….. 4
Administrative Staff…………………………………………………………………………………… 5
Financial Section
Independent Auditor’s Report……………………………………………………………………….. 6
Management’s Discussion and Analysis (Unaudited)…………………………………………….. 8
Basic Financial Statements
Statements of Net Position…………………………………………………………………….... 40
Statements of Revenues, Expenses, and Changes in Net Position……………….……….. 42
Statements of Cash Flows………………………………………………………………………. 44
Notes to the Basic Financial Statements (Index Page 46)………...…….…………………. 47
Required Supplementary Information - Unaudited
Schedule of Proportionate Share of the Net Pension Liability and Related Ratios……... 104
Schedule of Contributions……………………………………………………………………….. 105
Statistical Section – Unaudited
Ten-year Comparison
Summary of Revenues, Expenses, and Changes in Net Position………………………. 107
Summary of Debt Service Coverage (Pledged Revenue)………………………………... 108
Revenue Statistics………………………………………………………………..…………… 109
Other Operating Information…………………………………...…………………………….. 110
Operating Expense Net of Direct and Indirect Costs………………………………….……… 111
Capital Development Program Expenditures Per Adopted Budget..…………..…………… 113
Compliance Section
Independent Auditor’s Report on Internal Control Over Financial Reporting and on Compliance and Other Matters Based on an Audit of Financial Statements Performed in
Accordance With Government Auditing Standards……………………………………… 114 Prepared by: Finance and Administration Bureau of Port of Los Angeles

INTRODUCTORY SECTION

- 1 -
December 18, 2017
Mr. Eugene D. Seroka Executive Director Port of Los Angeles San Pedro, California
This Comprehensive Annual Financial Report (CAFR) of the Port of Los Angeles(the Port), Harbor Department of the City of Los Angeles, California (the City), for the years ended June 30, 2017 and 2016, is hereby submitted. Introduction The management of the Port has prepared this annual report. The responsibility for both the accuracy of the presented data, and the completeness and fairness of the presentation, including all disclosures, rests with the Port. To the best of management’s knowledge and belief, the enclosed data are accurate in all material respects and are reported in a manner designed to present fairly the financial position and changes in financial position of the Port. All disclosures necessary to enable the reader to gain an understanding of the Port’s financial activities have been included. The report contains the audited financial statements of the Port for the fiscal years ended June 30, 2017 and 2016, which have received an unmodified opinion from the Port’s independent auditors and are presented in accordance with generally accepted accounting principles (GAAP). The report is presented in three sections: Introductory, Financial, and Statistical. The Introductory Section outlines the relationship of the Port to the City and describes the organization and reporting entity. It additionally provides an overview of Port properties, operations, and key personnel. The Financial Section includes the Independent Auditor’s Report, Management’s Discussion and Analysis, Basic Financial Statements, and Required Supplementary Information. Management’s Discussion and Analysis presents a comparative review of financial position and changes in financial position for fiscal years 2017, 2016, and 2015. Also included in this section are a description of current and proposed capital development plans, a discussion of revenue growth, and an overview of the economic conditions and the competitive environment in which the Port operates. The basic financial statements are prepared on an accrual basis and use an economic resources measurement focus. The basic financial statements comprise the statements of net position that present the financial position as of June 30, 2017 and 2016, statements of revenues, expenses, and changes in net position depicting financial performance for fiscal years 2017 and 2016, statements of cash flows that present the source and application of funds from operations, financing (noncapital and capital related), and investment activities for fiscal years 2017 and 2016, and notes to the basic financial statements. The accompanying notes to the basic financial statements further explain and support the information in the statements.

- 2 -
The Port of Los Angeles
The Port is a proprietary department of the City and is held in trust by the City for the people of the State of California (the State) pursuant to a series of tidelands grants. The Port is operated independently from the City, generating its own revenues, and administering and controlling its own expenses and fiscal activities. The Port is governed by the Board of Harbor Commissioners (the Board) which consists of five commissioners, approved by the Mayor and confirmed by the City Council (the Council).
Most of the properties on which the Port’s land, docks, wharves, transit sheds, terminals and other facilities are located is owned by the State and administered by the City through the Port, pursuant to certain tidelands grants from the State. The Port has the duty to provide for the needs of maritime commerce, navigation, fishing and recreation and environmental activities that are water-related and are intended to be of statewide benefit. In accordance with GAAP, the accompanying financial statements are included as an Enterprise Fund of the City.
In addition, based on the foregoing criteria of oversight responsibility and accountability of all Port-related entities, the operations of the Los Angeles Harbor Improvements Corporation, a nonprofit corporation, have been included in the accompanying financial statements. Two joint ventures with the Port of Long Beach have been recorded as investments of the Port in accordance with the equity method of accounting. Additional information regarding these joint ventures and shareholders agreement may be found in the notes to the basic financial statements for the Port.
The management and operation of the Port are under the direction of the Executive Director, who is responsible for coordinating and directing the activities of several major management groups or bureaus. These bureaus each consist of multiple divisions and fall under the responsibilities of five senior executives who report directly to the Executive Director. The Port’s management structure is described in more detail below.
- The Deputy Executive Director of External Affairs leads the External Affairs Bureau, which consists of the Communications (including Community Relations and Media Relations), Government Affairs, Trade Development, and Commission Office divisions.
- The Deputy Executive Director & Chief Financial Officer leads the Finance and Administration Bureau, which consists of the Contracts and Purchasing, Human Resources, Accounting, Debt and Treasury Management, Financial Management, Management Audit, and Risk Management divisions.
- The Chief of Public Safety & Emergency Management leads the Public Safety & Emergency
Management Bureau, which consists of the Los Angeles Pilot Service, Port Police, and Information Technology divisions.
- The Deputy Executive Director of Marketing & Customer Relations leads the Marketing & Customer Relations Bureau, which consists of the Planning & Strategy, Cargo Marketing, Environmental Management, Waterfront/Commercial Real Estate, Cargo/Industrial Real Estate, and Wharfingers divisions.
- The Deputy Executive Director of Development leads the Development Bureau, which consists of the Construction, Goods Movement, Construction and Maintenance, and Engineering divisions.
The Port is located in the San Pedro Bay, approximately 20 miles south of downtown Los Angeles. The Port’s facilities lie within the shelter of a nine-mile long breakwater constructed by the federal government in several stages, the first of which commenced in 1899. The breakwater encloses the largest man-made harbor in the Western hemisphere.

The Port operates primarily as a landlord, as opposed to an operating port. Its docks, wharves, transit sheds, and terminals are leased to shipping or terminal companies, agents, and to other private firms. Although the Port owns these facilities, it has no direct hand in managing the daily movement of cargo. The Port is a landlord to close to 300 entities. In addition to major terminal operators, other tenants include marinas, commercial fishing operations, cruise operations, restaurants, and recreational facilities.
The major sources of income for the Port are from shipping services (wharfage, dockage, pilotage, assignment charges, etc.), land rentals, fees, concessions, and royalties. It currently serves approximately 80 shipping companies and agents with facilities that include 270 berthing facilities along 43 miles of waterfront.
In terms of its size and volume, the Port is one of the world's largest and busiest ports. The Port encompasses approximately 4,300 acres of land and 3,200 acres of water. The Port is a deep-water port with a minimum depth of 45 feet below mean low water mark and 53 feet in its main channel and at the bulk loader and supertanker channels. Two major railroads serve the Port.
The Port lies at the terminus of two major freeways within the Los Angeles freeway system. Subsurface pipelines link the Port to major refineries and petroleum distribution terminals within the Los Angeles Basin.
The Port handles the largest volume of containerized cargo of all U.S. ports, and additionally ranks as number one in cargo value for U.S. waterborne foreign traffic. The Port's major trading partners, concentrated along the Pacific Rim, include China/Hong Kong, Japan, South Korea, Taiwan, and Vietnam. Cargo to and from these countries represents the bulk of the total value of all cargo shipped through the Port.
The Port must be financially self-sufficient through the revenues it generates as it has no taxing authority. When appropriate, it seeks to obtain State and Federal funding for defined projects. The Port continues to maintain an AA/Aa2/AA credit ratings with Standard & Poor's Rating Services, Moody's Investors Service, and Fitch Ratings, respectively, with a "stable" outlook. These are the highest credit ratings for any stand-alone U.S. port.
Publication of this CAFR is a reflection of the excellence and professionalism of the Port's entire staff. The preparation of this report would not have been possible without the skill, effort, and dedication of the entire staff of the Finance and Administration Bureau. We wish to thank all Port's divisions for their assistance in providing the data necessary to prepare this report.
Sincerely,
MARLA BLEAVINS Deputy Executive Director and Chief Financial Officer
- 3 -

PORT OF LOS ANGELES (HARBOR DEPARTMENT OF THE CITY OF LOS ANGELES, CALIFORNIA)
Organizational Chart Fiscal Year 2016-2017
- 4 -
Executive Director City Attorney
Commission Office
Community Relations
Media Relations
Government Affairs
Trade Development
Board of Harbor Commissioners
Construction
Construction & Maintenance
External Affairs Finance &
Administration
Marketing & Customer Relations
Engineering
Public Safety & Emergency
Management Development
Communications
Goods Movement
Information Technology
Port Pilots
Port Police Financial Management
Debt & Treasury Management
Risk Management
Human Resources
Management Audit
Contracts & Purchasing
Cargo Marketing
Wharfingers
Waterfront/ Commercial Real
Estate
Planning & Strategy
Environmental Management
Cargo/ Industrial Real Estate
Accounting

PORT OF LOS ANGELES (HARBOR DEPARTMENT OF THE CITY OF LOS ANGELES, CALIFORNIA)
- 5 -
BOARD OF HARBOR COMMISSIONERS
SENIOR MANAGEMENT
Eugene D. Seroka Executive Director
Vacant Deputy Executive Director External Relations Marla Bleavins Deputy Executive Director & Chief Financial Officer Finance & Administration Thomas Gazsi Chief of Public Safety & Emergency Management
Michael Di Bernardo Deputy Executive Director Marketing & Customer Relations Tony Gioiello Deputy Executive Director Development
MANAGEMENT STAFF Theresa Adams Lopez Director of Community Relations Arley Baker Senior Director of Communications Christopher Cannon Director of Environmental Management Tricia Carey Director of Contracts & Purchasing Eric Caris Director of Cargo Marketing Kerry Cartwright Director of Goods Movement Capt. John Dwyer Pilot Service Capt. David Craig Flinn Pilot Service
Michael Galvin Director of Waterfront & Commercial Real Estate Jack Hedge Director of Cargo/Industrial Real Estate Julie Huerta Commission Office Lance Kaneshiro Director of Information Technology Michael Keenan Director of Planning & Economic Development David Libatique Senior Director of Governmental Affairs Frank Liu Director of Accounting
Tish Lorenzana Director of Human Resources James MacLellan Director of Business & Trade Development Tim Clark Director of Construction & Maintenance Kathy Merkovsky Director of Risk Management Jim Olds Director of Management Audits Timothy Riley Assistant Chief of Port Police Soheila Sajadian Director of Debt & Treasury Management Phillip Sanfield Director of Media Relations
Shaun Shahrestani Chief Harbor Engineer of Construction Jeffrey Strafford Director of Financial Management Dave Walsh Chief Harbor Engineer of Design Damien Young Interim Chief Wharfinger CITY ATTORNEY STAFF Janna Sidley General Counsel
Ambassador Vilma S. Martinez President
David Arian Vice President
Anthony Pirozzi, Jr. Commissioner
Edward R. Renwick Commissioner
Lucia Moreno‐Linares Commissioner

FINANCIAL SECTION

www.mgocpa.com Macias Gini & O’Connell LLP 777 S. Figueroa Street, Suite 2500 Los Angeles, CA 90017
6
Independent Auditor’s Report
Honorable Members of the Board of Harbor Commissioners Port of Los Angeles (Harbor Department of the City of Los Angeles) Report on the Financial Statements We have audited the accompanying financial statements of the Port of Los Angeles (Harbor Department of the City of Los Angeles) (Port), an enterprise fund of the City of Los Angeles, California, as of and for the fiscal years ended June 30, 2017 and 2016, and the related notes to the financial statements, as listed in the table of contents. Management’s Responsibility for the Financial Statements Management is responsible for the preparation and fair presentation of these financial statements in accordance with accounting principles generally accepted in the United States of America; this includes the design, implementation, and maintenance of internal control relevant to the preparation and fair presentation of financial statements that are free from material misstatement, whether due to fraud or error. Auditor’s Responsibility Our responsibility is to express an opinion on these financial statements based on our audits. We conducted our audits in accordance with auditing standards generally accepted in the United States of America and the standards applicable to financial audits contained in Government Auditing Standards, issued by the Comptroller General of the United States. Those standards require that we plan and perform the audit to obtain reasonable assurance about whether the financial statements are free from material misstatement. An audit involves performing procedures to obtain audit evidence about the amounts and disclosures in the financial statements. The procedures selected depend on the auditor’s judgment, including the assessment of the risks of material misstatement of the financial statements, whether due to fraud or error. In making those risk assessments, the auditor considers internal control relevant to the entity’s preparation and fair presentation of the financial statements in order to design audit procedures that are appropriate in the circumstances, but not for the purpose of expressing an opinion on the effectiveness of the entity’s internal control. Accordingly, we express no such opinion. An audit also includes evaluating the appropriateness of accounting policies used and the reasonableness of significant accounting estimates made by management, as well as evaluating the overall presentation of the financial statements. We believe that the audit evidence we have obtained is sufficient and appropriate to provide a basis for our audit opinion. Opinion In our opinion, the financial statements referred to above present fairly, in all material respects, the financial position of the Port, as of June 30, 2017 and 2016, and the changes in its financial position and its cash flows for the fiscal years then ended in accordance with accounting principles generally accepted in the United States of America.

7
Emphasis of Matter As discussed in Note 1 to the financial statements, the financial statements present only the Port and do not purport to, and do not, present fairly the financial position of the City of Los Angeles, California, as of June 30, 2017 and 2016, the changes in its financial position, or, where applicable, its cash flows for the fiscal years then ended in accordance with accounting principles generally accepted in the United States of America. Our opinion is not modified with respect to this matter. Other Matters Required Supplementary Information Accounting principles generally accepted in the United States of America require that the management’s discussion and analysis, schedule of proportionate share of the net pension liability and related ratios and schedule of contributions, as listed in the table of contents, be presented to supplement the financial statements. Such information, although not a part of the financial statements, is required by the Governmental Accounting Standards Board who considers it to be an essential part of financial reporting for placing the financial statements in an appropriate operational, economic, or historical context. We have applied certain limited procedures to the required supplementary information in accordance with auditing standards generally accepted in the United States of America, which consisted of inquiries of management about the methods of preparing the information and comparing the information for consistency with management’s responses to our inquiries, the financial statements, and other knowledge we obtained during our audit of the financial statements. We do not express an opinion or provide any assurance on the information because the limited procedures do not provide us with sufficient evidence to express an opinion or provide any assurance. Other Information The introductory and statistical sections have not been subjected to the auditing procedures applied in the audit of the financial statements, and accordingly, we do not express an opinion or provide any assurance on them. Other Reporting Required by Government Auditing Standards In accordance with Government Auditing Standards, we have also issued our report dated December 18, 2017 on our consideration of the Port’s internal control over financial reporting and on our tests of its compliance with certain provisions of laws, regulations, contracts, grant agreements and other matters. The purpose of that report is solely to describe the scope of our testing of internal control over financial reporting and compliance and the results of that testing, and not to provide an opinion on the Port’s internal control over financial reporting or on compliance. That report is an integral part of an audit performed in accordance with Government Auditing Standards in considering the Port’s internal control over financial reporting and compliance.
Los Angeles, California December 18, 2017

PORT OF LOS ANGELES (HARBOR DEPARTMENT OF THE CITY OF LOS ANGELES, CALIFORNIA)
Management’s Discussion and Analysis
June 30, 2017 and 2016
(Unaudited)
- 8 - Continued…..
Using This Financial Report
The management of the Port of Los Angeles (the Port) presents an overview of the Port’s financial performance during the years ended June 30, 2017 and 2016. This discussion and analysis should be read in conjunction with the transmittal letter on pages 1-3 and the Port’s basic financial statements starting from page 40.
The Port’s financial report consists of this management’s discussion and analysis (MD&A), and the following financial statements:
● Statements of Net Position – present information of all of the Port’s assets, deferred outflows of resources, liabilities, and deferred inflows of resources as of June 30, 2017 and 2016. The sum of assets and deferred outflows of resources minus the sum of liabilities and deferred inflows of resources is reported as net position, which over time may increase or decrease and, serves as an indicator of the Port’s financial position.
● Statements of Revenues, Expenses, and Changes in Net Position – present the results of operations during the current and prior fiscal year. These show the sources of the Port’s revenues and its expenses. Revenues and expenses are recorded and reported for some items that will result in cash flows in future periods. Changes in net position are reported when the underlying events occurred, regardless of the timing of the related cash flows.
● Statements of Cash Flows – present the inflows and outflows of cash and cash equivalents resulting from operating, noncapital financing, capital and related financing, and investing activities. A reconciliation is also provided to assist in understanding the difference between operating income and cash flows from operating activities.
● Notes to the Basic Financial Statements – present information that is not displayed on the face of the financial statements. Such information is essential to a full understanding of the Port’s financial activities.

PORT OF LOS ANGELES (HARBOR DEPARTMENT OF THE CITY OF LOS ANGELES, CALIFORNIA)
Management’s Discussion and Analysis
June 30, 2017 and 2016
(Unaudited)
- 9 - Continued…..
Overview of the Port’s Financial Statements
The Port is a fiscally independent department and an enterprise fund of the City of Los Angeles, California (the City). The Port’s financial statements are prepared on an accrual basis using the economic resources measurement focus in accordance with generally accepted accounting principles promulgated by the Governmental Accounting Standards Board (GASB). The notes to the basic financial statements on pages 47 to 103 provide additional information that is essential to a full understanding of the data provided in the financial statements.
Financial Highlights for Fiscal Year 2017
● Current assets exceeded current liabilities by $495.1 million.
● Capital assets, net of accumulated depreciation and amortization of $2.0 billion amounted to $3.9 billion.
● Total assets and deferred outflows of resources exceeded total liabilities and deferred inflows of resources by $3.3 billion.
● Bonded debt net of unamortized discounts/premiums of $77.6 million, totaled $969.3 million.
● Operating revenue amounted to $474.5 million.
● Net operating expenses excluding depreciation of $172.9 million amounted to $227.7 million.
● Capital contributions amounted to $18.8 million.

PORT OF LOS ANGELES (HARBOR DEPARTMENT OF THE CITY OF LOS ANGELES, CALIFORNIA)
Management’s Discussion and Analysis
June 30, 2017 and 2016
(Unaudited)
- 10 - Continued…..
Financial Highlights for Fiscal Year 2016
● Current assets exceeded current liabilities by $358.6 million.
● Capital assets, net of accumulated depreciation and amortization of $1.9 billion amounted to $4.0 billion.
● Total assets and deferred outflows of resources exceeded total liabilities and deferred inflows of resources by $3.2 billion.
● Bonded debt net of unamortized discounts/premiums of $57.2 million, totaled $1.0 billion.
● Operating revenue amounted to $436.1 million.
● Net operating expenses excluding depreciation of $163.9 million amounted to $226.3 million.
● Capital contributions amounted to $40.5 million.
.

PORT OF LOS ANGELES (HARBOR DEPARTMENT OF THE CITY OF LOS ANGELES, CALIFORNIA)
Management’s Discussion and Analysis
June 30, 2017 and 2016
(Unaudited)
- 11 - Continued…..
Analysis of Net Position
Net position is the sum of assets and deferred outflows of resources minus liabilities and deferred inflows of resources. Over time, increases or decreases in net position may serve as an indicator of whether the Port’s financial position is improving or deteriorating. The following is a condensed summary of the Port’s net position as of June 30, 2017, 2016, and 2015 (in thousands):
Condensed Net Position
Increase (Decrease) Over Prior Year
FY 2017 FY 2016 FY 2015 FY 2017 FY 2016
Assets
Current and other assets $ 753,106 $ 634,124 $ 637,824 $ 118,982 $ (3,700) Capital assets, net 3,925,084 3,950,902 3,912,136 (25,818) 38,766
Total assets 4,678,190 4,585,026 4,549,960 93,164 35,066
Deferred outflows of resources 79,575 44,857 50,714 34,718 (5,857)
Liabilities
Current liabilities 180,120 164,471 176,498 15,649 (12,027) Long-term liabilities 1,282,205 1,281,576 1,317,027 629 (35,451)
Total liabilities 1,462,325 1,446,047 1,493,525 16,278 (47,478)
Deferred inflows of resources 30,042 21,881 44,250 8,161 (22,369)
Net positionNet investment in capital assets 2,972,442 2,945,412 2,856,561 27,030 88,851 Restricted for debt service 62,255 66,599 68,373 (4,344) (1,774) Unrestricted 230,701 149,944 137,965 80,757 11,979
Total net position $ 3,265,398 $ 3,161,955 $ 3,062,899 $ 103,443 $ 99,056
Net Position, Fiscal Year 2017
The largest portion of the Port’s net position ($3.0 billion or 91.0%) reflects its net investment in capital assets (e.g. land, facilities and equipment, construction in progress and intangible assets). These assets are used for the construction, operation and maintenance of Port facilities. An additional portion of the Port’s net position ($62.3 million or 1.9%) represents resources that are restricted for the debt service reserve fund. The remaining balance of $230.7 million or 7.1% are unrestricted resources that may be used to meet the Port’s ongoing obligations.
Current and other assets increased by $119.0 million or 18.8% from $634.1 million in fiscal year 2016 to $753.1 million in fiscal year 2017. This increase in current assets occurred due to higher year-over-year unrestricted cash levels.

PORT OF LOS ANGELES (HARBOR DEPARTMENT OF THE CITY OF LOS ANGELES, CALIFORNIA)
Management’s Discussion and Analysis
June 30, 2017 and 2016
(Unaudited)
- 12 - Continued…..
Unrestricted and restricted cash, cash equivalents, and investments consist primarily of cash and pooled investments held by the City Treasury on behalf of the Port. The increase of $135.1 million from $572.4 million at June 30, 2016 to $707.5 million at June 30, 2017 was primarily due to the aforementioned increased unrestricted cash levels. Unrestricted cash was driven higher over the course of the fiscal year as record cargo volumes drove operating income to levels which more than sufficiently covered annual capital spending and debt service obligations. In addition, unrestricted cash was driven higher by the receipt of one-time legal settlement awards and insurance settlement proceeds. At June 30, 2017, the Port’s share in the fair value measurement of the City’s pooled investments reflected a decline of $0.1 million. The Port reported additional investments of $34.8 million from its share in the City’s investment purchases on June 30, 2017, and $4.4 million in securities lending transactions.
Grants receivable decreased by $9.2 million as grant funded projects progressed over the course of the fiscal year and their associated grant funds were drawn down.
Capital assets, net of depreciation decreased by $25.8 million due to the salvage of old cranes and lower spending on certain projects at Trapac, cruise and WWL Auto terminals.
Current liabilities increased by $15.6 million or 9.5% mainly due to an increase in other current liabilities for the Port’s share in the City’s investment purchases on June 30, 2017 settled subsequently in the next fiscal year.
Long-term liabilities increased by $0.6 million as increases in long-term environmental remediation obligations and net pension liabilities slightly exceeded the decline in bonds payable arising from the customary repayment of principal in conjunction with the Port’s annual servicing of its debt.
Net Position, Fiscal Year 2016
The largest portion of the Port’s net position ($2.9 billion or 93.2%) reflects its net investment in capital assets (e.g. land, facilities and equipment, construction in progress and intangible assets). These assets are used for the construction, operation and maintenance of Port facilities. An additional portion of the Port’s net position ($66.6 million or 2.1%) represents resources that are restricted for the debt service reserve fund. The remaining balance of $150.0 million or 4.7% are unrestricted resources that may be used to meet the Port’s ongoing obligations.
Current and other assets decreased by $3.7 million or 0.6% from $637.8 million in fiscal year 2015 to $634.1 million in fiscal year 2016. Fluctuations in current and other assets resulted from a decrease in notes receivable of $5.1 million as the notes matured in fiscal year 2016.
Unrestricted and restricted cash, cash equivalents, and investments consist primarily of cash and pooled investments held by the City Treasury on behalf of the Port. The decrease of $1.7 million from $574.1 million at June 30, 2015 to $572.4 million at June 30, 2016 was due to the decrease in the debt service reserve fund resulting from the early redemption of bonds during fiscal year 2016. At June 30, 2016, the Port’s share in the fair value measurement of the City’s pooled investments totaled $4.5 million. The Port reported additional investments of $8.6 million from its share in the City’s investment purchases on June 30, 2016, and $7.9 million in securities lending transactions.

PORT OF LOS ANGELES (HARBOR DEPARTMENT OF THE CITY OF LOS ANGELES, CALIFORNIA)
Management’s Discussion and Analysis
June 30, 2017 and 2016
(Unaudited)
- 13 - Continued…..
Grants receivable increased by $5.1 million mainly because more eligible projects were completed and reimbursed by grantors at fiscal year-end relative to prior fiscal year.
Capital assets, net of depreciation increased by $38.8 million due to continued commercial and terminal development, various building and facilities improvements, and acquisition of equipment.
Current liabilities decreased by $12.0 million or 6.8% mainly due to a decrease in accounts payable as invoices were paid more quickly relative to prior fiscal year.
Long-term liabilities decreased by $35.5 million primarily due to customary repayment of principal in conjunction with the Port’s annual servicing of its debt, as well as an early redemption of debt in September 2015.

PORT OF LOS ANGELES (HARBOR DEPARTMENT OF THE CITY OF LOS ANGELES, CALIFORNIA)
Management’s Discussion and Analysis
June 30, 2017 and 2016
(Unaudited)
- 14 - Continued…..
Analysis of the Port’s Activities
The following table presents condensed information showing how the Port’s net position changed during fiscal years 2017, 2016 and 2015 (in thousands):
Condensed Changes in Net Position
Increase (Decrease) Over Prior Year
FY 2017 FY 2016 FY 2015 FY 2017 FY 2016
Operating revenue $ 474,532 $ 436,126 $ 446,895 $ 38,406 $ (10,769) Less: Operating expenses 227,675 226,261 234,249 1,414 (7,988) Operating income before
depreciation and amortization 246,857 209,865 212,646 36,992 (2,781) Less: Depreciation and amortization 172,895 163,933 137,384 8,962 26,549 Operating income 73,962 45,932 75,262 28,030 (29,330) Net nonoperating revenue (expenses) 1,530 7,512 5,293 (5,982) 2,219 Income before capital contributions 75,492 53,444 80,555 22,048 (27,111) Capital contributions 18,801 40,489 111,852 (21,688) (71,363) Extraordinary Item 9,150 5,123 -- 4,027 5,123 Changes in net position 103,443 99,056 192,407 4,387 (93,351) Net position, July 1 3,161,955 3,062,899 3,064,554 99,056 (1,655) Cumulative effect of change in
accounting principles -- -- (194,062) -- 194,062 Net position, July 1, restated 3,161,955 3,062,899 2,870,492 99,056 192,407 Net position, June 30 $ 3,265,398 $ 3,161,955 $ 3,062,899 $ 103,443 $ 99,056
Changes in Net Position, Fiscal Year 2017 Net position for the Port posted a $103.4 million or 3.3% increase in fiscal year 2017. Approximately $449.5 million or 94.7% of total operating revenues were derived from fees for shipping services and leasing of facilities to customers. Since the Port operates as a landlord, operating expenses are principally administrative in nature. Operating expenses were higher by $1.4 million in fiscal year 2017 compared to the previous fiscal year.
Depreciation expense increased by $9.0 million to $172.9 million in fiscal year 2017 from $163.9 million in fiscal year 2016, primarily due to the completion of capital projects that have been put into service in recent years.
Nonoperating revenues for fiscal year 2017 totaled $13.2 million, while nonoperating expenses were $11.7 million, thereby resulting in net nonoperating revenue of $1.5 million. Nonoperating revenues of $13.2 million include: $2.2 million of income from an investment in the Intermodal Container Transfer Facility Joint Powers Authority, $1.1 million from interest and investment income from the Port’s cash in the City’s pooled investments, $1.2 million from noncapital grants, $7.9 million from pass through grant revenue, as well as $0.8 million from various rebates, reimbursements, and miscellaneous other receipts. Nonoperating

PORT OF LOS ANGELES (HARBOR DEPARTMENT OF THE CITY OF LOS ANGELES, CALIFORNIA)
Management’s Discussion and Analysis
June 30, 2017 and 2016
(Unaudited)
- 15 - Continued…..
expenses of $11.7 million include $0.6 million of interest on indebtedness, $7.9 million from pass through grant expenditures, $0.8 million of expenses resulting from certain capitalized projects being discontinued during the fiscal year, and $2.4 million related to the costs of issuing debt and maintaining liquidity support for the commercial paper program during the fiscal year.
As a result, income before capital contributions increased by $22.1 million or 41.3% to $75.5 million in fiscal year 2017 from $53.4 million in fiscal year 2016.
Capital contributions of $18.8 million represented funds for capital grants obtained in fiscal year 2017, and decreased by $21.7 million compared to the $40.5 million received in fiscal year 2016. Capital grant reimbursements in fiscal year 2017 funded initiatives such as the Yusen Terminal Efficiency Enhancements and Truck Trip Redesign Program ($7.7 million), I-110/C-Street Access Ramp Improvements ($4.5 million), I-110/SR-47/Harbor Boulevard Connectors ($2.3 million), Trapac Terminal Construction ($1.5 million), the South Wilmington Grade Separation ($1.4 million), San Pedro Waterfront Development ($0.7 million) and Rail Yard Track Connections at Berth 200 ($0.7 million).
Insurance recovery for the fire damage to Berths 177-178 and a portion of Berth 179 in 2014 in the amount of $9.2 million was received in fiscal year 2017 and reflected as Extraordinary Item. See page 103 of this report for additional information.
Changes in Net Position, Fiscal Year 2016 Net position for the Port posted a $99.1 million or 3.2% increase in fiscal year 2016. Approximately $415.0 million or 95.2% of total operating revenues were derived from fees for shipping services and leasing of facilities to customers. Since the Port operates as a landlord, operating expenses are principally administrative in nature. Operating expenses were lower by $8.0 million in fiscal year 2016 compared to the previous fiscal year.
Depreciation expense increased by $26.5 million to $163.9 million in fiscal year 2016 from $137.4 million in fiscal year 2015, primarily due to the completion of capital projects that have been put into service in recent years.
Nonoperating revenues for fiscal year 2016 totaled $16.3 million, while nonoperating expenses were $8.8 million, thereby resulting in net nonoperating revenue of $7.5 million. Nonoperating revenues of $16.3 million include: $2.5 million of income from an investment in the Intermodal Container Transfer Facility Joint Powers Authority, $9.3 million from interest and investment income from the Port’s cash in the City’s pooled investments, $0.7 million from noncapital grants, $1.6 million from pass through grant revenue, as well as $2.2 million from various rebates, reimbursements, and miscellaneous other receipts. Nonoperating expenses of $8.8 million include $0.5 million of interest on indebtedness, $1.6 million from pass through grant expenditures, $5.3 million of expenses resulting from certain capitalized projects being discontinued during the fiscal year, and $1.4 million related to the costs of issuing debt and maintaining liquidity support for the commercial paper program during the fiscal year.
As a result, income before capital contributions decreased by $27.1 million or 33.7% to $53.4 million in fiscal year 2016 from $80.6 million in fiscal year 2015.

PORT OF LOS ANGELES (HARBOR DEPARTMENT OF THE CITY OF LOS ANGELES, CALIFORNIA)
Management’s Discussion and Analysis
June 30, 2017 and 2016
(Unaudited)
- 16 - Continued…..
Capital contributions of $40.5 million represented funds for capital grants obtained in fiscal year 2016, and decreased by $71.4 million compared to the $111.9 million received in fiscal year 2015. Capital grant reimbursements in fiscal year 2016 came from the California Transportation Commission for the Proposition 1B transportation projects ($23.1 million), Metropolitan Transit Authority for the Trade Corridor Improvement project ($7.1 million), U.S. Department of Homeland Security for the Information Technology Cyber Security projects ($1.4 million), U.S. Environmental Protection Agency for various clean diesel programs ($1.6 million), and U.S. Department of Transportation for various transportation projects ($7.3 million).
Insurance recovery for the fire damage to Berths 177-178 and a portion of Berth 179 in 2014 in the amount of $5.1 million was received in fiscal year 2016 and reflected as Extraordinary Item. See page 103 of this report for additional information.
PORT OF LOS ANGELES (HARBOR DEPARTMENT OF THE CITY OF LOS ANGELES, CALIFORNIA)
Management’s Discussion and Analysis
June 30, 2017 and 2016
(Unaudited)
- 17 - Continued…..
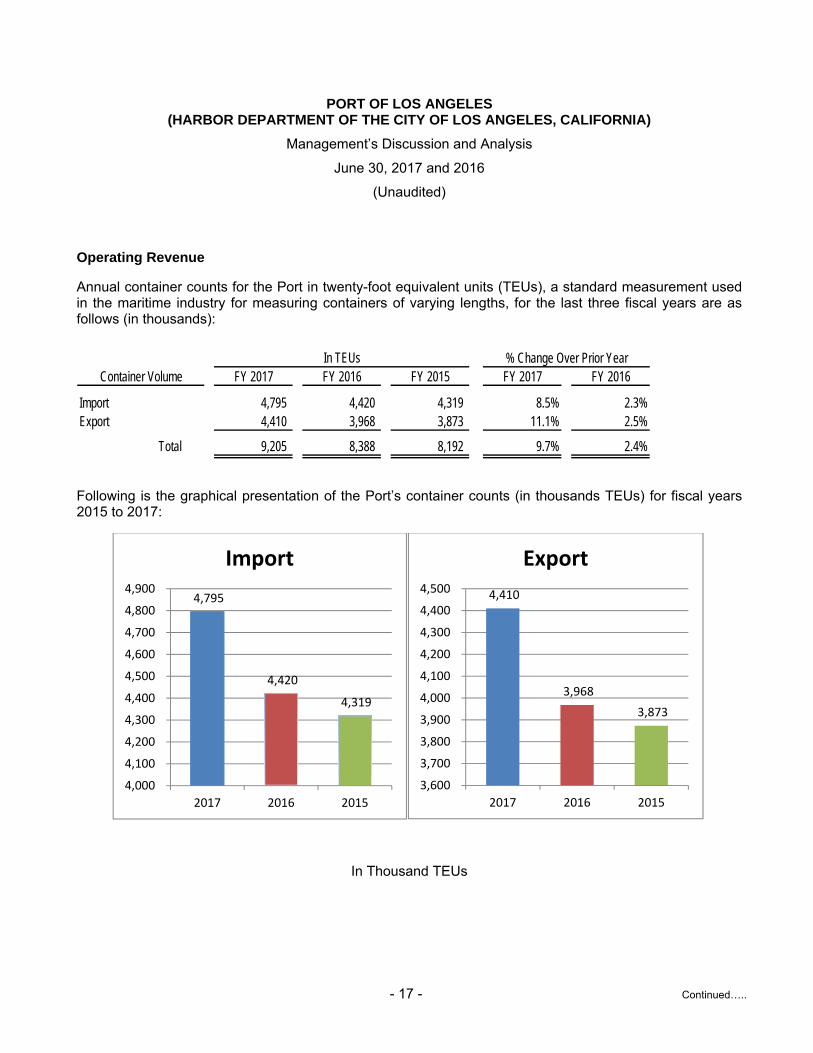
Operating Revenue
Annual container counts for the Port in twenty-foot equivalent units (TEUs), a standard measurement used in the maritime industry for measuring containers of varying lengths, for the last three fiscal years are as follows (in thousands):
% Change Over Prior YearContainer Volume FY 2017 FY 2016 FY 2015 FY 2017 FY 2016
Import 4,795 4,420 4,319 8.5% 2.3%Export 4,410 3,968 3,873 11.1% 2.5%
Total 9,205 8,388 8,192 9.7% 2.4%
In TEUs
Following is the graphical presentation of the Port’s container counts (in thousands TEUs) for fiscal years 2015 to 2017:
In Thousand TEUs
4,795
4,420
4,319
4,000
4,100
4,200
4,300
4,400
4,500
4,600
4,700
4,800
4,900
2017 2016 2015
Import
4,410
3,968
3,873
3,600
3,700
3,800
3,900
4,000
4,100
4,200
4,300
4,400
4,500
2017 2016 2015
Export

PORT OF LOS ANGELES (HARBOR DEPARTMENT OF THE CITY OF LOS ANGELES, CALIFORNIA)
Management’s Discussion and Analysis
June 30, 2017 and 2016
(Unaudited)
- 18 - Continued…..
The Port is the leading seaport in North America in terms of shipping container volume. The following presents a summary of cargo volumes by major classification handled by the Port for the last three fiscal years (in thousands):
% Change Over Prior YearCargo Type FY 2017 FY 2016 FY 2015 FY 2017 FY 2016
Container/general cargo 184,318 167,298 165,106 10.2% 1.3%Dry bulk 553 1,201 1,378 -54.0% -12.8%Liquid bulk 13,206 14,308 10,348 -7.7% 38.3%
Total 198,077 182,807 176,832
In Metric Revenue Tons
Information for the cargo volume that moved through the Port for the last ten fiscal years may be found in the Statistical Section on page 107.
Following is the graphical presentation of the Port’s cargo volumes for fiscal years 2015 to 2017 in thousand metric tons:
In Thousand Metric Tons
184,318
167,298
165,106
155,000
160,000
165,000
170,000
175,000
180,000
185,000
190,000
2017 2016 2015
Container/General Cargo
553
1,201
1,378
‐‐
200
400
600
800
1,000
1,200
1,400
1,600
2017 2016 2015
Dry Bulk13,206
14,308
10,348
‐‐
2,000
4,000
6,000
8,000
10,000
12,000
14,000
16,000
2017 2016 2015
Liquid Bulk

PORT OF LOS ANGELES (HARBOR DEPARTMENT OF THE CITY OF LOS ANGELES, CALIFORNIA)
Management’s Discussion and Analysis
June 30, 2017 and 2016
(Unaudited)
- 19 - Continued…..
The Port is the number one port by container volume in North America. Fiscal Year 2017 cargo volumes of 9.2 million TEUs represented a 9.7% increase relative to the prior fiscal year. Total loaded containers of 6.6 million represented a 9.9% increase relative to the prior fiscal year, and this increase was driven by an 8.5% increase in loaded imports. Empty containers totaling 2.6 million TEUs represented a year-over-year increase of 9.2%.
Many of the largest global container shipping lines, such as Maersk, China-COSCO Shipping, CMA CGM/APL, Evergreen, NYK, MOL, and Yang Ming have interests in the Port’s major container leaseholds. While their collective efforts drove the success of the Port’s TEU results, a significant contributor to the increase in container volumes was the shift of cargo from the Port of Long Beach to the Eagle Marine Services facility at the Port of Los Angeles following the acquisition of APL by CMA CGM.
Ultimately, the Port closed its fiscal year 2017 with total cargo volumes of 9.2 million TEUs, a new annual record for most container throughput for a Western Hemisphere port and the busiest year in the Port’s 110-year history.

PORT OF LOS ANGELES (HARBOR DEPARTMENT OF THE CITY OF LOS ANGELES, CALIFORNIA)
Management’s Discussion and Analysis
June 30, 2017 and 2016
(Unaudited)
- 20 - Continued…..
The Port’s major sources of its operating revenue are derived from shipping services, rental fees, royalties and other concession fees. The following table presents a summary of the Port’s operating revenues during fiscal years 2017, 2016 and 2015 (in thousands):
Summary of Operating Revenues
Increase (Decrease) Over Prior Year
FY 2017 FY 2016* FY 2015 FY 2017 FY 2016
Shipping servicesWharfage $ 369,459 $ 341,765 $ 336,090 $ 27,694 $ 5,675 Dockage and demurrage 4,326 5,845 6,426 (1,519) (581) Pilotage 9,558 7,064 7,110 2,494 (46) Assignment and other charges 14,912 13,796 15,273 1,116 (1,477)
Total shipping services 398,255 368,470 364,899 29,785 3,571
RentalsLand 50,554 45,763 45,255 4,791 508 Other 704 808 978 (104) (170)
Total rentals 51,258 46,571 46,233 4,687 338
Royalties and other feesFees, concession and royalties 10,436 10,655 14,968 (219) (4,313) Clean truck program fees 2,340 2,384 3,520 (44) (1,136) Other 12,243 8,046 17,275 4,197 (9,229)
Total royalties and other fees 25,019 21,085 35,763 3,934 (14,678) Total operating revenues $ 474,532 $ 436,126 $ 446,895 $ 38,406 $ (10,769)
* Certain information was reclassified to conform to current year's presentation.

PORT OF LOS ANGELES (HARBOR DEPARTMENT OF THE CITY OF LOS ANGELES, CALIFORNIA)
Management’s Discussion and Analysis
June 30, 2017 and 2016
(Unaudited)
- 21 - Continued…..
The following charts show the major components of the Port’s sources of operating revenue for fiscal years 2017 and 2016:
Fiscal Year 2017
Fiscal Year 2016
Wharfage, 92.8%
Dockage and
demurrage, 1.1%
Pilotage, 2.4%
Assignment and other charges,
3.7%
Shipping Services
Land, 98.6%
Others, 1.4%
Rentals
Fees, concession
and royalties,
41.7%
Clean truck program
fees, 9.4%
Others, 48.9%
Royalties and other fees
Wharfage, 92.8%
Dockage and
demurrage, 1.6%
Pilotage, 1.9%
Assignment and other charges,
3.7%
Shipping Services
Land, 98.3%
Others, 1.7%
Rentals
Fees, concession
and royalties,
50.5%
Clean truck program
fees, 11.3%
Others, 38.2%
Royalties and other fees

PORT OF LOS ANGELES (HARBOR DEPARTMENT OF THE CITY OF LOS ANGELES, CALIFORNIA)
Management’s Discussion and Analysis
June 30, 2017 and 2016
(Unaudited)
- 22 - Continued…..
Operating Revenue, Fiscal Year 2017
Operating revenue for fiscal year 2017 increased to $474.5 million, reflecting an 8.8% increase from the prior year revenue of $436.1 million. As stated earlier, the Port derives its operating revenues primarily from shipping services, rentals, and fees from royalties, concessions and other fees.
Shipping Services
Shipping services revenues represented 83.9% of fiscal year 2017 total operating revenues and consist of several classifications of fees assessed for various activities relating to vessel and cargo movement. Of these fees, wharfage is the most significant and comprised 92.8% of the total shipping service revenues in fiscal year 2017. Wharfage is the fee charged against merchandise for passage over wharf premises, to and from vessels, and barges. Wharfage was $27.7 million higher compared to fiscal year 2016 mainly due to higher cargo volumes moved through terminals. Net other shipping services revenues were $2.1 million higher as pilotage revenue and assignment revenue increased by $2.5 million and $1.1 million, respectively, while dockage and demurrage revenues decreased by $1.5 million.
Rentals
The Port generates revenues from making available various types of rental properties such as land, buildings, warehouses, wharves, and sheds. Rates are negotiated for these properties based upon two general classifications, waterfront and backland. Independent appraisals are performed periodically to establish benchmark rates for these properties. Rates ultimately set in land rental agreements may be adjusted, within reason, to reflect general market conditions. Rates for other categories of properties are also set taking into account the condition, location, utility, and other aspects of the property.
During fiscal year 2017, rental income at the Port, which represented 10.8% of fiscal year 2017 total operating revenues, increased by $4.7 million, or 10.1%, over last fiscal year. The increase was due to $6.7 million in net rental rate increases and new permits offset by $1.4 million in the non-recurrence of one-time payments and $0.6 million in permit terminations.
Royalties, Fees, and Other Operating Revenue
The Port levies fees for a variety of activities conducted on the Port properties. Examples include royalties from the production of oil and natural gas, fees for parking lots, motion picture productions, foreign trade zone operations, miscellaneous concessions, distribution of utilities, and maintenance and repair services conducted by the Port at the request of customers.
Revenues from royalties, fees, and other operating revenues in fiscal year 2017 was $25.0 million or 5.3% of the total operating revenues. This represented an increase of $3.9 million in this revenue category compared with fiscal year 2016 mainly due to the receipt of $3.0 million in Harbor Maintenance Tax proceeds and $0.9 million in other miscellaneous receipts.

PORT OF LOS ANGELES (HARBOR DEPARTMENT OF THE CITY OF LOS ANGELES, CALIFORNIA)
Management’s Discussion and Analysis
June 30, 2017 and 2016
(Unaudited)
- 23 - Continued…..
Operating Revenue, Fiscal Year 2016
Operating revenue for fiscal year 2016 decreased to $436.1 million, reflecting a 2.4% decrease from the prior year revenue of $446.9 million. As stated earlier, the Port derives its operating revenues primarily from shipping services, rentals, and fees from royalties, concessions and other fees.
Shipping Services
Shipping services revenues represented 84.5% of the fiscal year 2016 total operating revenues and consist of several classifications of fees assessed for various activities relating to vessel and cargo movement. Of these fees, wharfage is the most significant and comprised 92.8% of the total shipping service revenues in fiscal year 2016. Wharfage is the fee charged against merchandise for passage over wharf premises, to and from vessels, and barges. Wharfage was $5.7 million higher compared to fiscal year 2015 mainly due to higher cargo volumes moved through terminals. Net other shipping revenues were $2.1 million lower as dockage and demurrage revenues and assignment revenue decreased by $0.6 million and $1.5 million, respectively.
Rentals
The Port generates revenues from making available various types of rental properties such as land, buildings, warehouses, wharves, and sheds. Rates are negotiated for these properties based upon two general classifications, waterfront and backland. Independent appraisals are performed periodically to establish benchmark rates for these properties. Rates ultimately set in land rental agreements may be adjusted, within reason, to reflect general market conditions. Rates for other categories of properties are also set taking into account the condition, location, utility, and other aspects of the property.
During fiscal year 2016, rental income at the Port, which represented 10.7% of fiscal year 2016 total operating revenues, increased by $0.3 million, or 0.7%, over the prior fiscal year. The increase was due to $5.9 million in higher compensation resets, CPI increases and new leases offset by $5.6 million in catch-up payments related to the Intermodal Container Transfer Facility in the prior fiscal year.
Royalties, Fees, and Other Operating Revenue
The Port levies fees for a variety of activities conducted on the Port properties. Examples include royalties from the production of oil and natural gas, fees for parking lots, motion picture productions, foreign trade zone operations, miscellaneous concessions, distribution of utilities, and maintenance and repair services conducted by the Port at the request of customers.
Revenues from royalties, fees, and other operating revenues in fiscal year 2016 was $21.1 million or 4.8% of the total operating revenues. This represented a decrease of $14.7 million in this revenue category compared with fiscal year 2015 mainly due to $4.7 million in lower license fees related to the BNSF/SCIG facility, $4.5 million in lower utility reimbursements, $3.9 million in lower one-time settlement receipts, $1.1 million in lower clean truck program revenues, and $0.5 million in lower miscellaneous other operating revenues.
PORT OF LOS ANGELES (HARBOR DEPARTMENT OF THE CITY OF LOS ANGELES, CALIFORNIA)
Management’s Discussion and Analysis
June 30, 2017 and 2016
(Unaudited)
- 24 - Continued…..
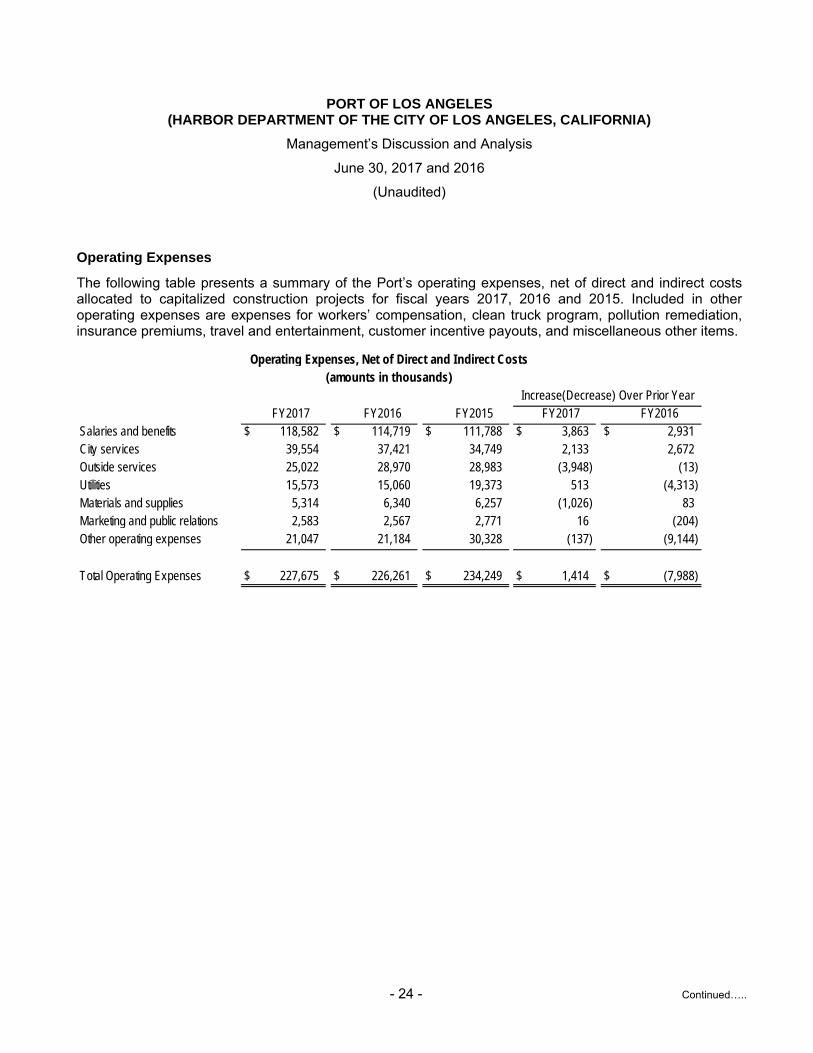
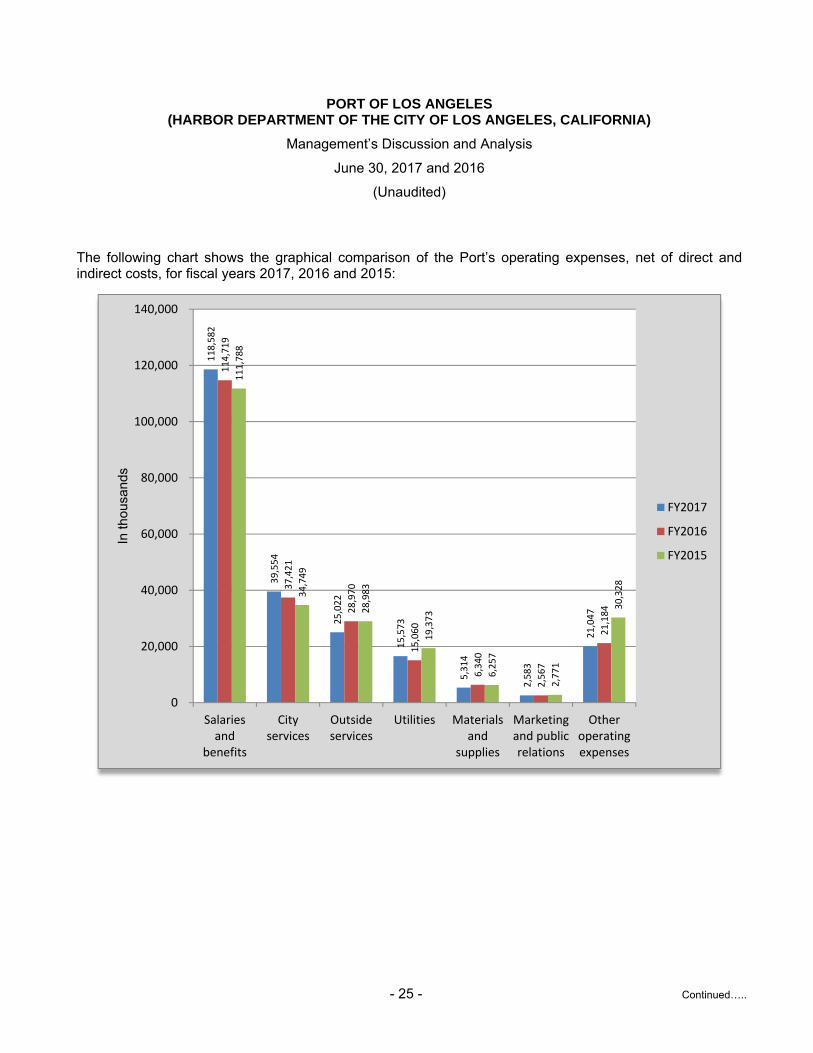
Operating Expenses
The following table presents a summary of the Port’s operating expenses, net of direct and indirect costs allocated to capitalized construction projects for fiscal years 2017, 2016 and 2015. Included in other operating expenses are expenses for workers’ compensation, clean truck program, pollution remediation, insurance premiums, travel and entertainment, customer incentive payouts, and miscellaneous other items.
FY2017 FY2016 FY2015 FY2017 FY2016Salaries and benefits $ 118,582 $ 114,719 $ 111,788 $ 3,863 $ 2,931City services 39,554 37,421 34,749 2,133 2,672Outside services 25,022 28,970 28,983 (3,948) (13)Utilities 15,573 15,060 19,373 513 (4,313)Materials and supplies 5,314 6,340 6,257 (1,026) 83Marketing and public relations 2,583 2,567 2,771 16 (204)Other operating expenses 21,047 21,184 30,328 (137) (9,144)
Total Operating Expenses $ 227,675 $ 226,261 $ 234,249 $ 1,414 $ (7,988)
Operating Expenses, Net of Direct and Indirect Costs(amounts in thousands)
Increase(Decrease) Over Prior Year
PORT OF LOS ANGELES (HARBOR DEPARTMENT OF THE CITY OF LOS ANGELES, CALIFORNIA)
Management’s Discussion and Analysis
June 30, 2017 and 2016
(Unaudited)
- 25 - Continued…..
The following chart shows the graphical comparison of the Port’s operating expenses, net of direct and indirect costs, for fiscal years 2017, 2016 and 2015:
118,582
39,554
25,022
15,573
5,314
2,583
21,047
114,719
37,421
28,970
15,060
6,340
2,567
21,184
111,788
34,749
28,983
19,373
6,257
2,771
30,328
0
20,000
40,000
60,000
80,000
100,000
120,000
140,000
Salariesand
benefits
Cityservices
Outsideservices
Utilities Materialsand
supplies
Marketingand publicrelations
Otheroperatingexpenses
In th
ousa
nds
FY2017
FY2016
FY2015

PORT OF LOS ANGELES (HARBOR DEPARTMENT OF THE CITY OF LOS ANGELES, CALIFORNIA)
Management’s Discussion and Analysis
June 30, 2017 and 2016
(Unaudited)
- 26 - Continued…..
Operating Expenses, Fiscal Year 2017
Operating expenses are presented net of direct and indirect costs allocated to capitalized construction projects. Direct costs are costs of materials, labor, and expenses assigned or identified with specific capital projects. Indirect costs are overhead costs not directly identified with a particular capital project such as administrative expenses, maintenance costs and City services, and hence, are allocated based on the average outstanding balance of capitalized construction projects. Information on direct and indirect costs deducted from operating expenses and charged to capitalized construction projects are presented on pages 111-112.
In fiscal year 2017, operating expenses increased by $1.4 million to $227.7 million, a 0.6% increase from prior fiscal year expenses of $226.3 million. Major components of operating expenses are salaries and benefits, city services, outside services, utilities, materials and supplies, and other operating expenses that are further discussed and analyzed below.
Salaries and benefits expense including pension expense increased by $3.9 million to $118.6 million, or 3.4% higher than the prior year expense of $114.7 million due to Memorandum of Understanding (MOU) salary increases for employees throughout the Port.
Total payments for City services increased by $2.1 million due to higher cost allocation plan rates and MOU mandated salary increases.
Outside services expenses of $25.0 million declined by $3.9 million or 13.6% relative to the prior fiscal year of $29.0 million with $5.1 million in spending declines offset by spending increases totaling $1.2 million across various divisions throughout the Port. These decreases in outside services expenses were primarily attributable to the following: lower demolition expenses by $1.9 million, lower security technology expenses by $0.9 million, lower legal expenses by $0.9 million, lower environmental assessment spending by $0.6 million and lower spending on miscellaneous outside services by $0.8 million. Increases in outside services expenses were comprised of: higher spending on building maintenance costs by $0.8 million and less capitalization of outside services overhead costs by $0.4 million.
Utilities increased by $0.5 million to $15.6 million or 3.4% from the prior fiscal year expense of $15.1 million mainly due to higher water and gas expenses relative to fiscal year 2016.
Materials and supplies expenses of $5.3 million declined by $1.0 million or 16.2% relative to the prior fiscal year of $6.3 million primarily due to $1.0 million in lower materials and supplies purchases within the construction and maintenance division.
Other operating expenses of $21.0 million represented a decrease of $0.1 million, or 0.6%, relative to prior fiscal year other operating expenses of $21.1 million. This decrease in other operating expenses was primarily attributable to lower provisioning for pollution remediation obligations by $3.7 million, lower provisioning for litigation and claim expenses by $0.8 million, lower provisioning for bad debt by $0.7 million, and lower miscellaneous other operating expenses by $0.4 million almost completely offset by an increase in provisioning for workers’ compensation liabilities of $5.5 million.
Additional information regarding pollution remediation for these sites may be found in Note 9 on page 74.

PORT OF LOS ANGELES (HARBOR DEPARTMENT OF THE CITY OF LOS ANGELES, CALIFORNIA)
Management’s Discussion and Analysis
June 30, 2017 and 2016
(Unaudited)
- 27 - Continued…..
Operating Expenses, Fiscal Year 2016
Operating expenses were presented net of direct and indirect costs allocated to capitalized construction projects. Direct costs are costs of materials, labor, and expenses assigned or identified with specific capital projects. Indirect costs are overhead costs not directly identified with a particular capital project such as administrative expenses, maintenance costs and City services, and hence, are allocated based on the average outstanding balance of capitalized construction projects. Information on direct and indirect costs deducted from operating expenses and charged to capitalized construction projects are presented on pages 111-112.
In fiscal year 2016, operating expenses decreased by $8.0 million to $226.3 million, a 3.4% decrease from prior fiscal year expenses of $234.2 million. Major components of operating expenses are salaries and benefits, city services, outside services, utilities, materials and supplies, and other operating expenses that are further discussed and analyzed below.
Salaries and benefits expense including pension expense increased by $2.9 million to $114.7 million, or 2.6% higher than the prior year expense of $111.8 million due to Memorandum of Understanding (MOU) salary increases for employees throughout the Port.
Total payments for City services increased by $2.7 million due to higher cost allocation plan rates and MOU mandated salary increases.
Outside services expenses of $29.0 million was approximately unchanged relative to the prior fiscal year with $6.1 million in spending declines offset by spending increases totaling $6.0 million across various divisions throughout the Port. These decreases in outside services expenses was primarily attributable to the following: higher capitalization of construction costs of $3.9 million, lower spending for environmental assessment services of $1.2 million, lower red car project spending by $0.8 million, and lower spending on cargo forecast costs by $0.2 million. Increases in outside services expenses were comprised of: higher spending on computer aided dispatch, port security and various police technology by $2.8 million, higher demolition expenses of a transit shed by $2.4 million, and higher spending on environmental legal services by $0.7 million.
Utilities decreased by $4.3 million to $15.1 million or 22.3% from the prior fiscal year expense of $19.4 million mainly due to lower Alternative Maritime Power (AMP) electricity consumption as ships were loaded and unloaded more efficiently relative to fiscal year 2015.
Materials and supplies expenses of $6.3 million was approximately unchanged relative to the prior fiscal year.
Other operating expenses of $21.2 million represented a decrease of $9.1 million, or 30.2%, relative to prior fiscal year expenses of $30.3 million. This decrease in other operating expenses was primarily attributable to lower provisions for bad debt of $4.1 million for possible non-collection of BNSF/SCIG license fees and $10.5 million in lower payouts related to the Ocean Common Carrier Incentive Program in fiscal year 2015 offset by an increase in pollution remediation obligations of $5.5 million.
Additional information regarding pollution remediation for these sites may be found in Note 9 on page 74.

PORT OF LOS ANGELES (HARBOR DEPARTMENT OF THE CITY OF LOS ANGELES, CALIFORNIA)
Management’s Discussion and Analysis
June 30, 2017 and 2016
(Unaudited)
- 28 - Continued…..
Nonoperating Revenues and Expenses
Nonoperating revenues and expenses include income from investment in a joint powers authority, interest income, and expenses along with receipts and expenses related with noncapital grant as well as pass through grant awards. The following table presents a summary of the Port’s nonoperating revenues and expenses for fiscal years 2017, 2016 and 2015:
Summary of Nonoperating Revenues and Expenses(amounts in thousands)
Increase (Decrease) Over Prior Year
FY 2017 FY 2016 FY 2015 FY 2017 FY 2016
Nonoperating revenuesIncome from investments in
Joint Powers Authorities $ 2,162 $ 2,544 $ 2,811 $ (382) $ (267) Interest and investment income 1,118 9,326 5,039 (8,208) 4,287 Other nonoperating revenue 9,994 4,402 5,619 5,592 (1,217)
Total nonoperating revenues 13,274 16,272 13,469 (2,998) 2,803
Nonoperating expensesInterest expense 604 507 331 97 176 Other nonoperating expenses 11,140 8,253 7,845 2,887 408
Total nonoperating expenses 11,744 8,760 8,176 2,984 584
Net nonoperating revenues (expenses) $ 1,530 $ 7,512 $ 5,293 $ (5,982) $ 2,219
Nonoperating Revenues and Expenses, Fiscal Year 2017
Net nonoperating revenues (expenses) for fiscal year 2017 of $1.5 million decreased by $6.0 million relative to net nonoperating revenues of $7.5 million in fiscal year 2016.
Nonoperating revenues decreased by $3.0 million due to lower interest and investment income by $8.2 million and lower other nonoperating revenues by $1.2 million offset by higher grant receipts by of $6.4 million.
Nonoperating expenses increased by $3.0 million in fiscal year 2017 primarily due to higher pass-through grant funding disbursements by $6.4 million and higher other nonoperating expenses by $1.1 million offset by lower discontinued capital projects by $4.5 million.
PORT OF LOS ANGELES (HARBOR DEPARTMENT OF THE CITY OF LOS ANGELES, CALIFORNIA)
Management’s Discussion and Analysis
June 30, 2017 and 2016
(Unaudited)
- 29 - Continued…..
Nonoperating Revenues and Expenses, Fiscal Year 2016
Net nonoperating revenues (expenses) for fiscal year 2016 of $7.5 million increased by $2.2 million relative to net nonoperating revenues of $5.3 million in fiscal year 2015.
Nonoperating revenues increased by $2.8 million due to primarily higher interest and investment income by $4.3 million, higher pass-through grant revenue by $1.0 million and higher other nonoperating revenues by $0.9 million offset by lower grant receipts of $3.4 million.
Nonoperating expenses increased by $0.6 million in fiscal year 2016 primarily due to higher discontinued capital projects.
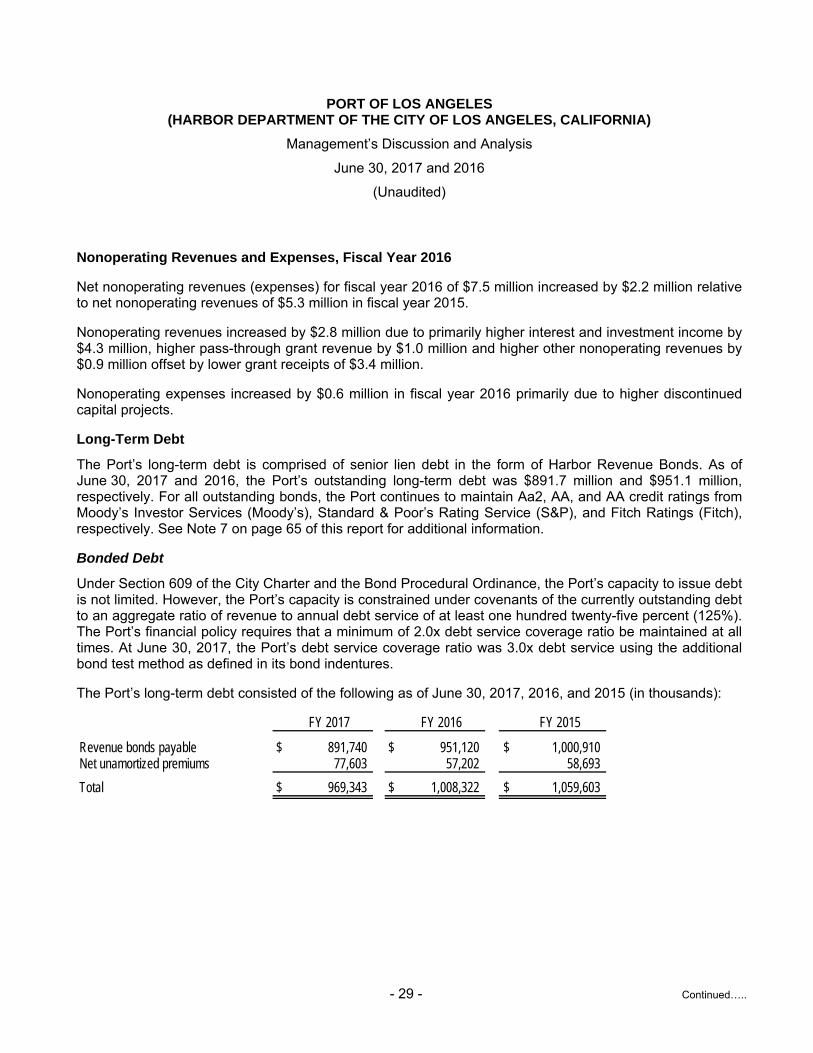
Long-Term Debt
The Port’s long-term debt is comprised of senior lien debt in the form of Harbor Revenue Bonds. As of June 30, 2017 and 2016, the Port’s outstanding long-term debt was $891.7 million and $951.1 million, respectively. For all outstanding bonds, the Port continues to maintain Aa2, AA, and AA credit ratings from Moody’s Investor Services (Moody’s), Standard & Poor’s Rating Service (S&P), and Fitch Ratings (Fitch), respectively. See Note 7 on page 65 of this report for additional information.
Bonded Debt
Under Section 609 of the City Charter and the Bond Procedural Ordinance, the Port’s capacity to issue debt is not limited. However, the Port’s capacity is constrained under covenants of the currently outstanding debt to an aggregate ratio of revenue to annual debt service of at least one hundred twenty-five percent (125%). The Port’s financial policy requires that a minimum of 2.0x debt service coverage ratio be maintained at all times. At June 30, 2017, the Port’s debt service coverage ratio was 3.0x debt service using the additional bond test method as defined in its bond indentures.
The Port’s long-term debt consisted of the following as of June 30, 2017, 2016, and 2015 (in thousands):
FY 2017 FY 2016 FY 2015
Revenue bonds payable $ 891,740 $ 951,120 $ 1,000,910 Net unamortized premiums 77,603 57,202 58,693
Total $ 969,343 $ 1,008,322 $ 1,059,603

PORT OF LOS ANGELES (HARBOR DEPARTMENT OF THE CITY OF LOS ANGELES, CALIFORNIA)
Management’s Discussion and Analysis
June 30, 2017 and 2016
(Unaudited)
- 30 - Continued…..
Capital Assets
The Port’s investment in capital assets, net of accumulated depreciation and amortization as of June 30, 2017, 2016 and 2015 amounted to $3.9 billion, $4.0 billion, and $3.9 billion, respectively. These accounted for 83.9%, 86.2%, and 86.0%, of total assets, respectively. The following table presents the Port’s capital assets, net of accumulated depreciation for fiscal years 2017, 2016 and 2015 (in thousands):
FY 2017 FY 2016 FY 2015 FY 2017 FY 2016Land $ 1,108,023 $ 1,108,023 $ 1,107,506 $ -- $ 517Facilities and equipment, net 2,649,576 2,503,081 2,437,287 146,495 65,794
Intangible assets, net 22,788 23,411 24,034 (623) (623)Construction in progress 47,477 112,391 182,747 (64,914) (70,356)Preliminary costs-capital projects 97,220 203,996 160,562 (106,776) 43,434Total $ 3,925,084 $ 3,950,902 $ 3,912,136 $ (25,818) $ 38,766
Increase(Decrease) Over Prior YearSummary of Capital Assets
See Note 5 on pages 62 – 63 of this report for additional information.

PORT OF LOS ANGELES (HARBOR DEPARTMENT OF THE CITY OF LOS ANGELES, CALIFORNIA)
Management’s Discussion and Analysis
June 30, 2017 and 2016
(Unaudited)
- 31 - Continued…..
The following chart shows the graphical presentation of the Port’s capital assets for the fiscal years 2017, 2016 and 2015:
1,108,023
2,649,576
22,788
47,477
97,220
1,108,023
2,503,081
23,411
112,391
203,996
1,107,506
2,437,287
24,034
182,747
160,562
0
500,000
1,000,000
1,500,000
2,000,000
2,500,000
3,000,000
Land Facilities andequipment, net
Intangibleassets, net
Construction inprogress
Preliminarycosts‐capitalprojects
In thousands
FY 2017
FY 2016
FY 2015
PORT OF LOS ANGELES (HARBOR DEPARTMENT OF THE CITY OF LOS ANGELES, CALIFORNIA)
Management’s Discussion and Analysis
June 30, 2017 and 2016
(Unaudited)
- 32 - Continued…..
Capital Assets, Fiscal Year 2017 Major capital assets activities during fiscal year 2017 are as follows:
● $25.6 million – completion of Phases 2-4 of backland improvements at Berths 142-143 as well as continued construction of the crane maintenance buildings, terminal buildings, main gate, and intermodal container transfer facility expansion at Berths 134-147 leased by Trapac.
● $24.3 million – completion of Berth 214-220 redevelopment which will enable the tenant, Yusen Terminals Inc. (YTI), to service larger ships as well as provide ships calling at the YTI terminal with better AMP service while docked.
● $8.5 million – completion of design and construction of C-Street/I-110 access ramp improvements which will realign the I-110 off-ramp to accommodate heavy truck volumes and provide improved connectivity to Harry Bridges Boulevard.
● $6.9 million – continued design and construction of San Pedro Waterfront and Wilmington Waterfront Development projects including, but not limited to Sampson Way roadway improvements, the Wilmington Waterfront Promenade, the Avalon Promenade and Gateway, Ports O’ Call Promenade and Town Square, retrofitting the Berth 57 wharf and Signal Street improvements.
● $6.4 million – various transportation projects including construction completion of John S. Gibson Intersection/North I-110 access ramp improvements, close out of final construction payments related to the South Wilmington Grade Separation, construction completion of Berth 200 rail yard track connections, and construction completion of I-110/SR-47 connector improvements.

PORT OF LOS ANGELES (HARBOR DEPARTMENT OF THE CITY OF LOS ANGELES, CALIFORNIA)
Management’s Discussion and Analysis
June 30, 2017 and 2016
(Unaudited)
- 33 - Continued…..
Capital Assets, Fiscal Year 2016 Major capital assets activities during fiscal year 2016 are as follows:
● $74.0 million – continued construction of backland improvements at the TraPac (Berths 135-147) including terminal buildings, main gate, and intermodal facility expansion.
● $24.5 million – continued construction of terminal redevelopment and AMP improvements at Yusen Terminals Inc. (YTI) contain terminal.
● $13.7 million – design and continued construction of C-Street/I-110 access ramp improvements.
● $19.6 million – various transportation projects including South Wilmington grade separation, John S. Gibson Intersection/North I-110 access ramp improvements, Berth 200 rail yard track connections, and I-110/SR-47 connector improvements.

PORT OF LOS ANGELES (HARBOR DEPARTMENT OF THE CITY OF LOS ANGELES, CALIFORNIA)
Management’s Discussion and Analysis
June 30, 2017 and 2016
(Unaudited)
- 34 - Continued…..
Capital Improvement Expenditures (CIP) for Fiscal Year 2018
The Port aims to continue to maintain its competitive edge by developing infrastructure that supports growth and efficiency, secure, and sustainable port operations. As such, the Port has adopted a capital budget of $160.5 million in fiscal year 2018. Comprising 13.7% of its total budget of $1.2 billion, the adopted capital expenditures include $97.7 million for direct costs of capital improvement projects, indirect costs of $45.9 million in allocated capitalized overhead and interest costs, $1.0 million for land and property acquisition, and $16.0 million for capital equipment. The adopted capital expenditures of $97.7 million include $41.7 million for terminal improvement projects, $7.8 million for transportation and infrastructure projects, $18.2 million for public access/environmental enhancement projects, $2.2 million for security projects, and $27.8 million for maritime services. Below is the graphical presentation of the fiscal year 2018 adopted capital improvement projects budget:
Terminal Improvement, $41.7M, 43%Transportation
Projects, $7.8M, 8%Security Projects,
$2.2M, 2%
Public Access/Environmental
Enhancements, $18.2M, 19%
Maritime Services, $27.8M, 28%
Capital Improvement Program ‐ $97.7 Million

PORT OF LOS ANGELES (HARBOR DEPARTMENT OF THE CITY OF LOS ANGELES, CALIFORNIA)
Management’s Discussion and Analysis
June 30, 2017 and 2016
(Unaudited)
- 35 - Continued…..
The components of the CIP are as follows:
Terminal Development Projects
Approximately $41.7 million or 42.6% of the total CIP direct cost budget of $97.7 million is dedicated to development projects at various Port terminals.
● $11.2 million for the upgrade and retrofit of an AMP installation and security improvements at the World Cruise Center.
● $8.2 million for various wharf rehabilitation, bollard repair, and seawall improvements projects throughout the Port.
● $8.1 million for redevelopment at the YTI Terminal, including wharf upgrades, berth dredging, crane rail extensions, electrical improvements, expansion of the terminal, backland improvements, and construction of loading track and modifications of utilities within the backland area.
● $7.9 million for projects at berths with liquid bulk oil cargo handling facilities to be in compliance with Marine Oil Terminal Engineering Maintenance Standards (MOTEMS).
● $2.6 million for the construction of the final phase of projects at TraPac Terminal.
● $1.9 million for the preparation of environmental documents, planning, and initial design of new development at the Everport container terminal.
● $1.4 million for the preparation of supplemental environmental and other planning documents at the Yang Ming and China Shipping container terminals.
Transportation and Infrastructure Projects
Approximately $7.8 million or 8.0% of the total CIP direct cost budget of $97.7 million is designated for transportation improvement projects.
● $4.2 million for various transportation projects such as preparation of the interchange reconfiguration at SR-47/Vincent Thomas Bridge and Front Street/Harbor Boulevard, 4,951 linear feet of rail road track extensions at the Trapac terminal, and resurfacing project on Water Street, Reeves Avenues, Miner Street, Pier A Street, and Swinford Street.
● $2.0 million for the construction of a drainage collection system and relocation of waterline underneath railroad tracks to adhere to industry standards.
● $1.6 million for the construction of the I-110 access ramp which will accommodate heavy truck volumes by providing free-flowing right turn lanes, while also allowing for improved connectivity to Harry Bridges Boulevard.

PORT OF LOS ANGELES (HARBOR DEPARTMENT OF THE CITY OF LOS ANGELES, CALIFORNIA)
Management’s Discussion and Analysis
June 30, 2017 and 2016
(Unaudited)
- 36 - Continued…..
Public Access and Environmental Enhancement Projects
Approximately $18.2 million or 18.6% of the total CIP direct cost budget of $97.7 million is designated for public access and environmental enhancement projects.
● $8.7 million for the construction of the Harbor Boulevard Roadway Improvement project which will allow for organized traffic flow into the San Pedro Public Market (Market).
● $3.0 million for various construction projects at the Wilmington Waterfront Promenade, including reconstruction of sites and facilities, planning and design of a new pedestrian bridge, and refurbishment of signs and landscaping.
● $2.0 million for the design and construction of the Market’s Promenade and Town Square.
● $1.9 million for demolition, clean-up, wharf retrofit, and roadway and waterway improvements at San Pedro Waterfront.
● $1.9 million for the construction of multi-use concrete walkway along Front Street from the Vincent Thomas Bridge to Pacific Avenue.
● $0.7 million for environmental assessments at the AltaSea site.
Port Security Projects
$2.2 million or 2.3% of the total CIP direct cost budget of $97.7 million is designated for the finalization of Phase 2 of the Port Fiber Optic Program and the new radio system for the Port Police.
Maritime Services
$27.8 million or 28.5% of the total CIP direct cost budget of $97.7 million is designated for miscellaneous purchases and projects including the Badger Avenue Bridge, the Maritime Museum, Ports O’ Call, the Municipal Fish Market, the Harbor Administrative Building, and other future projects.

PORT OF LOS ANGELES (HARBOR DEPARTMENT OF THE CITY OF LOS ANGELES, CALIFORNIA)
Management’s Discussion and Analysis
June 30, 2017 and 2016
(Unaudited)
- 37 - Continued…..
Factors That May Affect the Port’s Operations
There is significant competition for container traffic among North American ports. The availability of alternate port facilities at competitive prices affects the use of the Port’s facilities and therefore the revenues of the Port. Formation of shipping alliances adds to the complexity as shipping lines which have ownership in terminals route cargo to terminals that are not owned by them, but by their Alliance partners. While the shipping industry remains volatile in 2017, shipping lines are searching for the best terminal handling rates and even looking to the Port to provide incentives. The Port cannot predict the scope of such impact.
All of the ports on the West Coast of the U.S. compete for discretionary intermodal cargo destined for locations across the U.S. and Canada. Discretionary cargo makes up approximately 33% of cargo arriving at the Port. Currently, this discretionary cargo moves eastward both by rail and through the Panama Canal or through the Suez Canal. The use of all-water routes primarily through the Panama and Suez Canal to the East and Gulf Coasts of the U.S. is an alternative to Asian intermodal cargo moving through U.S. West Coast ports. Routing cargo via all water service has a longer transit time and is usually less expensive to the beneficial cargo owner vs. routing via West Coast Ports and loading via rail. The newly completed Panama Canal Expansion Program added a new set of locks, which allows ships of greater size (up to 12,500 TEU) to transit the Canal. The expansion creates a route to the East and Gulf Coast for ships of greater capacity than the current “Panamax” ships. While the effects of an expanded Canal are unknown, the Port has an existing ability to handle the New Panamax and Super Post-Panamax ships and continues to maintain and improve its strong infrastructure and intermodal capabilities.
The activities at the Port may generate air emissions that are subject to legal and regulatory requirements. Such requirements mandate and offer certain incentives for reductions of air pollution from ships, trains, trucks and other operational activities. Paying for mandated air pollution reduction infrastructure, equipment and other measures may become a significant portion of the Port’s capital budget and operating budget. Such expenditures may be necessary even if the Port does not undertake any new revenue-generating capital improvements. The Port cannot provide assurances that the actual cost of the required measures will not exceed the forecasted amount.
Competitive Environment
As of fiscal year ended June 30, 2017, six major container ports controlled 99.6% of the entire U.S. West Coast containerized cargo market: the ports of Los Angeles, Long Beach, Oakland, San Diego in California, and the ports of Seattle and Tacoma in Washington State. The ports of Los Angeles and Long Beach together had 72.8% of all U.S. West Coast market share based on a loaded TEU basis.
The industry is capital intensive and requires long lead times to plan and develop new facilities and infrastructure. Resources are typically allocated and facilities developed upon the commitment of customers to long-term permits at the Port that currently range from 15 to 30 years before expiration. Occupancy remains high and West Coast ports have limited land areas for expansion. Additionally, the greater Los Angeles area represents not only a large destination market for waterborne goods, but also the most attractive point of origin for trans-shipments to points east as the Port has extensive on-dock rail facilities creating intermodal connections that provide for time-to-market advantages.
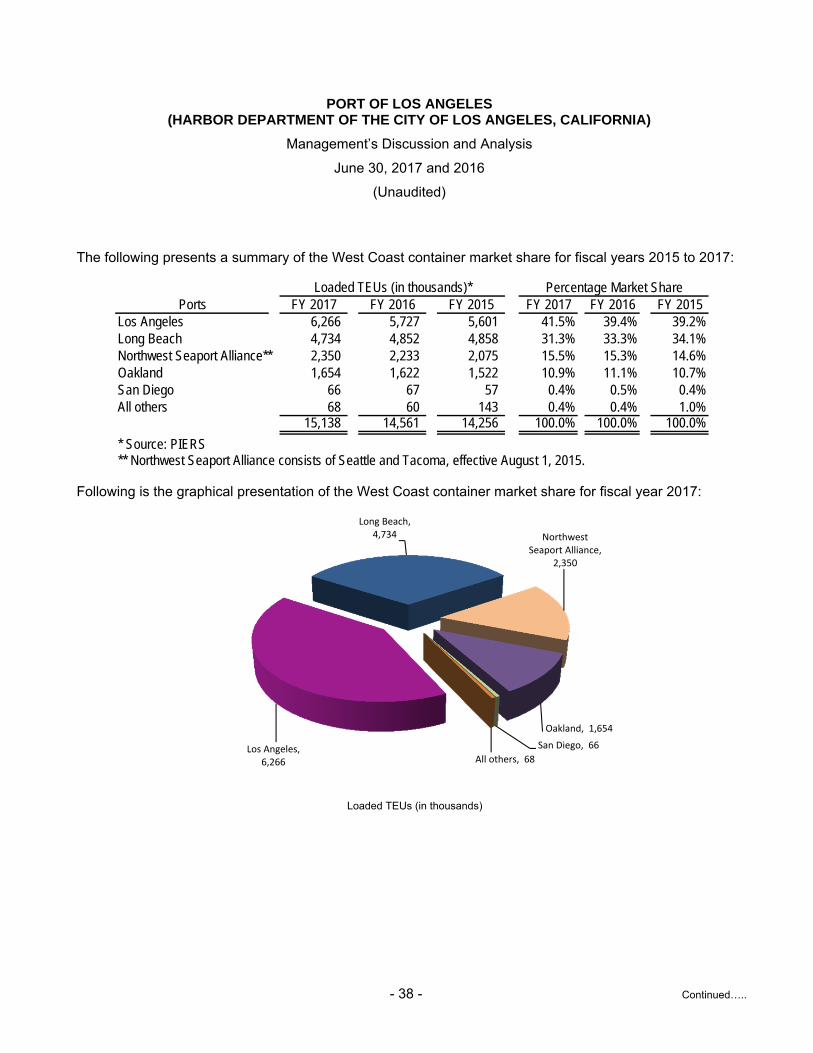
PORT OF LOS ANGELES (HARBOR DEPARTMENT OF THE CITY OF LOS ANGELES, CALIFORNIA)
Management’s Discussion and Analysis
June 30, 2017 and 2016
(Unaudited)
- 38 - Continued…..
The following presents a summary of the West Coast container market share for fiscal years 2015 to 2017:
Percentage Market SharePorts FY 2017 FY 2016 FY 2015 FY 2017 FY 2016 FY 2015
Los Angeles 6,266 5,727 5,601 41.5% 39.4% 39.2%Long Beach 4,734 4,852 4,858 31.3% 33.3% 34.1%Northwest Seaport Alliance** 2,350 2,233 2,075 15.5% 15.3% 14.6%Oakland 1,654 1,622 1,522 10.9% 11.1% 10.7%San Diego 66 67 57 0.4% 0.5% 0.4%All others 68 60 143 0.4% 0.4% 1.0%
15,138 14,561 14,256 100.0% 100.0% 100.0%
* Source: PIERS** Northwest Seaport Alliance consists of Seattle and Tacoma, effective August 1, 2015.
Loaded TEUs (in thousands)*
Following is the graphical presentation of the West Coast container market share for fiscal year 2017:
Loaded TEUs (in thousands)
Los Angeles, 6,266
Long Beach, 4,734 Northwest
Seaport Alliance, 2,350
Oakland, 1,654
San Diego, 66
All others, 68

PORT OF LOS ANGELES (HARBOR DEPARTMENT OF THE CITY OF LOS ANGELES, CALIFORNIA)
Management’s Discussion and Analysis
June 30, 2017 and 2016
(Unaudited)
- 39 - Continued…..
Request for Information
This financial report is designed to provide a general overview of the Port of Los Angeles’ finances. Questions concerning any of the information provided in this report or requests for additional information should be addressed to Marla Bleavins, Deputy Executive Director and Chief Financial Officer, Port of Los Angeles (Harbor Department of the City of Los Angeles), 425 S. Palos Verdes St., San Pedro, CA 90731.

PORT OF LOS ANGELES(HARBOR DEPARTMENT OF THE CITY OF LOS ANGELES, CALIFORNIA)
Statements of Net PositionJune 30, 2017 and 2016(amounts in thousands)
2017 2016ASSETS
Current AssetsCash and cash equivalents, unrestricted $ 619,413 $ 445,289 Cash and cash equivalents, restricted 15,915 21,581 Accounts receivable, net of allowance for doubtful accounts:
2017 - $26,503; 2016 - $20,493 34,324 42,226 Grants receivable 920 10,098 Materials and supplies inventories 2,561 2,777 Prepaid expenses 132 227 Accrued interest receivable 1,986 828
Total current assets 675,251 523,026
Noncurrent Restricted AssetsRestricted investments – bond funds 62,283 95,769 Other restricted cash and investments 9,840 9,759
Total noncurrent restricted assets 72,123 105,528
Capital assets Land 1,108,023 1,108,023 Facilities and equipment net of accumulated depreciation:
2017 - $2,049,121; 2016 - $1,905,179 2,649,576 2,503,081 Intangible assets, net of amortization:
2017 - $2,572; 2016 - $1,949 22,788 23,411 Construction in progress 47,477 112,391 Preliminary costs – capital projects 97,220 203,996
Total capital assets 3,925,084 3,950,902
Investment in Joint Powers Authorities 5,732 5,570
TOTAL ASSETS 4,678,190 4,585,026
DEFERRED OUTFLOWS OF RESOURCES
Deferred charges on debt refunding 16,700 2,832 Deferred outflows of resources - pensions 62,875 42,025
TOTAL DEFERRED OUTFLOWS OF RESOURCES 79,575 44,857 continued…..
- 40 -

PORT OF LOS ANGELES(HARBOR DEPARTMENT OF THE CITY OF LOS ANGELES, CALIFORNIA)
Statements of Net PositionJune 30, 2017 and 2016(amounts in thousands)
2017 2016
LIABILITIES
Current LiabilitiesAccounts payable $ 31,617 $ 30,569 Current maturities of notes payable and bonded debt 37,615 41,695 Accrued interest payable 18,023 19,806 Accrued salaries and employee benefits 17,542 16,859 Obligations under securities lending transactions 4,384 7,929 Accrued construction cost payable 3,060 3,239 Other current liabilities 67,879 44,374
Total current liabilities 180,120 164,471
Long-term liabilities
Long-term liabilities payable from unrestricted assetsBonds payable, net of unamortized discount/premium:
2017 - $77,603; 2016 - $57,202 931,728 966,627 Accrued salaries and employee benefits 7,537 8,114 Net pension liabilities 231,325 215,829 Other liabilities 101,316 80,931
Total long-term liabilities payable from unrestricted assets 1,271,906 1,271,501 Long-term liabilities payable from restricted assets 10,299 10,075
Total long-term liabilities 1,282,205 1,281,576
TOTAL LIABILITIES 1,462,325 1,446,047
DEFERRED INFLOWS OF RESOURCESDeferred inflows of resources - pensions 30,042 21,881
TOTAL DEFERRED INFLOWS OF RESOURCES 30,042 21,881
NET POSITIONNet investment in capital assets 2,972,442 2,945,412 Restricted for debt service 62,255 66,599 Unrestricted 230,701 149,944
TOTAL NET POSITION $ 3,265,398 $ 3,161,955
See accompanying notes to basic financial statements.
- 41 -

PORT OF LOS ANGELES(HARBOR DEPARTMENT OF THE CITY OF LOS ANGELES, CALIFORNIA)
Statements of Revenues, Expenses, and Changes in Net PositionFor the Fiscal Years Ended June 30, 2017 and 2016
(amounts in thousands)
2017 2016
OPERATING REVENUE
Shipping servicesWharfage $ 369,459 $ 341,765 Dockage 4,113 5,629 Demurrage 213 216 Lay day fees 255 938 Pilotage 9,558 7,064 Assignment charges 14,657 12,858
Total shipping services 398,255 368,470
RentalsLand 50,554 45,763 Buildings 206 221 Warehouses 85 88 Wharf and shed 413 499
Total rentals 51,258 46,571
Royalties, fees, and other operating revenuesFees, concessions, and royalties 10,436 10,655 Clean truck program fees 2,340 2,384 Other 12,243 8,046
Total royalties, fees, and other operating revenues 25,019 21,085
Total operating revenue 474,532 436,126
OPERATING EXPENSES
Salaries and other benefits 94,677 94,281 Pension expense 23,905 20,438 City services 39,554 37,421 Outside services 25,022 28,970 Utilities 15,573 15,060 Materials and supplies 5,314 6,340 Marketing and public relations 2,583 2,567 Workers' compensation, claims and settlement 4,977 245 Clean truck program expenses 704 897 Travel and entertainment 536 611 Other operating expenses 14,830 19,431
Total operating expenses before depreciation and amortization 227,675 226,261
Operating Income before depreciation and amortization 246,857 209,865 continued….
- 42 -

PORT OF LOS ANGELES(HARBOR DEPARTMENT OF THE CITY OF LOS ANGELES, CALIFORNIA)
Statements of Revenues, Expenses, and Changes in Net Position For the Fiscal Years Ended June 30, 2017 and 2016
(amounts in thousands)
2017 2016
Operating Income before depreciation and amortization $ 246,857 $ 209,865
Depreciation and amortization 172,895 163,933
OPERATING INCOME 73,962 45,932
NONOPERATING REVENUE (EXPENSES)
Nonoperating revenueIncome from investments in Joint Powers Authorities 2,162 2,544 Interest and investment income 1,118 9,326 Noncapital grant revenue 1,199 662 Pass through grant revenue 7,931 1,566 Other nonoperating revenue 864 2,174
Total nonoperating revenue 13,274 16,272
Nonoperating expensesInterest expense (604) (507) Pass through grant expenses (7,931) (1,566) Discontinued capital projects (773) (5,279) Other nonoperating expenses (2,436) (1,408)
Total nonoperating expenses (11,744) (8,760)
Net nonoperating revenue (expenses) 1,530 7,512
INCOME BEFORE CAPITAL CONTRIBUTIONS 75,492 53,444
Capital contributions 18,801 40,489
Extraordinary item 9,150 5,123
CHANGES IN NET POSITION 103,443 99,056
NET POSITION, JULY 1 3,161,955 3,062,899
NET POSITION, JUNE 30 $ 3,265,398 $ 3,161,955
See accompanying notes to basic financial statements.
- 43 -

PORT OF LOS ANGELES(HARBOR DEPARTMENT OF THE CITY OF LOS ANGELES, CALIFORNIA)
Statements of Cash FlowsFor the Fiscal Years Ended June 30, 2017 and 2016
(amounts in thousands)
2017 2016
CASH FLOWS FROM OPERATING ACTIVITIES
Shipping service fees collected $ 404,886 $ 369,753
Rentals collected 52,111 46,733
Royalties, fees, and other operating revenues collected 25,435 21,177
Payments for employee salaries and benefits, net of capitalized
amounts: 2017 - $23,563; 2016 - $22,832 (115,671) (115,548)
Payments for goods and services (92,180) (137,246)
Net cash provided by operating activities 274,581 184,869
CASH FLOWS FROM NONCAPITAL FINANCING ACTIVITY
Proceeds from noncapital grants 1,199 662
Net cash provided by noncapital financing activity 1,199 662
CASH FLOWS FROM CAPITAL AND RELATED FINANCING ACTIVITIES
Payments for property acquisitions and construction (111,717) (162,874)
Proceeds from sale of capital assets 76 1,750
Proceeds from capital grants and contributions 27,980 35,416
Proceeds from insurance recovery for damage of capital assets 9,150 5,123
Principal repayment and redemption – bonds (30,434) (43,193)
Receipts from (payments to) bond reserve fund 33,486 1,692
Interest and issuance costs paid (60,340) (49,643)
Net cash used in capital and related financing activities (131,799) (211,729)
CASH FLOWS FROM INVESTING ACTIVITIES
Receipt of interest 5,784 5,364
(Decrease) increase in cash collateral received under
the securities lending transactions (3,545) 5,064
(Decrease) increase in fair value of investments (5,904) 3,927
Net sale of investments 26,142 3,749
Net payments received on notes receivable -- 5,095
Distribution from Joint Powers Authorities 2,000 3,000
Net cash provided by investing activities 24,477 26,199
NET INCREASE IN CASH AND CASH EQUIVALENTS 168,458 1
CASH AND CASH EQUIVALENTS, JULY 1 466,870 466,869
CASH AND CASH EQUIVALENTS, JUNE 30 $ 635,328 $ 466,870 continued….
- 44 -

PORT OF LOS ANGELES(HARBOR DEPARTMENT OF THE CITY OF LOS ANGELES, CALIFORNIA)
Statements of Cash Flows For the Fiscal Years Ended June 30, 2017 and 2016
(amounts in thousands)
2017 2016
CASH AND CASH EQUIVALENTS COMPONENTS
Cash and cash equivalents, unrestricted $ 619,413 $ 445,289
Cash and cash equivalents, restricted 15,915 21,581
Total cash and cash equivalents $ 635,328 $ 466,870
RECONCILIATION OF OPERATING INCOME TO NET CASH PROVIDED
BY OPERATING ACTIVITIES
Operating income $ 73,962 $ 45,932
Adjustments to reconcile operating income to net cash provided by operating activities
Depreciation 172,895 163,933
Provision for doubtful accounts 6,010 6,742
Changes in assets, liabilities, and deferred outflows and inflows of resources
Accounts receivable 1,892 (5,206)
Materials and supplies inventories 216 (136)
Prepaid expenses 95 166
Deferred outflows of resources - pensions (20,850) 4,662
Accounts payable 1,048 (16,688)
Net pension liabilities 15,496 17,067
Accrued salaries and employee benefits 106 (189)
Other liabilities 15,550 (9,045)
Deferred inflows of resources - pensions 8,161 (22,369)
Total adjustments to reconcile operating income to net cashprovided by operation activities 200,619 138,937
Net cash provided by operating activities $ 274,581 184,869
NONCASH CAPITAL AND RELATED FINANCING ACTIVITIES
Acquisition of capital assets with construction payable $ 3,060 $ 3,239
Acquisition of capital assets with accounts payable 2,106 624
Write-off of discontinued construction projects 773 5,279
Capitalized interest expense, net 35,589 41,216
Revenue bond proceeds received in escrow trust fund 230,506 43,647 Debt defeased and related costs paid through escrow trust fund (230,506) (43,647)
See accompanying notes to basic financial statements.
- 45 -

PORT OF LOS ANGELES (HARBOR DEPARTMENT OF THE CITY OF LOS ANGELES, CALIFORNIA)
Notes to the Basic Financial Statements
June 30, 2017 and 2016
- 46 - Continued…..
The Notes to the Basic Financial Statements include disclosures considered necessary for a better understanding of the accompanying financial statements. An index to the Notes follows:
Page Note 1 - Organization and Summary of Significant Accounting Policies…………. 47
Note 2 - Adoption of new GASB Pronouncements………………………………..... 53
Note 3 - Recent GASB Pronouncements for Future Adoption……….……………. 54
Note 4 - Cash and Investments ………………………………………………………. 56
Note 5 - Capital Assets ………………………………………………………………... 62
Note 6 - Investment in Joint Powers Authorities and Other Entities………………. 64
Note 7 - Long-Term Debt..…..………………………………………………………… 65
Note 8 - Changes in Long-Term Liabilities…………………………………………... 72
Note 9 - Pollution Remediation Obligations………………………………………….. 74
Note 10 - Employee Deferred Compensation Plan……………………….………... 75
Note 11 - Risk Management…………………………………………………………... 76
Note 12 - Leases, Rentals, and Minimum Annual Guarantee (MAG) Agreements 78
Note 13 - Los Angeles City Employees’ Retirement System……………………… 79
Note 14 - City of Los Angeles Fire and Police Pension System…………………... 89
Note 15 - Commitments, Litigations and Contingencies …………………………... 99
Note 16 - Related-Party Transactions………………………………………………... 102
Note 17 - Capital Contributions……………………………………………………….. 102
Note 18 - Natural Resources Defense Council Settlement Judgment……………. 102
Note 19 - Cash Funding of Reserve Fund…………………………………………… 103
Note 20 - Extraordinary Item…….…..……………………….………………………… 103

PORT OF LOS ANGELES (HARBOR DEPARTMENT OF THE CITY OF LOS ANGELES, CALIFORNIA)
Notes to the Basic Financial Statements
June 30, 2017 and 2016
- 47 - Continued…..
1. Organization and Summary of Significant Accounting Policies
The financial statements of the Port of Los Angeles (Harbor Department of the City of Los Angeles, California), hereafter referred to as “Port of Los Angeles” or “Port,” have been prepared in conformity with generally accepted accounting principles (GAAP) as promulgated by the Governmental Accounting Standards Board (GASB). GASB is the accepted standard-setting body for establishing governmental accounting and financial reporting principles. The Port’s significant accounting policies are described below.
A. Organization and Reporting Entity
The Port of Los Angeles is a proprietary department of the City of Los Angeles, California (the City), formed for the purpose of providing shipping, fishing, recreational, and other resources and benefits for the enjoyment of the citizens of California. The Port is under the control of a five-member Board of Harbor Commissioners (BHC), who are appointed by the Mayor and approved by the City Council. The Port is administered by an Executive Director and subject to the State of California Tidelands Trust Act.
Most of the properties of the Port including land, docks, wharves, transit sheds, terminals, and other facilities are owned by the City and administered by the Port, subject to a trust created pursuant to certain tideland grants from the State. All monies arising out of the operation of the Port are limited as to use for the operation and maintenance of Port facilities, the acquisition and construction of improvements, and other such trust considerations under the Tidelands Trust and the Charter of the City.
The Port prepares and controls its own financial plan, administers and controls its fiscal activities, and is responsible for all Port construction and operations. The Port operates as principal landlord for the purpose of assigning or leasing port facilities and land areas. The Port’s principal source of revenue is from shipping services under tariffs (dockage and wharfage, etc.), rental of land and facilities, fees (parking and foreign trade zones), and royalties (oil wells). Capital construction is financed by cash from operations, debt secured by future revenues, and federal and state grants. The Port’s permanent work force attends to the daily operation of the Port facilities and its regular maintenance. Generally, the Port uses commercial contractors for large construction projects.
Operations of the Port are financed in a manner similar to that of a private business. The Port recovers its costs of providing services and improvements through tariff charges for shipping services and the leasing of facilities to Port customers.
In evaluating how to define the Port for financial reporting purposes, management has considered all potential component units by applying the criteria set forth by the GASB. The financial statements present only the financial activities of the Port in conformity with GAAP and are not intended to present the financial position and results of operations of the City.

PORT OF LOS ANGELES (HARBOR DEPARTMENT OF THE CITY OF LOS ANGELES, CALIFORNIA)
Notes to the Basic Financial Statements
June 30, 2017 and 2016
- 48 - Continued…..
Reporting Entity
The Los Angeles Harbor Improvements Corporation (LAHIC) is a nonprofit public benefit corporation organized under the laws of the state of California for public purposes. LAHIC was formed to assist the Port in undertaking financing third party capital expenditures at potentially advantageous terms that the BHC deems necessary for the promotion and accommodation of commerce.
The board of directors of LAHIC consists of five members. Election of the LAHIC board of directors occurs by vote of the BHC. The BHC is financially responsible for LAHIC’s activities. Further, although LAHIC is legally separate from the Port, it is reported as if it were part of the Port, because its sole purpose is to help finance and construct facilities and improvements, related to Port activities.
LAHIC is included in the reporting entity of the Port, and accordingly, the operations of LAHIC are blended in the Port’s accompanying basic financial statements.
B. Summary of Significant Accounting Policies
Method of Accounting – The Port’s activities are accounted for as an enterprise fund, and as such, its financial statements are presented using the economic resources measurement focus and the accrual method of accounting. Under this method of accounting, revenues are recognized when earned and expenses are recorded when the related liabilities are incurred.
Cash, Cash Equivalents, and Investments – The Port pools its available cash with that of the City. All cash and investments pooled with the City, plus any other cash deposits or investments with initial maturities of three months or less are considered cash and cash equivalents.
Interest income and realized gains and losses arising from such pooled cash and investments are apportioned to each participating City department fund based on the relationship of such department fund’s respective average daily cash balances to aggregate pooled cash and investments. The change in the fair value of pooled investments is allocated to each participating City department fund based on the aggregate respective cash balances at year-end.
The Port’s investments, including its share of the City’s Investment Pool, are stated at fair value. Fair value is determined based upon market closing prices or bid/ask prices for regularly traded securities. The fair value of investments with no regular market is estimated based on similar traded investments. The fair value of mutual funds, government-sponsored investment pools, and other similar investments is stated at share value or an allocation of fair value of the pool, if separately reported. Certain money market investments with initial maturities at the time of purchase of less than one year are recorded at amortized cost. The calculation of realized gains is independent of the calculation of the net increase in the fair value of investments. Realized gains and losses on investments that had been held more than one fiscal year and sold in the current year may have been recognized as an increase or decrease in fair value of investments reported in the prior year and the current year.

PORT OF LOS ANGELES (HARBOR DEPARTMENT OF THE CITY OF LOS ANGELES, CALIFORNIA)
Notes to the Basic Financial Statements
June 30, 2017 and 2016
- 49 - Continued…..
Securities Lending – As a participant in the City’s Investment Pool, the Port’s funds are also part of the City’s securities lending program (SLP). The investment collateral received by the City together with the corresponding liability is allocated among the City’s participating funds based on the aggregate respective cash balances at fiscal year-end.
Materials and Supplies Inventories – Inventories of materials and supplies are stated at lower of average cost or market.
Capital Assets – Capital assets are carried at cost or at acquisition value at the date received, in the case of properties acquired by donation, and by termination of leases for tenant improvements, less allowance for accumulated depreciation. The Port has a capitalization threshold of $5,000. Capital assets include intangible assets for the Port’s radio frequency and emission mitigation credits, and capitalized costs of the Port’s integrated financial accounting system, the Enterprise Resource Planning System.
Development costs for proposed capital projects that are incurred prior to the finalization of formal construction contracts are capitalized. Upon completion of capital projects, such preliminary costs are transferred to the appropriate property account. In the event the proposed capital projects are abandoned, the associated preliminary costs are charged to expense in the year of abandonment. Preliminary costs - capital projects for fiscal years 2017 and 2016 are $97.2 million and $204.0 million, respectively.
The Port capitalizes interest costs incurred on indebtedness issued in connection with the acquisition, construction or improvement of capital assets, net of interest revenue on reinvested debt proceeds. Interest capitalized in fiscal years 2017 and 2016 were $35.5 million and $41.2 million, respectively.
The Port capitalizes indirect project costs associated with the acquisition, development, and construction of new capital projects. Indirect project costs allocated to construction projects for fiscal years 2017 and 2016 were $18.3 million and $16.2 million, respectively.
Depreciation is computed on the straight-line basis over the estimated useful lives of the assets. The estimated useful lives of the Port’s depreciable assets are as follows:
Wharves and sheds 15 to 30 yearsBuildings and facilities 10 to 50 yearsEquipment 3 to 18 yearsIntangible assets 20 years
Investments in Joint Powers Authorities – Investments in joint power authorities are accounted for by the equity method.

PORT OF LOS ANGELES (HARBOR DEPARTMENT OF THE CITY OF LOS ANGELES, CALIFORNIA)
Notes to the Basic Financial Statements
June 30, 2017 and 2016
- 50 - Continued…..
Accrued Salaries and Employee Benefits – Aside from accrued salaries, the Port records as liabilities all accrued employee benefits, including estimated liabilities for certain unused vacation and sick leave in the period the benefits are earned. Port employees accumulate annual vacation and sick leave based on their length of service up to a designated maximum. Upon termination or retirement, employees are paid the cash value of their accumulated leave benefits.
Deferred Outflows and Inflows of Resources – In addition to assets, the Port reports a separate section for deferred outflows of resources. This represents a consumption of net position that applies to a future period(s) and so will not be recognized as an outflow of resources (expense) until then. The Port has two items that qualified for reporting in this category. They are deferred charges on debt refunding and deferred outflows of resources related to pensions. A deferred charge on refunding results from the difference in the carrying value of refunded debt and its reacquisition price. This amount is deferred and amortized over the shorter of the life of the refunded or refunding debt.
In addition to liabilities, the Port reports a separate section for deferred inflows of resources. This represents an acquisition of net position that applies to a future period(s) and so will not be recognized as an inflow of resources (revenue) until then. The Port has only one item that qualified for reporting in this category – deferred inflows of resources related to pensions.
Deferred inflows and outflows of resources related to pensions result from diverse pension related transactions and events including pension contributions subsequent to measurement date, changes of assumptions or other inputs, difference between expected and actual experience in the total pension liabilities, changes in proportionate share of contributions, and net differences between projected and actual pension plan investment earnings.
Operating and Nonoperating Revenues and Expenses – The Port differentiates between operating revenues and expenses, and nonoperating revenues and expenses. Operating revenues and expenses generally result from the Port’s primary ongoing operations. All revenues and expenses other than these are reported as nonoperating revenues and expenses.
Revenues from shipping services, rental fees, and royalties are the major sources of the Port’s revenues. Shipping services revenues consist of fees assessed for various activities relating to vessel and cargo movement. Twenty-foot equivalent units (TEUs) and metric tons are the measures used to determine cargo volumes that move through the Port. Rental fees are collected from the lease of various types of rental properties in Port-controlled lands. Rental rates are set using various methodologies, and are appraised periodically to evaluate and establish benchmark rates. Rental rates may be adjusted, within reason, to reflect general market conditions. The Port levies fees for various activities such as royalties from oil and natural gas production, fees for parking lots, and miscellaneous concessions.
Operating Expenses – The Port presents operating expenses at net of direct and indirect overhead costs allocated to capitalized construction projects. Direct costs are costs of materials, labor, and expenses assigned or identified with specific capitalized construction projects. Indirect costs are those that are not directly identifiable with a particular capital project and hence, are allocated to all outstanding construction projects. Indirect overhead costs such as
PORT OF LOS ANGELES (HARBOR DEPARTMENT OF THE CITY OF LOS ANGELES, CALIFORNIA)
Notes to the Basic Financial Statements
June 30, 2017 and 2016
- 51 - Continued…..
administrative expenses, maintenance salaries and City services are allocated to projects based on the average outstanding balance of capitalized construction projects.
Indirect overhead costs are defined to be the costs not directly attributable to those activities related to a capital project. The overhead rate is calculated based on the ratio of the costs of the direct amount of work assigned to capital projects to the total amount of hours worked by Port staff. The resulting rate is defined as the indirect overhead rate and is applied to the operating expenses of those divisions that participate both directly and indirectly in the activities related to capital projects. The resulting indirect overhead amount is then allocated on a pro-rata basis to capitalized construction projects based on the outstanding balance of each project.
Details of operating expenses net of allocated direct and indirect costs may be found on pages 111-112.
Operating Leases – The Port leases a substantial portion of lands and facilities to others. Leases relating to terminal operations tend to be long-term in nature (as long as 50 years), which generate 84.7% of the Port’s operating revenues. Leases relating to revocable permits and space assignments that are short-term in nature provide for cancellation on a 30-day notice by either party. Majority of the Port’s leases provide retention of ownership by the Port or restoration of the property to pre-leased conditions at the expiration of the agreement; accordingly, no leases are considered capital leases.
Pension and Other Postemployment Benefits (OPEB) – All full-time civilian Port employees are eligible to participate in the Los Angeles City Employees’ Retirement System (LACERS), a defined benefit single-employer pension plan. All full-time Port police officers are eligible to participate in the City of Los Angeles Fire and Police Pension System (LAFPP), a defined benefit single-employer pension plan. The Port funds fully its entire annual share of LACERS and LAFPP pensions and the respective OPEB contributions. The funding amounts are determined at the start of each fiscal year and are incorporated as part of the Port’s payroll to reimburse the City for the Port’s pro rata contribution share.
For purposes of measuring the net pension liability and deferred outflows/inflows of resources related to pensions, and pension expenses, information about the fiduciary net positions of LACERS and LAFPP, and additions to/deductions from LACERS and LAFPP’s fiduciary net positions have been determined on the same basis as they are reported by LACERS and LAFPP. For this purpose, benefit payments (including refunds of employee contributions) are recognized when due and payable in accordance with the benefit terms. Investments are reported at fair value.
Capital Contributions – The Port may receive grants for the purpose of acquisition or construction of property and equipment. These grants are generally structured as reimbursements against expenditures. Grants and similar items are recognized as capital contributions as soon as all eligibility requirements imposed by the provider have been met.

PORT OF LOS ANGELES (HARBOR DEPARTMENT OF THE CITY OF LOS ANGELES, CALIFORNIA)
Notes to the Basic Financial Statements
June 30, 2017 and 2016
- 52 - Continued…..
Net Position – The statements of net position are designed to display the financial position of the Port. The Port’s equity is reported as net position, which is classified into the following categories:
Net investment in capital assets – This category consists of capital assets, reduced by accumulated depreciation and by the outstanding balances of any bonds, notes, or other borrowings that are attributable to the acquisition, construction, or improvement of those assets. Deferred outflows of resources and deferred inflows of resources that are attributable to the acquisition, construction, or improvement of those assets or related debt are also included in this category.
Restricted – This category consists of restrictions placed on net position through external constraints imposed by creditors (such as debt covenants), grantors, contributors, or law or regulations of other governments. Constraints may also be imposed by law or constitutional provisions or enabling legislation.
Unrestricted – This category consists of net position that does not meet the definition of “restricted” or “net investment in capital assets.”
When both restricted and unrestricted resources are available for use, it is the Port’s policy to use unrestricted resources as needed and restricted resources for the purpose for which the restriction exists first.
Use of Estimates – The preparation of financial statements in conformity with U.S. generally accepted accounting principles requires management to make estimates and assumptions that affect certain reported amounts and disclosures. Accordingly, actual results could differ from those estimates.
Reclassifications – Certain reclassifications have been made to amounts reported in fiscal year 2016 to conform to the fiscal year 2017 presentation. Such reclassification had no impact on the change in net position previously reported. See Note 20 on page 103 of this report for additional information.

PORT OF LOS ANGELES (HARBOR DEPARTMENT OF THE CITY OF LOS ANGELES, CALIFORNIA)
Notes to the Basic Financial Statements
June 30, 2017 and 2016
- 53 - Continued…..
2. Adoption of New GASB Pronouncements
GASB Statement No. 74, “Financial Reporting for Postemployment Benefit Plans Other Than Pension Plans.” Issued in June 2015, this statement establishes new accounting and financial reporting requirements for governments whose employees are provided with postemployment benefits other than pensions (other postemployment benefits or OPEB), as well as for certain nonemployer governments that have a legal obligation to provide financial support for OPEB provided to the employees of other entities. This statement is effective for financial statements of applicable OPEB plans in fiscal year 2017. The statement has no impact on the Port’s financial statements because the Port does not administer an OPEB plan. The Port’s two retirement plans are implementing the statement in the plans’ separately issued financial reports.
GASB Statement No. 77, “Tax Abatement Disclosures.” Issued in August 2015, this statement improves financial reporting by giving users of financial statements essential information that is not consistently or comprehensively reported to the public at present. Disclosure of information about the nature and magnitude of tax abatements will make these transactions more transparent to financial statement users. As a result, users will be better equipped to understand (1) how tax abatements affect a government’s future ability to raise resources and meet its financial obligations and (2) the impact those abatements have on a government’s financial position and economic condition. The statement has no impact on the Port’s financial statements because the Port does not have transactions related to tax abatements.
GASB Statement No. 78, “Pensions Provided through Certain Multiple-Employer Defined Benefit Pension Plans.” Issued in December 2015, this statement amends the scope and applicability of Statement No. 68 to exclude pensions provided to employees of state and local government employers through certain cost-sharing multiple-employer defined benefit pension plans. This statement establishes requirements for recognition and measurement of pension expense, expenditures, and liabilities; note disclosures; and required supplementary information for pensions that have the characteristics described in the statement. The statement has no impact on the Port’s financial statements because the pension plans for the Port employees do not have the characteristics described in the statement.
GASB Statement No. 80, “Blending Requirements for Certain Component Units-an Amendment of GASB Statement No. 14.” Issued in January 2016, this statement amends the blending requirements for the financial statement presentation of component units of all state and local governments. The additional criterion requires blending of a component unit incorporated as a not-for-profit corporation in which the primary government is the sole corporate member. The Port implemented this statement in fiscal year 2017. The statement has no material impact on the Port’s financial statements.
PORT OF LOS ANGELES (HARBOR DEPARTMENT OF THE CITY OF LOS ANGELES, CALIFORNIA)
Notes to the Basic Financial Statements
June 30, 2017 and 2016
- 54 - Continued…..
3. Recent GASB Pronouncements for Future Adoption
GASB Statement No. 75, “Accounting and Financial Reporting for Postemployment Benefits Other Than Pensions.” Issued in June 2015, this statement establishes standards for recognizing and measuring liabilities, deferred outflows of resources, deferred inflows of resources, and expense/expenditures. For defined benefit OPEB, this statement identifies the methods and assumptions that are required to be used to project benefit payments, discount projected benefit payments to their actuarial present value, and attribute that present value to periods of employee service. Note disclosure and required supplementary information requirements about defined benefit OPEB also are addressed. This statement will be effective beginning fiscal year 2018.
GASB Statement No. 81, “Irrevocable Split-Interest Agreements.” Issued in March 2016, this statement requires that a government that receives resources pursuant to an irrevocable split interest agreement recognize assets, liabilities, and deferred inflows of resources at the inception of the agreement. This statement will be effective beginning fiscal year 2018.
GASB Statement No. 82, “Pension Issues-an Amendment of GASB Statements No. 67, No. 68, and No. 73.” Issued in March 2016, this statement addresses issues regarding (1) the presentation of payroll-related measures in required supplementary information, (2) the selection of assumptions and the treatment of deviations from the guidance in an Actuarial Standard of Practice for financial reporting purposes, and (3) the classification of payments made by employers to satisfy employee (plan member) contribution requirements. For items (1) and (3), the statement will be effective beginning fiscal year 2017. For item (2), the statement will be effective for actuarial valuations with the measurement date of June 30, 2017 for the Port’s financial statements as of June 30, 2018.
GASB Statement No. 83, “Certain Asset Retirement Obligations.” Issued in November 2016, this statement addresses accounting and financial reporting for certain assets retirement obligations (AROs). An ARO is a legally enforceable liability associated with the retirement of a tangible capital assets. The statement will enhance comparability and usefulness in governmental financial statements by establishing uniform criteria for governments to recognize and measure certain AROs and requiring disclosure related to those AROs. This statement will be effective beginning fiscal year 2019.
GASB Statement No. 84, “Fiduciary Activities.” Issued in January 2017, this statement establishes criteria for identifying fiduciary activities for accounting and financial reporting purposes and describes four fiduciary funds that should be reported, if applicable. The statement will be effective beginning fiscal year 2020.
GASB Statement No. 85, “Omnibus 2017.” Issued in March 2017, this statement addresses issues that have been identified during implementation and application of certain GASB Statements, including issues related to blending component units, goodwill, fair value measurement and application, and postemployment benefits (pensions and OPEB). The statement will be effective beginning fiscal year 2018.

PORT OF LOS ANGELES (HARBOR DEPARTMENT OF THE CITY OF LOS ANGELES, CALIFORNIA)
Notes to the Basic Financial Statements
June 30, 2017 and 2016
- 55 - Continued…..
GASB Statement No. 86, “Certain Debt Extinguishment Issues.” Issued in May 2017, this statement improves consistency in accounting and financial reporting for in-substance defeasance of debt by providing guidance for transactions in which cash and other monetary assets acquired with only existing resources – resources other than the proceeds of refunding debt – are placed in an irrevocable trust for the sole purpose of extinguishing debt. The statement also improves accounting and financial reporting for prepaid insurance on debt that is extinguished and notes to financial statements for debt that is defeased in substance. The statement will be effective beginning fiscal year 2018.
GASB Statement No. 87, “Leases.” Issued in June 2017, this statement increases the usefulness of government’s financial statements by requiring recognition of certain lease assets and liabilities for leases that previously were classified as operating leases and recognized as inflows of resources or outflows of resources based on payment provisions of the contract. It also establishes a single model for lease accounting based on the foundational principle that leases are financings of the right to use an underlying asset. The statement will be effective beginning fiscal year 2021.

PORT OF LOS ANGELES (HARBOR DEPARTMENT OF THE CITY OF LOS ANGELES, CALIFORNIA)
Notes to the Basic Financial Statements
June 30, 2017 and 2016
- 56 - Continued…..
4. Cash and Investments
The Port’s cash and investments consist of the following (in thousands):
2017 2016
Cash in bank and certificates of deposit $ 229 $ 332 Investment in U.S. Treasury and money market fund 62,283 95,769 Equity in the City of Los Angeles Investment Pool 644,939 476,297
Total cash and investments $ 707,451 $ 572,398
Certain of the Port’s cash and investments are restricted as to use by reason of bond indenture requirements or similar legal mandate. The Port’s unrestricted and restricted cash and investments are as follows (in thousands):
2017 2016
Unrestricted cash and cash equivalents $ 619,413 $ 445,289
Restricted cash and cash equivalentsCurrent
China Shipping Mitigation Fund 13,439 19,168 Community Mitigation Trust Fund – Trapac 112 112 Narcotics/Customs Enforcement Forfeiture Fund 611 531 Clean Truck Program and Fee Fund 5 30 Other 1,748 1,740
Subtotal – Current 15,915 21,581
NoncurrentHarbor Revenue Bond Funds 62,283 95,769 Customer Security Deposits 3,023 3,166 Batiquitos Environmental Fund 6,250 6,032 Harbor Restoration Fund 567 561
Subtotal – Noncurrent 72,123 105,528
Total restricted cash and investments 88,038 127,109
Total cash and investments $ 707,451 $ 572,398

PORT OF LOS ANGELES (HARBOR DEPARTMENT OF THE CITY OF LOS ANGELES, CALIFORNIA)
Notes to the Basic Financial Statements
June 30, 2017 and 2016
- 57 - Continued…..
A. Deposits
The Port had cash deposits and certificates of deposit with several major financial institutions amounting to $0.2 million and $0.3 million for fiscal years ended June 30, 2017 and 2016, respectively. The deposits were entirely covered by federal depository insurance or collateralized by securities held by the financial institutions in the Port’s name in conformance with the California Government Code.
B. Pooled Investments
The cash balances of substantially all funds on deposit in the City Treasury are pooled and invested by the City Treasurer for the purpose of maximizing interest earnings through pooled investment activities but safety and liquidity still take precedence over return. Interest earned on pooled investments is allocated to and recorded in certain participating funds, as authorized by the Los Angeles City Council (City Council) and permitted by the City Charter and the California Government Code, based on each fund's average daily deposit balance. Investments in the City Treasury are stated at fair value based on quoted market prices except for money market investments that have remaining maturities of one year or less at time of purchase, which are reported at amortized cost.
Pursuant to California Government Code Section 53607 (State Code) and the City Council File No. 94-2160, the City Treasury provides the City Council a statement of investment policy (the Policy) annually. City Council File No. 11-1740 was adopted on February 12, 2014, as the City’s investment policy. This Policy shall remain in effect until the City Council and the Mayor approve a subsequent revision. The Policy governs the City’s pooled investment practices. The Policy addresses soundness of financial institutions in which the City Treasurer will deposit funds and types of investment instruments permitted by California Government Code Sections 53600-53638, 16340 and 16429.1. The City Treasury further reports that the current policy allows for the purchase of investments with maturities up to thirty (30) years.
Examples of investments permitted by the Policy are obligations of the U.S. Treasury and agencies, local agency bonds, commercial paper notes, certificates of deposit (CD) placement service, bankers’ acceptances, medium term notes, repurchase agreements, mutual funds, money market mutual funds, and the State of California Local Agency Investment Fund.
The Port had $644.9 million and $476.3 million invested in the City’s General Pool and three Special Investment Pools, representing approximately 7.2% and 4.8% of the City Treasury’s General Pool and Special Investment Pools at June 30, 2017 and 2016, respectively.
The complete disclosures for the entire cash and investment pool are included in a publicly available financial report issued by the City. The report may be obtained by writing or calling: City of Los Angeles Office of the City Controller, 200 N. Main Street, City Hall East Room 300, Los Angeles, CA 90012, (213) 978-7555 or the Los Angeles City Controller’s website http://www.lacontroller.org/reports.
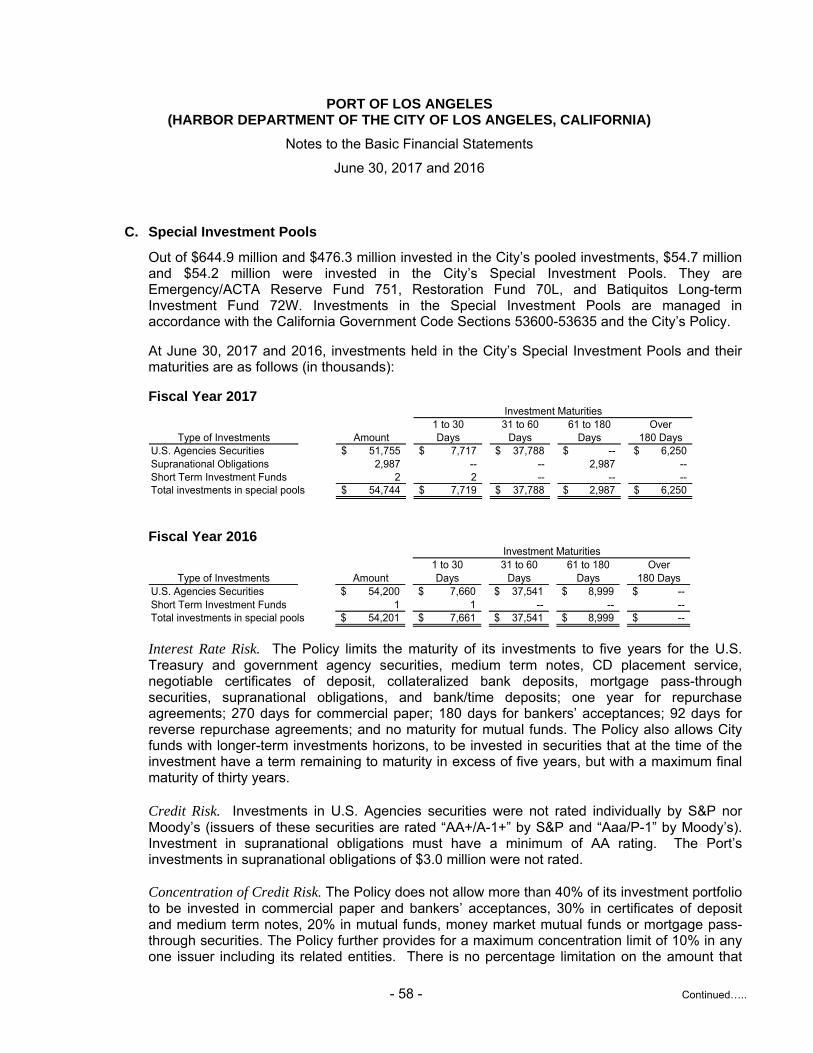
PORT OF LOS ANGELES (HARBOR DEPARTMENT OF THE CITY OF LOS ANGELES, CALIFORNIA)
Notes to the Basic Financial Statements
June 30, 2017 and 2016
- 58 - Continued…..
C. Special Investment Pools
Out of $644.9 million and $476.3 million invested in the City’s pooled investments, $54.7 million and $54.2 million were invested in the City’s Special Investment Pools. They are Emergency/ACTA Reserve Fund 751, Restoration Fund 70L, and Batiquitos Long-term Investment Fund 72W. Investments in the Special Investment Pools are managed in accordance with the California Government Code Sections 53600-53635 and the City’s Policy.
At June 30, 2017 and 2016, investments held in the City’s Special Investment Pools and their maturities are as follows (in thousands):
Fiscal Year 2017
1 to 30 31 to 60 61 to 180 OverAmount Days Days Days 180 Days
U.S. Agencies Securities 51,755$ 7,717$ 37,788$ --$ 6,250$ Supranational Obligations 2,987 -- -- 2,987 -- Short Term Investment Funds 2 2 -- -- -- Total investments in special pools 54,744$ 7,719$ 37,788$ 2,987$ 6,250$
Type of Investments
Investment Maturities
Fiscal Year 2016
Investment Maturities1 to 30 31 to 60 61 to 180 Over
Amount Days Days Days 180 DaysU.S. Agencies Securities 54,200$ 7,660$ 37,541$ 8,999$ --$ Short Term Investment Funds 1 1 -- -- -- Total investments in special pools 54,201$ 7,661$ 37,541$ 8,999$ --$
Type of Investments
Interest Rate Risk. The Policy limits the maturity of its investments to five years for the U.S. Treasury and government agency securities, medium term notes, CD placement service, negotiable certificates of deposit, collateralized bank deposits, mortgage pass-through securities, supranational obligations, and bank/time deposits; one year for repurchase agreements; 270 days for commercial paper; 180 days for bankers’ acceptances; 92 days for reverse repurchase agreements; and no maturity for mutual funds. The Policy also allows City funds with longer-term investments horizons, to be invested in securities that at the time of the investment have a term remaining to maturity in excess of five years, but with a maximum final maturity of thirty years. Credit Risk. Investments in U.S. Agencies securities were not rated individually by S&P nor Moody’s (issuers of these securities are rated “AA+/A-1+” by S&P and “Aaa/P-1” by Moody’s). Investment in supranational obligations must have a minimum of AA rating. The Port’s investments in supranational obligations of $3.0 million were not rated. Concentration of Credit Risk. The Policy does not allow more than 40% of its investment portfolio to be invested in commercial paper and bankers’ acceptances, 30% in certificates of deposit and medium term notes, 20% in mutual funds, money market mutual funds or mortgage pass-through securities. The Policy further provides for a maximum concentration limit of 10% in any one issuer including its related entities. There is no percentage limitation on the amount that

PORT OF LOS ANGELES (HARBOR DEPARTMENT OF THE CITY OF LOS ANGELES, CALIFORNIA)
Notes to the Basic Financial Statements
June 30, 2017 and 2016
- 59 - Continued…..
can be invested in the U.S. Treasury and government agencies. The City’s pooled investments comply with these requirements.
D. Other Investments
In each issuance of a parity obligation, the Port is required to establish a reserve fund with a trustee pursuant to the indenture. All moneys in the reserve funds or accounts shall be invested by the trustee solely in permitted investments. Permitted investments on deposit in the debt service reserve funds should be valued at fair market value and marked to market at least once per half year to meet the specific requirement under the indenture. Investments held in the debt service reserve funds shall mature no later than the final maturity of the bonds.
The Port evaluates the value of the reserve funds on or at August 1 of each year, in accordance with the Indenture of Trust (Indenture). The common reserve was $62.3 million at June 30, 2017 versus $66.6 million at June 30, 2016. The reserve funds were invested in money market funds and U.S. Treasuries.
Proceeds from any new money bonds should be invested in the “Permitted Investments” specified as follows: (1) direct obligations of the United States of America or obligations of the principal of and interest on which are unconditionally guaranteed by the United States of America; (2) bonds, debentures, notes, or other evidence of indebtedness issued or guaranteed by the federal or U.S. government agencies identified in the Indenture; (3) money market funds registered under the Federal Securities Act of 1933, and having a rating of AAAm-G, AAA-m, or AA-m by S&P and Aaa, Aa1, or Aa2 by Moody’s; (4) certificates of deposit issued by commercial bank, savings and loan associations, or mutual saving banks and secured at all times by collateral held by a third party; (5) certificates of deposits, savings accounts, deposit accounts, or money market deposits, which are fully insured by the Federal Deposit Insurance Corporation (FDIC), including the Bank Insurance Fund (BIF) and the Savings Association Insurance Fund (SAIF); (6) investment agreements including guaranteed investment contracts, forward purchase agreements, and reserve fund agreements with a provider whose long-term unsecured debt is rated not lower than the second highest rating category of Moody’s, and S&P; (7) commercial paper rated at the time of purchase, “Prime-1” by Moody’s, and “A-1” or better by S&P; (8) bonds or notes issued by any state or municipality, which are rated by Moody’s and S&P in one of the two highest rating categories assigned by such agencies; (9) federal funds or bankers acceptances with a maximum term of one year of any bank, which has an unsecured, uninsured, and unguaranteed obligation rating of “Prime-1” or “A3” or better by Moody’s and “A-1” or “A” or better by S&P; and (10) repurchase agreements between the Port and a dealer bank and securities firm. The term of the repurchase agreement may be up to 30 days and the value of the collateral must be equal to 104% of the amount of cash transferred to the dealer bank plus accrued interest. If the value of securities held as collateral slips below 104% of the value of the cash transferred by the Port, then additional cash and/or acceptable securities must be transferred. If, however, the securities used as collateral are the Federal National Mortgage Association (FNMA) or the Federal Home Loan Mortgage Corporation (FHLMC) then the value of collateral must equal to 105%.

PORT OF LOS ANGELES (HARBOR DEPARTMENT OF THE CITY OF LOS ANGELES, CALIFORNIA)
Notes to the Basic Financial Statements
June 30, 2017 and 2016
- 60 - Continued…..
E. City of Los Angeles Securities Lending Program
Portions of the Port funds are also used by the City in a Securities Lending Program (SLP) as part of the investment strategy relative to the total pool of funds invested by the City. The SLP is permitted and limited under provisions of California Government Code Section 53601. The City Council approved the SLP on October 22, 1991 under Council File No. 91-1860, which complies with the California Government Code. The objectives of the SLP in priority order are safety of loaned securities and prudent investment of cash collateral to enhance revenue from the investment program. The SLP is governed by a separate policy and guidelines.
The City’s custodial bank acts as the securities lending agent. In the event a counterparty defaults by reason of an act of insolvency, the bank shall take all actions which it deems necessary or appropriate to liquidate permitted investment and collateral in connection with such transaction and shall make a reasonable effort for within two business days (Replacement Period) to apply the proceeds thereof to the purchase of securities identical to the loaned securities not returned. If during the Replacement Period, the collateral liquidation proceeds are insufficient to replace any of the loaned securities not returned, the bank shall, subject to payment by the City of the amount of any losses on any permitted investments, pay such additional amounts as necessary to make such replacement.
Under the provisions of the SLP, and in accordance with the California Government Code, no more than 20% of the market value of the General Investment Pool (the Pool) is available for lending. The City loans out U.S. Treasury Notes, U.S. Agencies securities (e.g., Fannie Mae, Freddie Mac, Federal Home Loan Bank, Farmer Mac, Federal Farm Credit Bank and Tennessee Valley Authority), Medium-term Notes, and Supranational Obligations. The City receives cash as collateral on the loaned securities, which is reinvested in securities permitted under the Policy. In addition, the City receives securities as collateral on loaned securities, which the City has no ability to pledge or sell without borrower default. In accordance with the California Government Code, the securities lending agent marks to market the value of both the collateral and the reinvestments daily. Except for open loans where either party can terminate a lending contract on demand, term loans have a maximum life of 60 days. Earnings from securities lending accrue to the Pool and are allocated on a pro-rata basis to all Pool participants.
During the fiscal years 2017 and 2016, collateralizations on all loaned securities were compliant with the required 102% of the market value. The City can sell collateral securities only in the event of borrower default. The lending agent provides indemnification for borrower default. There were no violations of legal or contractual provisions and no borrower or lending agent default losses during the fiscal year. There was no credit risk exposure to the City because the amounts owed to the borrowers exceeded the amounts borrowed. Loaned securities are held by the City’s agents in the City’s name and are not subject to custodial credit risk.
The Port’s share in the assets and liabilities from the reinvested cash collateral amounted to $4.4 million and $7.9 million as of June 30, 2017 and 2016, respectively.
The above disclosures on “Note 4.E. City of Los Angeles Securities Lending Program” were derived from information prepared by the City and furnished to the Port.

PORT OF LOS ANGELES (HARBOR DEPARTMENT OF THE CITY OF LOS ANGELES, CALIFORNIA)
Notes to the Basic Financial Statements
June 30, 2017 and 2016
- 61 - Continued…..
F. Fair Value Measurement
The Port categorizes its fair value measurement within the fair value hierarchy established by GAAP. The hierarchy is based on the valuation inputs used to measure the fair value of the asset.
Level 1 inputs are quoted prices in active markets for identical assets;
Level 2 inputs are significant other observable inputs;
Level 3 inputs are significant unobservable inputs.
The Port has the following recurring fair value measurements as of June 30, 2017:
Total Level 1 Level 2 Level 3
U.S. Treasury notes 61,965$ 61,965$ --$ --$ Money market fund 317 -- 317 --
Total investments - bond funds 62,282$ 61,965$ 317$ --$
U.S. Agencies Securities 51,755$ --$ 51,755$ --$ Supranational obligations 2,987 -- 2,987 --
Total investments - special pools 54,742$ --$ 54,742$ --$
The Port has the following recurring fair value measurements as of June 30, 2016:
Total Level 1 Level 2 Level 3
U.S. Treasury notes 66,292$ 66,292$ --$ --$ Money market fund 29,477 -- 29,477 --
Total investments - bond funds 95,769$ 66,292$ 29,477$ --$
U.S. Agencies Securities 54,200$ --$ 54,200$ --$
Total investments - special pools 54,200$ --$ 54,200$ --$
Investments in Short Term Investment Funds of the City’s Special Investment Pools are considered cash equivalents due to their liquidity and are excluded from the fair value measurement.

PORT OF LOS ANGELES (HARBOR DEPARTMENT OF THE CITY OF LOS ANGELES, CALIFORNIA)
Notes to the Basic Financial Statements
June 30, 2017 and 2016
- 62 - Continued…..
5. Capital Assets
The Port’s capital assets consist of the following activities for fiscal year ended June 30, 2017 (in thousands):
Balance BalanceJuly 1, 2016 Increase Decrease June 30, 2017
Capital assets not depreciatedLand $ 1,108,023 $ -- $ -- $ -- $ 1,108,023 Construction in progress 112,391 169,717 -- (234,631) 47,477 Preliminary costs – capital
projects 203,996 -- (25,614) (81,162) 97,220 Intangible assets 12,900 -- -- -- 12,900
Total capital assetsnot depreciated 1,437,310 169,717 (25,614) (315,793) 1,265,620
Capital assets depreciated/amortizedWharves and sheds 1,178,292 -- -- 3,089 1,181,381 Buildings/facilities 3,068,220 -- (22,562) 308,031 3,353,689 Equipment 161,748 3,793 (6,587) 4,673 163,627 Intangible assets 12,460 -- -- -- 12,460
Total capital assetsdepreciated/amortized 4,420,720 3,793 (29,149) 315,793 4,711,157
Less accumulated depreciation/amortizationWharves and sheds (472,511) (28,224) -- -- (500,735) Buildings/facilities (1,321,566) (117,376) 21,742 -- (1,417,200) Equipment (111,102) (26,671) 6,587 -- (131,186) Intangible assets (1,949) (623) -- -- (2,572)
Total accumulateddepreciation/amortization (1,907,128) (172,894) 28,329 -- (2,051,693)
Total capital assets depreciated/amortized, net 2,513,592 (169,101) (820) 315,793 2,659,464
Capital assets, net $ 3,950,902 $ 616 $ (26,434) $ -- $ 3,925,084
and TransfersAdjustments

PORT OF LOS ANGELES (HARBOR DEPARTMENT OF THE CITY OF LOS ANGELES, CALIFORNIA)
Notes to the Basic Financial Statements
June 30, 2017 and 2016
- 63 - Continued…..
The Port’s capital assets consist of the following activities for fiscal year ended June 30, 2016 (in thousands):
Balance BalanceJuly 1, 2015 Increase Decrease June 30, 2016
Capital assets not depreciatedLand $ 1,107,506 $ 1,211 $ (900) $ 206 $ 1,108,023 Construction in progress 182,747 153,153 -- (223,509) 112,391 Preliminary costs – capital
projects 160,562 47,662 -- (4,228) 203,996 Intangible assets 12,900 -- -- -- 12,900
Total capital assetsnot depreciated 1,463,715 202,026 (900) (227,531) 1,437,310
Capital assets depreciated/amortizedWharves and sheds 1,163,742 -- -- 14,550 1,178,292 Buildings/facilities 2,857,903 116 (404) 210,605 3,068,220 Equipment 158,125 1,464 (589) 2,748 161,748 Intangible assets 12,460 -- -- -- 12,460
Total capital assetsdepreciated/amortized 4,192,230 1,580 (993) 227,903 4,420,720
Less accumulated depreciation/amortizationWharves and sheds (437,206) (35,305) -- -- (472,511) Buildings/facilities (1,213,414) (108,556) 404 -- (1,321,566) Equipment (91,863) (19,449) 582 (372) (111,102) Intangible assets (1,326) (623) -- -- (1,949)
Total accumulateddepreciation/amortization (1,743,809) (163,933) 986 (372) (1,907,128)
Total capital assets depreciated/amortized, net 2,448,421 (162,353) (7) 227,531 2,513,592
Capital assets, net $ 3,912,136 $ 39,673 $ (907) $ -- $ 3,950,902
and TransfersAdjustments
Net interest expense of $35.5 million and $41.2 million was capitalized for fiscal years 2017 and 2016, respectively.

PORT OF LOS ANGELES (HARBOR DEPARTMENT OF THE CITY OF LOS ANGELES, CALIFORNIA)
Notes to the Basic Financial Statements
June 30, 2017 and 2016
- 64 - Continued…..
6. Investment in Joint Powers Authorities and Other Entities
The Port has entered into two joint powers agreements as follows:
A. Intermodal Container Transfer Facility Joint Powers Authority
The Port of Los Angeles (POLA) and the Harbor Department of the City of Long Beach, California (POLB) entered into a joint powers agreement to form the Intermodal Container Transfer Facility Joint Powers Authority (ICTF) for the purpose of financing and constructing a facility to transfer cargo containers between trucks and railroad cars. The POLA contributed $2.5 million to the ICTF as part of the agreement. The facility, which began operations in December 1986, was developed and operated by Southern Pacific Transportation Company (SPTC) under a long-term lease agreement. SPTC was subsequently merged and continues operations as Union Pacific Corporation (UPC). The POLA appoints two members of the ICTF’s five-member governing board and accounts for its investment using the equity method. Both the POLA and POLB share income and equity distributions equally.
ICTF has issued bonds in prior years. At June 30, 2017 and 2016, there were no outstanding bonds.
The ICTF’s operations are financed from lease revenues by ICTF activities. The ICTF is empowered to perform those actions necessary for the development of the facility, including acquiring, constructing, leasing, and selling any of its property. The Port’s share of the ICTF’s net position at June 30, 2017 and 2016 totaled $5.7 million and $5.6 million, respectively. Separate financial statements for ICTF may be obtained from the Executive Director, Intermodal Container Transfer Facility Joint Powers Authority, 4801 Airport Plaza Drive, Long Beach, California 90815 or the ICTF’s website at http://ictf-jpa.org/document_library.php.
B. Alameda Corridor Transportation Authority
In August 1989, the Alameda Corridor Transportation Authority (ACTA) as established through a Joint Exercise of Powers Agreement between the Cities of Los Angeles and Long Beach, California. The purpose of ACTA is to acquire, construct, finance, and operate a consolidated transportation corridor; including an improved railroad expressway between the POLA and the Port of Long Beach (the POLB and, together with the POLA, the Ports) and downtown Los Angeles.
The POLA has no share of the ACTA’s net position and income at June 30, 2017 and 2016, and accordingly, they have not been recorded in the accompanying basic financial statements. If in the future, ACTA is entitled to distribute income or make equity distributions, the Ports shall share such income and equity distributions equally.
Separate financial statements for ACTA may be obtained from the Chief Financial Officer, Alameda Corridor Transportation Authority, One Civic Plaza Drive, Suite 350, Carson, California 90745 or the ACTA’s website http://www.acta.org/revenue_finance/financial_statement.asp.

PORT OF LOS ANGELES (HARBOR DEPARTMENT OF THE CITY OF LOS ANGELES, CALIFORNIA)
Notes to the Basic Financial Statements
June 30, 2017 and 2016
- 65 - Continued…..
7. Long-Term Debt
A. Bonded Debt, Commercial Paper and Other Indebtedness
Bonds issued by the Port are payable solely from the Port’s revenues pledged under indentures and are not general obligations of the City. The Port has agreed to certain covenants with respect to bonded indebtedness. Significant covenants include the requirement that the Port’s revenues, as defined under indentures, will be sufficient to pay future bond interest and principal maturities.
The Port’s activities for bonded debt and other indebtedness for fiscal year 2017 are as follows (in thousands):
Fiscal Beginning Ending PrincipalCall Date of Interest Maturity Original Balance Balance Due Within
Parity Bonds Provisions Issue Rate Year Principal July 1, 2016 Additions Deductions June 30, 2017 One Year
Issue 2006, Series A 8/1/2016 @ 102% 5/4/2006 5.00% 2025 $ 200,710 $ 48,760 $ -- $ (48,760) $ -- $ -- Issue 2006, Series B 8/1/2016 @ 102% 8/3/2006 5.00% 2026 209,815 72,560 -- (72,560) -- -- Issue 2006, Series C 8/1/2016 @ 102% 8/3/2006 5.00% 2026 16,545 11,155 -- (11,155) -- -- Issue 2009, Series A 8/1/2019 @ 100% 7/9/2009 2.00% – 5.25% 2030 100,000 78,665 -- (4,095) 74,570 4,255 Issue 2009, Series B 8/1/2019 @ 100% 7/9/2009 5.25% 2040 100,000 100,000 -- (100,000) -- -- Issue 2009, Series C 8/1/2019 @ 100% 7/9/2009 4.00% – 5.25% 2032 230,160 180,435 -- (8,860) 171,575 2,265 Issue 2011, Series A 8/1/2021 @ 100% 7/7/2011 3.00% – 5.00% 2023 58,930 56,795 -- (7,130) 49,665 7,490 Issue 2011, Series B 8/1/2021 @ 100% 7/7/2011 4.00% – 5.00% 2026 32,820 32,820 -- -- 32,820 -- Issue 2014, Series A 8/1/2024 @ 100% 9/18/2014 2.00% – 5.00% 2045 203,280 201,005 -- (3,420) 197,585 4,595 Issue 2014, Series B 8/1/2024 @ 100% 9/18/2014 3.00% – 5.00% 2045 89,105 87,745 -- (1,425) 86,320 1,480 Issue 2014, Series C 8/1/2024 @ 100% 9/18/2014 2.00% – 5.00% 2045 44,890 44,130 -- (780) 43,350 805 Issue 2015, Series A 8/1/2025 @ 100% 9/18/2014 2.00% – 5.00% 2027 37,050 37,050 -- (2,755) 34,295 2,835 Issue 2016, Series A 8/1/2026 @ 100% 10/13/2016 3.00% – 5.00% 2025 97,970 -- 97,970 -- 97,970 13,055 Issue 2016, Series B 8/1/2026 @ 100% 10/13/2016 2.00% – 5.00% 2037 68,385 -- 68,385 -- 68,385 835 Issue 2016, Series C 8/1/2026 @ 100% 10/13/2016 4.00% 2040 35,205 -- 35,205 -- 35,205 --
Total parity bonds $ 1,524,865 951,120 201,560 (260,940) 891,740 37,615
Unamortized bond premium 57,202 28,946 (8,545) 77,603 --
Net parity bonds 1,008,322 230,506 (269,485) 969,343 37,615
Less: current maturities of long-term debt (41,695) (50,570) 54,650 (37,615) --
Total long-term debt net of current maturities $ 966,627 $ 179,936 $ (214,835) $ 931,728 $ 37,615

PORT OF LOS ANGELES (HARBOR DEPARTMENT OF THE CITY OF LOS ANGELES, CALIFORNIA)
Notes to the Basic Financial Statements
June 30, 2017 and 2016
- 66 - Continued…..
The Port’s activities for bonded debt and other indebtedness for fiscal year 2016 are as follows (in thousands):
Fiscal Beginning Ending PrincipalCall Date of Interest Maturity Original Balance Balance Due Within
Parity Bonds Provisions Issue Rate Year Principal July 1, 2015 Additions Deductions June 30, 2016 One Year
Issue 2005, Series A 8/1/2015 @ 102% 10/13/2005 3.25% – 5.00% 2027 $ 29,930 $ 24,250 $ -- $ (24,250) $ -- $ -- Issue 2005, Series B 8/1/2015 @ 102% 10/13/2005 3.00% – 5.00% 2027 30,110 22,680 -- (22,680) -- -- Issue 2005, Series C-1 8/1/2015 @ 102% 10/13/2005 4.00% – 5.00% 2016 43,730 7,410 -- (7,410) -- -- Issue 2006, Series A 8/1/2016 @ 102% 5/4/2006 5.00% 2025 200,710 48,760 -- -- 48,760 195 Issue 2006, Series B 8/1/2016 @ 102% 8/3/2006 5.00% 2026 209,815 84,100 -- (11,540) 72,560 12,140 Issue 2006, Series C 8/1/2016 @ 102% 8/3/2006 5.00% 2026 16,545 12,005 -- (850) 11,155 895 Issue 2009, Series A 8/1/2019 @ 100% 7/9/2009 2.00% – 5.25% 2030 100,000 82,570 -- (3,905) 78,665 4,095 Issue 2009, Series B 8/1/2019 @ 100% 7/9/2009 5.25% 2040 100,000 100,000 -- -- 100,000 -- Issue 2009, Series C 8/1/2019 @ 100% 7/9/2009 4.00% – 5.25% 2032 230,160 190,110 -- (9,675) 180,435 8,860 Issue 2011, Series A 8/1/2021 @ 100% 7/7/2011 3.00% – 5.00% 2023 58,930 58,930 -- (2,135) 56,795 7,130 Issue 2011, Series B 8/1/2021 @ 100% 7/7/2011 4.00% – 5.00% 2026 32,820 32,820 -- -- 32,820 -- Issue 2014, Series A 8/1/2024 @ 100% 9/18/2014 2.00% – 5.00% 2045 203,280 203,280 -- (2,275) 201,005 3,420 Issue 2014, Series B 8/1/2024 @ 100% 9/18/2014 3.00% – 5.00% 2045 89,105 89,105 -- (1,360) 87,745 1,425 Issue 2014, Series C 8/1/2024 @ 100% 9/18/2014 2.00% – 5.00% 2045 44,890 44,890 -- (760) 44,130 780 Issue 2015, Series A 8/1/2025 @ 100% 9/18/2014 2.00% – 5.00% 2026 37,050 -- 37,050 -- 37,050 2,755
Total parity bonds $ 1,427,075 1,000,910 37,050 (86,840) 951,120 41,695
Unamortized bond (discount) premium 58,693 6,597 (8,088) 57,202 --
Net parity bonds 1,059,603 43,647 (94,928) 1,008,322 41,695
Less: current maturities of long-term debt (42,910) (41,695) 42,910 (41,695) --
Total long-term debt net of current maturities $ 1,016,693 $ 1,952 $ (52,018) $ 966,627 $ 41,695

PORT OF LOS ANGELES (HARBOR DEPARTMENT OF THE CITY OF LOS ANGELES, CALIFORNIA)
Notes to the Basic Financial Statements
June 30, 2017 and 2016
- 67 - Continued…..
B. Bond Premium and Discount
Original bond premium or discount is amortized over the life of the bonds. At the time of bond refunding, the unamortized discount or premium is amortized over the life of the refunded bonds or the life of the refunding bonds, whichever is shorter.
The unamortized discount or premium for the outstanding bonds for fiscal years 2017 and 2016 are as follows (in thousands):
2017 2016Premium Premium
Harbor Revenue Bonds (Discount) (Discount)
Issue of 2006, Series A $ -- $ 740 Issue of 2006, Series B -- 816 Issue of 2006, Series C -- 236 Issue of 2009, Series A 643 799 Issue of 2009, Series B -- (1,984) Issue of 2009, Series C 2,597 3,062 Issue of 2011, Series A 1,584 2,311 Issue of 2011, Series B 2,188 2,460 Issue of 2014, Series A 22,478 24,491 Issue of 2014, Series B 11,565 12,414 Issue of 2014, Series C 5,657 6,018 Issue of 2015, Series A 4,815 5,839 Issue of 2016, Series A 9,417 -- Issue of 2016, Series B 12,645 -- Issue of 2016, Series C 4,014 --
Total $ 77,603 $ 57,202

PORT OF LOS ANGELES (HARBOR DEPARTMENT OF THE CITY OF LOS ANGELES, CALIFORNIA)
Notes to the Basic Financial Statements
June 30, 2017 and 2016
- 68 - Continued…..
C. Principal Maturities and Interest
The Port’s scheduled annual debt service payments for bonded debt and other indebtedness are as follows (in thousands):
Principal Interest Total
2018 $ 37,615 $ 42,531 $ 80,146 2019 44,015 40,868 84,883 2020 46,515 38,836 85,351 2021 48,295 36,547 84,842 2022 51,280 34,069 85,349 2023 – 2027 290,210 127,383 417,593 2028 – 2032 99,985 78,115 178,100 2033 – 2037 127,065 50,399 177,464 2038 – 2042 98,525 22,619 121,144 2043 – 2045 48,235 3,698 51,933
Total $ 891,740 $ 475,065 $ 1,366,805
Fiscal Year
PORT OF LOS ANGELES (HARBOR DEPARTMENT OF THE CITY OF LOS ANGELES, CALIFORNIA)
Notes to the Basic Financial Statements
June 30, 2017 and 2016
- 69 - Continued…..
D. New Issuances
Fiscal Year 2017
2016 Series A Refunding Bonds The 2016 Series A Refunding Bonds were issued in October 2016 in aggregate principal amount of $98.0 million to refund the outstanding principal of $48.6 million of the 2006 Series A Refunding Bonds and $60.4 million of 2006 Series B Refunding Bonds. The 2016 Series A Refunding transaction resulted in cash flow savings of $14.7 million and economic gain of $11.8 million over the life of the bonds. Interest on the 2016 Series A Refunding Bonds is payable semiannually on February 1 and August 1 of each year starting from February 1, 2017. The bonds bear interest at coupon rates from 3% to 5% with maturity dates ranging from August 2017 to August 2024. 2016 Series B Refunding Bonds The 2016 Series B Refunding Bonds were issued in October 2016 in aggregate principal amount of $68.4 million to refund the outstanding principal of $10.2 million of the 2006 Series C Refunding Bonds and a portion of $100 million outstanding principal of 2009 Series B Bonds. The 2016 Series B Refunding transaction resulted in cash flow savings of $19.1 million and economic gain of $13.6 million over the life of the bonds. Interest on the 2016 Series B Refunding Bonds is payable semiannually on February 1 and August 1 of each year starting from February 1, 2017.The bonds bear interest at coupon rates from 2% to 5% with maturity dates ranging from August 2017 to August 2036. The Bonds with stated maturities on or after August 1, 2030 shall be subject to optional redemption prior to their maturities on or after August 1, 2026 without early redemption premium.

PORT OF LOS ANGELES (HARBOR DEPARTMENT OF THE CITY OF LOS ANGELES, CALIFORNIA)
Notes to the Basic Financial Statements
June 30, 2017 and 2016
- 70 - Continued…..
2016 Series C Refunding Green Bonds The 2016 Series C Refunding Green Bonds were issued in October 2016 in aggregate principal amount of $35.2 million to refund a portion of $100 million outstanding principal of 2009 Series B Bonds. The 2016 Series C Refunding transaction resulted in cash flow savings of $7.8 million and economic gain of $7.1 million over the life of the bonds. Interest on the 2016 Series C Refunding Green Bonds is payable semiannually on February 1 and August 1 of each year starting from February 1, 2017. These bonds are term bonds bearing interest at coupon rate of 4% with maturity dates ranging from August 2036 to August 2039. The Bonds with stated maturities on or after August 1, 2036 shall be subject to optional redemption prior to their maturities on or after August 1, 2026 without early redemption premium. Fiscal Year 2016
2015 Series A Refunding Bonds
The 2015 Series A Refunding Bonds were issued in October 2015 in the aggregate principal amount of $37.1 million to refund the outstanding principal of $22.7 million of the 2005 Series A Refunding Bonds and $21.2 million of the 2005 Series B Refunding Bonds. The refunding transaction resulted in cash flow savings of $9.3 million and economic gain of $8.4 million over the life of the bonds.
Interest on the 2015 Series A Refunding Bonds is payable semiannually on February 1 and August 1 of each year starting from February 1, 2016. The bonds bear interest at coupon rates from 2.00% to 5.00% with maturity dates ranging from August 2016 to August 2026.
Bonds maturing on August 1, 2026 total of $3.2 million are subject to optional redemption on or after August 1, 2025 without early redemption premium.

PORT OF LOS ANGELES (HARBOR DEPARTMENT OF THE CITY OF LOS ANGELES, CALIFORNIA)
Notes to the Basic Financial Statements
June 30, 2017 and 2016
- 71 - Continued…..
E. Commercial Paper
The Port has established a Commercial Paper program (Program) supported by bank credit lines to issue commercial paper notes (Notes) to provide interim financing primarily for the construction, maintenance, and replacement of the Port’s structures, facilities, and equipment needs. The total credit available under the current credit facilities that support the Program is at $200.0 million. The term of the Program will expire in August 2018.
There was no outstanding commercial paper as of June 30, 2017 and 2016.
F. Prior Years’ Defeasance of Debt
The Port defeased those bonds refunded by placing the proceeds of refunding bonds in irrevocable trusts to provide for all future debt service payments on old bonds. Accordingly, the trust account assets and liability for the defeased bonds are not included in the Port’s financial statements.
At June 30, 2017 and 2016, $20.8 million and $30.1 million, respectively, of defeased 1988 bonds remain outstanding.
An escrow for the advance refunding of 2009 Series B Bonds was established in October 2016 with remaining balance of $110.8 million as June 30, 2017.

PORT OF LOS ANGELES (HARBOR DEPARTMENT OF THE CITY OF LOS ANGELES, CALIFORNIA)
Notes to the Basic Financial Statements
June 30, 2017 and 2016
- 72 - Continued…..
8. Changes in Long-Term Liabilities
The changes in the Port’s long-term liabilities for the year ended June 30, 2017 are as follows (in thousands):
Balance Balance Due withinJuly 1, 2016 Additions Deductions June 30, 2017 one year
Revenue bonds $ 951,120 $ 201,560 $ (260,940) $ 891,740 $ 37,615 Unamortized (discount)/
premium 57,202 28,946 (8,545) 77,603 --
Net revenue bonds 1,008,322 230,506 (269,485) 969,343 37,615
Accrued employee benefits 8,663 133,757 (134,173) 8,247 710 Litigation 1,524 531 (146) 1,909 1,909 Workers compensation 12,508 4,353 (2,106) 14,755 1,820 Pollution remediation 74,826 50,100 (29,865) 95,061 11,776 Deposits 13,342 440 (235) 13,547 -- Net pension liabilities 215,829 15,496 231,325 -- Others 23,043 8,726 (13,836) 17,933 16,084
Total long-term liabilities $ 1,358,057 $ 443,909 $ (449,846) $ 1,352,120 $ 69,914

PORT OF LOS ANGELES (HARBOR DEPARTMENT OF THE CITY OF LOS ANGELES, CALIFORNIA)
Notes to the Basic Financial Statements
June 30, 2017 and 2016
- 73 - Continued…..
The changes in the Port’s long-term liabilities for the year ended June 30, 2016 are as follows (in thousands):
Balance Balance Due withinJuly 1, 2015 Additions Deductions June 30, 2016 one year
Revenue bonds $ 1,000,910 $ 37,050 $ (86,840) $ 951,120 $ 41,695 Unamortized (discount)/
premium 58,693 6,597 (8,088) 57,202 --
Net revenue bonds 1,059,603 43,647 (94,928) 1,008,322 41,695
Accrued employee benefits 9,345 147,690 (148,372) 8,663 550 Litigation 1,601 621 (698) 1,524 1,524 Workers compensation 15,335 -- (2,827) 12,508 1,504 Pollution remediation 73,403 5,194 (3,771) 74,826 10,002 Deposits 12,751 739 (148) 13,342 -- Net pension liabilities 198,762 18,858 (1,791) 215,829 -- Others 24,446 4,994 (6,397) 23,043 21,209
Total long-term liabilities $ 1,395,246 $ 221,743 $ (258,932) $ 1,358,057 $ 76,484
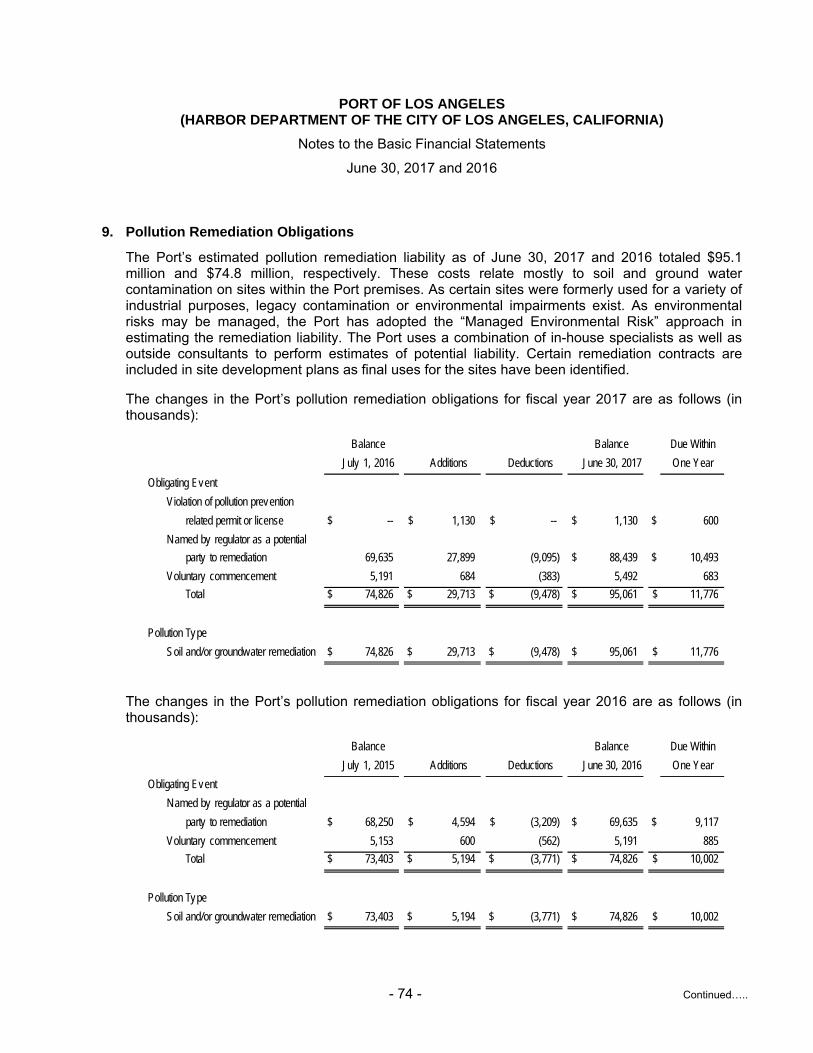
PORT OF LOS ANGELES (HARBOR DEPARTMENT OF THE CITY OF LOS ANGELES, CALIFORNIA)
Notes to the Basic Financial Statements
June 30, 2017 and 2016
- 74 - Continued…..
9. Pollution Remediation Obligations
The Port’s estimated pollution remediation liability as of June 30, 2017 and 2016 totaled $95.1 million and $74.8 million, respectively. These costs relate mostly to soil and ground water contamination on sites within the Port premises. As certain sites were formerly used for a variety of industrial purposes, legacy contamination or environmental impairments exist. As environmental risks may be managed, the Port has adopted the “Managed Environmental Risk” approach in estimating the remediation liability. The Port uses a combination of in-house specialists as well as outside consultants to perform estimates of potential liability. Certain remediation contracts are included in site development plans as final uses for the sites have been identified.
The changes in the Port’s pollution remediation obligations for fiscal year 2017 are as follows (in thousands):
Balance Balance Due Within
July 1, 2016 Additions Deductions June 30, 2017 One Year
Obligating Event
Violation of pollution prevention
related permit or license $ -- $ 1,130 $ -- $ 1,130 $ 600
Named by regulator as a potential
party to remediation 69,635 27,899 (9,095) $ 88,439 $ 10,493
Voluntary commencement 5,191 684 (383) 5,492 683
Total $ 74,826 $ 29,713 $ (9,478) $ 95,061 $ 11,776
Pollution Type
Soil and/or groundwater remediation $ 74,826 $ 29,713 $ (9,478) $ 95,061 $ 11,776
The changes in the Port’s pollution remediation obligations for fiscal year 2016 are as follows (in thousands):
Balance Balance Due Within
July 1, 2015 Additions Deductions June 30, 2016 One Year
Obligating Event
Named by regulator as a potential
party to remediation $ 68,250 $ 4,594 $ (3,209) $ 69,635 $ 9,117
Voluntary commencement 5,153 600 (562) 5,191 885
Total $ 73,403 $ 5,194 $ (3,771) $ 74,826 $ 10,002
Pollution Type
Soil and/or groundwater remediation $ 73,403 $ 5,194 $ (3,771) $ 74,826 $ 10,002

PORT OF LOS ANGELES (HARBOR DEPARTMENT OF THE CITY OF LOS ANGELES, CALIFORNIA)
Notes to the Basic Financial Statements
June 30, 2017 and 2016
- 75 - Continued…..
10. Employee Deferred Compensation Plan
The City offers a deferred compensation plan created in accordance with Internal Revenue Code Section 457 to its employees, in which Port employees participate, allowing them to defer receipt of income. All amounts deferred by the Port’s employees are paid to the City, which in turn pays them to the deferred compensation plan administrator. All amounts of compensation deferred under the plan, all property and rights purchased with those amounts, and all income attributable to those amounts are held in such custodial account for the exclusive benefit of the employee participants and their beneficiaries. Information on the Port employees’ share of plan assets is not available and is not recorded in the Port’s financial statements.
While the City has full power and authority to administer and to adopt rules and regulations for the plan, all investment decisions under the plan are the responsibility of the plan participants. The City has no liability for losses under the plan, but does have the duty of due care that would be required of an ordinary prudent investor. Under certain circumstances, employees may modify their arrangements with the plan to provide for greater or lesser contributions or to terminate their participation. If participants retire under the plan or terminate service with the City, they may be eligible to receive payments under the plan in accordance with the provisions thereof. In the event of serious financial emergency, the City may approve, upon request, withdrawals from the plan by the participants, along with their allocated contributions.

PORT OF LOS ANGELES (HARBOR DEPARTMENT OF THE CITY OF LOS ANGELES, CALIFORNIA)
Notes to the Basic Financial Statements
June 30, 2017 and 2016
- 76 - Continued…..
11. Risk Management
The Port purchases insurance for a variety of exposures associated with property, automobiles, vessels, employment practices, travel, police, pilotage, special events, and terrorism. The City is self-insured for workers’ compensation, and the Port participates in the City’s self-insurance program. Third party general liability exposures are self-insured by the Port for $1.0 million and the excess liability is maintained over the self-insured retention. There have been no settlements in the past three years that have exceeded the Port’s insurance coverage.
The actuarially determined accrued liability for workers’ compensation includes provision for incurred but not reported claims and loss adjustment expenses. The Port’s accrued workers’ compensation liability at June 30, 2017 and 2016 were $14.8 million and $12.5 million, respectively.
A number of lawsuits were pending against the Port that arose in the normal course of operations. The Port recognizes a liability for claims and when it is probable that a loss has been incurred and the amount of that loss, including those incurred but not reported, can be reasonably estimated. The City Attorney provides estimates for the amount of liabilities to be probable of occurring from lawsuits. The Port’s liability for litigation and other claims at June 30, 2017 and 2016 were $1.9 million and $1.5 million, respectively.

PORT OF LOS ANGELES (HARBOR DEPARTMENT OF THE CITY OF LOS ANGELES, CALIFORNIA)
Notes to the Basic Financial Statements
June 30, 2017 and 2016
- 77 - Continued…..
The changes in the Port’s estimated claims payable are as follows (in thousands):
2017 2016 2015Unpaid claims, July 1
Workers compensation $ 12,508 $ 15,335 $ 15,826 General liability/litigation 1,524 1,601 333
Total unpaid claims, July 1 14,032 16,936 16,159 Provision for current year's events and changes
in provision for prior year's eventsWorkers compensation 4,353 (1,167) 936 General liability/litigation 624 621 1,567
Total provision 4,977 (546) 2,503 Claims payments
Workers compensation (2,106) (1,660) (1,427) General liability/litigation (239) (698) (299)
Total claims payments (2,345) (2,358) (1,726) Unpaid claims, June 30
Workers' compensation 14,755 12,508 15,335 General liability/litigation 1,909 1,524 1,601
Total unpaid claims, June 30 $ 16,664 $ 14,032 $ 16,936
Current portionWorkers compensation $ 1,820 $ 1,504 $ 1,783 General liability/litigation 1,909 1,524 1,601
Total current portion $ 3,729 $ 3,028 $ 3,384
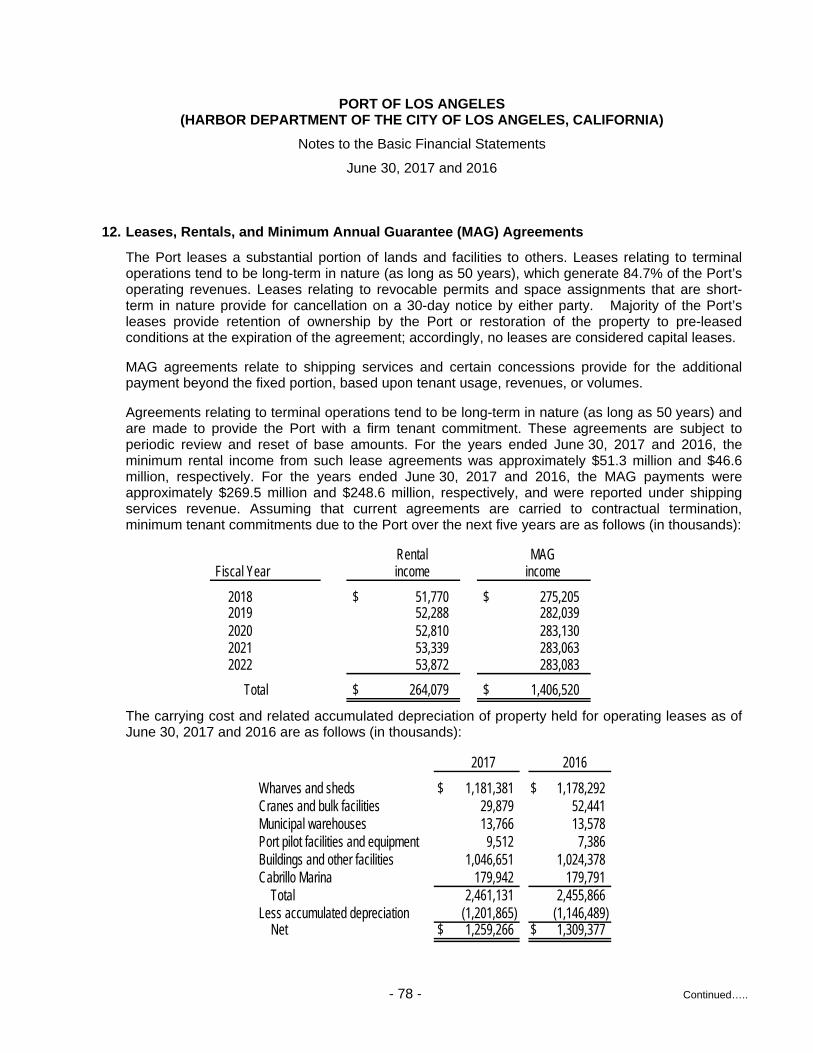
PORT OF LOS ANGELES (HARBOR DEPARTMENT OF THE CITY OF LOS ANGELES, CALIFORNIA)
Notes to the Basic Financial Statements
June 30, 2017 and 2016
- 78 - Continued…..
12. Leases, Rentals, and Minimum Annual Guarantee (MAG) Agreements
The Port leases a substantial portion of lands and facilities to others. Leases relating to terminal operations tend to be long-term in nature (as long as 50 years), which generate 84.7% of the Port’s operating revenues. Leases relating to revocable permits and space assignments that are short-term in nature provide for cancellation on a 30-day notice by either party. Majority of the Port’s leases provide retention of ownership by the Port or restoration of the property to pre-leased conditions at the expiration of the agreement; accordingly, no leases are considered capital leases.
MAG agreements relate to shipping services and certain concessions provide for the additional payment beyond the fixed portion, based upon tenant usage, revenues, or volumes.
Agreements relating to terminal operations tend to be long-term in nature (as long as 50 years) and are made to provide the Port with a firm tenant commitment. These agreements are subject to periodic review and reset of base amounts. For the years ended June 30, 2017 and 2016, the minimum rental income from such lease agreements was approximately $51.3 million and $46.6 million, respectively. For the years ended June 30, 2017 and 2016, the MAG payments were approximately $269.5 million and $248.6 million, respectively, and were reported under shipping services revenue. Assuming that current agreements are carried to contractual termination, minimum tenant commitments due to the Port over the next five years are as follows (in thousands):
Rental MAG Fiscal Year income income
2018 $ 51,770 $ 275,205 2019 52,288 282,039 2020 52,810 283,130 2021 53,339 283,063 2022 53,872 283,083
Total $ 264,079 $ 1,406,520
The carrying cost and related accumulated depreciation of property held for operating leases as of June 30, 2017 and 2016 are as follows (in thousands):
2017 2016
Wharves and sheds $ 1,181,381 $ 1,178,292 Cranes and bulk facilities 29,879 52,441 Municipal warehouses 13,766 13,578 Port pilot facilities and equipment 9,512 7,386 Buildings and other facilities 1,046,651 1,024,378 Cabrillo Marina 179,942 179,791
Total 2,461,131 2,455,866 Less accumulated depreciation (1,201,865) (1,146,489)
Net $ 1,259,266 $ 1,309,377

PORT OF LOS ANGELES (HARBOR DEPARTMENT OF THE CITY OF LOS ANGELES, CALIFORNIA)
Notes to the Basic Financial Statements
June 30, 2017 and 2016
- 79 - Continued…..
13. Los Angeles City Employees’ Retirement System
A. General Information about the Plan
Plan description. All full-time employees of the Port are eligible to participate in the Los Angeles City Employees’ Retirement System (LACERS), a single-employer defined benefit pension plan (the Plan). LACERS serves as a common investment and administrative agent for various City departments and agencies that participate in LACERS. LACERS is under the exclusive management and control of its Board of Administration whose authority is granted by statutes in Article XVI, Section 17 of the California State Constitution, and Article XI of the Los Angeles City Charter. Changes to the benefit terms require approval of the City Council.
LACERS issues a publicly available financial report that may be obtained by writing or calling: Los Angeles City Employees’ Retirement System, 202 W. First Street, Suite 500, Los Angeles, CA 90012, (800) 779-8328 or LACERS’ website http://lacers.org/aboutlacers/reports/index.html. As of the completion date of the Port’s financial statements, LACERS’ financial statements and the plan’s actuarial valuation study for fiscal year 2017 are not yet available.
Benefits provided. LACERS provides retirement, disability, death benefits, postemployment healthcare benefits, and annual cost-of-living adjustments based on employees’ years of service, age, and final compensation. There are two tiers of memberships. Under Tier 1, employees with 10 or more years of continuous service may retire if they are at age 60 or at least 30 years of service at age 55, or with any years of service at age 70 or older. Full-unreduced retirement benefits are determined as 2.16% per year of the employee’s service credit (not greater than 100%), multiplied by the employee’s average monthly pensionable salary during the employee’s last 12 months of service, or during any other 12 consecutive months of service. Normal retirement allowances are reduced for employees who retire at age 55 with 10 or more years of continues service, or at any age with 30 or more years of service. Membership to Tier 1 is closed to new entrants. Eligible employees hired on or after July 1, 2013 become members of Tier 2. However, on July 9, 2015, the City and the Coalition of the Los Angeles City Unions representing more than half City’s civilian workforce reached an agreement which rescinded Tier 2 and created a new tier of benefits. As a result, Ordinance 184134 was adopted on January 12, 2016, and all active Tier 2 members were transferred to Tier 1 as of February 21, 2016.
On or after February 21, 2016, new members became Tier 3 members of LACERS. Under Tier 3, employees may retire at age 60 with at least 10 or more years of service (including 5 years of continuous service) to receive full-unreduced benefits with a 1.50% retirement factor, or at age 55 with at least 30 years of service (including 5 years of continuous service) to receive full-unreduced retirement benefits with a 2.0% retirement factor. In addition, the employee may retire at age 63 with at least 10 years of service to receive an enhanced retirement benefit with a 2.0% retirement factor, or at age 63 with 30 years of service with a 2.1% retirement factor. Full-unreduced retirement benefits are determined as the applicable retirement factor (1.5%, 2.0%, or 2.1%) per year of the employee’s service credit (not greater than 80%), multiplied by the employee’s last 36 months of final average compensation or any other 36 consecutive months of service. Normal retirement allowances are reduced for employees who retire prior to age 55. LACERS does not have a mandatory retirement age.

PORT OF LOS ANGELES (HARBOR DEPARTMENT OF THE CITY OF LOS ANGELES, CALIFORNIA)
Notes to the Basic Financial Statements
June 30, 2017 and 2016
- 80 - Continued…..
Benefit terms provide for annual cost-of-living adjustments to each employee’s retirement allowance subsequent to the employee’s retirement date. The annual adjustments are the change in the Consumer Price Index, to a maximum increase in retirement allowance of 3% per year, excess banked, for Tier 1 members and 2% per year, excess not banked, for Tier 3 members.
LACERS covers all full-time personnel and department-certified part-time employees of the Port, except for sworn employees of certain Port Police officers.
Contributions. The Board of Administration of LACERS establishes and may amend the contribution requirements of System members and the City in accordance with Article XI Sections 1158 and 1160 of the Los Angeles City Charter provides for periodic employer contributions at actuarially-determined rates that, expressed as percentages of annual covered payroll together with certain fixed amounts, are sufficient to accumulate the required assets to pay benefits when due. For fiscal year 2017, the employer contribution rate as calculated by LACERS’ actuary is 28.16% for Tier 1 members (i.e., all LACERS members hired prior to February 21, 2016) and 24.96% Tier 3 members (i.e., all City employees who became members of LACERS on or after February 21, 2016). For fiscal year 2016, the employer contribution rate as calculated by LACERS’ actuary is 28.75% for Tier 1 members and 22.62% for Tier 2 members.
Based on the Port’s reported covered payroll of $79.9 million for fiscal year 2017, $79.1 million is subject to the 28.16% rate and $0.8 million is subject to the 24.96% rate. The Port’s actual contribution to LACERS, including family death benefit, excess benefit, and limited term plans is $21.8 million (100% of the actuarially determined contribution) and $21.9 million (100% of actuarially determined contribution) for the fiscal years ended June 30, 2017 and 2016, respectively.
All members are required to make contributions to LACERS regardless of the tier in which they are included. Currently, Tiers 1 and 3 members contribute at 11% of compensation.
Pension plan fiduciary net position. Detailed information about the pension plan’s fiduciary net position is available in the separately issued LACERS financial report.
B. Pension Liability, Pension Expense, and Deferred Outflows of Resources and Deferred Inflows of Resources Related to the Pension
At June 30, 2017 and 2016, the Port reported a liability of $221.3 million and $207.2 million, respectively, for its proportionate shares of the net pension liability of LACERS. The net pension liability was measured as of June 30, 2016 and 2015, respectively, and the total pension liability used to calculate the net pension liability was determined by an actuarial valuation as of that date. The Port’s proportion of the net pension liability was based on a projection of the Port’s long-term share of contributions to the pension plan relative to the projected contributions of all participating employers, actuarially determined. The Port’s proportionate share was determined to be 3.940% and 4.152% for fiscal years June 30, 2016 and 2015.

PORT OF LOS ANGELES (HARBOR DEPARTMENT OF THE CITY OF LOS ANGELES, CALIFORNIA)
Notes to the Basic Financial Statements
June 30, 2017 and 2016
- 81 - Continued…..
Fiscal Year 2017
For the year ended June 30, 2017, the Port recognized pension expense of $21.2 million. At June 30, 2017, the Port reported deferred outflows of resources and deferred inflows of resources related to pensions from the following sources (in thousands).
Pension contributions subsequent to measurement date $ 17,582 $ -- Changes of assumptions or other inputs 14,428 -- Differences between expected and actual experience in the
total pension liability -- 15,941 Changes in proportion and differences between employer's
contributions and proportionate share of contributions -- 10,980 Net difference between projected and actual earnings on
pension plan investments 25,325 --
Total $ 57,335 $ 26,921
Deferred Outflows of Resources
Deferred Inflows of
Resources
Amounts reported as deferred outflows of resources and deferred inflows of resources related to pensions will be recognized in pension expense as follows (in thousands):
Year ended June 30
2018 $ 1,805 2019 1,805 2020 8,240 2021 1,994 2022 (1,012) Thereafter --
The amortization table does not include pension contributions made after the measurement date.

PORT OF LOS ANGELES (HARBOR DEPARTMENT OF THE CITY OF LOS ANGELES, CALIFORNIA)
Notes to the Basic Financial Statements
June 30, 2017 and 2016
- 82 - Continued…..
Actuarial assumptions. The total pension liability in the June 30, 2016 actuarial valuation was determined using the following actuarial assumptions, applied to all periods included in the measurement:
Inflation 3.25%
Projected salary increases Ranges from 4.40% to 10.50% based on years of service
Investment rate of return 7.50%, net of pension plan investment expense, including inflation assumption at 3.25%
Cost-of-living adjustments 3.00% maximum for Tier 1 and 2.00% maximum for Tier 3.
Postemployment mortality rates for healthy retirees and beneficiaries were based on the RP-2000 Combined Healthy Mortality Table projected with scale BB to the year 2020, set back one year for males and with no setback for females. Postemployment mortality rates for disabled retirees were based on the RP-2000 Combined Healthy Mortality Table projected with scale BB to the year 2020, set forward seven years for males and set forward eight years for females.
For pre-retirement mortality, withdrawal rates, disability rates, and service retirement rates, the rates vary by age, gender, and/or service.
The actuarial assumptions used were based on the results of an actuarial experience study for the period from July 1, 2011 through June 30, 2014.

PORT OF LOS ANGELES (HARBOR DEPARTMENT OF THE CITY OF LOS ANGELES, CALIFORNIA)
Notes to the Basic Financial Statements
June 30, 2017 and 2016
- 83 - Continued…..
Long-term expected rate of return by asset class. The long-term expected rate of return on pension plan investments was determined using a building-block method in which expected future real rates of return (expected returns, net of pension plan investment expense and inflation) are developed for each major asset class. These returns are combined to produce the long-term expected rate of return by weighing the expected future real rates of return by the target asset allocation percentage and by adding expected inflation and subtracting expected investment expenses and a risk margin. The target allocation and projected arithmetic real rate of return for each major asset class, after deducting inflation, but before deducting investment expenses, used in the derivation of the long-term expected investment rate of return assumption are summarized as follows:
Asset Class
U.S. Larger Cap Equity 20.40% 5.94%U.S. Small Cap Equity 3.60% 6.64%Developed International Equity 21.75% 6.98%Emerging Market Equity 7.25% 8.48%Core Bonds 16.53% 0.71%High Yield Bonds 2.47% 2.89%Private Real Estate 5.00% 4.69%Public Real Assets 5.00% 3.41%Private Equity 12.00% 10.51%Credit Opportunities 5.00% 3.07%Cash 1.00% -0.46%
Total 100.00%
Target Allocation
Long-term Expected Real Rate of Return
Discount rate. The discount rate used to measure the Total Pension Liability was 7.50%. The projection of cash flows used to determine the discount rate assumed that contributions from plan members will be made at the current contribution rate and that contributions from the employers will be made at rates equal to actuarially determined contribution rates. For this purpose, only employee and employer contributions that are intended to fund benefits of current plan members and their beneficiaries are included. Projected employer contributions that are intended to fund the service costs for future plan members and their beneficiaries, as well as projected contributions from future plan members, are not included. Based on those assumptions, the pension plan’s fiduciary net position was projected to be available to make all projected future benefit payments of current plan members. Therefore, the long-term expected rate of return on pension plan investments was applied to all periods of projected benefit payments to determine the Total Pension Liability.

PORT OF LOS ANGELES (HARBOR DEPARTMENT OF THE CITY OF LOS ANGELES, CALIFORNIA)
Notes to the Basic Financial Statements
June 30, 2017 and 2016
- 84 - Continued…..
Sensitivity of the Port’s proportionate share of net pension liability to change in the discount rate. The following presents the Port’s proportionate share of the net pension liability, calculated using the discount rate of 7.50%, as well as what the Port’s proportionate share of the net pension liability would be if it were calculated using a discount rate that is one percentage point lower (6.50%) or one percentage point higher (8.50%) than the current rate (in thousands):
1%
Decrease (6.50%)
Discount
rate (7.50%)
1%
Increase (8.50%)
Port’s proportionate share of the net pension liability
$311,864 $221,275 $145,830
Fiscal Year 2016
For the year ended June 30, 2016, the Port recognized pension expense of $18.4 million. At June 30, 2016, the Port reported deferred outflows of resources and deferred inflows of resources related to pensions from the following sources (in thousands).
Pension contributions subsequent to measurement date $ 17,557 $ -- Changes of assumptions or other inputs 21,006 -- Differences between expected and actual experience in the
total pension liability -- 8,928 Changes in proportion and differences between employer's
contributions and proportionate share of contributions -- 3,522 Net difference between projected and actual earnings on
pension plan investments -- 5,968
Total $ 38,563 $ 18,418
Deferred Outflows of Resources
Deferred Inflows of
Resources

PORT OF LOS ANGELES (HARBOR DEPARTMENT OF THE CITY OF LOS ANGELES, CALIFORNIA)
Notes to the Basic Financial Statements
June 30, 2017 and 2016
- 85 - Continued…..
Amounts reported as deferred outflows of resources and deferred inflows of resources related to pensions will be recognized in pension expense as follows (in thousands):
Year ended June 30
2017 $ (872) 2018 (872) 2019 (872) 2020 5,906 2021 (702) Thereafter --
The amortization table does not include pension contributions made after the measurement date.
Actuarial assumptions. The total pension liability in the June 30, 2015 actuarial valuation was determined using the following actuarial assumptions, applied to all periods included in the measurement:
Inflation 3.25%
Projected salary increases Ranges from 4.40% to 10.50% based on years of service
Investment rate of return 7.50%, net of pension plan investment expense, including inflation
Cost-of-living adjustments Tier 1: 3.00%, Tier 2: 2.00%, actuarial increases are contingent upon Consumer Price Index (CPI) increases with a 3.00% maximum for Tier 1 and 2.00% maximum for Tier 2.
Postemployment mortality rates for healthy retirees and beneficiaries were based on the RP-2000 Combined Healthy Mortality Table projected with scale BB to the year 2020, set back one year for males and with no setback for females. Postemployment mortality rates for disabled retirees were based on the RP-2000 Combined Healthy Mortality Table projected with scale BB to the year 2020, set forward seven years for males and set forward eight years for females.
For pre-retirement mortality, withdrawal rates, disability rates, and service retirement rates, the rates vary by age, gender, and/or service.
The actuarial assumptions used were based on the results of an actuarial experience study for the period from July 1, 2011 through June 30, 2014.

PORT OF LOS ANGELES (HARBOR DEPARTMENT OF THE CITY OF LOS ANGELES, CALIFORNIA)
Notes to the Basic Financial Statements
June 30, 2017 and 2016
- 86 - Continued…..
Long-term expected rate of return by asset class. The long-term expected rate of return on pension plan investments was determined using a building-block method in which expected future real rates of return (expected returns, net of pension plan investment expense and inflation) are developed for each major asset class. These returns are combined to produce the long-term expected rate of return by weighing the expected future real rates of return by the target asset allocation percentage and by adding expected inflation and subtracting expected investment expenses and a risk margin. The target allocation and projected arithmetic real rate of return for each major asset class, after deducting inflation, but before deducting investment expenses, used in the derivation of the long-term expected investment rate of return assumption are summarized as follows:
Asset Class
U.S. Larger Cap Equity 20.40% 5.94%U.S. Small Cap Equity 3.60% 6.64%Developed International Equity 21.75% 6.98%Emerging Market Equity 7.25% 8.48%Core Bonds 16.53% 0.71%High Yield Bonds 2.47% 2.89%Private Real Estate 5.00% 4.69%Private Equity 12.00% 10.51%Public Real Assets 5.00% 3.41%Credit Opportunities 5.00% 3.07%Cash 1.00% -0.46%
Total 100.00%
Target Allocation
Long-term Expected Real Rate of Return
Discount rate. The discount rate used to measure the Total Pension Liability was 7.50%. The projection of cash flows used to determine the discount rate assumed that contributions from plan members will be made at the current contribution rate and that contributions from the employers will be made at contractually required rates, actuarially determined. For this purpose, only employer contributions that are intended to fund benefits for current plan members and their beneficiaries are included. Projected employer contributions that are intended to fund the service costs for future plan members and their beneficiaries, as well as projected contributions from future plan members, are not included. Based on those assumptions, the pension plan’s fiduciary net position was projected to be available to make all projected future benefit payments of current plan members. Therefore, the long-term expected rate of return on pension plan investments was applied to all periods of projected benefit payments to determine the Total Pension Liability.

PORT OF LOS ANGELES (HARBOR DEPARTMENT OF THE CITY OF LOS ANGELES, CALIFORNIA)
Notes to the Basic Financial Statements
June 30, 2017 and 2016
- 87 - Continued…..
Sensitivity of the Port’s proportionate share of net pension liability to change in the discount rate. The following presents the Port’s proportionate share of the net pension liability, calculated using the discount rate of 7.50%, as well as what the Port’s proportionate share of the net pension liability would be if it were calculated using a discount rate that is one percentage point lower (6.50%) or one percentage point higher (8.50%) than the current rate (in thousands):
1%
Decrease (6.50%)
Discount
rate (7.50%)
1%
Increase (8.50%)
Port’s proportionate share of the net pension liability
$300,730 $207,158 $129,286
C. Other Postemployment Benefits (OPEB)
The Port, as a participant in LACERS, also provides a retiree health insurance premium subsidy. Under Division 4, Chapter 11 of the City’s Administrative Code, certain retired employees are eligible for a health insurance premium subsidy. This subsidy is to be funded entirely by the City. Employees with ten or more years of service who retire after age 55, or employees who retire at age 70 with no minimum service requirement, are eligible for a health premium subsidy with a City approved health carrier. LACERS is advance funding the retiree health benefits on an actuarially determined basis.
During fiscal year 2011, the City adopted an ordinance to freeze the maximum medical subsidy at $1,190 for LACERS members who retire on or after July 1, 2011. However, LACERS members who at any time prior to retirement contribute the additional 2% or 4% of pay are exempted from the freeze and obtain a vested right to future increases in the maximum medical subsidy at an amount not less than the dollar increase in the Kaiser two-party non-Medicare Part A and Part B premium. As of June 30, 2016, all non-retired Tier 1 and Tier 3 LACERS members were making the additional contributions, and therefore are not subject to the medical subsidy freeze.
Projections of benefits include the types of benefits in force at the valuation date. Actuarial calculations reflect a long-term perspective and employ methods and assumptions that are designed to reduce short-term volatility in actuarial accrued liabilities and the actuarial value of assets.

PORT OF LOS ANGELES (HARBOR DEPARTMENT OF THE CITY OF LOS ANGELES, CALIFORNIA)
Notes to the Basic Financial Statements
June 30, 2017 and 2016
- 88 - Continued…..
The City’s annual OPEB cost, the percentage of annual OPEB cost contributed to the plan, and the net OPEB asset (obligation) for fiscal years ended June 30, 2016 and the two preceding years for the plan are as follows (in thousands):
Annual Percentage of Net OPEBYear OPEB OPEB Cost Asset
Ended Cost (AOC) Contributed (Obligation)06/30/16 $ 105,983 100% $ -- 06/30/15 100,467 100% -- 06/30/14 97,841 100% --
D. Funded Status of LACERS OPEB
Actuarial valuations involve the estimate of the value of reported amounts and assumptions about the probability of events in the future. Amounts determined regarding the funded status of the plan and the annual required contributions of the City are subject to continual revision as actual results are compared to past expectations and new estimates are made about the future. Following is the funded status information of the plan for fiscal years ended June 30, 2016, 2015, and 2014 (in thousands):
Actuarial UAAL as aActuarial Accrued Underfunded Percentage of
Actuarial Value of Liability AAL Funded Covered CoveredValuation Assets (AAL) (UAAL) Ratio Payroll Payroll
Date (a) (b) (b) – (a) (a)/(b) (c) [(b) – (a)]/(c)06/30/2016 $ 2,248,753 $ 2,793,689 $ 544,936 80.5% $ 1,968,703 27.7%06/30/2015 2,108,925 2,646,989 538,064 79.7% 1,907,665 28.2%06/30/2014 1,941,225 2,662,853 721,628 72.9% 1,816,171 39.7%
The actuarial valuation methods and assumptions used for LACERS OPEB as of June 30, 2016 were as follows: actuarial cost method used – entry age normal; amortization method - level percent of payroll; amortization period - multiple layers, closed not exceeding 30 years. Initial years range from 5 to 30 years; asset valuation method - 7-year fair value of assets less unrecognized return in each of the last 7 years; investment rate of return - 7.50%; projected salary increases – ranges from 10.50% to 4.40%; inflation rate - 3.25%; and healthcare cost trend rates – for medical, range from 2.22% to 8.39% depending on age groups and carrier in fiscal year 2017, 6.38% in fiscal year 2018 decreasing by 0.25% for each year until it reaches an ultimate rate of 5.00%, and dental premium trend rate – 5.00% for all years.
Note 13. A to D on LACERS retirement and OPEB plans were derived from information prepared by LACERS and the City.

PORT OF LOS ANGELES (HARBOR DEPARTMENT OF THE CITY OF LOS ANGELES, CALIFORNIA)
Notes to the Basic Financial Statements
June 30, 2017 and 2016
- 89 - Continued…..
14. City of Los Angeles Fire and Police Pension System
A. General Information about the Plan
Plan description. The Los Angeles Fire and Police Pension System (LAFPP) operates under the City of Los Angeles Charter and Administrative Code provisions as a single-employer defined benefit pension plan covering all full-time active sworn firefighters, police officers, and certain Harbor Port Police officers of the City of Los Angeles. LAFPP is composed of six tiers.
Tier 6 is the current tier for all Harbor Port Police Officers hired on or after July 1, 2011. Tier 5 was the tier for all Harbor Port Police officers hired on or after January 8, 2006 through June 30, 2012. The Los Angeles City Council approved Ordinance No. 177214 that allows Harbor Port Police Officers the option to transfer from LACERS to Tier 5 of LAFPP. The election period was from January 8, 2006 to January 5, 2007 and the decision to transfer is irrevocable.
Only “sworn” service with the Port is transferable to LAFPP. Other “non-sworn” services with other City Departments are not eligible for transfer. All new employees hired by the Port after the effective date of the Ordinance automatically go into either Tier 5 or Tier 6 of LAFPP.
Under provisions of the City Charter, the City Administrative Code and the State Constitution, the Board has the responsibility to administer the plan. Changes to the benefit terms require approval by the City Council.
LAFPP issues a publicly available financial report that may be obtained by writing or calling: Los Angeles Fire and Police Pension system, 360 E. Second Street, Suite 400, Los Angeles, CA 90012, (213) 978-4545 or LAFPP’s website https://www.lafpp.com/about/financial-reports. As of the completion date of the Port’s financial statements, the LAFPP’s financial statements and the plan’s actuarial valuation study for fiscal year 2017 are not yet available.
Benefits provided. Information about benefits for Tiers 1 through 4 members is available in the separately issued LAFPP financial report. Tier 5 members must be at least age 50, with 20 or more years of service, to be entitled to a service pension. Annual pension benefits are equal to 50% of their one-year average compensation, increasing for each year of service over 20 years, to a maximum of 90% for 33 years. Tier 5 provides for postemployment COLAs based on the Consumer Price Index (CPI) to a maximum of 3% per year. However, any increase in CPI greater than 3% per year is placed into a COLA bank for use in years in which the increase in CPI is less than 3%. The City Council may also grant a discretionary ad-hoc COLA no more than every three years, subject to certain conditions. Members who terminate their employment are entitled to a refund of their contributions plus Board-approved interest if they do not qualify for a pension or if they waive their pension entitlements.
Tier 6 members must be at least age 50, with 20 or more years of service, to be entitled to a service pension. Annual pension benefits are equal to 40% of their two-year average compensation, increasing for each year of service over 20 years, to a maximum of 90% for 33 years. Tier 6 provides for postemployment COLAs based on the CPI to a maximum of 3% per year. However, any increase in the CPI greater 3% per year is placed into a COLA bank for use in years in which the increase in CPI is less than 3%. The City Council may also grant a

PORT OF LOS ANGELES (HARBOR DEPARTMENT OF THE CITY OF LOS ANGELES, CALIFORNIA)
Notes to the Basic Financial Statements
June 30, 2017 and 2016
- 90 - Continued…..
discretionary ad-hoc COLA no more than every three years, subject to certain conditions. Members who terminate their employment are entitled to a refund of their contributions plus Board-approved interest if they do not qualify for a pension or if they waive their pension entitlements.
Contributions. The Board of Administration/Commissioners of LAFPP establishes and may amend the contribution requirements of members and the City. The City’s annual contribution for the LAFPP plan is actuarially determined and represents a level of funding that, if paid on an ongoing basis, is projected to cover normal cost each year and to amortize unfunded actuarial liabilities over a period not to exceed thirty years. The City Administrative Code and related ordinance define member contributions.
All members are required to make contributions to LAFPP regardless of tier in which they are included. However, members are exempt from making contributions when their continuous service exceeds 30 years for Tier 1 through 4, and 33 years for Tier 5 and Tier 6. The average member contribution rates for fiscal year 2015-16 (based on the June 30, 2014 valuation) was 9.60% of compensation paid biweekly.
In fiscal year 2017, the Port’s contribution rate for sworn employees that are members of the Harbor Tier 5 plan, as determined by the actuary is 33.92% of covered payroll. The Harbor Tier 6 rate is 29.51%. Based on the Port’s reported sworn covered payroll of $12.5 million for Tier 5, and $1.0 million for Tier 6, the Port’s pro rata share of the combined actuarially determined contribution for pension and postemployment healthcare benefits, and actual contribution made to LAFPP was $4.5 million (100% of actuarially determined contribution) and $4.2 million (100% of actuarially determined contribution) for the years ended June 30, 2017 and 2016, respectively.
Pension plan fiduciary net position. Detailed information about the pension plan’s fiduciary net position is available in the separately issued LAFPP financial report.
B. Pension Liability, Pension Expense, and Deferred Outflows of Resources and Deferred Inflows of Resources Related to the Pension
At June 30, 2017 and 2016, the Port reported a liability of $10.1 million and $8.7 million, respectively, for its proportionate shares of the net pension liability of LAFPP. The net pension liability was measured as of June 30, 2016 and 2015, respectively, and the total pension liability used to calculate the net pension liability was determined by an actuarial valuation as of that date. The Port’s proportion of the net pension liability was based on a projection of the Port’s long-term share of contributions to the pension plan relative to the projected contributions of all participating employers, actuarially determined. The Port’s proportionate share was determined to be 0.408% and 0.425% for fiscal years June 30, 2017 and 2016.

PORT OF LOS ANGELES (HARBOR DEPARTMENT OF THE CITY OF LOS ANGELES, CALIFORNIA)
Notes to the Basic Financial Statements
June 30, 2017 and 2016
- 91 - Continued…..
Fiscal Year 2017
For the year ended June 30, 2017, the Port recognized pension expense of $2.7 million. At June 30, 2017, the Port reported deferred outflows of resources and deferred inflows of resources related to pensions from the following sources (in thousands).
Pension contributions subsequent to measurement date $ 3,716 $ -- Changes of assumptions or other inputs -- 228 Differences between expected and actual experience in the
total pension liability -- 2,891 Net difference between projected and actual earnings on
pension plan investments 1,825 --
Total $ 5,541 $ 3,119
Deferred Outflows of Resources
Deferred Inflows of
Resources
Amounts reported as deferred outflows of resources and deferred inflows of resources related to pensions will be recognized in pension expense as follows (in thousands):
Year ended June 30
2018 $ (614) 2019 (614) 2020 105 2021 28 2022 (199) Thereafter --
The amortization table does not include pension contributions made after the measurement date.

PORT OF LOS ANGELES (HARBOR DEPARTMENT OF THE CITY OF LOS ANGELES, CALIFORNIA)
Notes to the Basic Financial Statements
June 30, 2017 and 2016
- 92 - Continued…..
Actuarial assumptions. The total pension liability in the June 30, 2016 actuarial valuation was determined using the following actuarial assumptions, applied to all periods included in the measurement:
Inflation 3.25%
Projected salary increases Ranges from 4.75% to 11.50% based on years of service
Investment rate of return 7.50%, net of pension plan investment expense, including inflation
Cost-of-living adjustments 3.25% of Tiers 1 and 2 retirement income and 3.00% of Tiers 3, 4, 5 and 6 retirement income
Postemployment mortality rates were based on the RP-2000 Combined Healthy Mortality Table for Males or Females, as appropriate, projected to 2022 with scale BB with different age adjustment (i.e., set back or set forward) for healthy and disabled members, including beneficiaries. For pre-retirement mortality, withdrawal rates, disability rates, and service retirement rates, the rates vary by age, service, gender, membership classification and tier.
The actuarial assumptions used were based on the results of an actuarial experience study for the period from July 1, 2010 through June 30, 2013.

PORT OF LOS ANGELES (HARBOR DEPARTMENT OF THE CITY OF LOS ANGELES, CALIFORNIA)
Notes to the Basic Financial Statements
June 30, 2017 and 2016
- 93 - Continued…..
Long-term expected rate of return by asset class. The long-term expected rate of return on pension plan investments was determined using a building-block method in which expected future real rates of return (expected returns, net of pension plan investment expense and inflation) are developed for each major asset class. These returns are combined to produce the long-term expected rate of return by weighing the expected future real rates of return by the target asset allocation percentage and by adding expected inflation. The target allocation and projected arithmetic real rate of return for each major asset class, after deducting inflation, but before deducting investment expenses, used in the derivation of the long-term expected investment rate of return assumption are summarized as follows:
Asset Class
Large Cap U.S. Equity 23.00% 6.03%Small Cap U.S. Equity 6.00% 6.71%Developed International Equity 16.00% 6.71%Emerging Market Equity 5.00% 8.02%U.S. Core Fixed Income 14.00% 0.52%High Yield Bonds 3.00% 2.81%Real Estate 10.00% 4.73%TIPS 5.00% 0.43%Commodities 5.00% 4.67%Cash 1.00% -0.19%Unconstrained Fixed Income 2.00% 2.50%Private Equity 10.00% 9.25%
Total 100.00% 5.12%
Target Allocation
Long-term Expected Real Rate of Return
Discount rate. The discount rate used to measure the Total Pension Liability was 7.50%. The projection of cash flows used to determine the discount rate assumed that contributions from plan members will be made at the current contribution rate for each tier and that contributions from the employers will be made at rates equal to the actuarially determined contribution rates for each tier. For this purpose, only employer contributions that are intended to fund benefits for current plan members and their beneficiaries are included. Projected employer contributions that are intended to fund the service costs for future plan members and their beneficiaries, as well as projected contributions from future plan members, are not included. Based on those assumptions, the pension plan’s fiduciary net position was projected to be available to make all projected future benefit payments of current plan members. Therefore, the long-term expected rate of return on pension plan investments was applied to all periods of projected benefit payments to determine the Total Pension Liability.

PORT OF LOS ANGELES (HARBOR DEPARTMENT OF THE CITY OF LOS ANGELES, CALIFORNIA)
Notes to the Basic Financial Statements
June 30, 2017 and 2016
- 94 - Continued…..
Sensitivity of the Port’s proportionate share of net pension liability to change in the discount rate. The following presents the Port’s proportionate share of the net pension liability, calculated using the discount rate of 7.50%, as well as what the Port’s proportionate share of the net pension liability would be if it were calculated using a discount rate what is one percentage point lower (6.50%) or one percentage point higher (8.50%) than the current rate (in thousands):
1%
Decrease (6.50%)
Discount
rate (7.50%)
1%
Increase (8.50%)
Port’s proportionate share of the net pension liability
$20,648 $10,050 $1,550
Fiscal Year 2016
For the year ended June 30, 2016, the Port recognized pension expense of $2.7 million. At June 30, 2016, the Port reported deferred outflows of resources and deferred inflows of resources related to pensions from the following sources (in thousands).
Pension contributions subsequent to measurement date $ 3,462 $ -- Changes of assumptions or other inputs -- 312 Differences between expected and actual experience in the
total pension liability -- 2,020 Net difference between projected and actual earnings on
pension plan investments -- 1,131
Total $ 3,462 $ 3,463
Deferred Outflows of Resources
Deferred Inflows of
Resources

PORT OF LOS ANGELES (HARBOR DEPARTMENT OF THE CITY OF LOS ANGELES, CALIFORNIA)
Notes to the Basic Financial Statements
June 30, 2017 and 2016
- 95 - Continued…..
Amounts reported as deferred outflows of resources and deferred inflows of resources related to pensions will be recognized in pension expense as follows (in thousands):
Year ended June 30
2017 $ (965) 2018 (965) 2019 (965) 2020 (246) 2021 (322) Thereafter --
The amortization table does not include pension contributions made after the measurement date.
Actuarial assumptions. The total pension liability in the June 30, 2015 actuarial valuation was determined using the following actuarial assumptions, applied to all periods included in the measurement:
Inflation 3.25%
Projected salary increases Ranges from 4.75% to 11.50% based on years of service
Investment rate of return 7.50%, net of pension plan investment expense, including inflation
Cost-of-living adjustments 3.25% of Tiers 1 and 2 retirement income and 3.00% of Tiers 3, 4, 5 and 6 retirement income
Postemployment mortality rates were based on the RP-2000 Combined Healthy Mortality Table for Males or Females, as appropriate, projected to 2022 with scale BB with different age adjustment (i.e., set back or set forward) for healthy and disabled members, including beneficiaries. For pre-retirement mortality, withdrawal rates, disability rates, and service retirement rates, the rates vary by age, service, gender, membership classification and tier.
The actuarial assumptions used were based on the results of an actuarial experience study for the period from July 1, 2010 through June 30, 2013.

PORT OF LOS ANGELES (HARBOR DEPARTMENT OF THE CITY OF LOS ANGELES, CALIFORNIA)
Notes to the Basic Financial Statements
June 30, 2017 and 2016
- 96 - Continued…..
Long-term expected rate of return by asset class. The long-term expected rate of return on pension plan investments was determined using a building-block method in which expected future real rates of return (expected returns, net of pension plan investment expense and inflation) are developed for each major asset class. These returns are combined to produce the long-term expected rate of return by weighing the expected future real rates of return by the target asset allocation percentage and by adding expected inflation. The target allocation and projected arithmetic real rate of return for each major asset class, after deducting inflation, but before deducting investment expenses, used in the derivation of the long-term expected investment rate of return assumption are summarized as follows:
Asset Class
Large Cap U.S. Equity 23.00% 6.03%Small Cap U.S. Equity 6.00% 6.71%Developed International Equity 16.00% 6.71%Emerging Market Equity 5.00% 8.02%U.S. Core Fixed Income 14.00% 0.52%High Yield Bonds 3.00% 2.81%Real Estate 10.00% 4.73%TIPS 5.00% 0.43%Commodities 5.00% 4.67%Cash 1.00% -0.19%Unconstrained Fixed Income 2.00% 2.50%Private Equity 10.00% 9.25%
Total 100.00% 5.12%
Target Allocation
Long-term Expected Real Rate of Return
Discount rate. The discount rate used to measure the Total Pension Liability was 7.50%. The projection of cash flows used to determine the discount rate assumed that contributions from plan members will be made at the current contribution rate for each tier and that contributions from the employers will be made at rates equal to the actuarially determined contribution rates for each tier. For this purpose, only employer contributions that are intended to fund benefits for current plan members and their beneficiaries are included. Projected employer contributions that are intended to fund the service costs for future plan members and their beneficiaries, as well as projected contributions from future plan members, are not included. Based on those assumptions, the pension plan’s fiduciary net position was projected to be available to make all projected future benefit payments of current plan members. Therefore, the long-term expected rate of return on pension plan investments was applied to all periods of projected benefit payments to determine the Total Pension Liability.

PORT OF LOS ANGELES (HARBOR DEPARTMENT OF THE CITY OF LOS ANGELES, CALIFORNIA)
Notes to the Basic Financial Statements
June 30, 2017 and 2016
- 97 - Continued…..
Sensitivity of the Port’s proportionate share of net pension liability to change in the discount rate. The following presents the Port’s proportionate share of the net pension liability, calculated using the discount rate of 7.50%, as well as what the Port’s proportionate share of the net pension liability would be if it were calculated using a discount rate what is one percentage point lower (6.50%) or one percentage point higher (8.50%) than the current rate (in thousands):
1%
Decrease (6.50%)
Discount
rate (7.50%)
1%
Increase (8.50%)
Port’s proportionate share of the net pension liability
$18,490 $8,671 $810
C. Other Postemployment Benefits (OPEB)
The City Charter, the Administrative Code, and related ordinance define the postemployment healthcare benefits. There are no member contributions for healthcare benefits. The Port, as a participant in LAFPP, also provides a retiree health insurance premium subsidy.
The City’s annual OPEB cost, the percentage of annual OPEB cost contributed to the LAFPP plan, and the net OPEB asset (obligation) for fiscal years ended June 30, 2016, 2015, and 2014 are as follows (in thousands):
Annual Percentage of Net OPEBYear OPEB OPEB Cost Asset
Ended Cost (AOC) Contributed (Obligation)
06/30/16 $ 161,911 99.50% $ (132,506)06/30/15 160,865 99.14% (131,698)06/30/14 149,877 98.97% (130,319)

PORT OF LOS ANGELES (HARBOR DEPARTMENT OF THE CITY OF LOS ANGELES, CALIFORNIA)
Notes to the Basic Financial Statements
June 30, 2017 and 2016
- 98 - Continued…..
D. Funded Status of LAFPP OPEB
Actuarial valuations involve estimates of the value of reported amounts and assumptions about the probability of events in the future. Amounts determined regarding the funded status of the plan and the ARC of the City are subject to continual revision as actual results are compared to expectations and new estimates are made about the future. Following is the funded status information for the LAFPP OPEB plan for fiscal years ended June 30, 2016, 2015, and 2014 (in thousands).
Actuarial UAAL as aActuarial Accrued Underfunded Percentage of
Actuarial Value of Liability AAL Funded Covered CoveredValuation Assets (AAL) (UAAL) Ratio Payroll Payroll
Date (a) (b) (b) – (a) (a)/(b) (c) [(b) – (a)]/(c)
06/30/2016 $ 1,480,810 $ 3,079,670 $ 1,598,860 48.08% $ 1,400,808 114.14%06/30/2015 1,344,333 2,962,703 1,618,370 45.38% 1,405,171 115.17%06/30/2014 1,200,874 2,783,283 1,582,409 43.15% 1,402,715 112.81%
The actuarial valuation methods and assumptions used for LAFPP OPEB as of June 30, 2016 were as follows: actuarial cost method used - entry age normal; amortization method – closed amortization periods; remaining amortization period – multiple layers, range from 5 to 30 years; asset valuation method – market value of assets less unrecognized returns in each of the last seven years; investment rate of return - 7.50%; projected salary increases - 4.00%; inflation rate - 3.25%; medical healthcare cost trend rate of 7.00% in 2016-2017 and 2017-2018, decreasing by 0.25% for each year for eight years until it reaches an ultimate rate of 5.00%; and dental healthcare cost trend of 5.00% for all years.
Note 14. A to D on LAFPP retirement and OPEB plans were derived from information prepared by LAFPP and the City.

PORT OF LOS ANGELES (HARBOR DEPARTMENT OF THE CITY OF LOS ANGELES, CALIFORNIA)
Notes to the Basic Financial Statements
June 30, 2017 and 2016
- 99 - Continued…..
15. Commitments, Litigation and Contingencies
A. Commitments
Open purchase orders and uncompleted construction contracts amounted to approximately $26.0 million as of June 30, 2017. Such open commitments do not lapse at the end of the Port’s fiscal year and are carried forth to succeeding periods until fulfilled.
In 1985, the Port received a parcel of land, with an estimated value of $14.0 million from the federal government, for the purpose of constructing a marina. The Port has agreed to reimburse the federal government up to $14.0 million from excess revenues, if any, generated from marina operations after the Port has recovered all costs of construction. No such payments were made in fiscal years 2017 and 2016.
B. Litigation
The Port is also involved in certain litigation arising in the normal course of business. In the opinion of management, there is no pending litigation or unasserted claims, the outcome of which would materially affect the financial position of the Port.
C. Alameda Corridor Transportation Authority (ACTA) Agreement
In August 1989, the Port and the POLB (the Ports) entered into a joint exercise of powers agreement and formed ACTA for the purpose of establishing a comprehensive transportation corridor and related facilities consisting of street and railroad rights-of-way and an improved highway and railroad network along Alameda Street between the Santa Monica Freeway and the Ports in San Pedro Bay, linking the Ports to the central Los Angeles area. The Alameda Corridor began operating on April 15, 2002. ACTA is governed by a seven-member board, which is comprised of two members from each Port, one each from the Cities of Los Angeles and Long Beach and one from the Metropolitan Transportation Authority. If in the future, ACTA is able to distribute income or make equity distributions, the Ports shall share such income and equity distributions equally.
In October 1998, the Ports, ACTA, and the railroad companies, which operate on the corridor, entered into a Corridor Use and Operating Agreement (Corridor Agreement). The Corridor Agreement provides for operation of the corridor to transport cargo into and out of the Ports. Payment of use fees and container charges, as defined in the Corridor Agreement are used to pay (a) the debt service that ACTA incurs on approximately $2.2 billion of outstanding bonds, (b) for the cost of funding required reserves and costs associated with the financing, including credit enhancement and rebate requirements, and (c) repayment and reimbursement obligations to the Ports, (collectively, ACTA Obligations). Use fees end in 2062 or sooner if the ACTA Obligations are paid off earlier.
If ACTA revenues are insufficient to pay ACTA Obligations outlined in (a) and (b) above, the Corridor Agreement obligates each Port to pay up to twenty percent (20%) of the shortfall (Shortfall) for each debt service payment date. If this event occurs, the Ports’ payments to ACTA are intended to provide cash for debt service payments and to assure that the Alameda

PORT OF LOS ANGELES (HARBOR DEPARTMENT OF THE CITY OF LOS ANGELES, CALIFORNIA)
Notes to the Basic Financial Statements
June 30, 2017 and 2016
- 100 - Continued…..
Corridor is available to maintain continued cargo movement through the Ports. The Ports are required to include expected Shortfall payments in their budgets, but Shortfall payments are subordinate to other obligations of the Port, including the bonds and commercial paper currently outstanding. The Port does not and is not required to take Shortfall payments into account when determining whether it may incur additional indebtedness or when calculating compliance with rate covenants under the respective bond indentures and resolutions related to each Port bond or indebtedness.
An amended and restated Corridor Agreement became effective December 15, 2016, which (1) incorporated the July 5, 2006 First Amendment to the Corridor Agreement; (2) replaced the Operating Committee with an alternative decision making process for management of Alameda Corridor maintenance and operations; and (3) removed construction related provisions and updated certain other provisions to reflect current conditions and practices. The Los Angeles Board of Harbor Commissioners approved the amended and restated Corridor Agreement at a meeting held on October 24, 2016.
In 2016, ACTA issued Tax-Exempt First and Second Subordinate Lien Revenue Refunding Bonds, Series 2016A and Series 2016B (Series 2016 Bonds). The issuance of the Series 2016 Bonds advance refunded most of ACTA’s Refunding Series 2004A Bonds and reduced potential future Shortfall payments. There were no Shortfall payments in both fiscal years 2017 and 2016.
D. TraPac Project and Environmental Impact Report
On December 6, 2007, the Board of Harbor Commissioners (BHC) certified the Final Environmental Impact Report for TraPac, Inc. (TraPac), a terminal operator, and approved the TraPac project. The TraPac project involves the development and improvements to Berths 136-147, currently occupied by TraPac. Subsequent to the project approval, certain entities (Appellants) appealed to the City Council the certification/project approval under the provisions of the California Environmental Quality Act (CEQA).
On April 3, 2008, the BHC approved a Memorandum of Understanding (MOU) between the City and the Appellants to resolve the appeal of the TraPac Environmental Impact Report (EIR). The MOU provides for the revocation of the appeals and the establishment of a Port Community Mitigation Trust Fund (PCMTF) to be operated by a nonprofit entity to pay for off-Port environmental impacts from Port-related operations. The nonprofit created to provide administrative services for this fund is the Harbor Community Benefit Foundation (HCBF).
The Port had provided the first two years PCMTF funding of $12.0 million and $4.0 million in a special Community Mitigation Trust Fund (CMTF) account maintained by the Port to meet its obligations in the MOU. The MOU required additional contributions of $2.00 per TEU to be made in the event that future cargo exceeded calendar year 2007 levels in future years. Based on the reduced volume of cargo processed in the applicable term due to the recession, no additional PCMTF funding has been necessary for incremental volume.
PORT OF LOS ANGELES (HARBOR DEPARTMENT OF THE CITY OF LOS ANGELES, CALIFORNIA)
Notes to the Basic Financial Statements
June 30, 2017 and 2016
- 101 - Continued…..
On October 26, 2010, the BHC approved the Operating Agreement of the TraPac MOU (Operating Agreement) which provided for more detailed procedures for the implementation of the MOU. The Operating Agreement also provided for the management of the PCMTF by an independent financial manager. In accordance with the Operating Agreement, in 2011 the Port transferred the unspent balance of PCMTF funding from its CMTF to the PCMTF, an escrow account maintained by an independent financial manager, which is currently J.P. Morgan.
While the five-year MOU expired in April 2013, the Operating Agreement provided that the Port shall continue to fund the PCMTF with contributions on account of a list of specific expansion projects that have environmental impact reports certified within five years after the first HCBF Board of Directors meeting (said certification deadline established as May 19, 2016). The Operating Agreement provides that if the listed MOU expansion projects have EIRs certified by the May 2016 deadline and proceeds with construction; the Port will make a one-time additional contribution at a rate of $3.50 per TEU (or $1.50 per cruise passenger, and $0.15 per ton of bulk cargo) per project for growth associated with such expansion projects. Funds will be transferred to the PCMTF within 21 days following award of a construction contract or commencement of construction of each project that had an EIR certified prior to May 19, 2016. In fiscal year 2016, $0.8 million was contributed to the PCMTF based upon the Yusen container terminal project contract award. There were no contributions made during fiscal year 2017.
As of June 30, 2017, a total of $17.5 million has been disbursed from the Port’s CMTF. The remaining fund balance including interest earned as of June 30, 2017 is $0.1 million.

PORT OF LOS ANGELES (HARBOR DEPARTMENT OF THE CITY OF LOS ANGELES, CALIFORNIA)
Notes to the Basic Financial Statements
June 30, 2017 and 2016
- 102 - Continued…..
16. Related-Party Transactions
During the normal course of business, the Port is charged for services provided and use of land owned by the City, the most significant of which is related to fire protection, museum/park maintenance, and legal services. Total amounts charged by the City for services approximate $39.6 million and $37.4 million in fiscal years 2017 and 2016, respectively. In addition, the amounts charged by the City for water and electricity usage approximate $14.8 million and $14.0 million in fiscal years 2017 and 2016, respectively.
17. Capital Contributions
Amounts either received or to be reimbursed for the restricted purpose of the acquisition, construction of capital assets, or other grant-related capital expenditures are recorded as capital contributions. During the years ended June 30, 2017 and 2016, the Port reported capital contributions of $18.8 million and $40.5 million, respectively, for certain capital construction and grant projects.
18. Natural Resources Defense Council Settlement Judgment
In March 2003, the Port settled a lawsuit entitled: Natural Resources Defense Council, Inc., et al. v. City of Los Angeles, et al., regarding the environmental review of a Port project at the China Shipping Terminal. The settlement called for a total of $50.0 million in mitigation measures to be undertaken by the Port. This $50.0 million charge was recorded as an expense in fiscal year 2003.
The terms of the settlement agreement require that the Port fund various mitigation activities in the amount of $10.0 million per year over a five-year term ending in fiscal year 2007. As of June 30, 2009, a total of $50.0 million were transferred from Harbor Revenue Fund to the restricted mitigation funds.
In June 2004, the Port agreed to amend the original settlement to include, and transferred to the restricted mitigation fund, an additional $3.5 million for the creation of parks and open space in San Pedro.
Pursuant to the settlement agreement, the Port is also obligated to expend up to $5.0 million to retrofit customer vessels to receive shore-side power as an alternative to using on-board diesel fueled generators. Through the end of fiscal year 2009, the Port has spent $5.0 million for this program.
The settlement agreement also established a throughput restriction at China Shipping Terminal per calendar year. Actual throughput at the terminal exceeded the cap for calendar years 2008, 2007, 2006, and 2005, and payments of $1.8 million, $6.9 million, $5.8 million, and $3.9 million, respectively, were made for having exceeded the caps. The Port charged to nonoperating expense and deposited in the restricted mitigation fund the said amounts in June 2009, June 2008, May 2007, and April 2006, respectively. Total deposits for the four years were $18.4 million, with the June 2009 deposit for calendar year 2008 being the last payment for excess throughput required under the settlement agreement.

PORT OF LOS ANGELES (HARBOR DEPARTMENT OF THE CITY OF LOS ANGELES, CALIFORNIA)
Notes to the Basic Financial Statements
June 30, 2017 and 2016
- 103 - Continued…..
In April 2011, the Port contributed $3.2 million to the restricted mitigation funds as payment for four low profile cranes installed on Berth 102 designed to reduce visual impact by the use of a horizontal boom that does not need to be raised up when the crane is not in use.
In November 2015, two separate Memoranda of Agreements were approved and authorized to transfer $5.2 million to the Harbor Community Benefit Foundation (HCBF) to administer air quality improvement projects and $4 million to the South Coast Air Quality Management District to assist in funding the demonstration of a catenary zero emission truck project.
As of June 30, 2017, the Port has contributed a total of $75.0 million to the restricted mitigation funds in accordance with the provisions of the settlement.
19. Cash Funding of Reserve Fund
As of June 30, 2017 and 2016, the Port had $969.3 million and $1.0 billion of outstanding parity bonds (including net unamortized premiums). The Port holds cash reserves for each Indenture of the outstanding bonds as the BHC, on September 18, 2008, approved the full cash funding of the entire reserve requirement of $61.5 million and transferred it to the Port’s bond trustee in December 2008. The cash funding of the reserve took place to reassure bond holders of the strong commitment of the Port to its financial wherewithal as rating agencies had reduced the AAA ratings of the surety companies that had provided insurance for the bonds that the Port had issued. As of June 30, 2017, the balance in the Common Reserve fund totaled $62.3 million. Any excess amounts in the Common Reserve resulting from principal repayments will be transferred to the interest fund and/or redemption fund to be used to pay interest and redeem bonds. The required amount for the reserve fund will be reevaluated on a yearly basis. The funds in the reserve are invested in the U.S. Treasury securities and money market funds.
20. Extraordinary Item
On September 22, 2014, a fire caused extensive damage to Berth 177-178 and to a portion of Berth 179. The Port filed claims under its all-risk property insurance policy. Total insurance recovery of $14.3 million was received by the Port. During the fiscal years 2017 and 2016, the Port received insurance recovery in the amounts of $9.2 million and $5.1 million, respectively.

REQUIRED SUPPLEMENTARY INFORMATION

PORT OF LOS ANGELES (HARBOR DEPARTMENT OF THE CITY OF LOS ANGELES, CALIFORNIA)
Required Supplementary Information
Schedule of Proportionate Share of the Net Pension Liability
and Related Ratios – Last Ten Fiscal Years*
(In Thousands)
(Unaudited)
- 104 -
Fiscal Year
Proportion of the
Net Pension
Liability
Proportionate
Share of Net
Pension Liability
Covered Payroll (1)
Proportionate
Share of Net
Pension Liability
as a Percentage
of Covered
Payroll
Plan Fiduciary
Net Position as
a Percentage of
Total Pension
Liability
2015 4.224% 188,299$ 76,040$ 247.60% 72.57%2016 4.152% 207,158$ 75,963$ 272.71% 70.49%2017 3.940% 221,275$ 75,092$ 294.67% 67.77%
(1) Covered payroll represents the collective total of the LACERS pensionable wages of all LACERS membership tiers.
Los Angeles City Employees' Retirement System (LACERS)
Fiscal Year
Proportion of the
Net Pension
Liability
Proportionate
Share of Net
Pension Liability
Covered Payroll (2)
Proportionate
Share of Net
Pension Liability
as a Percentage
of Covered
Payroll
Plan Fiduciary
Net Position as
a Percentage of
Total Pension
Liability
2015 0.559% 10,463$ 11,619$ 90.05% 79.16%2016 0.425% 8,671$ 12,301$ 70.49% 83.98%2017 0.408% 10,050$ 12,148$ 82.49% 83.02%
(2) Covered payroll represents the collective total of the LAFPP eligible wages of all LAFPP
membership tiers.
Los Angeles Fire and Police Pension Plan (LAFPP)
* Fiscal year 2015 was the first year of implementation, therefore only three years are shown.

PORT OF LOS ANGELES (HARBOR DEPARTMENT OF THE CITY OF LOS ANGELES, CALIFORNIA)
Required Supplementary Information
Schedule of Contributions – Last Ten Fiscal Years*
(In Thousands)
(Unaudited)
- 105 -
(Amount in thousands) 2017 2016 2015
Actuarially determined contribution 17,582$ 17,557$ 15,765$
Contributions in relation to theactuarially determined contribution 17,582 17,557 15,765
Contribution deficiency (excess) --$ --$ --$
Port's covered payroll 79,924$ 78,061$ 77,126$
Contributions as a percentage ofcovered payroll 22.00% 22.49% 20.44%
Los Angeles City Employees' Retirement System (LACERS)
(Amount in thousands) 2017 2016 2015
Actuarially determined contribution 3,716$ 3,462$ 3,648$
Contributions in relation to theactuarially determined contribution 3,716 3,462 3,648
Contribution deficiency (excess) --$ --$ --$
Port's covered payroll 12,514$ 12,184$ 12,301$
Contributions as a percentage ofcovered payroll 29.69% 28.41% 29.66%
Los Angeles Fire and Police Pension Plan (LAFPP)
* Fiscal year 2015 was the first year of implementation, therefore only three years are shown.
See Note to Schedule on the following page.

PORT OF LOS ANGELES (HARBOR DEPARTMENT OF THE CITY OF LOS ANGELES, CALIFORNIA)
Required Supplementary Information
Schedule of Contributions – Last Ten Fiscal Years*
(In Thousands)
(Unaudited)
- 106 -
Notes to Schedule: LACERS LAFPP
Valuation date As of June 30, two years prior to the end of the fiscal year in which contributions are reported
As of June 30, two years prior to the end of the fiscal year in which contributions are reported
Actuarial cost method Entry age, level percentage of salary
Entry age, level percentage of salary
Amortization cost method Level percentage of payroll
Level percentage of payroll
Amortization period 15 years for actuarial gains/losses, 20 years for assumption changes, and 15 years for plan changes, 30 years for actuarial surplus
20 years for actuarial gains/losses, 25 years for assumption changes, and 15 years for plan changes
Asset valuation method Market value less unrecognized returns
Market value less unrecognized returns
Investment rate of return 7.50%
7.50%
Inflation 3.25%
3.25%
Project salary increases Ranges from 10.50% to 4.40%, based on years of service
Ranges from 4.75% to 11.50% based on years of service
Mortality RP-2000 Combined Healthy Mortality Table
RP-2000 Combined Healthy Mortality Table

STATISTICAL SECTION

Summary of Revenues, Expenses, and Changes in Net PositionLast Ten Fiscal Years
2008 2009 2010 2011 2012 2013 2014 2015 2016 2017Operating revenues
Shipping services $ 374,878 $ 329,347 $ 327,630 $ 343,498 $ 357,716 $ 347,876 $ 377,213 $ 364,899 $ 368,470 $ 398,255 Rentals 45,524 42,368 43,141 45,428 43,143 42,890 40,156 46,233 46,571 51,258 Royalties, fees, and other operating revenues 5,943 30,509 36,047 11,577 8,928 6,602 8,582 35,763 21,085 25,019
Total operating revenues 426,345 402,224 406,818 400,503 409,787 397,368 425,951 446,895 436,126 474,532 Operating expenses
Salaries and benefits 92,979 95,429 92,930 98,837 98,614 101,861 112,053 111,788 114,719 118,582 Marketing and public relations 5,137 3,531 2,490 2,912 3,177 2,877 2,711 2,771 2,567 2,583 Travel and entertainment 1,099 609 546 804 932 1,139 548 512 611 536 Outside services 36,957 34,977 25,776 29,367 27,660 29,690 26,331 28,983 28,970 25,022 Materials and supplies 8,719 7,800 6,366 6,249 6,314 5,989 6,883 6,257 6,340 5,314 City services 32,129 30,680 37,147 29,964 32,014 31,074 33,633 34,749 37,421 39,554 Other operating expenses 44,732 81,117 44,980 41,562 31,095 32,539 23,195 49,189 35,633 36,084
Total operating expenses before depreciation 221,752 254,143 210,235 209,695 199,806 205,169 205,354 234,249 226,261 227,675 Operating Income before depreciation 204,593 148,081 196,583 190,808 209,981 192,199 220,597 212,646 209,865 246,857 Depreciation 78,295 83,413 87,255 90,468 100,485 108,037 124,221 137,384 163,933 172,895 Operating Income 126,298 64,668 109,328 100,340 109,496 84,162 96,376 75,262 45,932 73,962 Nonoperating revenues (expenses)
Income from investments in Joint Powers Authorities 4,440 2,980 2,270 (333) 1,851 2,049 2,129 2,811 2,544 2,162
Interest and investment income 34,863 18,824 15,233 6,436 9,486 826 4,654 5,039 9,326 1,118 Interest expense (38,052) (36,979) (35,663) (3,704) (10,538) (2,473) (1,530) (331) (507) (604) Other income and expenses, net (2,536) (7,625) (2,951) (6,667) (8,359) 784 (27,364) (2,226) (3,851) (1,146)
Net nonoperating revenues (expenses) (1,285) (22,800) (21,111) (4,268) (7,560) 1,186 (22,111) 5,293 7,512 1,530 Income before capital contributions 125,013 41,868 88,217 96,072 101,936 85,348 74,265 80,555 53,444 75,492 Capital contributions 14,161 4,103 16,950 12,059 31,307 17,630 80,374 111,852 40,489 18,801 Special and extraordinary items -- -- -- -- -- 13,387 15,002 -- 5,123 9,150 Changes in net position 139,174 45,971 105,167 108,131 133,243 116,365 169,641 192,407 99,056 103,443 Total net position – beginning of year 2,337,869 2,383,616 2,429,587 2,534,754 2,642,885 2,776,128 2,884,351 3,064,554 3,062,899 3,161,955
Cumulative effect of change in accounting principle -- -- -- -- -- -- -- (194,062) -- -- Net adjustment for write off prior period bond issues costs -- -- -- -- -- (8,142) 10,562 -- -- -- Net position July 1, restated 2,337,869 2,383,616 2,429,587 2,534,754 2,642,885 2,767,986 2,894,913 2,870,492 3,062,899 3,161,955
Total net position – end of year $ 2,477,043 $ 2,429,587 $ 2,534,754 $ 2,642,885 $ 2,776,128 $ 2,884,351 $ 3,064,554 $ 3,062,899 $ 3,161,955 $ 3,265,398 Net position:
Net investment in capital assets 1,985,653 2,101,396 2,164,885 2,286,360 2,397,744 2,634,840 2,863,795 2,856,561 2,945,412 2,972,442 Restricted 9 61,608 67,844 67,341 67,796 57,913 58,054 68,373 66,599 62,255 Unrestricted 491,381 266,583 302,025 289,184 310,588 191,598 142,705 137,965 149,944 230,701
Total net position $ 2,477,043 $ 2,429,587 $ 2,534,754 $ 2,642,885 $ 2,776,128 $ 2,884,351 $ 3,064,554 $ 3,062,899 $ 3,161,955 $ 3,265,398
(Unaudited)
PORT OF LOS ANGELES(HARBOR DEPARTMENT OF THE CITY OF LOS ANGELES, CALIFORNIA)
(In Thousands)
- 107 -

PORT OF LOS ANGELES(HARBOR DEPARTMENT OF THE CITY OF LOS ANGELES, CALIFORNIA)
Summary of Debt Service Coverage (Pledged Revenue)Last Ten Fiscal Years
(In Thousands)(Unaudited)
2008 2009 2010 2011 2012 2013 2014 2015 2016 2017
Operating revenues (including investment/interestincome and noncapital grant revenues) (1) $ 465,648 $ 424,028 $ 424,306 $ 412,962 $ 435,291 $ 416,974 $ 446,910 $ 460,364 $ 452,398 $ 487,806
Operating expenses (2) 221,752 254,143 210,235 209,695 199,806 205,169 205,354 234,249 226,261 227,675
Net available revenue $ 243,896 $ 169,885 $ 214,071 $ 203,267 $ 235,485 $ 211,805 $ 241,556 $ 226,115 $ 226,137 $ 260,131
Debt service, revenue bonds $ 61,318 $ 61,298 $ 66,851 $ 72,736 $ 71,382 $ 72,204 $ 65,323 $ 69,916 $ 91,831 $ 87,570 Debt service, commercial papers — — — 191 227 194 165 187 — —
Total debt service (3) $ 61,318 $ 61,298 $ 66,851 $ 72,927 $ 71,609 $ 72,398 $ 65,488 $ 70,103 $ 91,831 $ 87,570
Net available revenue coverage 4.0 2.8 3.2 2.8 3.3 2.9 3.7 3.2 2.5 3.0
Net cash flow from operations $ 252,898 $ 151,264 $ 185,416 $ 158,268 $ 217,113 $ 234,234 $ 131,284 $ 213,184 $ 184,869 $ 274,581
Net operating cash flow coverage 4.1 2.5 2.8 2.2 3.0 3.2 2.0 3.0 2.0 3.1
(1) Operating revenues include pledged pooled investment/interest income and non-capital grant revenues.(2) Depreciation and amortization expenses, interest expense, and other nonoperating expenses are not included.
Note: Details regarding the Port of Los Angeles’ outstanding debt can be found in the notes to the basic financial statements.
(3) Debt service includes principal and interest payments on issued bonds as well as on commercial paper notes, which are senior debt backed by pledged-revenue. Debt service does not include loans from the California Department of Boating and Waterways, which are not backed by pledged-revenue.
- 108 -

PORT OF LOS ANGELES(HARBOR DEPARTMENT OF THE CITY OF LOS ANGELES, CALIFORNIA)
Revenue Statistics Last Ten Fiscal Years
(Unaudited)
2008 2009 2010 2011 2012 2013 2014 2015 2016 2017
Revenue Information
Revenue Rates
General cargo tariff rate 6.25$ 6.25$ 6.25$ 6.25$ 6.25$ 6.25$ 6.25$ 6.25$ 6.25$ 6.25$
Basic dockage (600’) 2,465 2,465 2,465 2,465 2,465 2,465 2,465 2,465 2,465 2,465
Required rate of return on improvements 12.0% 12.0% 12.0% 12.0% 12.0% 12.0% 12.0% 12.0% 12.0% 12.0%
Required rate of return on land 10.0% 10.0% 10.0% 10.0% 10.0% 10.0% 10.0% 10.0% 10.0% 10.0%
Containerized cargo volume
(in millions of TEUs) 8.1 7.3 7.2 7.9 8.2 7.8 8.2 8.2 8.4 9.2
Inbound tonnage (million tons) 105.2 94.4 88.2 93.7 98.3 93.1 99.1 102.9 105.6 105.8
Outbound tonnage (million tons) 65.1 66.1 66.7 67.8 74.6 71.5 74.3 74.6 79.3 92.4
Revenue tons (million)
General cargo 161.9 144.3 145.8 149.1 163.9 156.3 165.0 165.1 167.3 184.3
Liquid bulk 6.2 11.1 10.7 10.6 9.9 7.8 10.5 10.3 14.3 13.2
Dry bulk 1.9 2.0 1.4 1.2 1.1 1.0 1.0 1.4 1.2 0.6Total revenue tons (million) 170.0 157.4 157.9 160.9 174.9 165.1 176.5 176.8 182.8 198.1
0.0
50.0
100.0
150.0
200.0
General Cargo
(In Million Tons)
0.0
2.0
4.0
6.0
8.0
10.0
12.0
14.0
16.0
Liquid Bulk(In Million Tons)
0.0
0.5
1.0
1.5
2.0
2.5
Dry Bulk(In Million Tons)
- 109 -

PORT OF LOS ANGELES(HARBOR DEPARTMENT OF THE CITY OF LOS ANGELES, CALIFORNIA)
Other Operating InformationLast Ten Fiscal Years
(Unaudited)
2008 2009 2010 2011 2012 2013 2014 2015 2016 2017
Miles of waterfront 43 43 43 43 43 43 43 43 43 43
Number of major container terminals 8 8 8 8 8 8 8 8 8 8
Number of cargo terminals 25 25 24 24 24 24 23 23 23 23
Vessel arrivals 2,467 2,322 2,124 2,236 2,100 2,089 2,196 1,846 2,014 2,060
Cruise passengers 1,191,449 990,965 802,899 667,434 515,827 355,875 541,418 578,902 676,644 529,031
Vehicles 185,978 109,634 147,935 183,126 215,374 178,252 167,826 147,457 169,561 235,862
Full time employees 935 971 948 959 958 947 949 885 906 883
‐‐
500
1,000
1,500
2,000
2,500
3,000
Vessel Arrivals
‐‐
200,000
400,000
600,000
800,000
1,000,000
1,200,000
1,400,000
Cruise Passengers
‐‐
50,000
100,000
150,000
200,000
250,000
Vehicles
- 110 -

Expenses Before
Allocation of Direct and
Indirect Costs
Direct Costs Allocated to
Projects
Expenses After Allocation of Direct Costs
Indirect Overhead Costs
Allocated to Capital Projects
Net Operating Expenses
Salaries and benefits $ 142,053 $ (13,337) $ 128,716 $ (10,134) $ 118,582
City services 53,388 (10,240) 43,148 (3,594) 39,554
Outside services 92,808 (66,199) 26,609 (1,587) 25,022
Utilities 17,114 (557) 16,557 (984) 15,573
Materials and supplies 7,681 (1,555) 6,126 (812) 5,314
Marketing and public relations 2,894 (15) 2,879 (296) 2,583
Workers’ compensation, claims and settlements 4,977 — 4,977 — 4,977
Clean truck program expenses 704 — 704 — 704
Travel and entertainment 614 (3) 611 (75) 536
Other operating expenses 16,318 (645) 15,673 (843) 14,830
Total operating expenses $ 338,551 $ (92,551) $ 246,000 $ (18,325) $ 227,675
(Unaudited)(In Thousands)
PORT OF LOS ANGELES(HARBOR DEPARTMENT OF THE CITY OF LOS ANGELES, CALIFORNIA)
Operating Expenses Net of Direct and Indirect CostsFiscal Year Ended June 30, 2017
- 111 -

Expenses Before
Allocation of Direct and
Indirect Costs
Direct Costs Allocated to
Projects
Expenses After Allocation of Direct Costs
Indirect Overhead Costs
Allocated to Capital Projects
Net Operating Expenses
Salaries and benefits $ 137,382 $ (13,773) $ 123,609 $ (8,890) $ 114,719
City services 45,492 (4,884) 40,608 (3,187) 37,421
Outside services 157,765 (126,847) 30,918 (1,948) 28,970
Utilities 15,834 (64) 15,770 (710) 15,060
Materials and supplies 9,191 (2,362) 6,829 (489) 6,340
Marketing and public relations 2,830 (21) 2,809 (242) 2,567
Workers’ compensation, claims and settlements 245 — 245 — 245
Clean truck program expenses 897 — 897 — 897
Travel and entertainment 707 (5) 702 (91) 611
Other operating expenses 20,475 (373) 20,102 (671) 19,431
Total operating expenses $ 390,818 $ (148,329) $ 242,489 $ (16,228) $ 226,261
(Unaudited)
Operating Expenses Net of Direct and Indirect CostsFiscal Year Ended June 30, 2016
(In Thousands)
PORT OF LOS ANGELES(HARBOR DEPARTMENT OF THE CITY OF LOS ANGELES, CALIFORNIA)
- 112 -

PORT OF LOS ANGELES(HARBOR DEPARTMENT OF THE CITY OF LOS ANGELES, CALIFORNIA)
Capital Development Program Expenditures Per Adopted BudgetFor Fiscal Year 2017-2018
(In Thousands)(Unaudited)
Project Description
Expenditures per Adopted
Budget
Berth 90-93 World Cruise Center $ 11,159
Berth 100-102 Development - China Shipping Container Terminal 393
Berth 121-131 Development - Yang Ming Container Terminal 1,124
Berth 135-147 Development - TraPac Container Terminal 2,563
Berth 212-224 Development - YTI Container Terminal 8,058
Berth 222-236 Development - Everport Container Terminal 1,975
Berth 400-409 Development - Maersk/Cut 313
Motems (Marine Oil Terminal Engineering and Maintenance Standards) 7,853
Miscellaneous Terminal Improvements 8,199
Transportation Improvement 7,809
Security Projects 2,219
Port-wide Public Enhancements - Community 1,926
Los Angeles Waterfront 16,248
Harbor Department Facilities 749
Miscellaneous Projects 12,081
Unallocated Capital Improvement Program Fund 15,000
Total $ 97,669
Note: Schedule above excludes capital equipment.
- 113 -

COMPLIANCE SECTION

www.mgocpa.com Macias Gini & O’Connell LLP 777 S. Figueroa Street, Suite 2500 Los Angeles, CA 90017
114
Independent Auditor’s Report on Internal Control Over Financial Reporting and on Compliance and Other Matters Based on an Audit of Financial Statements
Performed in Accordance With Government Auditing Standards Honorable Members of the Board of Harbor Commissioners Port of Los Angeles (Harbor Department of the City of Los Angeles) We have audited, in accordance with the auditing standards generally accepted in the United States of America and the standards applicable to financial audits contained in Government Auditing Standards issued by the Comptroller General of the United States, the financial statements of the Port of Los Angeles (Harbor Department of the City of Los Angeles) (Port), an enterprise fund of the City of Los Angeles (City), as of and for the fiscal year ended June 30, 2017, and the related notes to the financial statements, and have issued our report thereon dated December 18, 2017. Internal Control over Financial Reporting In planning and performing our audit of the financial statements, we considered the Port’s internal control over financial reporting (internal control) to determine the audit procedures that are appropriate in the circumstances for the purpose of expressing our opinion on the financial statements, but not for the purpose of expressing an opinion on the effectiveness of the Port’s internal control. Accordingly, we do not express an opinion on the effectiveness of the Port’s internal control. A deficiency in internal control exists when the design or operation of a control does not allow management or employees, in the normal course of performing their assigned functions, to prevent, or detect and correct, misstatements on a timely basis. A material weakness is a deficiency, or a combination of deficiencies, in internal control, such that there is a reasonable possibility that a material misstatement of the entity’s financial statements will not be prevented, or detected and corrected on a timely basis. A significant deficiency is a deficiency, or a combination of deficiencies, in internal control that is less severe than a material weakness, yet important enough to merit attention by those charged with governance. Our consideration of internal control was for the limited purpose described in the first paragraph of this section and was not designed to identify all deficiencies in internal control that might be material weaknesses or significant deficiencies. Given these limitations, during our audit we did not identify any deficiencies in internal control that we consider to be material weaknesses. However, material weaknesses may exist that have not been identified. Compliance and Other Matters As part of obtaining reasonable assurance about whether the Port’s financial statements are free from material misstatement, we performed tests of its compliance with certain provisions of laws, regulations, contracts, and grant agreements, noncompliance with which could have a direct and material effect on the determination of financial statement amounts. However, providing an opinion on compliance with those provisions was not an objective of our audit, and accordingly, we do not express such an opinion. The results of our tests disclosed no instances of noncompliance or other matters that are required to be reported under Government Auditing Standards.

115
Purpose of this Report The purpose of this report is solely to describe the scope of our testing of internal control and compliance and the results of that testing, and not to provide an opinion on the effectiveness of the entity’s internal control or on compliance. This report is an integral part of an audit performed in accordance with Government Auditing Standards in considering the entity’s internal control and compliance. Accordingly, this communication is not suitable for any other purpose.
Los Angeles, California December 18, 2017