Embed Size (px)
Citation preview
FC Research
March 2017
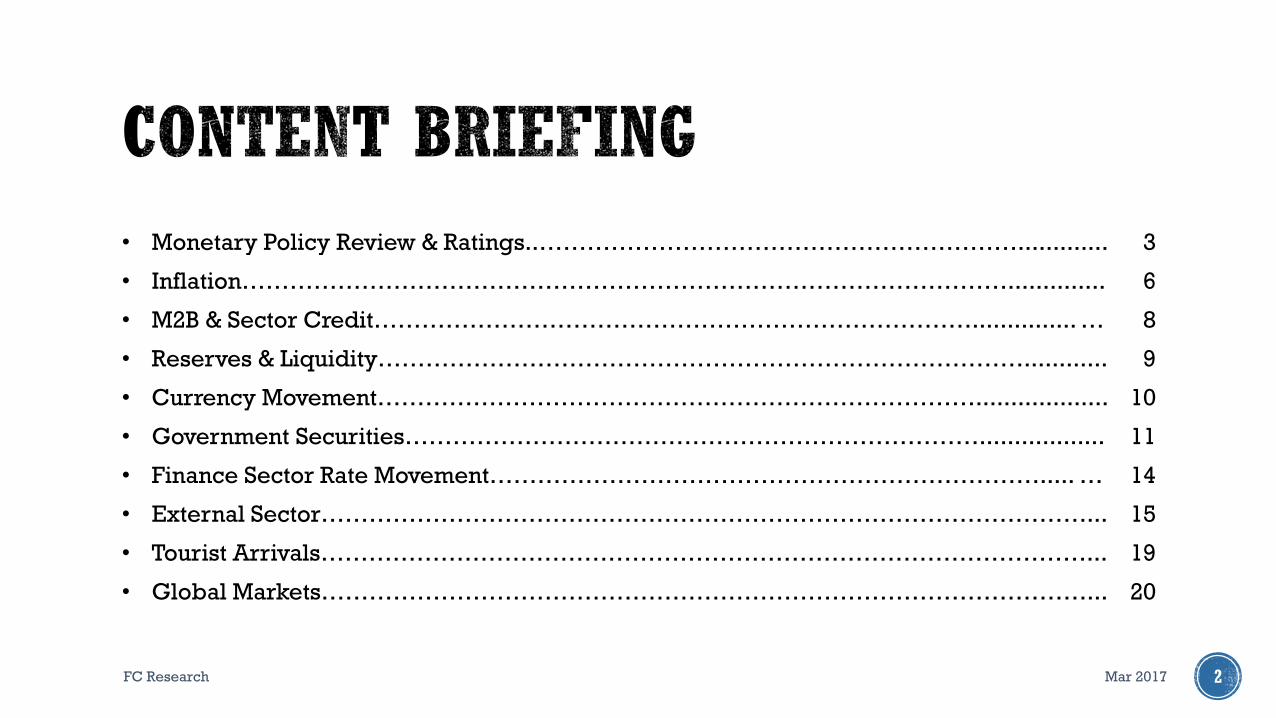
• Monetary Policy Review & Ratings..……………………………………………………............. 3
• Inflation…………………………………………………………………………………….............. 6
• M2B & Sector Credit…………………………………………………………………............... … 8
• Reserves & Liquidity………………………………………………………………………............ 9
• Currency Movement…………………………………………………………………................... 10
• Government Securities……………………………………………………………….................. 11
• Finance Sector Rate Movement……………………………………………………………..... … 14
• External Sector……………………………………………………………………………………... 15
• Tourist Arrivals……………………………………………………………………………………... 19
• Global Markets……………………………………………………………………………………... 20
Mar 2017FC Research 2
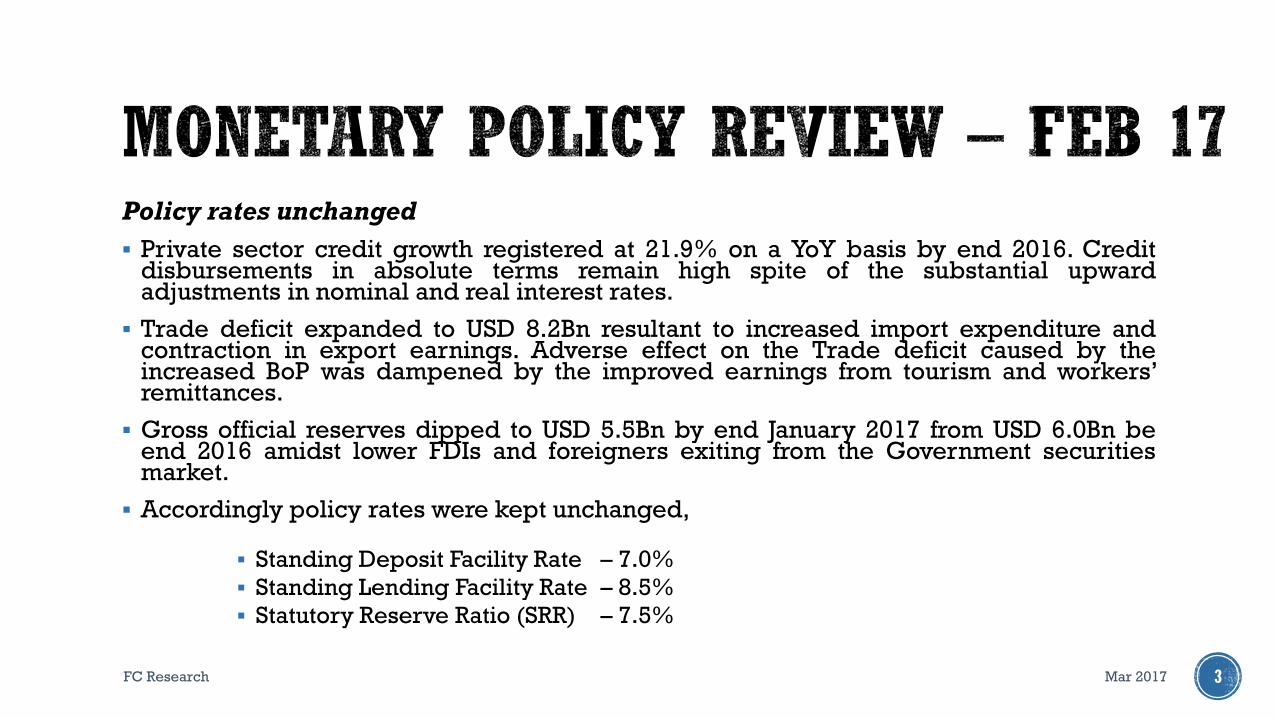
Policy rates unchanged
Private sector credit growth registered at 21.9% on a YoY basis by end 2016. Creditdisbursements in absolute terms remain high spite of the substantial upwardadjustments in nominal and real interest rates.
Trade deficit expanded to USD 8.2Bn resultant to increased import expenditure andcontraction in export earnings. Adverse effect on the Trade deficit caused by theincreased BoP was dampened by the improved earnings from tourism and workers’remittances.
Gross official reserves dipped to USD 5.5Bn by end January 2017 from USD 6.0Bn beend 2016 amidst lower FDIs and foreigners exiting from the Government securitiesmarket.
Accordingly policy rates were kept unchanged,
Standing Deposit Facility Rate – 7.0%
Standing Lending Facility Rate – 8.5%
Statutory Reserve Ratio (SRR) – 7.5%
Mar 2017FC Research 3
The International Monetary Fund gave a thumbs up to revenue collections butasked Sri Lanka to speed up delayed reforms, tighten monetary policy if inflationdid not fall and collect more foreign reserves.
Macroeconomic performance was mixed with gradual growth recovery and higherinflation due to drought, impact of VAT increase.
The team commends the authorities for strong efforts in implementing their IMF-supported economic reform program.
Net international reserves fell short of the target and progress on implementingstructural benchmarks was somewhat uneven.
Mar 2017FC Research 4

S&P Global Ratings affirmed its 'B+' long-term and 'B' short-term sovereign creditratings on the Sri Lanka. The outlook on the long-term rating remains negativewhile the transfer and convertibility risk assessment on Sri Lanka remainedunchanged at 'B+'.
Country's fiscal position improved resultant to the government-led reforms and IMFtechnical and funding assistance. However, high external debt, and low reservescontinue to make Sri Lanka vulnerable to external shocks. Other rating constraintson Sri Lanka include the high general government net debt burden of 74.9% ofGDP in 2016).
Annual growth in general government debt to average at 4.4% of GDP for 2017-2020 while net general government debt to decline to 65% of GDP through 2020 onthe back of robust nominal GDP growth. Exchange rate stability remain a majorpriority given 43% of central government debt is denominated in foreign currency.
Mar 2017FC Research 5
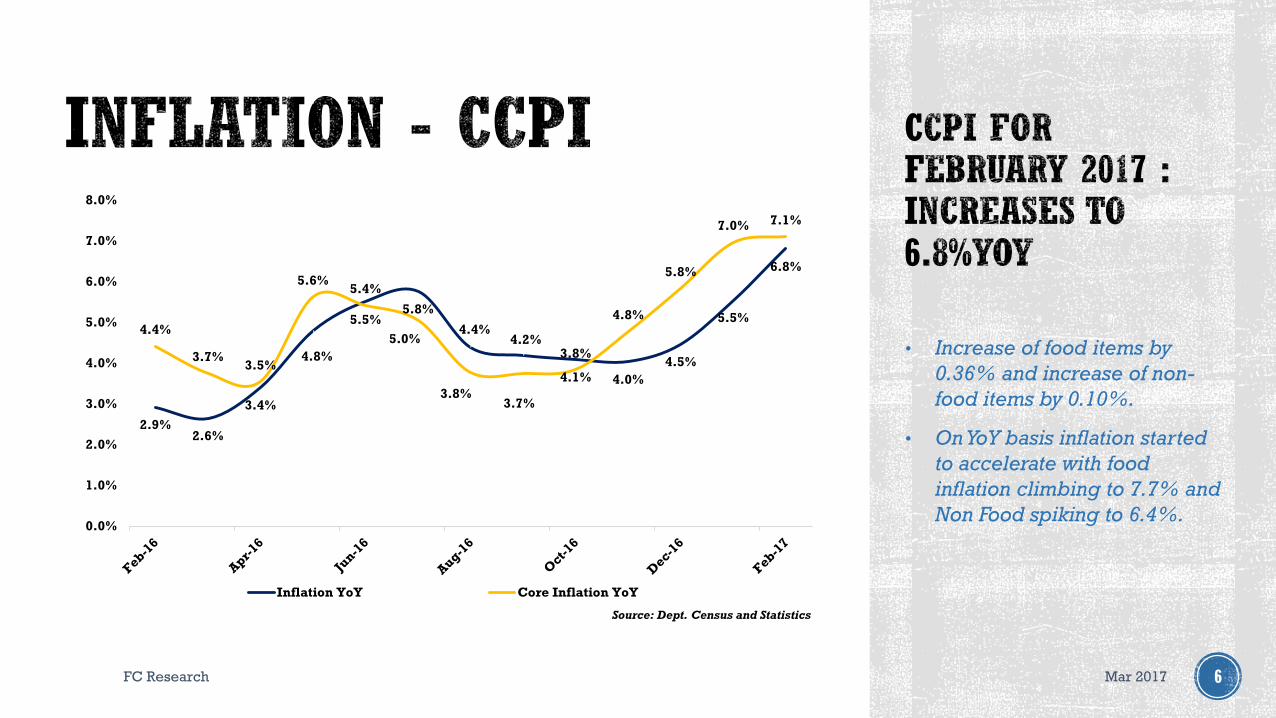
• Increase of food items by
0.36% and increase of non-
food items by 0.10%.
• On YoY basis inflation started
to accelerate with food
inflation climbing to 7.7% and
Non Food spiking to 6.4%.
Mar 2017FC Research 6
2.9%2.6%
3.4%
4.8%
5.5%5.8%
4.4%4.2%
4.1% 4.0%
4.5%
5.5%
6.8%
4.4%
3.7%3.5%
5.6%5.4%
5.0%
3.8%3.7%
3.8%
4.8%
5.8%
7.0% 7.1%
0.0%
1.0%
2.0%
3.0%
4.0%
5.0%
6.0%
7.0%
8.0%
Inflation YoY Core Inflation YoY
Source: Dept. Census and Statistics
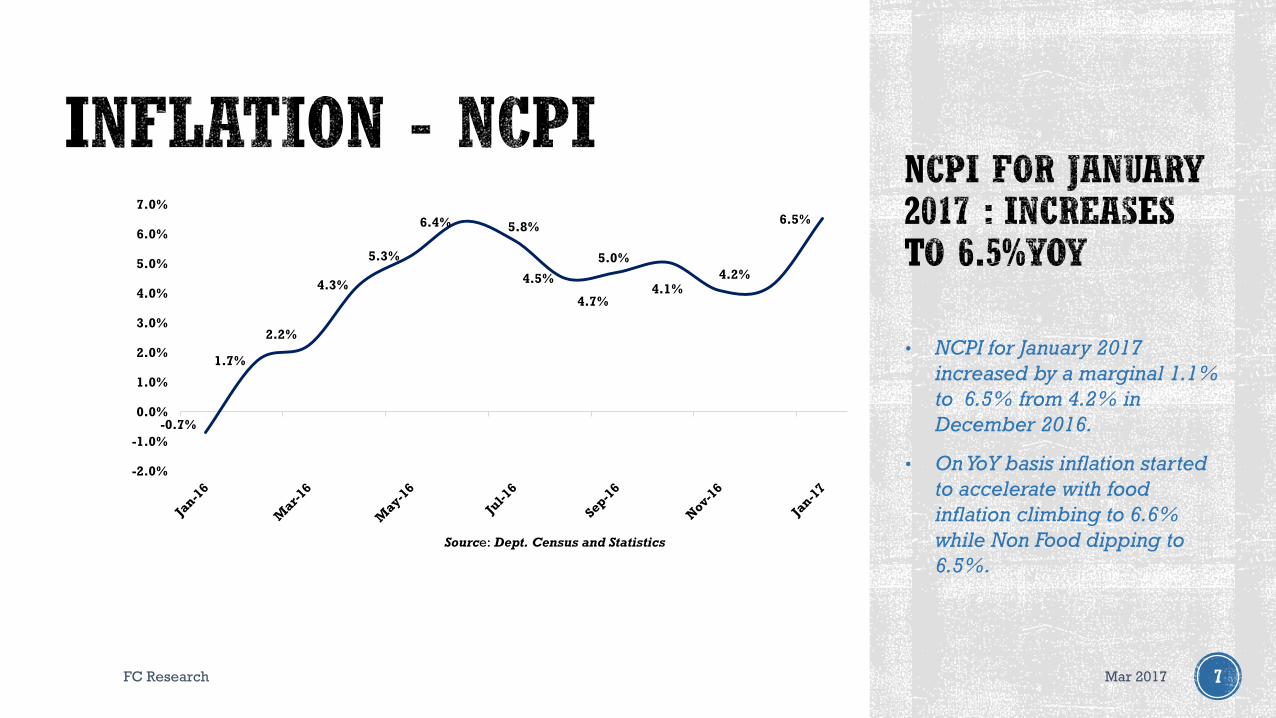
• NCPI for January 2017
increased by a marginal 1.1%
to 6.5% from 4.2% in
December 2016.
• On YoY basis inflation started
to accelerate with food
inflation climbing to 6.6%
while Non Food dipping to
6.5%.
Mar 2017FC Research 7
-0.7%
1.7%
2.2%
4.3%
5.3%
6.4% 5.8%
4.5%
4.7%
5.0%
4.1%4.2%
6.5%
-2.0%
-1.0%
0.0%
1.0%
2.0%
3.0%
4.0%
5.0%
6.0%
7.0%
Source: Dept. Census and Statistics
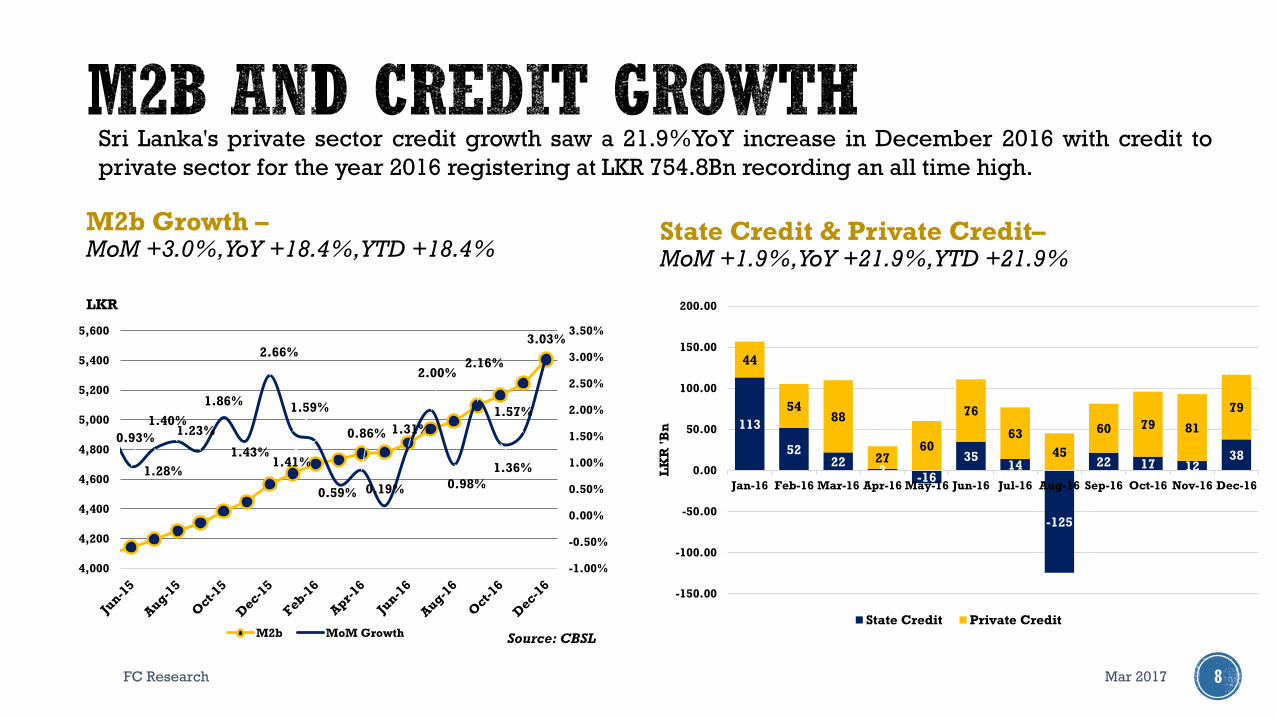
M2b Growth –MoM +3.0%, YoY +18.4%, YTD +18.4%
Mar 2017FC Research 8
Sri Lanka's private sector credit growth saw a 21.9%YoY increase in December 2016 with credit to
private sector for the year 2016 registering at LKR 754.8Bn recording an all time high.
0.93%
1.28%
1.40%1.23%
1.86%
1.43%
2.66%
1.59%
1.41%
0.59%
0.86%
0.19%
1.31%
2.00%
0.98%
2.16%
1.36%
1.57%
3.03%
-1.00%
-0.50%
0.00%
0.50%
1.00%
1.50%
2.00%
2.50%
3.00%
3.50%
4,000
4,200
4,400
4,600
4,800
5,000
5,200
5,400
5,600
M2b MoM Growth Source: CBSL
LKR
State Credit & Private Credit–MoM +1.9%, YoY +21.9%, YTD +21.9%
113
5222
2-16
3514
-125
22 17 1238
44
5488
2760
76
63
45
60 79 81
79
-150.00
-100.00
-50.00
0.00
50.00
100.00
150.00
200.00
Jan-16 Feb-16 Mar-16 Apr-16 May-16 Jun-16 Jul-16 Aug-16 Sep-16 Oct-16 Nov-16 Dec-16
LK
R '
Bn
State Credit Private Credit
Mar 2017FC Research 9
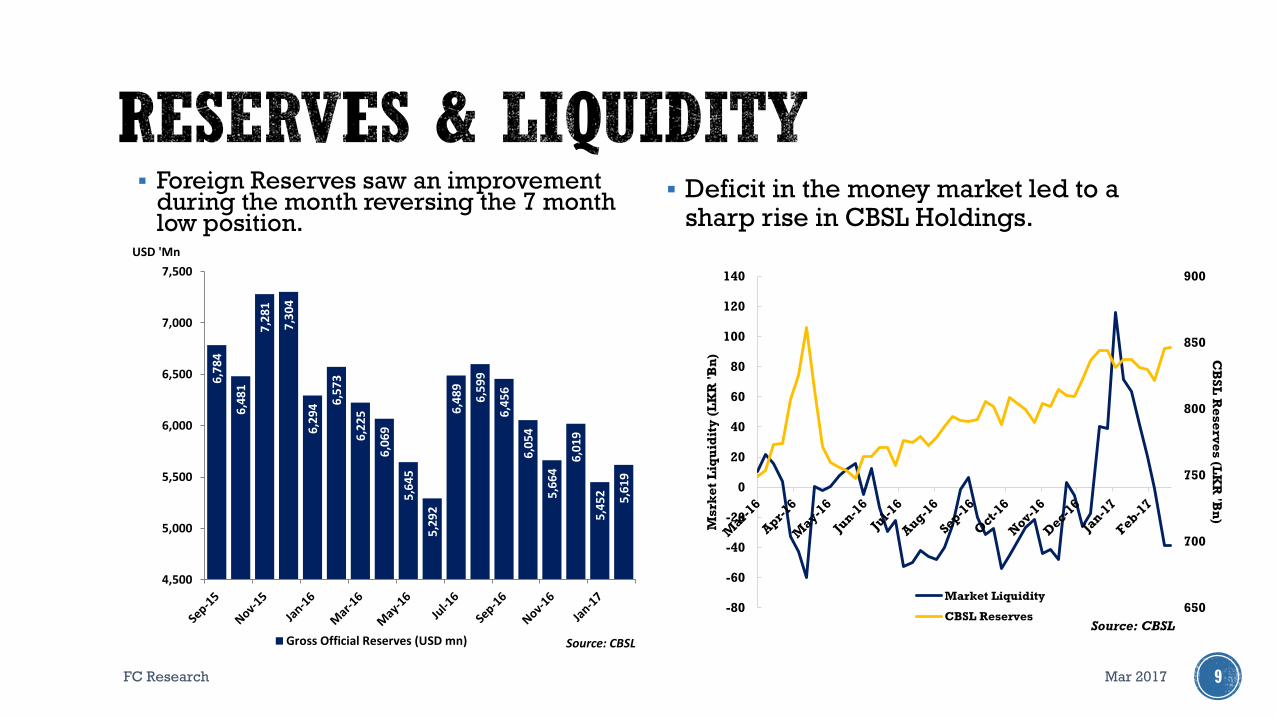
Foreign Reserves saw an improvement during the month reversing the 7 month low position.
Deficit in the money market led to a sharp rise in CBSL Holdings.
6,7
84
6,4
81
7,2
81
7,3
04
6,2
94 6
,57
3
6,2
25
6,0
69
5,6
45
5,2
92
6,4
89
6,5
99
6,4
56
6,0
54
5,6
64
6,0
19
5,4
52 5,6
19
4,500
5,000
5,500
6,000
6,500
7,000
7,500
USD 'Mn
Gross Official Reserves (USD mn) Source: CBSL
650
700
750
800
850
900
-80
-60
-40
-20
0
20
40
60
80
100
120
140
CB
SL
Re
se
rve
s (L
KR
'Bn
)
Ms
rke
t L
iqu
idit
y (
LK
R '
Bn
)
Market Liquidity
CBSL ReservesSource: CBSL
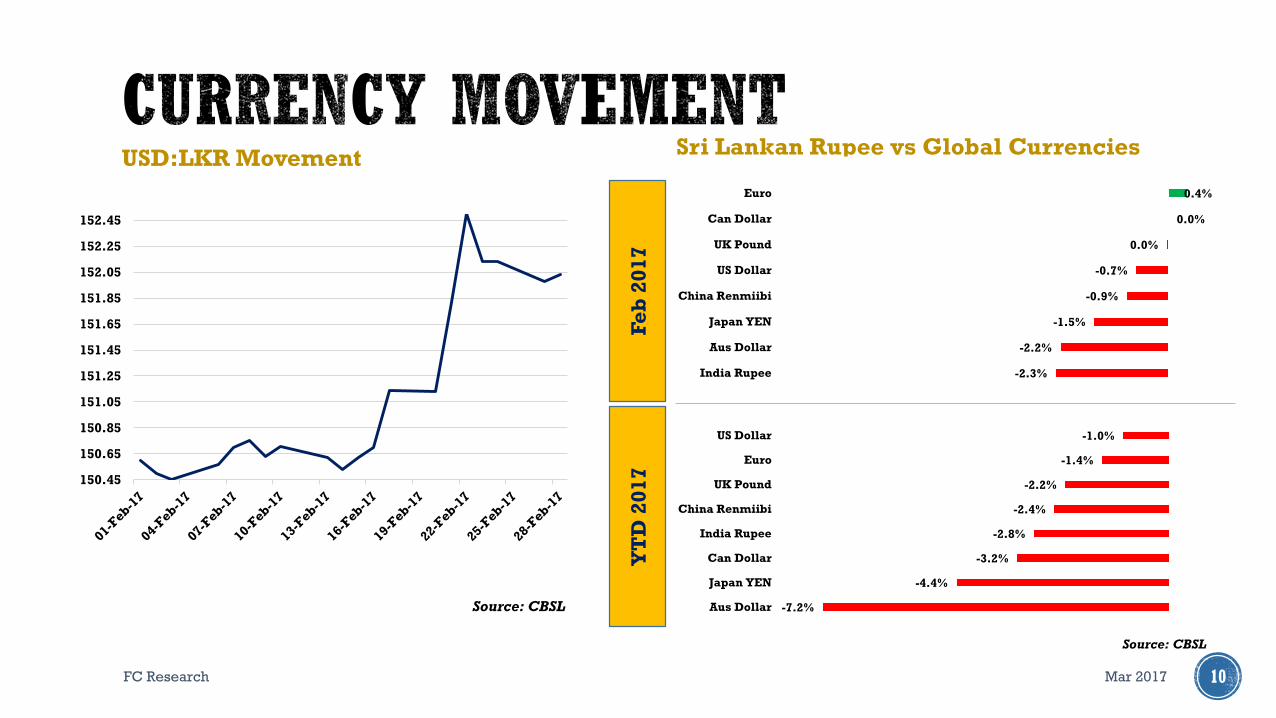
USD:LKR MovementSri Lankan Rupee vs Global Currencies
Mar 2017FC Research 10
Source: CBSL
Fe
b 2
01
7Y
TD
20
17
Source: CBSL
150.45
150.65
150.85
151.05
151.25
151.45
151.65
151.85
152.05
152.25
152.45
-2.3%
-2.2%
-1.5%
-0.9%
-0.7%
0.0%
0.0%
0.4%
India Rupee
Aus Dollar
Japan YEN
China Renmiibi
US Dollar
UK Pound
Can Dollar
Euro
-7.2%
-4.4%
-3.2%
-2.8%
-2.4%
-2.2%
-1.4%
-1.0%
Aus Dollar
Japan YEN
Can Dollar
India Rupee
China Renmiibi
UK Pound
Euro
US Dollar
Mar 2017FC Research 11
-100
-50
0
50
100
150
200
250
300
350
Mar-16 Apr-16 May-16 Jun-16 Jul-16 Aug-16 Sep-16 Oct-16 Nov-16 Dec-16 Jan-17 Feb-17
Excess Liquidity CBSL Holdings of Gov. Securities Source: CBSL
Mar 2017FC Research 12
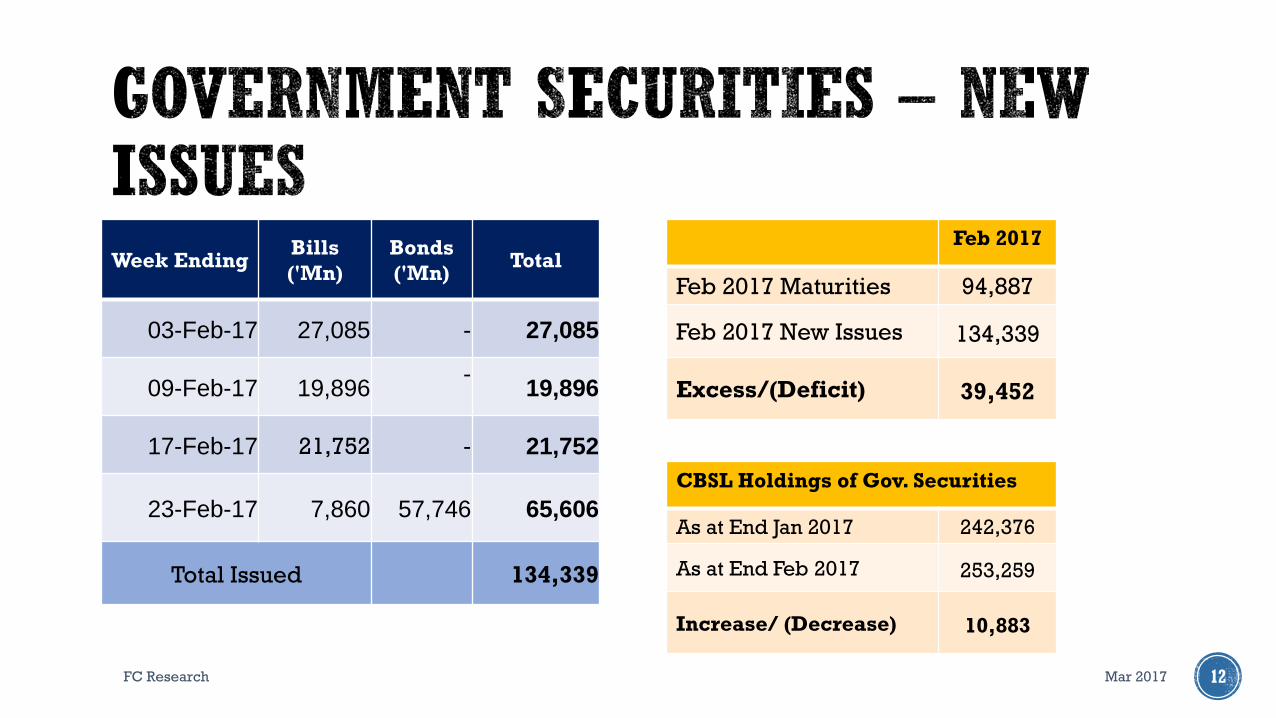
Week EndingBills
('Mn)
Bonds
('Mn)Total
03-Feb-17 27,085 - 27,085
09-Feb-17 19,896-
19,896
17-Feb-17 21,752 - 21,752
23-Feb-17 7,860 57,746 65,606
Total Issued 134,339
Feb 2017
Feb 2017 Maturities 94,887
Feb 2017 New Issues 134,339
Excess/(Deficit) 39,452
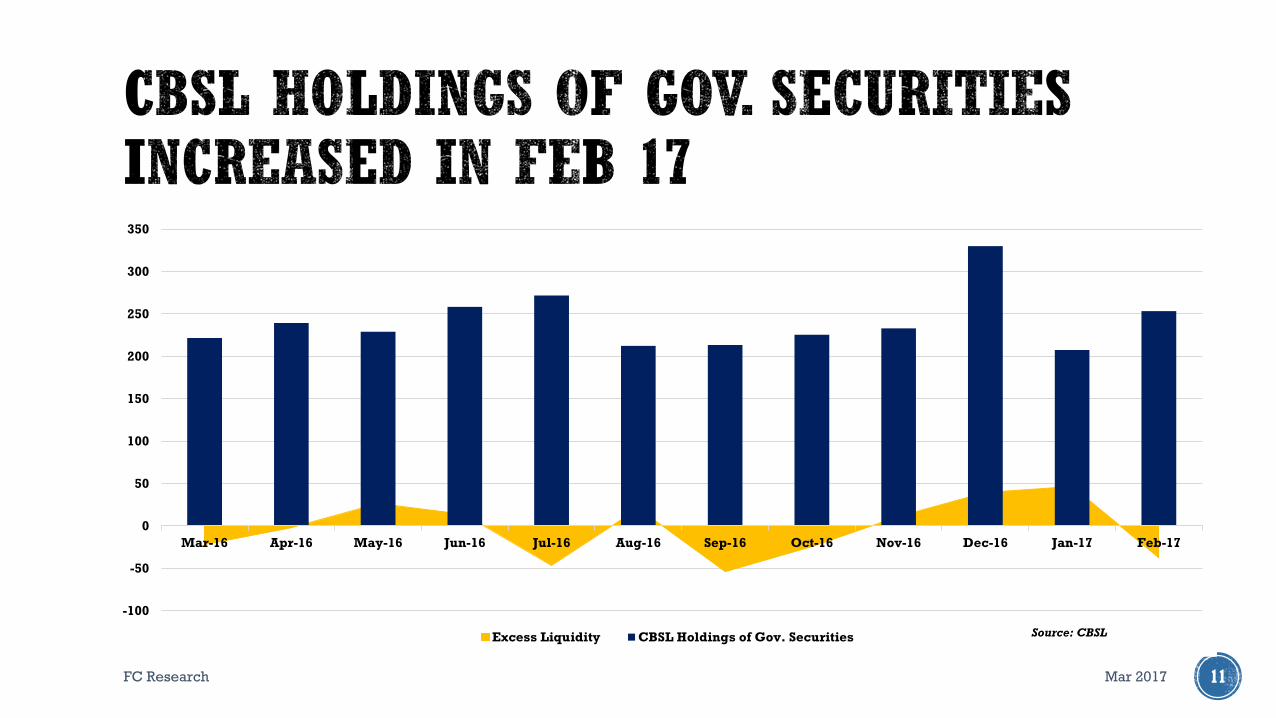
CBSL Holdings of Gov. Securities
As at End Jan 2017 242,376
As at End Feb 2017 253,259
Increase/ (Decrease) 10,883
Mar 2017FC Research 13
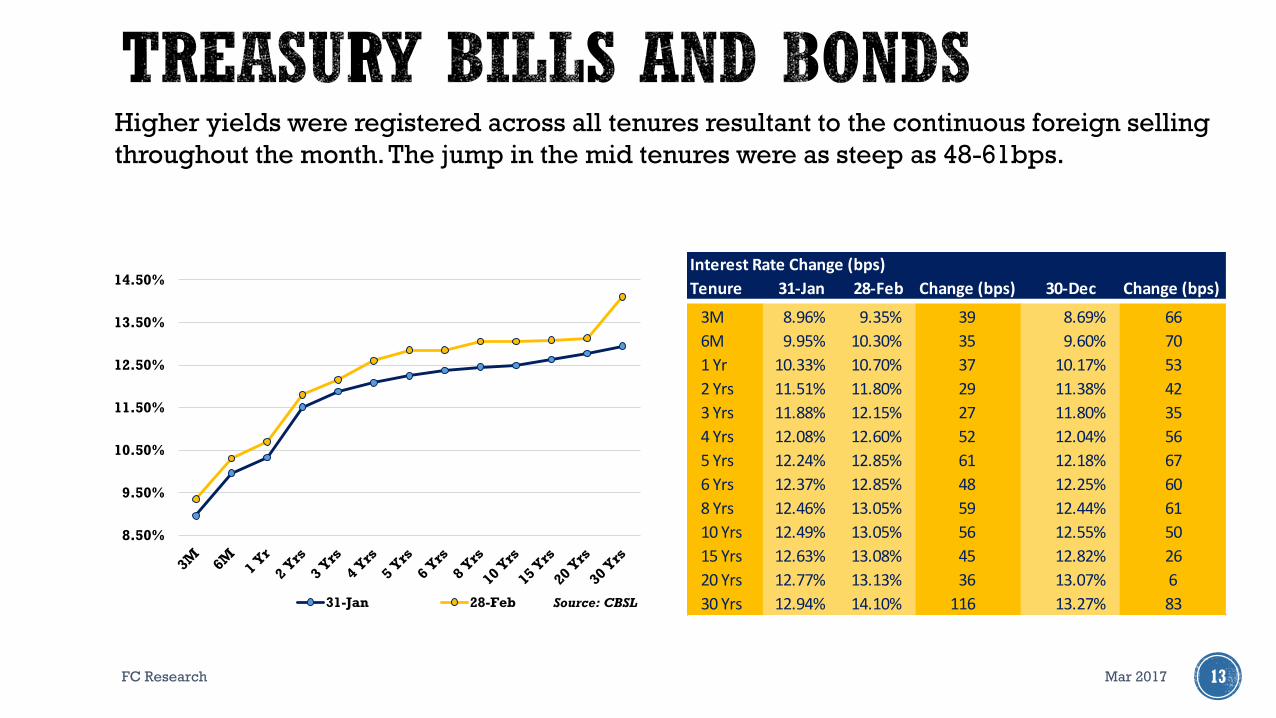
Higher yields were registered across all tenures resultant to the continuous foreign selling
throughout the month. The jump in the mid tenures were as steep as 48-61bps.
8.50%
9.50%
10.50%
11.50%
12.50%
13.50%
14.50%
31-Jan 28-Feb Source: CBSL
Interest Rate Change (bps)
Tenure 31-Jan 28-Feb Change (bps) 30-Dec Change (bps)
3M 8.96% 9.35% 39 8.69% 66
6M 9.95% 10.30% 35 9.60% 70
1 Yr 10.33% 10.70% 37 10.17% 53
2 Yrs 11.51% 11.80% 29 11.38% 42
3 Yrs 11.88% 12.15% 27 11.80% 35
4 Yrs 12.08% 12.60% 52 12.04% 56
5 Yrs 12.24% 12.85% 61 12.18% 67
6 Yrs 12.37% 12.85% 48 12.25% 60
8 Yrs 12.46% 13.05% 59 12.44% 61
10 Yrs 12.49% 13.05% 56 12.55% 50
15 Yrs 12.63% 13.08% 45 12.82% 26
20 Yrs 12.77% 13.13% 36 13.07% 6
30 Yrs 12.94% 14.10% 116 13.27% 83
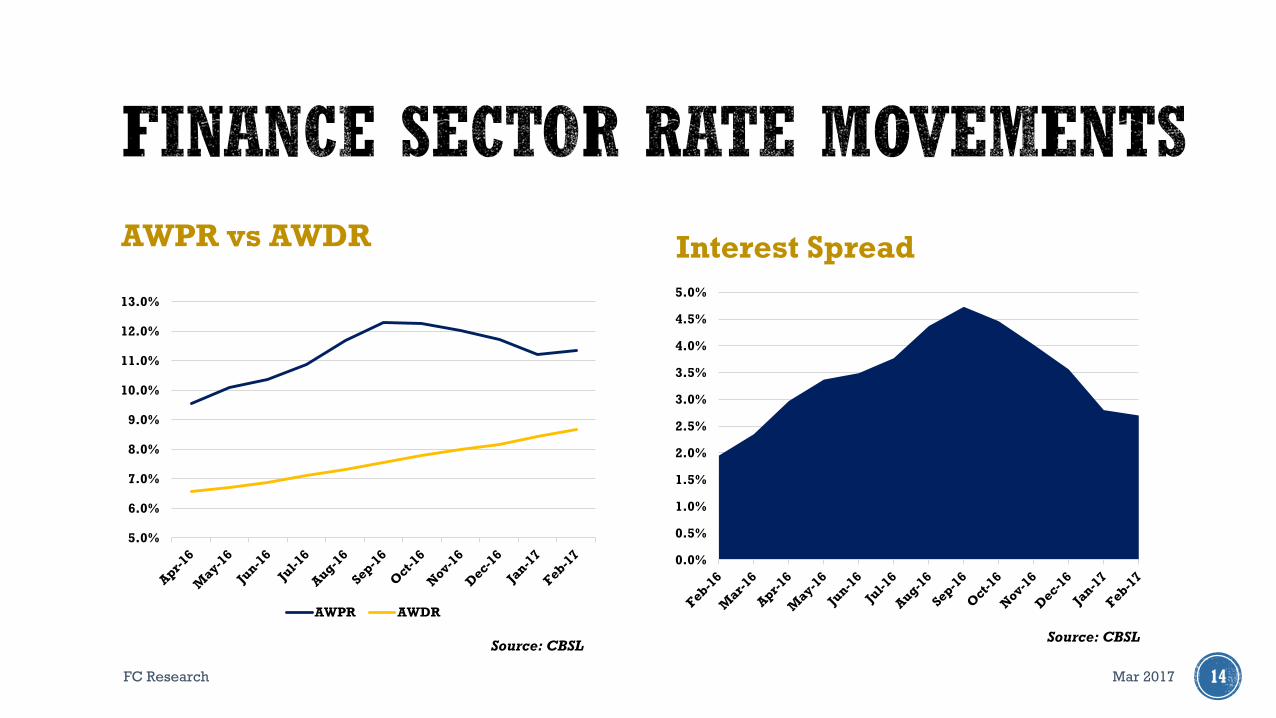
AWPR vs AWDR Interest Spread
Mar 2017FC Research 14
Source: CBSLSource: CBSL
Source: CBSL
5.0%
6.0%
7.0%
8.0%
9.0%
10.0%
11.0%
12.0%
13.0%
AWPR AWDR
0.0%
0.5%
1.0%
1.5%
2.0%
2.5%
3.0%
3.5%
4.0%
4.5%
5.0%
Mar 2017FC Research 15
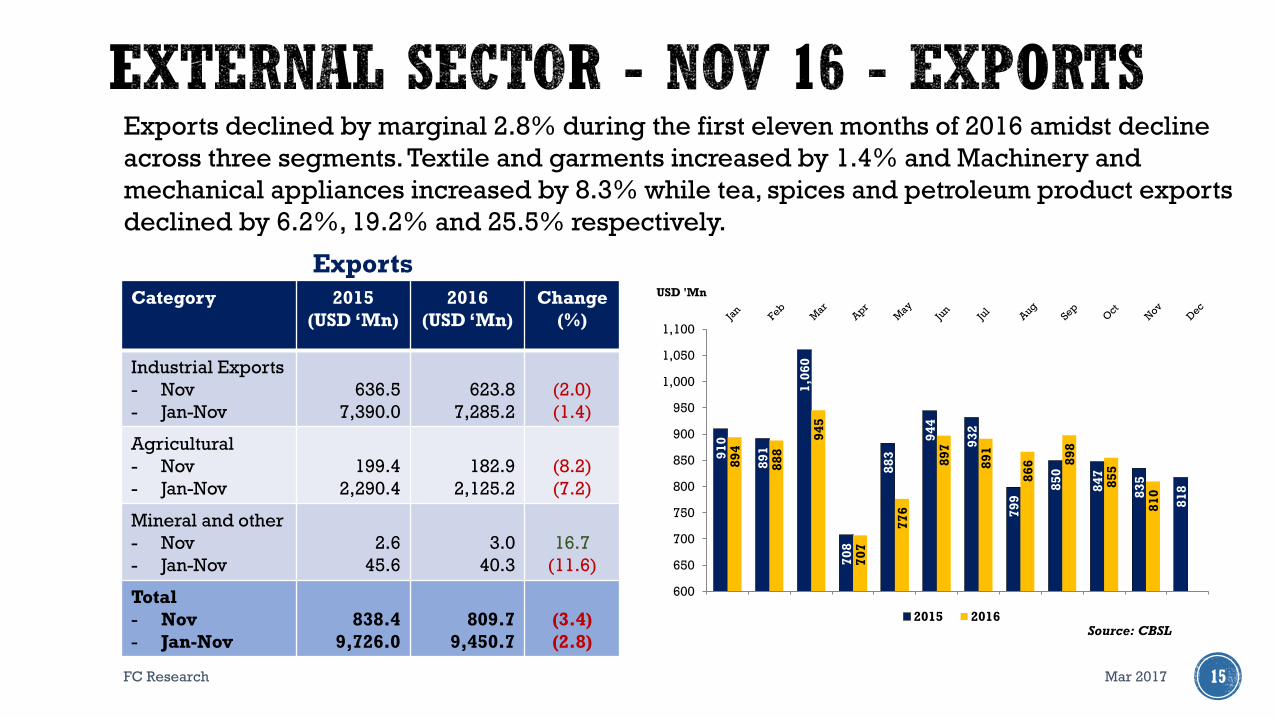
Exports declined by marginal 2.8% during the first eleven months of 2016 amidst decline
across three segments. Textile and garments increased by 1.4% and Machinery and
mechanical appliances increased by 8.3% while tea, spices and petroleum product exports
declined by 6.2%, 19.2% and 25.5% respectively.
Exports
Category 2015
(USD ‘Mn)
2016
(USD ‘Mn)
Change
(%)
Industrial Exports
- Nov
- Jan-Nov
636.5
7,390.0
623.8
7,285.2
(2.0)
(1.4)
Agricultural
- Nov
- Jan-Nov
199.4
2,290.4
182.9
2,125.2
(8.2)
(7.2)
Mineral and other
- Nov
- Jan-Nov
2.6
45.6
3.0
40.3
16.7
(11.6)
Total
- Nov
- Jan-Nov
838.4
9,726.0
809.7
9,450.7
(3.4)
(2.8)
91
0
89
1
1,0
60
70
8
88
3
94
4
93
2
79
9
85
0
84
7
83
5
81
8
89
4
88
8
94
5
70
7
77
6
89
7
89
1
86
6 89
8
85
5
81
0
600
650
700
750
800
850
900
950
1,000
1,050
1,100
USD 'Mn
2015 2016Source: CBSL
Imports
Mar 2017FC Research 16
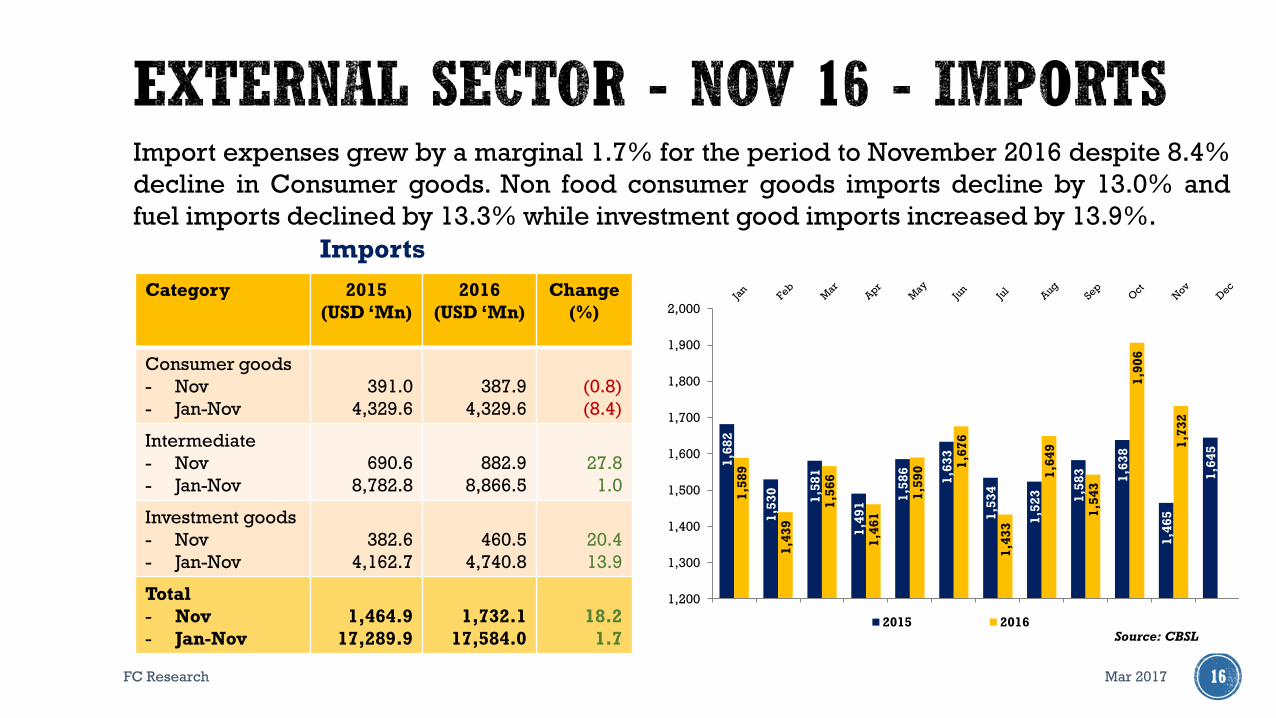
Import expenses grew by a marginal 1.7% for the period to November 2016 despite 8.4%
decline in Consumer goods. Non food consumer goods imports decline by 13.0% and
fuel imports declined by 13.3% while investment good imports increased by 13.9%.
Category 2015
(USD ‘Mn)
2016
(USD ‘Mn)
Change
(%)
Consumer goods
- Nov
- Jan-Nov
391.0
4,329.6
387.9
4,329.6
(0.8)
(8.4)
Intermediate
- Nov
- Jan-Nov
690.6
8,782.8
882.9
8,866.5
27.8
1.0
Investment goods
- Nov
- Jan-Nov
382.6
4,162.7
460.5
4,740.8
20.4
13.9
Total
- Nov
- Jan-Nov
1,464.9
17,289.9
1,732.1
17,584.0
18.2
1.7
1,6
82
1,5
30
1,5
81
1,4
91
1,5
86
1,6
33
1,5
34
1,5
23 1,5
83
1,6
38
1,4
65
1,6
45
1,5
89
1,4
39
1,5
66
1,4
61
1,5
90 1
,67
6
1,4
33
1,6
49
1,5
43
1,9
06
1,7
32
1,200
1,300
1,400
1,500
1,600
1,700
1,800
1,900
2,000
2015 2016Source: CBSL
Mar 2017FC Research 17
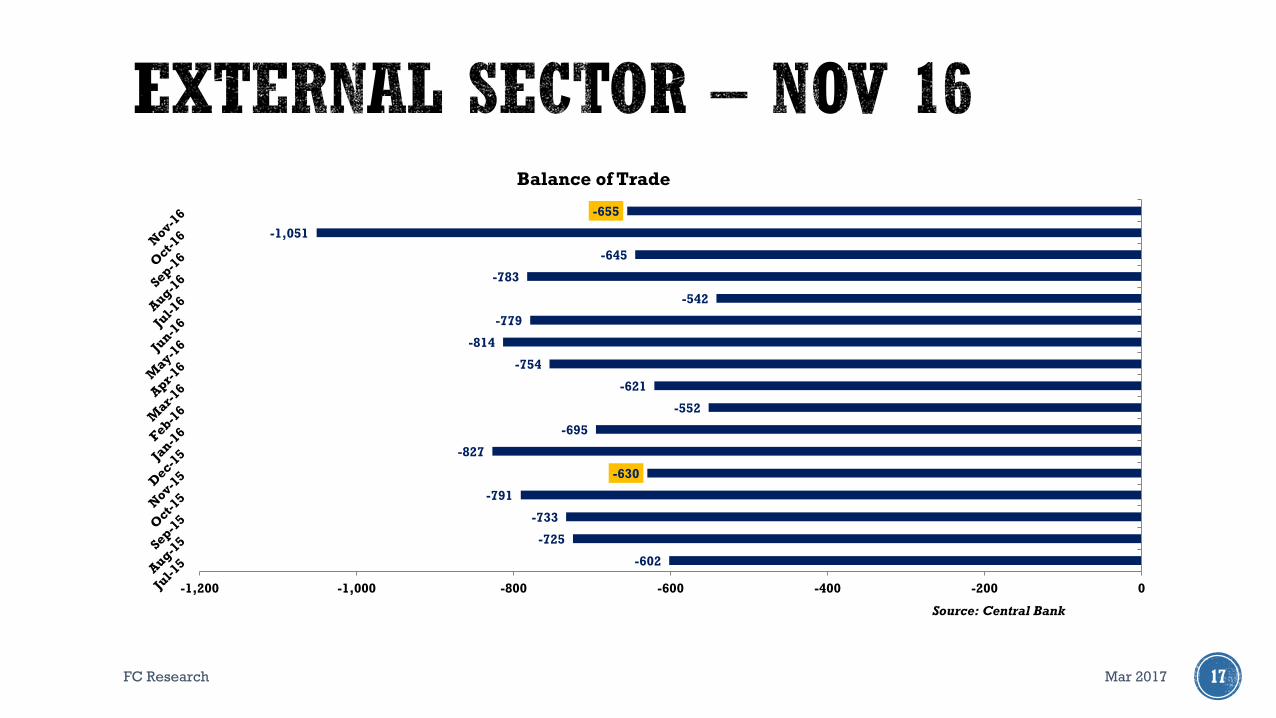
-602
-725
-733
-791
-630
-827
-695
-552
-621
-754
-814
-779
-542
-783
-645
-1,051
-655
-1,200 -1,000 -800 -600 -400 -200 0
Balance of Trade
Source: Central Bank
Nov
Trade Balance -13.2%
Mar 2017FC Research 18
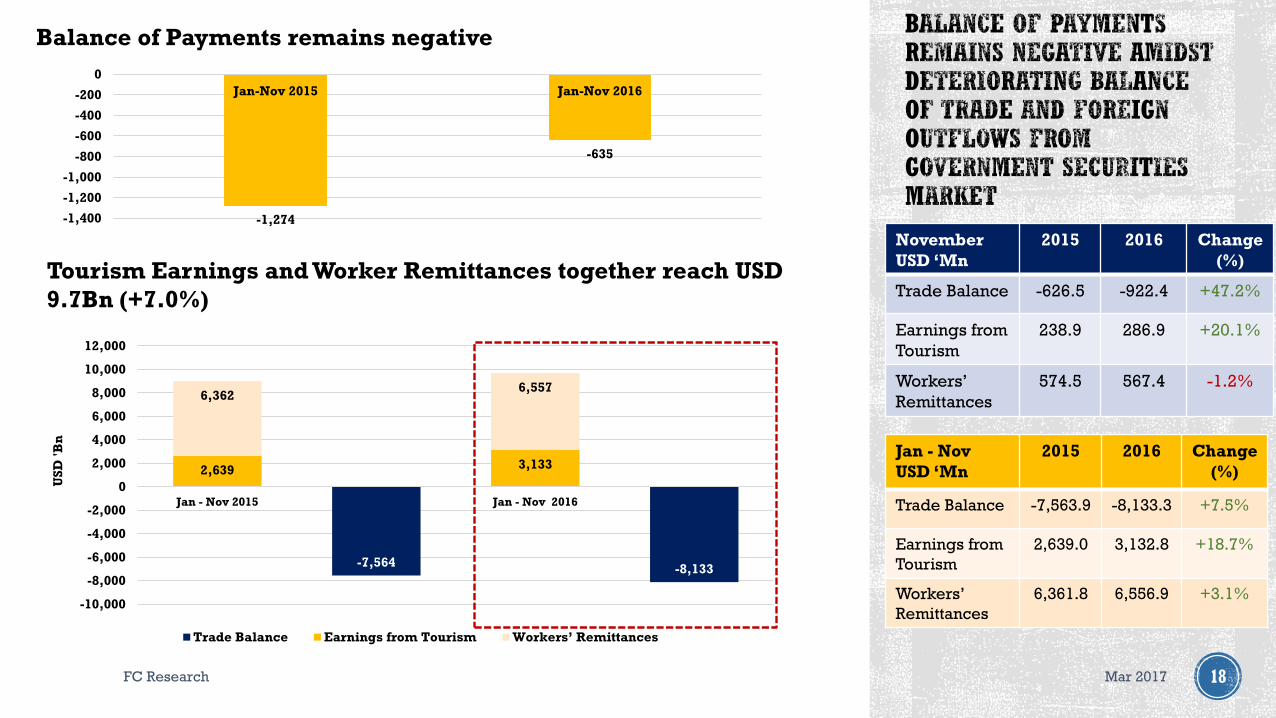
November
USD ‘Mn
2015 2016 Change
(%)
Trade Balance -626.5 -922.4 +47.2%
Earnings from
Tourism
238.9 286.9 +20.1%
Workers’
Remittances
574.5 567.4 -1.2%
Jan - Nov
USD ‘Mn
2015 2016 Change
(%)
Trade Balance -7,563.9 -8,133.3 +7.5%
Earnings from
Tourism
2,639.0 3,132.8 +18.7%
Workers’
Remittances
6,361.8 6,556.9 +3.1%
Balance of Payments remains negative
Tourism Earnings and Worker Remittances together reach USD
9.7Bn (+7.0%)
-1,274
-635
-1,400
-1,200
-1,000
-800
-600
-400
-200
0
Jan-Nov 2015 Jan-Nov 2016
-7,564-8,133
2,639 3,133
6,3626,557
-10,000
-8,000
-6,000
-4,000
-2,000
0
2,000
4,000
6,000
8,000
10,000
12,000
Jan - Nov 2015 Jan - Nov 2016
Trade Balance Earnings from Tourism Workers’ Remittances
US
D '
Bn
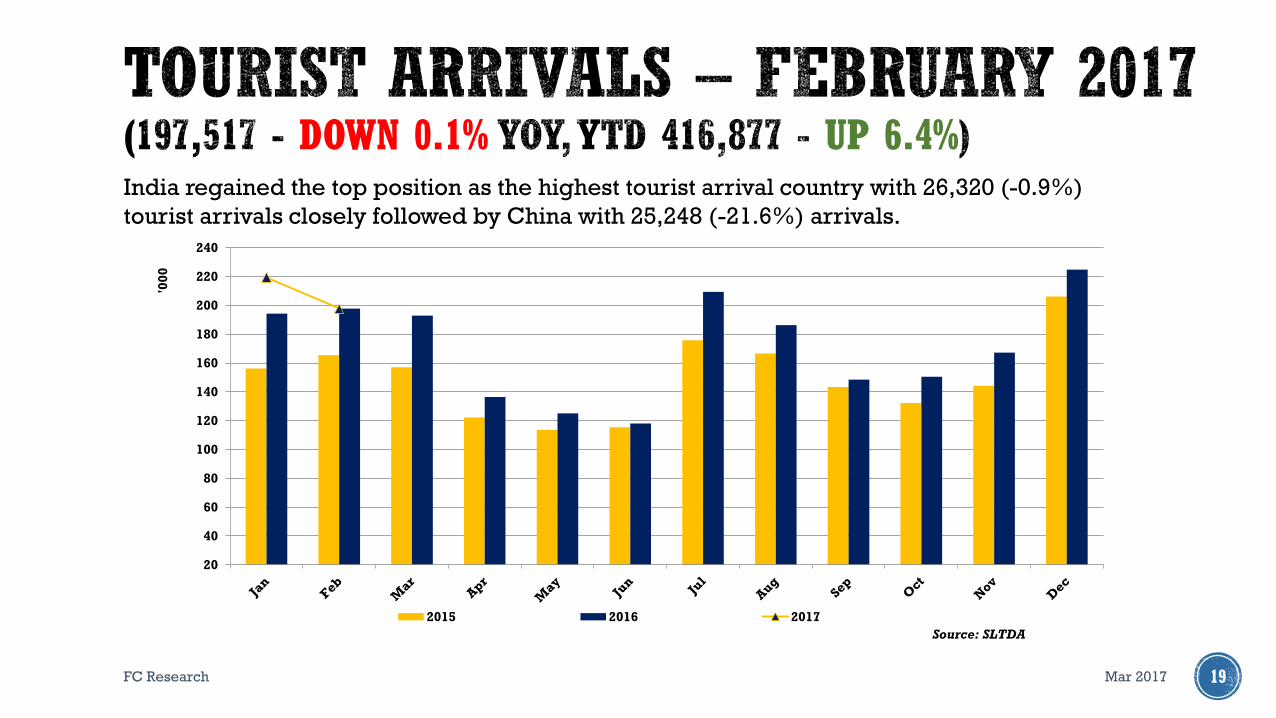
DOWN 0.1% UP 6.4%
Mar 2017FC Research 19
India regained the top position as the highest tourist arrival country with 26,320 (-0.9%)
tourist arrivals closely followed by China with 25,248 (-21.6%) arrivals.
20
40
60
80
100
120
140
160
180
200
220
240
'00
0
2015 2016 2017
Source: SLTDA
FC Research 20
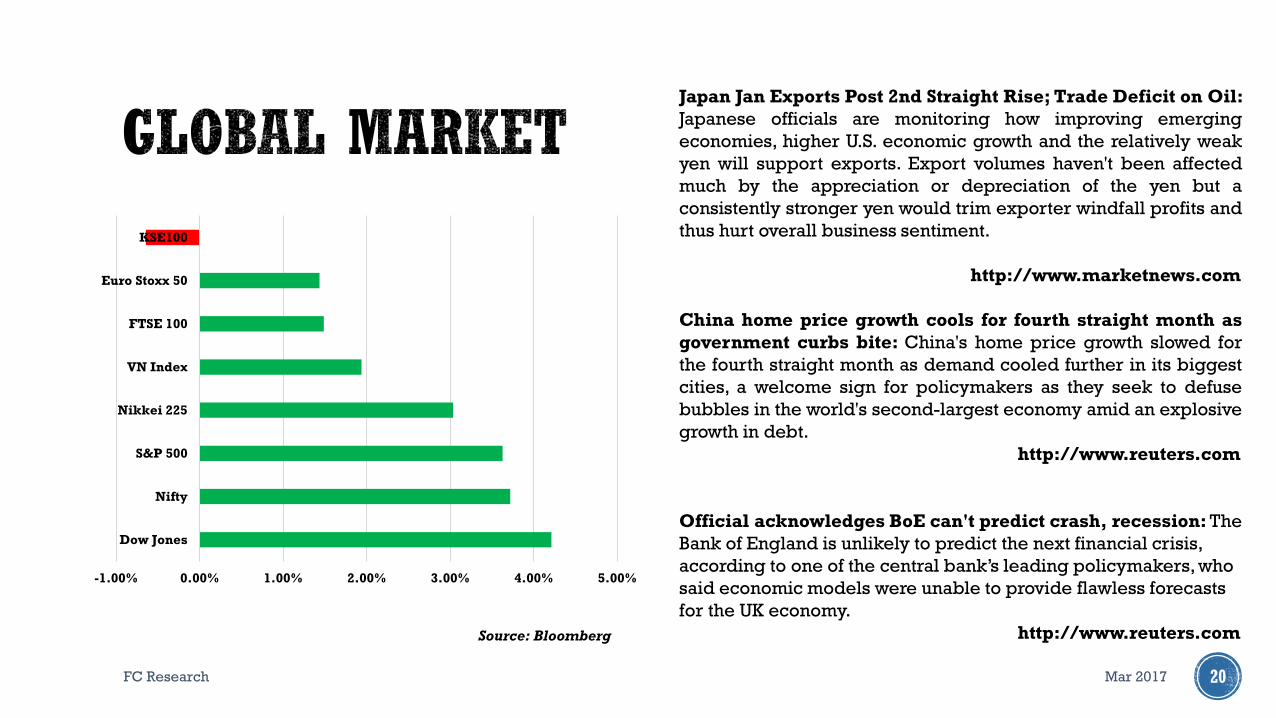
Japan Jan Exports Post 2nd Straight Rise; Trade Deficit on Oil:
Japanese officials are monitoring how improving emerging
economies, higher U.S. economic growth and the relatively weak
yen will support exports. Export volumes haven't been affected
much by the appreciation or depreciation of the yen but a
consistently stronger yen would trim exporter windfall profits and
thus hurt overall business sentiment.
http://www.marketnews.com
China home price growth cools for fourth straight month as
government curbs bite: China's home price growth slowed for
the fourth straight month as demand cooled further in its biggest
cities, a welcome sign for policymakers as they seek to defuse
bubbles in the world's second-largest economy amid an explosive
growth in debt.
http://www.reuters.com
Official acknowledges BoE can't predict crash, recession: The
Bank of England is unlikely to predict the next financial crisis,
according to one of the central bank’s leading policymakers, who
said economic models were unable to provide flawless forecasts
for the UK economy.
http://www.reuters.comSource: Bloomberg
Mar 2017
-1.00% 0.00% 1.00% 2.00% 3.00% 4.00% 5.00%
Dow Jones
Nifty
S&P 500
Nikkei 225
VN Index
FTSE 100
Euro Stoxx 50
KSE100
FC Research 21
This Review is prepared and issued by First Capital Equities (Pvt) Ltd. based on information in the public domain, internallydeveloped and other sources, believed to be correct. Although all reasonable care has been taken to ensure the contents ofthe review are accurate, First Capital Equities (Pvt) Ltd and/or its Directors, employees, are not responsible for thecorrectness, usefulness, reliability of same. First Capital Equities (Pvt) Ltd may act as a Broker in the investments which are thesubject of this document or related investments and may have acted on or used the information contained in this document, orthe research or analysis on which it is based, before its publication. First Capital Equities (Pvt) Ltd and/or its principal, theirrespective Directors, or Employees may also have a position or be otherwise interested in the investments referred to in thisdocument. This is not an offer to sell or buy the investments referred to in this document. This Review may contain data whichare inaccurate and unreliable. You hereby waive irrevocably any rights or remedies in law or equity you have or may haveagainst First Capital Equities (Pvt) Ltd with respect to the Review and agree to indemnify and hold First Capital Equities (Pvt)Ltd and/or its principal, their respective directors and employees harmless to the fullest extent allowed by law regarding allmatters related to your use of this Review. No part of this document may be reproduced, distributed or published in whole orin part by any means to any other person for any purpose without prior permission.
Mar 2017

CONTACT
FC Research +94 11 2639 898
• Amanda Lokugamage +94 11 2639 868
• Michelle Weerasinghe +94 11 2639 866
• Dimantha Mathew +94 11 2639 853
• Atchuthan Srirangan +94 11 2639 863
• Hansinee Beddage +94 11 2639 864
22