Embed Size (px)
Citation preview

VVoolluummee--1111,, IIssssuuee--11 JJuunnee--DDeecc 22001177 pppp.. 11--88 IImmppaacctt FFaaccttoorr 22..88 available online at www.csjournalss.com
AA UUGGCC RReeccoommmmeennddeedd JJoouurrnnaall Page| 1
PPrreeddiiccttiinngg SSttuuddeennttss PPeerrffoorrmmaannccee:: AAnn EEDDMM
AApppprrooaacchh 1Sneha Kumari,
2Dr. Anupam Bhatia
1M.phil. Scholar,
2Asstt. Professor
Deptt.of Computer Science and Applications,ChaudharyRanbir Singh University, Jind (haryana)
Abstract: Prediction about the student's performance is an integral part of an education system, as the overall growth of the
education system is directly proportional to the success rate of the students in their examinations. Therefore, there are many
situations where the performance of the students needs to be predicted.Data mining is a powerful tool which aims at discovering of useful information from large collections of data. Different data mining techniques and models have been
applied to this task.The main focus of this research work is to develop a predictive model based on student‟s data which can
predict the performance with high accuracy rates. To evaluate theperformance of studentsclassification task is used and from
many approaches that are used for data classification, the Naïve Bayes method is used in this research work. It takes students data as input and gives students upcoming performances.By using data mining classification algorithm, Naïve Bayes, we
obtained a model of almost 77.02% accuracy.The result generated helps the educational institutions along with students
develop a good understanding of how well or how poorly they would perform, and then develop a suitable learning strategy
so that identified students can be assisted more by the teachers and their performance is improved in future, which is beneficial for their individual results and also for academic institutions profile.
I. INTRODUCTION
Data Mining (DM) also known as Knowledge Discovery from Databases (KDD), is the field of discovering
novel and potentially useful information from the massive amount of data[1]. The objective of data mining is to
design and effort efficiently with a large amount of data sets.. It has also been defined as “the non trivial process
of identifying genuine, unique, probably useful and understandable patterns in data”[2]. Data mining
applications are greatly used in the field of education to efficiently manage and extract undiscovered knowledge
from educational data. Application of data mining technique in the Educational setting is called as Educational
Data Mining (EDM). EDM is a nexus of Data Mining, Statistics, Machine Learning, and Psychometrics.
Educational Data Mining (EDM) community website[3] defines EDM as follows: “Educational Data Mining
is an emerging discipline, concerned with developing methods for exploring the unique type of data that come
from educational settings and using those methods to better understand students and the settings which they
learn in”.According to Wikipedia “Educational Data Mining (EDM) refers to techniques, tools, and research
designed for automatically extracting meaning from large repositories of data generated by or related to people's
learning activities in educational settings”[4].EDM design models, tasks, algorithms, and techniques to explore a
large amount of educational data collected by the educational system from educational environments to discover
new knowledge about the students and understand them, for this various data mining techniques have been used
such as Decision Tree, Artificial Intelligence, Neural Network and other. The mined knowledge provides better
sight, facilitate and upgrade the educational process.
Predicting student academic performance has long been an key research area. Educational Institutes aims to
offer quality education to students to get better their behavior and improve the quality of managerial decisions.
High level of quality in education is achieved by discovering knowledge from educational information to study
the main attributes that may have an effect on the students‟ performance. The discovered knowledge help and
provide recommendations to the academic planners in education institutions to improve their decision-making
process, improve students‟ academic performance and reduce failure rates to better understand students
behavior, to assist instructors, to improve teaching etc.The ability to predict students‟ performance is very
important in aneducational environment. Student‟s academic performance is based on factors like personal,
social, demographic data etc.Therefore there are many situations where the performance of the students needs to
be predicted[5].
The prediction of student performance with high accuracy is beneficial for identifying the students with low
academic achievements. In addition, the prediction results may help students develop a good understanding of
how well or how poorly they would perform, and then develop a suitable learning strategyso that identified
students can be assisted more by the teachers and their performance is improved in future which is beneficial for
their individual results and also for academic institutions profile. Accurate prediction of student success is one
way to improve the quality of education and make available better educational services.

VVoolluummee--1111,, IIssssuuee--11 JJuunnee--DDeecc 22001177 pppp.. 11--88 IImmppaacctt FFaaccttoorr 22..88 available online at www.csjournalss.com
2
II. DATA DESCRIPTION
Data Preparation
In this study, data set is taken from www.doe.virginia.gov/statistics-reports/research-data/. The data set is in
excel sheet consists of students academic data. This data set contains 14 variables into 8 files, 2008 to 2015
applicants. There are approximately 5,00,000 records in this data set. The student dataset was a continuous data
and has been converted into nominal data.
Data Cleaning Integrated data was having missing values i.e. attribute value missing or noisy values. In this research missing
data elements are replaced with the average. Other options include replacing missing data elements with the
zero, the mean, or the mode, or to just leave it blank
Data Selection and Transformation
The attributes like Year, Federal race code, Gender, Disability flag, LEP flag, Disadvanced flag, Cohort count,
Diploma rate and Dropout rate were considered as relevant and Division number, Division name, School
number, School name were ignored as they are irrelevant to student performance analysis. The attribute Level
code consists – school, division, and state. For this research data related to school level code was selected.
All the variables which were derived from the database are given in table 1for reference.
Table 1- Selected Attributes Description
The domain values for some of the variables were defined for the present investigation as follows-
Federal race code - The Federal Race Code identifies one of the racial categories that most clearly reflect
the student's recognition of his or her community or with which th500tudent most closely identifies.The
valid values are 0=unspecified (used through the 2009-2010 school year), 1=American Indian/Alaska
Native, 2=Asian, 3=Black or African/American, 4=Hispanic of any race, 5=White, 6=Native
Hawaiian/Other Pacific Islander, 99=Two or more races, non-Hispanic (added in 2010-2011).
Disability flag - A person having an intellectual disability; hearing impairment, including deafness; speech
or language impairment; visual impairment, including blindness; serious emotional disturbance, other
health impairment; specific learning disability; deaf-blindness; or multiple disabilities and who, by reason
thereof, receive special education and related services. The valid values: Y = Yes or N = No
Attribute name Description Possible Values
School Year Calendar year
1(2008-2009), 2(2009-2010), 3(2010-2011),
4(2011-2012), 5(2012-2013), 6(2013-2014),
7(2014-2015)
Federal Race Code Students category
0-unspecified, 1 -American Indian, 2-Asian, 3 -
Black/African, 4 -Hispanic of any race, 5 -
White, 6 -other pacific islander, 99 - two or
more races
Gender Students sex Male, Female
Disability Flag Student with disability Yes (1), No(0)
LEP Flag Limited English Proficiency
Status
Yes(1), No(0)
Disadvantaged Flag Students with economically
disadvantaged status
Yes(1) ,No (0)
Cohort Count Number of students in cohort Between 0 to 500
Diploma Rate Graduation rate of students Between 0 to 100
Dropout Rate Number of students who dropout Between 0 to 100

VVoolluummee--1111,, IIssssuuee--11 JJuunnee--DDeecc 22001177 pppp.. 11--88 IImmppaacctt FFaaccttoorr 22..88 available online at www.csjournalss.com
3
LEP flag – LEP ( Limited English Proficiency Status)
Disadvantaged flag - A flag that identifies students as economically disadvantaged if they meet any one of
the following: 1) is eligible for Free/Reduced Meals, or 2) receives TANF, or 3) is eligible for Medicaid, or
4) identified as either Migrant or experiencing Homelessness. The valid values: Y = Yes or N = No
Cohort count – The number of students in the cohort. Virginia‟s graduation cohorts are defined as: group of
students who enter the ninth grade for the first time together with the expectation of graduating within four
years.
Diploma rate - Graduation rate is the percentage of students in a cohort who earn a diploma within four
years of entering the ninth grade.
Dropout rate - Dropout rate reflects the number of students who dropped out and did not re-enroll.
III. TOOLS AND TECHNIQUES
RAPID MINER –Rapid miner tool is used for exploration, statistical analysis and mining the students data.
Rapid Miner ( formally YALE i.e. Yet Another Learning Environment) is an OSS (Open Source Software)
under an OSI-certified open source license that may be used for Text Mining, Machine Learning, Predictive
and Business Analysis as well as for Research, Education Training, Application Development and supports
all steps of the Data Mining process. Rapid Miner provides a easy to use drag-drop interface without the
need of any programming skills. RapidMiner Studio is a powerful visual design environment for rapidly
building complete predictive analytic workflows. This all-in-one tool features hundreds of pre-defined data
preparation and machine learning algorithms to support all your data science projects[12].
CLASSIFICATION - Classification is one of the most commonly applied supervised learning techniques,
which employs a set of pre-classified examples to build a model that can classify the population of records
at large[6]. The objective of classification is to predict the future outcome based on the existing data.
Classification is the most often studied problems by Data Mining and Machine learning researchers. A
classifier, or classification model, predicts categorical labels (classes)[7]. A classification model is
considered by analyzing the relationship between the attributes and the class of objects in the training set.
Such classification model can be used to classify future objects and develop understanding of the classes of
objects in the databases.
The classification process involves two steps: learning and classification. In the learning step, a model that
describes a predetermined set of classes or concepts is made by examining a set of the training dataset. The
models are generally in the form of classification rules. In the classification step, the model is put to test
using a different data set that is used to estimate the predictive accuracy of the model. If the model accuracy
is considered acceptable, the model can be applied to classify the dataset for which the class label is not
known in advance[8].
Therefore, the Educational Institute‟s is trying to predict the future result of their registered students based
on their existing previous and current student‟s data, that make classification one of the techniques better
suited for educational analysis[9]. Basic techniques for classification are Decision Tree Induction, Bayesian
Classification, and Neural Networks. Other approaches like Genetic Algorithms, Rough Sets, Fuzzy Logic,
Case-Based Reasoning can also be used for classification.
NAÏVE BAYES - The Naive Bayes algorithm is a statistical classifier that calculates a set of probabilities
by counting the frequency and combinations of values in a given data set[10]. They can predict class
membership probabilities, such as the probability that a given tuple belongs to a particular class.It
represents a predictive approach to make predictions on values of data using known results found from
different data. Also, the output from the prediction model using Naïve Bayes can be easily interpreted into
the understandable human language.
A naive Bayes (NB) classifier is a simple probabilistic classifier based on (a) Bayes theorem, (b) strong
(naive) independence assumptions, and (c) independent feature models. It is also an important mining
classifier for data mining and applied in many real-world classification problems because of its high
classification performance. An NB classifier can easily handle missing attribute values by simply omitting
the corresponding probabilities for those attributes when calculating the likelihood of membership for each
class. The NB classifier also requires the class conditional independence, i.e. the effect of an attribute on a
given class is independent of these of other attributes.

VVoolluummee--1111,, IIssssuuee--11 JJuunnee--DDeecc 22001177 pppp.. 11--88 IImmppaacctt FFaaccttoorr 22..88 available online at www.csjournalss.com
4
Naïve Bayes algorithm Pseudo Code
Given a training dataset, D = {X1,X2...Xn}, each data record is represented as, Xi = {x1, x2... xn}.
D contains the following attributes {A1,A2... An} and each attribute Ai contains the following
attribute values{Ai1, Ai2... Ain}. The attribute values can be discrete or continuous. D also
contains a set of classes C = {C1, C2,Cm}. Each training instance, X ∈ D, has a particular class
label Ci.
For a test instance, X, the classifier will predict that X belongs to the class with the highest
posterior probability, conditioned on X. That is, the NB classifier predicts that the instance X
belongs to the class Ci, if and only if
P(Ci|X) > p(Cj|X) for 1 ≤ j ≤ m,j 6= i.
Thus we find that the class Ci for which P(Ci|X) is maximized is called the Maximum Posteriori
Hypothesis. By Bayes‟ theoremP(Ci|X) =P(X|Ci)P(Ci) /P(X)
In this theorem, as P(X) is constant for all classes, only P(X|Ci )P(Ci) needs to be maximized. If
the class prior probabilities are not known, then it is commonly assumed that the classes are
equally likely, that is P(C1) = P(C2) = ··· = P(Cm), and we would therefore maximize P(Ci).
Otherwise, maximize P(X|Ci)P(Ci). The class prior probabilities are calculated by P(Ci) =
|Ci,D|/|D|, where |Ci,D is the number of training instances belonging to the class Ci in D.
To compute P(X|Ci) in a dataset with many attributes is extremely computationally expensive.
Thus, the naive assumption of class conditional independence is made in order to reduce
computation in evaluating P(X|Ci). The attributes are conditionally independent of another, given
the class label of the instance. Thus eq 1 and eq 2 are used to produce P(X|Ci)[11].
P(X|Ci) = n
k=1P(xk|Ci).............................................................(1)
P(X|Ci) = P(x1|Ci)×P(x2|Ci)×···×P(xn|Ci)……………………..(2)
EVALUATION AND ANALYSIS
The analysis is performed using Rapid Miner studio. In this paper, Naïve Bayes in Rapid Miner is utilized to
construct the prediction model. The data is imported from Excel File to Rapid Miner using the Read CSV
operator. Data was retrieved using the retrieve operator and data was passed to the operator named “cross-
validation. The set role and discretize operator is used are preprocessing step. Cross-validation is applied to
evaluate and find the accuracy of the model. Cross-validation operator is a nested operator; it has two sub-
processes testing and training.
Testing & Training- These are the sub-processes of validation operator (figure 2). The training subprocess is
used for training a model. The trained model is then applied in the testing sub-process. During the testing phase
performance of the model is also measured. During the training phase of cross-validation, naïve Bayes operator
is used to training the model and in testing phase Apply Model operator is used to test the model. Performance
operator is used for performance evaluation.
Figure 1 – Representing the Model for Data Analysis

VVoolluummee--1111,, IIssssuuee--11 JJuunnee--DDeecc 22001177 pppp.. 11--88 IImmppaacctt FFaaccttoorr 22..88 available online at www.csjournalss.com
5
Figure 2 - Testing and Training (Cross-Validation) of Model
I. RESULTS
Rapid Miner Performance operator provides several options to check the model validity: accuracy, precision,
recall, and AUC charts(AUC (optimistic), AUC and AUC (pessimistic)) and, themodel accuracy is 77.04%
(figure- 3).
Figure 3- Shows the Accuracy of the Model
Figure 4 – Precision of the Model
VVoolluummee--1111,, IIssssuuee--11 JJuunnee--DDeecc 22001177 pppp.. 11--88 IImmppaacctt FFaaccttoorr 22..88 available online at www.csjournalss.com
6
Figure 5 – Recall Table View
Figure 6 – AUC (Neutral)
Figure 7 - Description of Performance Vector
VVoolluummee--1111,, IIssssuuee--11 JJuunnee--DDeecc 22001177 pppp.. 11--88 IImmppaacctt FFaaccttoorr 22..88 available online at www.csjournalss.com
7
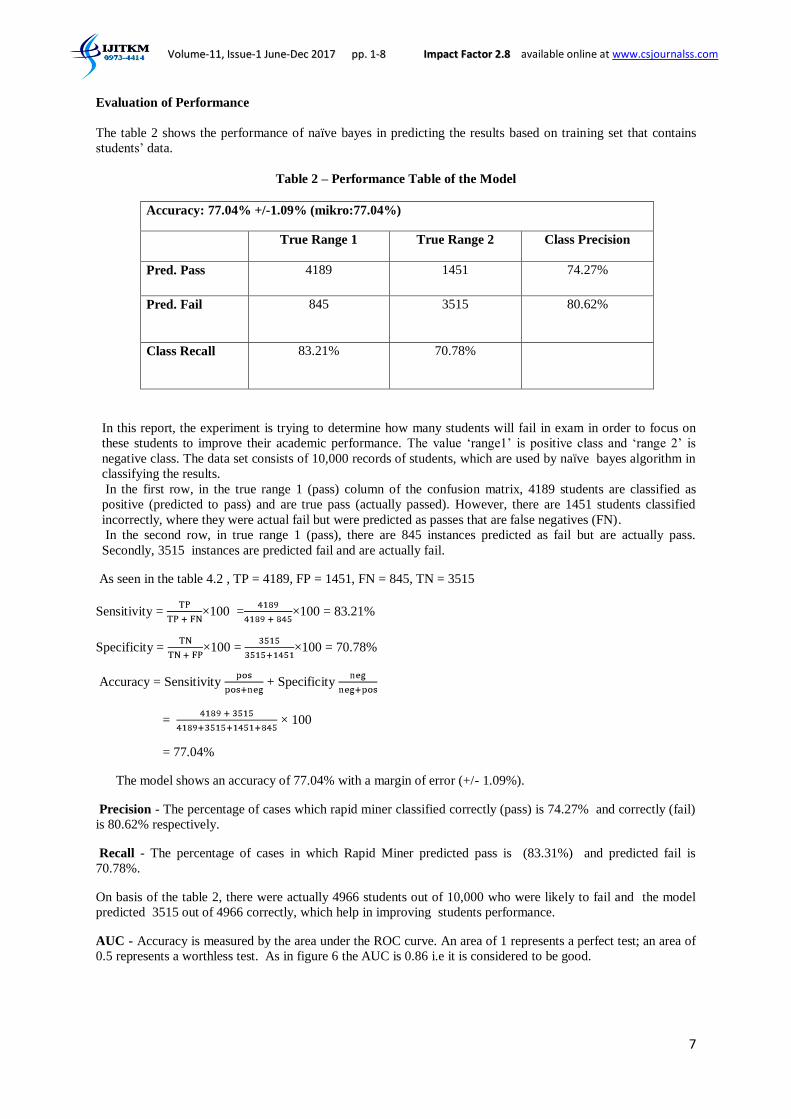
Evaluation of Performance
The table 2 shows the performance of naïve bayes in predicting the results based on training set that contains
students‟ data.
Table 2 – Performance Table of the Model
Accuracy: 77.04% +/-1.09% (mikro:77.04%)
True Range 1 True Range 2 Class Precision
Pred. Pass 4189 1451 74.27%
Pred. Fail 845
3515 80.62%
Class Recall 83.21%
70.78%
In this report, the experiment is trying to determine how many students will fail in exam in order to focus on
these students to improve their academic performance. The value „range1‟ is positive class and „range 2‟ is
negative class. The data set consists of 10,000 records of students, which are used by naïve bayes algorithm in
classifying the results.
In the first row, in the true range 1 (pass) column of the confusion matrix, 4189 students are classified as
positive (predicted to pass) and are true pass (actually passed). However, there are 1451 students classified
incorrectly, where they were actual fail but were predicted as passes that are false negatives (FN).
In the second row, in true range 1 (pass), there are 845 instances predicted as fail but are actually pass.
Secondly, 3515 instances are predicted fail and are actually fail.
As seen in the table 4.2 , TP = 4189, FP = 1451, FN = 845, TN = 3515
Sensitivity = ×100 = ×100 = 83.21%
Specificity = ×100 = ×100 = 70.78%
Accuracy = Sensitivity + Specificity
= × 100
= 77.04%
The model shows an accuracy of 77.04% with a margin of error (+/- 1.09%).
Precision - The percentage of cases which rapid miner classified correctly (pass) is 74.27% and correctly (fail)
is 80.62% respectively.
Recall - The percentage of cases in which Rapid Miner predicted pass is (83.31%) and predicted fail is
70.78%.
On basis of the table 2, there were actually 4966 students out of 10,000 who were likely to fail and the model
predicted 3515 out of 4966 correctly, which help in improving students performance.
AUC - Accuracy is measured by the area under the ROC curve. An area of 1 represents a perfect test; an area of
0.5 represents a worthless test. As in figure 6 the AUC is 0.86 i.e it is considered to be good.

VVoolluummee--1111,, IIssssuuee--11 JJuunnee--DDeecc 22001177 pppp.. 11--88 IImmppaacctt FFaaccttoorr 22..88 available online at www.csjournalss.com
8
The performance of the model in terms of accuracy, precision, recall.we have concluded that the naïve Bayes
produces the accuracy 77.04. The model also produced precision 80.66% and recall 83.21% that shows it is
possible to obtain a good prediction model.
IV. CONCLUSION AND FUTURE WORK
In this study, a model was developed based on some selected input variables. Out of all input variables, some of
most influencing factors were identified and taken to predict the student‟s academic performance. Data mining
classification algorithm naïve Bayes was applied to predict the performance of students on the basis of previous
year student database. The tool Rapid miner 7.3.01 is used for exploration, statistical analysis, and mining of
student data. Cross-Validation operator is used to performing a cross-validation process. From the above
analysis, we have concluded that the naïve Bayes produces the accuracy 77.04%, precision 80.66% and recall
83.21% that shows it is possible to obtain a good prediction model.The proposed methodology can be adopted to
predict the performance of students and help the teachers as well as the students to enhance the quality of
learning and student‟s performance by taking significance decision at right time.
In future work, the study can be enhanced by including the data with more information about the students and of
higher quality which might help to improve the current model performance and also to obtain more accurate
student performance and to determine student behavior. Also, the work could be carried out with other modern
techniques to acquire a wider approach and more reliable outputs.
REFERENCES
1. S. G. Kulkarni, G. C. Rampure, and B. Yadav, “Understanding Educational Data Mining ( EDM ),” pp.
773–777, 1956.
2. M. Computing, “Predictive Data Mining : A Generalized Approach,” vol. 3, no. 1, pp. 519–525, 2014.
3. “Home | International Educational Data Mining Society.” [Online]. Available:
http://www.educationaldatamining.org/. [Accessed: 22-May-2017].
4. EducationalDataMining.org. 2013.
5. S. Taruna and M. Pandey, “An Empirical Analysis of Classification Techniques for Predicting Academic
Performance,” pp. 523–528, 2014.
6. B. Ramageri, “Data mining techniques and applications,” Indian J. Comput. Sci. …, vol. 1, no. 4, pp. 301–
305, 2010.
7. A. D. Kumar and V. Radhika, “A Survey on Predicting Student Performance,” vol. 5, no. 5, pp. 6147–6149,
2014.
8. J. Ruby and K. David, “Analysis of Influencing Factors in Predicting Students Performance Using MLP -A
Comparative Study,” Int. J. Innov. Res. Comput. Commun. Eng. (An ISO Certif. Organ., vol. 3297, no. 2,
pp. 1085–1092, 2007.
9. M. A. Al-Barrak and M. Al-Razgan, “Predicting Students Final GPA Using Decision Trees: A Case Study,”
Int. J. Inf. Educ. Technol., vol. 6, no. 7, pp. 528–533, 2016.
10. S. R. Dash and S. Dehuri, “Comparative Study of Different Classification Techniques for Post Operative
Patient Dataset,” Int. J. Innov. Res. Comput. Communucation Eng., vol. 1, no. 5, pp. 1101–1108, 2013.
11. P. Sharma, D. Singh, and A. Singh, “Classification Algorithms on a Large Continuous Random Dataset
Using Rapid,” Ieee Spons. 2Nd Int. Conf. Electron. Commun. Syst. 2015), no. Icecs, pp. 704–709, 2015.
12. “RapidMiner Studi o Manual.”


![Pertemuan-2 Referensi OSI [Read-Only] - blog.stikom.edublog.stikom.edu/anjik/files/2012/08/OSI-Model.pdf · Model Referensi OSI • OSI memberikan pandangan yang "abstrak" dari arsitektur](https://img.pdfslide.tips/doc/110x75/5b33f09e7f8b9a330e8b9436/pertemuan-2-referensi-osi-read-only-blog-model-referensi-osi-osi-memberikan.jpg)


![Escopo CQuiM E 007 2018 - ipt.br · LL] dS oes OOÊ-OLCLO aepue 'eF!lned OSI OSI OSI OSI OSI OSI OSI ap ap s! a»cal soppaL a 'suq!å cnnpo.ld/ ap ealV ov5vruv aa vauv epepyen ep](https://img.pdfslide.tips/doc/110x75/5be6643209d3f28a428dca85/escopo-cquim-e-007-2018-iptbr-ll-ds-oes-ooe-olclo-aepue-eflned-osi-osi.jpg)