Embed Size (px)
Citation preview
RESEARCH Open Access
Practices of algorithm education based ondiscovery learning using a programvisualization systemKoichi Yamashita1*, Ryota Fujioka2, Satoru Kogure3, Yasuhiro Noguchi3, Tatsuhiro Konishi3 and Yukihiro Itoh4
* Correspondence:[email protected] of Business Administration,Tokoha University, 1230 Miyakoda,Kita-ku, Hamamatsu, Shizuoka431-2102, JapanFull list of author information isavailable at the end of the article
Abstract
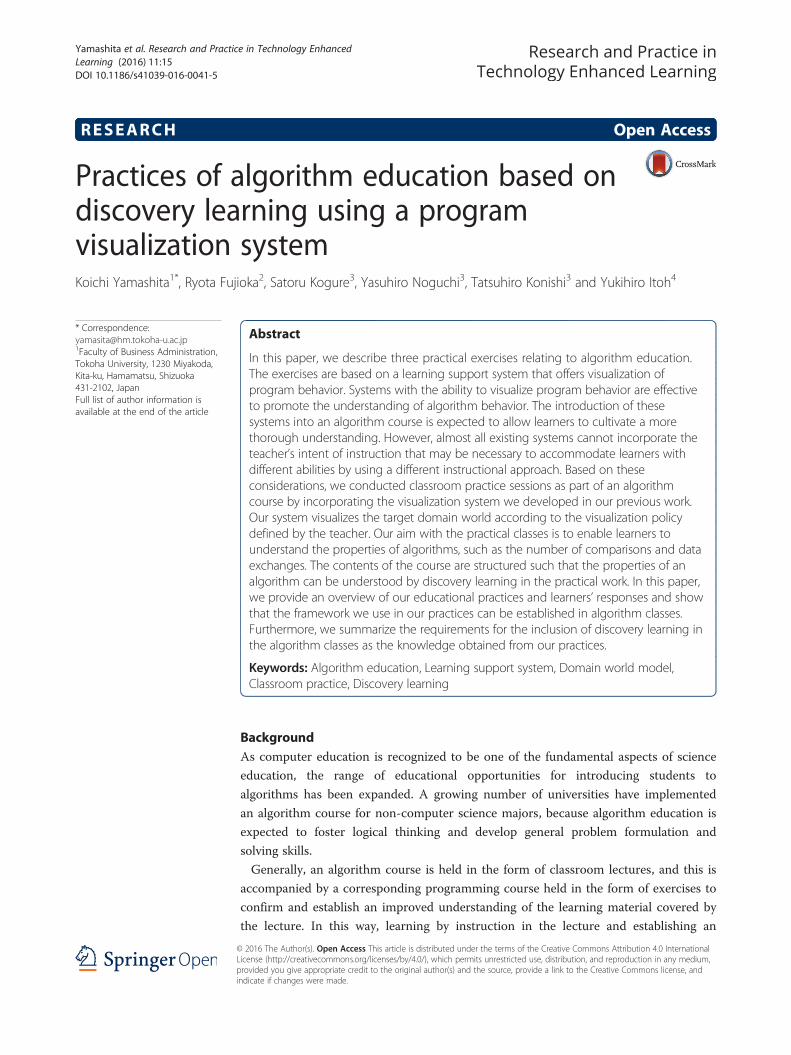
In this paper, we describe three practical exercises relating to algorithm education.The exercises are based on a learning support system that offers visualization ofprogram behavior. Systems with the ability to visualize program behavior are effectiveto promote the understanding of algorithm behavior. The introduction of thesesystems into an algorithm course is expected to allow learners to cultivate a morethorough understanding. However, almost all existing systems cannot incorporate theteacher’s intent of instruction that may be necessary to accommodate learners withdifferent abilities by using a different instructional approach. Based on theseconsiderations, we conducted classroom practice sessions as part of an algorithmcourse by incorporating the visualization system we developed in our previous work.Our system visualizes the target domain world according to the visualization policydefined by the teacher. Our aim with the practical classes is to enable learners tounderstand the properties of algorithms, such as the number of comparisons and dataexchanges. The contents of the course are structured such that the properties of analgorithm can be understood by discovery learning in the practical work. In this paper,we provide an overview of our educational practices and learners’ responses and showthat the framework we use in our practices can be established in algorithm classes.Furthermore, we summarize the requirements for the inclusion of discovery learning inthe algorithm classes as the knowledge obtained from our practices.
Keywords: Algorithm education, Learning support system, Domain world model,Classroom practice, Discovery learning
BackgroundAs computer education is recognized to be one of the fundamental aspects of science
education, the range of educational opportunities for introducing students to
algorithms has been expanded. A growing number of universities have implemented
an algorithm course for non-computer science majors, because algorithm education is
expected to foster logical thinking and develop general problem formulation and
solving skills.
Generally, an algorithm course is held in the form of classroom lectures, and this is
accompanied by a corresponding programming course held in the form of exercises to
confirm and establish an improved understanding of the learning material covered by
the lecture. In this way, learning by instruction in the lecture and establishing an
© 2016 The Author(s). Open Access This article is distributed under the terms of the Creative Commons Attribution 4.0 InternationalLicense (http://creativecommons.org/licenses/by/4.0/), which permits unrestricted use, distribution, and reproduction in any medium,provided you give appropriate credit to the original author(s) and the source, provide a link to the Creative Commons license, andindicate if changes were made.
Yamashita et al. Research and Practice in Technology EnhancedLearning (2016) 11:15 DOI 10.1186/s41039-016-0041-5
understanding by exercising construct a learning cycle. The cycle enables learners to
understand algorithms as the essence of problem solving and program code as the for-
mal representation of algorithm externalization. However, according to our classroom
experience, a number of learners are unable to develop the learning style required for
this cycle and reach an impasse. We consider this to be the consequence of them pro-
ceeding to the programming exercise without sufficient understanding of the
algorithm.
To date, several learning support systems have been developed to support novice
learners to understand algorithms (Pears et al., 2007). These systems visualize the way
objects of program code and the algorithm are processed (i.e., the target domain world)
and reproduce the behavior of the code and the algorithm. Introducing these systems
into classes is expected to allow learners to cultivate an improved understanding of al-
gorithms (Robins et al., 2003).
However, the expansion of the range of educational opportunities has increasingly re-
quired teachers to teach learners with various levels of background knowledge. De-
pending on learners’ prior knowledge, a teacher would have to adjust the content or
intent of instructions, such as the point where the learners should focus on the algo-
rithm or program, or the abstraction or generalization degree of instruction. Almost all
of the existing systems disallow these variations of the teacher’s intent and visualize the
world of the target domain with a fixed visualization policy. Moreover, although exist-
ing systems tend to focus on reproducing the entire flow of algorithm behavior, know-
ledge related to the algorithm is also important in algorithm education. For example,
properties of an algorithm such as the number of comparisons or exchanges in sorting
tasks are an important learning target.
In this paper, we describe the classroom practice of our algorithm course, based
on these considerations. We introduced the learning support system developed in
our previous work (Kogure et al., 2014) into the class. Our system visualizes the
target domain world according to the visualization policy defined by the teacher.
In addition, the contents of our practice not only include using our system to learn
about the entire flow representing the behavior of an algorithm but also discovery
learning about the properties of the algorithm. Learners’ reactions suggest that it
would be possible to successfully establish the framework of our practice in algo-
rithm classes.
Preceding workBasic idea
Systems supporting novice learners to learn an algorithm or program visualize its be-
havior in the target domain world. The learners understand the structure of the world
and the principles to control the behavior in the world by using visualization. These
systems include TRALKA2 (Malmi et al., 2004), Jeliot3 (Ben-Ari et al., 2011), ViLLE
(Rajala et al., 2008), iList (Fossati et al., 2008), and LEPA (Yamashita et al., 2016).
Learners understand the structure of the world by observing logical data structures vi-
sualized automatically by the system based on the provided algorithm or program code.
Moreover, learners understand the algorithm or program code as the principles of
behavior in the world by observing the changes in the status of the domain world as vi-
sualized in a step-by-step manner by the system.
Yamashita et al. Research and Practice in Technology Enhanced Learning (2016) 11:15 Page 2 of 19
In many existing systems, the policies for visualizing the target domain world are
pre-defined by the system developer. This may be an obstacle for a teacher who plans
to introduce the system into actual classes. Teachers often explain various concepts by
visualizations and change their policy of visualization depending on the learners. For
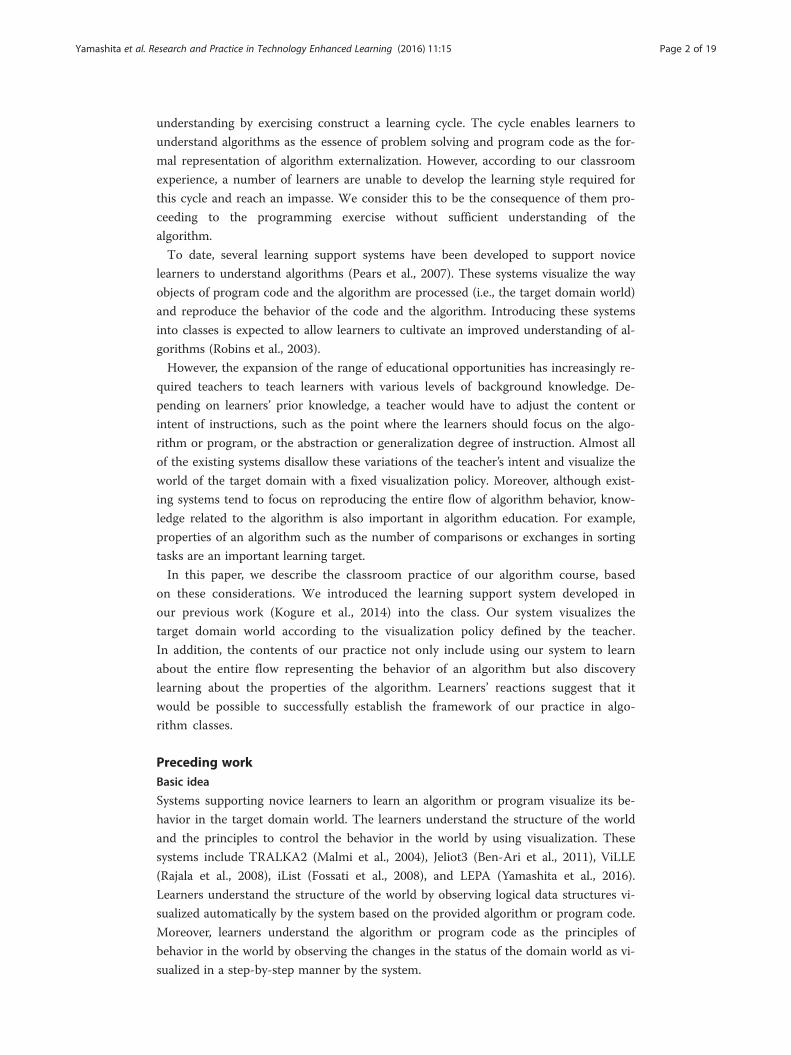
example, a teacher may draw an array object using a horizontal layout when the in-
struction target is sorting of the array (as in Fig. 1), whereas the teacher may draw it by
using a vertical layout for a stack. Changes such as these in the visualization policy are
derived by adjusting the contents of the instruction to learners’ background knowledge.
For example, once learners sufficiently understand a stack, representing an object using
either a horizontal or vertical layout will be acceptable to them. Similarly, when teach-
ing non-novice learners, the teacher would not need to draw the temporary variable in
a task in which the values of two variables are exchanged.
Typically, visualized data structures are displayed to learners by showing them
slides and/or movies produced with presentation and video editing software. Never-
theless, these materials cannot be used for certain learning activities, such as when
learners are required to observe program behavior where input data are changed
individually, because the input data are fixed. Other methods that would allow
learners to change the input data would involve providing target program that in-
cludes graphic drawing functions. However, this would also not be realistic because
it might burden teachers with troublesome coding, such as creating, updating, and
deleting drawing objects with name resolution that involves namespaces, scopes,
and so on.
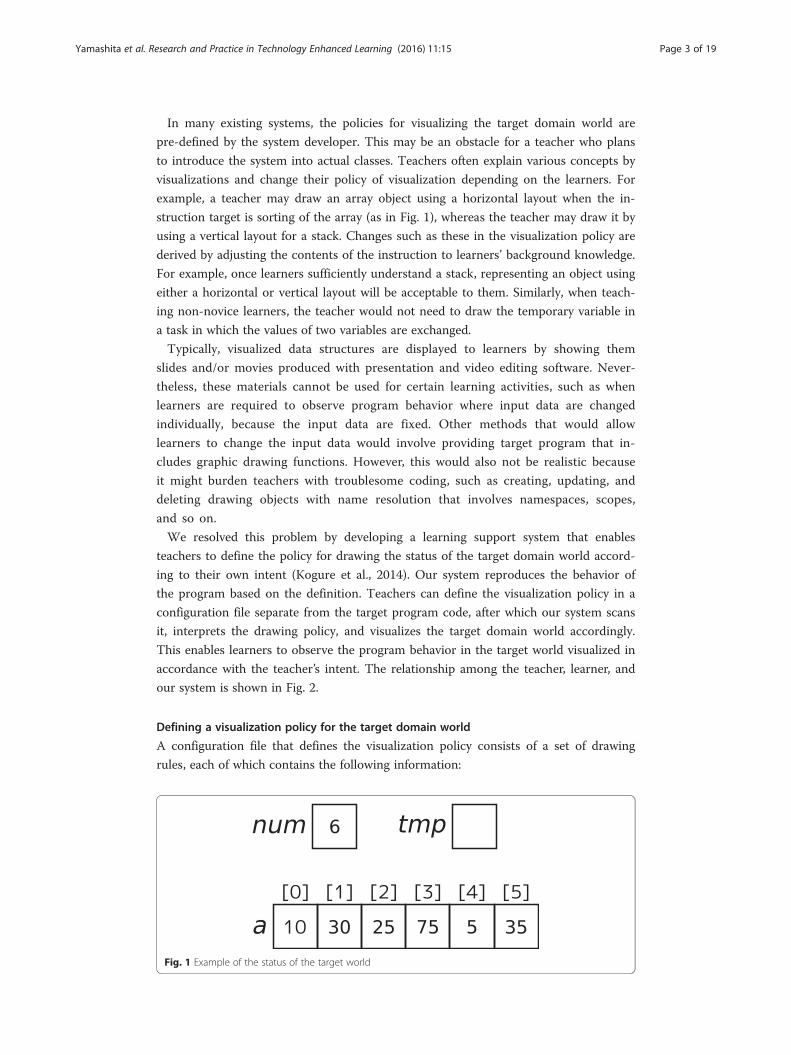
We resolved this problem by developing a learning support system that enables
teachers to define the policy for drawing the status of the target domain world accord-
ing to their own intent (Kogure et al., 2014). Our system reproduces the behavior of
the program based on the definition. Teachers can define the visualization policy in a
configuration file separate from the target program code, after which our system scans
it, interprets the drawing policy, and visualizes the target domain world accordingly.
This enables learners to observe the program behavior in the target world visualized in
accordance with the teacher’s intent. The relationship among the teacher, learner, and
our system is shown in Fig. 2.
Defining a visualization policy for the target domain world
A configuration file that defines the visualization policy consists of a set of drawing
rules, each of which contains the following information:
Fig. 1 Example of the status of the target world
Yamashita et al. Research and Practice in Technology Enhanced Learning (2016) 11:15 Page 3 of 19
� Condition to actuate the drawing operation
� Operation to edit the target drawing object
� Identifier of the target drawing object
� Type of target drawing object
� Attributes for the drawing operation
We selected the available object and attribute types by examining actual teaching ma-
terials for algorithm and programming education in the faculties to which the authors
are affiliated. Table 1 provides a list of the available types, operations, and attributes.
Circle, square, and rectangle objects are mainly used to express directly the value of the
variable in the target program. The table object mainly expresses an array. Connector
and line objects express a relationship between the two objects, and label and balloon
objects are used to describe program behavior or the role of an object in natural
language.
Teachers can specify a condition for actuating the drawing operation by referencing
the statement number (statement ID) or variables in the target program, such as “when
a certain statement is executed,” or “when the value of a certain variable satisfies the
condition.” A condition can be expressed with six types of comparison operators, ==,
!=, >=, <=, <, and >, and three types of operands, i.e., the immediate number, a variable
in the target program, and the statement ID.
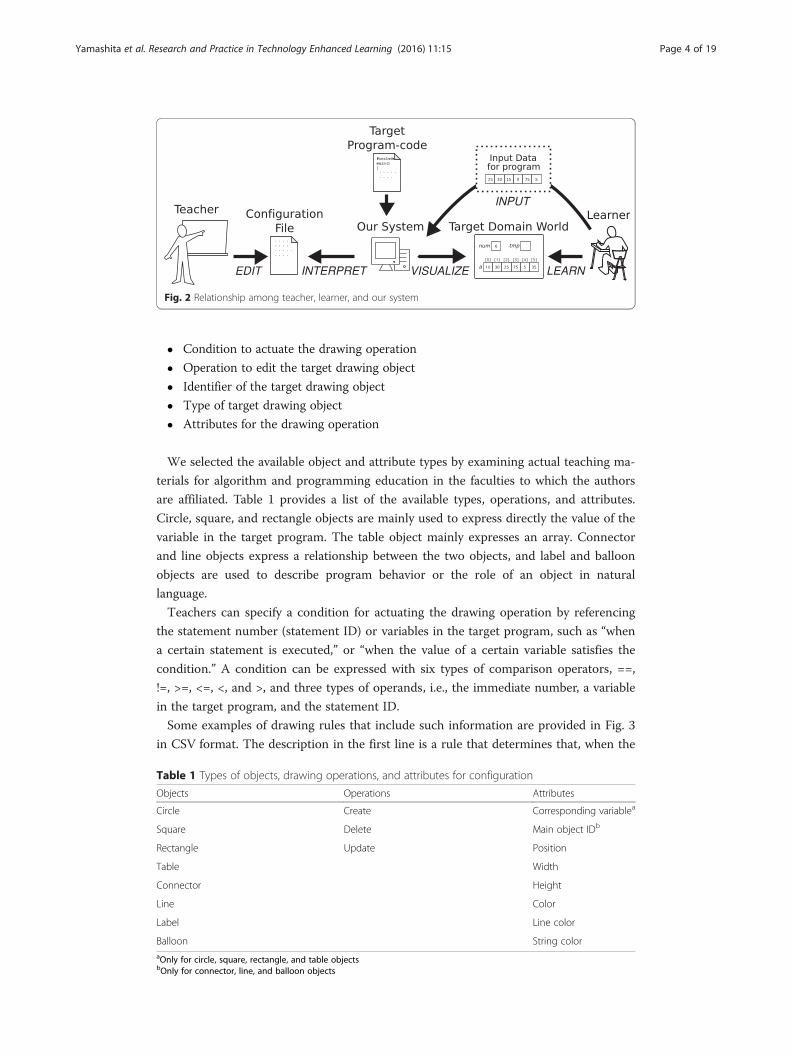
Some examples of drawing rules that include such information are provided in Fig. 3
in CSV format. The description in the first line is a rule that determines that, when the
Fig. 2 Relationship among teacher, learner, and our system
Table 1 Types of objects, drawing operations, and attributes for configuration
Objects Operations Attributes
Circle Create Corresponding variablea
Square Delete Main object IDb
Rectangle Update Position
Table Width
Connector Height
Line Color
Label Line color
Balloon String coloraOnly for circle, square, rectangle, and table objectsbOnly for connector, line, and balloon objects
Yamashita et al. Research and Practice in Technology Enhanced Learning (2016) 11:15 Page 4 of 19
statement with ID “3” in the target program is executed, our system draws a circle ob-
ject and assigns the object ID “OBJ1” to it. The corresponding variable is described as
“low,” and hence the value of the variable low is drawn inside OBJ1. OBJ1 is drawn at
position (“X1,” “Y1”) with a line, background, and inner character colors of “black,”
“white,” and “black,” respectively, according to the description in the rule. The rule in
the second line means that when the statement with ID “5” is executed, the line color
of the already visualized object “OBJ1” is updated to “red.” The last line is the rule that
when variable “j” has a value that is greater than “i” in the target program, the inner
character color of “OBJ1” is updated to “blue.”
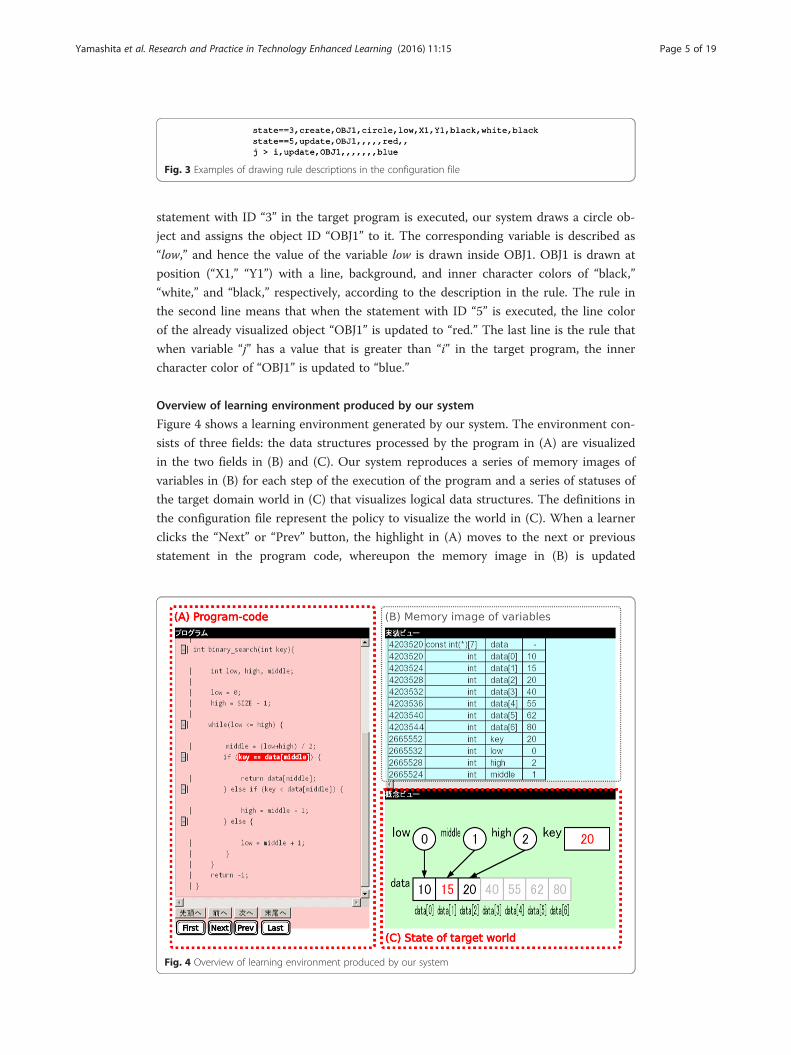
Overview of learning environment produced by our system
Figure 4 shows a learning environment generated by our system. The environment con-
sists of three fields: the data structures processed by the program in (A) are visualized
in the two fields in (B) and (C). Our system reproduces a series of memory images of
variables in (B) for each step of the execution of the program and a series of statuses of
the target domain world in (C) that visualizes logical data structures. The definitions in
the configuration file represent the policy to visualize the world in (C). When a learner
clicks the “Next” or “Prev” button, the highlight in (A) moves to the next or previous
statement in the program code, whereupon the memory image in (B) is updated
Fig. 3 Examples of drawing rule descriptions in the configuration file
Fig. 4 Overview of learning environment produced by our system
Yamashita et al. Research and Practice in Technology Enhanced Learning (2016) 11:15 Page 5 of 19
according to the values of the variables after executing the highlighted statement, and
the corresponding status of the target domain world is visualized in (C). Our system
simulates the statement execution step by step so that the learner can understand the
program behavior by observing the changes in the target domain world in (C). More-
over, if there are some connector objects or descriptions with label and balloon objects
reflecting instructions in a class, they will assist the learner to understand the program
behavior. Field (B) represents the status of the memory image, which is implemented
for the learning target that needs to reference the main memory, such as a pointer.
The learning environment in Fig. 4 is an instance for observing the behavior of a bin-
ary search program. We needed to describe 31 drawing rules to define the visualization
in (C) for this environment.
Preliminary experiment
We conducted a small preliminary experiment in order to evaluate the difficulty of
preparing teaching material by the rule definitions in our system. The subjects in the
experiment were one Master’s student and two undergraduate students with their cap-
acity to perform the role as teaching assistant. We measured the time required for the
subjects to prepare teaching materials by using the rule definitions in the following
manner: first, we provided each subject with sufficient tutorials to enable them to pro-
duce teaching materials by the rule definitions in our system. Next, we presented the
subjects with the program code for selection sort and requested them to describe the
rule set required to visualize the program behavior in the target domain world. Our re-
quest included conveying that each subject has to implement the visualization policy
pre-established by us. After completing the rule definition, we requested the subjects to
create slide materials using PowerPoint with the same content and behavior as the ma-
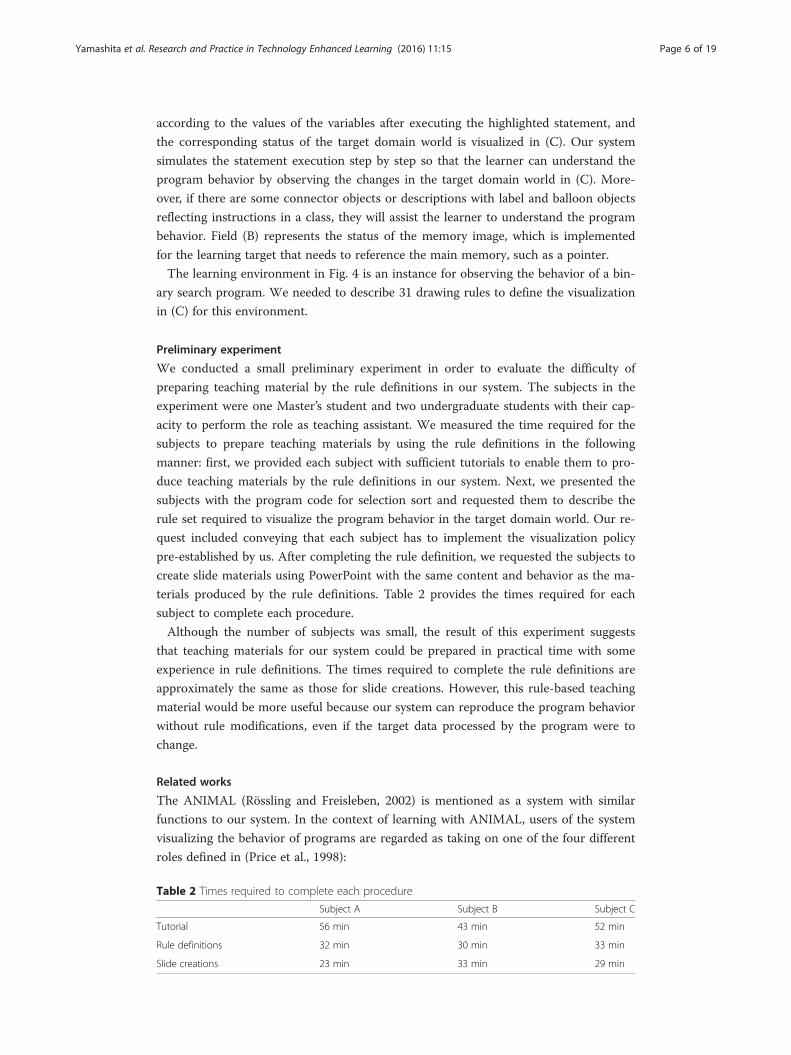
terials produced by the rule definitions. Table 2 provides the times required for each
subject to complete each procedure.
Although the number of subjects was small, the result of this experiment suggests
that teaching materials for our system could be prepared in practical time with some
experience in rule definitions. The times required to complete the rule definitions are
approximately the same as those for slide creations. However, this rule-based teaching
material would be more useful because our system can reproduce the program behavior
without rule modifications, even if the target data processed by the program were to
change.
Related works
The ANIMAL (Rössling and Freisleben, 2002) is mentioned as a system with similar
functions to our system. In the context of learning with ANIMAL, users of the system
visualizing the behavior of programs are regarded as taking on one of the four different
roles defined in (Price et al., 1998):
Table 2 Times required to complete each procedure
Subject A Subject B Subject C
Tutorial 56 min 43 min 52 min
Rule definitions 32 min 30 min 33 min
Slide creations 23 min 33 min 29 min
Yamashita et al. Research and Practice in Technology Enhanced Learning (2016) 11:15 Page 6 of 19
1. User/viewer, agent observing the target domain world visualized by the system.
2. Visualizer/animator, agent defining the visualization of the target domain world
with the system.
3. Software developer, agent developing the visualization system.
4. Programmer, agent designing the algorithm or program code that is the target of
visualization.
The ANIMAL is a system that aims to achieve overall improvement in terms of learning
support by providing sophisticated support for each of the four above-mentioned roles, by
straightening the differences among them. In the context of learning with our system,
learners take on the user/viewer role and the teacher takes on the visualizer/animator and
programmer roles. The software developer role is taken on by us.
The visualizer/animator in ANIMAL needs to use a script language named Animal-
Script to define the visualization of the target domain world. Although the description
capability increases significantly by using the script language, the cost associated with
learning the language is a matter that cannot be ignored. Moreover, the amount of
script required to define the visualization in ANIMAL is generally larger than the
amount of visualization rules used in our system. For example, the sample script for a
bubble sort algorithm bundled in ANIMAL consists of 170 lines of code, whereas our
configuration file for bubble sort consists of 56 lines of rule. Rössling and Ackermann
(2007) attempted to reduce the defining costs by bundling some ready-to-use sample
scripts together with a GUI front-end for arranging the scripts. Likewise, our system is
being extended to enable the visualizer/animator to use a front-end GUI to define the
visualization rules.
Classroom practice sessionsIn existing systems including ANIMAL, an action in the domain world is implemented
by the target program code or algorithm rather than by the users; that is, users’ GUI
operations are used mainly to observe changes in the domain world. In contrast, our
system provides a means of data input into the target program by learners themselves.
Data input into the target program implements an action to the domain world without
the need to edit the program code. We consider the use of this function to introduce
discovery learning into algorithm education. Below in this section, we describe three
classroom practical exercises with our system based on this consideration.
The first practical exercise involves fundamental sorting algorithms, incorporated into
actual classes, and conducted in order to confirm that an algorithm class including dis-
covery learning could be established as a form of algorithm education. The second in-
cludes search algorithms and was conducted separately from the actual classes,
confirming that our framework of practice could be applied to classes other than those
covering sorting algorithms. The third was another about sorting algorithms, was incor-
porated into the actual classes covering the same topic, and was conducted to investi-
gate the effects of our framework. In each practical exercise, we planned learning
without referencing the memory image in (B). Participants referred to field (A) as the
formal expression of the algorithm, from which we omitted the syntax details. Partici-
pants also focused on the observations in field (C) to understand the behavior of the al-
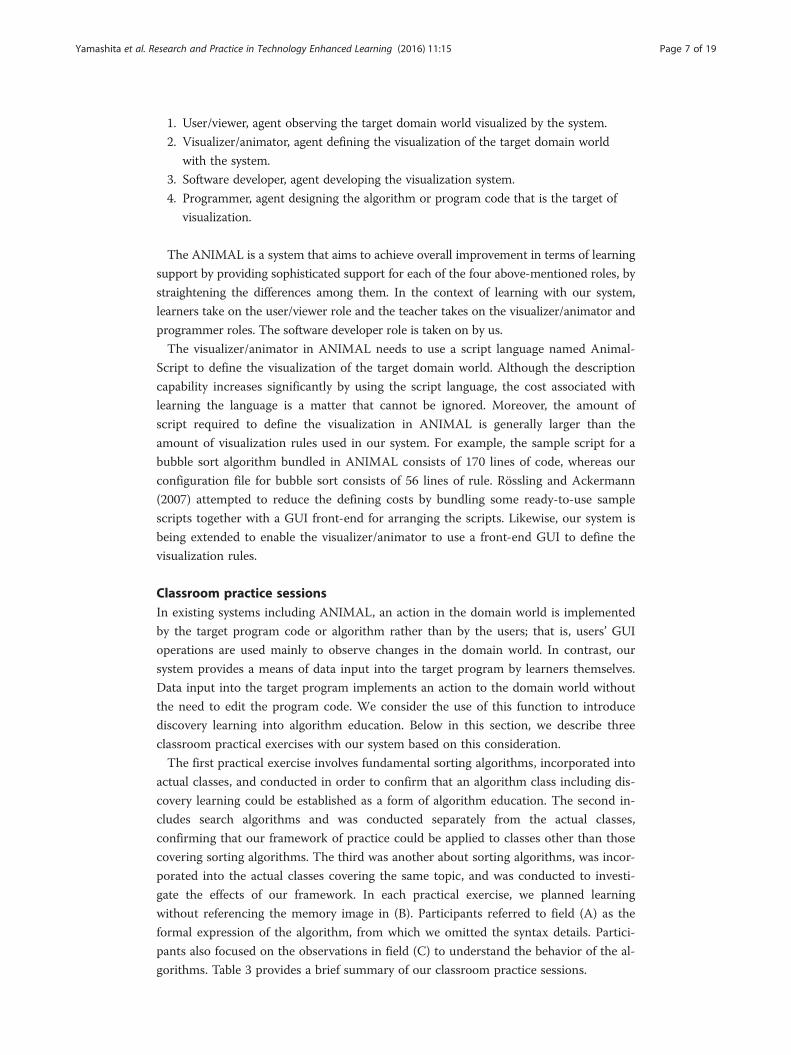
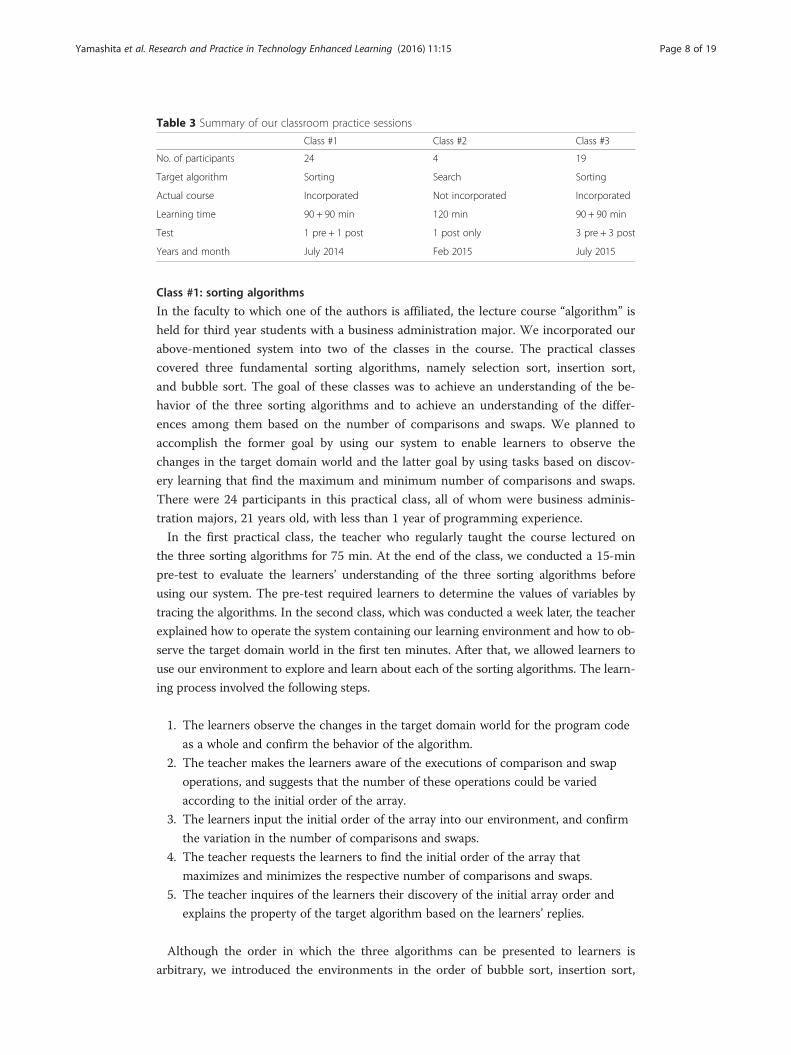
gorithms. Table 3 provides a brief summary of our classroom practice sessions.
Yamashita et al. Research and Practice in Technology Enhanced Learning (2016) 11:15 Page 7 of 19
Class #1: sorting algorithms
In the faculty to which one of the authors is affiliated, the lecture course “algorithm” is
held for third year students with a business administration major. We incorporated our
above-mentioned system into two of the classes in the course. The practical classes
covered three fundamental sorting algorithms, namely selection sort, insertion sort,
and bubble sort. The goal of these classes was to achieve an understanding of the be-
havior of the three sorting algorithms and to achieve an understanding of the differ-
ences among them based on the number of comparisons and swaps. We planned to
accomplish the former goal by using our system to enable learners to observe the
changes in the target domain world and the latter goal by using tasks based on discov-
ery learning that find the maximum and minimum number of comparisons and swaps.
There were 24 participants in this practical class, all of whom were business adminis-
tration majors, 21 years old, with less than 1 year of programming experience.
In the first practical class, the teacher who regularly taught the course lectured on
the three sorting algorithms for 75 min. At the end of the class, we conducted a 15-min
pre-test to evaluate the learners’ understanding of the three sorting algorithms before
using our system. The pre-test required learners to determine the values of variables by
tracing the algorithms. In the second class, which was conducted a week later, the teacher
explained how to operate the system containing our learning environment and how to ob-
serve the target domain world in the first ten minutes. After that, we allowed learners to
use our environment to explore and learn about each of the sorting algorithms. The learn-
ing process involved the following steps.
1. The learners observe the changes in the target domain world for the program code
as a whole and confirm the behavior of the algorithm.
2. The teacher makes the learners aware of the executions of comparison and swap
operations, and suggests that the number of these operations could be varied
according to the initial order of the array.
3. The learners input the initial order of the array into our environment, and confirm
the variation in the number of comparisons and swaps.
4. The teacher requests the learners to find the initial order of the array that
maximizes and minimizes the respective number of comparisons and swaps.
5. The teacher inquires of the learners their discovery of the initial array order and
explains the property of the target algorithm based on the learners’ replies.
Although the order in which the three algorithms can be presented to learners is
arbitrary, we introduced the environments in the order of bubble sort, insertion sort,
Table 3 Summary of our classroom practice sessions
Class #1 Class #2 Class #3
No. of participants 24 4 19
Target algorithm Sorting Search Sorting
Actual course Incorporated Not incorporated Incorporated
Learning time 90 + 90 min 120 min 90 + 90 min
Test 1 pre + 1 post 1 post only 3 pre + 3 post
Years and month July 2014 Feb 2015 July 2015
Yamashita et al. Research and Practice in Technology Enhanced Learning (2016) 11:15 Page 8 of 19
and selection sort in these practical classes. We omitted steps 2 and 3 above when pre-
senting insertion and selection sort. The task in step 4 is based on discovery learning,
hence we required the learners to follow this step for all three algorithms. Step 4 con-
sists of the following sub-steps that construct the discovery learning cycle:
4a. Learners generate a hypothesis about the array order that satisfies the
requirements.
4b. Learners input the array order based on their hypothesis in 4a.
4c. Learners verify the hypothesis by observing the behavior of the algorithm using the
array order in 4b.
4d. Learners return to step 4a and regenerate a more plausible hypothesis as necessary
based on the verification results in 4c.
We incorporate the input process in the target program code for realizing steps 3
and 4 to enable learners to input the initial order of the array when tracing the
program. After the entire 60-min learning period devoted to the three algorithms, we
conducted a 15-min post-test to evaluate learners’ understanding of the three sorting
algorithms after using our system. The post-test consisted of tasks involving tracing the
same algorithms as in the pre-test except for the target array.
The teacher created three configuration files to enable learners to learn by following
the above-mentioned steps before the practical classes. The configuration files con-
sisted of 56, 65, and 62 drawing rules for bubble sort, insertion sort, and selection sort,
respectively. Many of the drawing rules are defined in order to enable the target do-
main world to be visualized in a way similar to which existing systems visualize these
worlds. Meanwhile, some of the rules are defined to visualize the teacher’s intents such
as ensuring that the instruction contents correspond to a learner’s background know-
ledge and providing guidance during the discovery process. Specifically, the intents of
instruction included in our environment by the teacher were the following:
� To suggest the role of the variables to learners by drawing an arrowed connector
from the variables indexing the array to the corresponding array elements.
� To clarify the difference between sorted and unsorted elements by coloring sorted
elements only.
� To clarify the difference of a role by drawing circle objects for the index variables,
with a rectangle object for the temporary variable in swaps.
� To suggest the viewpoints in discovery learning by using label objects to notify the
execution of comparison and swap.
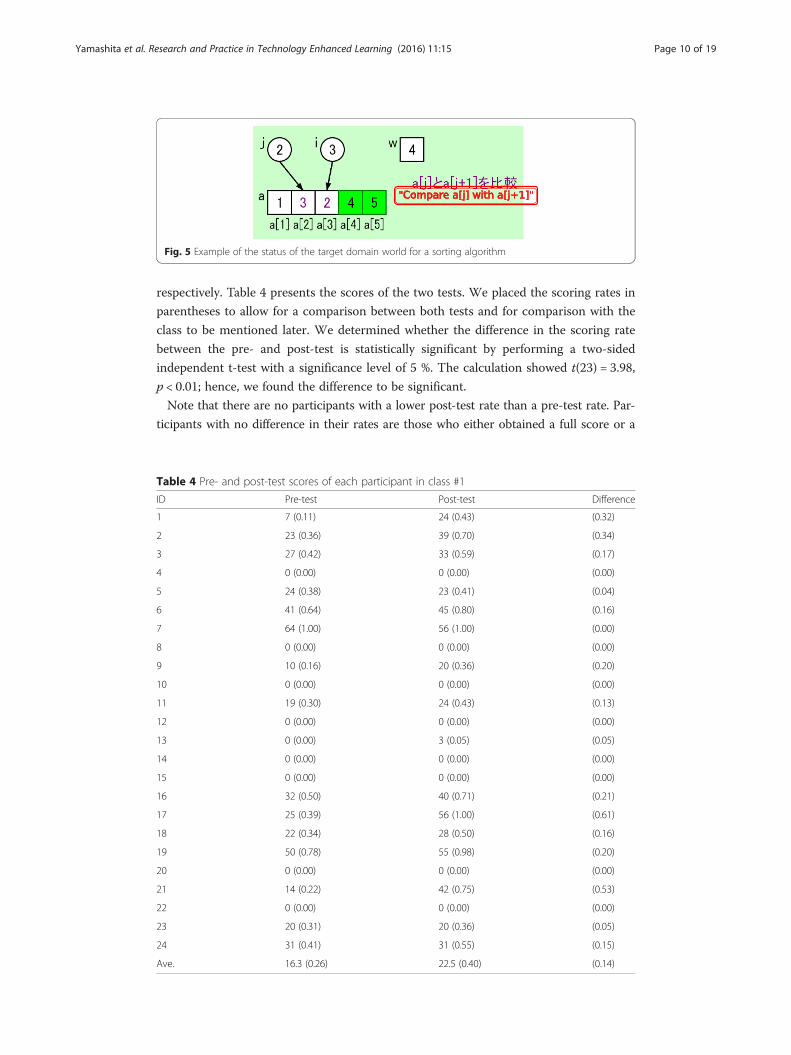
All of these intents of instruction were suggestive rather than codified, because we
intended to encourage learners to focus on the number of comparisons and swaps by
themselves in step 4. Figure 5 provides an example of the status of the target domain
world visualized by our system.
Both the pre- and post-tests elicited values for all the variables on the specified watch
points in a series of processes for each algorithm. The teacher scored the tests on an all
or none basis, i.e., one point for correct answers and zero for wrong answers for every
value at every watch point. The pre-test and post-test contained 64 and 56 questions,
Yamashita et al. Research and Practice in Technology Enhanced Learning (2016) 11:15 Page 9 of 19
respectively. Table 4 presents the scores of the two tests. We placed the scoring rates in
parentheses to allow for a comparison between both tests and for comparison with the
class to be mentioned later. We determined whether the difference in the scoring rate
between the pre- and post-test is statistically significant by performing a two-sided
independent t-test with a significance level of 5 %. The calculation showed t(23) = 3.98,
p < 0.01; hence, we found the difference to be significant.
Note that there are no participants with a lower post-test rate than a pre-test rate. Par-
ticipants with no difference in their rates are those who either obtained a full score or a
Fig. 5 Example of the status of the target domain world for a sorting algorithm
Table 4 Pre- and post-test scores of each participant in class #1
ID Pre-test Post-test Difference
1 7 (0.11) 24 (0.43) (0.32)
2 23 (0.36) 39 (0.70) (0.34)
3 27 (0.42) 33 (0.59) (0.17)
4 0 (0.00) 0 (0.00) (0.00)
5 24 (0.38) 23 (0.41) (0.04)
6 41 (0.64) 45 (0.80) (0.16)
7 64 (1.00) 56 (1.00) (0.00)
8 0 (0.00) 0 (0.00) (0.00)
9 10 (0.16) 20 (0.36) (0.20)
10 0 (0.00) 0 (0.00) (0.00)
11 19 (0.30) 24 (0.43) (0.13)
12 0 (0.00) 0 (0.00) (0.00)
13 0 (0.00) 3 (0.05) (0.05)
14 0 (0.00) 0 (0.00) (0.00)
15 0 (0.00) 0 (0.00) (0.00)
16 32 (0.50) 40 (0.71) (0.21)
17 25 (0.39) 56 (1.00) (0.61)
18 22 (0.34) 28 (0.50) (0.16)
19 50 (0.78) 55 (0.98) (0.20)
20 0 (0.00) 0 (0.00) (0.00)
21 14 (0.22) 42 (0.75) (0.53)
22 0 (0.00) 0 (0.00) (0.00)
23 20 (0.31) 20 (0.36) (0.05)
24 31 (0.41) 31 (0.55) (0.15)
Ave. 16.3 (0.26) 22.5 (0.40) (0.14)
Yamashita et al. Research and Practice in Technology Enhanced Learning (2016) 11:15 Page 10 of 19
zero score. Although the scoring rate of all participants increased by 0.14 on average,
those who had pre-test scores greater than zero increased the rate by 0.22 on average.
Class #2: search algorithms
We conducted another practical session for fundamental search algorithms separate
from the actual classes during which instruction was provided. Search algorithms
had not been introduced during the time of instruction because of the shortage of
time. Three search algorithms were introduced during this class: sequential search,
binary search, and hash search. The goal of the class was to allow learners to de-
velop an understanding of the behavior of and the differences among the three
search algorithms based on the search key and the search target. We planned to
achieve the goal by observing the changes in the target domain world using our
system and by the tasks based on discovery learning. The tasks assessed whether
learners were able to find the maximum and minimum number of comparisons
and the synonym records. Four learners participated in this practical session, all of
whom were business administration majors, 21 years old, and had less than 1 year
of programming experience. All of them had participated in the practical session
described in the previous subsection and none had any learning experience in
search algorithms.
The practice class was of 120-min duration. The teacher first explained how to oper-
ate our learning environment and how to observe the target domain world and then
conducted the class in the following steps:
1. The teacher provides the learners with the definition of the search problem. The
teacher then explains that the class focuses on searching from an array rather than
from a file and encourages the learners to think about a search algorithm
spontaneously.
2. The teacher introduces the basic idea of a sequential search algorithm as one of the
simplest solutions and allows the learners to observe its behavior using our
environment.
3. The teacher requests the learners to input some search keys and observe
the change in the number of comparisons and then requires the learners
find the search key that maximizes and minimizes the number of
comparisons.
4. The teacher inquires of the learners their discovery of the search key and
consequently explains the property of a sequential search algorithm, naïve but
inefficient, based on their replies.
5. The teacher mentions that there are more search algorithms, introduces the basic
idea of a binary search algorithm, and allows the learners to observe its behavior
using our environment.
6. The teacher requests the learners to input some search keys, observe the change in
behavior, and find the search key that maximizes and minimizes the number of
comparisons.
7. The teacher inquires of the learners their discovery of the search key and
consequently explains the property of a binary search algorithm, fast but requires
the search space to be sorted, based on their replies.
Yamashita et al. Research and Practice in Technology Enhanced Learning (2016) 11:15 Page 11 of 19
8. The teacher introduces the basic idea of a hash search as yet another algorithm,
and allows the learners to observe the behavior of a hash search from a dataset with
no synonyms using our environment.
9. The teacher allows the learners to observe the behavior of generating a hash table
using a certain dataset and observe the occurrence of collisions. Here, the collision
resolution of the algorithm used in the practical session is based on open
addressing.
10.The teacher inquires of the learners why collisions occur and how the searching
process changes. Then, the teacher requests the learners to find the dataset and
search keys that trigger collisions.
11.The teacher encourages learners to report what they have discovered and what they
have realized, and explains the properties related to a hash search such as hash
function requirements and the size of hash tables, based on learners’ replies.
12.The teacher allows the learners to use our environment to observe the behavior of
a hash search from a dataset with synonyms.
The configuration files are created by the teacher before the class, as in class #1. The
configuration files consisted of 28 drawing rules for sequential search, 33 rules for bin-
ary search, 30 rules for hash search from a dataset with no synonyms, 41 rules for hash
table generation, and 36 rules for hash search from a dataset with synonyms. The intent
of instruction included in our environment by the teacher for reasons other than the
visualization of elemental objects in the target domain world was the following:
� To suggest the role of variables to learners by drawing an arrowed connector from
the variables indexing the array to the corresponding array elements.
� To clarify the difference in the roles by drawing circle objects for the index
variables and a rectangle object for the search key.
� To clarify the difference between the search range and other array elements by
coloring only out-of-range elements when using the sequential and binary search
algorithms.
� To suggest the viewpoints in discovery learning by coloring two objects that are the
target of the comparison process.
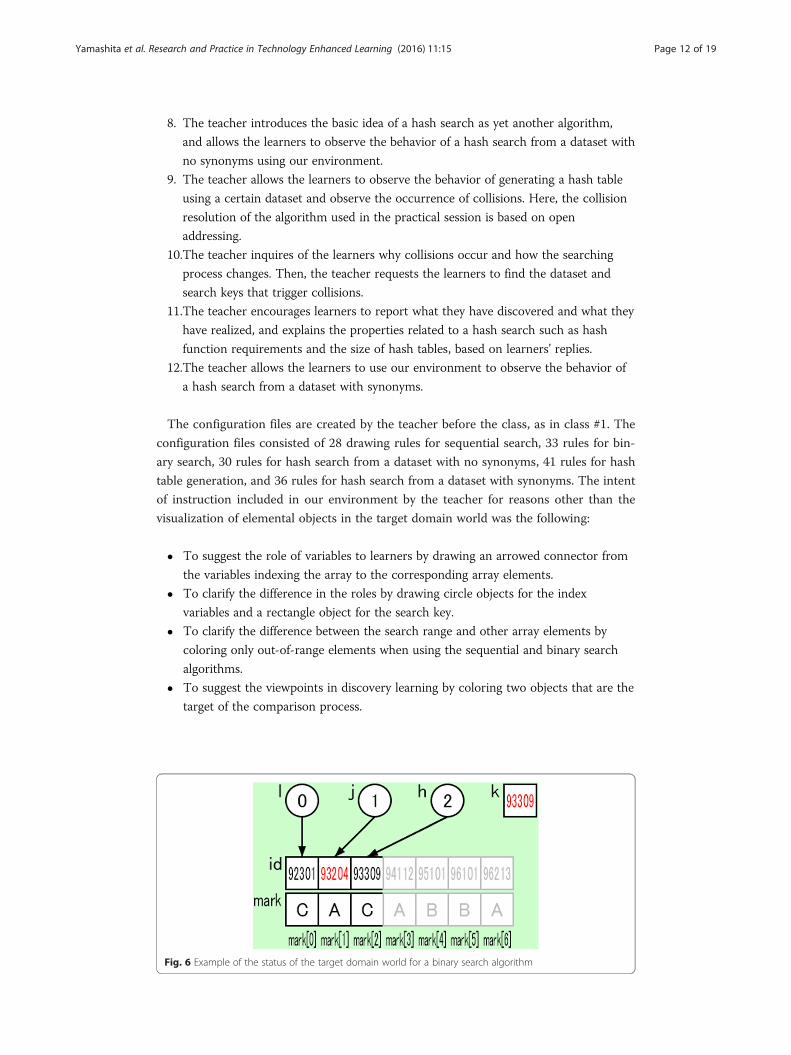
Fig. 6 Example of the status of the target domain world for a binary search algorithm
Yamashita et al. Research and Practice in Technology Enhanced Learning (2016) 11:15 Page 12 of 19
We intended to support learners’ discovery experience by providing suggestive visual-
izations similar to those in the practice session described in the previous subsection.
The tasks based on discovery learning are included in steps 3, 6, and 10. Figure 6
provides an example of the status of the target domain world when the binary search
algorithm is visualized by our system. The search key is stored in the variable k. The
search range is presented by using gray color for the array elements that are out of the
search range. A comparison between two objects is presented by using red color for
the target of the comparison process, 93204 and 93309. These visualizations suggest
the objects on which the learners should focus and support the learners’ discovery
learning.
After the practice session, we instructed the learners to write a briefing paper on
search algorithms by briefly explaining their behavior and properties as a 15-min
post-test. The teacher examined their responses from the viewpoint of whether the
learners adequately described the three algorithms and their properties based on
what they learned in this practice session. Consequently, we found that, although
the learners were able to describe all three algorithms and roughly explain the be-
havior and properties of each, they tended to use informal terms in their descrip-
tions. We consider the learners to have grasped the behavior and properties of the
algorithms but have not acquired the terminology, because this practice did not in-
clude an instruction session.
Class #3: sorting algorithms
The last practice class among the three was conducted in July 2015. The contents and
goal of the class were the same as for class #1; that is, to understand the behavior of
three sorting algorithms and to understand the differences among them based on the
number of comparisons and swaps. We incorporated class #3 into the actual course “al-
gorithm” as two consecutive sessions. We also included the same intent of instruction
as those in class #1 in the configuration files. Learners followed steps 1 to 5 of class #1
when learning about each of the sorting algorithms with our environment. This time,
19 learners participated in the practice sessions, all of whom were business administra-
tion majors, 22 years old, with less than 1 year of programming experience. Four of
them had participated in class #1 but had received zero for both of the pre- and post-
tests.
Class #3 differed from class #1 in two respects. First, we used questionnaires to ob-
tain leaner feedback at the end of the second practice session. We discuss these results
in Section 4.Second, whereas the pre- and post-tests in class #1 required the values of
variables to be obtained by tracing the three algorithms, those administered in class #3
consisted of the following three questions:
Q1. Asks the values of variables obtained by tracing the single provided algorithm in
order to check the overall understanding of algorithm behavior.
Q2. Asks the number of comparisons and swaps to determine whether the learners
could find the correct number for the provided algorithm and initial array.
Q3. Asks which algorithm is the most efficient to sort the provided initial array and
why, to establish whether the learners could explain the differences among the
algorithms appropriately.
Yamashita et al. Research and Practice in Technology Enhanced Learning (2016) 11:15 Page 13 of 19
The algorithms provided in Q1 and Q2 were different, as were the initial array provided
in Q2 and Q3. These also differed between the pre-test and post-test.
The scoring was done by the teacher as in class #1. Q1 required the values of all vari-
ables on ten specified watch points in a series of processing the algorithm. The teacher
scored one point for correct values at every watch point and zero for answers including
the wrong value for Q1. Every answered number of comparisons and swaps for Q2
scored one point for each correct answer and zero if the answer was wrong. The
teacher scored each answer in response to Q3 using a five-point scale, examined from
the viewpoints as to whether the algorithm in the answer is the most efficient one, the
description contains comparisons among the algorithms, the comparative perspective is
appropriate, and the description contains a sufficient degree of details.
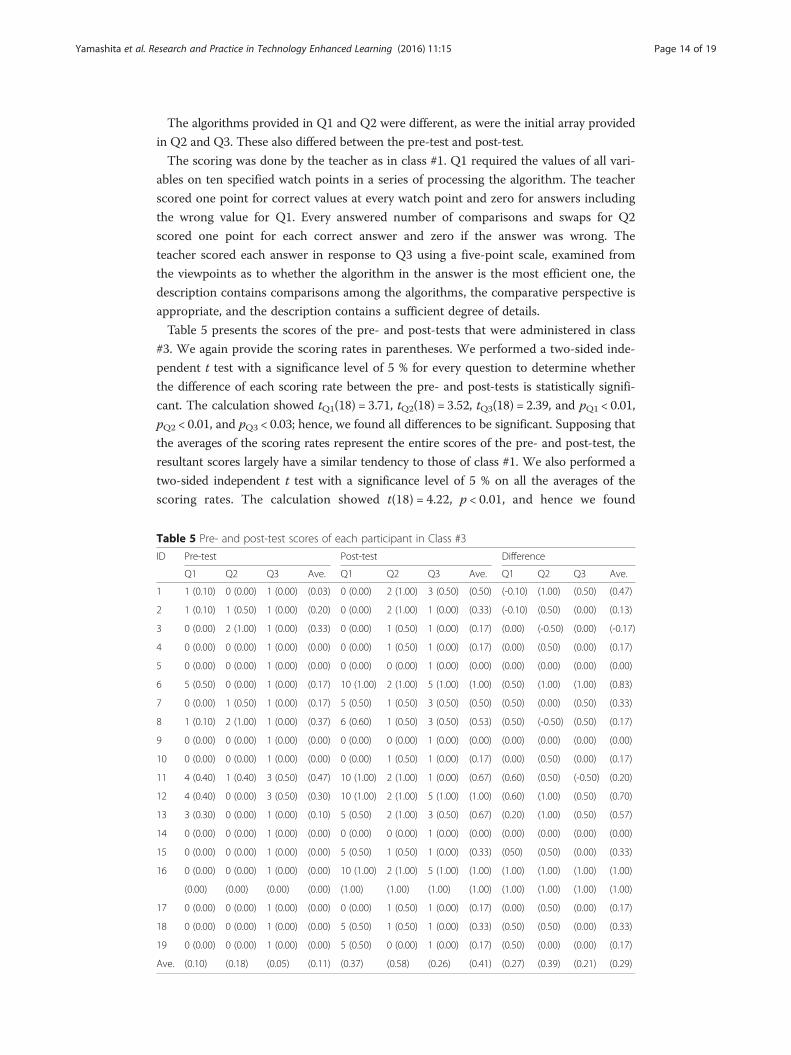
Table 5 presents the scores of the pre- and post-tests that were administered in class
#3. We again provide the scoring rates in parentheses. We performed a two-sided inde-
pendent t test with a significance level of 5 % for every question to determine whether
the difference of each scoring rate between the pre- and post-tests is statistically signifi-
cant. The calculation showed tQ1(18) = 3.71, tQ2(18) = 3.52, tQ3(18) = 2.39, and pQ1 < 0.01,
pQ2 < 0.01, and pQ3 < 0.03; hence, we found all differences to be significant. Supposing that
the averages of the scoring rates represent the entire scores of the pre- and post-test, the
resultant scores largely have a similar tendency to those of class #1. We also performed a
two-sided independent t test with a significance level of 5 % on all the averages of the
scoring rates. The calculation showed t(18) = 4.22, p < 0.01, and hence we found
Table 5 Pre- and post-test scores of each participant in Class #3
ID Pre-test Post-test Difference
Q1 Q2 Q3 Ave. Q1 Q2 Q3 Ave. Q1 Q2 Q3 Ave.
1 1 (0.10) 0 (0.00) 1 (0.00) (0.03) 0 (0.00) 2 (1.00) 3 (0.50) (0.50) (-0.10) (1.00) (0.50) (0.47)
2 1 (0.10) 1 (0.50) 1 (0.00) (0.20) 0 (0.00) 2 (1.00) 1 (0.00) (0.33) (-0.10) (0.50) (0.00) (0.13)
3 0 (0.00) 2 (1.00) 1 (0.00) (0.33) 0 (0.00) 1 (0.50) 1 (0.00) (0.17) (0.00) (-0.50) (0.00) (-0.17)
4 0 (0.00) 0 (0.00) 1 (0.00) (0.00) 0 (0.00) 1 (0.50) 1 (0.00) (0.17) (0.00) (0.50) (0.00) (0.17)
5 0 (0.00) 0 (0.00) 1 (0.00) (0.00) 0 (0.00) 0 (0.00) 1 (0.00) (0.00) (0.00) (0.00) (0.00) (0.00)
6 5 (0.50) 0 (0.00) 1 (0.00) (0.17) 10 (1.00) 2 (1.00) 5 (1.00) (1.00) (0.50) (1.00) (1.00) (0.83)
7 0 (0.00) 1 (0.50) 1 (0.00) (0.17) 5 (0.50) 1 (0.50) 3 (0.50) (0.50) (0.50) (0.00) (0.50) (0.33)
8 1 (0.10) 2 (1.00) 1 (0.00) (0.37) 6 (0.60) 1 (0.50) 3 (0.50) (0.53) (0.50) (-0.50) (0.50) (0.17)
9 0 (0.00) 0 (0.00) 1 (0.00) (0.00) 0 (0.00) 0 (0.00) 1 (0.00) (0.00) (0.00) (0.00) (0.00) (0.00)
10 0 (0.00) 0 (0.00) 1 (0.00) (0.00) 0 (0.00) 1 (0.50) 1 (0.00) (0.17) (0.00) (0.50) (0.00) (0.17)
11 4 (0.40) 1 (0.40) 3 (0.50) (0.47) 10 (1.00) 2 (1.00) 1 (0.00) (0.67) (0.60) (0.50) (-0.50) (0.20)
12 4 (0.40) 0 (0.00) 3 (0.50) (0.30) 10 (1.00) 2 (1.00) 5 (1.00) (1.00) (0.60) (1.00) (0.50) (0.70)
13 3 (0.30) 0 (0.00) 1 (0.00) (0.10) 5 (0.50) 2 (1.00) 3 (0.50) (0.67) (0.20) (1.00) (0.50) (0.57)
14 0 (0.00) 0 (0.00) 1 (0.00) (0.00) 0 (0.00) 0 (0.00) 1 (0.00) (0.00) (0.00) (0.00) (0.00) (0.00)
15 0 (0.00) 0 (0.00) 1 (0.00) (0.00) 5 (0.50) 1 (0.50) 1 (0.00) (0.33) (050) (0.50) (0.00) (0.33)
16 0 (0.00) 0 (0.00) 1 (0.00) (0.00) 10 (1.00) 2 (1.00) 5 (1.00) (1.00) (1.00) (1.00) (1.00) (1.00)
(0.00) (0.00) (0.00) (0.00) (1.00) (1.00) (1.00) (1.00) (1.00) (1.00) (1.00) (1.00)
17 0 (0.00) 0 (0.00) 1 (0.00) (0.00) 0 (0.00) 1 (0.50) 1 (0.00) (0.17) (0.00) (0.50) (0.00) (0.17)
18 0 (0.00) 0 (0.00) 1 (0.00) (0.00) 5 (0.50) 1 (0.50) 1 (0.00) (0.33) (0.50) (0.50) (0.00) (0.33)
19 0 (0.00) 0 (0.00) 1 (0.00) (0.00) 5 (0.50) 0 (0.00) 1 (0.00) (0.17) (0.50) (0.00) (0.00) (0.17)
Ave. (0.10) (0.18) (0.05) (0.11) (0.37) (0.58) (0.26) (0.41) (0.27) (0.39) (0.21) (0.29)
Yamashita et al. Research and Practice in Technology Enhanced Learning (2016) 11:15 Page 14 of 19
the difference of the entire set of scoring rates to be significant. There was only
one participant with a post-test rate lower than their pre-test rate. The average im-
provement in the scoring rate was 0.29, which suggests the effectiveness of the
framework in our practical work.
DiscussionDiscovery learning of the properties of an algorithm
Our intension was to enable learners to discover the properties of an algorithm ra-
ther than the algorithm itself because of the goal of the actual algorithm course.
The course is expected to use case learning to promote general problem solving
skills, rather than develop the fundamental skills required for program design.
Hence, the teacher has placed great emphasis on instilling knowledge about exist-
ing algorithms. The evaluation results of Class #1 and #3 based on the pre- and
post-test suggest that the learners cultivated an improved understanding of sorting
algorithms through the practice sessions. The briefing papers written in Class #2
suggest that the learners understood the behavior of a search algorithm to some
extent, despite being unsuccessful in mastering the terminology. We consider these
results to confirm that the framework implemented in our practice sessions can be
established in algorithm classes.
During coding exercises or when learning with a learning support system,
learners develop the learning activity individually; hence, they would focus on ir-
regular and inconsistent points for discovery. Kirschner et al. (2006) has pointed
out that unguided learning is ineffective based on examples from science and med-
ical education, and insisted on the necessity of guidance in discovery learning.
Thus, we included visual objects in the visualized domain world, which serves as a
guide for discovery. Not only does our system provide objects consisting of the tar-
get domain world but also suggestive viewpoints to reduce the irregularity and in-
consistency. The visualizations defined in our practice exercises are not intended
to explain the role of each object or the behavior of the algorithm, rather to sug-
gest points on which the learners should focus, that is, to provide guidance for dis-
covery learning. In our practical classes, participants replied actively by sharing
their discovery with the teacher. Therefore, we consider our visualization to work
effectively with the desired effect in terms of discovery learning.
Factors influencing score improvements
Class #1 and #3 had an interval of 1 week between the pre- and post-test because
of schedule restrictions. This was because we incorporated each of the practice ex-
ercises into a series of actual classes. These intervals are not short and conse-
quently allowed the learners to learn out-of-class with textbooks and course notes.
In this section, we discuss the questionnaire administered in class #3 and the sur-
vey results to evaluate the extent to which out-of-class learning influences the
post-test score.
The questionnaire covered the following six aspects:
E1. Enquires about the amount of out-of-class preparation and reviews using a
five-point scale.
Yamashita et al. Research and Practice in Technology Enhanced Learning (2016) 11:15 Page 15 of 19
E2. Enquires about the level of confidence in programming skills using a five-point scale.
E3. Enquires about the level of interest in computer science using a five-point scale.
E4. Enquires about the usability of our learning environment using a five-point scale.
E5. Enquires about the learning target that cultivated an improved understanding.
E6. Enquires about the learner’s impression or suggestions to improve our environment.
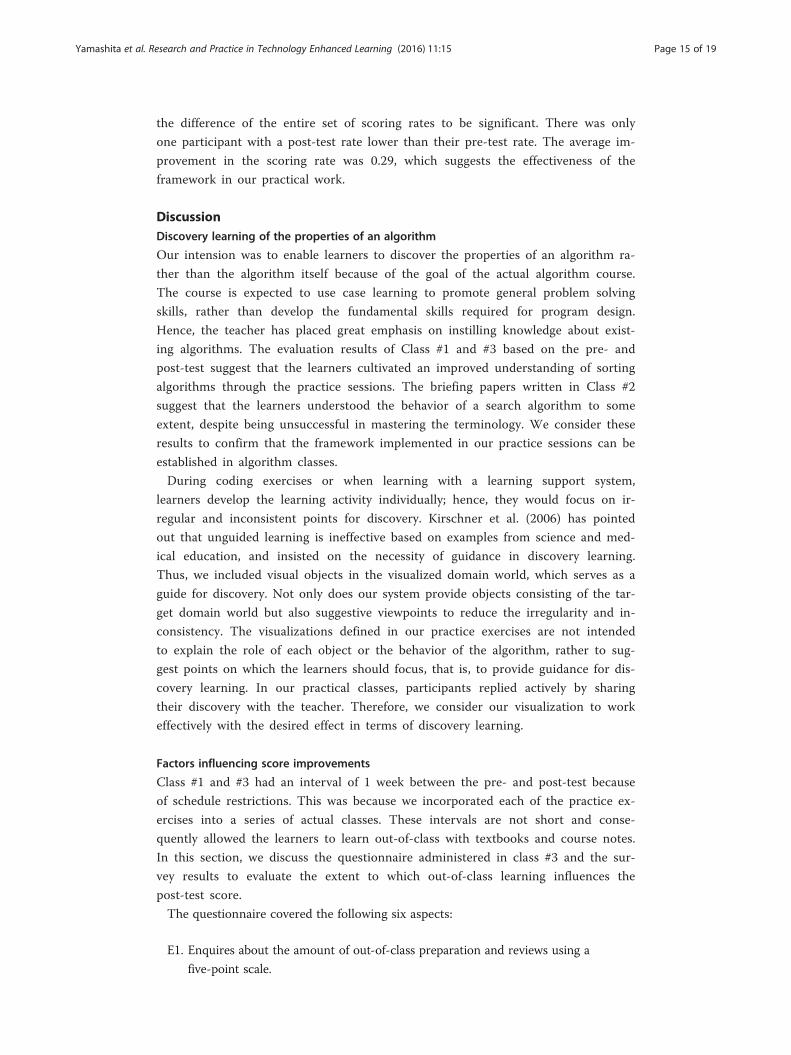
We included items E5 and E6 for the purpose of applying qualitative analysis, but un-
fortunately, most of the participants left these items unanswered. Table 6 provides the
answers of each participant for E1 to E4.
We estimated the relationships between the scoring rate improvements in the pre-
and post-tests and answers on the questionnaire by applying the following growth
model: Both test rates were modeled as linear functions to obtain the distribution of
slopes and intercepts. The slopes and intercepts serve as dependent variables, and
questionnaire items serve as independent variables. We examined how each question-
naire item (i.e., the independent variables) affects both test scores (i.e., dependent vari-
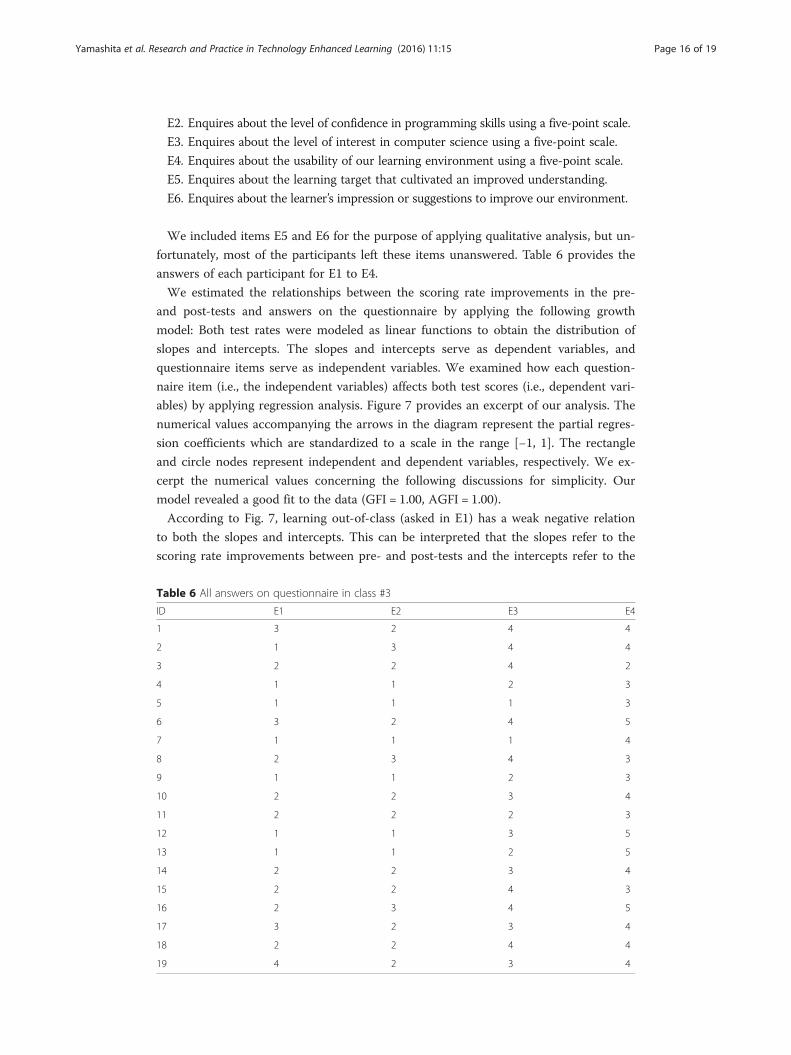
ables) by applying regression analysis. Figure 7 provides an excerpt of our analysis. The
numerical values accompanying the arrows in the diagram represent the partial regres-
sion coefficients which are standardized to a scale in the range [−1, 1]. The rectangle
and circle nodes represent independent and dependent variables, respectively. We ex-
cerpt the numerical values concerning the following discussions for simplicity. Our
model revealed a good fit to the data (GFI = 1.00, AGFI = 1.00).
According to Fig. 7, learning out-of-class (asked in E1) has a weak negative relation
to both the slopes and intercepts. This can be interpreted that the slopes refer to the
scoring rate improvements between pre- and post-tests and the intercepts refer to the
Table 6 All answers on questionnaire in class #3
ID E1 E2 E3 E4
1 3 2 4 4
2 1 3 4 4
3 2 2 4 2
4 1 1 2 3
5 1 1 1 3
6 3 2 4 5
7 1 1 1 4
8 2 3 4 3
9 1 1 2 3
10 2 2 3 4
11 2 2 2 3
12 1 1 3 5
13 1 1 2 5
14 2 2 3 4
15 2 2 4 3
16 2 3 4 5
17 3 2 3 4
18 2 2 4 4
19 4 2 3 4
Yamashita et al. Research and Practice in Technology Enhanced Learning (2016) 11:15 Page 16 of 19
pre-test rates, roughly. Based on the interpretation, both of the score improvements
and pre-test scores had been influenced very little by out-of-class learning. That is, al-
though there was an interval of one week between Class #1 and #3 because of schedule
restriction, we can ignore the influence of the interval on the scores of the pre- and
post-test. This evaluation result does not have sufficient reliability for generality be-
cause we could not procure a sufficient number of participants for the practice ses-
sions. However, at least in Class #3 the score improvements would be influenced little
by out-of-class learning.
Questionnaire items intended to probe effects other than out-of-class learning also
had the expected outcome. The confidence in programming skills (E2) were found to
have weak relations to intercepts. This suggests that the pre-test scores would be tan-
gible confidence of programming skills. The interests in computer science (E3) have
weak relations to slopes, suggesting that participants with an interest in computer sci-
ence would be eager to attempt the classroom practice with the program visualization
system. Evaluations of the usability of our system (E4) have an extremely strong rela-
tion to slopes. We think it is natural that participants who cultivated an improved un-
derstanding of algorithms graded the usability higher.
ConclusionIn this paper, we described the educational practices based on the learning support
system we developed in our previous work. The system, which offers visualization
of program behavior, supports learners to understand algorithms, and hence intro-
ducing these systems is expected to allow learners to cultivate an improved under-
standing. However, existing systems tend to focus on reproducing the entire flow
of the algorithm behavior, which means that it is necessary to structure the con-
tents of classes such that the properties of an algorithm such as the number of
comparisons or swaps are taught. Furthermore, almost all of existing systems disal-
lows variation in the teacher’s intent of instruction to accommodate the learners.
Fig. 7 Path diagram representing our model in questionnaire analysis
Yamashita et al. Research and Practice in Technology Enhanced Learning (2016) 11:15 Page 17 of 19
Based on these considerations, we introduced the system developed in our previous
work. Our system visualizes the target domain world according to the visualization
policy defined by the teacher. We included contents based on discovery learning
about the properties of algorithms in our classroom practices. The teacher made
learners externalize their discovery by inquiries and explained knowledge based on
their externalized discovery.
We conducted three classroom practical sessions introducing our system. The evalu-
ation results of the pre- and post-test in class #1 and #3 provided that the learners cul-
tivated an improved understanding through our practices. The results of the post-test
of class #2 showed that the learners gained an understanding of the general behavior of
algorithms to a certain degree, though they gained little understanding of the termin-
ology. These results suggest that the framework of our practices can be established in
algorithm classes. Although we must consider that a statistically insufficient number of
learners participating in the practice sessions may influence the accuracy of verification,
we believe that continuous practice will suppress this reliability matter.
One of the limitations of our framework is that it is difficult to encourage adoption
of the terminology such as the name of an algorithm. The transfer of knowledge in lec-
ture classes would require the teacher to balance the lecture and time learners are
allowed to practice with the system. We plan to find ideal material for use in classes by
continuously conducting classroom practice sessions with our system. Further, the
questionnaire administered in class #3 had inquiries concerning mainly the learner’s
attributes; hence, our analysis based on the answers could not reveal factors that have
(or do not have) a learning effect. We intend to continue improving the questionnaire
inquiries in order to determine the direction for improving our class design and our
system. Other future work is to conduct a more quantitative evaluation of the learning
effects and efficiency of our classroom practices. We also plan to continue investigating
how efficiently the framework in our practices is prepared and how effectively and effi-
ciently the algorithm classes are conducted.
Our practices suggest that if the algorithm course is held as part of fundamental sci-
ence education, the teacher could conduct the classes based on discovery learning by
introducing an appropriate learning support system. We can summarize the require-
ments of classroom practice for algorithms including discovery learning such as our
practice described in this paper as follows:
� Teacher needs to introduce the learning support system into the class for use by
each of the learners individually.
� The system needs the functionality to allow the design of actions to the target
domain world and user interface to apply actions other than coding.
� The system needs the functionality to construct the target domain world based on
the teacher’s intent to suggest focusing points and support the learner’s discovery.
AcknowledgementsThis study was supported by JSPS KAKENHI Grant Numbers JP24300282, JP15K1610, JP16K01084.
Authors’ contributionsKY participated in the development of the system, conducted the classroom practices, summarized the research andwrote this paper. RF and SK implemented and evaluated the system. YN, TK, and YI gave advice based on actualteaching experience. All authors read and approved the final manuscript.
Yamashita et al. Research and Practice in Technology Enhanced Learning (2016) 11:15 Page 18 of 19
Competing interestsAll authors declare that they have no competing interests.
Author details1Faculty of Business Administration, Tokoha University, 1230 Miyakoda, Kita-ku, Hamamatsu, Shizuoka 431-2102, Japan.2Graduate School of Informatics, Shizuoka University, 3-5-1 Johoku, Naka-ku, Hamamatsu, Shizuoka 432-8011, Japan.3Faculty of Informatics, Shizuoka University, 3-5-1 Johoku, Naka-ku, Hamamatsu, Shizuoka 432-8011, Japan. 4ShizuokaUniversity, 3-5-1 Johoku, Naka-ku, Hamamatsu, Shizuoka 432-8011, Japan.
Received: 14 December 2015 Accepted: 8 August 2016
ReferencesBen-Ari, M, Bednarik, R, Ben-Bassat Levy, R, Ebel, G, Moreno, A, Myller, N, & Sutinen, E. (2011). A decade of research and
development on program animation: the Jeliot experience. Journal of Visual Languages & Computing,22(5), 375–384.
Fossati, D, Eugenio, BD, Brown, C, Ohlsson, S. (2008). Learning linked lists: experiments with the iList system. Proceedingsof the 9th International Conference on Intelligent Tutoring Systems, 80-89. doi:10.1007/978-3-540-69132-7_13.
Kirschner, P, Sweller, J, & Clark, RE. (2006). Why unguided learning does not work: an analysis of the failure of discoverylearning, problem-based learning, experiential learning and inquiry-based learning. Educational Psychologist, 41(2),75–86.
Kogure, S, Fujioka, R, Noguchi, Y, Yamashita, K, Konishi, T, Itoh, Y. (2014). Code reading environment according tovisualizing both variable’s memory image and target world’s status. Proceeding of the 22nd International Conferenceon Computers in Education, 343-348.
Malmi, L, Karavirta, V, Korhonen, A, Nikander, J, Seppälä, O, & Silvasti, P. (2004). Visual algorithm simulation exercisesystem with automatic assessment: TRAKLA2. Informatics in Education, 3(2), 267–288.
Pears, A, Seidman, S, Malmi, L, Mannila, L, Adams, E, Bennedsen, J, Devlin, M, & Paterson, J. (2007). A survey of literatureon the teaching of introductory programming. ACM SIGCSE Bulletin, 39(4), 204–223.
Price, B, Beacker, R, & Small, I. (1998). An introduction to software visualization. In J. Stasko, J. Domingue, M. H. Brown, &B. A. Price (Eds.), Software Visualization (pp. 15–32). MIT Press: Cambridge.
Rajala, T, Laakso, MJ, Kaila, E, & Salakoski, T. (2008). Effectiveness of program visualization: a case study with the ViLLEtool. Journal of Information Technology Education, 7, 15–32.
Robins, A, Rountree, J, & Rountree, N. (2003). Learning and teaching programming: a review and discussion. ComputerScience Education, 13(2), 137–172.
Rössling, G, & Ackermann, T. (2007). A framework for generating AV content on-the-fly. Electronic Notes in TheoreticalComputer Science, 178, 23–31.
Rössling, G, & Freisleben, B. (2002). ANIMAL: a system for supporting multiple roles in algorithm animation. Journal ofVisual Language & Computing, 13(3), 341–354.
Yamashita, K, Nagao, T, Kogure, S, Noguchi, Y, Konishi, T, & Itoh, Y. (2016). Code-reading support environmentvisualizing three fields and educational practice to understand nested loops. Research and Practice in TechnologyEnhanced Learning, 11(1), 1–22. doi:10.1186/s41039-016-0027-3.
Submit your manuscript to a journal and benefi t from:
7 Convenient online submission
7 Rigorous peer review
7 Immediate publication on acceptance
7 Open access: articles freely available online
7 High visibility within the fi eld
7 Retaining the copyright to your article
Submit your next manuscript at 7 springeropen.com
Yamashita et al. Research and Practice in Technology Enhanced Learning (2016) 11:15 Page 19 of 19