Embed Size (px)
Citation preview
SANDIA REPORT SAND2010‐1721 Unlimited Release Printed March 2010
Precision Moisture Generation and Measurement Adriane N. Irwin, Steven M. Thornberg, and Michael I. White Prepared by Sandia National Laboratories Albuquerque, New Mexico 87185 and Livermore, California 94550
Sandia National Laboratories is a multi‐program laboratory operated by Sandia Corporation, a wholly owned subsidiary of Lockheed Martin company, for the U.S. Department of Energy's National Nuclear Security Administration under contract DE‐AC04‐94AL85000. Approved for public release; further dissemination unlimited.
2
Issued by Sandia National Laboratories, operated for the United States Department of Energy by Sandia Corporation. NOTICE: This report was prepared as an account of work sponsored by an agency of the United States Government. Neither the United States Government, nor any agency thereof, nor any of their employees, nor any of their contractors, subcontractors, or their employees, make any warranty, express or implied, or assume any legal liability or responsibility for the accuracy, completeness, or usefulness of any information, apparatus, product, or process disclosed, or represent that its use would not infringe privately owned rights. Reference herein to any specific commercial product, process, or service by trade name, trademark, manufacturer, or otherwise, does not necessarily constitute or imply its endorsement, recommendation, or favoring by the United States Government, any agency thereof, or any of their contractors or subcontractors. The views and opinions expressed herein do not necessarily state or reflect those of the United States Government, any agency thereof, or any of their contractors. Printed in the United States of America. This report has been reproduced directly from the best available copy. Available to DOE and DOE contractors from U.S. Department of Energy Office of Scientific and Technical Information P.O. Box 62 Oak Ridge, TN 37831 Telephone: (865) 576‐8401 Facsimile: (865) 576‐5728 E‐Mail: [email protected] Online ordering: http://www.osti.gov/bridge Available to the public from U.S. Department of Commerce National Technical Information Service 5285 Port Royal Rd. Springfield, VA 22161 Telephone: (800) 553‐6847 Facsimile: (703) 605‐6900 E‐Mail: [email protected] Online order: http://www.ntis.gov/help/ordermethods.asp?loc=7‐4‐0#online
3
SAND2010‐1721 Unlimited Release Printed March 2010
Precision Moisture Generation and Measurement
Adriane N. Irwin, Steven M. Thornberg, and Michael I. White Materials Reliability
Sandia National Laboratories P.O. Box 5800
Albuquerque, New Mexico 87185‐0886
Abstract
In many industrial processes, gaseous moisture is undesirable as it can lead to metal corrosion, polymer degradation, and other materials aging processes. However, generating and measuring precise moisture concentrations is challenging due to the need to cover a broad concentration range (parts‐per‐billion to percent) and the affinity of moisture to a wide range surfaces and materials. This document will discuss the techniques employed by the Mass Spectrometry Laboratory of the Materials Reliability Department at Sandia National Laboratories to generate and measure known gaseous moisture concentrations. This document highlights the use of a chilled mirror and primary standard humidity generator for the characterization of aluminum oxide moisture sensors. The data presented shows an excellent correlation in frost point measured between the two instruments, and thus provides an accurate and reliable platform for characterizing moisture sensors and performing other moisture related experiments.

4
5
CONTENTS
1. Introduction.................................................................................................................... 9
2. Experimental ................................................................................................................ 11 2.1. Moisture Generation Techniques ................................................................................. 12 2.2. Moisture Removal Techniques ..................................................................................... 14 2.3. Moisture Measurement Techniques ............................................................................ 15 2.4. Panametrics Moisture Sensor Characterization ........................................................... 16 2.5. Calibration and Traceability .......................................................................................... 20
3. Conclusions................................................................................................................... 22
4. References.................................................................................................................... 23
Appendix A:................................................................................................................................... 25
FIGURES Figure 1: Comparison of the crystalline structure of molybdenum disulfide and graphite ......... 10 Figure 2: Chemical structure of water .......................................................................................... 10 Figure 3: Effect of pressure and temperature changes on relative humidity .............................. 12 Figure 4: Photograph of a standard salt solution ......................................................................... 13 Figure 5: Schematic of the Thunder Scientific Model 3900 low humidity generator .................. 14 Figure 6: Temperature controlled oven with vacuum supplied by roughing pump .................... 14 Figure 7: Graphic representation of the schematic used for moisture sensor characterization . 17 Figure 8: Photograph of the schematic used for moisture sensor characterization.................... 17 Figure 9: Typical recorded MH values for humidity cycles from 1/12/2009 to 1/19/2009 ......... 18 Figure 10: Recorded MH values for a humidity cycle from 1/12/2009 to 1/14/2009.................. 19 Figure 11: Recorded MH values for a humidity cycle from ‐70C FP to +10C FP ........................ 19 Figure 12: Recorded MH values for Sensor 219733 from 9/10/2008 to 1/16/2009.................... 20 Figure 13: Chilled mirror FP vs moisture generator FP................................................................. 21 Figure 14: Chilled mirror FP – moisture generator FP vs moisture generator FP ........................ 22
TABLES Table 1: Units of measure commonly applied to moisture measurement .................................. 11 Table 2: Common salt solutions with resultant percent relative humidity.................................. 13

6
APPENDIX TABLES Table 1‐A: Thunder Scientific Model 3900 Low Humidity Generator Specifications….………………25 Table 2‐A: GE Panametrics MM3 Moisture Sensor Specifications…………………………….………………26 Table 3‐A: General Eastern Model M3 Chilled Mirror Specifications ……………………………………….27 Table 4‐A: RH Systems Model 373 Chilled Mirror Specifications……………...…….………………………..29
7
NOMENCLATURE %RH percent relative humidity C carbon CMH chilled mirror hygrometry DP dew point DUT device under test FP frost point GE General Electric L liter MEMS microelectro‐mechanical systems MH unit of moisture measurement utilized by General Electric Panametrics sensors MM3 Moisture Monitor Series 3, General Electric Panametrics Mo molybdenum NIST National Institute of Standards and Technology ppb parts per billion ppm parts per million ppmv parts per million by volume Ps saturation pressure Pt test pressure psia pounds‐force per square inch absolute psig pounds‐force per square inch gauge PSL Primary Standards Laboratory S sulfur slpm standard liters per minute SNL Sandia National Laboratories Tt test temperature Ts saturation temperature

8
9
1. INTRODUCTION
Without water, life on earth would not exist, and in certain amounts, it is an essential component to a variety of biological processes, such as decomposition and bacterial growth. However, in many industrial processes, such as aerospace and satellite development, gaseous moisture is undesirable as it can lead to metal corrosion, polymer degradation, and other materials aging processes.1 For example, moisture contamination of the specialty gases used to perform chemical vapor deposition and reactive ion etching in semiconductor fabrication can lead to clogging of gas delivery lines and other reactor problems.2 As a result, it is often necessary to consider the appropriate level of and measure moisture concentrations when optimizing certain industrial processes. To illustrate the importance of accurate moisture generation and measurement, we will briefly discuss the impact of moisture on solid lubricants. In solid lubricants, either too much or too little gaseous moisture can negatively affect the coefficient of friction.
Solid Lubricants
Lubrication is an important aspect to maintaining machinery in proper operating condition as many machine elements, such as bearings, journals, shafts, and joints require proper lubrication between their moving surfaces to decrease friction, prevent contamination, reduce wear, and dissipate heat. Under severe environmental conditions, such as high temperature, high pressure, or vacuum, liquid lubricants are often not suitable and require the use of a solid lubricant. 3 In general, solid lubricants are provided as thin films of the self‐lubricating substance, such as molybdenum disulfide (MoS2) or graphite.
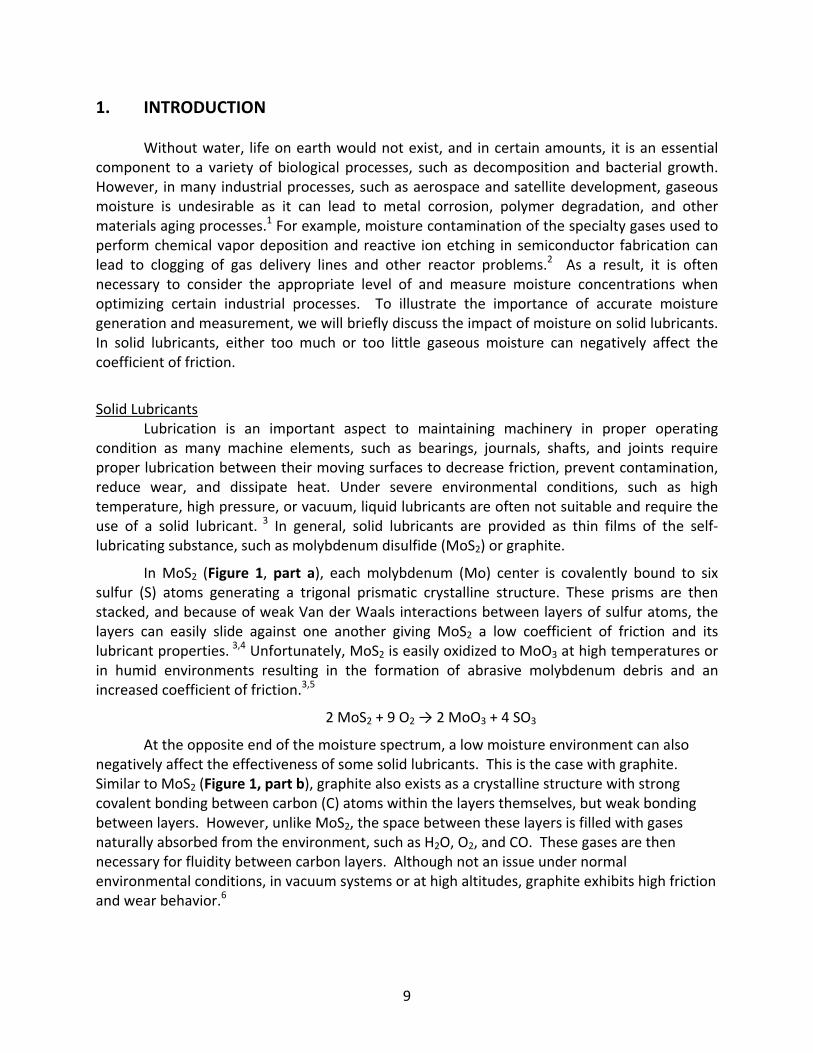
In MoS2 (Figure 1, part a), each molybdenum (Mo) center is covalently bound to six sulfur (S) atoms generating a trigonal prismatic crystalline structure. These prisms are then stacked, and because of weak Van der Waals interactions between layers of sulfur atoms, the layers can easily slide against one another giving MoS2 a low coefficient of friction and its lubricant properties. 3,4 Unfortunately, MoS2 is easily oxidized to MoO3 at high temperatures or in humid environments resulting in the formation of abrasive molybdenum debris and an increased coefficient of friction.3,5
2 MoS2 + 9 O2 → 2 MoO3 + 4 SO3
At the opposite end of the moisture spectrum, a low moisture environment can also negatively affect the effectiveness of some solid lubricants. This is the case with graphite. Similar to MoS2 (Figure 1, part b), graphite also exists as a crystalline structure with strong covalent bonding between carbon (C) atoms within the layers themselves, but weak bonding between layers. However, unlike MoS2, the space between these layers is filled with gases naturally absorbed from the environment, such as H2O, O2, and CO. These gases are then necessary for fluidity between carbon layers. Although not an issue under normal environmental conditions, in vacuum systems or at high altitudes, graphite exhibits high friction and wear behavior.6
10
Figure 1: Comparison of the crystalline structure of molybdenum disulfide and graphite
(a) The Mo center (grey) is covalently bound to six S atoms (yellow) generating layers of a trigonal prismatic crystal structure. (b) The C atoms covalently bind generating layers of a hexangonal lattice.
Images available at: http://www.fhi‐berlin.mpg.de/~hermann/Balsac/BalsacPictures/SSDfig159.gif and http://e‐materials.ensiacet.fr/domains/d02/doc01/graphics/graphite.jpg
As illustrated through this specific example of solid lubricants, both high and low
moisture concentrations can result in the improper lubrication of an industrial system. Likewise, it is critical to accurately and reliably measure and generate moisture concentrations in many of the other areas previously mentioned (i.e., corrosion, polymer degradation, semiconductors).
Moisture Measurement Challenges
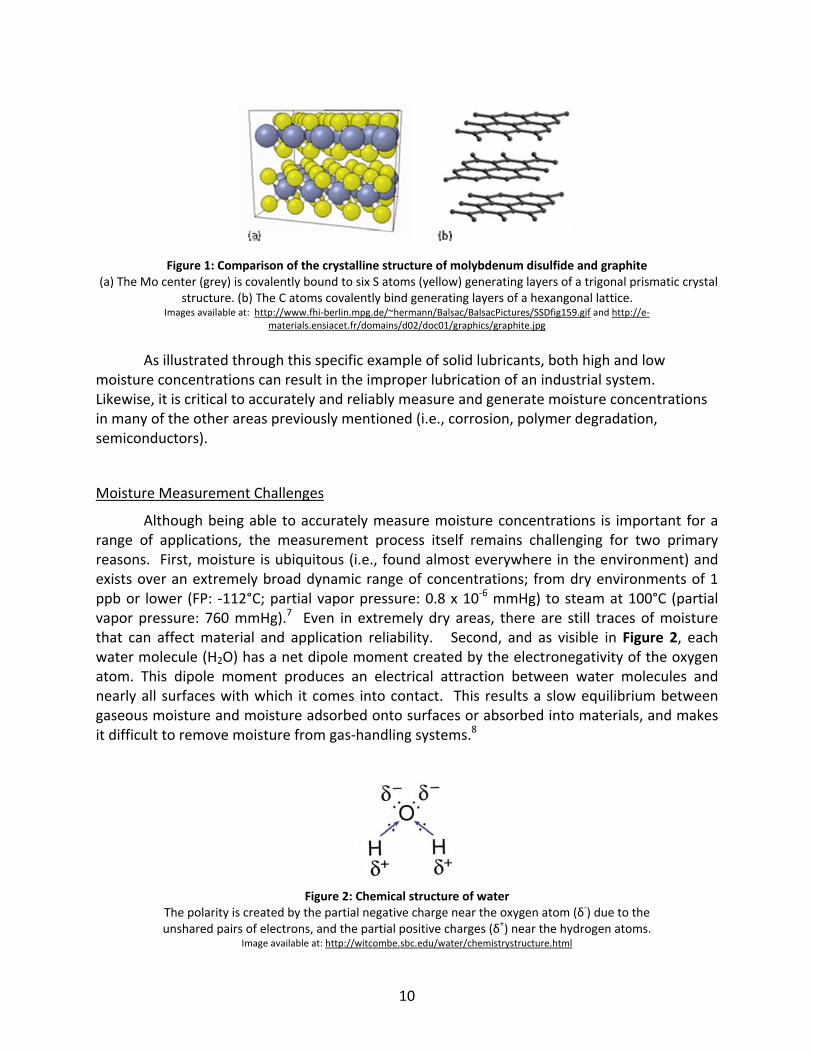
Although being able to accurately measure moisture concentrations is important for a range of applications, the measurement process itself remains challenging for two primary reasons. First, moisture is ubiquitous (i.e., found almost everywhere in the environment) and exists over an extremely broad dynamic range of concentrations; from dry environments of 1 ppb or lower (FP: ‐112°C; partial vapor pressure: 0.8 x 10‐6 mmHg) to steam at 100°C (partial vapor pressure: 760 mmHg).7 Even in extremely dry areas, there are still traces of moisture that can affect material and application reliability. Second, and as visible in Figure 2, each water molecule (H2O) has a net dipole moment created by the electronegativity of the oxygen atom. This dipole moment produces an electrical attraction between water molecules and nearly all surfaces with which it comes into contact. This results a slow equilibrium between gaseous moisture and moisture adsorbed onto surfaces or absorbed into materials, and makes it difficult to remove moisture from gas‐handling systems.8
Figure 2: Chemical structure of water
The polarity is created by the partial negative charge near the oxygen atom (δ‐) due to the unshared pairs of electrons, and the partial positive charges (δ+) near the hydrogen atoms.
Image available at: http://witcombe.sbc.edu/water/chemistrystructure.html
11
This document will discuss the techniques employed by the Mass Spectrometry
Laboratory of the Materials Reliability Department at Sandia National Laboratories (SNL) to measure moisture concentrations, specifically highlighting the role of aluminum oxide moisture sensors. This document will additionally discuss the methods utilized to generate precise moisture concentrations and remove moisture contamination in order to further ensure the accuracy and reliability of the moisture measurement process.
2. EXPERIMENTAL
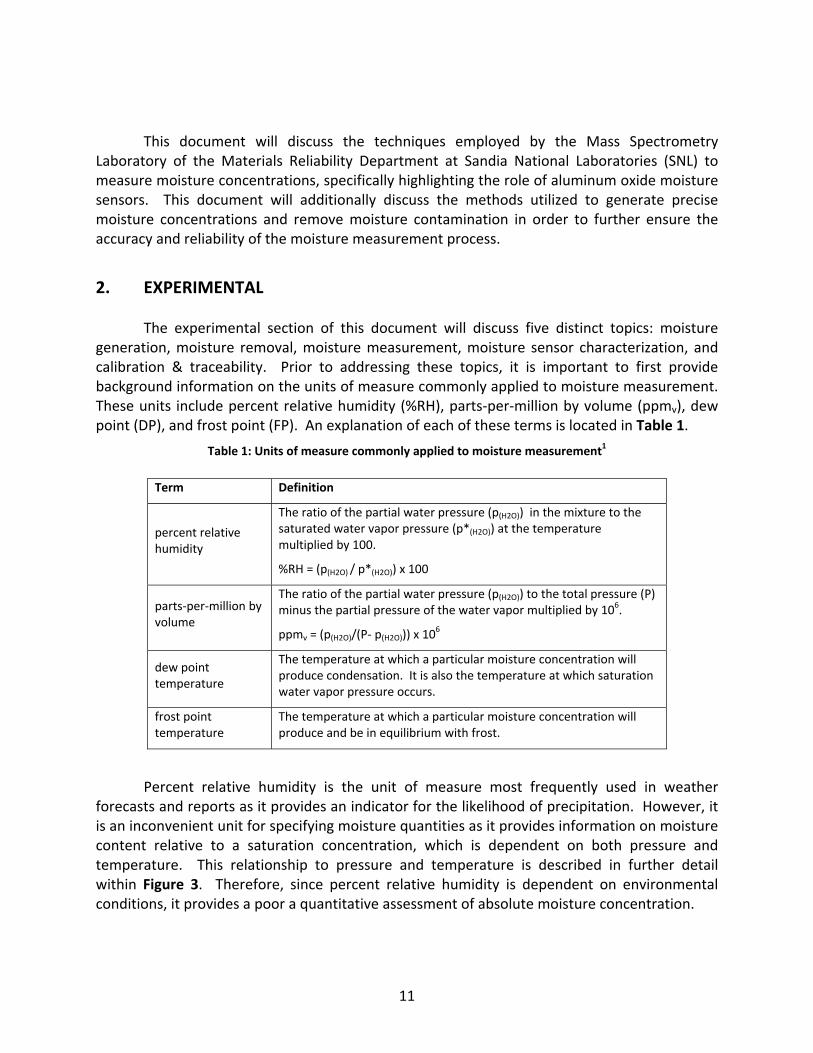
The experimental section of this document will discuss five distinct topics: moisture generation, moisture removal, moisture measurement, moisture sensor characterization, and calibration & traceability. Prior to addressing these topics, it is important to first provide background information on the units of measure commonly applied to moisture measurement. These units include percent relative humidity (%RH), parts‐per‐million by volume (ppmv), dew point (DP), and frost point (FP). An explanation of each of these terms is located in Table 1.
Table 1: Units of measure commonly applied to moisture measurement1
Term Definition
percent relative humidity
The ratio of the partial water pressure (p(H2O)) in the mixture to the saturated water vapor pressure (p*(H2O)) at the temperature multiplied by 100.
%RH = (p(H2O) / p*(H2O)) x 100
parts‐per‐million by volume
The ratio of the partial water pressure (p(H2O)) to the total pressure (P) minus the partial pressure of the water vapor multiplied by 106.
ppmv = (p(H2O)/(P‐ p(H2O))) x 106
dew point temperature
The temperature at which a particular moisture concentration will produce condensation. It is also the temperature at which saturation water vapor pressure occurs.
frost point temperature
The temperature at which a particular moisture concentration will produce and be in equilibrium with frost.
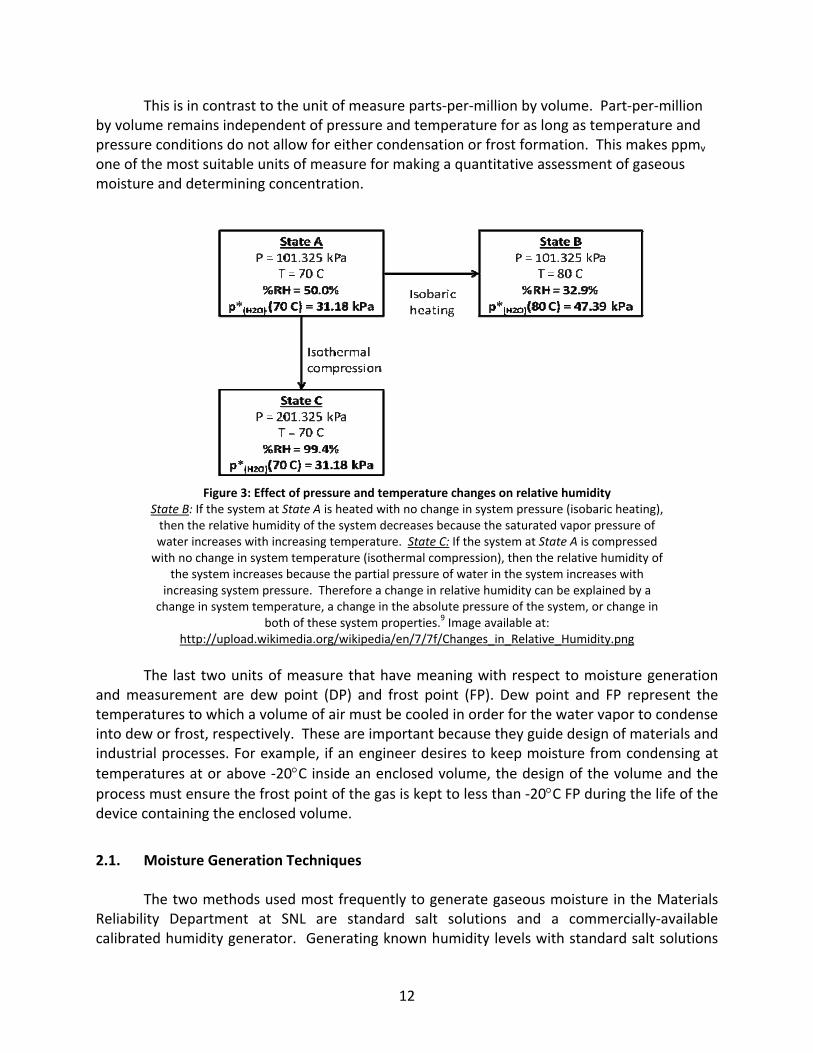
Percent relative humidity is the unit of measure most frequently used in weather forecasts and reports as it provides an indicator for the likelihood of precipitation. However, it is an inconvenient unit for specifying moisture quantities as it provides information on moisture content relative to a saturation concentration, which is dependent on both pressure and temperature. This relationship to pressure and temperature is described in further detail within Figure 3. Therefore, since percent relative humidity is dependent on environmental conditions, it provides a poor a quantitative assessment of absolute moisture concentration.
12
This is in contrast to the unit of measure parts‐per‐million by volume. Part‐per‐million by volume remains independent of pressure and temperature for as long as temperature and pressure conditions do not allow for either condensation or frost formation. This makes ppmv one of the most suitable units of measure for making a quantitative assessment of gaseous moisture and determining concentration.
Figure 3: Effect of pressure and temperature changes on relative humidity
State B: If the system at State A is heated with no change in system pressure (isobaric heating), then the relative humidity of the system decreases because the saturated vapor pressure of water increases with increasing temperature. State C: If the system at State A is compressed with no change in system temperature (isothermal compression), then the relative humidity of
the system increases because the partial pressure of water in the system increases with increasing system pressure. Therefore a change in relative humidity can be explained by a
change in system temperature, a change in the absolute pressure of the system, or change in both of these system properties.9 Image available at:
http://upload.wikimedia.org/wikipedia/en/7/7f/Changes_in_Relative_Humidity.png
The last two units of measure that have meaning with respect to moisture generation
and measurement are dew point (DP) and frost point (FP). Dew point and FP represent the temperatures to which a volume of air must be cooled in order for the water vapor to condense into dew or frost, respectively. These are important because they guide design of materials and industrial processes. For example, if an engineer desires to keep moisture from condensing at
temperatures at or above ‐20C inside an enclosed volume, the design of the volume and the
process must ensure the frost point of the gas is kept to less than ‐20C FP during the life of the device containing the enclosed volume.
2.1. Moisture Generation Techniques
The two methods used most frequently to generate gaseous moisture in the Materials Reliability Department at SNL are standard salt solutions and a commercially‐available calibrated humidity generator. Generating known humidity levels with standard salt solutions
13
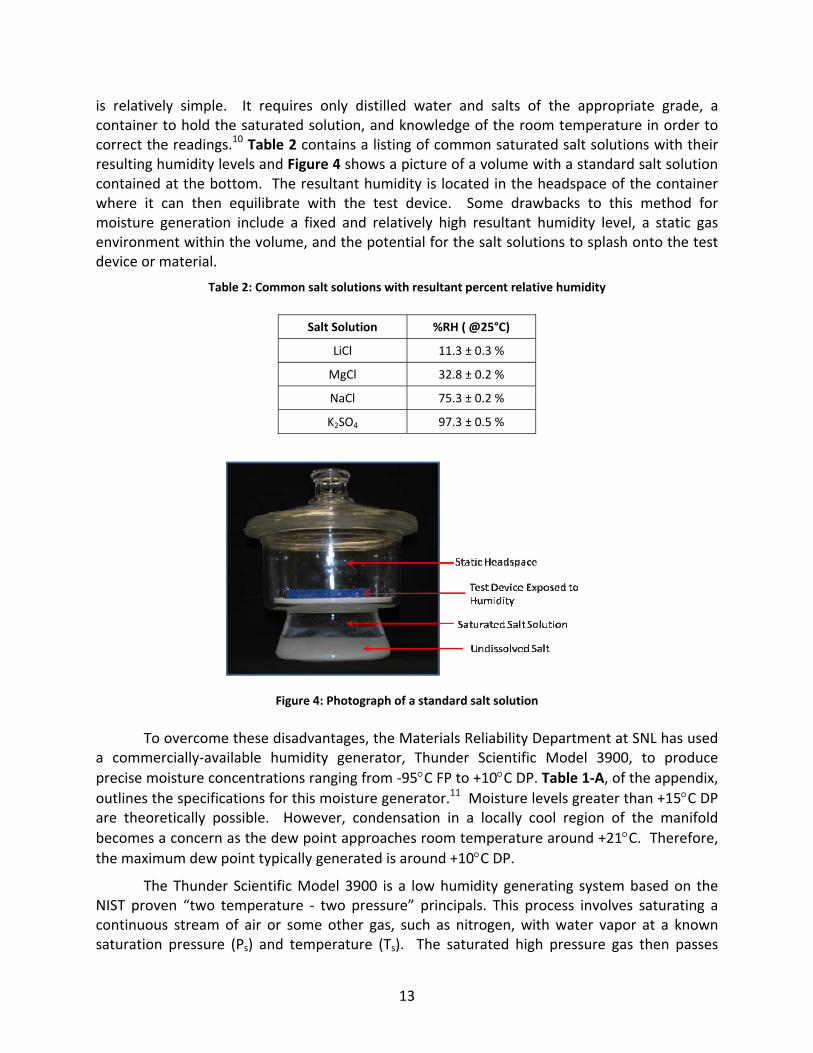
is relatively simple. It requires only distilled water and salts of the appropriate grade, a container to hold the saturated solution, and knowledge of the room temperature in order to correct the readings.10 Table 2 contains a listing of common saturated salt solutions with their resulting humidity levels and Figure 4 shows a picture of a volume with a standard salt solution contained at the bottom. The resultant humidity is located in the headspace of the container where it can then equilibrate with the test device. Some drawbacks to this method for moisture generation include a fixed and relatively high resultant humidity level, a static gas environment within the volume, and the potential for the salt solutions to splash onto the test device or material.
Table 2: Common salt solutions with resultant percent relative humidity
Salt Solution %RH ( @25°C)
LiCl 11.3 ± 0.3 %
MgCl 32.8 ± 0.2 %
NaCl 75.3 ± 0.2 %
K2SO4 97.3 ± 0.5 %
Figure 4: Photograph of a standard salt solution
To overcome these disadvantages, the Materials Reliability Department at SNL has used
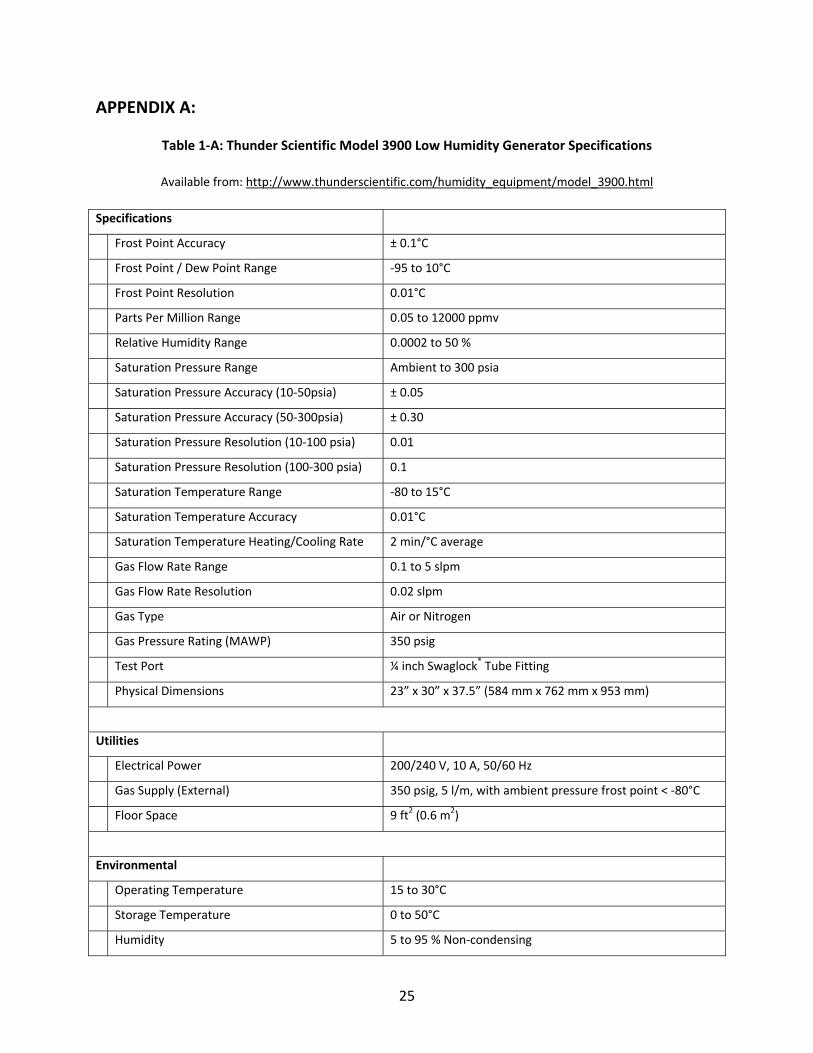
a commercially‐available humidity generator, Thunder Scientific Model 3900, to produce
precise moisture concentrations ranging from ‐95C FP to +10C DP. Table 1‐A, of the appendix, outlines the specifications for this moisture generator.11 Moisture levels greater than +15C DP are theoretically possible. However, condensation in a locally cool region of the manifold
becomes a concern as the dew point approaches room temperature around +21C. Therefore, the maximum dew point typically generated is around +10C DP.
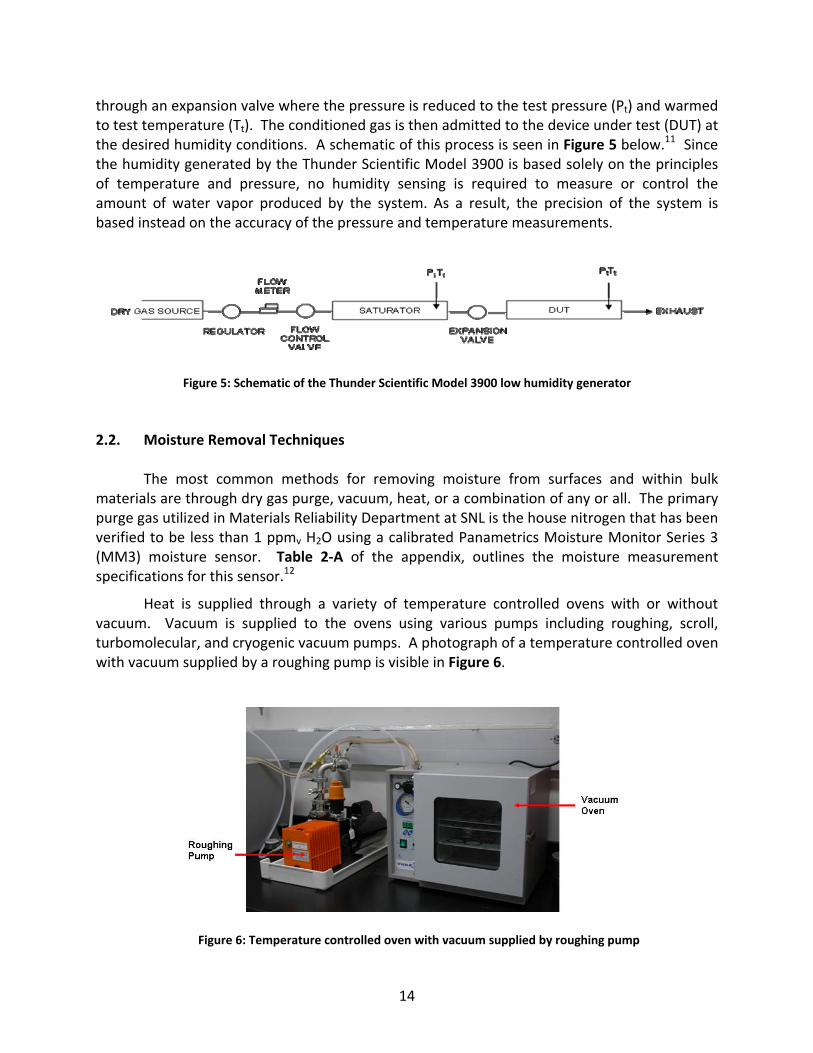
The Thunder Scientific Model 3900 is a low humidity generating system based on the NIST proven “two temperature ‐ two pressure” principals. This process involves saturating a continuous stream of air or some other gas, such as nitrogen, with water vapor at a known saturation pressure (Ps) and temperature (Ts). The saturated high pressure gas then passes
14
through an expansion valve where the pressure is reduced to the test pressure (Pt) and warmed to test temperature (Tt). The conditioned gas is then admitted to the device under test (DUT) at the desired humidity conditions. A schematic of this process is seen in Figure 5 below.11 Since the humidity generated by the Thunder Scientific Model 3900 is based solely on the principles of temperature and pressure, no humidity sensing is required to measure or control the amount of water vapor produced by the system. As a result, the precision of the system is based instead on the accuracy of the pressure and temperature measurements.
Figure 5: Schematic of the Thunder Scientific Model 3900 low humidity generator
2.2. Moisture Removal Techniques
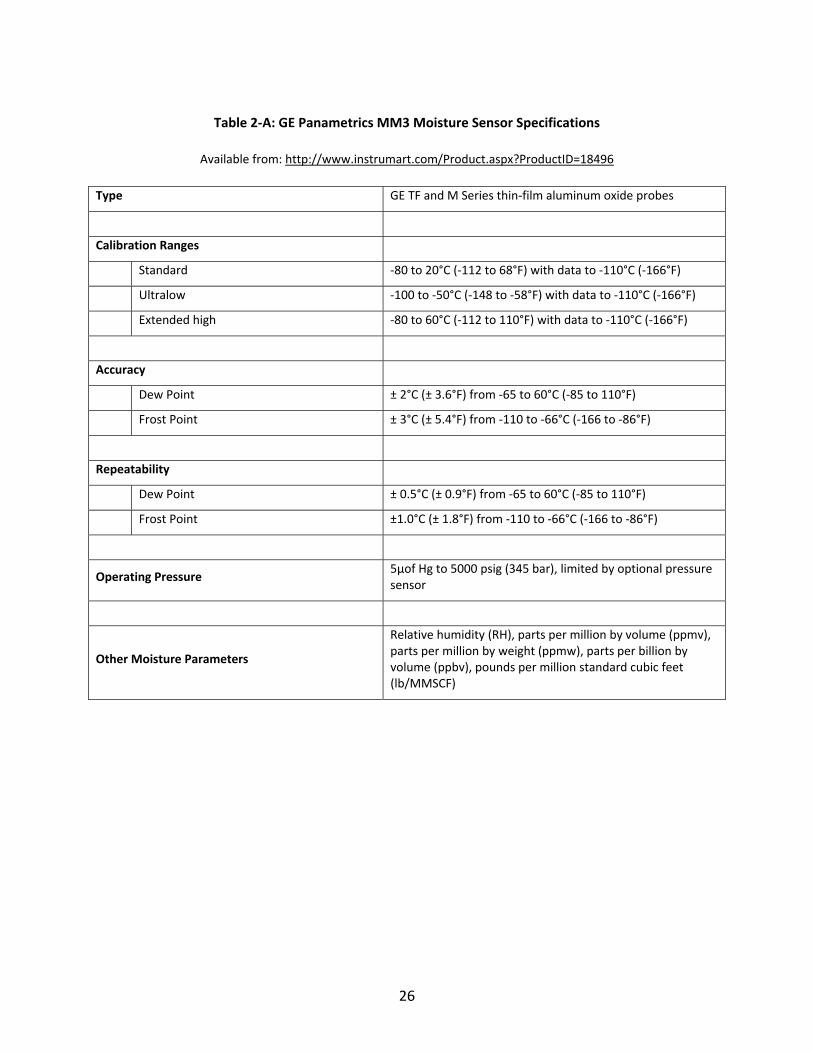
The most common methods for removing moisture from surfaces and within bulk materials are through dry gas purge, vacuum, heat, or a combination of any or all. The primary purge gas utilized in Materials Reliability Department at SNL is the house nitrogen that has been verified to be less than 1 ppmv H2O using a calibrated Panametrics Moisture Monitor Series 3 (MM3) moisture sensor. Table 2‐A of the appendix, outlines the moisture measurement specifications for this sensor.12
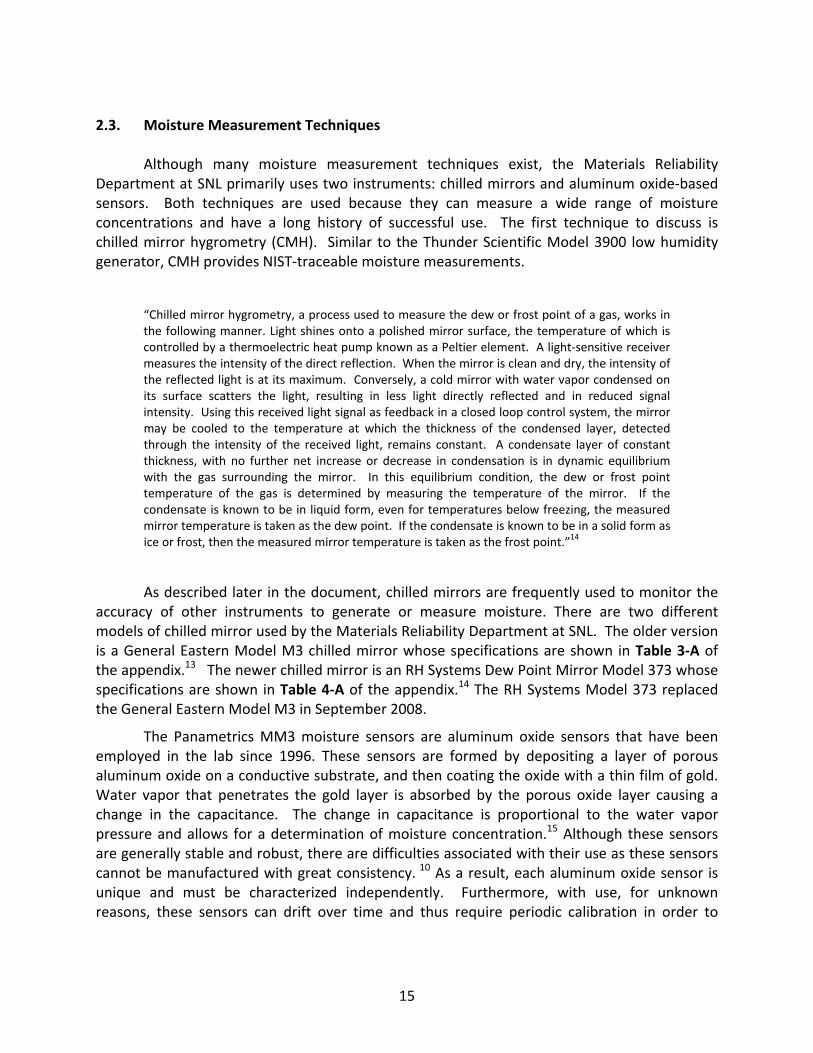
Heat is supplied through a variety of temperature controlled ovens with or without vacuum. Vacuum is supplied to the ovens using various pumps including roughing, scroll, turbomolecular, and cryogenic vacuum pumps. A photograph of a temperature controlled oven with vacuum supplied by a roughing pump is visible in Figure 6.
Figure 6: Temperature controlled oven with vacuum supplied by roughing pump
15
2.3. Moisture Measurement Techniques
Although many moisture measurement techniques exist, the Materials Reliability Department at SNL primarily uses two instruments: chilled mirrors and aluminum oxide‐based sensors. Both techniques are used because they can measure a wide range of moisture concentrations and have a long history of successful use. The first technique to discuss is chilled mirror hygrometry (CMH). Similar to the Thunder Scientific Model 3900 low humidity generator, CMH provides NIST‐traceable moisture measurements.
“Chilled mirror hygrometry, a process used to measure the dew or frost point of a gas, works in the following manner. Light shines onto a polished mirror surface, the temperature of which is controlled by a thermoelectric heat pump known as a Peltier element. A light‐sensitive receiver measures the intensity of the direct reflection. When the mirror is clean and dry, the intensity of the reflected light is at its maximum. Conversely, a cold mirror with water vapor condensed on its surface scatters the light, resulting in less light directly reflected and in reduced signal intensity. Using this received light signal as feedback in a closed loop control system, the mirror may be cooled to the temperature at which the thickness of the condensed layer, detected through the intensity of the received light, remains constant. A condensate layer of constant thickness, with no further net increase or decrease in condensation is in dynamic equilibrium with the gas surrounding the mirror. In this equilibrium condition, the dew or frost point temperature of the gas is determined by measuring the temperature of the mirror. If the condensate is known to be in liquid form, even for temperatures below freezing, the measured mirror temperature is taken as the dew point. If the condensate is known to be in a solid form as ice or frost, then the measured mirror temperature is taken as the frost point.”14
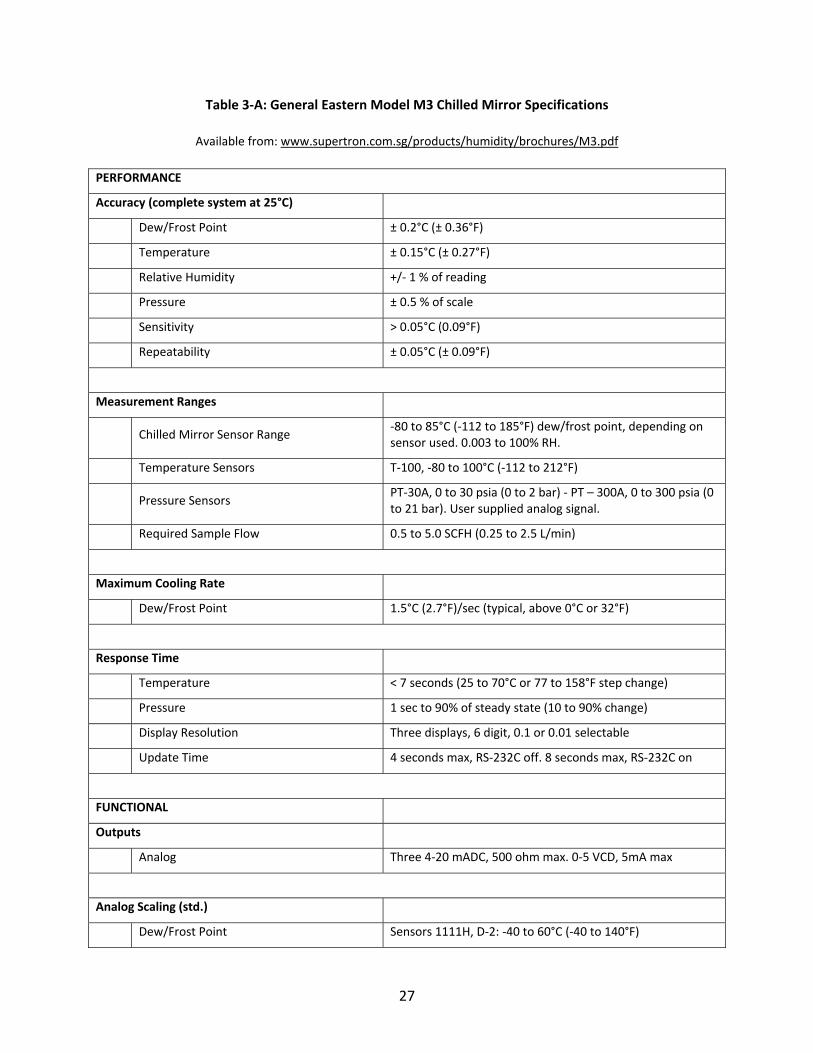
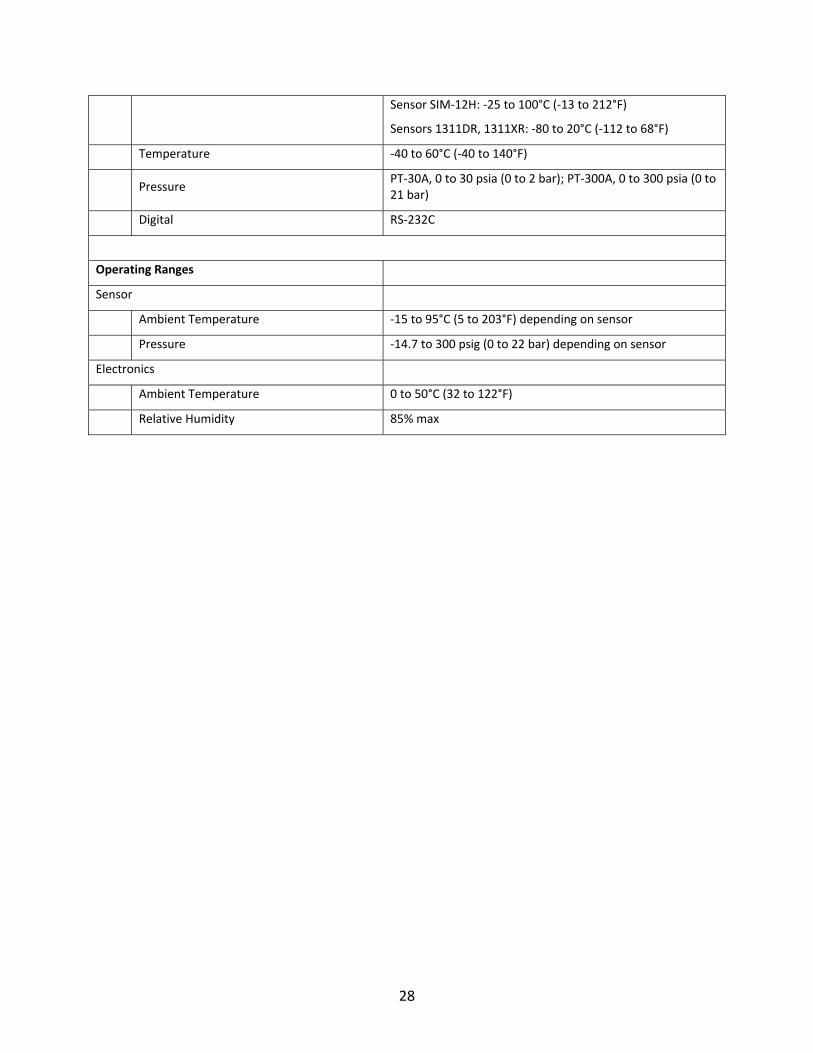
As described later in the document, chilled mirrors are frequently used to monitor the accuracy of other instruments to generate or measure moisture. There are two different models of chilled mirror used by the Materials Reliability Department at SNL. The older version is a General Eastern Model M3 chilled mirror whose specifications are shown in Table 3‐A of the appendix.13 The newer chilled mirror is an RH Systems Dew Point Mirror Model 373 whose specifications are shown in Table 4‐A of the appendix.14 The RH Systems Model 373 replaced the General Eastern Model M3 in September 2008.
The Panametrics MM3 moisture sensors are aluminum oxide sensors that have been employed in the lab since 1996. These sensors are formed by depositing a layer of porous aluminum oxide on a conductive substrate, and then coating the oxide with a thin film of gold. Water vapor that penetrates the gold layer is absorbed by the porous oxide layer causing a change in the capacitance. The change in capacitance is proportional to the water vapor pressure and allows for a determination of moisture concentration.15 Although these sensors are generally stable and robust, there are difficulties associated with their use as these sensors cannot be manufactured with great consistency. 10 As a result, each aluminum oxide sensor is unique and must be characterized independently. Furthermore, with use, for unknown reasons, these sensors can drift over time and thus require periodic calibration in order to
16
ensure confidence in the data collected. The process for overcoming these obstacles and characterizing each sensor is presented in the following section.
2.4. Panametrics Moisture Sensor Characterization
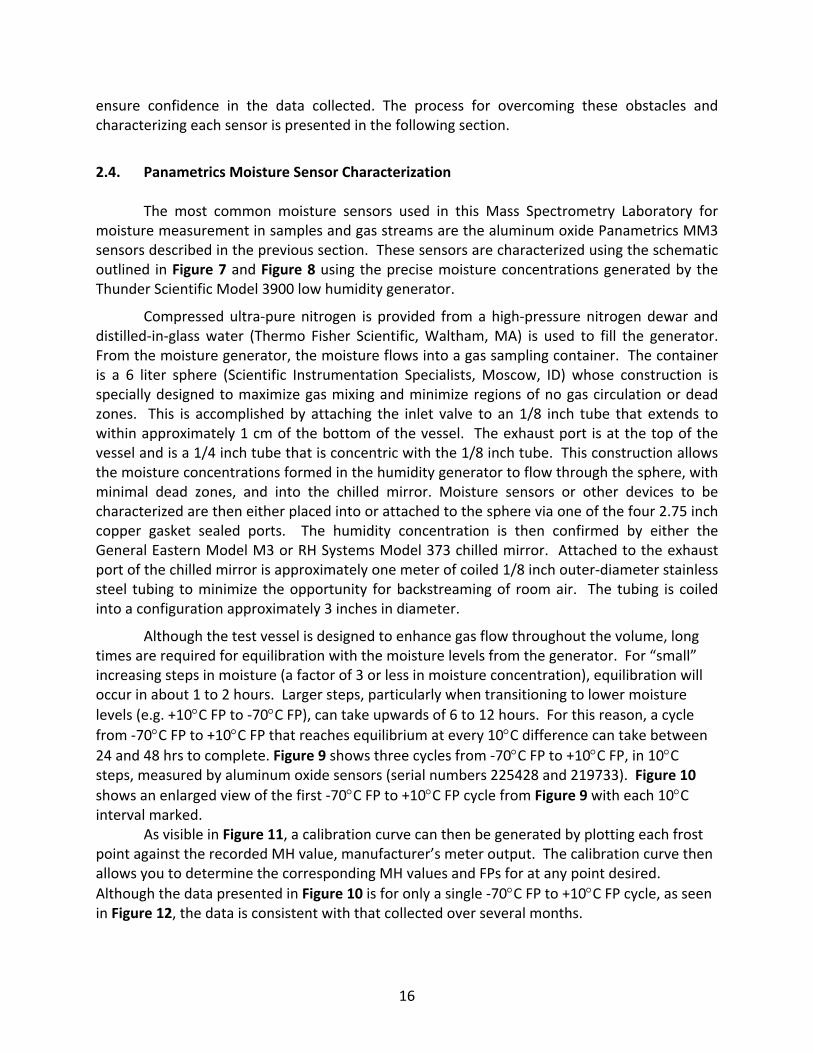
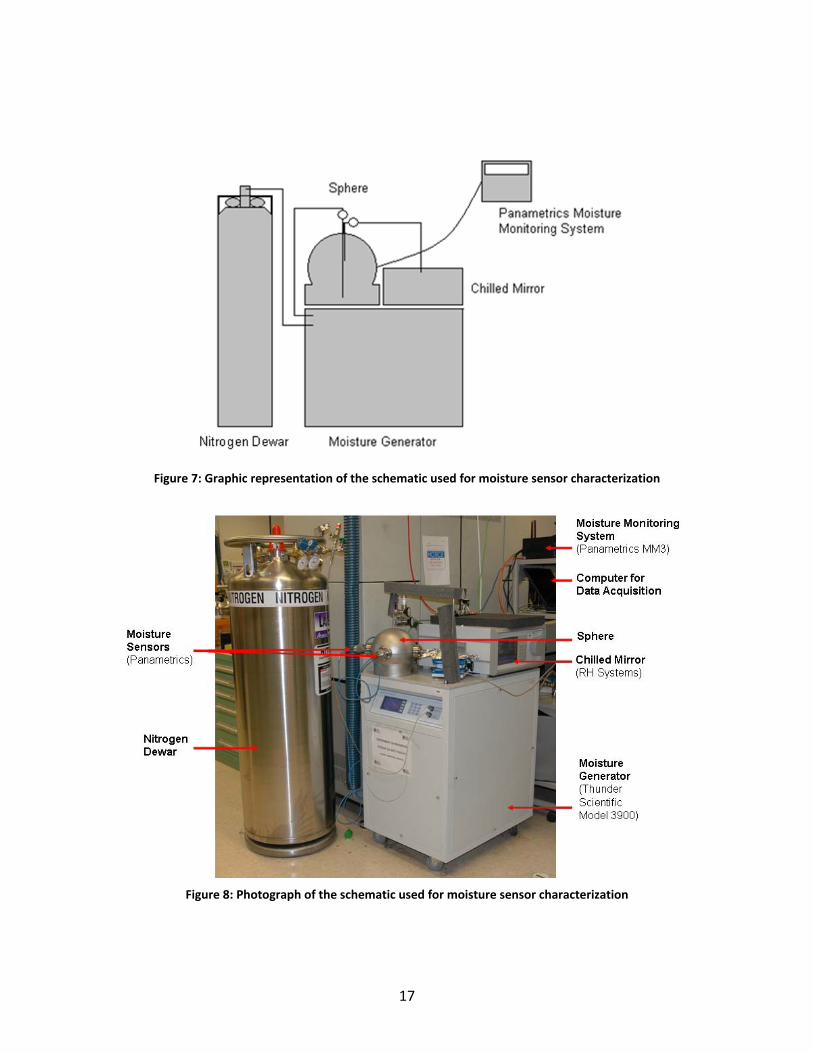
The most common moisture sensors used in this Mass Spectrometry Laboratory for moisture measurement in samples and gas streams are the aluminum oxide Panametrics MM3 sensors described in the previous section. These sensors are characterized using the schematic outlined in Figure 7 and Figure 8 using the precise moisture concentrations generated by the Thunder Scientific Model 3900 low humidity generator.
Compressed ultra‐pure nitrogen is provided from a high‐pressure nitrogen dewar and distilled‐in‐glass water (Thermo Fisher Scientific, Waltham, MA) is used to fill the generator. From the moisture generator, the moisture flows into a gas sampling container. The container is a 6 liter sphere (Scientific Instrumentation Specialists, Moscow, ID) whose construction is specially designed to maximize gas mixing and minimize regions of no gas circulation or dead zones. This is accomplished by attaching the inlet valve to an 1/8 inch tube that extends to within approximately 1 cm of the bottom of the vessel. The exhaust port is at the top of the vessel and is a 1/4 inch tube that is concentric with the 1/8 inch tube. This construction allows the moisture concentrations formed in the humidity generator to flow through the sphere, with minimal dead zones, and into the chilled mirror. Moisture sensors or other devices to be characterized are then either placed into or attached to the sphere via one of the four 2.75 inch copper gasket sealed ports. The humidity concentration is then confirmed by either the General Eastern Model M3 or RH Systems Model 373 chilled mirror. Attached to the exhaust port of the chilled mirror is approximately one meter of coiled 1/8 inch outer‐diameter stainless steel tubing to minimize the opportunity for backstreaming of room air. The tubing is coiled into a configuration approximately 3 inches in diameter.
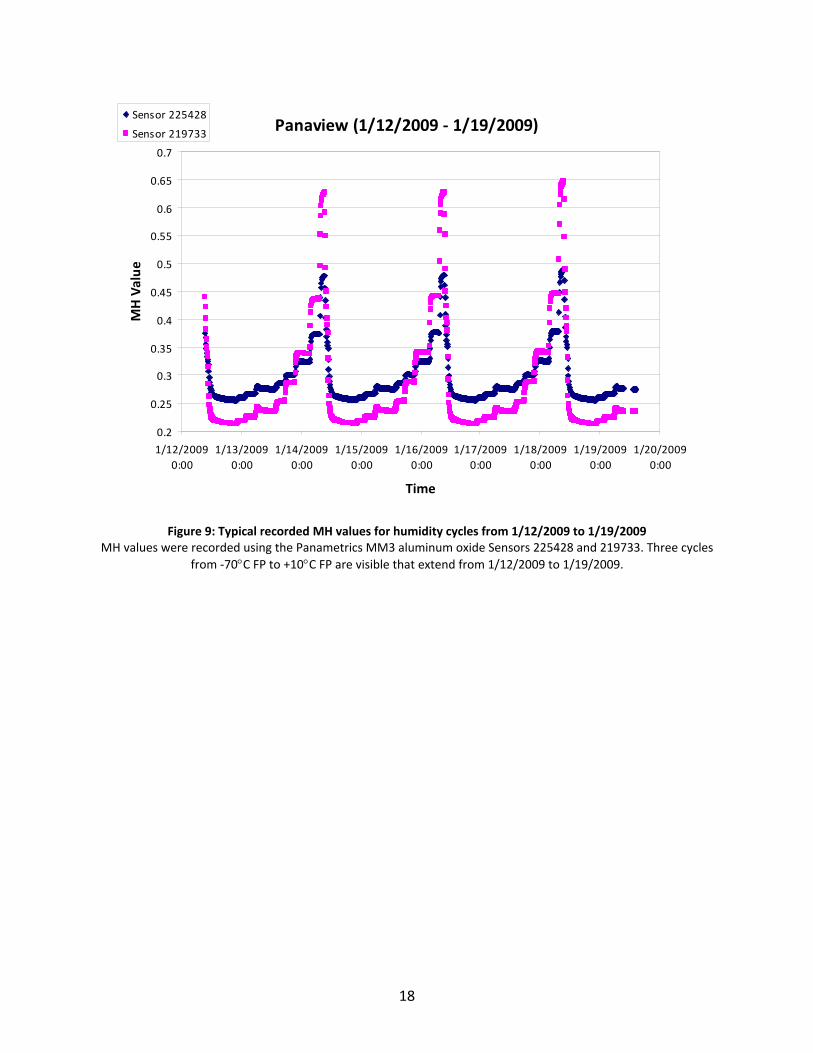
Although the test vessel is designed to enhance gas flow throughout the volume, long times are required for equilibration with the moisture levels from the generator. For “small” increasing steps in moisture (a factor of 3 or less in moisture concentration), equilibration will occur in about 1 to 2 hours. Larger steps, particularly when transitioning to lower moisture
levels (e.g. +10C FP to ‐70C FP), can take upwards of 6 to 12 hours. For this reason, a cycle from ‐70C FP to +10C FP that reaches equilibrium at every 10C difference can take between 24 and 48 hrs to complete. Figure 9 shows three cycles from ‐70C FP to +10C FP, in 10C steps, measured by aluminum oxide sensors (serial numbers 225428 and 219733). Figure 10
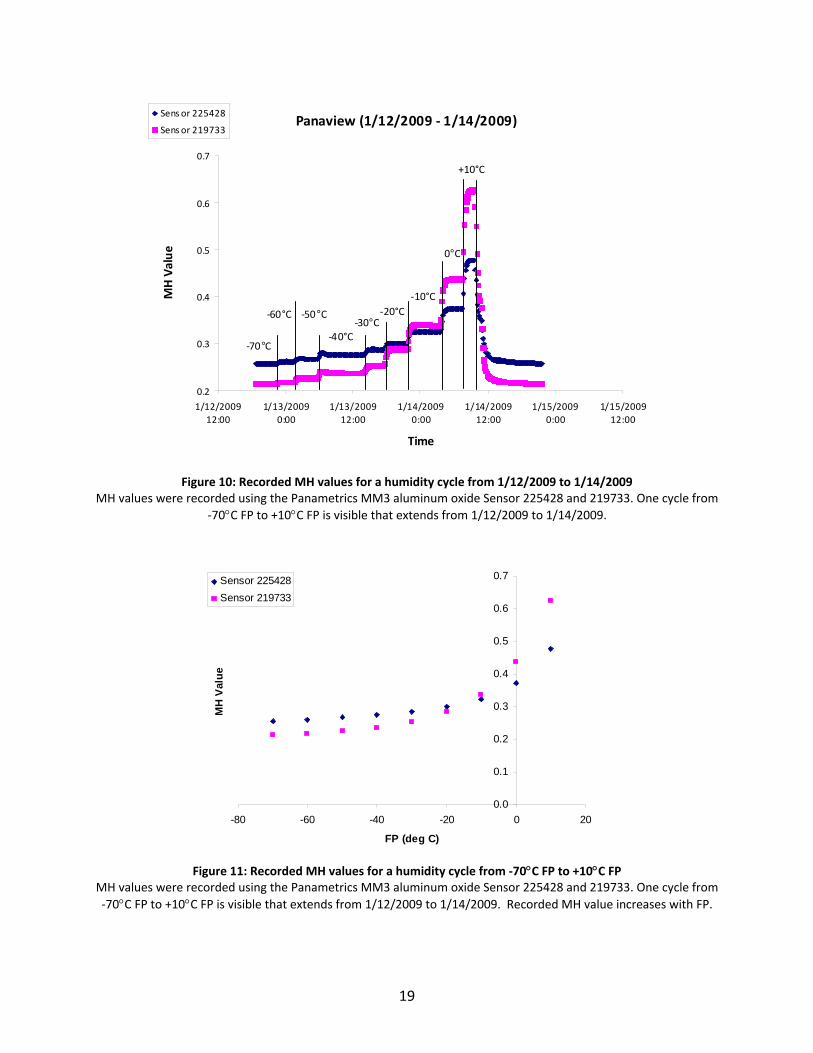
shows an enlarged view of the first ‐70C FP to +10C FP cycle from Figure 9 with each 10C interval marked.
As visible in Figure 11, a calibration curve can then be generated by plotting each frost point against the recorded MH value, manufacturer’s meter output. The calibration curve then allows you to determine the corresponding MH values and FPs for at any point desired.
Although the data presented in Figure 10 is for only a single ‐70C FP to +10C FP cycle, as seen in Figure 12, the data is consistent with that collected over several months.
17
Figure 7: Graphic representation of the schematic used for moisture sensor characterization
Figure 8: Photograph of the schematic used for moisture sensor characterization
18
Panaview (1/12/2009 ‐ 1/19/2009)
0.2
0.25
0.3
0.35
0.4
0.45
0.5
0.55
0.6
0.65
0.7
1/12/2009
0:00
1/13/2009
0:00
1/14/2009
0:00
1/15/2009
0:00
1/16/2009
0:00
1/17/2009
0:00
1/18/2009
0:00
1/19/2009
0:00
1/20/2009
0:00
Time
MH Value
Sensor 225428
Sensor 219733
Figure 9: Typical recorded MH values for humidity cycles from 1/12/2009 to 1/19/2009 MH values were recorded using the Panametrics MM3 aluminum oxide Sensors 225428 and 219733. Three cycles
from ‐70C FP to +10C FP are visible that extend from 1/12/2009 to 1/19/2009.
19
Panaview (1/12/2009 ‐ 1/14/2009)
0.2
0.3
0.4
0.5
0.6
0.7
1/12/2009
12:00
1/13/2009
0:00
1/13/2009
12:00
1/14/2009
0:00
1/14/2009
12:00
1/15/2009
0:00
1/15/2009
12:00
Time
MH Value
Sens or 225428
Sens or 219733
‐70°C
+10°C
0°C
‐10°C
‐20°C‐30°C
‐40°C
‐50°C‐60°C
Panaview (1/12/2009 ‐ 1/14/2009)
0.2
0.3
0.4
0.5
0.6
0.7
1/12/2009
12:00
1/13/2009
0:00
1/13/2009
12:00
1/14/2009
0:00
1/14/2009
12:00
1/15/2009
0:00
1/15/2009
12:00
Time
MH Value
Sens or 225428
Sens or 219733
‐70°C
+10°C
0°C
‐10°C
‐20°C‐30°C
‐40°C
‐50°C‐60°C
Figure 10: Recorded MH values for a humidity cycle from 1/12/2009 to 1/14/2009
MH values were recorded using the Panametrics MM3 aluminum oxide Sensor 225428 and 219733. One cycle from
‐70C FP to +10C FP is visible that extends from 1/12/2009 to 1/14/2009.
0.0
0.1
0.2
0.3
0.4
0.5
0.6
0.7
-80 -60 -40 -20 0 20
FP (deg C)
MH
Val
ue
Sensor 225428
Sensor 219733
Figure 11: Recorded MH values for a humidity cycle from ‐70C FP to +10C FP
MH values were recorded using the Panametrics MM3 aluminum oxide Sensor 225428 and 219733. One cycle from
‐70C FP to +10C FP is visible that extends from 1/12/2009 to 1/14/2009. Recorded MH value increases with FP.
20
Sensor 219733
0.0
0.1
0.2
0.3
0.4
0.5
0.6
0.7
-80 -60 -40 -20 0 20
FP (deg C)
MH
Val
ue
9/10/2008 9/11/2008
9/12/2008 9/13/2008
9/14/2008 9/15/2008
9/26/2008 9/28/2008
9/28/2008 9/29/2008
9/30/2008 10/6/2008
10/7/2008 10/8/2008
10/9/2008 10/10/2008
10/11/2008 10/12/2008
10/13/2008 10/14/2008
11/7/2008 11/10/2008
11/12/2008 11/14/2008
11/19/2008 11/21/2008
11/23/2008 11/25/2008
11/27/2008 11/29/2008
12/1/2008 12/3/2008
12/5/2008 12/7/2008
12/10/2008 12/12/2008
12/14/2008 12/16/2008
1/12/2009 1/14/2009
1/16/2009
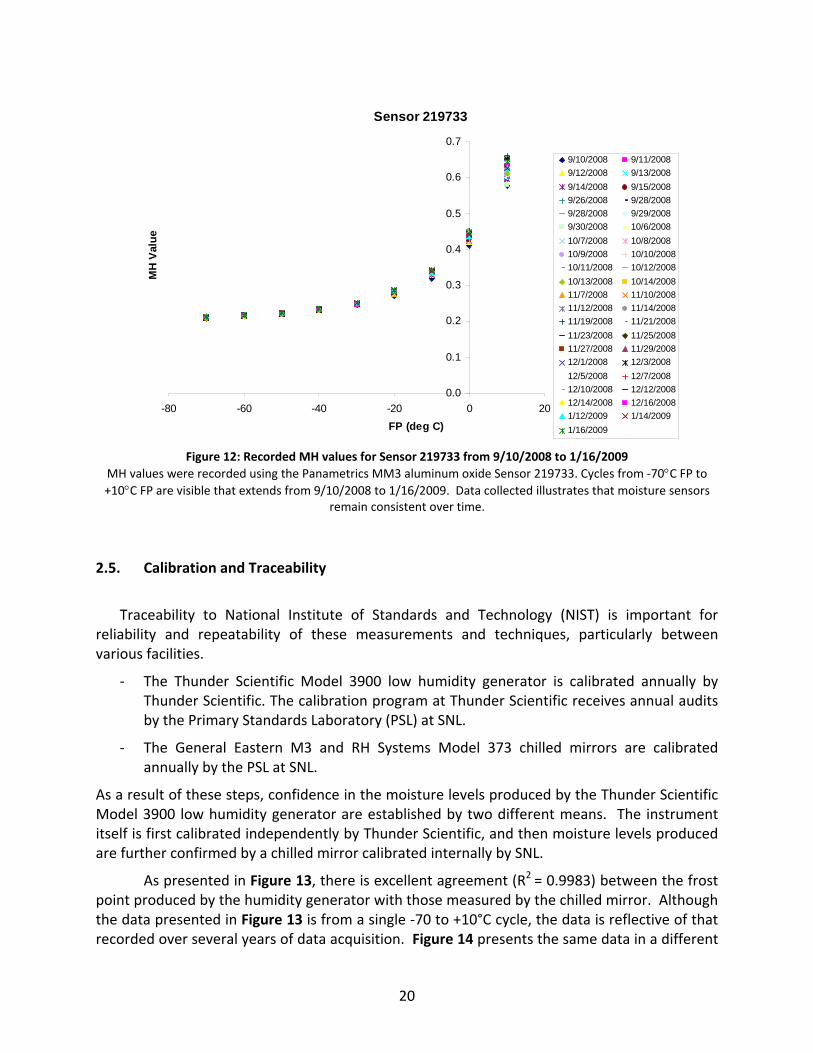
Figure 12: Recorded MH values for Sensor 219733 from 9/10/2008 to 1/16/2009
MH values were recorded using the Panametrics MM3 aluminum oxide Sensor 219733. Cycles from ‐70C FP to +10C FP are visible that extends from 9/10/2008 to 1/16/2009. Data collected illustrates that moisture sensors
remain consistent over time.
2.5. Calibration and Traceability
Traceability to National Institute of Standards and Technology (NIST) is important for reliability and repeatability of these measurements and techniques, particularly between various facilities.
‐ The Thunder Scientific Model 3900 low humidity generator is calibrated annually by Thunder Scientific. The calibration program at Thunder Scientific receives annual audits by the Primary Standards Laboratory (PSL) at SNL.
‐ The General Eastern M3 and RH Systems Model 373 chilled mirrors are calibrated annually by the PSL at SNL.
As a result of these steps, confidence in the moisture levels produced by the Thunder Scientific Model 3900 low humidity generator are established by two different means. The instrument itself is first calibrated independently by Thunder Scientific, and then moisture levels produced are further confirmed by a chilled mirror calibrated internally by SNL.
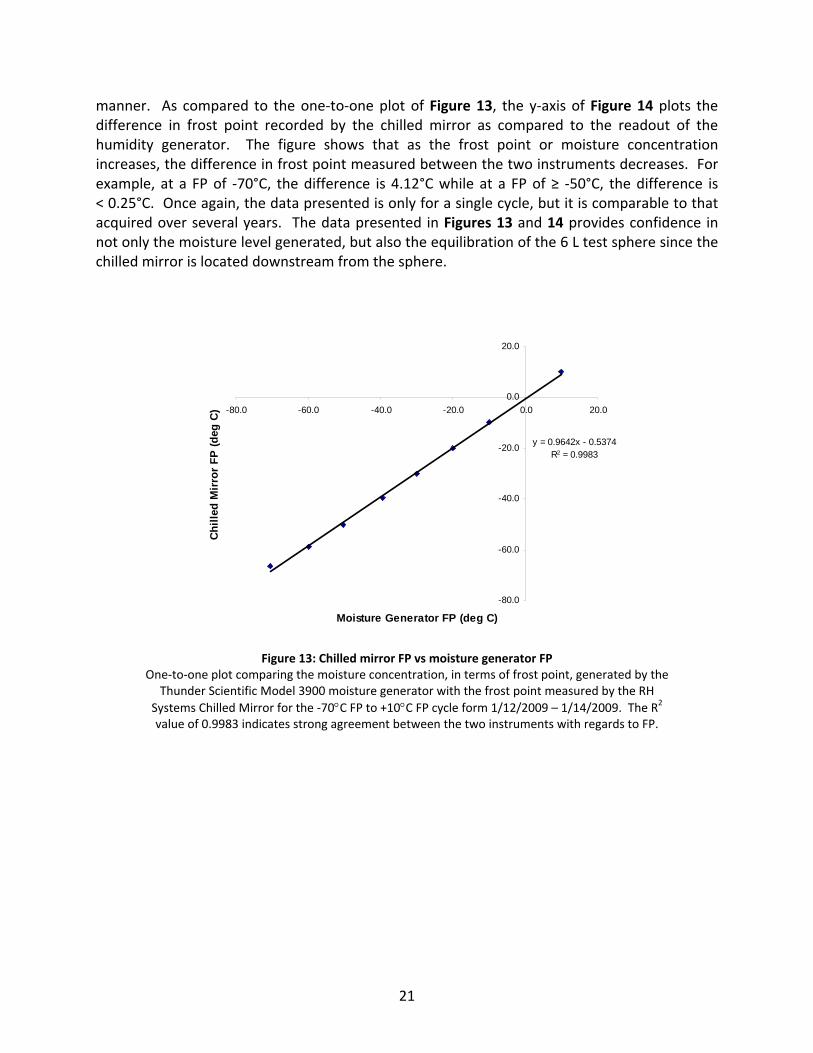
As presented in Figure 13, there is excellent agreement (R2 = 0.9983) between the frost point produced by the humidity generator with those measured by the chilled mirror. Although the data presented in Figure 13 is from a single ‐70 to +10°C cycle, the data is reflective of that recorded over several years of data acquisition. Figure 14 presents the same data in a different
21
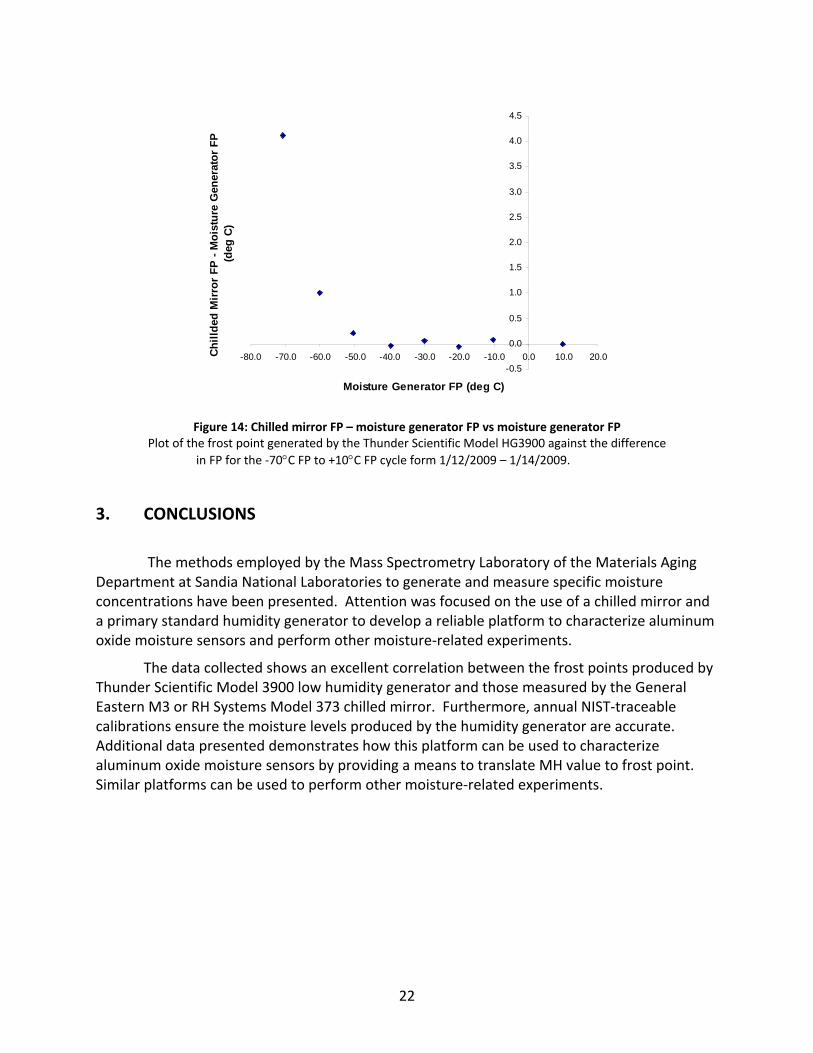
manner. As compared to the one‐to‐one plot of Figure 13, the y‐axis of Figure 14 plots the difference in frost point recorded by the chilled mirror as compared to the readout of the humidity generator. The figure shows that as the frost point or moisture concentration increases, the difference in frost point measured between the two instruments decreases. For example, at a FP of ‐70°C, the difference is 4.12°C while at a FP of ≥ ‐50°C, the difference is < 0.25°C. Once again, the data presented is only for a single cycle, but it is comparable to that acquired over several years. The data presented in Figures 13 and 14 provides confidence in not only the moisture level generated, but also the equilibration of the 6 L test sphere since the chilled mirror is located downstream from the sphere.
y = 0.9642x - 0.5374R2 = 0.9983
-80.0
-60.0
-40.0
-20.0
0.0
20.0
-80.0 -60.0 -40.0 -20.0 0.0 20.0
Moisture Generator FP (deg C)
Ch
ille
d M
irro
r F
P (
deg
C)
Figure 13: Chilled mirror FP vs moisture generator FP One‐to‐one plot comparing the moisture concentration, in terms of frost point, generated by the
Thunder Scientific Model 3900 moisture generator with the frost point measured by the RH
Systems Chilled Mirror for the ‐70C FP to +10C FP cycle form 1/12/2009 – 1/14/2009. The R2 value of 0.9983 indicates strong agreement between the two instruments with regards to FP.
22
-0.5
0.0
0.5
1.0
1.5
2.0
2.5
3.0
3.5
4.0
4.5
-80.0 -70.0 -60.0 -50.0 -40.0 -30.0 -20.0 -10.0 0.0 10.0 20.0
Moisture Generator FP (deg C)
Ch
illd
ed M
irro
r F
P -
Mo
istu
re G
ener
ato
r F
P
(deg
C)
Figure 14: Chilled mirror FP – moisture generator FP vs moisture generator FP Plot of the frost point generated by the Thunder Scientific Model HG3900 against the difference
in FP for the ‐70C FP to +10C FP cycle form 1/12/2009 – 1/14/2009.
3. CONCLUSIONS
The methods employed by the Mass Spectrometry Laboratory of the Materials Aging Department at Sandia National Laboratories to generate and measure specific moisture concentrations have been presented. Attention was focused on the use of a chilled mirror and a primary standard humidity generator to develop a reliable platform to characterize aluminum oxide moisture sensors and perform other moisture‐related experiments.
The data collected shows an excellent correlation between the frost points produced by Thunder Scientific Model 3900 low humidity generator and those measured by the General Eastern M3 or RH Systems Model 373 chilled mirror. Furthermore, annual NIST‐traceable calibrations ensure the moisture levels produced by the humidity generator are accurate. Additional data presented demonstrates how this platform can be used to characterize aluminum oxide moisture sensors by providing a means to translate MH value to frost point. Similar platforms can be used to perform other moisture‐related experiments.
23
4. REFERENCES
1. D. Roveti and K. Soleyn, A review of humidity sensors, in Measurements and Control, vol. 33, pp. 105‐10, 1999.
2. T. Ohmi, N. Masakauza, N. Ohki, K. Kawada, and K. Hirao, Trace moisture analysis in specialty
gases, in Journal of the Electrochemical Society, vol. 139, no. 9, pp. 2654‐8, 1992.
3. J.A. Picas, A. Forn, M. Baile, and E. Martin, Humidity effect on friction and wear behavior of self‐lubricant coatings, in Surface Engineering, vol. 22, no. 4, pp. 314‐9, 2006.
4. F.A. Cotton and G. Wilkinson, Advanced Inorganic Chemistry, John Wiley & Sons, Canada, 1972.
5. J. Moser and F. Levy, MoS2_x lubricating films: structure and wear mechanism investigated by cross‐sectional transmission electron microscopy, in Thin Solid Films, vol. 228, pp. 257‐60, 1993.
6. Stanford Linear Accelerator Center 2575, Origin of low‐friction behavior in graphite investigated by surface x‐ray diffraction, SLAC‐PUB‐10429, Stanford Synchroton Radiation Laboratory, Menlo Park, CA, May 2004.
7. P.E. Wiederhold, Fundamentals of Moisture & Humidity ‐ Part 1 – Definitions and Specifications,
in Measurements & Control, vol. 187, pp. 97‐108, 1998.
8. F. Mermoud, M.D. Brandt, J. McAdrew, Low‐level moisture generation, in Analytical Chemistry, vol. 63, no. 3, pp. 198‐202, 1991.
9. Relative humidity [webpage on the internet]. Wikipedia Foundation, Inc; last updated 9 Dec 09, last accessed 10 Dec 09. Available from: http://en.wikipedia.org/wiki/Relative_humidity.
10. N.I. Dubovikov, O.A. Podmurnaya, Measuring the relative humidity over salt solutions, in
Measurment Techniques, vol. 44, no. 12, pp. 1260‐1, 2001.
11. Model 3900 “Two‐Pressure Two‐Temperature Low Humidity Generator” [product information sheet on the internet]. Albuquerque: Thunder Scientific Corporation; c2008. Available from: http://www.thunderscientific.com/humidity_equipment/model_3900.html.
12. Moisture Monitor Series 3 [product information sheet on the internet]. Waltham, MA: General
Electric Corporation; c1997‐2007. Available from: http://www.instrumart.com/Product.aspx?ProductID=18496
13. M3 Chilled Mirror Monitor [product information sheet on the internet]. Woburn, MA: General
Eastern Instruments Inc. Available from: www.supertron.com.sg/products/humidity/brochures/M3.pdf

24
14. RH Systems Dew Point Mirror 373 [product information sheet on the internet]. Albuquerque, NM: RH Systems; last accessed 16 January 2009. Available from: http://www.rhsystems.net/product_373.php
15. P.E. Wiederhold, Fundamentals of Moisture & Humidity ‐ Part 3 – Humidity measurement methods, vol. 190, pp. 131‐143, 1998.
25
APPENDIX A:
Table 1‐A: Thunder Scientific Model 3900 Low Humidity Generator Specifications
Available from: http://www.thunderscientific.com/humidity_equipment/model_3900.html
Specifications
Frost Point Accuracy ± 0.1°C
Frost Point / Dew Point Range ‐95 to 10°C
Frost Point Resolution 0.01°C
Parts Per Million Range 0.05 to 12000 ppmv
Relative Humidity Range 0.0002 to 50 %
Saturation Pressure Range Ambient to 300 psia
Saturation Pressure Accuracy (10‐50psia) ± 0.05
Saturation Pressure Accuracy (50‐300psia) ± 0.30
Saturation Pressure Resolution (10‐100 psia) 0.01
Saturation Pressure Resolution (100‐300 psia) 0.1
Saturation Temperature Range ‐80 to 15°C
Saturation Temperature Accuracy 0.01°C
Saturation Temperature Heating/Cooling Rate 2 min/°C average
Gas Flow Rate Range 0.1 to 5 slpm
Gas Flow Rate Resolution 0.02 slpm
Gas Type Air or Nitrogen
Gas Pressure Rating (MAWP) 350 psig
Test Port ¼ inch Swaglock® Tube Fitting
Physical Dimensions 23” x 30” x 37.5” (584 mm x 762 mm x 953 mm)
Utilities
Electrical Power 200/240 V, 10 A, 50/60 Hz
Gas Supply (External) 350 psig, 5 l/m, with ambient pressure frost point < ‐80°C
Floor Space 9 ft2 (0.6 m2)
Environmental
Operating Temperature 15 to 30°C
Storage Temperature 0 to 50°C
Humidity 5 to 95 % Non‐condensing
26
Table 2‐A: GE Panametrics MM3 Moisture Sensor Specifications
Available from: http://www.instrumart.com/Product.aspx?ProductID=18496
Type GE TF and M Series thin‐film aluminum oxide probes
Calibration Ranges
Standard ‐80 to 20°C (‐112 to 68°F) with data to ‐110°C (‐166°F)
Ultralow ‐100 to ‐50°C (‐148 to ‐58°F) with data to ‐110°C (‐166°F)
Extended high ‐80 to 60°C (‐112 to 110°F) with data to ‐110°C (‐166°F)
Accuracy
Dew Point ± 2°C (± 3.6°F) from ‐65 to 60°C (‐85 to 110°F)
Frost Point ± 3°C (± 5.4°F) from ‐110 to ‐66°C (‐166 to ‐86°F)
Repeatability
Dew Point ± 0.5°C (± 0.9°F) from ‐65 to 60°C (‐85 to 110°F)
Frost Point ±1.0°C (± 1.8°F) from ‐110 to ‐66°C (‐166 to ‐86°F)
Operating Pressure 5μof Hg to 5000 psig (345 bar), limited by optional pressure sensor
Other Moisture Parameters
Relative humidity (RH), parts per million by volume (ppmv), parts per million by weight (ppmw), parts per billion by volume (ppbv), pounds per million standard cubic feet (lb/MMSCF)
27
Table 3‐A: General Eastern Model M3 Chilled Mirror Specifications
Available from: www.supertron.com.sg/products/humidity/brochures/M3.pdf
PERFORMANCE
Accuracy (complete system at 25°C)
Dew/Frost Point ± 0.2°C (± 0.36°F)
Temperature ± 0.15°C (± 0.27°F)
Relative Humidity +/‐ 1 % of reading
Pressure ± 0.5 % of scale
Sensitivity > 0.05°C (0.09°F)
Repeatability ± 0.05°C (± 0.09°F)
Measurement Ranges
Chilled Mirror Sensor Range ‐80 to 85°C (‐112 to 185°F) dew/frost point, depending on sensor used. 0.003 to 100% RH.
Temperature Sensors T‐100, ‐80 to 100°C (‐112 to 212°F)
Pressure Sensors PT‐30A, 0 to 30 psia (0 to 2 bar) ‐ PT – 300A, 0 to 300 psia (0 to 21 bar). User supplied analog signal.
Required Sample Flow 0.5 to 5.0 SCFH (0.25 to 2.5 L/min)
Maximum Cooling Rate
Dew/Frost Point 1.5°C (2.7°F)/sec (typical, above 0°C or 32°F)
Response Time
Temperature < 7 seconds (25 to 70°C or 77 to 158°F step change)
Pressure 1 sec to 90% of steady state (10 to 90% change)
Display Resolution Three displays, 6 digit, 0.1 or 0.01 selectable
Update Time 4 seconds max, RS‐232C off. 8 seconds max, RS‐232C on
FUNCTIONAL
Outputs
Analog Three 4‐20 mADC, 500 ohm max. 0‐5 VCD, 5mA max
Analog Scaling (std.)
Dew/Frost Point Sensors 1111H, D‐2: ‐40 to 60°C (‐40 to 140°F)
28
Sensor SIM‐12H: ‐25 to 100°C (‐13 to 212°F)
Sensors 1311DR, 1311XR: ‐80 to 20°C (‐112 to 68°F)
Temperature ‐40 to 60°C (‐40 to 140°F)
Pressure PT‐30A, 0 to 30 psia (0 to 2 bar); PT‐300A, 0 to 300 psia (0 to 21 bar)
Digital RS‐232C
Operating Ranges
Sensor
Ambient Temperature ‐15 to 95°C (5 to 203°F) depending on sensor
Pressure ‐14.7 to 300 psig (0 to 22 bar) depending on sensor
Electronics
Ambient Temperature 0 to 50°C (32 to 122°F)
Relative Humidity 85% max
29
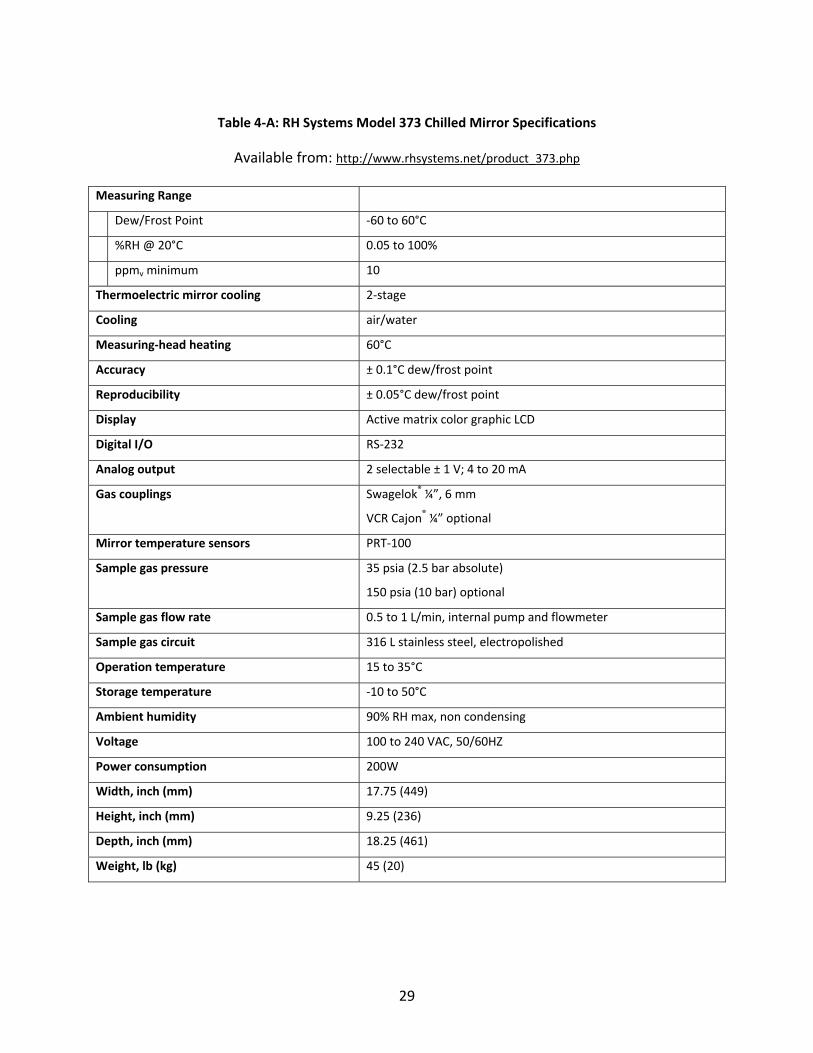
Table 4‐A: RH Systems Model 373 Chilled Mirror Specifications
Available from: http://www.rhsystems.net/product_373.php
Measuring Range
Dew/Frost Point ‐60 to 60°C
%RH @ 20°C 0.05 to 100%
ppmv minimum 10
Thermoelectric mirror cooling 2‐stage
Cooling air/water
Measuring‐head heating 60°C
Accuracy ± 0.1°C dew/frost point
Reproducibility ± 0.05°C dew/frost point
Display Active matrix color graphic LCD
Digital I/O RS‐232
Analog output 2 selectable ± 1 V; 4 to 20 mA
Gas couplings Swagelok® ¼”, 6 mm
VCR Cajon® ¼” optional
Mirror temperature sensors PRT‐100
Sample gas pressure 35 psia (2.5 bar absolute)
150 psia (10 bar) optional
Sample gas flow rate 0.5 to 1 L/min, internal pump and flowmeter
Sample gas circuit 316 L stainless steel, electropolished
Operation temperature 15 to 35°C
Storage temperature ‐10 to 50°C
Ambient humidity 90% RH max, non condensing
Voltage 100 to 240 VAC, 50/60HZ
Power consumption 200W
Width, inch (mm) 17.75 (449)
Height, inch (mm) 9.25 (236)
Depth, inch (mm) 18.25 (461)
Weight, lb (kg) 45 (20)

30
Distribution 1 MS0889 Jason R. Brown 1825 1 MS0889 Jill Glass 1825 1 MS0481 Randy Harrison 2132 1 MS0889 James M. Hochrein 1825 1 MS0886 Adriane N. Irwin 1825 1 MS1425 Kent B. Pfeifer 1717 11 MS0889 Steven M. Thornberg 1825 1 MS0889 Michael I. White 1825 1 MS0899 Technical Library 9536 (electronic copy)