Embed Size (px)
Citation preview
PRECONCENTRATION OF RARE EARTH ELEMENTS (REEs) USING SILICA GEL
MODIFIED WITH SEVERAL FUNCTIONAL GROUPS
A Thesis Submitted to the Graduate School of Engineering and Sciences of zmir Institute of Technology in Partial Fulfillment of the
Requirements for the Degree of
MASTER OF SCIENCE
in Chemistry
by Semira ÜNAL
July 2007 ZMR
We approve the thesis of Semira ÜNAL
Date of Signature
........................................ 19 July 2007 Assoc. Prof. Dr. Ahmet E. EROLU Supervisor Department of Chemistry zmir Institute of Technology ........................................ 19 July 2007 Assoc. Prof. Dr. Talal SHAHWAN Co-Supervisor Department of Chemistry zmir Institute of Technology ........................................ 19 July 2007 Assist. Prof. Dr. Ali ÇAIR Co-Supervisor Department of Chemistry zmir Institute of Technology ........................................ 19 July 2007 Assoc. Prof. Dr. Durmu ÖZDEMR Department of Chemistry zmir Institute of Technology ........................................ 19 July 2007 Prof. Dr. Emür HENDEN Department of Chemistry Ege University ........................................ 19 July 2007 Assoc. Prof. Dr. Nusret ERTA Division of Analytical Chemistry Gazi University ........................................ 19 July 2007 Prof. Dr. Levent ARTOK Head of Department zmir Institute of Technology
.........................................................
Prof. Dr. M. Barı ÖZERDEM Head of the Graduate School

ACKNOWLEDGEMENTS
I would like to express my sincere gratitude to my supervisor, Assoc. Prof. Dr.
Ahmet EROLU, for his supervision, guidance, support, and encouragement throughout
my study. I am also grateful to my co-supervisors Assoc. Prof. Dr. Talal SHAHWAN and
Assist. Prof. Dr. Ali ÇAIR for their valuable recommendations.
I specially express thanks to members of the thesis committee, Prof. Dr. Emür
HENDEN, Assoc. Prof. Dr. Nusret ERTA and Assoc. Prof. Dr. Durmu ÖZDEMR for
their valuable comments.
I would like to thank to research specialists Oya ALTUNGÖZ and Sinan
YILMAZ for their contributions during the ICP-MS and ICP-OES analyses. Special
thanks to Evrim YAKUT and Duygu OUZ at Material Research Center for their help in
performing SEM/EDX and TGA analyses.
Also I deeply appreciate the support of my friend Rsch. Assist. Kader REYHAN.
Special thanks to my friends Ayegül EKER, Ezel BOYACI, Nazlı EFECAN, Özge
TUNUSOLU, Elif KUMRAL and Meral KARACA for their helps during laboratory
studies.
Finally, I would like to thank to my family for their support, encouragement, and
understanding.
iv
ABSTRACT
PRECONCENTRATION OF RARE EARTH ELEMENTS (REEs) USING
SILICA GEL MODIFIED WITH SEVERAL FUNCTIONAL GROUPS
Determination of rare earth elements (REEs) in environmental samples can be
performed by inductively coupled plasma optical emission spectrometry (ICP-OES) and
inductively coupled plasma mass spectrometry (ICP-MS), in addition to other
spectrometric and chromatographic methods. Although these plasma-based techniques
offer a good quality data for the determination of REEs, an efficient
separation/preconcentration technique prior to instrumental measurements may still be
required due to low concentrations and the presence of heavy matrix, in order to achieve
accurate and reliable results.
In this study, silica gel modified with various organic compound containing S
and N functional groups was proposed as adsorbent material for preconcentration of
REEs in environmental waters before ICP-MS determination. These organic compounds
are (3-aminopropyl)trimethoxysilane (APTMS), (3-mercaptopropyl)trimethoxysilane
(MPTMS), 2–aminophenol, 2-aminothiophenol, 2-aminobenzothiazole and L-glutamic
acid dimethyl ester. It was shown that REEs can be sorbed by only APTMS and
MPTMS modified silica gel quantitatively in a broad pH range (pH>3). At high REEs
concentration APTMS modified silica gel (silica-amino) worked better than silica gel.
Up to 10.0 mg/L, silica-amino have sorbed higher than 80% of the REEs while silica gel
could sorb only 30% of them. Among the sorbents investigated silica-amino was chosen
for subsequent experiments. Desorption from APTMS modified silica and silica gel was
realised with 1.0 M HNO3. Spike recovery tests were performed in various water types
including ultra pure water, sea water, tap water and geothermal water and were found to
change between 81-110%.
v
ÖZET
NADR TOPRAK ELEMENTLERNN ÇETL FONKSYONEL
GRUPLARLA MODFYE EDLM SLKA JEL LE
ÖN-DERTRLMES
Çevre örneklerindeki nadir toprak element tayinleri genellikle spektrometrik ve
kromatografik tekniklerinin yanı sıra plazma teknikleri (endüktif elemi plazma optik
emisyon spektrometri, ICP-OES, ve endüktif elemi plazma kütle spektrometri, ICP-
MS) ile gerçekletirilmektedir. Plazmaya dayalı bu teknikler nadir toprak elementlerinin
tayini için etkili yöntemler olarak bilinse de; bu elementlerin deriimlerinin çok düük
olması ve numunelerin içerdii aır matriksten dolayı, doru ve güvenilir sonuçlar elde
etmek için enstrümantal ölçümlerden önce etkili bir matriks ayırma/ön-deritirme ilemi
gerekmektedir.
Bu çalımada, silika jele N ve S fonksiyonel grup içeren çeitli organik gruplar
takılmaya çalıılmıtır. Modifiye silika jelin, çevre örneklerindeki nadir toprak
elementlerinin ICP-MS veya ICP-OES ile tayininden önce ön-deritirilmesinde
kullanılması önerilmektedir. Bu organik gruplar (3-aminopropil)trimetoksisilan,
(3-merkaptopropil)trimetoksisilan, 2-aminofenol, 2-aminotiyofenol, 2-aminobenzotiazol
ve L-glutamik asit dimetil esterdir. Çalımalar nadir toprak elementlerinin sadece
(3-aminopropil)trimetoksisilan, (3-merkaptopropil)trimetoksisilan modifiye edilmi
silika jel tarafından geni bir pH aralıında tutunduklarını (pH>3) göstermitir. Yüksek
deriimlerde yapılan sorpsiyon çalımalarında, silika-aminonun, 10.0 mg/L’ye kadar
olan deriimlerdeki nadir toprak elementlerini %80’den daha fazla bir oranda tuttuu
bulunurken, silika jel sadece %30’unu tutabilmitir. Sorbentten geri alma
çalımalarında, 1.0 M HNO3 kullanılmıtır. Takip eden çalımalar silika-amino ile
gerçekletirilmitir. Deiyonize su, çeme suyu, deniz suyu ve jeotermal sulara dıardan
yapılan katımların geri kazanım testlerinde (spike recovery tests), %81-110 arasında
deien deerler elde edilmitir.
vi
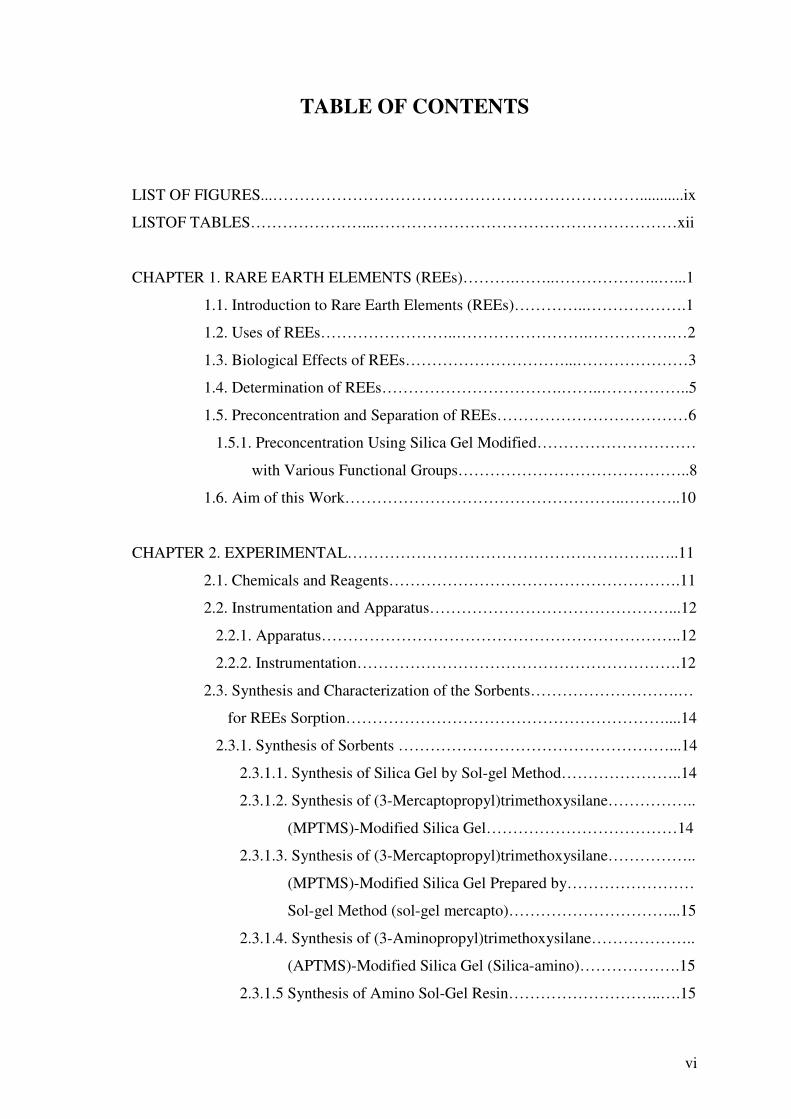
TABLE OF CONTENTS
LIST OF FIGURES...……………………………………………………………...........ix
LISTOF TABLES…………………...…………………………………………………xii
CHAPTER 1. RARE EARTH ELEMENTS (REEs)……….……..………………..…...1
1.1. Introduction to Rare Earth Elements (REEs)…………..……………….1
1.2. Uses of REEs……………………..…………………….…………….…2
1.3. Biological Effects of REEs…………………………...…………………3
1.4. Determination of REEs…………………………….……..……………..5
1.5. Preconcentration and Separation of REEs………………………………6
1.5.1. Preconcentration Using Silica Gel Modified…………………………
with Various Functional Groups……………………………………..8
1.6. Aim of this Work……………………………………………..………..10
CHAPTER 2. EXPERIMENTAL………………………………………………….…..11
2.1. Chemicals and Reagents……………………………………………….11
2.2. Instrumentation and Apparatus………………………………………...12
2.2.1. Apparatus…………………………………………………………..12
2.2.2. Instrumentation…………………………………………………….12
2.3. Synthesis and Characterization of the Sorbents……………………….…
for REEs Sorption……………………………………………………....14
2.3.1. Synthesis of Sorbents ……………………………………………...14
2.3.1.1. Synthesis of Silica Gel by Sol-gel Method…………………..14
2.3.1.2. Synthesis of (3-Mercaptopropyl)trimethoxysilane……………..
(MPTMS)-Modified Silica Gel………………………………14
2.3.1.3. Synthesis of (3-Mercaptopropyl)trimethoxysilane……………..
(MPTMS)-Modified Silica Gel Prepared by……………………
Sol-gel Method (sol-gel mercapto)…………………………...15
2.3.1.4. Synthesis of (3-Aminopropyl)trimethoxysilane………………..
(APTMS)-Modified Silica Gel (Silica-amino)……………….15
2.3.1.5 Synthesis of Amino Sol-Gel Resin………………………..….15
vii
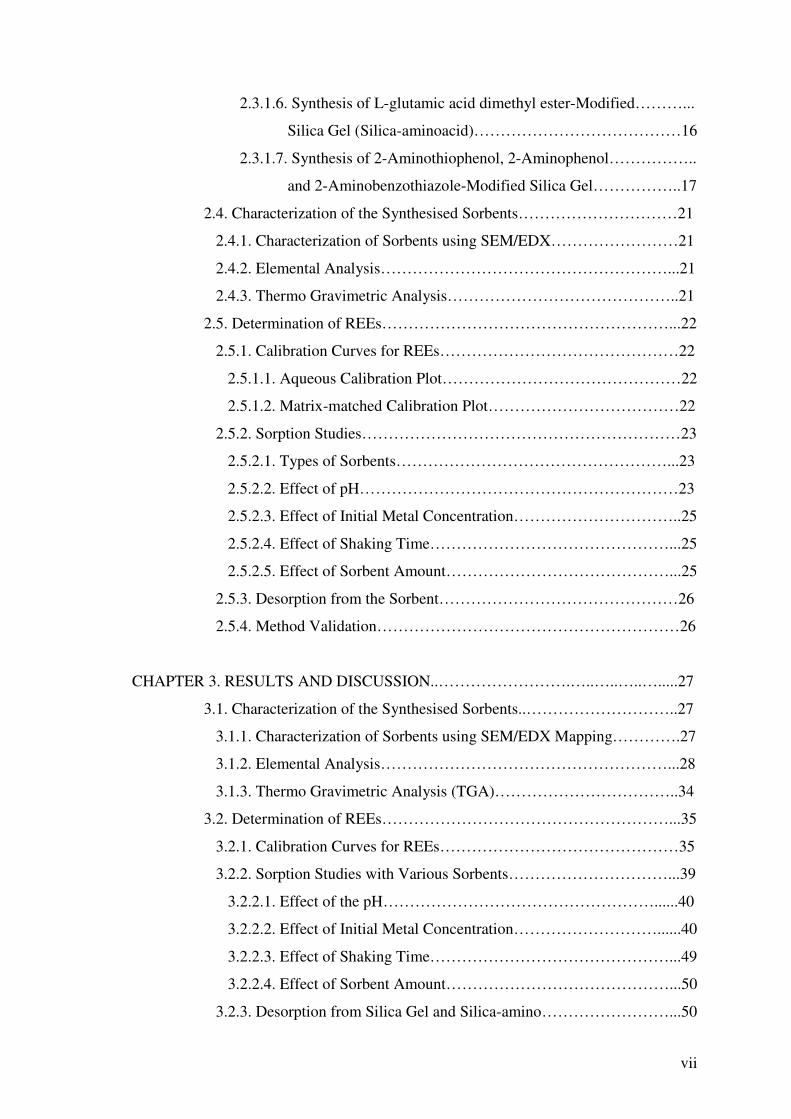
2.3.1.6. Synthesis of L-glutamic acid dimethyl ester-Modified………...
Silica Gel (Silica-aminoacid)…………………………………16
2.3.1.7. Synthesis of 2-Aminothiophenol, 2-Aminophenol……………..
and 2-Aminobenzothiazole-Modified Silica Gel……………..17
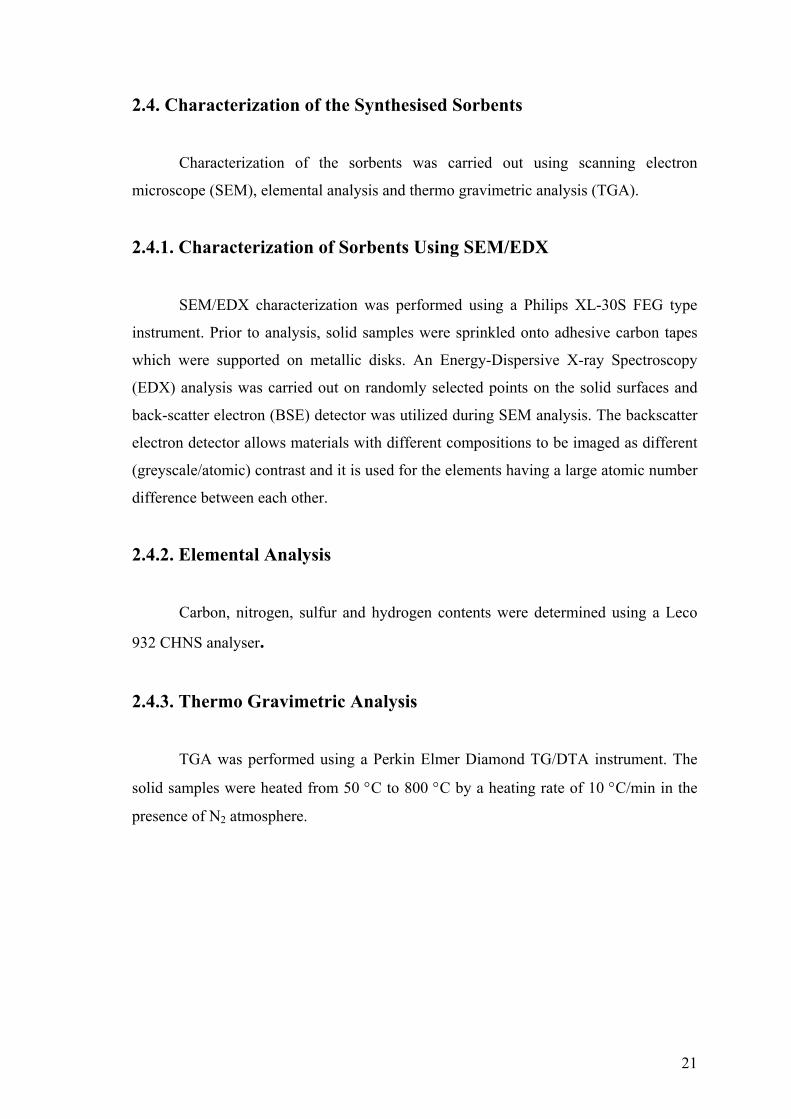
2.4. Characterization of the Synthesised Sorbents…………………………21
2.4.1. Characterization of Sorbents using SEM/EDX……………………21
2.4.2. Elemental Analysis………………………………………………...21
2.4.3. Thermo Gravimetric Analysis……………………………………..21
2.5. Determination of REEs………………………………………………...22
2.5.1. Calibration Curves for REEs………………………………………22
2.5.1.1. Aqueous Calibration Plot………………………………………22
2.5.1.2. Matrix-matched Calibration Plot………………………………22
2.5.2. Sorption Studies……………………………………………………23
2.5.2.1. Types of Sorbents……………………………………………...23
2.5.2.2. Effect of pH……………………………………………………23
2.5.2.3. Effect of Initial Metal Concentration…………………………..25
2.5.2.4. Effect of Shaking Time………………………………………...25
2.5.2.5. Effect of Sorbent Amount……………………………………...25
2.5.3. Desorption from the Sorbent………………………………………26
2.5.4. Method Validation…………………………………………………26
CHAPTER 3. RESULTS AND DISCUSSION..…………………….…..…..…..….....27
3.1. Characterization of the Synthesised Sorbents..………………………..27
3.1.1. Characterization of Sorbents using SEM/EDX Mapping………….27
3.1.2. Elemental Analysis………………………………………………...28
3.1.3. Thermo Gravimetric Analysis (TGA)……………………………..34
3.2. Determination of REEs………………………………………………...35
3.2.1. Calibration Curves for REEs………………………………………35
3.2.2. Sorption Studies with Various Sorbents…………………………...39
3.2.2.1. Effect of the pH……………………………………………......40
3.2.2.2. Effect of Initial Metal Concentration………………………......40
3.2.2.3. Effect of Shaking Time………………………………………...49
3.2.2.4. Effect of Sorbent Amount……………………………………...50
3.2.3. Desorption from Silica Gel and Silica-amino……………………...50
viii
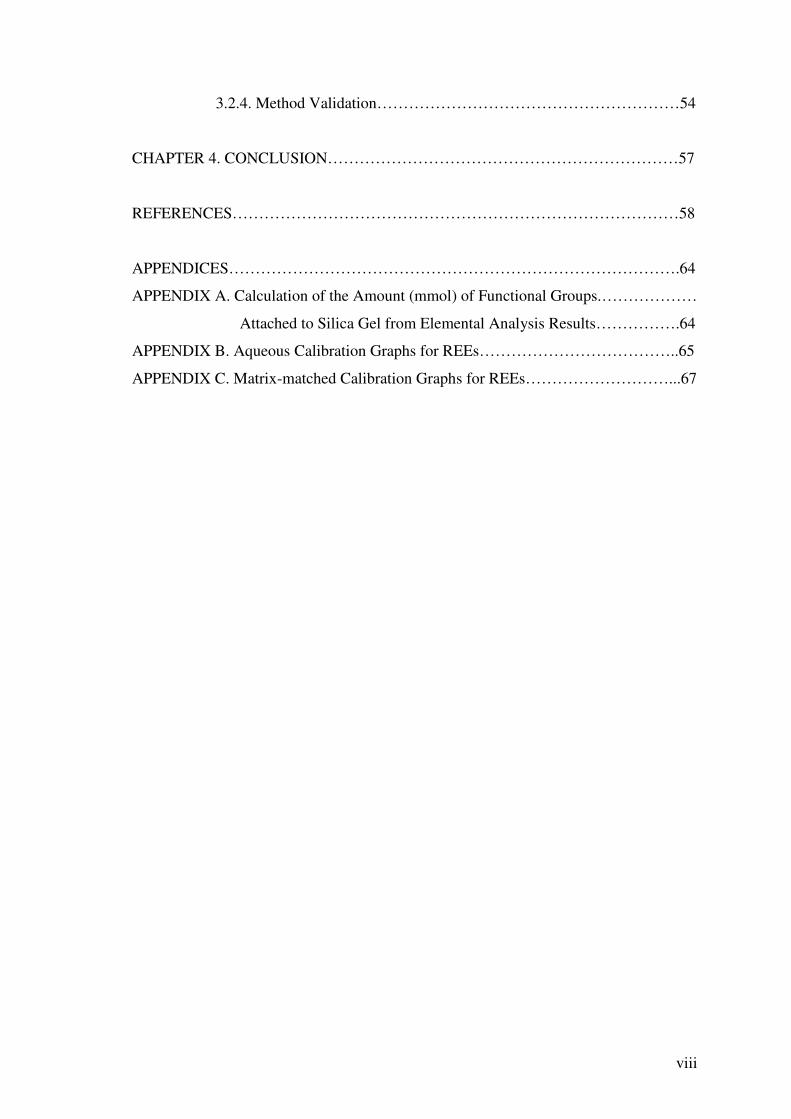
3.2.4. Method Validation…………………………………………………54
CHAPTER 4. CONCLUSION…………………………………………………………57
REFERENCES…………………………………………………………………………58
APPENDICES………………………………………………………………………….64
APPENDIX A. Calculation of the Amount (mmol) of Functional Groups.………………
Attached to Silica Gel from Elemental Analysis Results…………….64
APPENDIX B. Aqueous Calibration Graphs for REEs………………………………..65
APPENDIX C. Matrix-matched Calibration Graphs for REEs………………………...67
ix
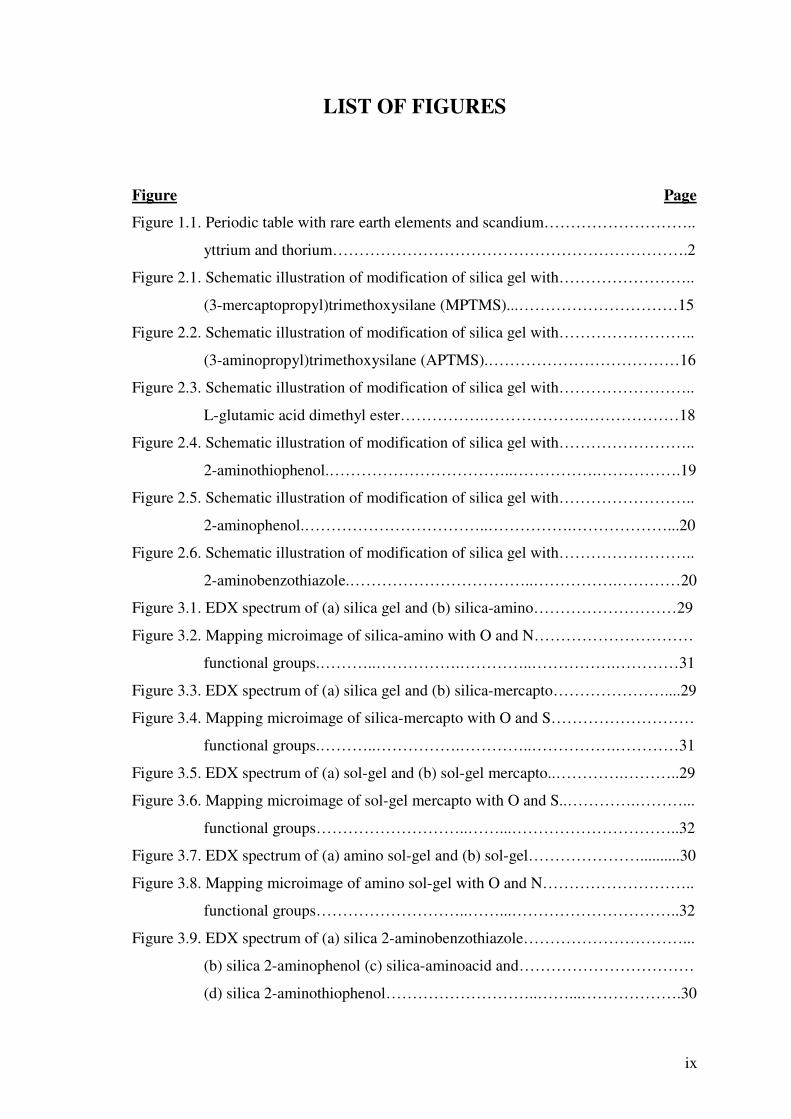
LIST OF FIGURES
Figure Page
Figure 1.1. Periodic table with rare earth elements and scandium………………………..
yttrium and thorium………………………………………………………….2
Figure 2.1. Schematic illustration of modification of silica gel with……………………..
(3-mercaptopropyl)trimethoxysilane (MPTMS)...…………………………15
Figure 2.2. Schematic illustration of modification of silica gel with……………………..
(3-aminopropyl)trimethoxysilane (APTMS).………………………………16
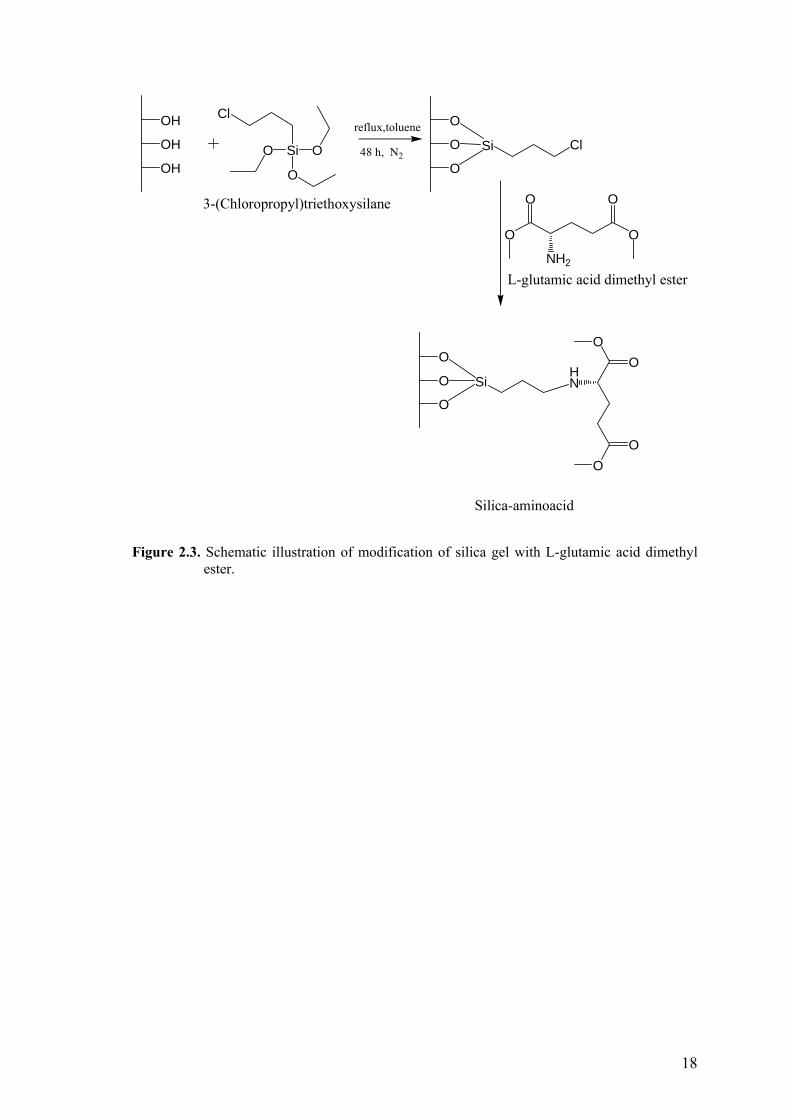
Figure 2.3. Schematic illustration of modification of silica gel with……………………..
L-glutamic acid dimethyl ester…………….……………….………………18
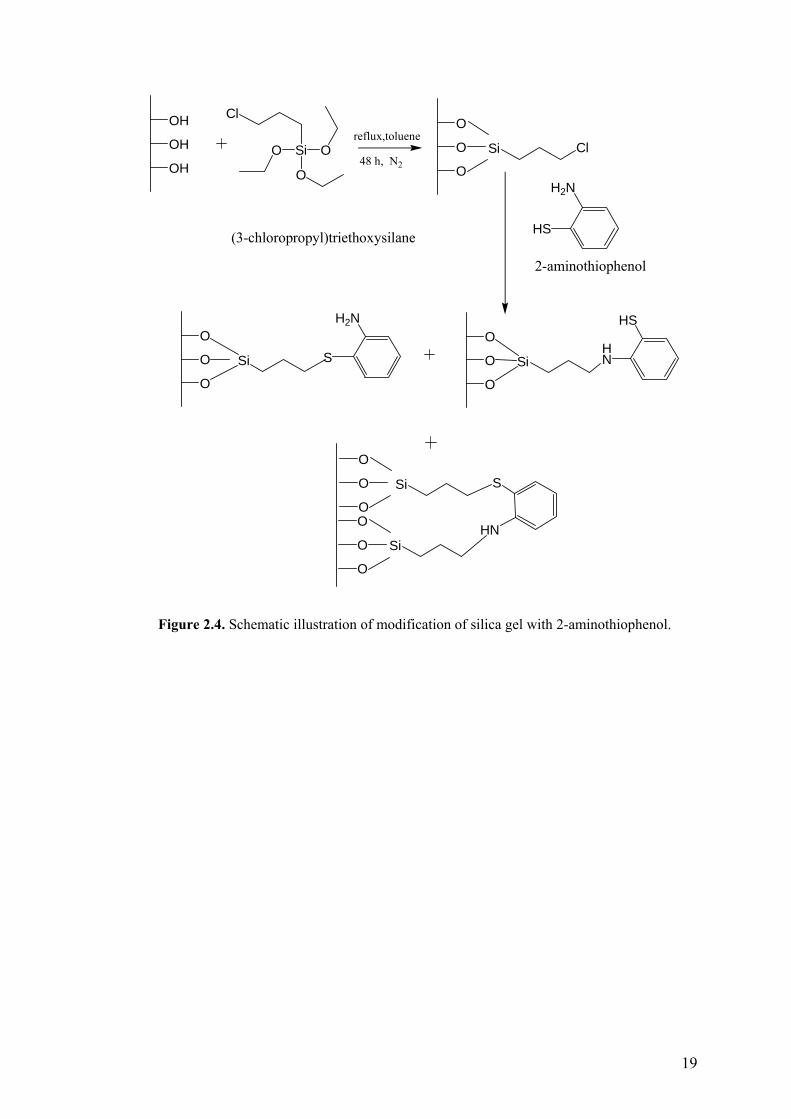
Figure 2.4. Schematic illustration of modification of silica gel with……………………..
2-aminothiophenol.……………………………..…………….…………….19
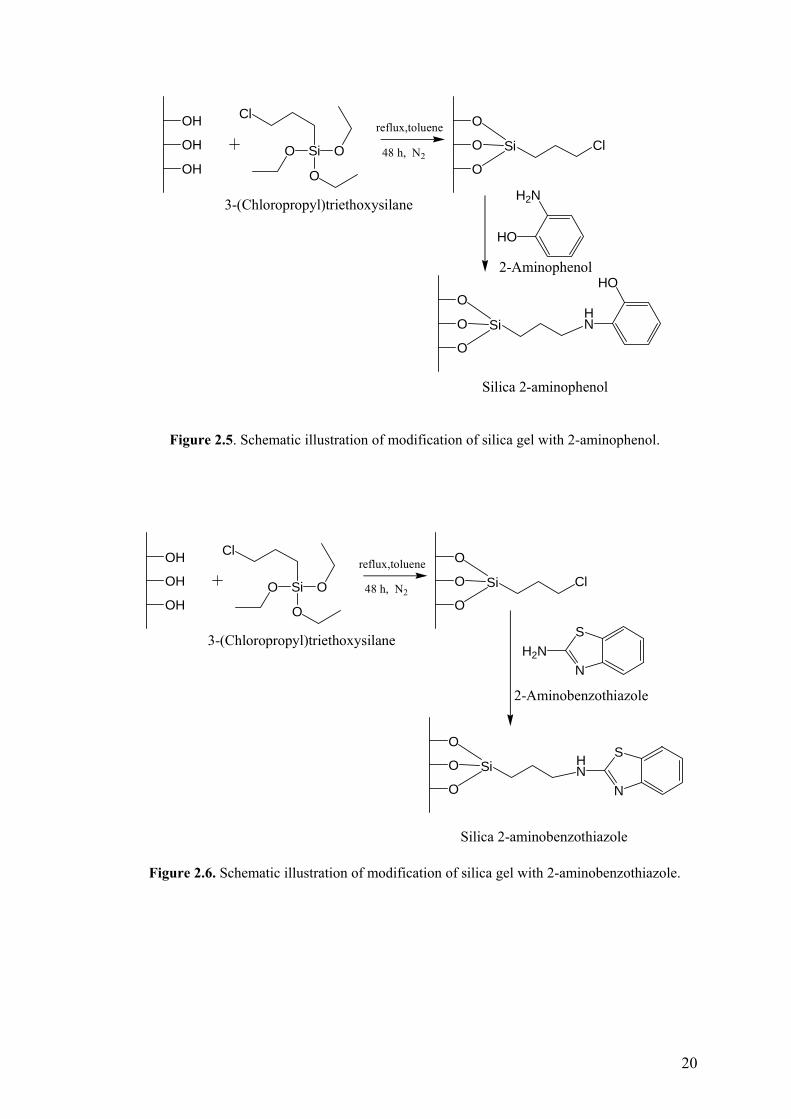
Figure 2.5. Schematic illustration of modification of silica gel with……………………..
2-aminophenol.……………………………..…………….………………...20
Figure 2.6. Schematic illustration of modification of silica gel with……………………..
2-aminobenzothiazole.……………………………..…………….…………20
Figure 3.1. EDX spectrum of (a) silica gel and (b) silica-amino………………………29
Figure 3.2. Mapping microimage of silica-amino with O and N…………………………
functional groups.………..…………….…………..…………….…………31
Figure 3.3. EDX spectrum of (a) silica gel and (b) silica-mercapto…………………....29
Figure 3.4. Mapping microimage of silica-mercapto with O and S………………………
functional groups.………..…………….…………..…………….…………31
Figure 3.5. EDX spectrum of (a) sol-gel and (b) sol-gel mercapto..………….………..29
Figure 3.6. Mapping microimage of sol-gel mercapto with O and S..………….………...
functional groups………………………..……...…………………………..32
Figure 3.7. EDX spectrum of (a) amino sol-gel and (b) sol-gel…………………..........30
Figure 3.8. Mapping microimage of amino sol-gel with O and N………………………..
functional groups………………………..……...…………………………..32
Figure 3.9. EDX spectrum of (a) silica 2-aminobenzothiazole…………………………...
(b) silica 2-aminophenol (c) silica-aminoacid and……………………………
(d) silica 2-aminothiophenol………………………..……...……………….30
x
Figure 3.10. Mapping microimage of silica 2-aminothiophenol with…………………….
O,S,N and CI functional groups……………………..……………...……33
Figure 3.11. TGA curves of (a) silica-amino (b) silica gel (c) silica-mercapto…………..
(d) silica 2-aminophenol (e) silica 2-aminobenzothiazole……………………
(f) silica 2-aminothiophenol and (g) silica-aminoacid……………………..36
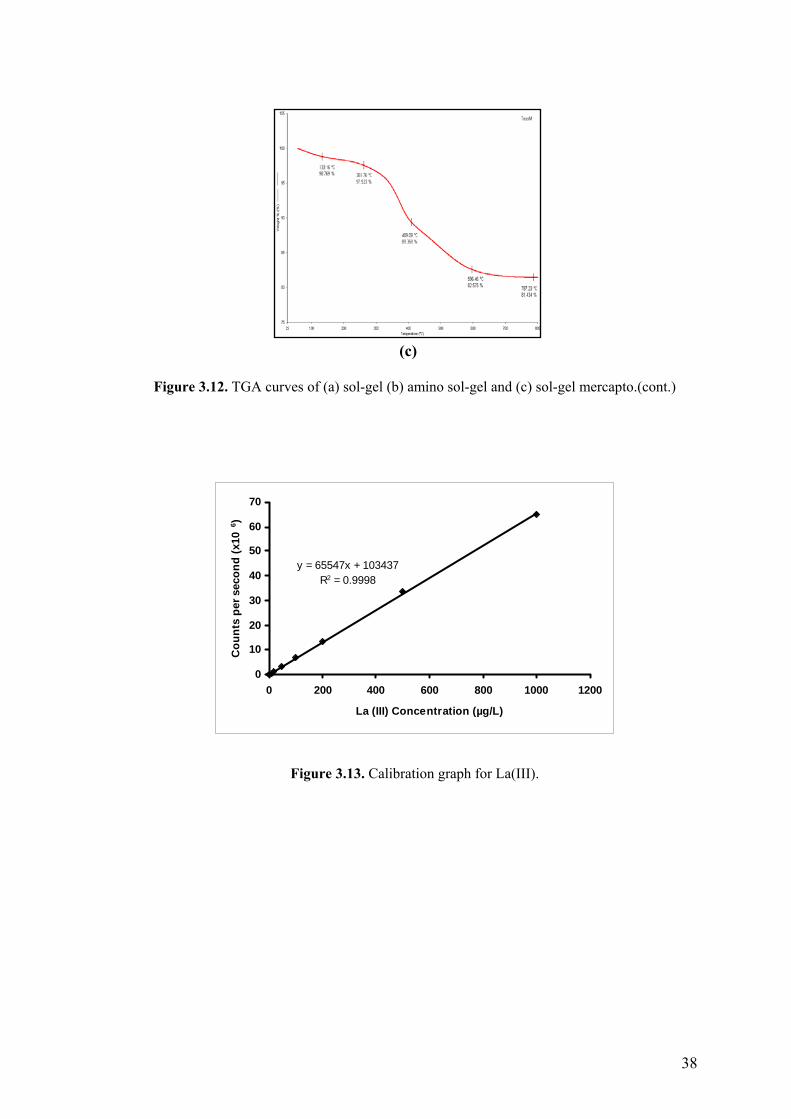
Figure 3.12. TGA curves of (a) sol-gel (b) amino sol-gel and (c) sol-gel…………….......
mercapto………………………………………………………………….37
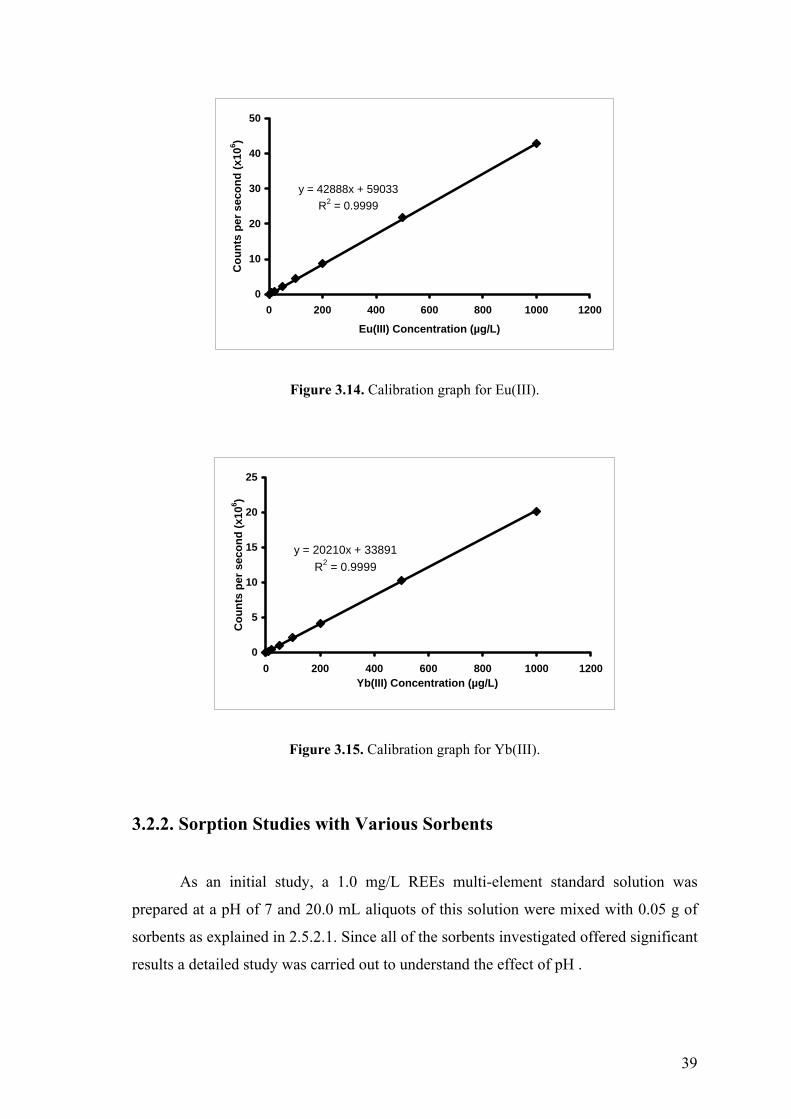
Figure 3.13. Calibration graph for La(III)……………………………………………...38
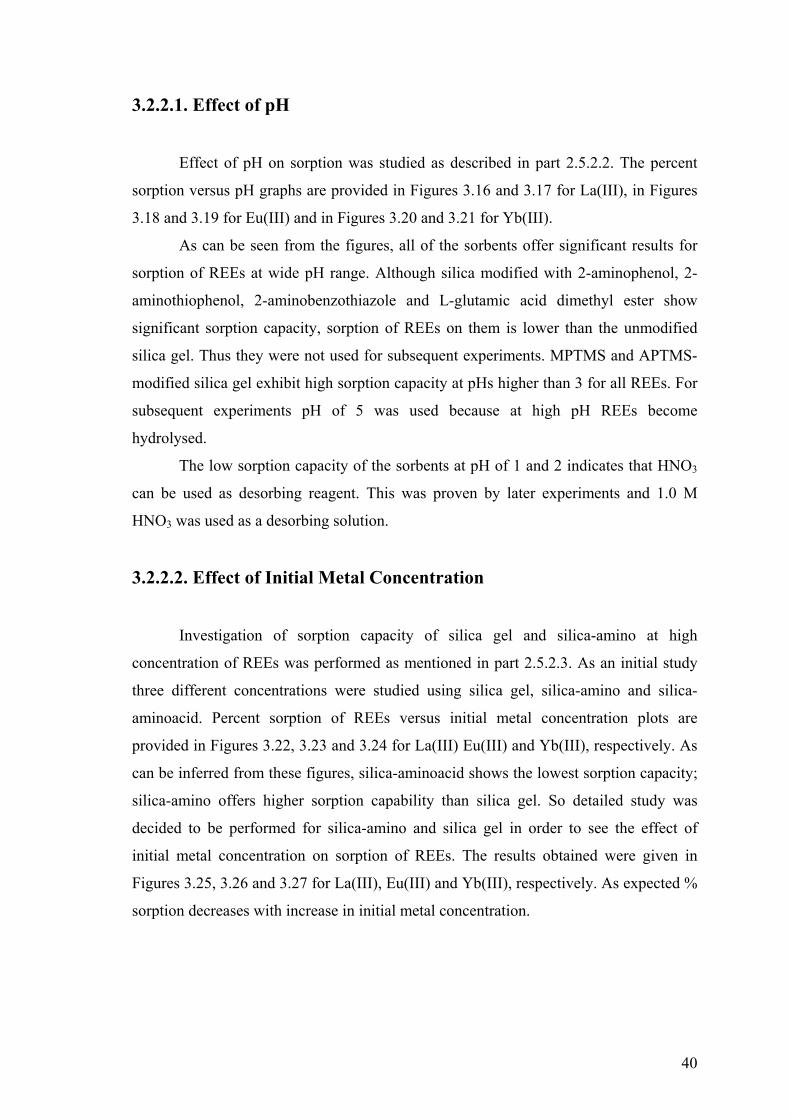
Figure 3.14. Calibration graph for Eu(III)……………………………………………...39
Figure 3.15. Calibration graph for Yb(III)……………………………………………..39
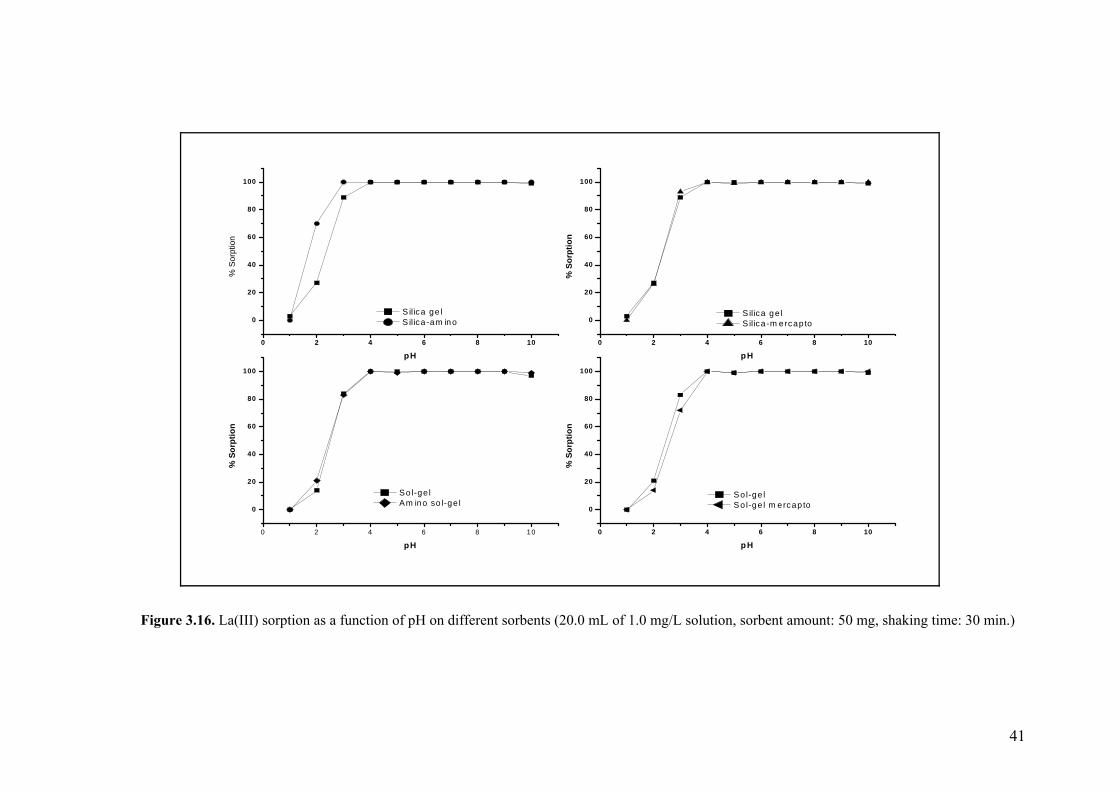
Figure 3.16. La(III) sorption as a function of pH on different sorbents………..………41
Figure 3.17. La(III) sorption as a function of pH on different sorbents………..………42
Figure 3.18. Eu(III) sorption as a function of pH on different sorbents………..………43
Figure 3.19. Eu(III) sorption as a function of pH on different sorbents………..………44
Figure 3.20. Yb(III) sorption as a function of pH on different sorbents………..……...45
Figure 3.21. Yb(III) sorption as a function of pH on different sorbents………..……...46
Figure 3.22. La(III) sorption as a function of initial metal concentration………………...
on different sorbents…………………………………………..……….....47
Figure 3.23. Eu(III) sorption as a function of initial metal concentration………………...
on different sorbents…………………………………………………..….47
Figure 3.24. Yb(III) sorption as a function of initial metal concentration ……………….
on different sorbents…………………………………………………..….48
Figure 3.25. Effect of initial metal concentration on sorption of La(III)…………………
on silica gel and silica-amino……………..………………………….......48
Figure 3.26. Effect of initial metal concentration on sorption of Eu(III)…………………
on silica gel and silica-amino……………..………………………….......49
Figure 3.27. Effect of initial metal concentration on sorption of Yb(III)…………………
on silica gel and silica-amino……………..………………………….......49
Figure 3.28. Matrix-matched calibration graphs for La(III)……..…………………..…55
Figure 3.29. Matrix-matched calibration graphs for Eu(III)……..…………………….55
Figure 3.30. Matrix-matched calibration graphs for Yb(III)……..…………………….56
Figure B.1. Calibration graph for Ce(III)…………………………………….……..….65
Figure B.2. Calibration graph for Pr(III)…………………………………….……..…..65
Figure B.3. Calibration graph for Nd(III)……..…………………………….……..…...65
xi
Figure B.4. Calibration graph for Sm(III)…………………………………….……..…65
Figure B.5. Calibration graph for Gd(III)…………………………………….……..….66
Figure B.6. Calibration graph for Dy(III)…………………………………….……..….66
Figure B.7. Calibration graph for Ho(III)…………………………………….……..….66
Figure B.8. Calibration graph for Er(III)…………………………………….……..…..66
Figure C.1. Matrix-matched calibration graphs for Ce(III)……………………………67
Figure C.2. Matrix-matched calibration graphs for Pr(III)…………………………….67
Figure C.3. Matrix-matched calibration graphs for Nd(III)…………………………...68
Figure C.4. Matrix-matched calibration graphs for Sm(III)…………………………...68
Figure C.5. Matrix-matched calibration graphs for Gd(III)…………………………...69
Figure C.6. Matrix-matched calibration graphs for Dy(III)…………………………...69
Figure C.7. Matrix-matched calibration graphs for Ho(III)…………………………...70
Figure C.8. Matrix-matched calibration graphs for Er(III)……………………….……70
xii
LIST OF TABLES
Table Page
Table 1.1. Industrial uses of REEs………………………………………………………4
Table 2.1. The operating parameters for Agilent 7500 ICP-MS……………………….12
Table 2.2. Operating parameters for Varian Liberty Series II…………………………….
Axial view ICP-OES………………………………………………………13
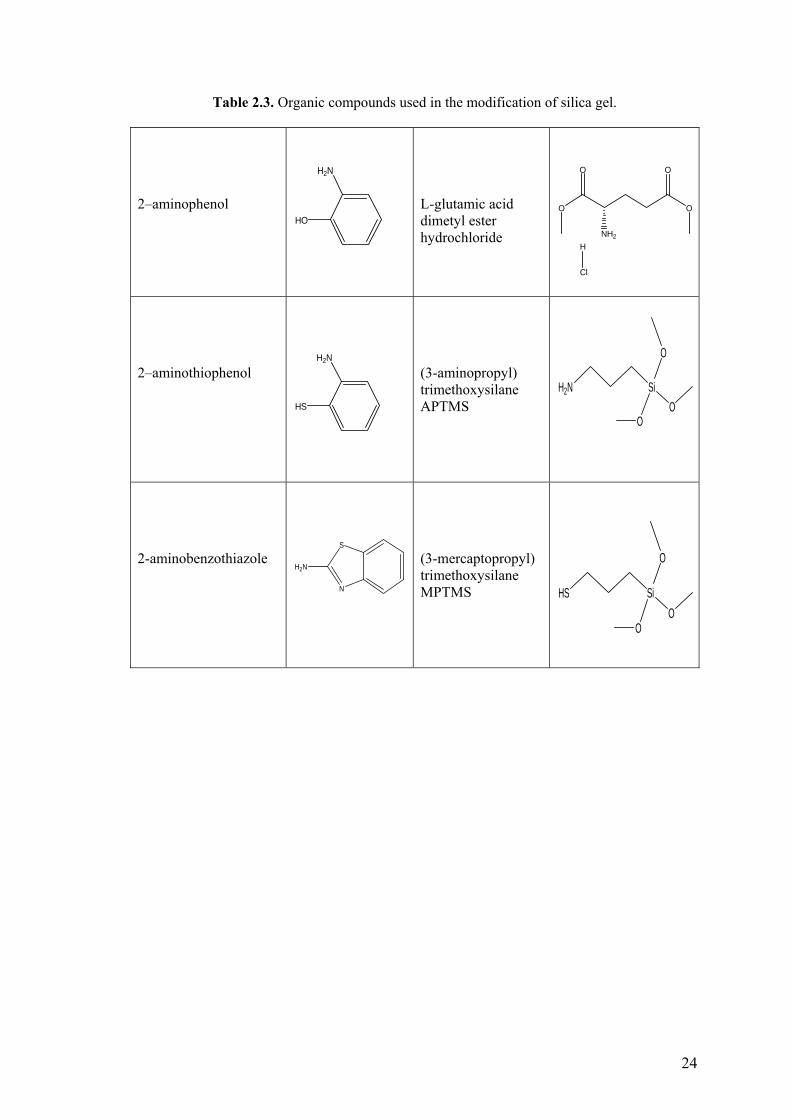
Table 2.3. Organic compounds used in the modification of silica gel…………………24
Table 3.1. Elemental analysis results of synthesised sorbents materials………………….
having both S and N functional groups…………………………………….33
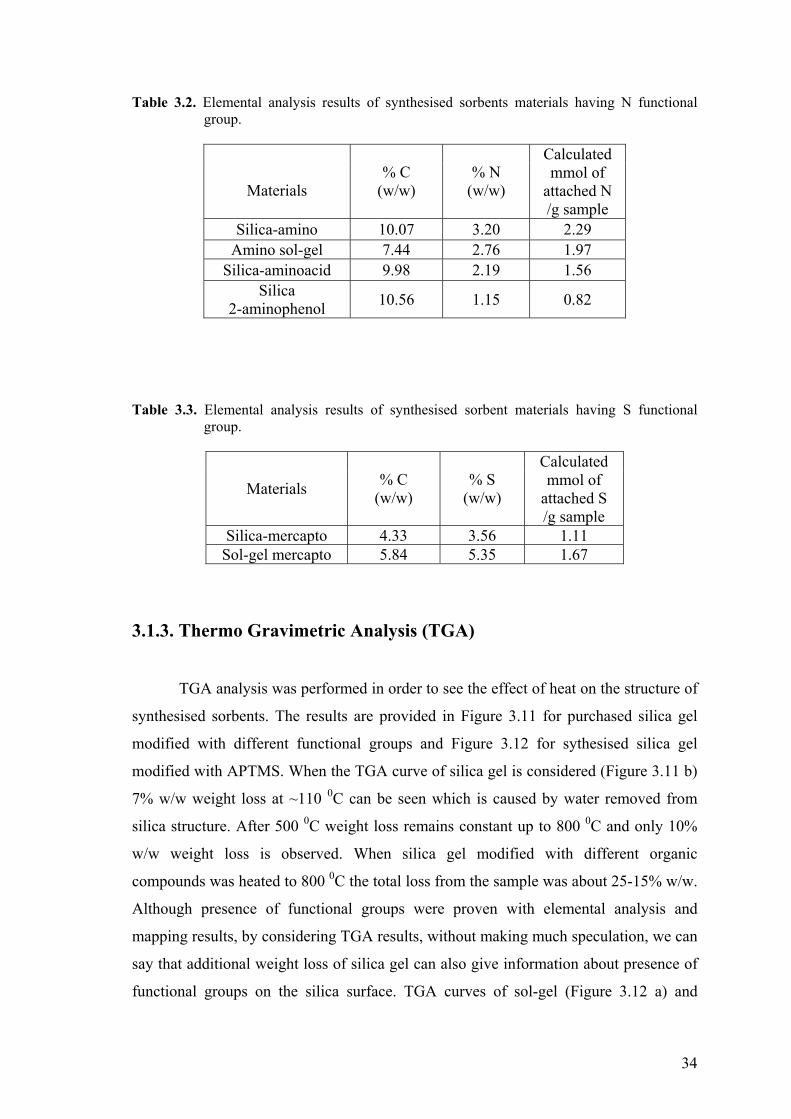
Table 3.2. Elemental analysis results of synthesised sorbents materials………………….
having N functional groups………………………………………………...34
Table 3.3. Elemental analysis results of synthesised sorbents materials………………….
having S functional groups……………………...…..……………………...34
Table 3.4. Effect of shaking time on sorption of REEs at 25 °C……………………….51
Table 3.5 Effect of shaking time on sorption of REEs at 50 °C………………………..52
Table 3.6. Effect of sorbent amount on sorption of REEs.……..……………………....53
Table 3.7. Desorption of REEs from silica gel and silica-amino……………..………..54
Table 3.8. REEs recovery results for ultrapure water, geothermal water,………………...
tap water and sea water…………………………………………………......56
1
CHAPTER 1
RARE EARTH ELEMENTS (REEs)
1.1. Introduction to Rare Earth Elements (REEs)
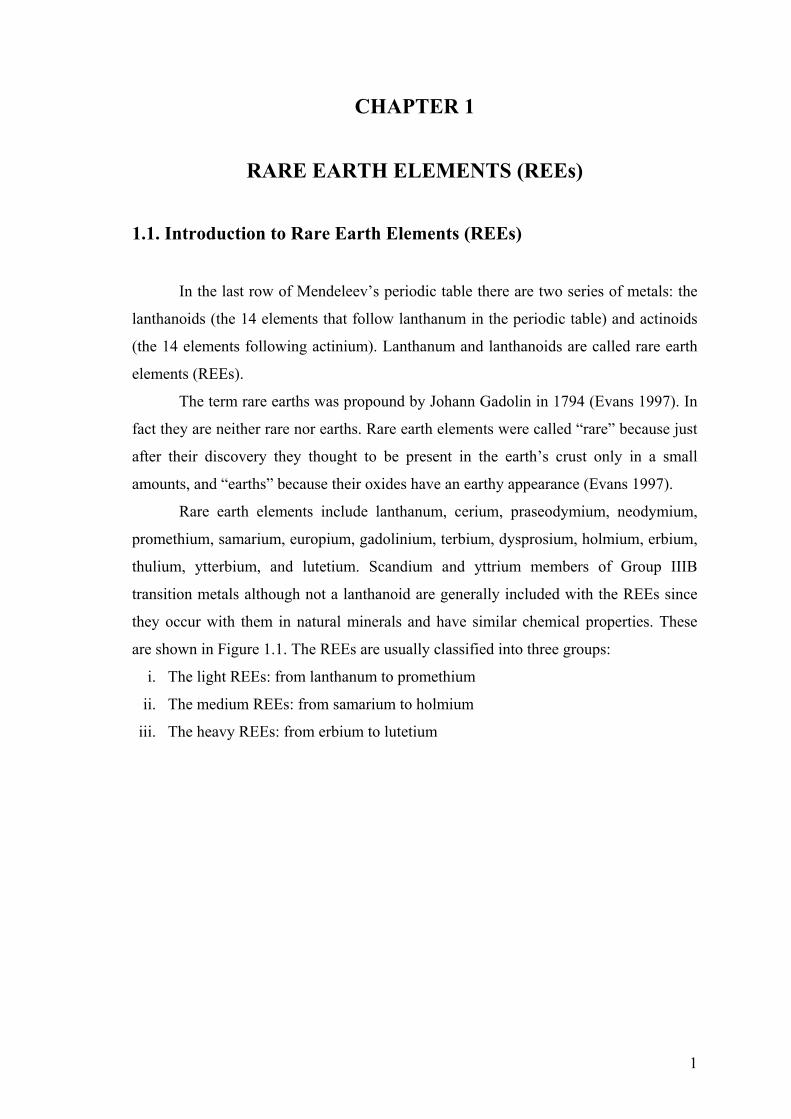
In the last row of Mendeleev’s periodic table there are two series of metals: the
lanthanoids (the 14 elements that follow lanthanum in the periodic table) and actinoids
(the 14 elements following actinium). Lanthanum and lanthanoids are called rare earth
elements (REEs).
The term rare earths was propound by Johann Gadolin in 1794 (Evans 1997). In
fact they are neither rare nor earths. Rare earth elements were called “rare” because just
after their discovery they thought to be present in the earth’s crust only in a small
amounts, and “earths” because their oxides have an earthy appearance (Evans 1997).
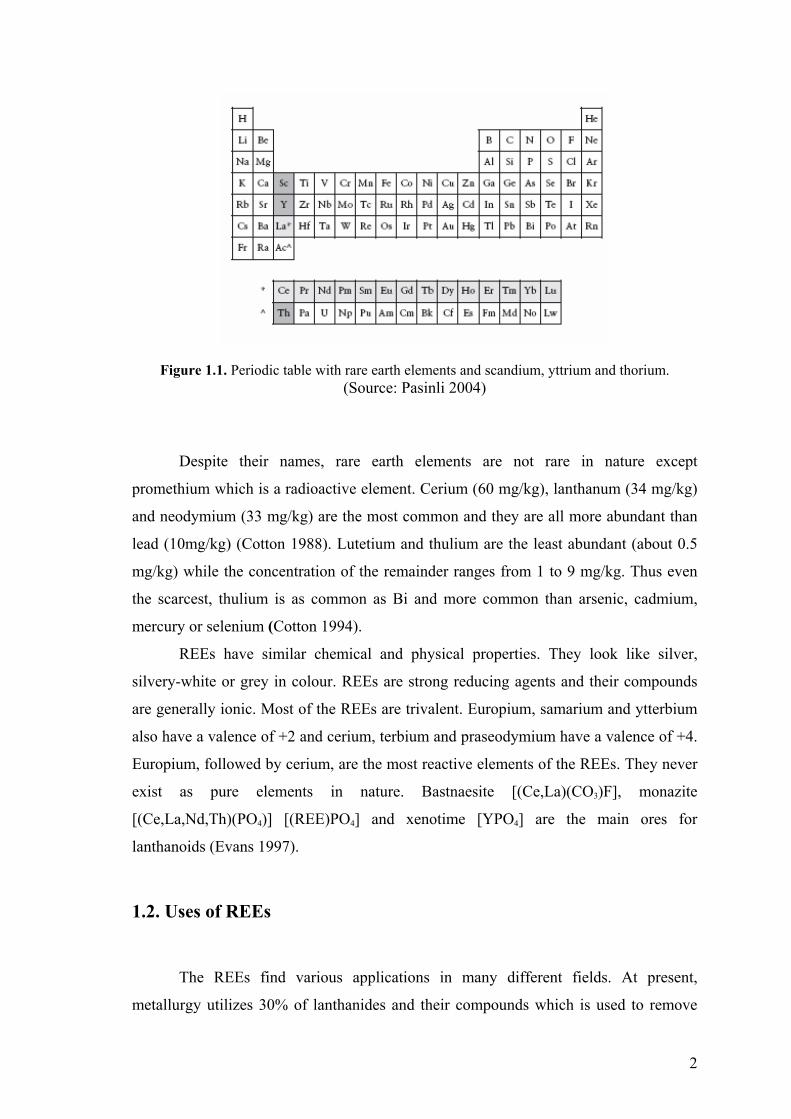
Rare earth elements include lanthanum, cerium, praseodymium, neodymium,
promethium, samarium, europium, gadolinium, terbium, dysprosium, holmium, erbium,
thulium, ytterbium, and lutetium. Scandium and yttrium members of Group IIIB
transition metals although not a lanthanoid are generally included with the REEs since
they occur with them in natural minerals and have similar chemical properties. These
are shown in Figure 1.1. The REEs are usually classified into three groups:
i. The light REEs: from lanthanum to promethium
ii. The medium REEs: from samarium to holmium
iii. The heavy REEs: from erbium to lutetium
2
Figure 1.1. Periodic table with rare earth elements and scandium, yttrium and thorium. (Source: Pasinli 2004)
Despite their names, rare earth elements are not rare in nature except
promethium which is a radioactive element. Cerium (60 mg/kg), lanthanum (34 mg/kg)
and neodymium (33 mg/kg) are the most common and they are all more abundant than
lead (10mg/kg) (Cotton 1988). Lutetium and thulium are the least abundant (about 0.5
mg/kg) while the concentration of the remainder ranges from 1 to 9 mg/kg. Thus even
the scarcest, thulium is as common as Bi and more common than arsenic, cadmium,
mercury or selenium (Cotton 1994).
REEs have similar chemical and physical properties. They look like silver,
silvery-white or grey in colour. REEs are strong reducing agents and their compounds
are generally ionic. Most of the REEs are trivalent. Europium, samarium and ytterbium
also have a valence of +2 and cerium, terbium and praseodymium have a valence of +4.
Europium, followed by cerium, are the most reactive elements of the REEs. They never
exist as pure elements in nature. Bastnaesite [(Ce,La)(CO3)F], monazite
[(Ce,La,Nd,Th)(PO4)] [(REE)PO4] and xenotime [YPO4] are the main ores for
lanthanoids (Evans 1997).
1.2. Uses of REEs
The REEs find various applications in many different fields. At present,
metallurgy utilizes 30% of lanthanides and their compounds which is used to remove
3
oxygen and to enrich steel. They are used as catalysts/chemicals (39%), in glass/ceramic
industry (25%) and in electronics (6%). High purity indivudial REEs are increasingly
used as major components in lasers (e.g. halogenes of neodymium, holmium and
erbium), phosphors, magnetic bubble memory films, permanent magnets (alloys of
samarium and neodymium) refractive index lenses, fibre optics cathode ray tubes and
superconductors. They are also used as magnetic resonance imaging (MRI) contrast
reagents in medicine. LaCl3 is added to chemical fertilizers in China (Qui et al. 2000a,
Liang et al. 2005a and Prasada et al. 2004). Their industrial uses are summarised in
Table 1.1.
1.3. Biological Effects of REEs
Since lanthanides and their compounds have a broad application in industry,
there is an increased risk of their penetration into humans and animals, which may
affect their metabolic processes (Nakamura et al. 1997). Although so far there is no
reported incidence of intoxication because of the intake of REEs through to food chain,
several deleterious effects due to occupational and environmental exposure to REEs
have been reported (Sabbioni et al. 1982 and Sax 1984). As indicated in the report,
REEs have both positive and negative effects on human healths. For instance, REEs
show benefit in the liver where gadolinium selectively inhibits secretion by Kupffer
cells and it decreases cytochrome P450 activity in hepatocytes, thus protecting liver
cells against toxic products of xenobiotic biotransformation. Praseodymium ion (Pr3+)
produces the same protective effect in liver tissue cultures. Cytophysiological effects of
lanthanides appear to result from the similarity of their cationic radii to the size of Ca2+
ions. Trivalent lanthanide ions, especially La3+and Gd3+, block different calcium
channels in human and animal cells. Lanthanides can affect numerous enzymes:
Dy3+and La3+ block Ca2+ -ATPase and Mg2+ -ATPase, while Eu3+ and Tb3+ inhibit
calcineurin. In neurons, lanthanide ions regulate the transport and release of synaptic
transmitters and block some membrane receptors, e.g. GABA and glutamate receptors
(Palazs et al. 2000).
4
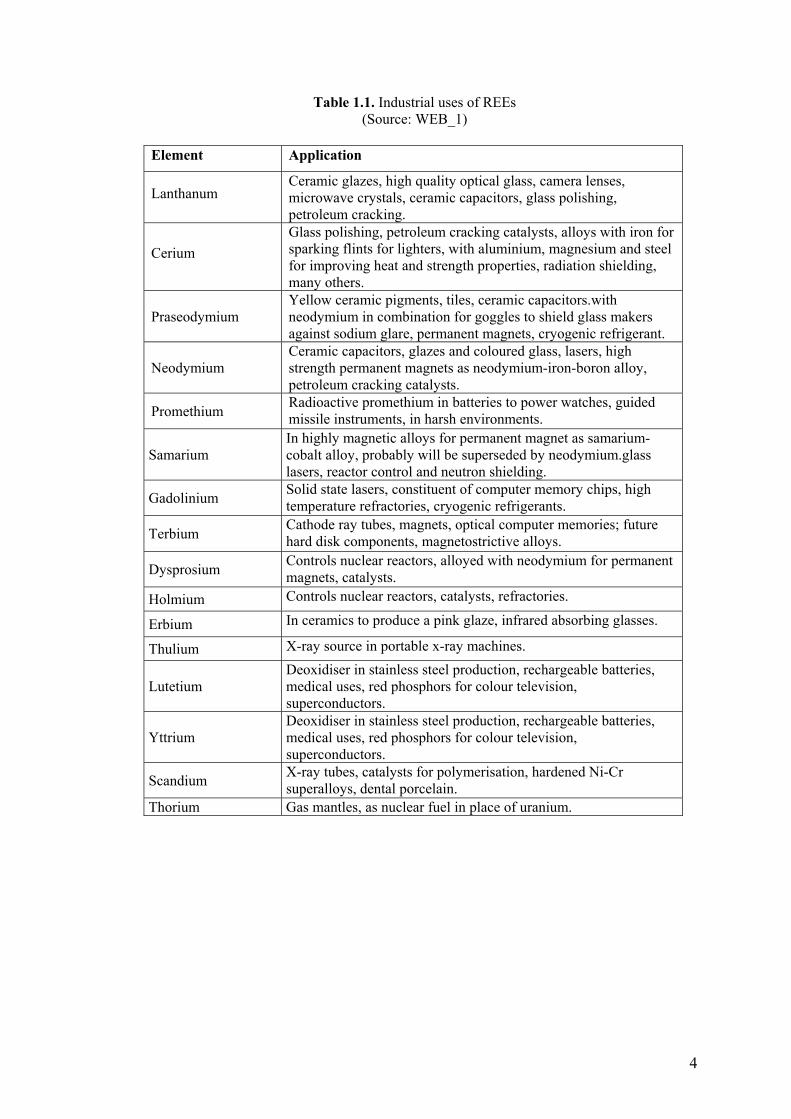
Table 1.1. Industrial uses of REEs (Source: WEB_1)
Element Application
Lanthanum Ceramic glazes, high quality optical glass, camera lenses, microwave crystals, ceramic capacitors, glass polishing, petroleum cracking.
Cerium Glass polishing, petroleum cracking catalysts, alloys with iron for sparking flints for lighters, with aluminium, magnesium and steel for improving heat and strength properties, radiation shielding, many others.
Praseodymium Yellow ceramic pigments, tiles, ceramic capacitors.with neodymium in combination for goggles to shield glass makers against sodium glare, permanent magnets, cryogenic refrigerant.
Neodymium Ceramic capacitors, glazes and coloured glass, lasers, high strength permanent magnets as neodymium-iron-boron alloy, petroleum cracking catalysts.
Promethium Radioactive promethium in batteries to power watches, guided missile instruments, in harsh environments.
Samarium In highly magnetic alloys for permanent magnet as samarium-cobalt alloy, probably will be superseded by neodymium.glass lasers, reactor control and neutron shielding.
Gadolinium Solid state lasers, constituent of computer memory chips, high temperature refractories, cryogenic refrigerants.
Terbium Cathode ray tubes, magnets, optical computer memories; future hard disk components, magnetostrictive alloys.
Dysprosium Controls nuclear reactors, alloyed with neodymium for permanent magnets, catalysts.
Holmium Controls nuclear reactors, catalysts, refractories.
Erbium In ceramics to produce a pink glaze, infrared absorbing glasses.
Thulium X-ray source in portable x-ray machines.
Lutetium Deoxidiser in stainless steel production, rechargeable batteries, medical uses, red phosphors for colour television, superconductors.
Yttrium Deoxidiser in stainless steel production, rechargeable batteries, medical uses, red phosphors for colour television, superconductors.
Scandium X-ray tubes, catalysts for polymerisation, hardened Ni-Cr superalloys, dental porcelain.
Thorium Gas mantles, as nuclear fuel in place of uranium.
5
1.4 Determination of REEs
Since the use of REEs in industrial applications has been increased, the
possibility of their release into the environment has also increased. Accurate and precise
analytical methods are thus needed for their determination in various samples.
Neutron activation analysis (NAA) (Figueiredo et al. 2002 and Minowa et al.
2003), isotope dilution mass spectrometry (IDMS) (Shaw et al. 2003 and Greaves et al.
1989), inductively coupled plasma optic emission spectrometry (ICP-OES) (Pasinli et
al. 2005, Djingova et al. 2002, Rucandio et al. 1997 and Liang et al. 2005a) and
inductively coupled plasma mass spectrometry (ICP-MS) (Hirata et al. 2002, Inagaki et
al. 2000 and Vicente et al. 1998) are the most frequently employed analytical techniques
for the determination of REEs. Among these, neutron activation analysis (NAA) and
isotope dilution mass spectrometry (IDMS) are time consuming and require very
sophisticated equipment, thus, are unaccessible to most laboratories. Inductively
coupled plasma optic emission spectrometry (ICP-OES) is one of the most effective
multi-element techniques for determination of many trace elements including REEs.
Instrumental detection limits are stated to be in the order of 50 μg/L. (Djingova et al.
2002). A more recent technique for determination of REEs is ICP-MS with detection
limits in the order of sub μg/L. It also provides multielement detection capability, high
sensitivity and wide linear dynamic range which allows direct determination of trace
metals at ppt (ng/L) levels (Pedriera et al. 2002).
ICP-MS has been widely used in the determination of trace REEs. For example
Zhang et al. developed a method based on 2-ethylhexyl hydrogenethylhexyl
phosphonate (EHEHP) extraction chromatographic separation for trace of REEs
impurities and Sm matrix prior to ICP-MS detection (Zhang et al. 2007). Zhu et al.
developed a chelating resin-packed Chelex 100 minicolumn for preconcentration of
REEs in seawater before ICP-MS determination (Zhu et al. 2006). They preconcentrated
the seawater 20 fold by loading the mini column with 50 mL of seawater eluting with
2.25 mL of 2 M HNO3 and adding 0.25 mL of internal standard. They showed that
detection limits for REEs ranged from 0.06 ng/L for Lu to 0.5 ng/L for Sm can be
obtained. Ming et al. used ICP-MS for the determination of REEs in human hair and
and wheat flour (Ming et al. 1998). They compare three sample digestion methods, dry
ashing, microwave digestion and open vessel acid digestion for biological samples and
showed there is no statistical difference in these methods with respect to accuracy.
6
Pedreira et al. separated and determined several REEs in a highly pure neodymium
oxide, by HPLC and ICP-MS (Pedreira et al. 2003). Murakami et al. extracted REEs
from seawater by using bis(2-ethyl-hexyl)hydrogen phosphate (HDEHP) impregnated
porous PTFE filter tube then the sorbed REEs were quantitatively eluted by 5 M HCl
and determined with ICP-MS (Murakami et al. 2005).
1.5. Preconcentration and Separation of REEs
Athough ICP-MS is one of the most suitable techniques for determination of
REEs and has the abilitiy to detect trace elements at sub-μg/L levels, it suffers from
problems of ionization suppression by matrix elements, isobaric polyatomic
interferences and clogging of sample introduction system when a sample containing
high dissolved salts like seawater. To overcome these difficulties efficient
preconcentration of REEs and their separation from matrix is required.
Co-precipitation has been one of the most widely used techniques for separation
and preconcentration of REEs. For example Roychowdhury et al. precipitated REEs and
Y as oxalates using calcium as carrier (Roychowdhury et al. 1989). The oxalate and
precipitate is ignited to the oxide, which is then dissolved in dilute nitric acid and the
solution is used for ICP-OES measurements. Greaves et al. extracted rare earth elements
by co-precipitation with hydrated iron (III) oxide and purified them on a single cation-
exchange column by using hydrochloric and nitric acids as eluents (Greaves et al.
1989).
Liquid-liquid extraction is another type of separation technique used for REEs.
Wang et al. performed selective extraction of yttrium from heavy lanthanides by liquid–
liquid extraction using a novel organic carboxylic acid extractant s-Nonylphenoxy
acetic acid (CA-100) in the presence of the complexing agent, such as EDTA, DTPA,
and HEDTA (Wang et al. 2004). Tsurubo et al. improved the extraction of REEs with
bis(2-ethylhexy1)-phosphoric acid (DEHPA), one of the most important acidic
organophosphorus extractants for lanthanides, by using 18-crown-6 ether, an ion size
selective masking reagent (Tsurubo et al. 1995). Nakashima et al. used ctyl(phenyl)-
N,N-diisobutylcarbamoylmethyl phosphine oxide (CMPO) for extraction of rare earth
metals into ionic liquids from aqueous solutions (Nakashima et al. 2005). Ion exchange
techniques have also been employed for preconcentration and separation of REEs.
7
Djingova et al. used Dowex 50WX8 cation exchange resin for the determination of the
rare earth elements in soils and sediments (Djingova et al. 2002). Rucandio used the
same cation exchange resin for the determination of 14 rare earth elements (REEs) and
Y in geological materials (Rucandio 1997). In this study separation of REEs from
barium (Ba) was also achieved. Dowex 50WX8 was also utilized by Rimskaya in
another study for determination of REEs in sulfide minerals (Rimskaya 2003). Inakagi
and Haraguchi preconcentrated REEs by heating the perchloric acid digested human
blood serum sample solution with Chelex-100 resin (Inakagi and Haraguchi 2000). Cao
et al. developed an effective procedure to avoid spectral interference from ligtht REEs
and barium polyatomic ions on heavy REEs in ICP-MS with AG50W-X8 cation
exhange chromatography (Cao et al. 2001). Qin et al. used a 2-ethylhexyl hydrogen 2-
ethylhexylphosphonate resin as the stationary phase and dilute nitric acid as the mobile
phase (Qin et al. 2000b). Möller et al. used Chelex-100 chelating resin for
preconcentration of REEs in seawater (Möller et al. 1992).
In addition to other preconcentration and separation techniques, solid phase
extraction (SPE) technique has been increasingly popular in recent years (Shabani et al.
1992, Esser et al. 1994, Lorena et al. 1998, Bahramifar et al. 2005, Liang et al. 2005b,
Wang et al. 2006, Jain et al. 2007, Vicente et al. 1998 and Hirata et al. 1992). Solid
phase extraction relies on partitioning between a liquid (sample matrix) and a solid
(sorbent) phase. This sample treatment technique enables the concentration and
purification of analytes from solution by sorption on a solid sorbent. The basic approach
involves passing the liquid sample through a column, a cartridge, a tube or a disk
containing an adsorbent that retains the analytes. After all of the sample has been passed
through the sorbent, retained analytes are subsequently recovered upon elution with an
appropriate solvent. SPE has several advantages (i) it is simple to implement, (ii) it
offers high preconcentration factor to be attained, (iii) it enables rapid phase seperation,
and (iv) it is easily incorporated into automated analytical techniques.
This method is widely used in chromatographic preconcentration and it can be
applied in two different forms. These are batch and column method. In our study we
used batch method. In the batch method, a quantity of the chromatographic stationary
phase or sorbent is added to the sample and the mixture is shaken for a specified time.
Then the sorbent was separated from sample solution by filtration. Finally the resultant
solution is analysed by an appropriate method.
8
Column preconcentration can be applied either off-line or on-line. In off-line
method the solution sample is passed through a suitable column and the resultant
solution is analysed by a suitable procedure. In the on-line method, the column
containing the sorbent is coupled directly to the analytical instrument. Thus, the sample
enrichment, desorption and analysis steps can be performed at the same run
automatically.
1.5.1. Preconcentration Using Silica Gel Modified with Various
Functional Groups
New types of SPE sorbents, such as naphthalene, silica and silica gel, glass
beads, cellulose, polyurethane foam, molecular imprinted polymers (MIPs) and other
supports, are currently being developed to allow more effective extractions.
Silica gel can be used as a very successful adsorbing agent as it does not swell or
strain, has good mechanical strength and can undergo heat treatment. In addition,
chelating agents can be easily loaded on silica gel with high stability, or be bound
chemically to the support, affording a higher stability. The surface of silica gel is
characterized by the presence of silanol groups, which are known to be weak ion-
exchangers, causing low interaction, binding and extraction of ionic species (Kvitek et
al. 1982). In particular, silica gel presents high sorption capacity for metal ions, such as
Cu, Ni, Co, Zn or Fe (Sarkar et al. 1996). Retention is highly dependent on sample pH
with quantitative retention requiring pH values over 7.5–8, as under acidic conditions
silanol groups are neutral and the ion-exchange capacity of the silica gel is greatly
reduced or even decreased to zero at low pHs. In addition, this sorbent has a very low
selectivity, and is prone to hydrolysis at basic pH. Consequently, modification of the
silica gel surface has been performed to obtain solid sorbents with greater selectivity.
In most of the methods for preparation of immobilized silica gel, a two-step
procedure has been used for loading the surface with specific organic compounds,
physical adsorption and chemical immobilization. In the first method, the organic
compound is directly adsorbed on the silanol group of silica gel surface (impregnated or
loaded sorbent), either by passing the reagent solution through a column packed with
the adsorbent (Liang et al. 2005b), or by shaking the adsorbent in the reagent solution
(Lorena et al. 1998). In the second approach, a covalent bond is formed between the
9
silica gel surface groups and those of the organic compound (functionalized sorbent).
Chemisorption of chelating molecules on silica surface provides immobility,
mechanical stability and water insolubility, thereby increasing the efficiency, sensitivity
and selectivity of the analytical applications (Jal et al. 2004). Chemical modification of
silica surface by organic chelating group acts as ion-exchanger, which provides greater
selectivity for the analyte than that offered by traditional ion-exchanger. The most
convenient way to develop a chemically modified surface is by simple immobilization
(or fixing) of the group on the surface by adsorption or electrostatic interaction or
hydrogen bond formation of other type of interaction. Simple impregnation of the
solution of modifiers or covalent binding, the so called covalent grafting of the
chelating molecule to silica matrix via silanization, is the common practice of
developing a functionalized silica surface.
Several organic functional groups have been immobilized to the silica gel
surface in preconcentration studies. For example Mahmoud et al. used silica gel phase-
impregnated with dithizone for selective extraction and solid phase pre-concentration of
mercury(II) from aqueous and natural water samples (Mahmoud et al. 2000). P´erez-
Quintanilla et al. modified mesoporous silicas (SBA-15 and MCM-41) with
2-mercaptothiazoline for mercury removal from aqueous media (P´erez-Quintanilla et
al. 2006). Pu et al. studied 2-mercaptobenzothiazole-modified silica gel for the flow
injection on-line preconcentration–separation and determination of silver by flame
atomic absorption spectrometry (Pu et al. 1998). Ekinci and Köklü prepared
(3-aminopropyl)triethoxysilane modified silica-gel for the separation and
preconcentration of vanadium, silver, manganese and lead prior to their determination
by graphite furnace atomic absorption spectrometry (Ekinci and Köklü 2000). The same
sorbent was used for solid-phase extraction of bismuth, lead and nickel from seawater
by Tokman et al. (Tokman et al. 2003). Hassanien et al. functionalized silica gel with
(3-aminopropyl)trimethoxysilane (Hassanien et al. 2006). Then obtaining
aminopropylsilica gel (APSG) was reacted with morin yielding morin-bonded silica gel.
The prepared sorbent was then used for separation and preconcentration of Ag(I),
Au(III), Pd(II), Pt(II) and Rh(III) from aqueous medium. Roldan et al. determined
copper, iron, nickel and zinc in gasoline by FAAS after sorption and preconcentration
on silica modified with 2-aminothiazole groups (Roldan et al. 2005). Göktürk et al.
preconcentrated germanium using silica having mercapto functional groups, determined
it by hydride generation flame atomic absorption spectrometry HGAAS (Göktürk et al.
10
2000). Garg et al. synthesised o-vanillin-immobilized silica gel for the adsorption and
estimation of copper, cobalt, iron and zinc by both batch and column techniques (Garg
et al. 1999). Safavi et al. synthesised glycerol-bonded silica gel as a new sorbent for
effective preconcentration of traces of Co(II) in aqueous solutions (Safavi et al. 2006).
Evangelista et al. used hexagonal mesoporous silica modified with 2-mercaptothiazoline
for removing mercury from water solution (Evangelista et al. 2007). Mahmoud prepared
Eriochrome black-T indicator immobilized silica gel. Then this sorbent was used as
phase extractor for zinc (II) and magnesium (II) from calcium (II) (Mahmoud 1997).
1.6. Aim of this Work
The purpose of this study is to develop a sensitive enrichment/matrix separation
procedure for the determination of REEs in environmental water samples. For this
purpose for modification of silica gel different strategies were followed. In the first
strategy silica gel was synthesised by sol-gel method (Eroğlu 1996) and after synthesis
its surface was modified with (3-mercaptopropyl)trimethoxysilane (MPTMS). In the
second approach (3-aminopropyl)trimethoxysilane (APTMS) was modified during sol-
gel process. In another approach commercial silica gel was modified with MPTMS,
APTMS, L-glutamic acid dimethyl ester, 2-aminophenol, 2-aminothiophenol and 2-
aminobenzothiaozole. Sorption capability of these synthesised sorbents towards REEs
were investigated and APTMS-modified silicagel (silica-amino) was suggested as a
proper sorbent for subsequent studies. The efficiency of silica-amino was evaluated
through preconcentration and recovery studies. Determination of REEs concentrations
were obtained by ICP-MS or ICP-OES.
11
CHAPTER 2
EXPERIMENTAL
2.1. Chemicals and Reagents
All chemicals were of analytical reagent grade. Ultra pure water (18MΩ) was
used throughout the study. Glassware and plasticware were cleaned by soaking in 10%
v/v nitric acid and rinsed with distilled water prior to use.
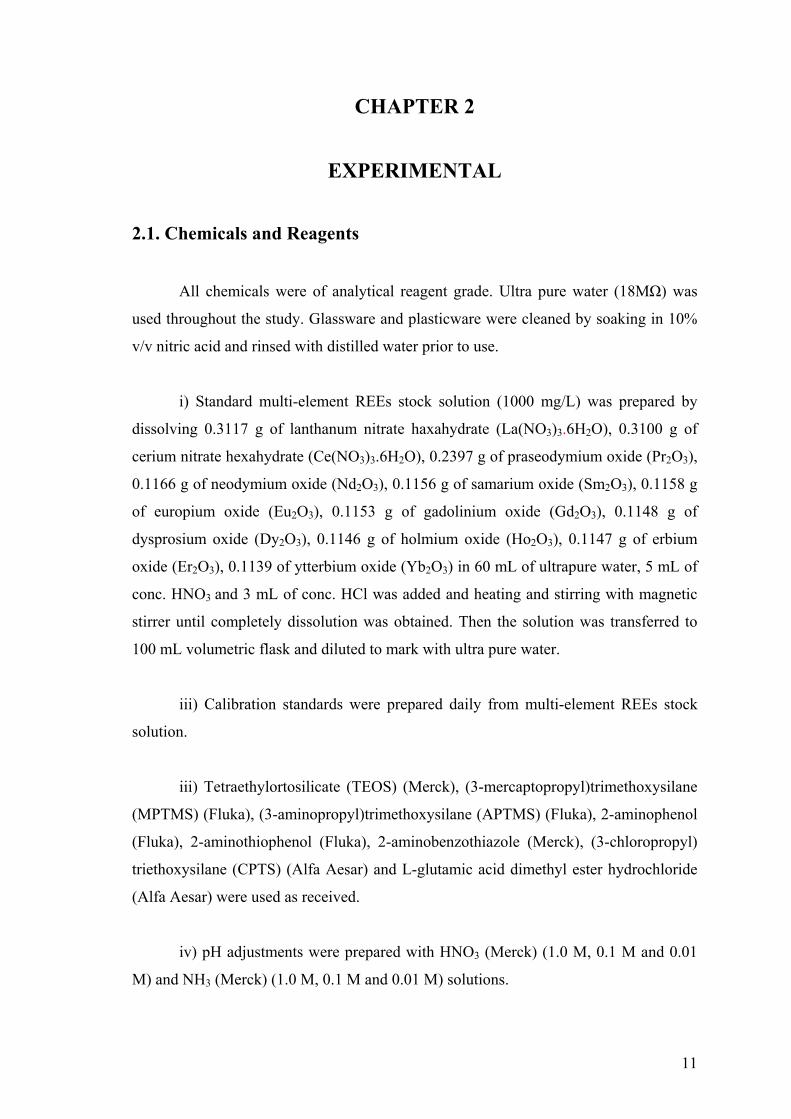
i) Standard multi-element REEs stock solution (1000 mg/L) was prepared by
dissolving 0.3117 g of lanthanum nitrate haxahydrate (La(NO3)3.6H2O), 0.3100 g of
cerium nitrate hexahydrate (Ce(NO3)3.6H2O), 0.2397 g of praseodymium oxide (Pr2O3),
0.1166 g of neodymium oxide (Nd2O3), 0.1156 g of samarium oxide (Sm2O3), 0.1158 g
of europium oxide (Eu2O3), 0.1153 g of gadolinium oxide (Gd2O3), 0.1148 g of
dysprosium oxide (Dy2O3), 0.1146 g of holmium oxide (Ho2O3), 0.1147 g of erbium
oxide (Er2O3), 0.1139 of ytterbium oxide (Yb2O3) in 60 mL of ultrapure water, 5 mL of
conc. HNO3 and 3 mL of conc. HCl was added and heating and stirring with magnetic
stirrer until completely dissolution was obtained. Then the solution was transferred to
100 mL volumetric flask and diluted to mark with ultra pure water.
iii) Calibration standards were prepared daily from multi-element REEs stock
solution.
iii) Tetraethylortosilicate (TEOS) (Merck), (3-mercaptopropyl)trimethoxysilane
(MPTMS) (Fluka), (3-aminopropyl)trimethoxysilane (APTMS) (Fluka), 2-aminophenol
(Fluka), 2-aminothiophenol (Fluka), 2-aminobenzothiazole (Merck), (3-chloropropyl)
triethoxysilane (CPTS) (Alfa Aesar) and L-glutamic acid dimethyl ester hydrochloride
(Alfa Aesar) were used as received.
iv) pH adjustments were prepared with HNO3 (Merck) (1.0 M, 0.1 M and 0.01
M) and NH3 (Merck) (1.0 M, 0.1 M and 0.01 M) solutions.
12
2. 2. Instrumentation and Apparatus
2.2.1. Apparatus
In batch sorption studies, Yellowline RS 10 (Staufen, Germany) lateral shaker
was used to provide efficient mixing. pH measurements were performed using InoLab
pH720 pH meter .
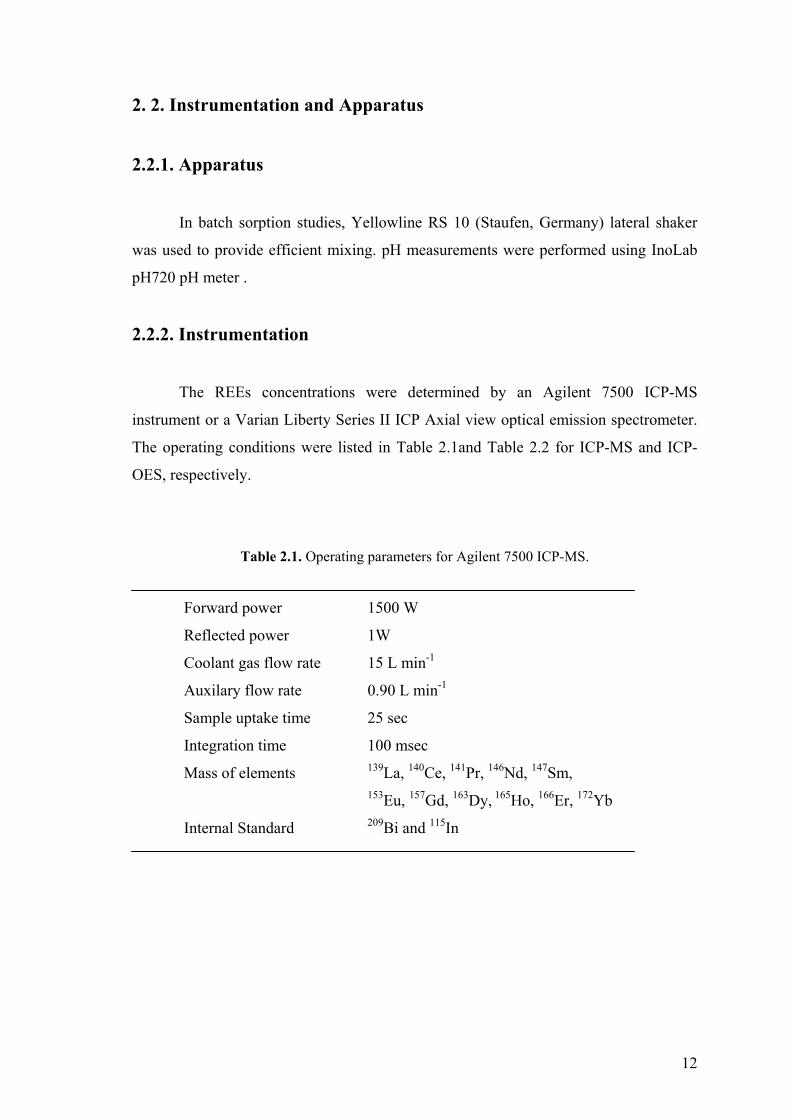
2.2.2. Instrumentation
The REEs concentrations were determined by an Agilent 7500 ICP-MS
instrument or a Varian Liberty Series II ICP Axial view optical emission spectrometer.
The operating conditions were listed in Table 2.1and Table 2.2 for ICP-MS and ICP-
OES, respectively.
Table 2.1. Operating parameters for Agilent 7500 ICP-MS. Forward power 1500 W
Reflected power 1W
Coolant gas flow rate 15 L min-1
Auxilary flow rate 0.90 L min-1
Sample uptake time 25 sec
Integration time 100 msec
Mass of elements 139La, 140Ce, 141Pr, 146Nd, 147Sm, 153Eu, 157Gd, 163Dy, 165Ho, 166Er, 172Yb
Internal Standard 209Bi and 115In
13
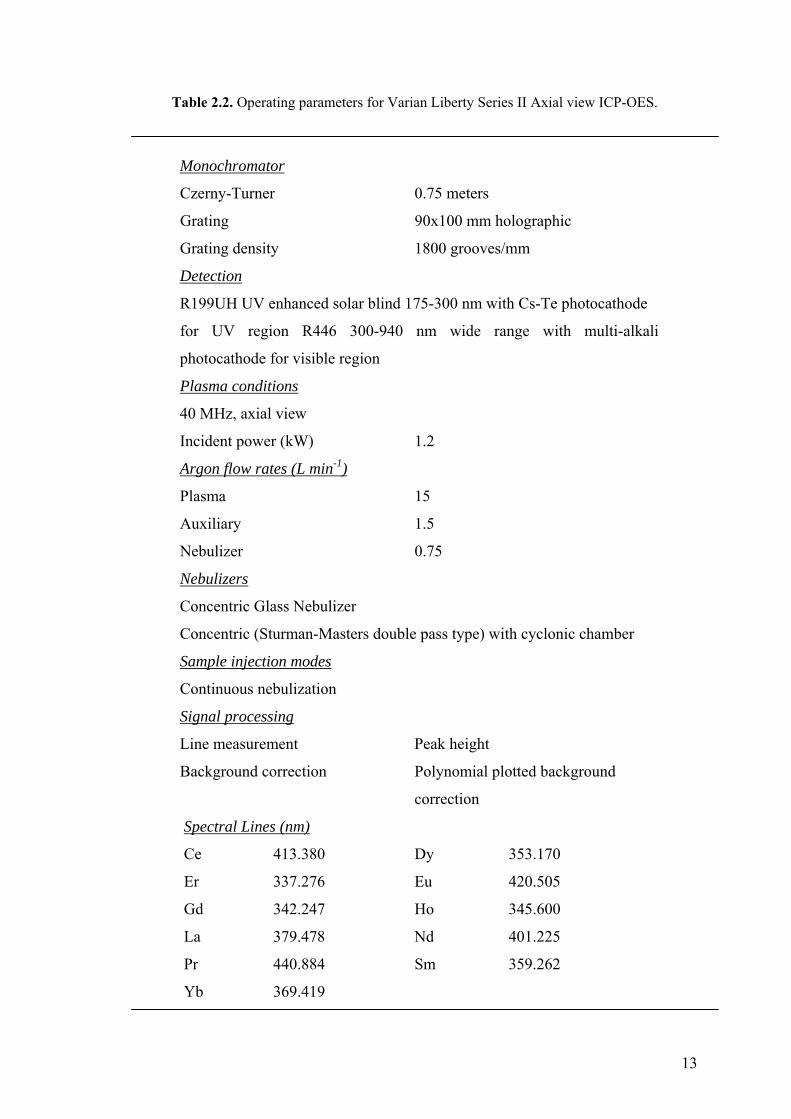
Table 2.2. Operating parameters for Varian Liberty Series II Axial view ICP-OES.
Monochromator
Czerny-Turner 0.75 meters
Grating 90x100 mm holographic
Grating density 1800 grooves/mm
Detection
R199UH UV enhanced solar blind 175-300 nm with Cs-Te photocathode
for UV region R446 300-940 nm wide range with multi-alkali
photocathode for visible region
Plasma conditions
40 MHz, axial view
Incident power (kW) 1.2
Argon flow rates (L min-1)
Plasma 15
Auxiliary 1.5
Nebulizer 0.75
Nebulizers
Concentric Glass Nebulizer
Concentric (Sturman-Masters double pass type) with cyclonic chamber
Sample injection modes
Continuous nebulization
Signal processing
Line measurement Peak height
Background correction Polynomial plotted background
correction
Spectral Lines (nm)
Ce 413.380 Dy 353.170
Er 337.276 Eu 420.505
Gd 342.247 Ho 345.600
La 379.478 Nd 401.225
Pr 440.884 Sm 359.262
Yb 369.419
14
2.3. Synthesis and Characterization of the Sorbents for REEs Sorption
2.3.1. Synthesis of Sorbents
2.3.1.1. Synthesis of Silica Gel by Sol-gel Method
Synthesis of silica gel by sol-gel method was carried out as described by Eroğlu
(1996). In this method silica gel was synthesised using tetraethylortosilicate as starting
material. 25 mL of tetraethylortosilicate, 8 mL of water and 27 mL of ethanol was
mixed immediately in a beaker. The pH of the mixture was adjusted to 4.5 with 2x10⁻⁴
M HCl and stirred for 30 min. After that it was allowed to gel at room temperature for 3
days in a closed container and dried for one week at 60 °C. Finally the obtained silica
gel (sol-gel) was crushed in a porcelain cup.
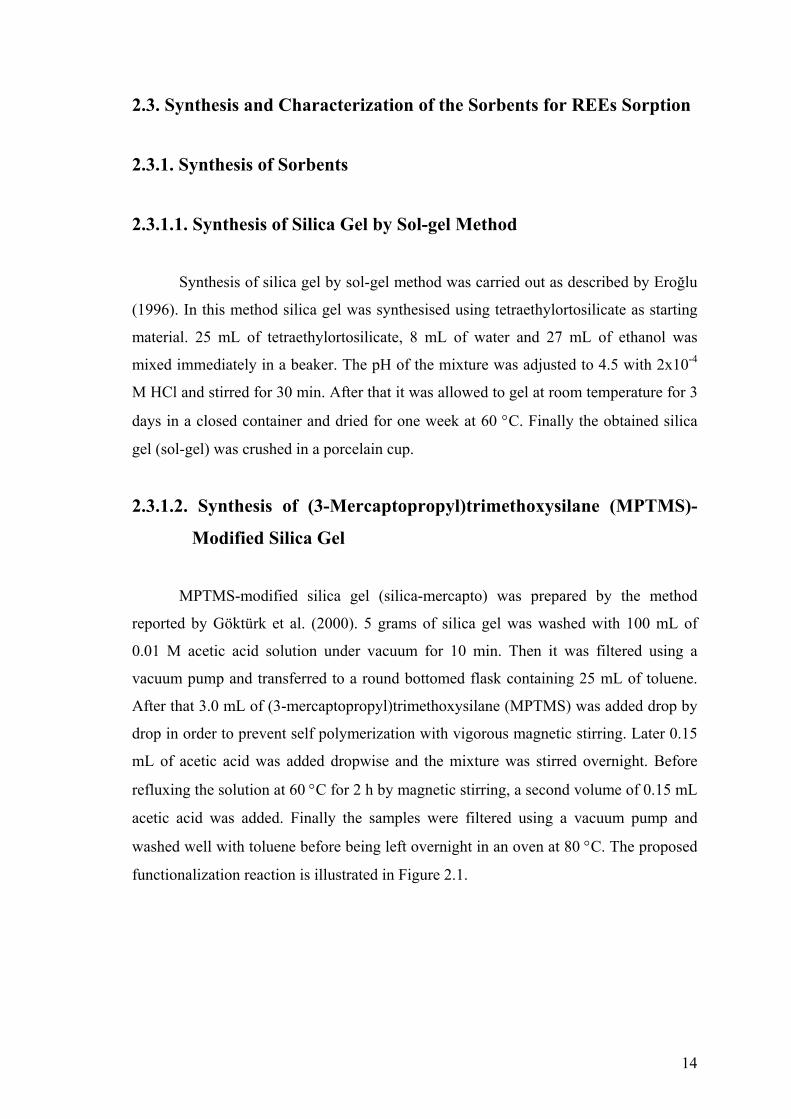
2.3.1.2. Synthesis of (3-Mercaptopropyl)trimethoxysilane (MPTMS)-
Modified Silica Gel
MPTMS-modified silica gel (silica-mercapto) was prepared by the method
reported by Göktürk et al. (2000). 5 grams of silica gel was washed with 100 mL of
0.01 M acetic acid solution under vacuum for 10 min. Then it was filtered using a
vacuum pump and transferred to a round bottomed flask containing 25 mL of toluene.
After that 3.0 mL of (3-mercaptopropyl)trimethoxysilane (MPTMS) was added drop by
drop in order to prevent self polymerization with vigorous magnetic stirring. Later 0.15
mL of acetic acid was added dropwise and the mixture was stirred overnight. Before
refluxing the solution at 60 °C for 2 h by magnetic stirring, a second volume of 0.15 mL
acetic acid was added. Finally the samples were filtered using a vacuum pump and
washed well with toluene before being left overnight in an oven at 80 °C. The proposed
functionalization reaction is illustrated in Figure 2.1.
15
OH
OH
OH
Si
O
O
OSH
(3-mercaptopropyl)trimethoxysilane
O
O
O
Si SHheating
60 0C for 2 h
Silica-mercapto
Figure 2.1. Schematic illustration of modification of silica gel with (3-mercaptopropyl) trimethoxysilane (MPTMS).
2.3.1.3. Synthesis of (3-Mercaptopropyl)trimethoxysilane (MPTMS)-
Modified Silica Gel Prepared by Sol-gel Method (sol-gel
mercapto)
Synthesis of MPTMS-modified silica gel (prepaired bysol-gel method) was
performed as described in Part 2.3.1.2. The only difference was that sol-gel was used
instead of commercial silica gel.
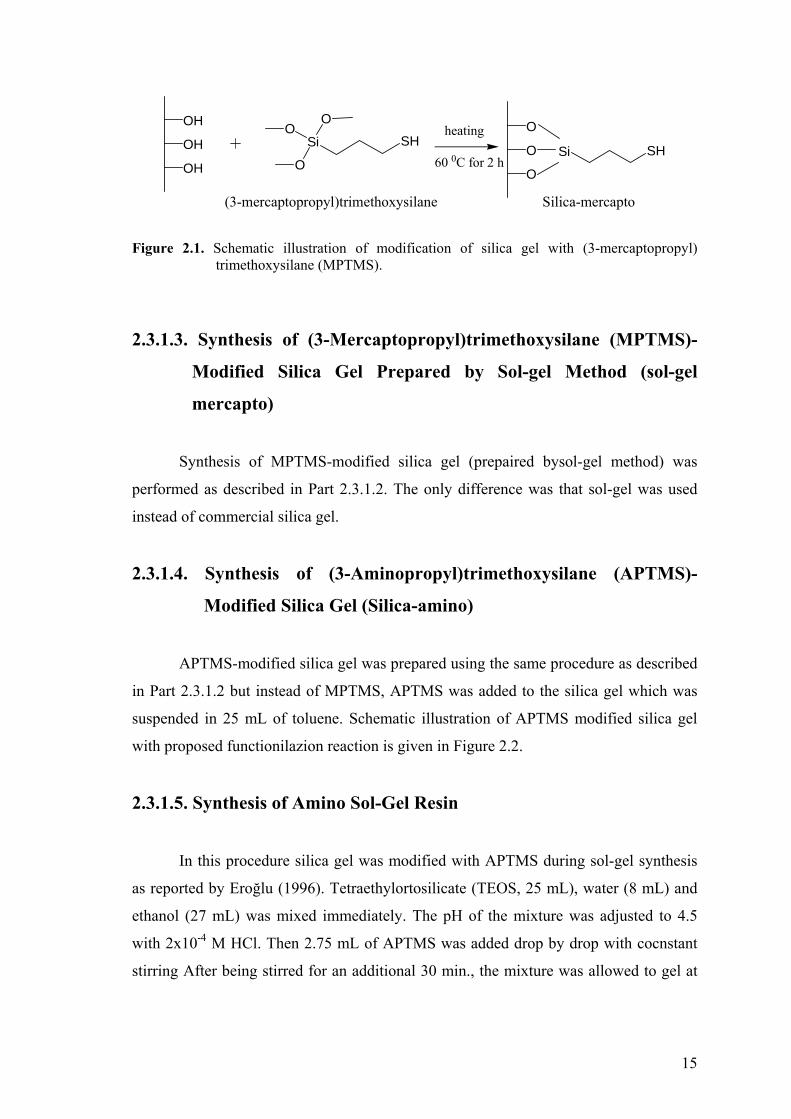
2.3.1.4. Synthesis of (3-Aminopropyl)trimethoxysilane (APTMS)-
Modified Silica Gel (Silica-amino)
APTMS-modified silica gel was prepared using the same procedure as described
in Part 2.3.1.2 but instead of MPTMS, APTMS was added to the silica gel which was
suspended in 25 mL of toluene. Schematic illustration of APTMS modified silica gel
with proposed functionilazion reaction is given in Figure 2.2.
2.3.1.5. Synthesis of Amino Sol-Gel Resin
In this procedure silica gel was modified with APTMS during sol-gel synthesis
as reported by Eroğlu (1996). Tetraethylortosilicate (TEOS, 25 mL), water (8 mL) and
ethanol (27 mL) was mixed immediately. The pH of the mixture was adjusted to 4.5
with 2x10⁻⁴ M HCl. Then 2.75 mL of APTMS was added drop by drop with cocnstant
stirring After being stirred for an additional 30 min., the mixture was allowed to gel at
16
room temperature for 3 days in a closed container and dried for one a week at 60 °C.
After drying the glass were crushed in a porcelain cup.
OH
OH
OH
Si
O
O
ONH2
(3-aminopropyl)trimethoxysilane
O
O
O
Si NH260 0C for 2h
heating
Silica-amino
Figure 2.2. Schematic illustration of modification of silica gel with (3-aminopropyl) trimethoxysilane (APTMS).
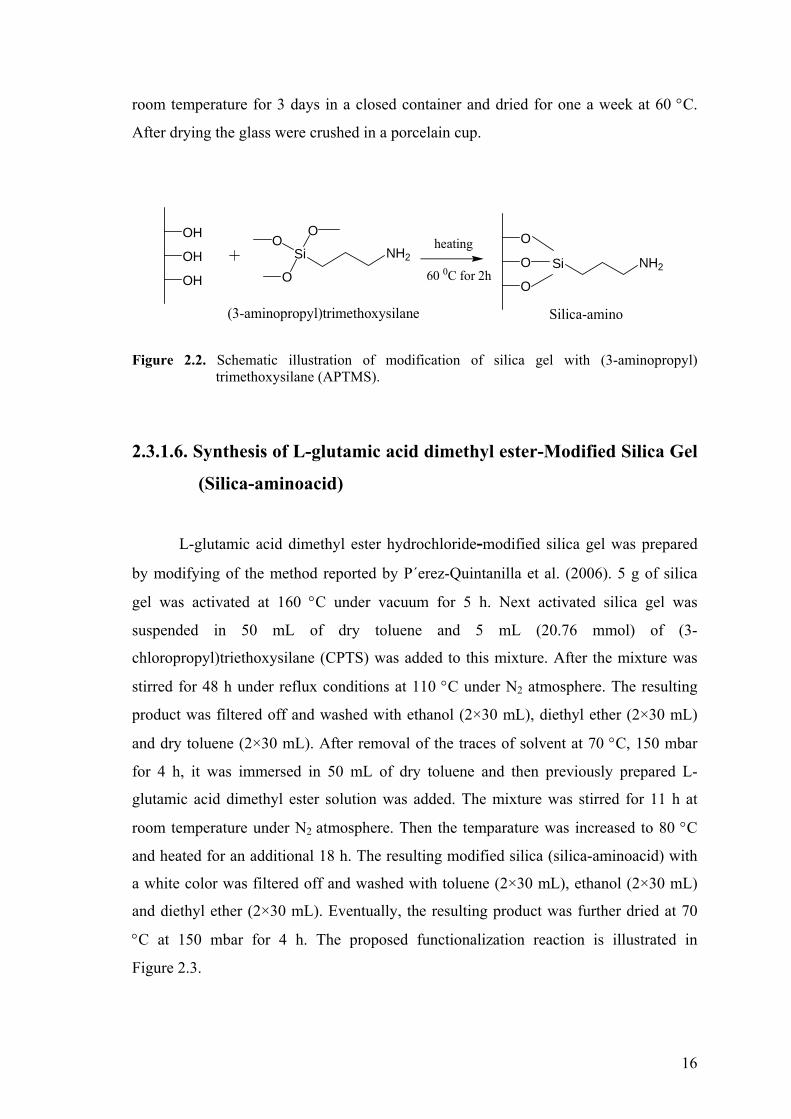
2.3.1.6. Synthesis of L-glutamic acid dimethyl ester-Modified Silica Gel
(Silica-aminoacid)
L-glutamic acid dimethyl ester hydrochloride-modified silica gel was prepared
by modifying of the method reported by P´erez-Quintanilla et al. (2006). 5 g of silica
gel was activated at 160 °C under vacuum for 5 h. Next activated silica gel was
suspended in 50 mL of dry toluene and 5 mL (20.76 mmol) of (3-
chloropropyl)triethoxysilane (CPTS) was added to this mixture. After the mixture was
stirred for 48 h under reflux conditions at 110 °C under N2 atmosphere. The resulting
product was filtered off and washed with ethanol (2×30 mL), diethyl ether (2×30 mL)
and dry toluene (2×30 mL). After removal of the traces of solvent at 70 °C, 150 mbar
for 4 h, it was immersed in 50 mL of dry toluene and then previously prepared L-
glutamic acid dimethyl ester solution was added. The mixture was stirred for 11 h at
room temperature under N2 atmosphere. Then the temparature was increased to 80 °C
and heated for an additional 18 h. The resulting modified silica (silica-aminoacid) with
a white color was filtered off and washed with toluene (2×30 mL), ethanol (2×30 mL)
and diethyl ether (2×30 mL). Eventually, the resulting product was further dried at 70
°C at 150 mbar for 4 h. The proposed functionalization reaction is illustrated in
Figure 2.3.
17
L-glutamic acid dimethyl ester solution was prepared by treatment of 4.8331 g
(22.836 mmol) of L-glutamic acid dimethyl ester hydrochloride with 4.2502 g of
Na2CO3 in 40 mL of water. The solution was extracted three times with 30 mL of ethyl
acetate and organic phases were combined. Then organic phase was washed with 40 ml
of brine solution and it was dried with MgSO4. Finally the solvent was concentrated
under vacuum (at 200 mbar) Thus L-glutamic acid dimethyl ester solution was obtained.
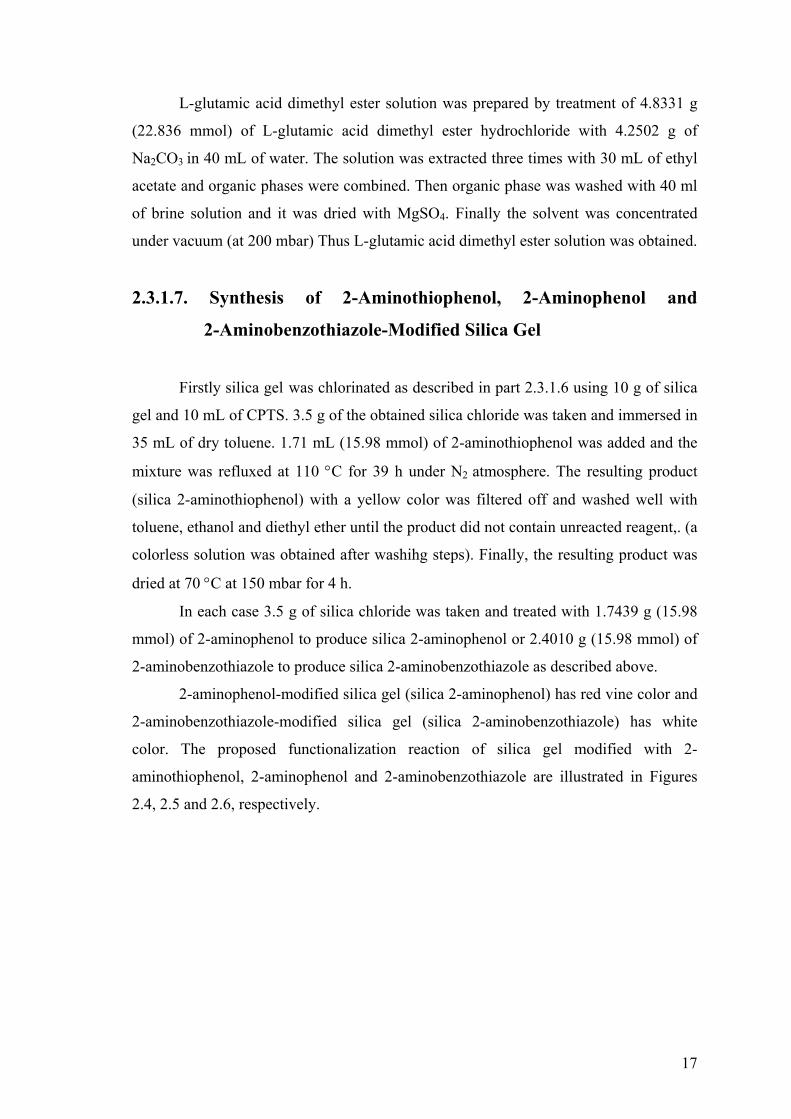
2.3.1.7. Synthesis of 2-Aminothiophenol, 2-Aminophenol and
2-Aminobenzothiazole-Modified Silica Gel
Firstly silica gel was chlorinated as described in part 2.3.1.6 using 10 g of silica
gel and 10 mL of CPTS. 3.5 g of the obtained silica chloride was taken and immersed in
35 mL of dry toluene. 1.71 mL (15.98 mmol) of 2-aminothiophenol was added and the
mixture was refluxed at 110 °C for 39 h under N2 atmosphere. The resulting product
(silica 2-aminothiophenol) with a yellow color was filtered off and washed well with
toluene, ethanol and diethyl ether until the product did not contain unreacted reagent,. (a
colorless solution was obtained after washihg steps). Finally, the resulting product was
dried at 70 °C at 150 mbar for 4 h.
In each case 3.5 g of silica chloride was taken and treated with 1.7439 g (15.98
mmol) of 2-aminophenol to produce silica 2-aminophenol or 2.4010 g (15.98 mmol) of
2-aminobenzothiazole to produce silica 2-aminobenzothiazole as described above.
2-aminophenol-modified silica gel (silica 2-aminophenol) has red vine color and
2-aminobenzothiazole-modified silica gel (silica 2-aminobenzothiazole) has white
color. The proposed functionalization reaction of silica gel modified with 2-
aminothiophenol, 2-aminophenol and 2-aminobenzothiazole are illustrated in Figures
2.4, 2.5 and 2.6, respectively.
18
OH
OH
OHSiO O
O
Cl
3-(Chloropropyl)triethoxysilane
O
O
O
Si Cl
O
O
O
Si
reflux,toluene
48 h, N2
NH2
O
O
O
O
L-glutamic acid dimethyl ester
HN
OO
OO
Silica-aminoacid
Figure 2.3. Schematic illustration of modification of silica gel with L-glutamic acid dimethyl ester.
19
OH
OH
OHSiO O
O
Cl
(3-chloropropyl)triethoxysilane
H2N
HS
2-aminothiophenol
H2N
SO
O
O
Si
O
O
O
Si Cl
HS
HNO
O
O
Si
S
HN
Si
Si
O
O
O
O
O
O
reflux,toluene
48 h, N2
Figure 2.4. Schematic illustration of modification of silica gel with 2-aminothiophenol.
20
OH
OH
OHSiO O
O
Cl
3-(Chloropropyl)triethoxysilane H2N
HO
O
O
O
Si Cl
Silica 2-aminophenol
reflux,toluene
48 h, N2
O
O
O
Si
HO
HN
2-Aminophenol
Figure 2.5. Schematic illustration of modification of silica gel with 2-aminophenol.
OH
OH
OHSiO O
O
Cl
3-(Chloropropyl)triethoxysilane
O
O
O
Si Clreflux,toluene
48 h, N2
S
NH2N
2-Aminobenzothiazole
Silica 2-aminobenzothiazole
S
N
HNO
O
O
Si
Figure 2.6. Schematic illustration of modification of silica gel with 2-aminobenzothiazole.
21
2.4. Characterization of the Synthesised Sorbents
Characterization of the sorbents was carried out using scanning electron
microscope (SEM), elemental analysis and thermo gravimetric analysis (TGA).
2.4.1. Characterization of Sorbents Using SEM/EDX
SEM/EDX characterization was performed using a Philips XL-30S FEG type
instrument. Prior to analysis, solid samples were sprinkled onto adhesive carbon tapes
which were supported on metallic disks. An Energy-Dispersive X-ray Spectroscopy
(EDX) analysis was carried out on randomly selected points on the solid surfaces and
back-scatter electron (BSE) detector was utilized during SEM analysis. The backscatter
electron detector allows materials with different compositions to be imaged as different
(greyscale/atomic) contrast and it is used for the elements having a large atomic number
difference between each other.
2.4.2. Elemental Analysis
Carbon, nitrogen, sulfur and hydrogen contents were determined using a Leco
932 CHNS analyser.
2.4.3. Thermo Gravimetric Analysis
TGA was performed using a Perkin Elmer Diamond TG/DTA instrument. The
solid samples were heated from 50 °C to 800 °C by a heating rate of 10 °C/min in the
presence of N2 atmosphere.
22
2.5. Determination of REEs
2.5.1. Calibration Curves for REEs
Determination of REEs was performed using ICP-MS and ICP-OES with the
condition given in Tables 2.1 and 2.2.
2.5.1.1. Aqueous Calibration Plot
Standard solutions from 10.0 µg/L to 1000 µg/L were prepared from 1000 mg/L
multi-element REEs standard with simple dilution. All standards contained 1% (v/v)
HNO3 corresponding to a molarity of 0.144 M.
In ICP-MS studies 209Bi or 115In were used as internal standard. For comparison,
quantitation was made by both including these internal standards and not taking them
into consideration. In both cases same results were obtained. Therefore, internal
standardization was only applied randomly to check any change in the response of the
instrument.
2.5.1.2. Matrix-matched Calibration Plot
The matrix-matched calibration standards were prepared by applying the
proposed sorption/desorption procedure using silica-amino. Among the various
synthesised sorbents silica-amino exhibited better results. Therefore, for subsequent
experiments silica-amino was decided to be used. In order to plot matrix-matched
calibration plots of REEs, standard solutions from 0.2 mg/L to 2.0 mg/L were mixed
with 0.05 g of silica-amino. The solutions were shaken manually for 1 min. and then
placed on the shaker for 30 min. at room temperature. The contents were collected on
filter papers and then were eluted using 1.0 M HNO3 solution. In later experiments it
was obtained that 1.0 M HNO3 was sufficient to elute REEs from silica-amino
completely. Since 1.0 M HNO3 can damage the sampling and interface cones of ICP-
MS instrument, the eluent solutions were diluted 5 times before being introduced to
ICP-MS. So the diluted matrix matched standards concentration corresponded to from
23
0.04 mg/L to 0.4 mg/L. Graphs of counts per second versus concentration were
constructed using these standards.
2.5.2. Sorption Studies
2.5.2.1. Types of Sorbents
In order to find the suitable sorbent for the sorption of REEs, silica gel was tried
to be modified with several organic compunds containing S and N functional groups
which are thought to react with REEs in order to remove them from solution. The
modified organic compouds are given in Table 2.3. The sorption experiments were
performed with the batch method. As an initial experiment, 1.0 mg/L multi-element
REEs standard solution was prepared at a pH of 7 and 50 mg of the tested sorbent was
added to 20.0 mL of this solution. The resulting mixture was shaken manually for 1-2
min. and then for a further 30 min. on a shaker at room temperature. At the end of the
shaking period, the mixture was filtered and filtrate was analysed by ICP-MS.
2.5.2.2. Effect of pH
In order to investigate the effect of pH on the sorption of REEs, 1.0 mg/L multi-
element REEs standard solutions were prepared at different pHs from pH 1 to 10. From
each of these solutions 20.0 mL were taken and 50 mg of sorbent was added. The
mixture was shaken for 1-2 min. manually then 30 min on a shaker. After the solid and
the liquid phases were separated by filtration, the liquid parts were analysed for REEs
with ICP-MS.
24
Table 2.3. Organic compounds used in the modification of silica gel. 2–aminophenol
H2N
HO
L-glutamic acid dimetyl ester hydrochloride
NH2
O
O
O
O
H
Cl
2–aminothiophenol
H2N
HS
(3-aminopropyl) trimethoxysilane APTMS
Si
O
O
OH2N
2-aminobenzothiazole
S
N
H2N
(3-mercaptopropyl) trimethoxysilane MPTMS
Si
O
O
OHS
25
2.5.2.3. Effect of Initial Metal Concentration
Sorption ability of silica gel, silica-amino and silica-aminoacid at high
concentration of REEs was investigated. For an initial study, REEs solution at three
different concentrations (1.0 mg/L, 50.0 mg/L and 100.0 mg/L) were prepared. 20.0 mL
of these solutions (at pH 5) were taken and 50 mg of sorbent was added to each of them.
Then the mixture was shaken for 1 min. manually and 30 min. on a shaker. After
filtration, the filtrates were analysed with ICP-MS. More detailed experimental plan was
decided to be carried out for only silica and silica-amino since silica-aminoacid did not
exhibit sorption capacity higher than silica gel. So, sorption capacity of silica gel and
silica amino was investigated at concentrations varying from 1.0 mg/L to 100.0 mg/L
prepared at pH 5.
2.5.2.4. Effect of Shaking Time
In order to obtain efficient sorption, the optimum contact time was investigated.
For this purpose, 20.0 mL of 50.0 mg/L multi-element REEs solutions at pH 5
containing 50 mg of silica gel and silica-amino were shaken from 1 min. to 4h. After
filtration, the resulting solutions were analysed by ICP-OES and percent sorption was
calculated.
2.5.2.5. Effect of Sorbent Amount
Determination of sorbent amount is an important factor for quantitative sorption
of the analyte from the solution. So the effect of sorbent amount on sorption was
examined. An amount of sorbents (silica gel and silica-amino) varying from 25 mg to
100 mg were added to 20.0 mL of 50.0 mg/L multi-element REEs solutions at pH 5 and
shaken 1 min. manually then for 30 min. on a shaker. After filtration the content of
REEs in solution was determined with ICP-OES.
26
2.5.3. Desorption from the Sorbent
After collection of REEs by silica gel and silica-amino, their release was
investigated using HNO3 at different concentrations. 20.0 mL of 1.0 mg/L multielement
REEs solutions were prepared at pH 5 and 0.05 g of sorbent was added. After shaking
for 30 minutes, the mixtures were filtered and the sorbent with filter paper were put into
the 20.0 mL of desorbing solution. The new mixtures were shaken once again for 30
minutes. At the end of this period, the mixtures were filtered and the filtrates were
analysed for their REEs content with ICP-MS.
2.5.4. Method Validation
Method validation was realised through spike recovery test with ultra pure water
(UPW), tap water (TW), sea water (SW) and geothermal water (GW) samples. 20.0 mL
of aliquots of sample were spiked with 1.0 mg/L multi-element REEs and mixed with
silica-amino. After usual sorption procedure, the mixtures were filtered and the sorbents
with filter paper were placed into 20.0 mL of 1.0 M HNO3 for desorption. The blank
solution and the calibration standards were prepared using the same procedure. For
quantitation matrix-matched calibration standars were used. The concentration of REEs
in the eluates was determined by ICP-MS and the percent recoveries were calculated.
27
CHAPTER 3
RESULTS AND DISCUSSION
3.1. Characterization of the Synthesised Sorbents
3.1.1. Characterization of Sorbents Using SEM/EDX Mapping
In order to follow the success of the modification procedures, firstly EDX
mapping was applied.
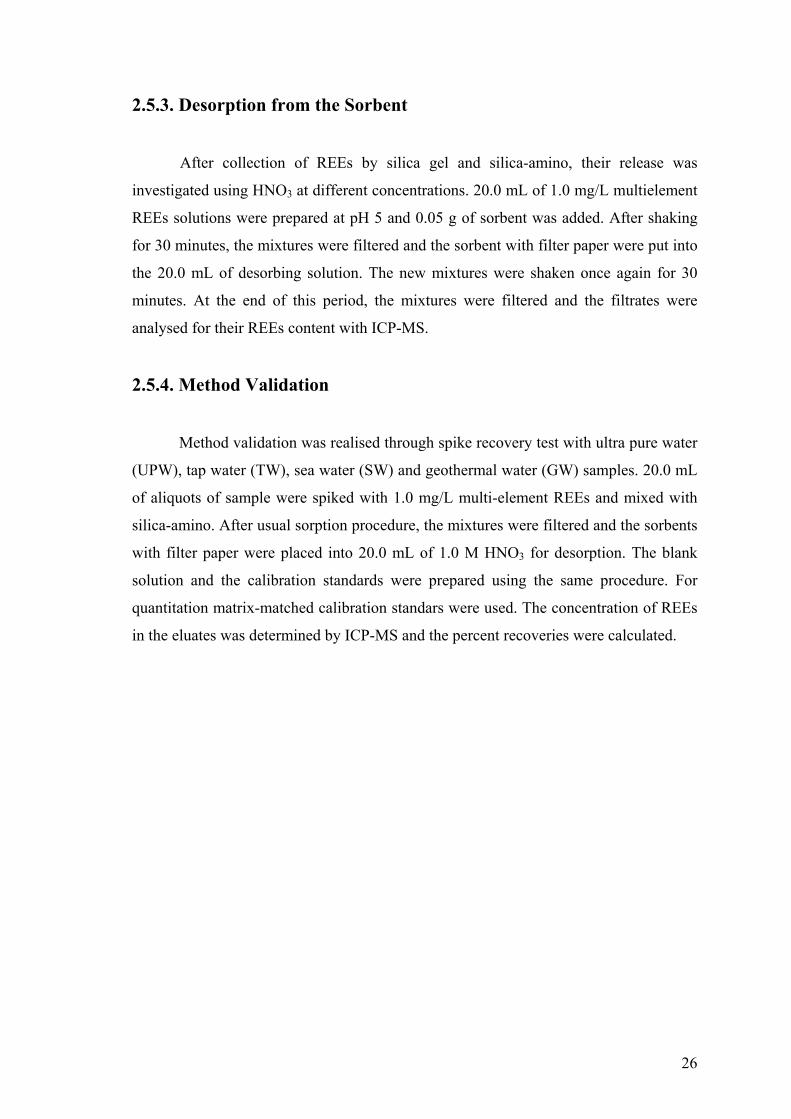
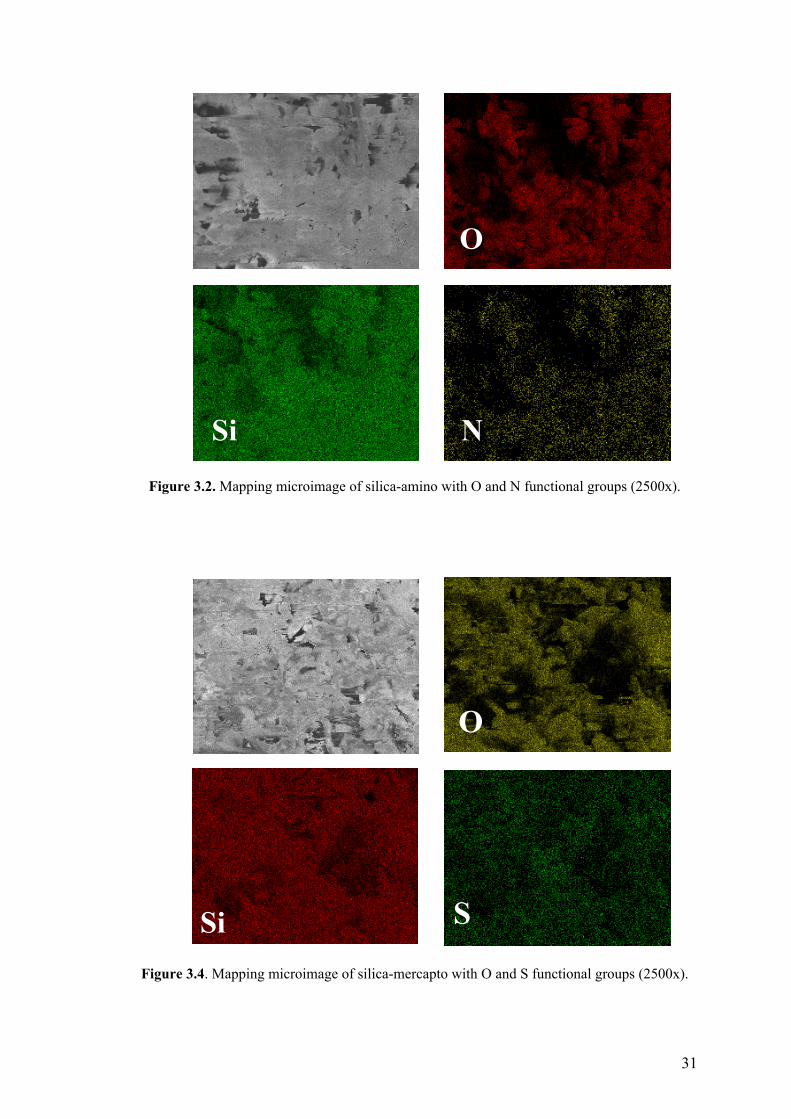
EDX spectra of silica gel and silica-amino is provided in Figure 3.1. It indicates
the presence of N on the sorbent surface and mapping figures (Figure 3.2 on page 31)
indicates the homogenous distribution of O and N functional groups on the sorbent
surface.The N atoms were observed to be representing the amine functional group.
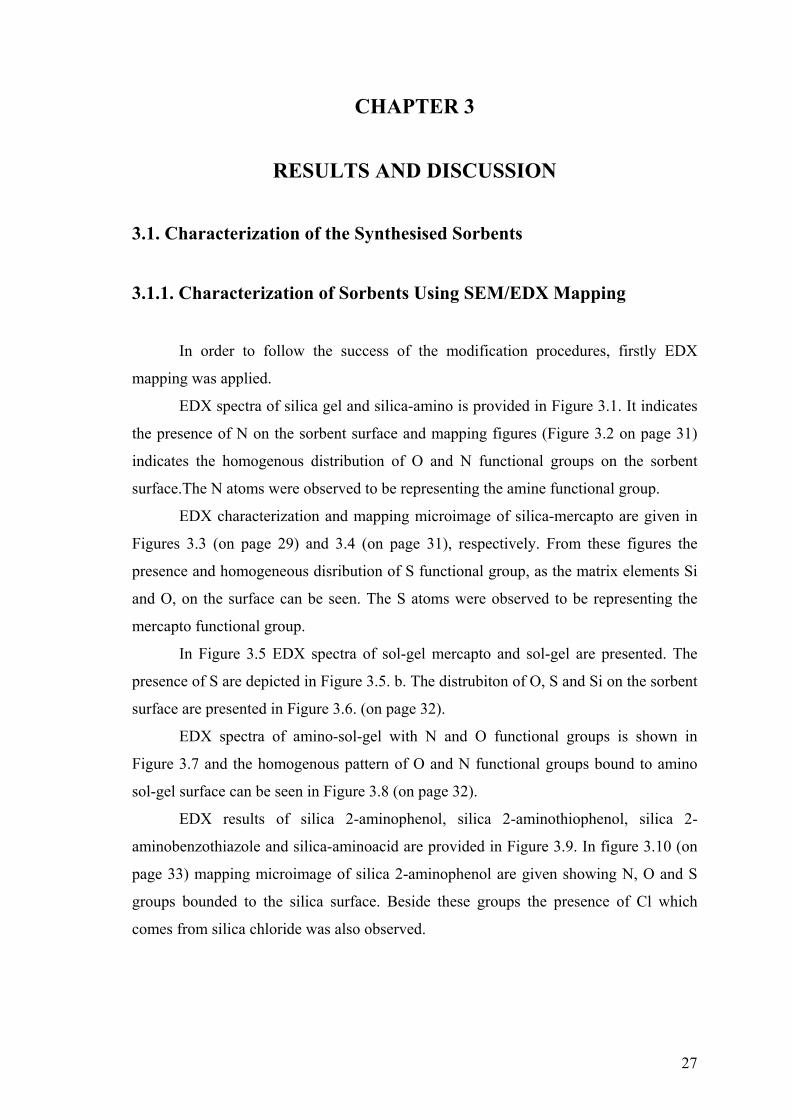
EDX characterization and mapping microimage of silica-mercapto are given in
Figures 3.3 (on page 29) and 3.4 (on page 31), respectively. From these figures the
presence and homogeneous disribution of S functional group, as the matrix elements Si
and O, on the surface can be seen. The S atoms were observed to be representing the
mercapto functional group.
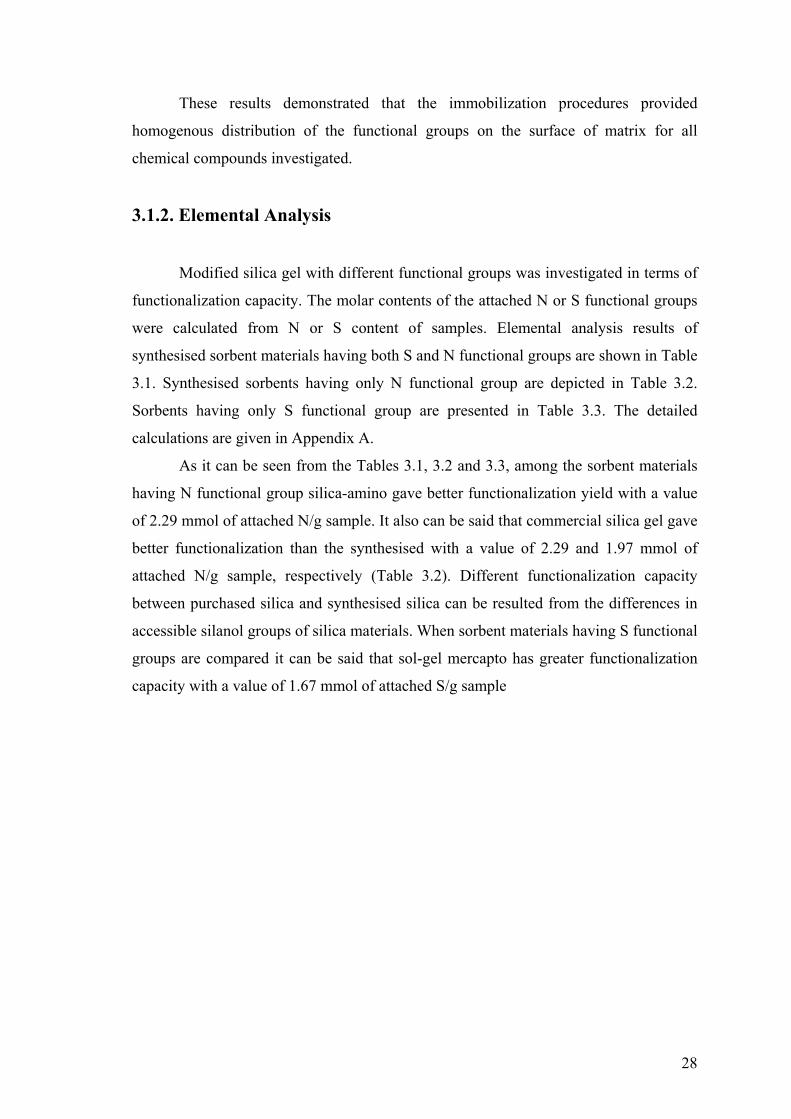
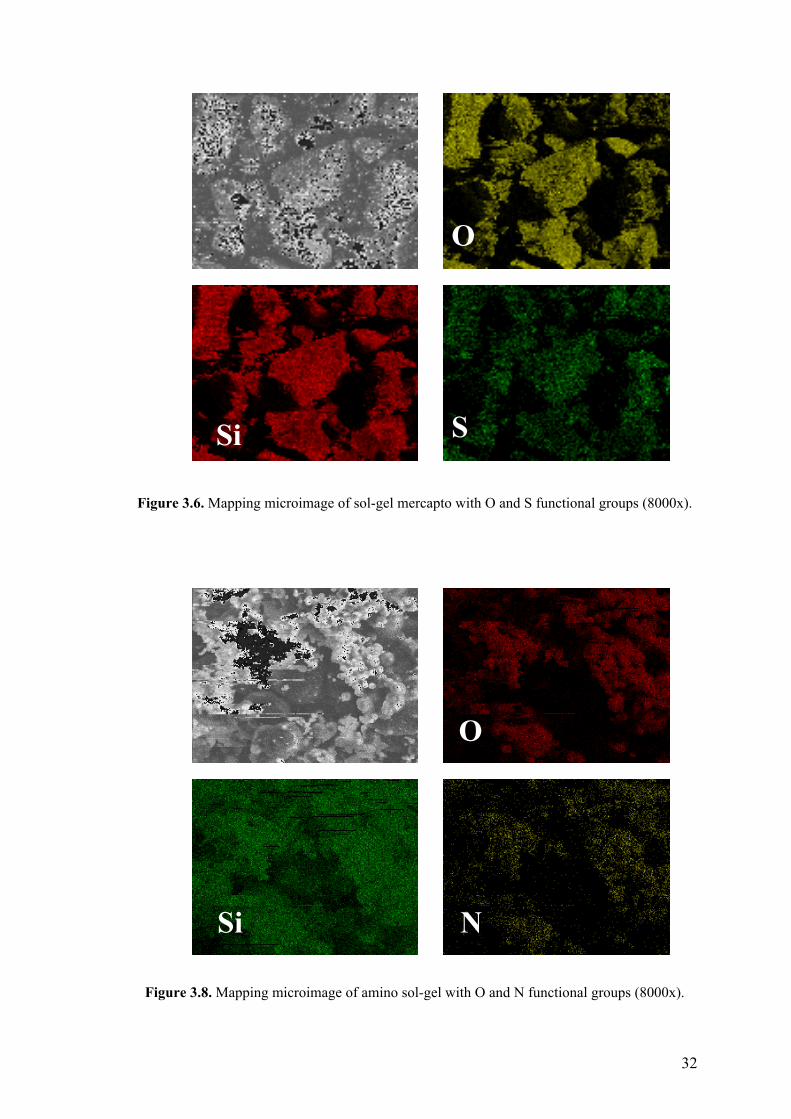
In Figure 3.5 EDX spectra of sol-gel mercapto and sol-gel are presented. The
presence of S are depicted in Figure 3.5. b. The distrubiton of O, S and Si on the sorbent
surface are presented in Figure 3.6. (on page 32).
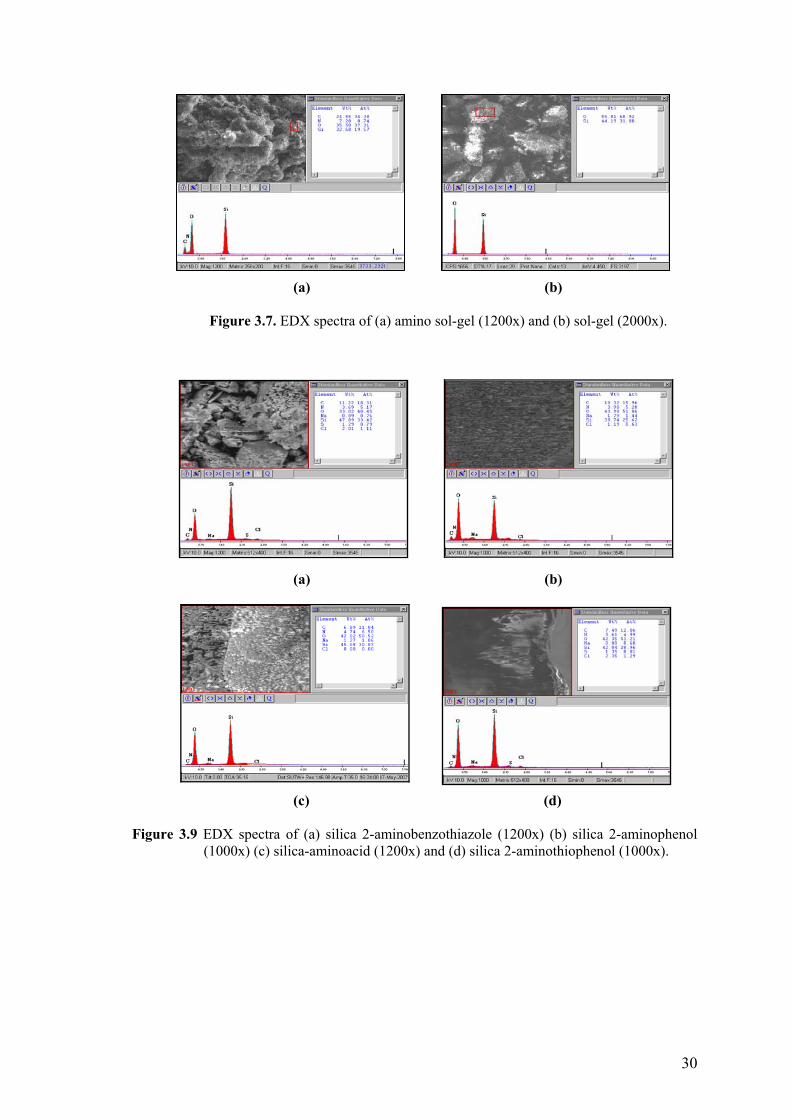
EDX spectra of amino-sol-gel with N and O functional groups is shown in
Figure 3.7 and the homogenous pattern of O and N functional groups bound to amino
sol-gel surface can be seen in Figure 3.8 (on page 32).
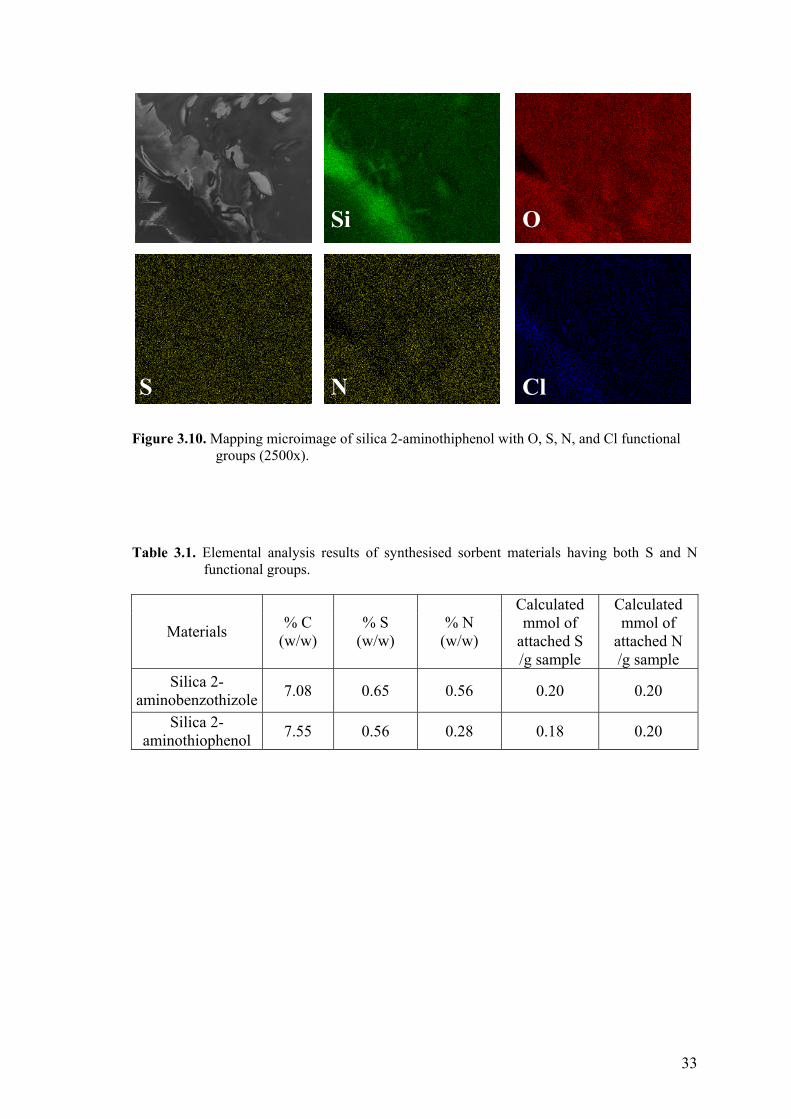
EDX results of silica 2-aminophenol, silica 2-aminothiophenol, silica 2-
aminobenzothiazole and silica-aminoacid are provided in Figure 3.9. In figure 3.10 (on
page 33) mapping microimage of silica 2-aminophenol are given showing N, O and S
groups bounded to the silica surface. Beside these groups the presence of Cl which
comes from silica chloride was also observed.
28
These results demonstrated that the immobilization procedures provided
homogenous distribution of the functional groups on the surface of matrix for all
chemical compounds investigated.
3.1.2. Elemental Analysis
Modified silica gel with different functional groups was investigated in terms of
functionalization capacity. The molar contents of the attached N or S functional groups
were calculated from N or S content of samples. Elemental analysis results of
synthesised sorbent materials having both S and N functional groups are shown in Table
3.1. Synthesised sorbents having only N functional group are depicted in Table 3.2.
Sorbents having only S functional group are presented in Table 3.3. The detailed
calculations are given in Appendix A.
As it can be seen from the Tables 3.1, 3.2 and 3.3, among the sorbent materials
having N functional group silica-amino gave better functionalization yield with a value
of 2.29 mmol of attached N/g sample. It also can be said that commercial silica gel gave
better functionalization than the synthesised with a value of 2.29 and 1.97 mmol of
attached N/g sample, respectively (Table 3.2). Different functionalization capacity
between purchased silica and synthesised silica can be resulted from the differences in
accessible silanol groups of silica materials. When sorbent materials having S functional
groups are compared it can be said that sol-gel mercapto has greater functionalization
capacity with a value of 1.67 mmol of attached S/g sample
29
(a) (b)
Figure 3.1. EDX spectra of (a) silica gel (1000x) and (b) silica-amino (1000x).
(a) (b)
Figure 3.3. EDX spectra of (a) silica gel (1000x) and (b) silica-mercapto (2000x).
(a) (b)
Figure 3.5. EDX spectra of (a) sol-gel (2000x) and (b) sol-gel mercapto (1500x).
30
(a) (b)
Figure 3.7. EDX spectra of (a) amino sol-gel (1200x) and (b) sol-gel (2000x).
(a) (b)
(c) (d)
Figure 3.9 EDX spectra of (a) silica 2-aminobenzothiazole (1200x) (b) silica 2-aminophenol
(1000x) (c) silica-aminoacid (1200x) and (d) silica 2-aminothiophenol (1000x).
31
Figure 3.2. Mapping microimage of silica-amino with O and N functional groups (2500x).
Figure 3.4. Mapping microimage of silica-mercapto with O and S functional groups (2500x).
O
NSi
O
SSi
32
Figure 3.6. Mapping microimage of sol-gel mercapto with O and S functional groups (8000x).
hfgşsdghşd Figure 3.8. Mapping microimage of amino sol-gel with O and N functional groups (8000x).
O
Si N
O
S
Si O
Si S
33
Figure 3.10. Mapping microimage of silica 2-aminothiphenol with O, S, N, and Cl functional
groups (2500x).
Table 3.1. Elemental analysis results of synthesised sorbent materials having both S and N functional groups.
Materials % C (w/w)
% S (w/w)
% N (w/w)
Calculated mmol of
attached S /g sample
Calculated mmol of
attached N /g sample
Silica 2-aminobenzothizole 7.08 0.65 0.56 0.20 0.20
Silica 2-aminothiophenol 7.55 0.56 0.28 0.18 0.20
Si O
N S Cl
34
Table 3.2. Elemental analysis results of synthesised sorbents materials having N functional group.
Materials
% C (w/w)
% N (w/w)
Calculated mmol of
attached N /g sample
Silica-amino 10.07 3.20 2.29 Amino sol-gel 7.44 2.76 1.97
Silica-aminoacid 9.98 2.19 1.56 Silica
2-aminophenol 10.56 1.15 0.82
Table 3.3. Elemental analysis results of synthesised sorbent materials having S functional
group.
Materials % C (w/w)
% S (w/w)
Calculated mmol of
attached S /g sample
Silica-mercapto 4.33 3.56 1.11 Sol-gel mercapto 5.84 5.35 1.67
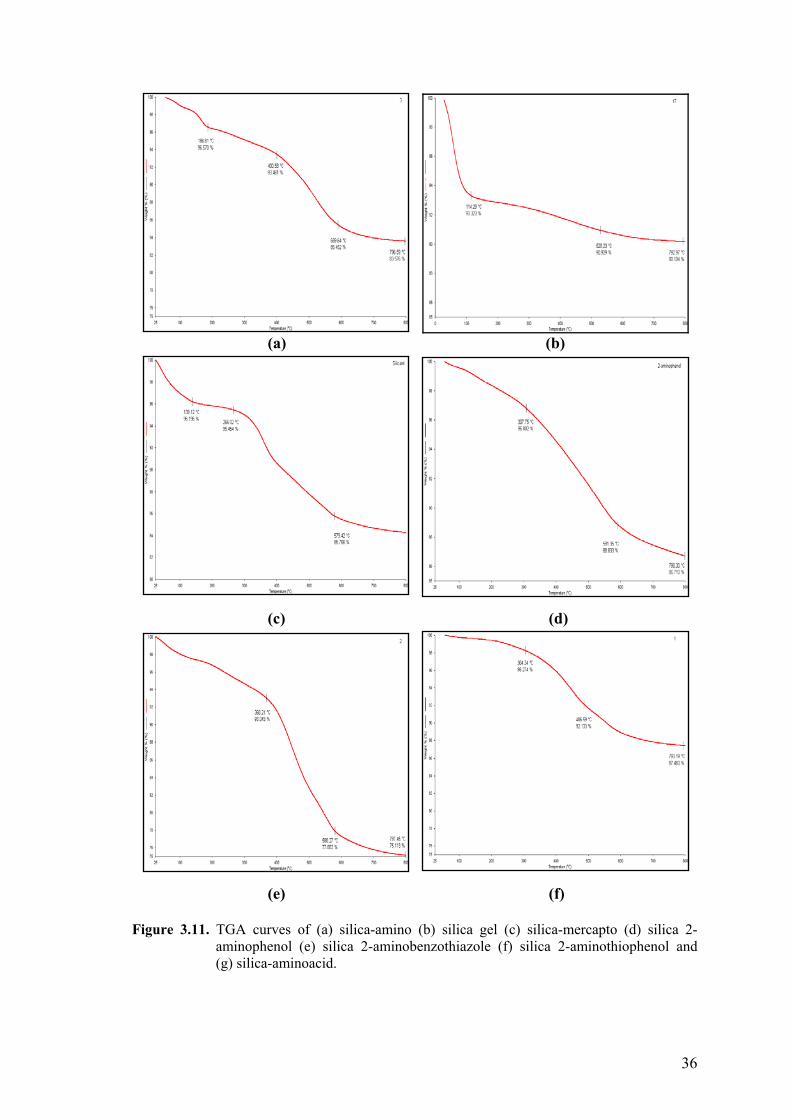
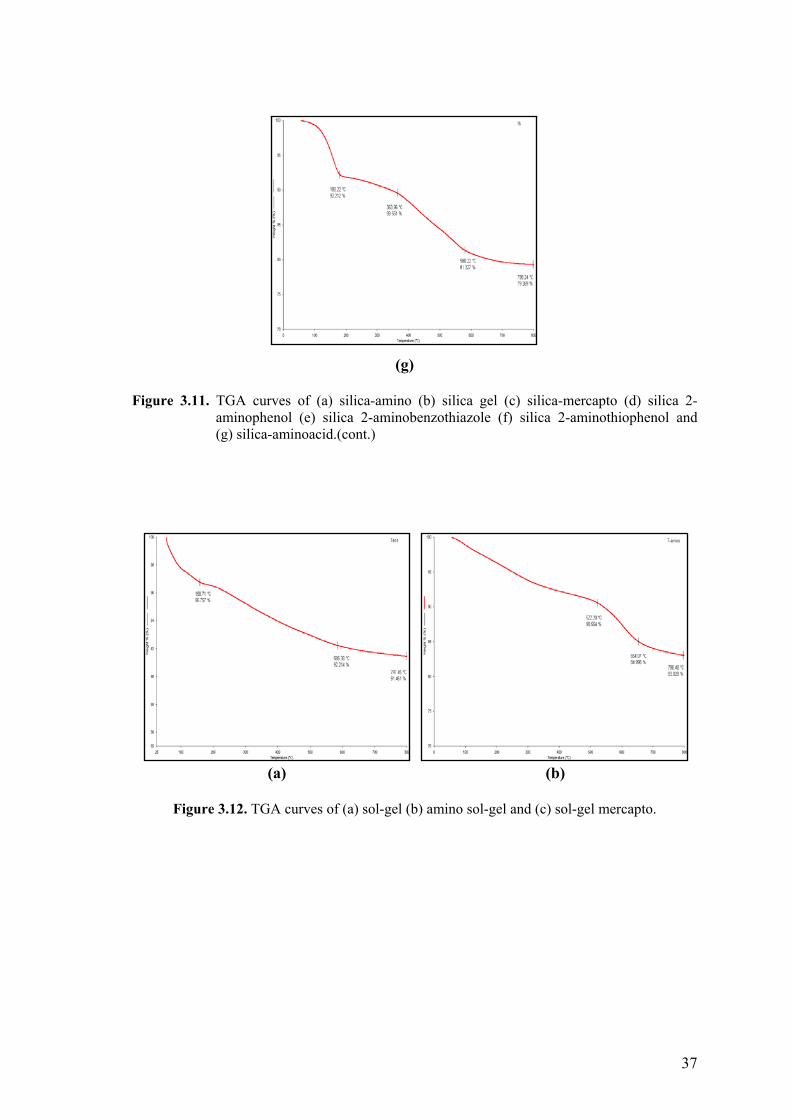
3.1.3. Thermo Gravimetric Analysis (TGA)
TGA analysis was performed in order to see the effect of heat on the structure of
synthesised sorbents. The results are provided in Figure 3.11 for purchased silica gel
modified with different functional groups and Figure 3.12 for sythesised silica gel
modified with APTMS. When the TGA curve of silica gel is considered (Figure 3.11 b)
7% w/w weight loss at ~110 0C can be seen which is caused by water removed from
silica structure. After 500 0C weight loss remains constant up to 800 0C and only 10%
w/w weight loss is observed. When silica gel modified with different organic
compounds was heated to 800 0C the total loss from the sample was about 25-15% w/w.
Although presence of functional groups were proven with elemental analysis and
mapping results, by considering TGA results, without making much speculation, we can
say that additional weight loss of silica gel can also give information about presence of
functional groups on the silica surface. TGA curves of sol-gel (Figure 3.12 a) and
35
purchased silica gel (Figure 3.11 b) is similar so it can be concluded that silica gel was
synthesised succesfully by sol-gel method.
3.2. Determination of REEs
Determination of REEs was performed by ICP-MS or ICP-OES. Experiments
related to optimization of shaking time and sorbent amount were performed with ICP-
OES since initial the REEs concentration was high (50.0 mg/L). In these experiments,
concentrations of REEs were also determined by ICP-MS after dilution; giving similar
results. ICP-MS was used only for lower concentrations.
3.2.1. Calibration Curves for REEs
Two calibration graphs, aqeuous calibration plot and matrix-matched calibration
plot, were employed throughout the study. The matrix-matched standard graph was
obtained by employing the proposed sorption/desorption steps with silica-amino as
described in experimental part. Graphs of counts per second versus concentration were
constructed for all REEs. In this part, three selected graphs are given; Figure 3.13 for
La(III) (as a representative of the light REEs; La, Ce, Pr, Nd), Figure 3.14 for Eu(III)
(as a representative of the medium REEs; Sm, Eu, Gd, Tb, Dy, Ho), and Figure 3.15 for
Yb(III) (as a representative of the heavy REEs, Er, Tm, Yb, Lu). In these figures
aqueous standard graphs are provided. Calibration graphs for the remaining REEs are
given in Appendix B. The matrix-matched calibration standards are given in part 3.2.4.
36
(a) (b)
(c) (d)
(e) (f) Figure 3.11. TGA curves of (a) silica-amino (b) silica gel (c) silica-mercapto (d) silica 2-
aminophenol (e) silica 2-aminobenzothiazole (f) silica 2-aminothiophenol and (g) silica-aminoacid.
37
(g) Figure 3.11. TGA curves of (a) silica-amino (b) silica gel (c) silica-mercapto (d) silica 2-
aminophenol (e) silica 2-aminobenzothiazole (f) silica 2-aminothiophenol and (g) silica-aminoacid.(cont.)
(a) (b)
Figure 3.12. TGA curves of (a) sol-gel (b) amino sol-gel and (c) sol-gel mercapto.
38
(c)
Figure 3.12. TGA curves of (a) sol-gel (b) amino sol-gel and (c) sol-gel mercapto.(cont.)
y = 65547x + 103437R2 = 0.9998
0
10
20
30
40
50
60
70
0 200 400 600 800 1000 1200
La (III) Concentration (µg/L)
Cou
nts
per s
econ
d (x
106 )
Figure 3.13. Calibration graph for La(III).
39
y = 42888x + 59033R2 = 0.9999
0
10
20
30
40
50
0 200 400 600 800 1000 1200
Eu(III) Concentration (µg/L)
Cou
nts
per s
econ
d (x
106 )
Figure 3.14. Calibration graph for Eu(III).
y = 20210x + 33891R2 = 0.9999
0
5
10
15
20
25
0 200 400 600 800 1000 1200Yb(III) Concentration (µg/L)
Cou
nts
per s
econ
d (x
106 )
Figure 3.15. Calibration graph for Yb(III).
3.2.2. Sorption Studies with Various Sorbents
As an initial study, a 1.0 mg/L REEs multi-element standard solution was
prepared at a pH of 7 and 20.0 mL aliquots of this solution were mixed with 0.05 g of
sorbents as explained in 2.5.2.1. Since all of the sorbents investigated offered significant
results a detailed study was carried out to understand the effect of pH .
40
3.2.2.1. Effect of pH
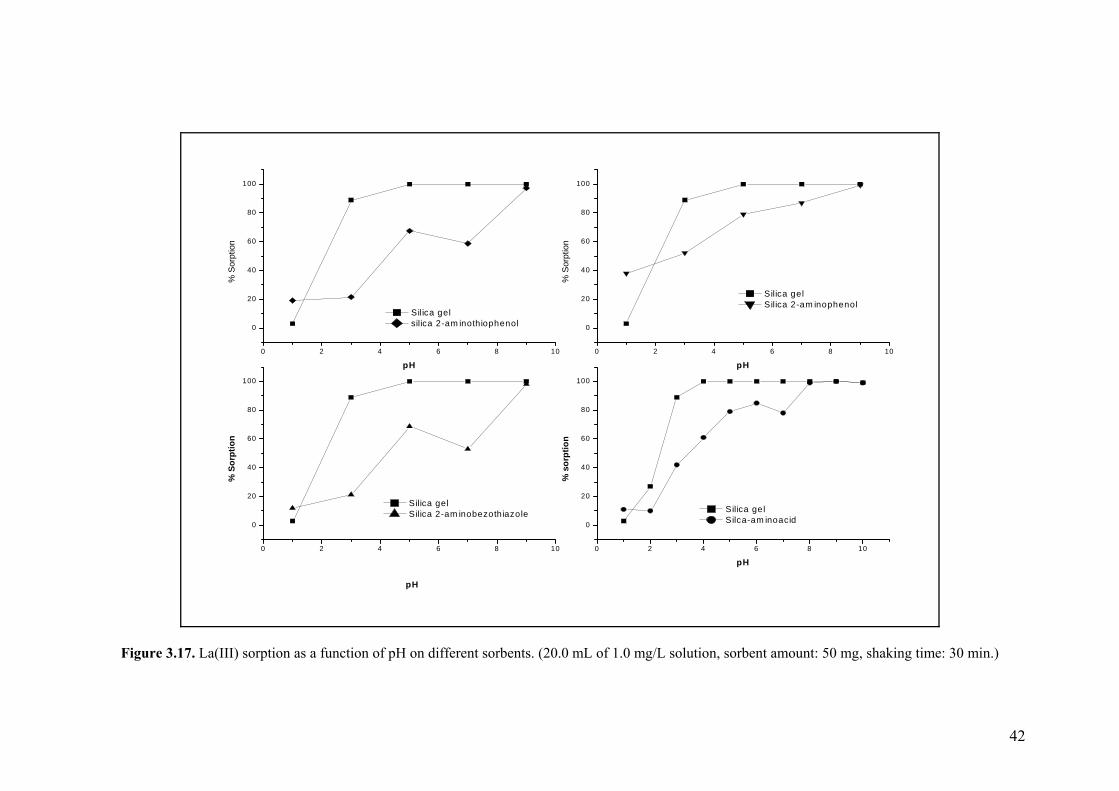
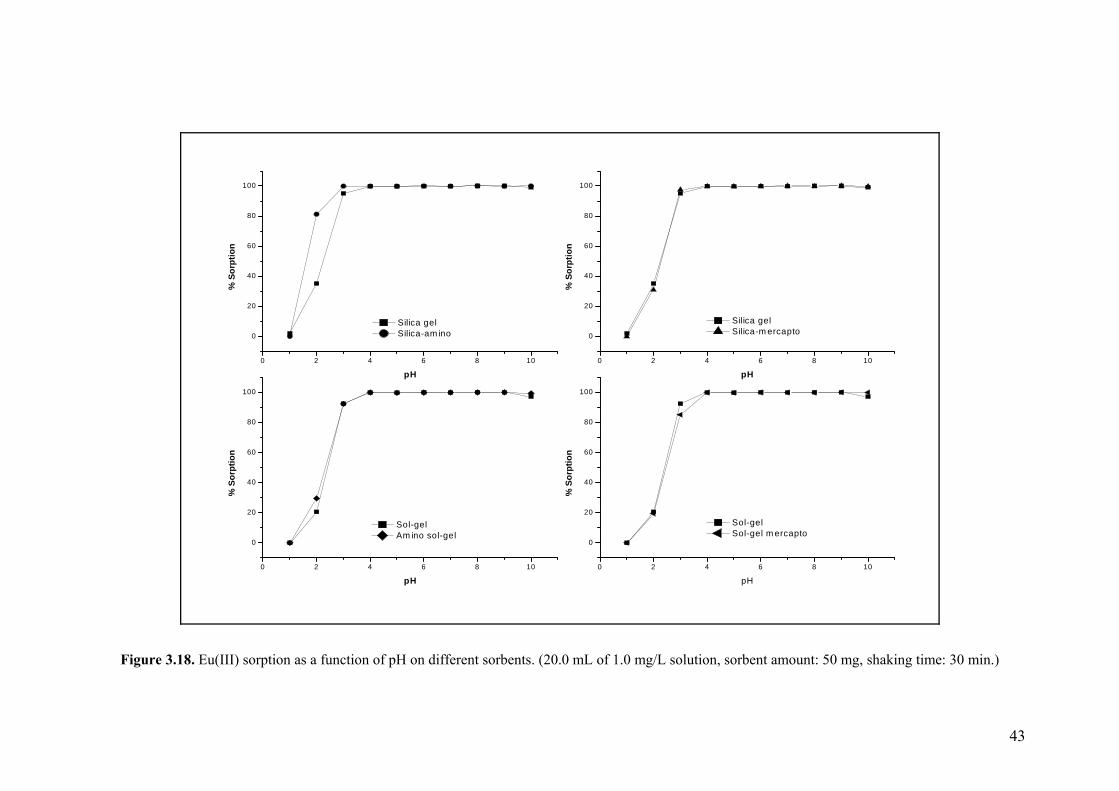
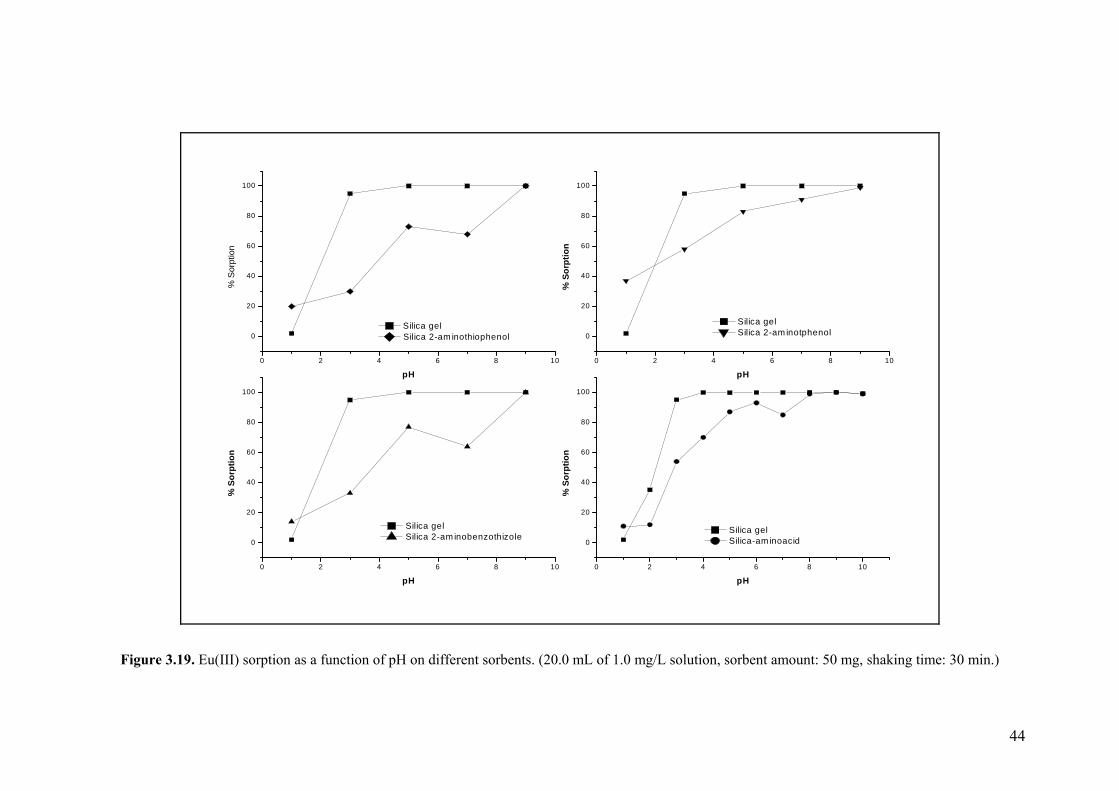
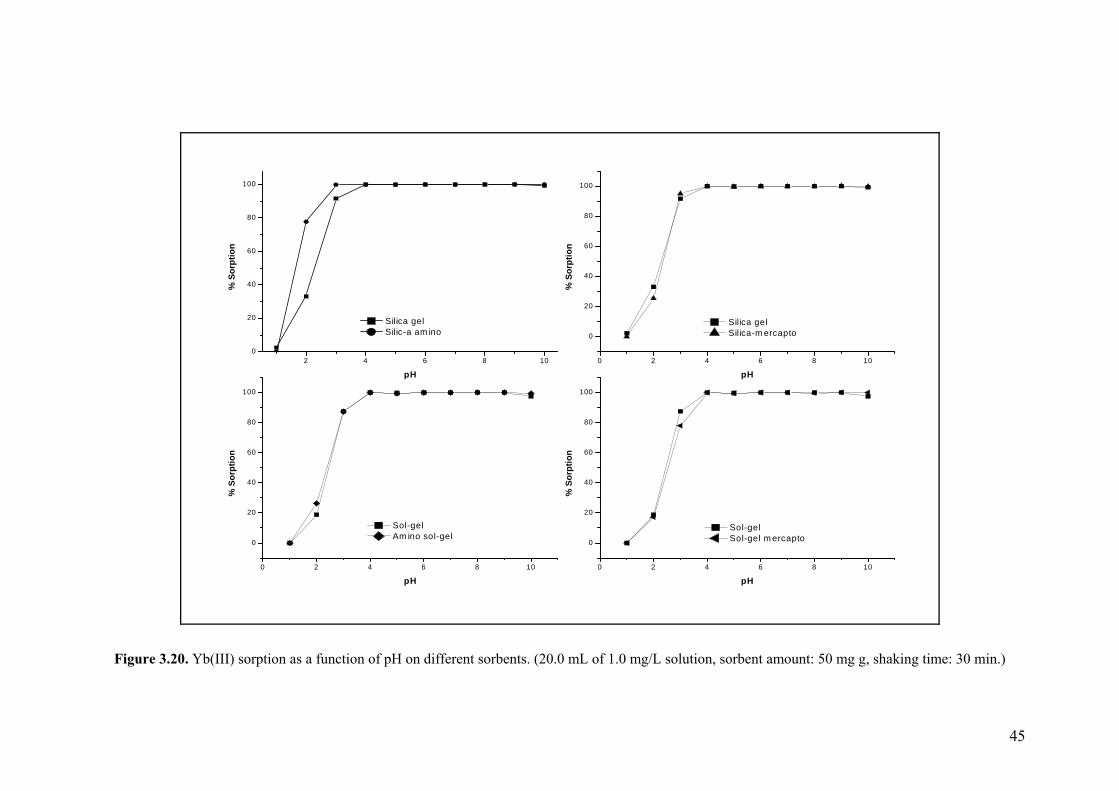
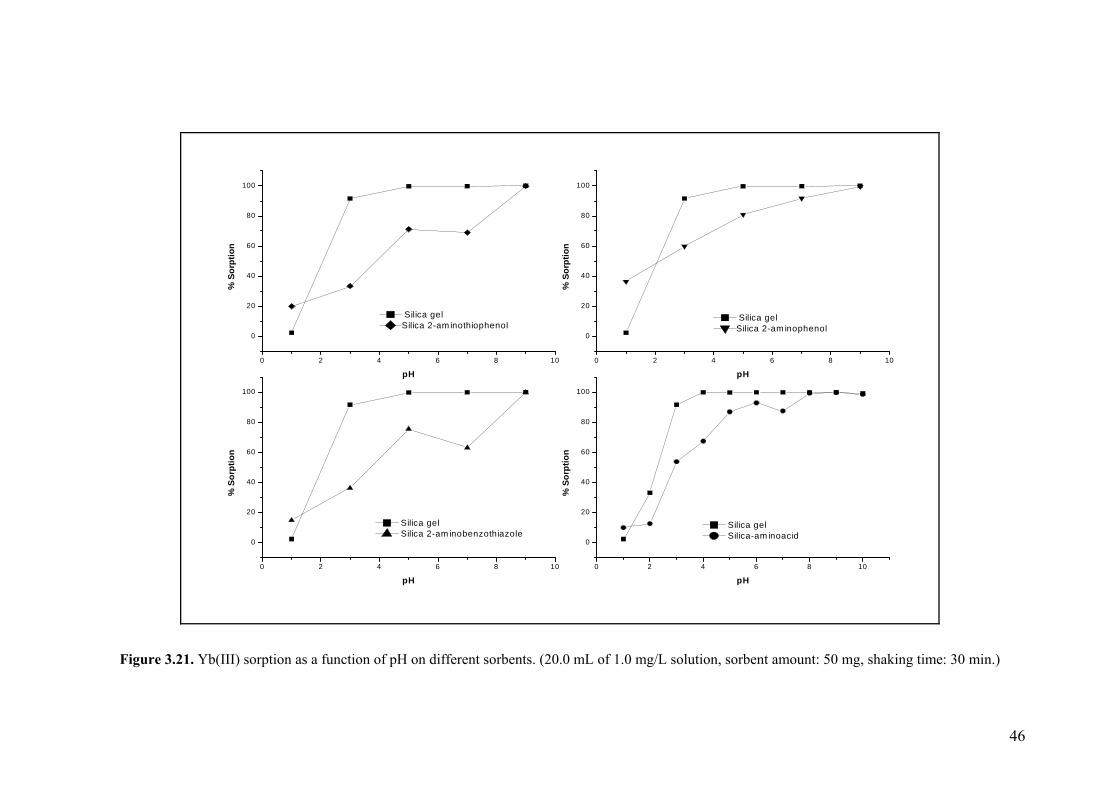
Effect of pH on sorption was studied as described in part 2.5.2.2. The percent
sorption versus pH graphs are provided in Figures 3.16 and 3.17 for La(III), in Figures
3.18 and 3.19 for Eu(III) and in Figures 3.20 and 3.21 for Yb(III).
As can be seen from the figures, all of the sorbents offer significant results for
sorption of REEs at wide pH range. Although silica modified with 2-aminophenol, 2-
aminothiophenol, 2-aminobenzothiazole and L-glutamic acid dimethyl ester show
significant sorption capacity, sorption of REEs on them is lower than the unmodified
silica gel. Thus they were not used for subsequent experiments. MPTMS and APTMS-
modified silica gel exhibit high sorption capacity at pHs higher than 3 for all REEs. For
subsequent experiments pH of 5 was used because at high pH REEs become
hydrolysed.
The low sorption capacity of the sorbents at pH of 1 and 2 indicates that HNO3
can be used as desorbing reagent. This was proven by later experiments and 1.0 M
HNO3 was used as a desorbing solution.
3.2.2.2. Effect of Initial Metal Concentration
Investigation of sorption capacity of silica gel and silica-amino at high
concentration of REEs was performed as mentioned in part 2.5.2.3. As an initial study
three different concentrations were studied using silica gel, silica-amino and silica-
aminoacid. Percent sorption of REEs versus initial metal concentration plots are
provided in Figures 3.22, 3.23 and 3.24 for La(III) Eu(III) and Yb(III), respectively. As
can be inferred from these figures, silica-aminoacid shows the lowest sorption capacity;
silica-amino offers higher sorption capability than silica gel. So detailed study was
decided to be performed for silica-amino and silica gel in order to see the effect of
initial metal concentration on sorption of REEs. The results obtained were given in
Figures 3.25, 3.26 and 3.27 for La(III), Eu(III) and Yb(III), respectively. As expected %
sorption decreases with increase in initial metal concentration.
41
0 2 4 6 8 10
0
20
40
60
80
100
% S
orpt
ion
pH
S ilica ge l S ilica -am ino
0 2 4 6 8 10
0
20
40
60
80
100
S ilica ge l S ilica -m ercapto
% S
orpt
ion
pH
0 2 4 6 8 10
0
20
40
60
80
100
So l-ge l Am ino so l-ge l
% S
orpt
ion
pH0 2 4 6 8 10
0
20
40
60
80
100
So l-ge l So l-ge l m ercap to
% S
orpt
ion
pH
Figure 3.16. La(III) sorption as a function of pH on different sorbents (20.0 mL of 1.0 mg/L solution, sorbent amount: 50 mg, shaking time: 30 min.)
42
0 2 4 6 8 10
0
20
40
60
80
100
% S
orpt
ion
pH
Silica gel silica 2-am inothiophenol
0 2 4 6 8 10
0
20
40
60
80
100
pH
Silica gel Silica 2-am inobezothiazole
% S
orpt
ion
0 2 4 6 8 10
0
20
40
60
80
100
Silica gel Silca-am inoacid
% s
orpt
ion
pH
0 2 4 6 8 10
0
20
40
60
80
100
Silica gel Silica 2-am inophenol
% S
orpt
ion
pH
Figure 3.17. La(III) sorption as a function of pH on different sorbents. (20.0 mL of 1.0 mg/L solution, sorbent amount: 50 mg, shaking time: 30 min.)
43
0 2 4 6 8 10
0
20
40
60
80
100
% S
orpt
ion
pH
Silica gel Silica-am ino
0 2 4 6 8 10
0
20
40
60
80
100
Silica gel Silica-m ercapto
% S
orpt
ion
pH
0 2 4 6 8 10
0
20
40
60
80
100
Sol-gel Am ino sol-gel
% S
orpt
ion
pH0 2 4 6 8 10
0
20
40
60
80
100
Sol-gel Sol-gel m ercapto
% S
orpt
ion
pH
Figure 3.18. Eu(III) sorption as a function of pH on different sorbents. (20.0 mL of 1.0 mg/L solution, sorbent amount: 50 mg, shaking time: 30 min.)
44
0 2 4 6 8 10
0
20
40
60
80
100
Silica gel Silica 2-am inothiophenol
% S
orpt
ion
pH0 2 4 6 8 10
0
20
40
60
80
100
Silica gel Silica 2-am inotphenol
% S
orpt
ion
pH
0 2 4 6 8 10
0
20
40
60
80
100
Silica gel Silica 2-am inobenzothizole
% S
orpt
ion
pH0 2 4 6 8 10
0
20
40
60
80
100
Silica gel Silica-am inoacid
% S
orpt
ion
pH
Figure 3.19. Eu(III) sorption as a function of pH on different sorbents. (20.0 mL of 1.0 mg/L solution, sorbent amount: 50 mg, shaking time: 30 min.)
45
2 4 6 8 100
20
40
60
80
100
Silica gel Silic-a am ino
% S
orpt
ion
pH0 2 4 6 8 10
0
20
40
60
80
100
Silica gel Silica-m ercapto
% S
orpt
ion
pH
0 2 4 6 8 10
0
20
40
60
80
100
Sol-gel Am ino sol-gel
% S
orpt
ion
pH0 2 4 6 8 10
0
20
40
60
80
100
Sol-gel Sol-gel m ercapto
% S
orpt
ion
pH
Figure 3.20. Yb(III) sorption as a function of pH on different sorbents. (20.0 mL of 1.0 mg/L solution, sorbent amount: 50 mg g, shaking time: 30 min.)
46
0 2 4 6 8 10
0
20
40
60
80
100
Silica gelSilica 2-am inothiophenol
% S
orpt
ion
pH0 2 4 6 8 10
0
20
40
60
80
100
Silica gelSilica 2-am inophenol
% S
orpt
ion
pH
0 2 4 6 8 10
0
20
40
60
80
100
Silica gel Silica 2-am inobenzothiazole
% S
orpt
ion
pH0 2 4 6 8 10
0
20
40
60
80
100
Silica gel Silica-am inoacid
% S
orpt
ion
pH
Figure 3.21. Yb(III) sorption as a function of pH on different sorbents. (20.0 mL of 1.0 mg/L solution, sorbent amount: 50 mg, shaking time: 30 min.)
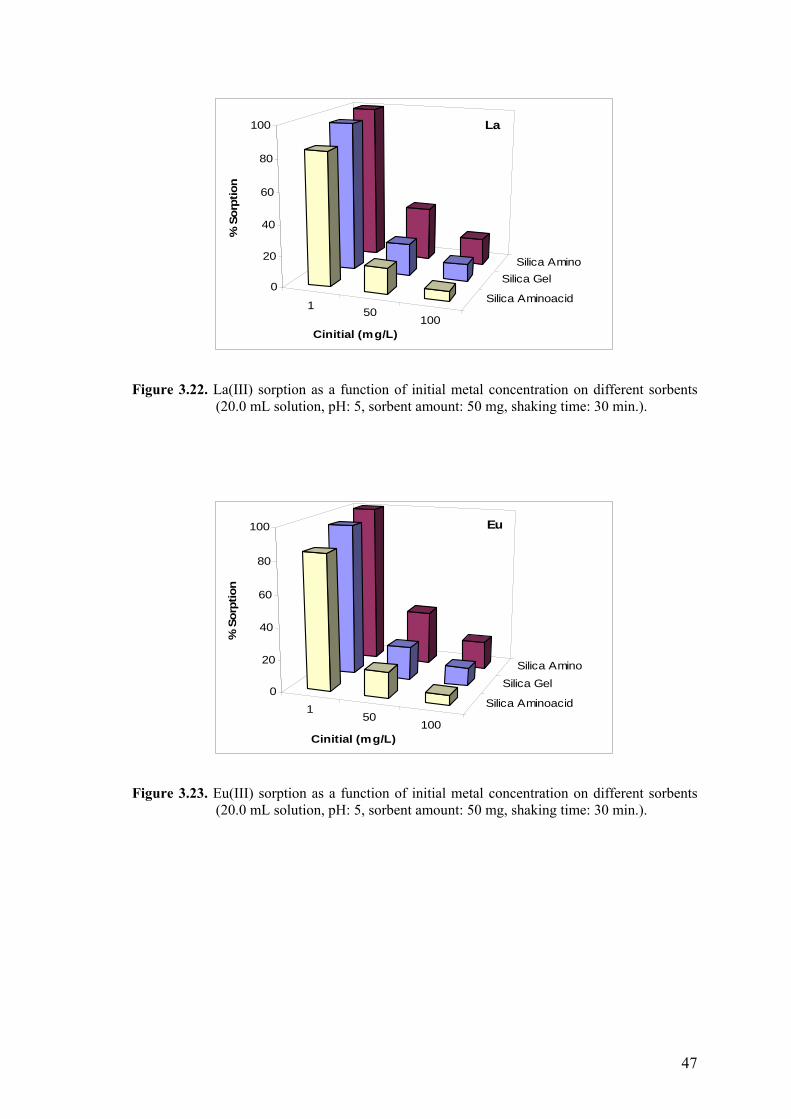
47
1 50100
Silica Aminoacid
Silica GelSilica Amino
0
20
40
60
80
100
% S
orpt
ion
Cinitial (mg/L)
La
Figure 3.22. La(III) sorption as a function of initial metal concentration on different sorbents
(20.0 mL solution, pH: 5, sorbent amount: 50 mg, shaking time: 30 min.).
150
100
Silica Aminoacid
Silica GelSilica Amino
0
20
40
60
80
100
% S
orpt
ion
Cinitial (mg/L)
Eu
Figure 3.23. Eu(III) sorption as a function of initial metal concentration on different sorbents
(20.0 mL solution, pH: 5, sorbent amount: 50 mg, shaking time: 30 min.).
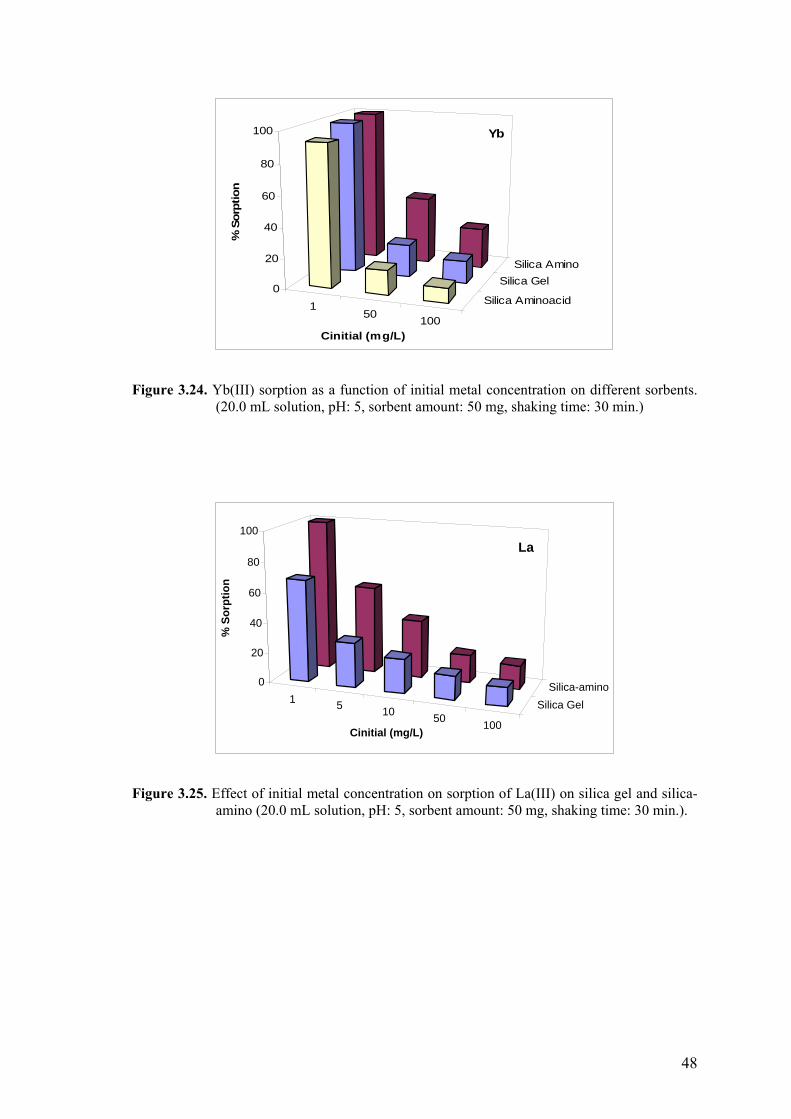
48
150 100
Silica Aminoacid
Silica GelSilica Amino
0
20
40
60
80
100
% S
orpt
ion
Cinitial (mg/L)
Yb
Figure 3.24. Yb(III) sorption as a function of initial metal concentration on different sorbents. (20.0 mL solution, pH: 5, sorbent amount: 50 mg, shaking time: 30 min.)
1 5 10 50 100
Silica GelSilica-amino0
20
40
60
80
100
% S
orpt
ion
Cinitial (mg/L)
La
Figure 3.25. Effect of initial metal concentration on sorption of La(III) on silica gel and silica-amino (20.0 mL solution, pH: 5, sorbent amount: 50 mg, shaking time: 30 min.).
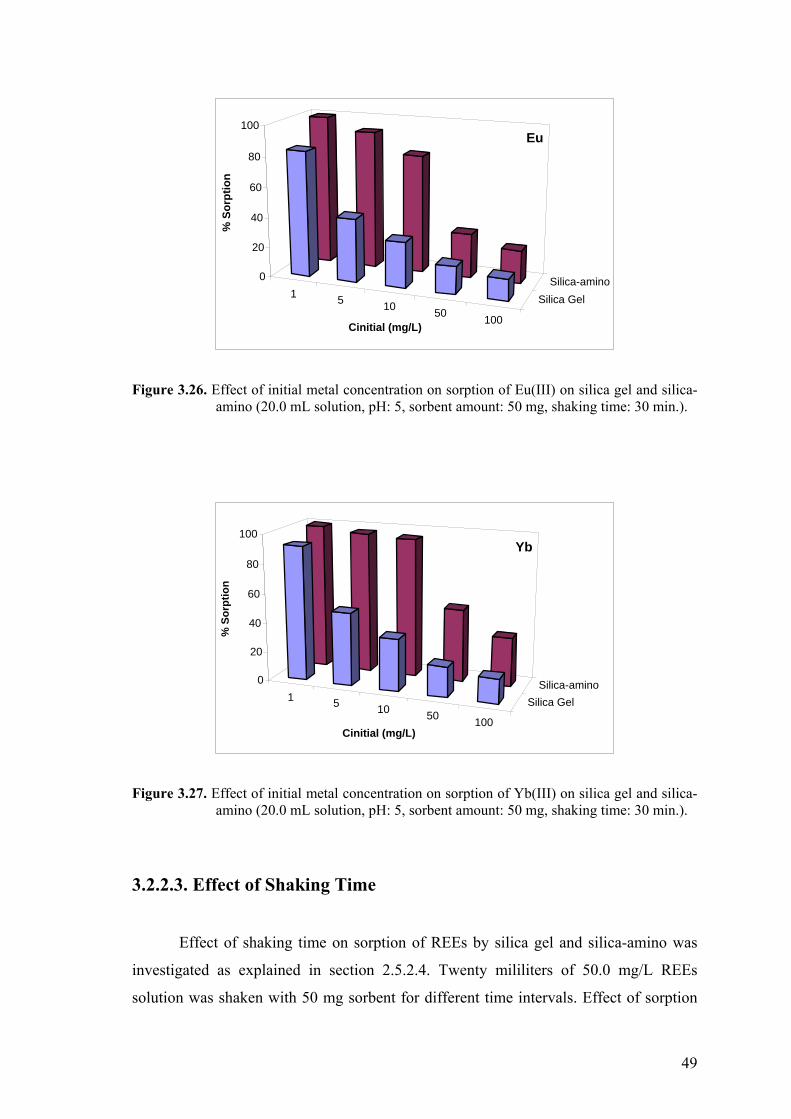
49
1 5 10 50 100
Silica GelSilica-amino0
20
40
60
80
100
% S
orpt
ion
Cinitial (mg/L)
Eu
Figure 3.26. Effect of initial metal concentration on sorption of Eu(III) on silica gel and silica-amino (20.0 mL solution, pH: 5, sorbent amount: 50 mg, shaking time: 30 min.).
1 5 10 50 100
Silica GelSilica-amino0
20
40
60
80
100
% S
orpt
ion
Cinitial (mg/L)
Yb
Figure 3.27. Effect of initial metal concentration on sorption of Yb(III) on silica gel and silica-amino (20.0 mL solution, pH: 5, sorbent amount: 50 mg, shaking time: 30 min.).
3.2.2.3. Effect of Shaking Time
Effect of shaking time on sorption of REEs by silica gel and silica-amino was
investigated as explained in section 2.5.2.4. Twenty mililiters of 50.0 mg/L REEs
solution was shaken with 50 mg sorbent for different time intervals. Effect of sorption
50
time was studied at two different tempeatures. The results for La(III), Eu(III) and
Yb(III) are exhibited in Table 3.4 for 25 °C and in Table 3.5 for 50 °C.
The results indicated that there is no significant change in sorption with
increasing temperature. The percent sorption of REEs on silica gel and silica-amino
remained between 2-42% at all sorption times tried. Also there is no linear change in
sorption capacity of the adsorbent with increasing sorption time.
3.2.2.4. Effect of Sorbent Amount
As explained in part 2.5.2.5, the optimum amount of the sorbent for maximum
take up was determined by increasing the amount of silica gel and silica-amino added
into 20.0 mL of 50.0 mg/L REEs. Results are given in Table 3.6. As can be seen from
the table when sorbent amount is increased, percent sorption of REEs on silica gel does
not change significantly whereas sorption on silica-amino is increased with increasing
sorbent amount.
In addition, from light REEs to heavy REEs, sorption capability of silica-amino
is increased for a studied sorbent amount. It can be concluded that silica-amino exhibits
higher selectivity for heavy REEs.
3.2.3. Desorption from Silica Gel and Silica-amino
Possible candidate for desorption was HNO3 since silica gel and silica-amino
have very low sorption capacity at a pH of 1. For this purpose, silica gel or silica-amino
was shaken with 1% (0.143 M), 2% (0.286 M), 5% (0.717 M) and 10% (1.434 M) (v/v)
HNO3 solutions and the previously sorbed REEs were eluted and resultant solutions
were analysed by ICP-MS. Elution efficiencies (percent recoveries) calculated for
various concentrations of HNO3 are given in Table 3.7. These values were between 36-
83% with 10% HNO3. Another important point is that 1.0 mg/L of solution at pH 5 was
sorbed in equal amounts by two sorbents (silica gel and silica-amino), however, REEs
can be more easily recovered from silica-amino than silica gel, with HNO3. Therefore,
1.0 M HNO3 eluent and silica-amino sorbent were choosen for the desorption studies.
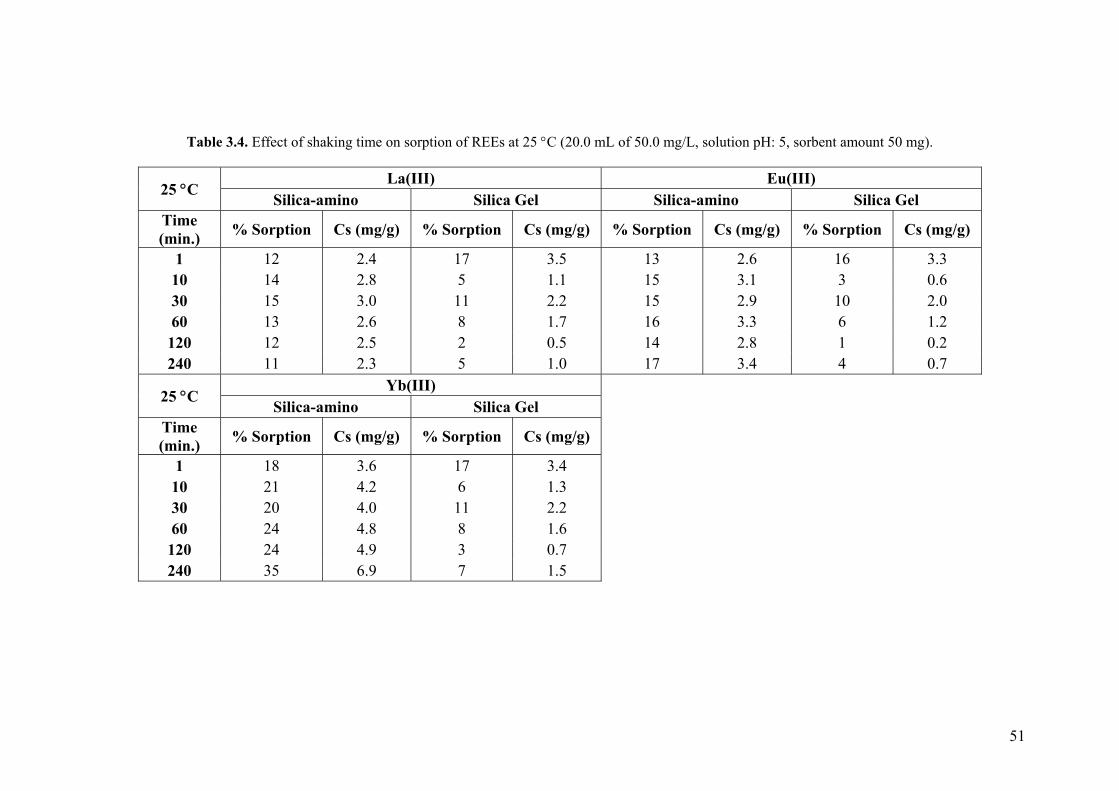
51
Table 3.4. Effect of shaking time on sorption of REEs at 25 °C (20.0 mL of 50.0 mg/L, solution pH: 5, sorbent amount 50 mg).
La(III) Eu(III) 25 °C Silica-amino Silica Gel Silica-amino Silica Gel Time (min.) % Sorption Cs (mg/g) % Sorption Cs (mg/g) % Sorption Cs (mg/g) % Sorption Cs (mg/g)
1 12 2.4 17 3.5 13 2.6 16 3.3 10 14 2.8 5 1.1 15 3.1 3 0.6 30 15 3.0 11 2.2 15 2.9 10 2.0 60 13 2.6 8 1.7 16 3.3 6 1.2 120 12 2.5 2 0.5 14 2.8 1 0.2 240 11 2.3 5 1.0 17 3.4 4 0.7
Yb(III) 25 °C Silica-amino Silica Gel
Time (min.) % Sorption Cs (mg/g) % Sorption Cs (mg/g)
1 18 3.6 17 3.4 10 21 4.2 6 1.3 30 20 4.0 11 2.2 60 24 4.8 8 1.6 120 24 4.9 3 0.7 240 35 6.9 7 1.5
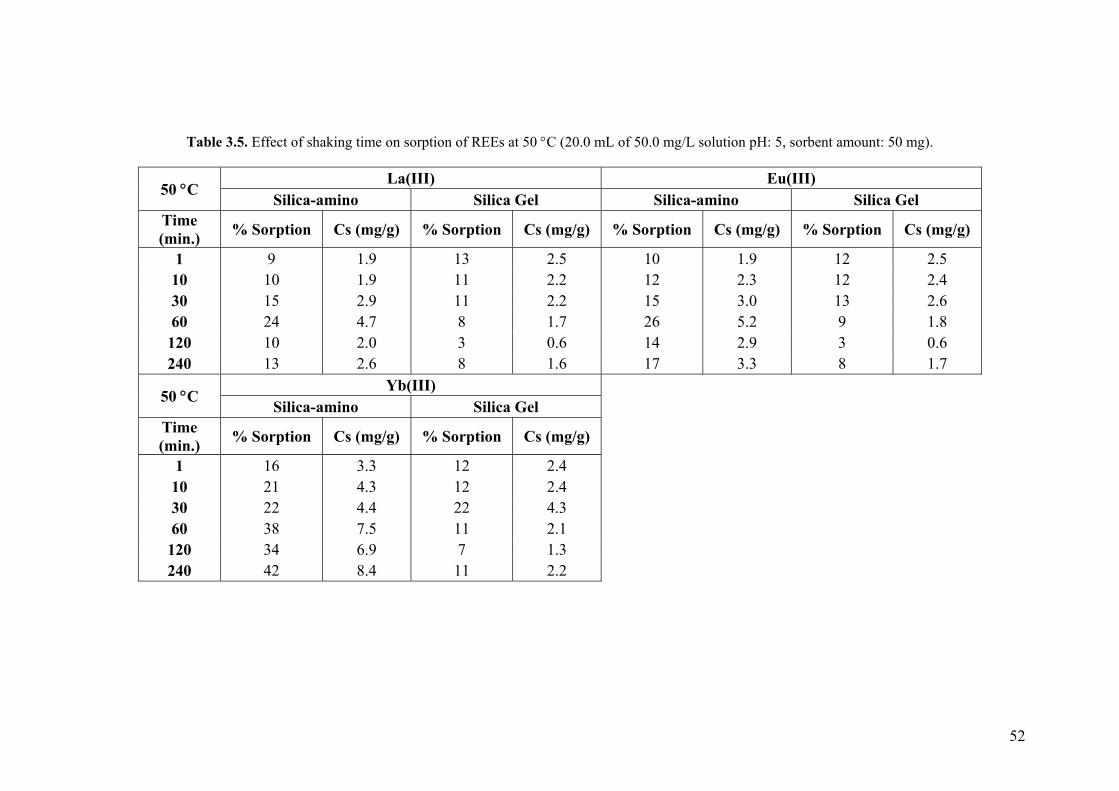
52
Table 3.5. Effect of shaking time on sorption of REEs at 50 °C (20.0 mL of 50.0 mg/L solution pH: 5, sorbent amount: 50 mg).
La(III) Eu(III) 50 °C Silica-amino Silica Gel Silica-amino Silica Gel Time (min.) % Sorption Cs (mg/g) % Sorption Cs (mg/g) % Sorption Cs (mg/g) % Sorption Cs (mg/g)
1 9 1.9 13 2.5 10 1.9 12 2.5 10 10 1.9 11 2.2 12 2.3 12 2.4 30 15 2.9 11 2.2 15 3.0 13 2.6 60 24 4.7 8 1.7 26 5.2 9 1.8 120 10 2.0 3 0.6 14 2.9 3 0.6 240 13 2.6 8 1.6 17 3.3 8 1.7
Yb(III) 50 °C
Silica-amino Silica Gel Time (min.) % Sorption Cs (mg/g) % Sorption Cs (mg/g)
1 16 3.3 12 2.4 10 21 4.3 12 2.4 30 22 4.4 22 4.3 60 38 7.5 11 2.1 120 34 6.9 7 1.3 240 42 8.4 11 2.2
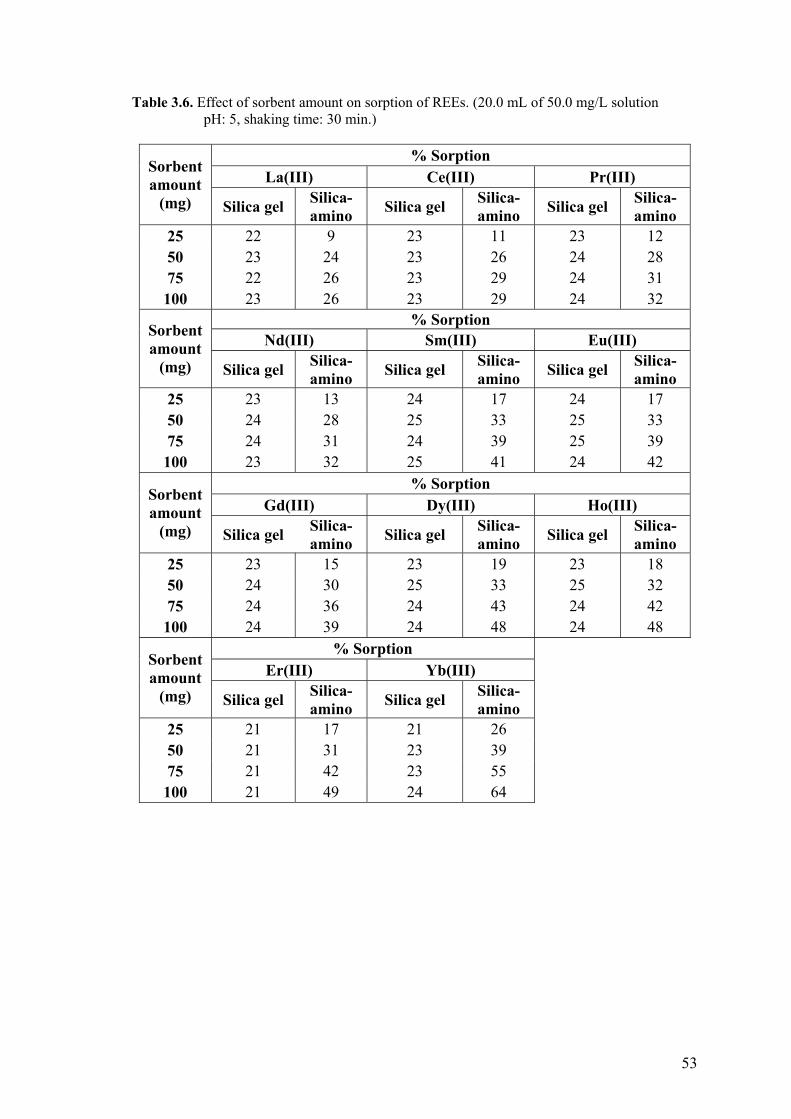
53
Table 3.6. Effect of sorbent amount on sorption of REEs. (20.0 mL of 50.0 mg/L solution pH: 5, shaking time: 30 min.)
% Sorption
La(III) Ce(III) Pr(III) Sorbent amount
(mg) Silica gel Silica-amino Silica gel Silica-
amino Silica gel Silica-amino
25 22 9 23 11 23 12 50 23 24 23 26 24 28 75 22 26 23 29 24 31 100 23 26 23 29 24 32
% Sorption Nd(III) Sm(III) Eu(III) Sorbent
amount (mg) Silica gel Silica-
amino Silica gel Silica-amino Silica gel Silica-
amino 25 23 13 24 17 24 17 50 24 28 25 33 25 33 75 24 31 24 39 25 39 100 23 32 25 41 24 42
% Sorption Gd(III) Dy(III) Ho(III)
Sorbent amount
(mg) Silica gel Silica-amino Silica gel Silica-
amino Silica gel Silica-amino
25 23 15 23 19 23 18 50 24 30 25 33 25 32 75 24 36 24 43 24 42 100 24 39 24 48 24 48
% Sorption Er(III) Yb(III)
Sorbent amount
(mg) Silica gel Silica-amino Silica gel Silica-
amino
25 21 17 21 26 50 21 31 23 39 75 21 42 23 55 100 21 49 24 64
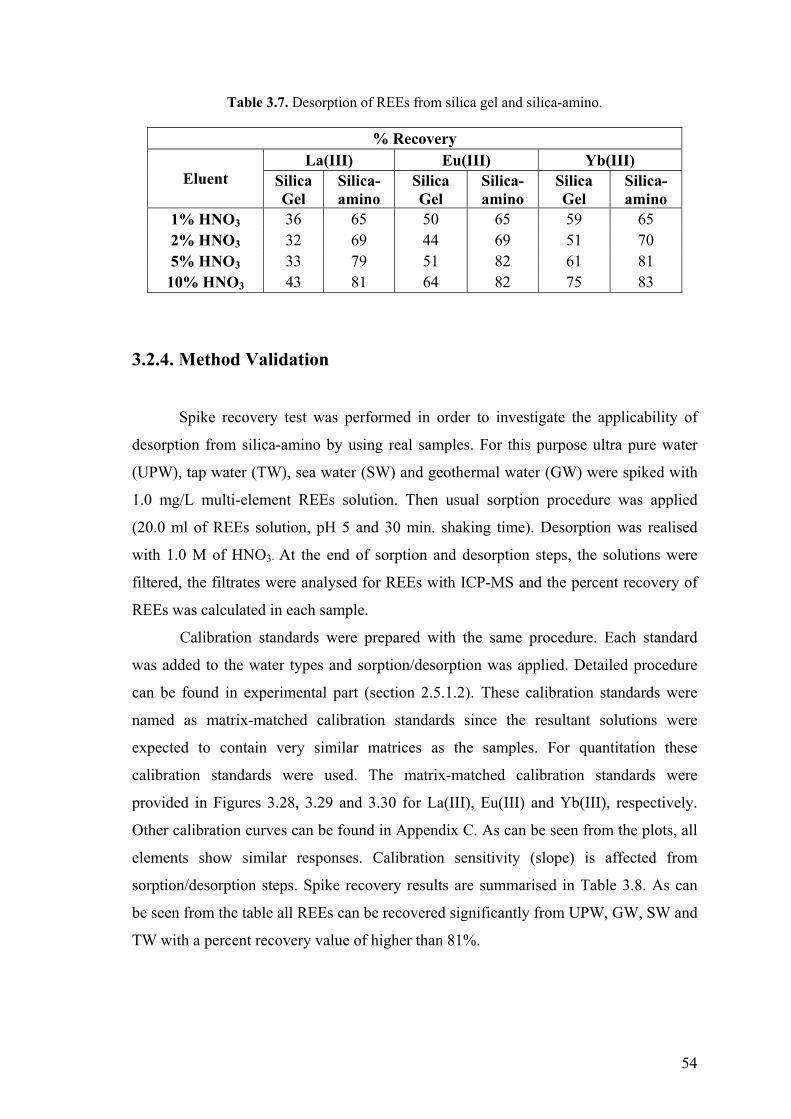
54
Table 3.7. Desorption of REEs from silica gel and silica-amino.
% Recovery La(III) Eu(III) Yb(III)
Eluent Silica Gel
Silica-amino
Silica Gel
Silica-amino
Silica Gel
Silica-amino
1% HNO3 36 65 50 65 59 65 2% HNO3 32 69 44 69 51 70 5% HNO3 33 79 51 82 61 81 10% HNO3 43 81 64 82 75 83
3.2.4. Method Validation
Spike recovery test was performed in order to investigate the applicability of
desorption from silica-amino by using real samples. For this purpose ultra pure water
(UPW), tap water (TW), sea water (SW) and geothermal water (GW) were spiked with
1.0 mg/L multi-element REEs solution. Then usual sorption procedure was applied
(20.0 ml of REEs solution, pH 5 and 30 min. shaking time). Desorption was realised
with 1.0 M of HNO3. At the end of sorption and desorption steps, the solutions were
filtered, the filtrates were analysed for REEs with ICP-MS and the percent recovery of
REEs was calculated in each sample.
Calibration standards were prepared with the same procedure. Each standard
was added to the water types and sorption/desorption was applied. Detailed procedure
can be found in experimental part (section 2.5.1.2). These calibration standards were
named as matrix-matched calibration standards since the resultant solutions were
expected to contain very similar matrices as the samples. For quantitation these
calibration standards were used. The matrix-matched calibration standards were
provided in Figures 3.28, 3.29 and 3.30 for La(III), Eu(III) and Yb(III), respectively.
Other calibration curves can be found in Appendix C. As can be seen from the plots, all
elements show similar responses. Calibration sensitivity (slope) is affected from
sorption/desorption steps. Spike recovery results are summarised in Table 3.8. As can
be seen from the table all REEs can be recovered significantly from UPW, GW, SW and
TW with a percent recovery value of higher than 81%.
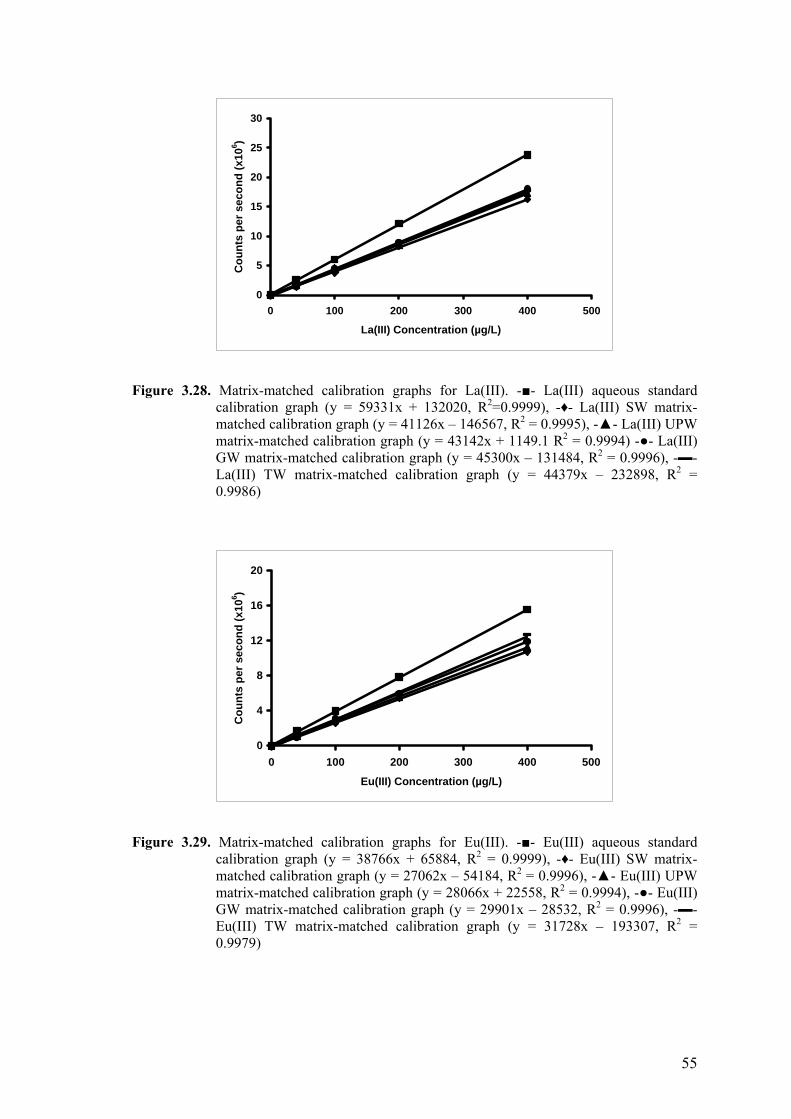
55
0
5
10
15
20
25
30
0 100 200 300 400 500
La(III) Concentration (µg/L)
Cou
nts
per s
econ
d (x
106 )
Figure 3.28. Matrix-matched calibration graphs for La(III). -- La(III) aqueous standard calibration graph (y = 59331x + 132020, R2=0.9999), -♦- La(III) SW matrix-matched calibration graph (y = 41126x – 146567, R2 = 0.9995), -- La(III) UPW matrix-matched calibration graph (y = 43142x + 1149.1 R2 = 0.9994) -- La(III) GW matrix-matched calibration graph (y = 45300x – 131484, R2 = 0.9996), -- La(III) TW matrix-matched calibration graph (y = 44379x – 232898, R2 = 0.9986)
0
4
8
12
16
20
0 100 200 300 400 500
Eu(III) Concentration (µg/L)
Cou
nts
per s
econ
d (x
106 )
Figure 3.29. Matrix-matched calibration graphs for Eu(III). -- Eu(III) aqueous standard calibration graph (y = 38766x + 65884, R2 = 0.9999), -♦- Eu(III) SW matrix-matched calibration graph (y = 27062x – 54184, R2 = 0.9996), -- Eu(III) UPW matrix-matched calibration graph (y = 28066x + 22558, R2 = 0.9994), -- Eu(III) GW matrix-matched calibration graph (y = 29901x – 28532, R2 = 0.9996), -- Eu(III) TW matrix-matched calibration graph (y = 31728x – 193307, R2 = 0.9979)
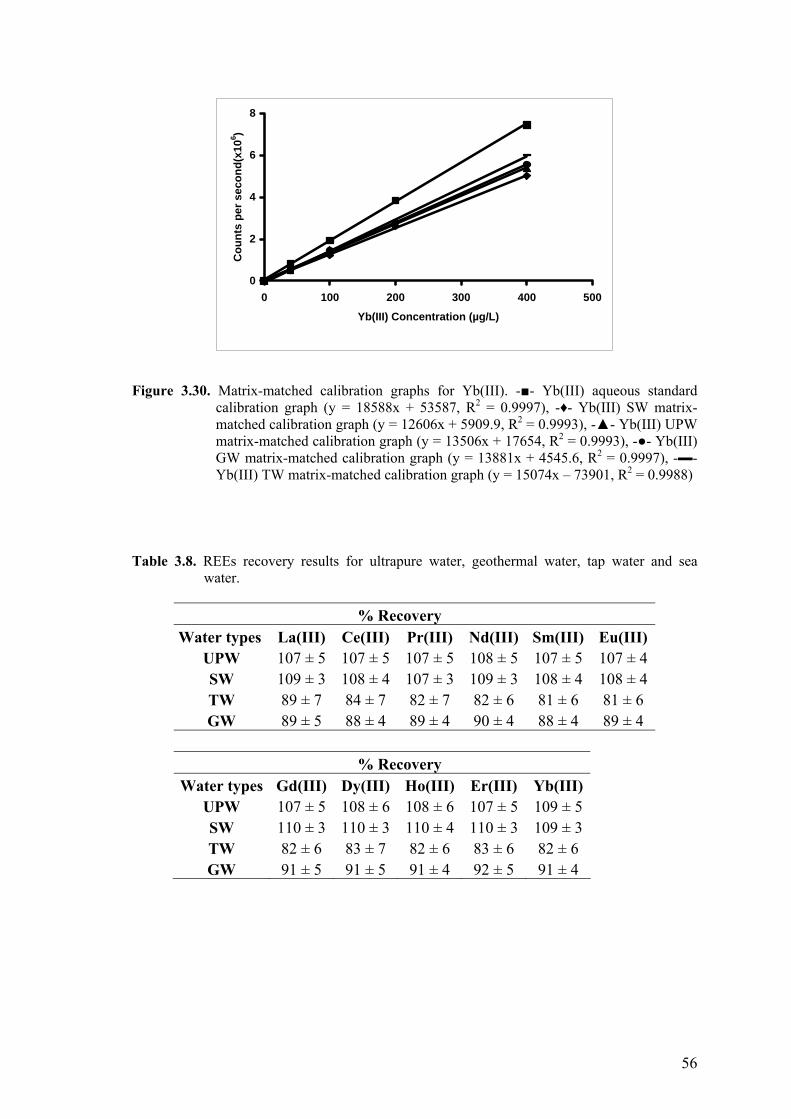
56
0
2
4
6
8
0 100 200 300 400 500
Yb(III) Concentration (µg/L)
Cou
nts
per s
econ
d(x1
06 )
Figure 3.30. Matrix-matched calibration graphs for Yb(III). -- Yb(III) aqueous standard calibration graph (y = 18588x + 53587, R2 = 0.9997), -♦- Yb(III) SW matrix-matched calibration graph (y = 12606x + 5909.9, R2 = 0.9993), -- Yb(III) UPW matrix-matched calibration graph (y = 13506x + 17654, R2 = 0.9993), -- Yb(III) GW matrix-matched calibration graph (y = 13881x + 4545.6, R2 = 0.9997), -- Yb(III) TW matrix-matched calibration graph (y = 15074x – 73901, R2 = 0.9988)
Table 3.8. REEs recovery results for ultrapure water, geothermal water, tap water and sea
water.
% Recovery Water types La(III) Ce(III) Pr(III) Nd(III) Sm(III) Eu(III)
UPW 107 ± 5 107 ± 5 107 ± 5 108 ± 5 107 ± 5 107 ± 4 SW 109 ± 3 108 ± 4 107 ± 3 109 ± 3 108 ± 4 108 ± 4 TW 89 ± 7 84 ± 7 82 ± 7 82 ± 6 81 ± 6 81 ± 6 GW 89 ± 5 88 ± 4 89 ± 4 90 ± 4 88 ± 4 89 ± 4
% Recovery
Water types Gd(III) Dy(III) Ho(III) Er(III) Yb(III) UPW 107 ± 5 108 ± 6 108 ± 6 107 ± 5 109 ± 5 SW 110 ± 3 110 ± 3 110 ± 4 110 ± 3 109 ± 3 TW 82 ± 6 83 ± 7 82 ± 6 83 ± 6 82 ± 6 GW 91 ± 5 91 ± 5 91 ± 4 92 ± 5 91 ± 4
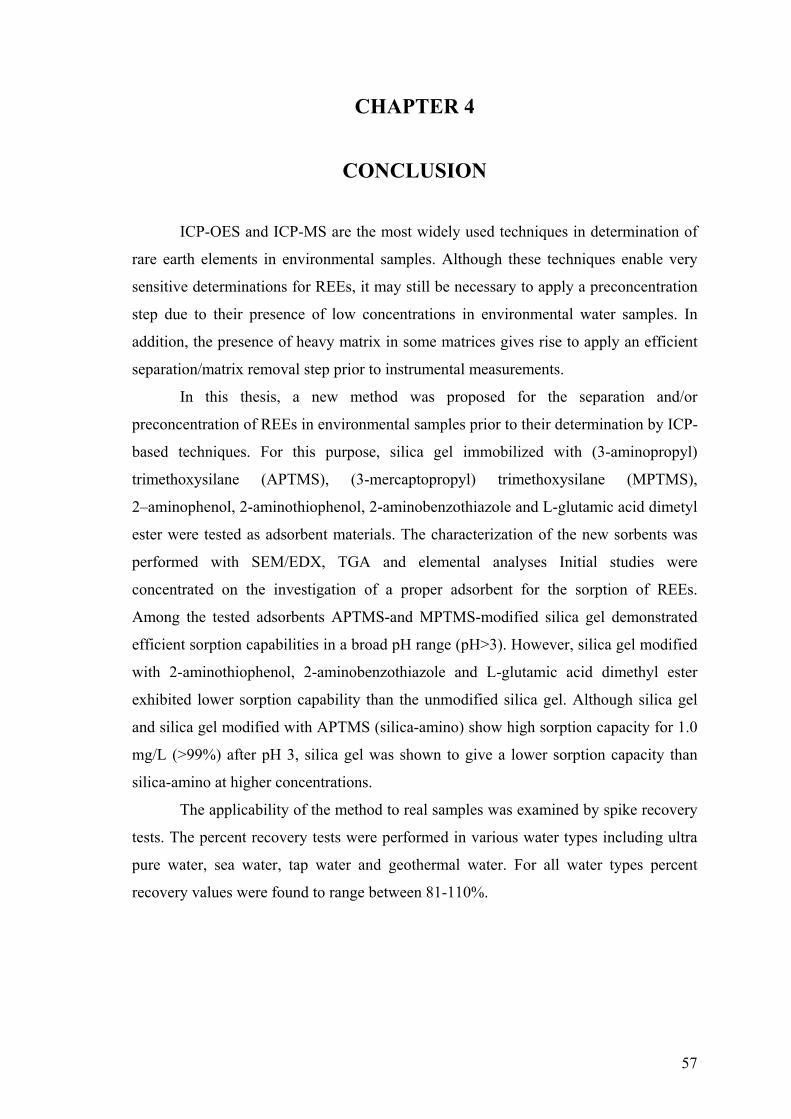
57
CHAPTER 4
CONCLUSION
ICP-OES and ICP-MS are the most widely used techniques in determination of
rare earth elements in environmental samples. Although these techniques enable very
sensitive determinations for REEs, it may still be necessary to apply a preconcentration
step due to their presence of low concentrations in environmental water samples. In
addition, the presence of heavy matrix in some matrices gives rise to apply an efficient
separation/matrix removal step prior to instrumental measurements.
In this thesis, a new method was proposed for the separation and/or
preconcentration of REEs in environmental samples prior to their determination by ICP-
based techniques. For this purpose, silica gel immobilized with (3-aminopropyl)
trimethoxysilane (APTMS), (3-mercaptopropyl) trimethoxysilane (MPTMS),
2–aminophenol, 2-aminothiophenol, 2-aminobenzothiazole and L-glutamic acid dimetyl
ester were tested as adsorbent materials. The characterization of the new sorbents was
performed with SEM/EDX, TGA and elemental analyses Initial studies were
concentrated on the investigation of a proper adsorbent for the sorption of REEs.
Among the tested adsorbents APTMS-and MPTMS-modified silica gel demonstrated
efficient sorption capabilities in a broad pH range (pH>3). However, silica gel modified
with 2-aminothiophenol, 2-aminobenzothiazole and L-glutamic acid dimethyl ester
exhibited lower sorption capability than the unmodified silica gel. Although silica gel
and silica gel modified with APTMS (silica-amino) show high sorption capacity for 1.0
mg/L (>99%) after pH 3, silica gel was shown to give a lower sorption capacity than
silica-amino at higher concentrations.
The applicability of the method to real samples was examined by spike recovery
tests. The percent recovery tests were performed in various water types including ultra
pure water, sea water, tap water and geothermal water. For all water types percent
recovery values were found to range between 81-110%.
58
REFERENCES Bahramifar, N., Yamini, Y. 2005. “On-line Preconcentration of some Rare Earth
Elements in Water Samples Using C18-cartridge Modified with l-(2-pyridylazo) 2-naphtol (PAN) Prior to Simultaneous Determination by Inductively Coupled Plasma Optical Emission Spectrometry (ICP–OES)”, Analytica Chimica Acta. Vol. 540, pp. 325–332.
Cao, X., Yin, M., Wang, X. 2001. “Elimination of the Spectral Interference from Polyatomic Ions with Rare Earth Elements in Inductively Coupled Plasma Mass Spectrometry by Combining Algebraic Correction with Chromatographic Separation”, Spectrochimica Acta Part B. Vol. 56, pp. 431-441.
Cotton, F.A., Wilkinson, G. 1988. “Advanced Inorganic Chemistry”, (John
Wiley&Sons, New York), p. 955.
Cotton, F.A., Wilkinson G., Gaus P.L. 1994. “Basic Inorganic Chemistry”, (John Wiley&Sons, New York), p. 615.
Dmjingova, R., Ivanova, J. 2002. “Determination of Rare Earth Elements in Soils and Sediments by Inductively Coupled Plasma Optical Emission Spectrometry After Cation-Exchange Separation”, Talanta. Vol. 5, pp. 821-829.
Ekinci, C., Köklü, Ü. 2000 “Determination of Vanadium, Manganese, Silver and Lead
by Graphite Furnace Atomic Absorption Spectrometry after Preconcentration on Silica-gel Modified with (3-Aminopropyl)triethoxysilane”, Spectrochimica Acta Part B. Vol. 55, pp. 1491-1495.
Eroğlu, T. 1996. “Use of Sol-gel Beads in Preconcentration”, M.Sc. Thesis, METU,
Ankara.
Eser, B.K., Volpe, A., Kenneally, J.M., Smith, D.K. 1994. “Preconcentration and Purification of Rare Earth Elements in Natural Waters Using Silica- Immobilized 8-Hydroxyquinoline and a Supported Organophosphorus Extractant”, Anaytical Chemistry. Vol. 66, pp. 1736-1742.
Evans, C.H. 1997 “Episodes from the History of the Rare Earth Elements”, University
of Pitssburg, PA, USA, 15.
Figueiredo, A.M.G., Avristcher, W., Masini, E.A., Diniz, S.C., Abrao, A. 2002. “Determination of Lanthanides (La, Ce, Nd, Sm) and Other Elements in Metallic Gallium by Instrumental Neutron Activation Analysis”, Journal of Alloys and Compounds. Vol. 344, pp. 36-39.
Garg, B.S., Sharma, R.K., Bist, J.S., Bhojak, N., Mittal, S. 1999. “Separation and Preconcentration of Metal Ions and Their Estimation in Vitamin, Steel and Milk Samples Using o-vanillin-immobilized Silica Gel”, Talanta. Vol. 48, pp. 49–55.
59
Göktürk, G., Delzendeh, M., Volkan, M. 2000. “Preconcentration of Germanium on Mercapto-modified Silica Gel”, Spectrochimica Acta Part B. Vol. 55, pp. 1063-1071.
Greaves, M.J., Elderfield, H., Klinkhammer, G.P. 1989. “Determination of the Rare
Earth Elements in Natural Waters by Isotope Dilution Mass Spectrometry”, Analytica Chimica Acta. Vol. 218, pp. 265-280.
Hassanien, M.M., Abou-El-Sherbini, K.S. 2006. ”Synthesis and Characterisation of Morin-functionalised Silica Gel for the Enrichment of Some Precious Metal Ions”, Talanta. Vol. 68, pp. 1550–1559.
Hirata, S., Kajiya, T., Aihara, M., Honda, K., Shikino, O. 2002. “Determination of Rare
Earth Elements in Seawater by on-line Column Preconcentration Inductively Coupled Plasma Mass Spectrometry”, Talanta. Vol. 58, pp. 1185-1194.
Inagaki, K., Haraguchi, H. 2000. “Determination of Rare Earth Elements in Human Blood Serum by Inductively Coupled Plasma Mass Spectrometry After Chelating Resin Preconcentration”, Analyst. Vol. 125, pp. 191-196.
Jal, P.K., Patel, S., Mishra, B.K. 2004. “Chemical Modification of Silica Surface by Immobilization of Functional Groups for Extractive Concentration of Metal Ions”, Talanta. Vol. 62, pp. 1005–1028.
Jain, V.K, Pandya, R.A., Pillai, S. G., Agrawal, Y. K., Kanaiya, P. H. 2007. “Solid-
Phase Extractive Preconcentration and Separation of Lanthanum(III) and Cerium(III) Using a Polymer-Supported Chelating Calix [4] Arene Resin”, Journal of Analytical Chemistry. Vol. 62, No. 2, pp. 104–112.
Kvitek, R.J., Evans, J.F., Carri, P.W. 1982. “Diamineysilane Modified Controlled Pore
Glass-The Covalent Attachment Reaction from Aqueous Solution and the Mechanism of Reaction of Bound Diamine with Copper(II)”, Analytica Chimica Acta. Vol. 144, pp. 93-106.
Lorena, C.L., Peralta-Zamora, P., Bueno, M.I.M.S. 1998. “Pre-concentration of Rare Earths using Silica Gel Loaded with 1-(2-pyridylazo)-2-naphthol (PAN) and Determination by Energy Dispersive X-ray Fluorescence”, Talanta. Vol. 46, pp. 1371–1378.
Liang, P., Liu, Y., Guo, L. 2005a. “Determination of Trace Rare Earth Elements by
Inductively Coupled Plasma Atomic Emission Spectrometry After Preconcentration with Multiwalled Carbon Nanotubes”, Spectrochimica Acta Part B. Vol. 60, pp. 125– 129.
Liang, P., Wenjun, Fa, W. 2005b. “Determination of La, Eu and Yb in Water Samples by Inductively Coupled Plasma Atomic Emission Spectrometry After Solid Phase Extraction of their 1-Phenyl-3-Methyl-4-Benzoylpyrazol-5-one Complexes on Silica Gel Column”, Microchimica Acta. Vol. 150, pp. 15–19.
60
Mahmoud, M. 1997. “Silica Gel-immobilized Eriochrome Black-T as Potential Solid Phase Extractor for Zinc (II) and Magnesium (II) from Calcium (II)”, Talanta. Vol. 45, pp. 309-315.
Mahmoud, M.E., Osman, M.M., Mohamed, E., Amer, M.E. 2000. “Selective Pre- concentration and Solid Phase Extraction of Mercury(II) from Natural Water by Silica Gel-Loaded Dithizone phases”, Analytica Chimica Acta. Vol. 415, pp. 33–40.
Ming, Y., Bing L. 1998. “Determination of Rare Earth Elements in Human Hair and
Wheat Flour Reference Materials by Inductively Coupled Plasma Mass Spectrometry with Dry Ashing and Microwave Digestion”, Spectrochimica Acta Part B. Vol. 53, pp. 1447–1454.
Minowa, H., Ebihara, M. 2003. “Separation of Rare Earth Elements from Scandium by Extraction Chromatography Application to Radio Chemical Neutron Activation Analysis for Trace Rare Earth Elements in Geological Samples”, Analytica Chimica Acta. Vol. 498, pp. 25-37.
Möller, P., Dulski, P., Luck, J. 1992. “Determination of Rare Earth Elements in
Seawater by Inductively Coupled Plasma Mass Spectrometry”, Spectrochimica Acta Part B. Vol. 47, pp. 1379-1387.
Murakami, M., Hamanaka, E., Takada, T. 2005. “Novel Sorbent Extraction Technique
Using a Chelating Agent Impregnated Porous PTFE Filter Tube: Preconcentration of Rare Earth Elements (REEs) with Bis(2-Ethyl-Hexyl)Hydrogen Phosphate (HDEHP) Loaded Porous PTFE Filter Tube Prior to Determination by ICP-MS”, Analytical Letters. Vol. 38, pp. 2449–2461.
Nakamura, Y., Tsumura, Y., Shibata, T. & Ito, Y. 1997. “Differences in Behavior
among the Chlorides of Seven Rare Earth Elements Administered Intravenously to Rats”, Fundamentals and Applied Toxicology. Vol. 37, pp. 106–116.
Nakashima, K., Kubota, F., Maruyama, T., Yumo, M. 2005. “Feasibility of Ionic
Liquids as Alternative Separation Media for Industrial Solvent Extraction Processes”, Industrial&Engineering Chemistry Research. Vol. 44, pp. 4368-4372.
Palasz, A., Czekaj, P. 2000. “Toxicological and Cytophysiological Aspects of
Lanthanides Action”, Acta Biochimica Polonica. Vol. 47, pp. 1107-1114. Pasinli, T. 2004. “Preconcentration and Atomic Spectrometric Determination of Rare
Earth Elements (REEs) in Environmental Samples”, M.Sc. Thesis, İYTE, İzmir. Pasinli, T., Eroğlu, A.E., Shahwan, T. 2005. “Preconcentration and Atomic
Spectrometric Determination of Rare Earth Elements (REEs) in Natural Water Samples by Inductively Coupled Plasma Atomic Emission Spectrometry”, Analytica Chimica Acta. Vol. 547, pp. 42-49.
61
Pedreira, W.R., Sarkis, J.E.S., Rodrigues, C., Tomiyoshi, I.A., Silva Queiroz, C.A., Abrao, A. 2002. ”Determination of Trace Amounts of Rare Earth Elements in High Pure Lanthanum Oxide by Sector Field Inductively Coupled Plasma Mass Spectrometry (HR ICP–MS) and High-performance Liquid Chromatography (HPLC) Techniques”, Journal of Alloys and Compounds. Vol. 344, pp. 17–20.
Pedreira, W.R., Sarkis, J.E.S., Silva Queiroz C.A., Rodrigues, C., Tomiyoshi, I.A.,
Abrao, A. 2003. “Determination of Trace Amounts of Rare Earth Elements in Highly Pure Neodymium Oxide by Sector Field Inductively Coupled Plasma Mass Spectrometry (ICP-SFMS) and High-performance Liquid Chromatography (HPLC) Techniques”, Journal of Solid State Chemistry. Vol. 171, pp. 3–6.
P´erez-Quintanilla, D., Hierro, I., Fajardo, M., Sierra, I. 2006. “2-Mercaptothiazoline Modified Mesoporous Silica for Mercury Removal from Aqueous Media”, Journal of Hazardous Materials. Vol. B134, pp. 245–256.
Pu, Q., Sun, Q., Hu, Z., Su, Z. 1998 “Application of 2-Mercaptobenzothiazole-
Modified Silica Gel to On-line Preconcentration and Separation of Silver for its Atomic Absorption Spectrometric Determination”, Analyst. Vol. 123, pp. 239–243.
Rao, T.P., Kala, R. 2004. “On-line and Off-line Preconcentration of Trace and
Ultratrace Amounts of Lanthanides”, Talanta. Vol. 63, pp. 949–959. Rimskaya-Korsakova, M.N., Dubinin, A.V., Ivanov, V.M. 2003. “Determination of
Rare-Earth Elements in Sulfide Minerals by Inductively Coupled Plasma Mass Spectrometry with Ion-Exchange Preconcentration”, Journal of Analytical Chemistry. Vol. 58, No. 9, pp. 870–874.
Roldan, P.S., Ilton, L., Alcăntara, I.L., Padilha, C.C.F., Padilha, P.M. 2005.
“Determination of Copper, Iron, Nickel and Zinc in Gasoline by FAAS After Sorption and Preconcentration on Silica Modified with 2-Aminotiazole groups”, Fuel. Vol. 84, pp. 305–309.
Roychowdhury, P., Roy, N.K, Das, D.K., Das, A.K.1989. “Determination of rare-
Earth Elements and Yttrium In Silicate Rocks by Sequential Inductively-Coupled Plasma Emission Spectrometry”, Talanta. Vol. 36, pp. 1183-1186.
Rucandio, M.I. 1997. “Cation-exchange isolation and ICP-AES Determination of
Rare Earth Elements In Geological Silicate Materials”, Fresenius Journal of Anaytical Chemistry. Vol. 357, pp. 661-669.
Sabbioni, E., Pietra, R., Gaglione, P., Vocaturo, G., Colombo ,F., Zanoni, M., Rodi, F. 1982. “Long-term Occupational Risk of Rare-earth pneumoconiosis. A case report as Investigated by Neutron Activation Analysis”, Science of The Total Environment. Vol. 26, pp. 19-32.
62
Safavi, A., Iranpoor, N., Saghir, N. 2004. “Directly Silica Bonded Analytical Reagents: Synthesis of 2-mercaptobenzothiazole–silica gel and its Application as a New Sorbent for Preconcentration and Determination of Silver Ion Using Solid-phase Extraction Method”, Separation and Purification Technology. Vol. 40, pp. 303–308.
Safavi, A., Iranpoor, N., Saghir, N., Momeni, S. 2006. “Glycerol–silica gel: A new Solid Sorbent for Preconcentration and Determination of Traces of Cobalt(II) Ion”, Analytica Chimica Acta. Vol. 569, pp. 139–144.
Sarkar, A.R., Data, P.K., Sarkar, M., 1996. “Sorption Recovery of Metal Ions Using Silica Gel Modified with Salicylaldoxime”, Talanta. Vol. 43, pp. 1857-1862.
Sax, N. I. 1984, “Dangerous Properties of Industrial Material”, Van Nostrand Reinhold,
(New Jersey), pp. 2358-2368. Shabani, M.B., Akagi, Y., Masuda, A. 1992. “Preconcentration of Trace Rare-Earth
Elements in Seawater by Complexation with Bis(2-ethylhexyl) Hydrogen Phosphate and 2-Ethylhexyl Dihydrogen Phosphate Adsorbed on a C18 Cartridge and Determination by Inductively Coupled Plasma Mass Spectrometry”, Anaytical Chemistry. Vol. 64, pp. 737-743.
Shaw, T.J., Duncan, T., Schnetger, B. 2003. ”A Preconcentration/Matrix Reduction Method for the Analysis of Rare Earth Elements In Seawater and Groundwaters by Isotope Dilution ICPMS”, Anaytical Chemistry. Vol. 75, pp. 3396-3403.
Sheila, M., Evangelista, S.M., Oliveira, E.D., Castro, G.R., Luiz, F., Zara, L.F., Prado, A.G.S. 2007. ”Hexagonal Mesoporous Silica Modified with 2-Mercaptothiazoline for Removing Mercury from Water Solution”, Surface Science. Vol. 601, pp. 2194–2202.
Qin, S., Yongchao, Q., Hu, B., Houngchun, X., Zucheng, J. 2000a.
“Determination of Rare Earth Impurities In High-puritiy Lanthanum Oxide Using Electrothermal Vaporization/ICP-AES After HPLC Separation”, Anaytical Sciences. Vol. 16, pp. 957-961.
Qin, S.,Bin, H., Yongchao, Q., Wanjau, R., Zucheng, J., 2000b. “Determination of
Trace Rare Earth Impurities in High-purity Cerium Oxide by Using Electrothermal Vaporization ICP-AES after HPLC Separation with 2-Ethylhexyl Hydrogen 2-Ethylhexylphosphonate Resin as the Stationary Phase”, Journal of Anaytical Aomic Spectrometry. Vol. 15, pp.141-416.
Tokman, N., Akman, S., Özcan, M. 2003. “Solid-phase Extraction of Bismuth, Lead and Nickel from Seawater Using Silica Gel Modified with (3-Aminopropyl) triethoxysilane Filled in a Syringe Prior to their Determination by Graphite Furnace Atomic Absorption Spectrometry”, Talanta. Vol. 59, pp. 201-/205.
63
Tsurubo, S., Mizutani, M., Kadota, Y., Yamamoto, T., Umetani, S., Sasaki, T., Q.Le, T.
H., Le, Q., Matsui, M. 1995. “Improved Extraction-Separation of Alkaline Earths and Lanthanides Using Crown Ethers as Ion Size Selective Masking Reagents: A Novel Macrocycle Application”, Anaytical Chemistry. Vol. 67, pp. 1465-1469.
Vicente, O., Padro, A., Martinez, L., Olsina, R., Marchevsky, E. 1998. “Determination of Some Rare Earth Elements in Seawater by Inductively Coupled Plasma Mass Spectrometry Using Flow Injection Preconcentration”, Spectrochimica Acta Part B. Vol. 53, pp. 1281-1287.
Wang, Y.G., Xiong, Y., Meng, S.L., Li, D.Q. 2004. “Separation of Yttrium from Heavy Lanthanide by CA-100 Using the Complexing Agent”, Talanta. Vol. 63, pp. 239-243.
Wang, Z.H., Yan, X., Wang Z.P, Zhang, Z.P, Liu, L-W. 2006. “Flow Injection On-
Line Solid Phase Extraction Coupled with Inductively Coupled Plasma Mass Spectrometry for Determination of (Ultra)Trace Rare Earth Elements in Environmental Materials Using Maleic Acid Grafted Polytetrafluoroethylene Fibers as Sorbent”, Journal of American Society for Mass Spectrometry. Vol. 17, pp. 1258–1264.
WEB_1, 2007. (03/02/2007) http://osoon.ut.ee/~hahha/re/uses.html
Zhang, X., Liu, L.,Yi, Y., Liu, Y., Li, X., Su, Y., Lin, P. 2007. “Determination of Rare Earth Impurities in High Purity Samarium Oxide Using Inductively Coupled Plasma Mass Spectrometry after Extraction Chromatographic Separation”, International Journal of Mass Spectrometry. Vol. 260, pp. 57–66.
Zhu,Y., Itoh, A., Fujimori, E.,Umemura, T., Haraguchi, H. 2006. “Determination of
Rare Earth Elements in Seawater by ICP-MS After Preconcentration with a Chelating Resin-packed Minicolumn”, Journal of Alloys and Compounds. Vol. 408–412, pp. 985–988.
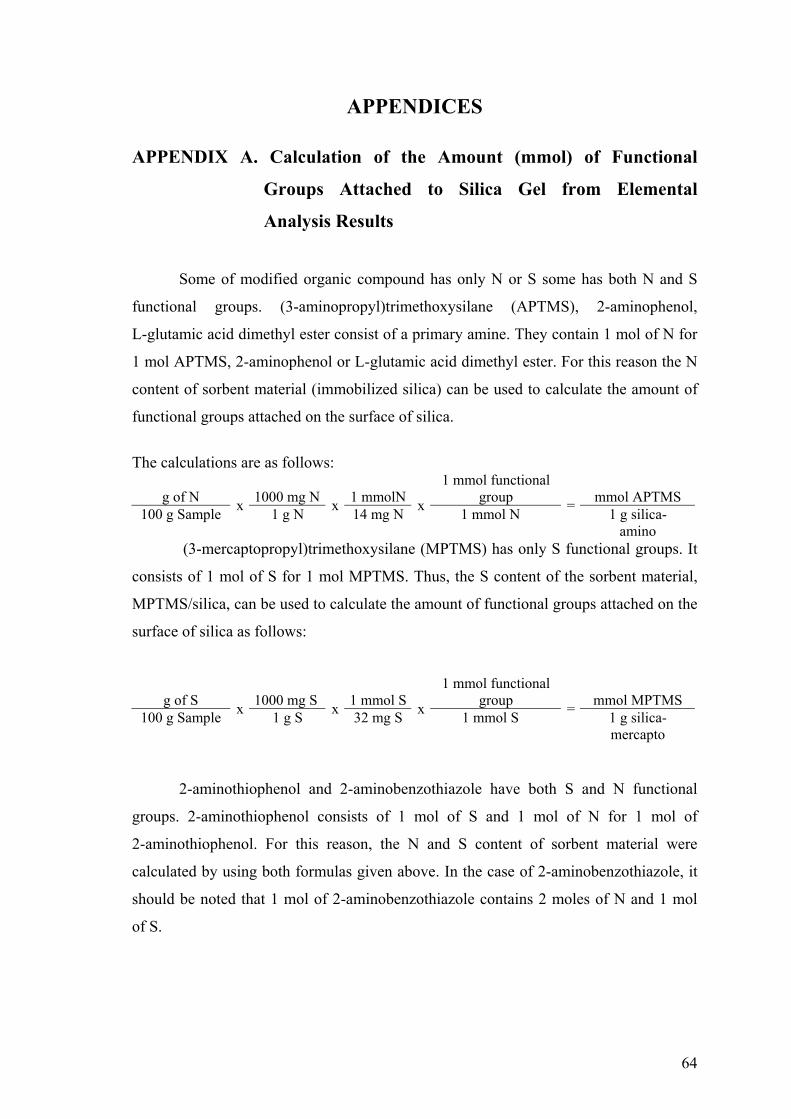
64
APPENDICES
APPENDIX A. Calculation of the Amount (mmol) of Functional
Groups Attached to Silica Gel from Elemental
Analysis Results
Some of modified organic compound has only N or S some has both N and S
functional groups. (3-aminopropyl)trimethoxysilane (APTMS), 2-aminophenol,
L-glutamic acid dimethyl ester consist of a primary amine. They contain 1 mol of N for
1 mol APTMS, 2-aminophenol or L-glutamic acid dimethyl ester. For this reason the N
content of sorbent material (immobilized silica) can be used to calculate the amount of
functional groups attached on the surface of silica.
The calculations are as follows:
g of N 1000 mg N 1 mmolN1 mmol functional
group mmol APTMS 100 g Sample x 1 g N x 14 mg N x 1 mmol N = 1 g silica-
amino (3-mercaptopropyl)trimethoxysilane (MPTMS) has only S functional groups. It
consists of 1 mol of S for 1 mol MPTMS. Thus, the S content of the sorbent material,
MPTMS/silica, can be used to calculate the amount of functional groups attached on the
surface of silica as follows:
g of S 1000 mg S 1 mmol S1 mmol functional
group mmol MPTMS 100 g Sample x 1 g S x 32 mg S x 1 mmol S = 1 g silica-
mercapto
2-aminothiophenol and 2-aminobenzothiazole have both S and N functional
groups. 2-aminothiophenol consists of 1 mol of S and 1 mol of N for 1 mol of
2-aminothiophenol. For this reason, the N and S content of sorbent material were
calculated by using both formulas given above. In the case of 2-aminobenzothiazole, it
should be noted that 1 mol of 2-aminobenzothiazole contains 2 moles of N and 1 mol
of S.
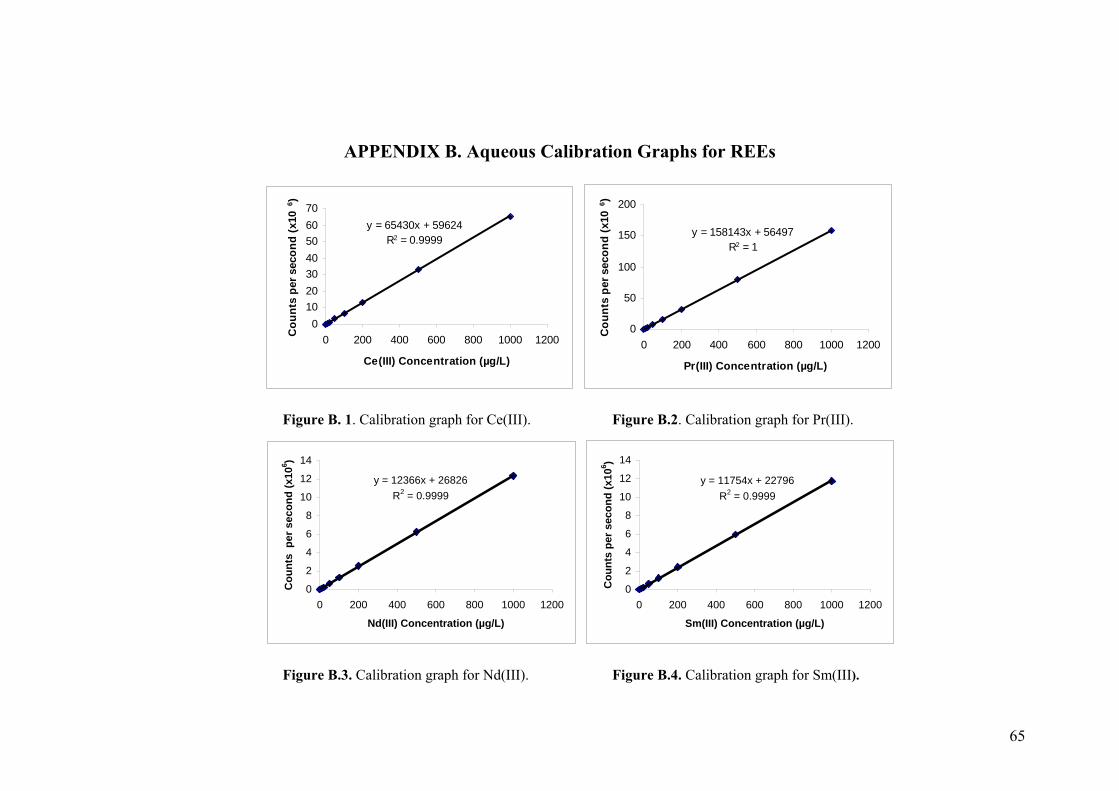
65
APPENDIX B. Aqueous Calibration Graphs for REEs
y = 65430x + 59624R2 = 0.9999
010203040506070
0 200 400 600 800 1000 1200
Ce(III) Concentration (µg/L)
Cou
nts
per s
econ
d (x
106 )
y = 158143x + 56497R2 = 1
0
50
100
150
200
0 200 400 600 800 1000 1200
Pr(III) Concentration (µg/L)
Cou
nts
per s
econ
d (x
106 )
Figure B. 1. Calibration graph for Ce(III). Figure B.2. Calibration graph for Pr(III).
y = 12366x + 26826R2 = 0.9999
0
2
4
6
8
10
12
14
0 200 400 600 800 1000 1200
Nd(III) Concentration (µg/L)
Cou
nts
per
sec
ond
(x10
6 )
y = 11754x + 22796R2 = 0.9999
0
2
4
6
8
10
12
14
0 200 400 600 800 1000 1200
Sm(III) Concentration (µg/L)C
ount
s pe
r sec
ond
(x10
6 )
Figure B.3. Calibration graph for Nd(III). Figure B.4. Calibration graph for Sm(III).
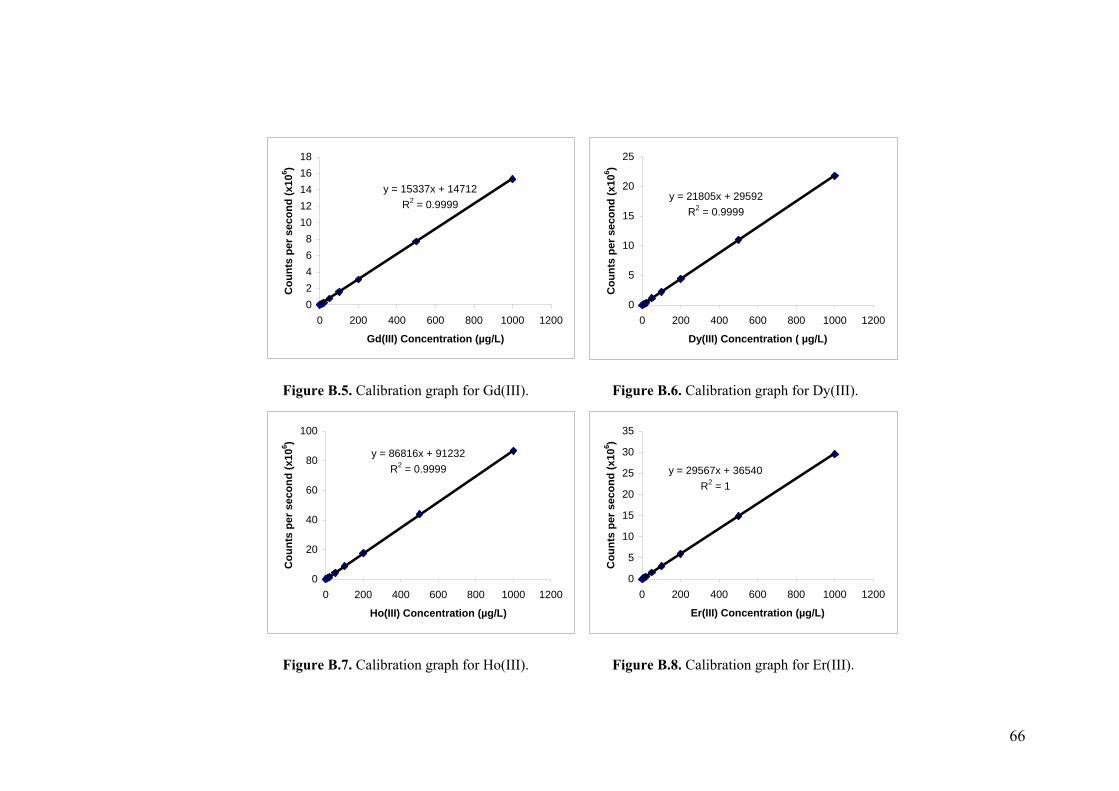
66
y = 15337x + 14712R2 = 0.9999
02468
1012141618
0 200 400 600 800 1000 1200
Gd(III) Concentration (µg/L)
Cou
nts
per s
econ
d (x
106 )
y = 21805x + 29592R2 = 0.9999
0
5
10
15
20
25
0 200 400 600 800 1000 1200
Dy(III) Concentration ( µg/L)
Cou
nts
per s
econ
d (x
106 )
Figure B.5. Calibration graph for Gd(III). Figure B.6. Calibration graph for Dy(III).
y = 86816x + 91232R2 = 0.9999
0
20
40
60
80
100
0 200 400 600 800 1000 1200
Ho(III) Concentration (µg/L)
Cou
nts
per s
econ
d (x
106 )
y = 29567x + 36540R2 = 1
0
5
10
15
20
25
30
35
0 200 400 600 800 1000 1200
Er(III) Concentration (µg/L)C
ount
s pe
r sec
ond
(x10
6 )
Figure B.7. Calibration graph for Ho(III). Figure B.8. Calibration graph for Er(III).
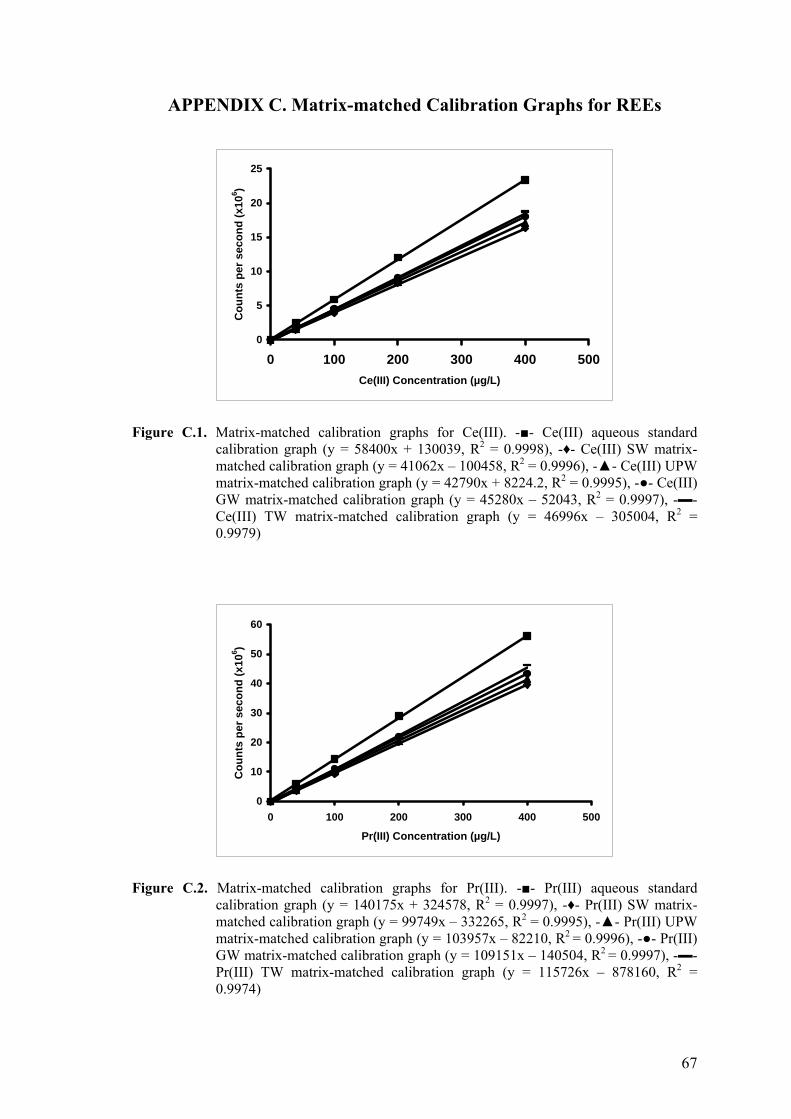
67
APPENDIX C. Matrix-matched Calibration Graphs for REEs
0
5
10
15
20
25
0 100 200 300 400 500Ce(III) Concentration (µg/L)
Cou
nts
per s
econ
d (x
106 )
Figure C.1. Matrix-matched calibration graphs for Ce(III). -- Ce(III) aqueous standard calibration graph (y = 58400x + 130039, R2 = 0.9998), -♦- Ce(III) SW matrix-matched calibration graph (y = 41062x – 100458, R2 = 0.9996), -- Ce(III) UPW matrix-matched calibration graph (y = 42790x + 8224.2, R2 = 0.9995), -- Ce(III) GW matrix-matched calibration graph (y = 45280x – 52043, R2 = 0.9997), -- Ce(III) TW matrix-matched calibration graph (y = 46996x – 305004, R2 = 0.9979)
0
10
20
30
40
50
60
0 100 200 300 400 500
Pr(III) Concentration (µg/L)
Cou
nts
per s
econ
d (x
106 )
Figure C.2. Matrix-matched calibration graphs for Pr(III). -- Pr(III) aqueous standard calibration graph (y = 140175x + 324578, R2 = 0.9997), -♦- Pr(III) SW matrix-matched calibration graph (y = 99749x – 332265, R2 = 0.9995), -- Pr(III) UPW matrix-matched calibration graph (y = 103957x – 82210, R2 = 0.9996), -- Pr(III) GW matrix-matched calibration graph (y = 109151x – 140504, R2 = 0.9997), -- Pr(III) TW matrix-matched calibration graph (y = 115726x – 878160, R2 = 0.9974)
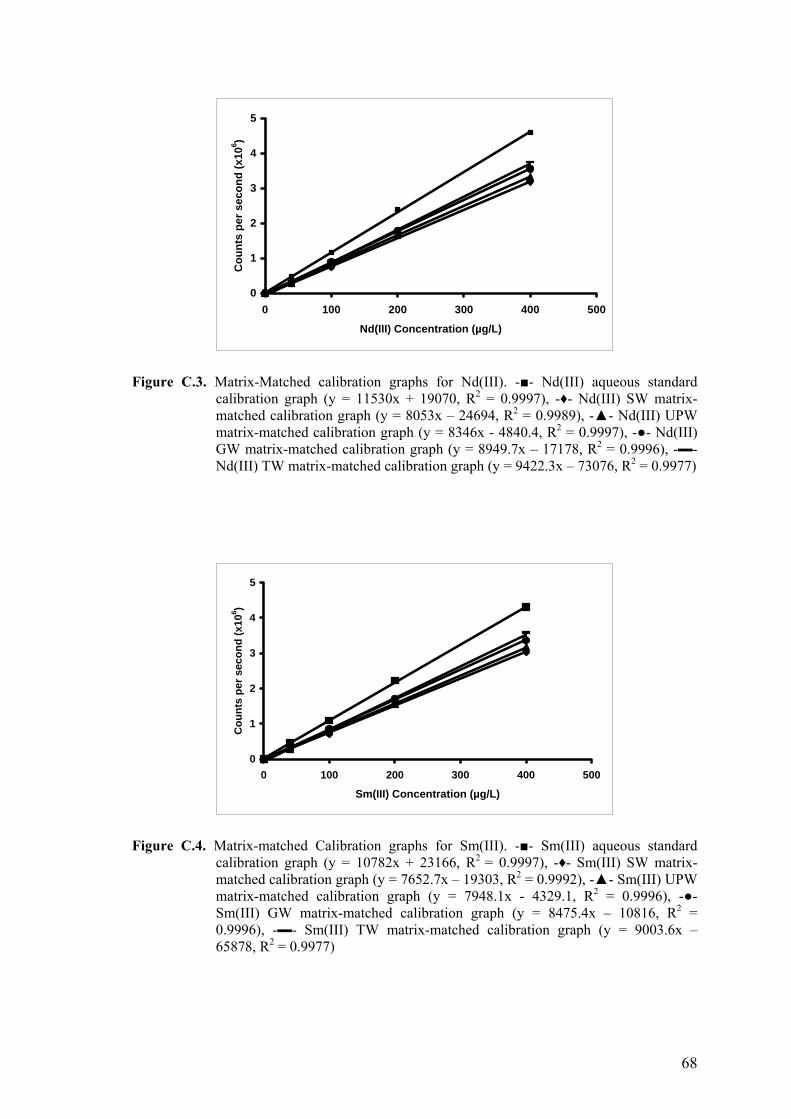
68
0
1
2
3
4
5
0 100 200 300 400 500
Nd(III) Concentration (µg/L)
Cou
nts
per s
econ
d (x
106 )
Figure C.3. Matrix-Matched calibration graphs for Nd(III). -- Nd(III) aqueous standard calibration graph (y = 11530x + 19070, R2 = 0.9997), -♦- Nd(III) SW matrix-matched calibration graph (y = 8053x – 24694, R2 = 0.9989), -- Nd(III) UPW matrix-matched calibration graph (y = 8346x - 4840.4, R2 = 0.9997), -- Nd(III) GW matrix-matched calibration graph (y = 8949.7x – 17178, R2 = 0.9996), -- Nd(III) TW matrix-matched calibration graph (y = 9422.3x – 73076, R2 = 0.9977)
0
1
2
3
4
5
0 100 200 300 400 500
Sm(III) Concentration (µg/L)
Cou
nts
per s
econ
d (x
106 )
Figure C.4. Matrix-matched Calibration graphs for Sm(III). -- Sm(III) aqueous standard calibration graph (y = 10782x + 23166, R2 = 0.9997), -♦- Sm(III) SW matrix-matched calibration graph (y = 7652.7x – 19303, R2 = 0.9992), -- Sm(III) UPW matrix-matched calibration graph (y = 7948.1x - 4329.1, R2 = 0.9996), -- Sm(III) GW matrix-matched calibration graph (y = 8475.4x – 10816, R2 = 0.9996), -- Sm(III) TW matrix-matched calibration graph (y = 9003.6x – 65878, R2 = 0.9977)
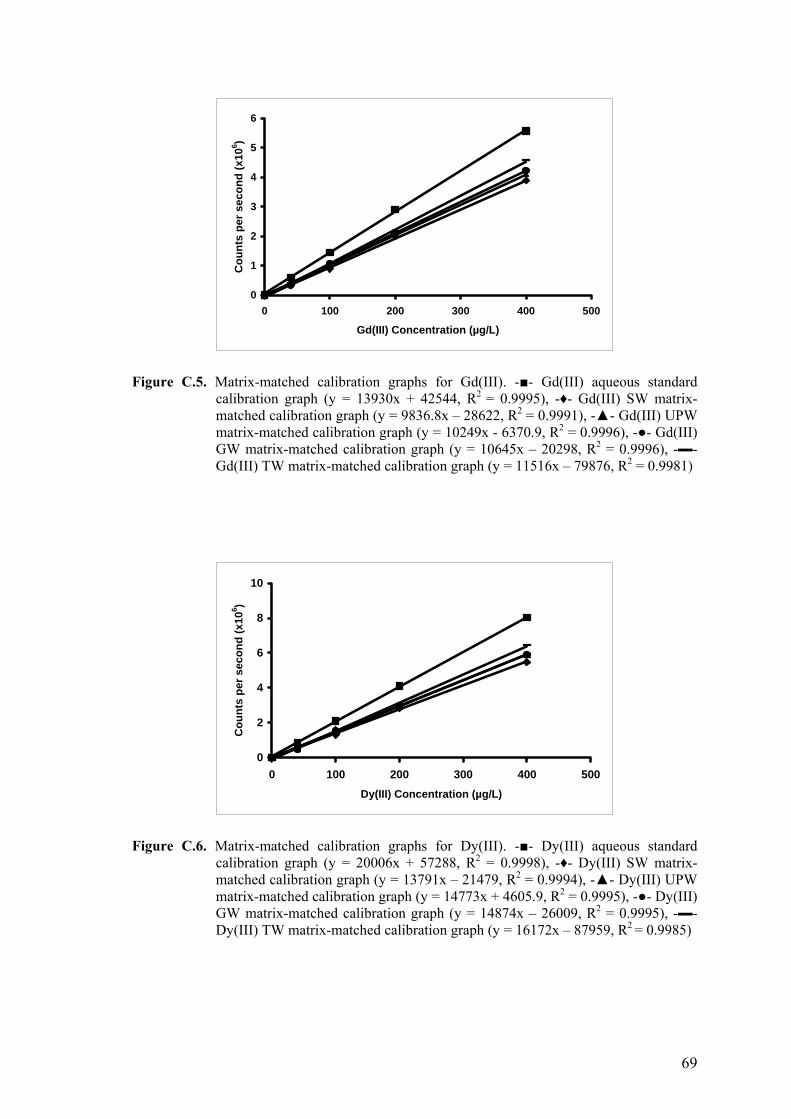
69
0
1
2
3
4
5
6
0 100 200 300 400 500
Gd(III) Concentration (µg/L)
Cou
nts
per s
econ
d (x
106 )
Figure C.5. Matrix-matched calibration graphs for Gd(III). -- Gd(III) aqueous standard calibration graph (y = 13930x + 42544, R2 = 0.9995), -♦- Gd(III) SW matrix-matched calibration graph (y = 9836.8x – 28622, R2 = 0.9991), -- Gd(III) UPW matrix-matched calibration graph (y = 10249x - 6370.9, R2 = 0.9996), -- Gd(III) GW matrix-matched calibration graph (y = 10645x – 20298, R2 = 0.9996), -- Gd(III) TW matrix-matched calibration graph (y = 11516x – 79876, R2 = 0.9981)
0
2
4
6
8
10
0 100 200 300 400 500Dy(III) Concentration (µg/L)
Cou
nts
per s
econ
d (x
106 )
Figure C.6. Matrix-matched calibration graphs for Dy(III). -- Dy(III) aqueous standard calibration graph (y = 20006x + 57288, R2 = 0.9998), -♦- Dy(III) SW matrix-matched calibration graph (y = 13791x – 21479, R2 = 0.9994), -- Dy(III) UPW matrix-matched calibration graph (y = 14773x + 4605.9, R2 = 0.9995), -- Dy(III) GW matrix-matched calibration graph (y = 14874x – 26009, R2 = 0.9995), -- Dy(III) TW matrix-matched calibration graph (y = 16172x – 87959, R2 = 0.9985)
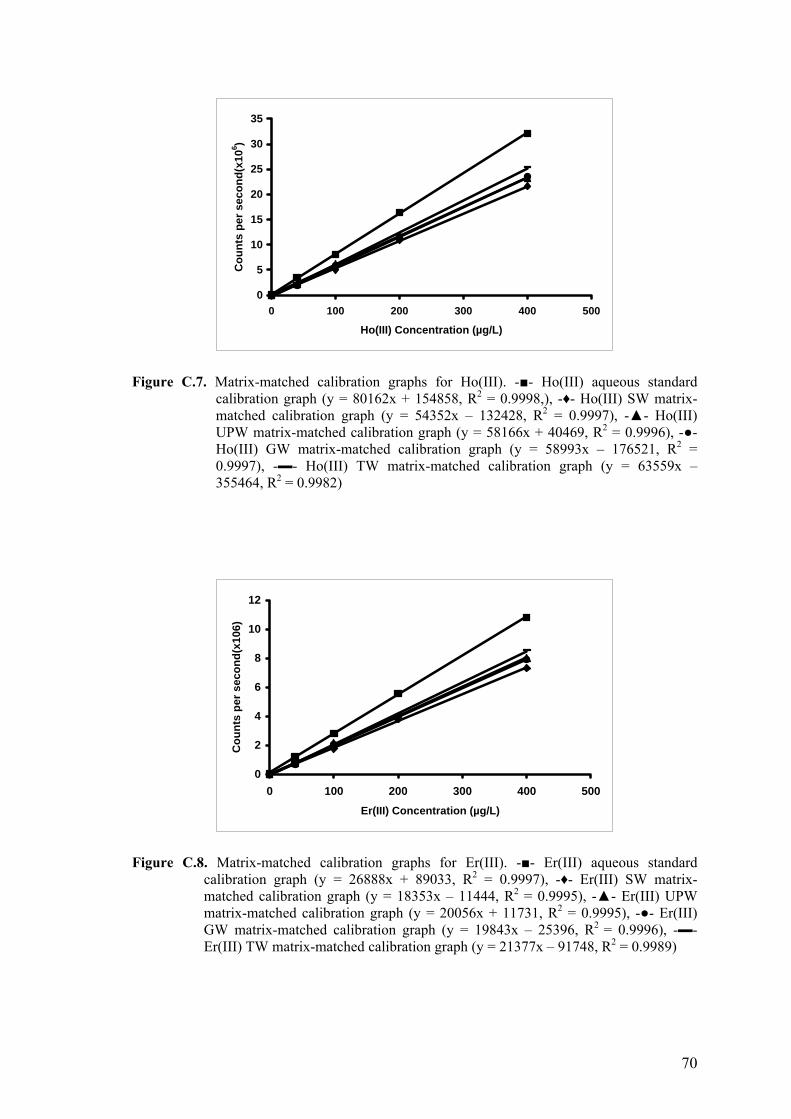
70
0
5
10
15
20
25
30
35
0 100 200 300 400 500
Ho(III) Concentration (µg/L)
Cou
nts
per s
econ
d(x1
06 )
Figure C.7. Matrix-matched calibration graphs for Ho(III). -- Ho(III) aqueous standard calibration graph (y = 80162x + 154858, R2 = 0.9998,), -♦- Ho(III) SW matrix-matched calibration graph (y = 54352x – 132428, R2 = 0.9997), -- Ho(III) UPW matrix-matched calibration graph (y = 58166x + 40469, R2 = 0.9996), -- Ho(III) GW matrix-matched calibration graph (y = 58993x – 176521, R2 = 0.9997), -- Ho(III) TW matrix-matched calibration graph (y = 63559x – 355464, R2 = 0.9982)
0
2
4
6
8
10
12
0 100 200 300 400 500Er(III) Concentration (µg/L)
Cou
nts
per s
econ
d(x1
06)
Figure C.8. Matrix-matched calibration graphs for Er(III). -- Er(III) aqueous standard calibration graph (y = 26888x + 89033, R2 = 0.9997), -♦- Er(III) SW matrix-matched calibration graph (y = 18353x – 11444, R2 = 0.9995), -- Er(III) UPW matrix-matched calibration graph (y = 20056x + 11731, R2 = 0.9995), -- Er(III) GW matrix-matched calibration graph (y = 19843x – 25396, R2 = 0.9996), -- Er(III) TW matrix-matched calibration graph (y = 21377x – 91748, R2 = 0.9989)