Embed Size (px)
Citation preview
Predicting Online Video Advertising Effectswith Multimodal Deep Learning
Jun Ikeda∗, Hiroyuki Seshime†, Xueting Wang∗, and Toshihiko Yamasaki∗∗The University of Tokyo, 7–3–1 Hongo, Bunkyo-ku, Tokyo, 113–8656 Japan
∗{ikeda, xt wang, yamasaki}@hal.t.u-tokyo.ac.jp†Septeni Co., Ltd. 8–17–1 Nishishinjuku, Shinjuku-ku, Tokyo, 160–6128 Japan
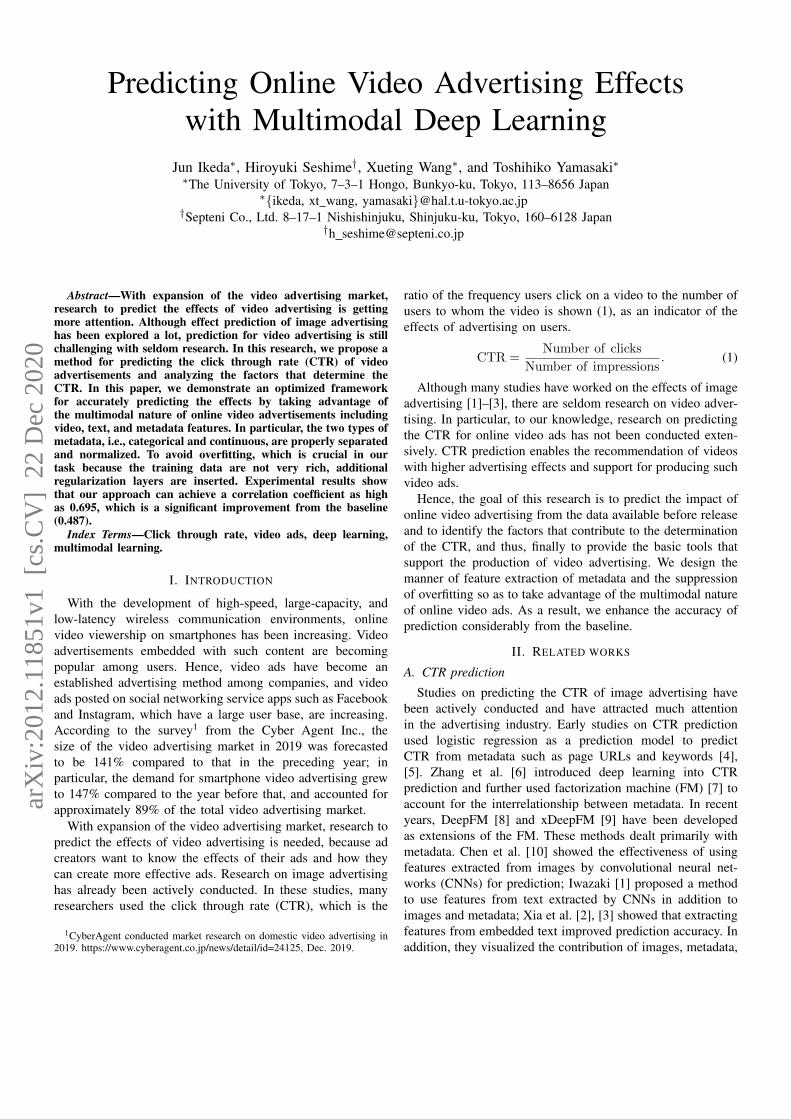
Abstract—With expansion of the video advertising market,research to predict the effects of video advertising is gettingmore attention. Although effect prediction of image advertisinghas been explored a lot, prediction for video advertising is stillchallenging with seldom research. In this research, we propose amethod for predicting the click through rate (CTR) of videoadvertisements and analyzing the factors that determine theCTR. In this paper, we demonstrate an optimized frameworkfor accurately predicting the effects by taking advantage ofthe multimodal nature of online video advertisements includingvideo, text, and metadata features. In particular, the two types ofmetadata, i.e., categorical and continuous, are properly separatedand normalized. To avoid overfitting, which is crucial in ourtask because the training data are not very rich, additionalregularization layers are inserted. Experimental results showthat our approach can achieve a correlation coefficient as highas 0.695, which is a significant improvement from the baseline(0.487).
Index Terms—Click through rate, video ads, deep learning,multimodal learning.
I. INTRODUCTION
With the development of high-speed, large-capacity, andlow-latency wireless communication environments, onlinevideo viewership on smartphones has been increasing. Videoadvertisements embedded with such content are becomingpopular among users. Hence, video ads have become anestablished advertising method among companies, and videoads posted on social networking service apps such as Facebookand Instagram, which have a large user base, are increasing.According to the survey1 from the Cyber Agent Inc., thesize of the video advertising market in 2019 was forecastedto be 141% compared to that in the preceding year; inparticular, the demand for smartphone video advertising grewto 147% compared to the year before that, and accounted forapproximately 89% of the total video advertising market.
With expansion of the video advertising market, research topredict the effects of video advertising is needed, because adcreators want to know the effects of their ads and how theycan create more effective ads. Research on image advertisinghas already been actively conducted. In these studies, manyresearchers used the click through rate (CTR), which is the
1CyberAgent conducted market research on domestic video advertising in2019. https://www.cyberagent.co.jp/news/detail/id=24125, Dec. 2019.
ratio of the frequency users click on a video to the number ofusers to whom the video is shown (1), as an indicator of theeffects of advertising on users.
CTR =Number of clicks
Number of impressions. (1)
Although many studies have worked on the effects of imageadvertising [1]–[3], there are seldom research on video adver-tising. In particular, to our knowledge, research on predictingthe CTR for online video ads has not been conducted exten-sively. CTR prediction enables the recommendation of videoswith higher advertising effects and support for producing suchvideo ads.
Hence, the goal of this research is to predict the impact ofonline video advertising from the data available before releaseand to identify the factors that contribute to the determinationof the CTR, and thus, finally to provide the basic tools thatsupport the production of video advertising. We design themanner of feature extraction of metadata and the suppressionof overfitting so as to take advantage of the multimodal natureof online video ads. As a result, we enhance the accuracy ofprediction considerably from the baseline.
II. RELATED WORKS
A. CTR prediction
Studies on predicting the CTR of image advertising havebeen actively conducted and have attracted much attentionin the advertising industry. Early studies on CTR predictionused logistic regression as a prediction model to predictCTR from metadata such as page URLs and keywords [4],[5]. Zhang et al. [6] introduced deep learning into CTRprediction and further used factorization machine (FM) [7] toaccount for the interrelationship between metadata. In recentyears, DeepFM [8] and xDeepFM [9] have been developedas extensions of the FM. These methods dealt primarily withmetadata. Chen et al. [10] showed the effectiveness of usingfeatures extracted from images by convolutional neural net-works (CNNs) for prediction; Iwazaki [1] proposed a methodto use features from text extracted by CNNs in addition toimages and metadata; Xia et al. [2], [3] showed that extractingfeatures from embedded text improved prediction accuracy. Inaddition, they visualized the contribution of images, metadata,
arX
iv:2
012.
1185
1v1
[cs
.CV
] 2
2 D
ec 2
020
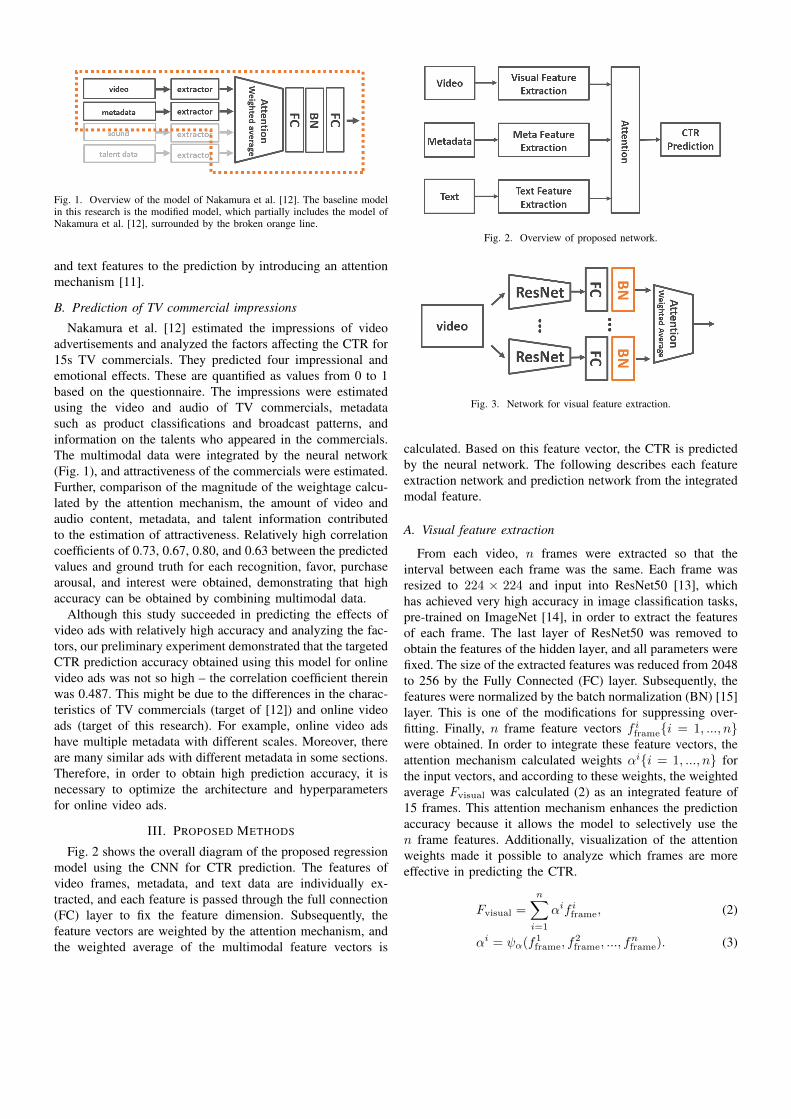
Fig. 1. Overview of the model of Nakamura et al. [12]. The baseline modelin this research is the modified model, which partially includes the model ofNakamura et al. [12], surrounded by the broken orange line.
and text features to the prediction by introducing an attentionmechanism [11].
B. Prediction of TV commercial impressions
Nakamura et al. [12] estimated the impressions of videoadvertisements and analyzed the factors affecting the CTR for15s TV commercials. They predicted four impressional andemotional effects. These are quantified as values from 0 to 1based on the questionnaire. The impressions were estimatedusing the video and audio of TV commercials, metadatasuch as product classifications and broadcast patterns, andinformation on the talents who appeared in the commercials.The multimodal data were integrated by the neural network(Fig. 1), and attractiveness of the commercials were estimated.Further, comparison of the magnitude of the weightage calcu-lated by the attention mechanism, the amount of video andaudio content, metadata, and talent information contributedto the estimation of attractiveness. Relatively high correlationcoefficients of 0.73, 0.67, 0.80, and 0.63 between the predictedvalues and ground truth for each recognition, favor, purchasearousal, and interest were obtained, demonstrating that highaccuracy can be obtained by combining multimodal data.
Although this study succeeded in predicting the effects ofvideo ads with relatively high accuracy and analyzing the fac-tors, our preliminary experiment demonstrated that the targetedCTR prediction accuracy obtained using this model for onlinevideo ads was not so high – the correlation coefficient thereinwas 0.487. This might be due to the differences in the charac-teristics of TV commercials (target of [12]) and online videoads (target of this research). For example, online video adshave multiple metadata with different scales. Moreover, thereare many similar ads with different metadata in some sections.Therefore, in order to obtain high prediction accuracy, it isnecessary to optimize the architecture and hyperparametersfor online video ads.
III. PROPOSED METHODS
Fig. 2 shows the overall diagram of the proposed regressionmodel using the CNN for CTR prediction. The features ofvideo frames, metadata, and text data are individually ex-tracted, and each feature is passed through the full connection(FC) layer to fix the feature dimension. Subsequently, thefeature vectors are weighted by the attention mechanism, andthe weighted average of the multimodal feature vectors is
Fig. 2. Overview of proposed network.
Fig. 3. Network for visual feature extraction.
calculated. Based on this feature vector, the CTR is predictedby the neural network. The following describes each featureextraction network and prediction network from the integratedmodal feature.
A. Visual feature extraction
From each video, n frames were extracted so that theinterval between each frame was the same. Each frame wasresized to 224 × 224 and input into ResNet50 [13], whichhas achieved very high accuracy in image classification tasks,pre-trained on ImageNet [14], in order to extract the featuresof each frame. The last layer of ResNet50 was removed toobtain the features of the hidden layer, and all parameters werefixed. The size of the extracted features was reduced from 2048to 256 by the Fully Connected (FC) layer. Subsequently, thefeatures were normalized by the batch normalization (BN) [15]layer. This is one of the modifications for suppressing over-fitting. Finally, n frame feature vectors f iframe{i = 1, ..., n}were obtained. In order to integrate these feature vectors, theattention mechanism calculated weights αi{i = 1, ..., n} forthe input vectors, and according to these weights, the weightedaverage Fvisual was calculated (2) as an integrated feature of15 frames. This attention mechanism enhances the predictionaccuracy because it allows the model to selectively use then frame features. Additionally, visualization of the attentionweights made it possible to analyze which frames are moreeffective in predicting the CTR.
Fvisual =
n∑i=1
αif iframe, (2)
αi = ψα(f1frame, f
2frame, ..., f
nframe). (3)
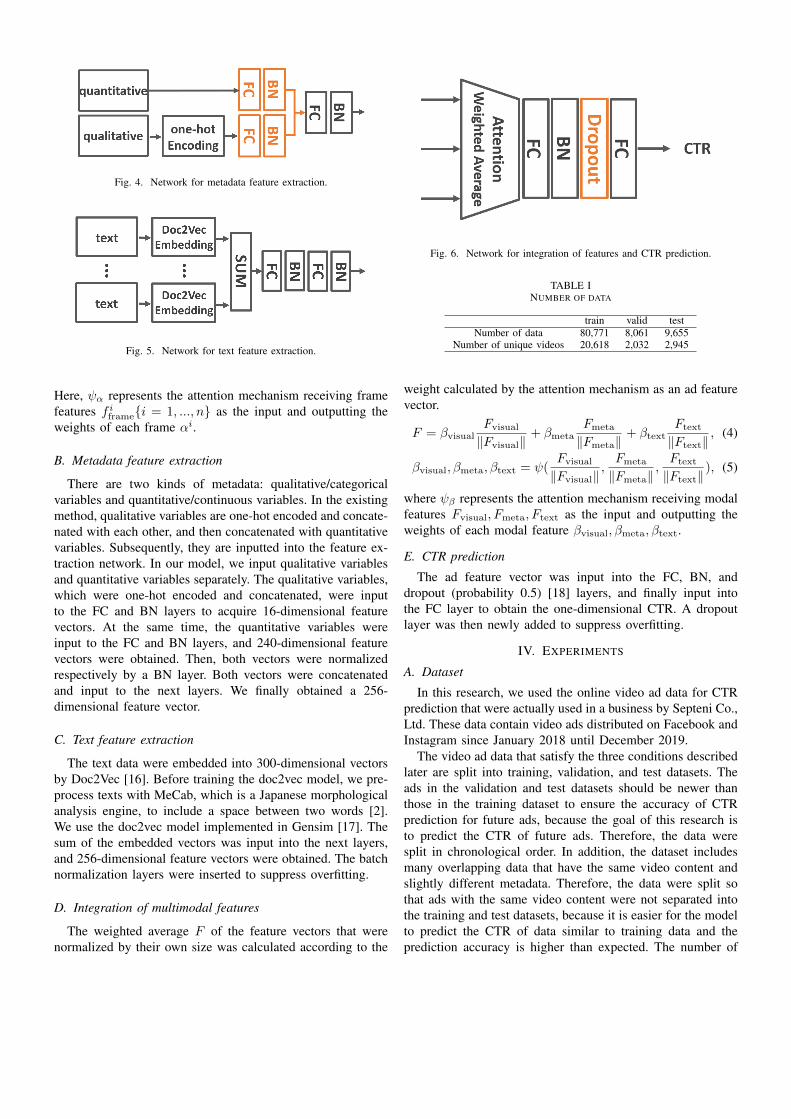
Fig. 4. Network for metadata feature extraction.
Fig. 5. Network for text feature extraction.
Here, ψα represents the attention mechanism receiving framefeatures f iframe{i = 1, ..., n} as the input and outputting theweights of each frame αi.
B. Metadata feature extraction
There are two kinds of metadata: qualitative/categoricalvariables and quantitative/continuous variables. In the existingmethod, qualitative variables are one-hot encoded and concate-nated with each other, and then concatenated with quantitativevariables. Subsequently, they are inputted into the feature ex-traction network. In our model, we input qualitative variablesand quantitative variables separately. The qualitative variables,which were one-hot encoded and concatenated, were inputto the FC and BN layers to acquire 16-dimensional featurevectors. At the same time, the quantitative variables wereinput to the FC and BN layers, and 240-dimensional featurevectors were obtained. Then, both vectors were normalizedrespectively by a BN layer. Both vectors were concatenatedand input to the next layers. We finally obtained a 256-dimensional feature vector.
C. Text feature extraction
The text data were embedded into 300-dimensional vectorsby Doc2Vec [16]. Before training the doc2vec model, we pre-process texts with MeCab, which is a Japanese morphologicalanalysis engine, to include a space between two words [2].We use the doc2vec model implemented in Gensim [17]. Thesum of the embedded vectors was input into the next layers,and 256-dimensional feature vectors were obtained. The batchnormalization layers were inserted to suppress overfitting.
D. Integration of multimodal features
The weighted average F of the feature vectors that werenormalized by their own size was calculated according to the
Fig. 6. Network for integration of features and CTR prediction.
TABLE INUMBER OF DATA
train valid testNumber of data 80,771 8,061 9,655
Number of unique videos 20,618 2,032 2,945
weight calculated by the attention mechanism as an ad featurevector.
F = βvisualFvisual
‖Fvisual‖+ βmeta
Fmeta
‖Fmeta‖+ βtext
Ftext
‖Ftext‖, (4)
βvisual, βmeta, βtext = ψ(Fvisual
‖Fvisual‖,Fmeta
‖Fmeta‖,Ftext
‖Ftext‖), (5)
where ψβ represents the attention mechanism receiving modalfeatures Fvisual, Fmeta, Ftext as the input and outputting theweights of each modal feature βvisual, βmeta, βtext.
E. CTR prediction
The ad feature vector was input into the FC, BN, anddropout (probability 0.5) [18] layers, and finally input intothe FC layer to obtain the one-dimensional CTR. A dropoutlayer was then newly added to suppress overfitting.
IV. EXPERIMENTS
A. Dataset
In this research, we used the online video ad data for CTRprediction that were actually used in a business by Septeni Co.,Ltd. These data contain video ads distributed on Facebook andInstagram since January 2018 until December 2019.
The video ad data that satisfy the three conditions describedlater are split into training, validation, and test datasets. Theads in the validation and test datasets should be newer thanthose in the training dataset to ensure the accuracy of CTRprediction for future ads, because the goal of this research isto predict the CTR of future ads. Therefore, the data weresplit in chronological order. In addition, the dataset includesmany overlapping data that have the same video content andslightly different metadata. Therefore, the data were split sothat ads with the same video content were not separated intothe training and test datasets, because it is easier for the modelto predict the CTR of data similar to training data and theprediction accuracy is higher than expected. The number of
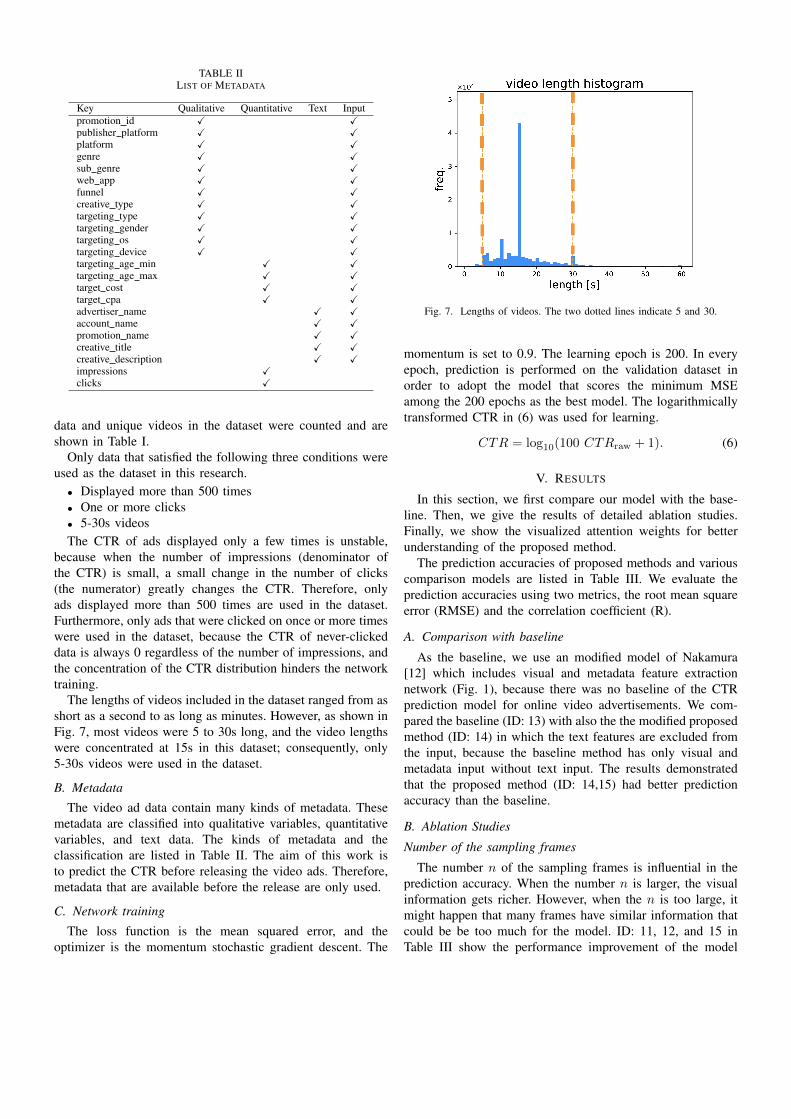
TABLE IILIST OF METADATA
Key Qualitative Quantitative Text Inputpromotion id X Xpublisher platform X Xplatform X Xgenre X Xsub genre X Xweb app X Xfunnel X Xcreative type X Xtargeting type X Xtargeting gender X Xtargeting os X Xtargeting device X Xtargeting age min X Xtargeting age max X Xtarget cost X Xtarget cpa X Xadvertiser name X Xaccount name X Xpromotion name X Xcreative title X Xcreative description X Ximpressions Xclicks X
data and unique videos in the dataset were counted and areshown in Table I.
Only data that satisfied the following three conditions wereused as the dataset in this research.
• Displayed more than 500 times• One or more clicks• 5-30s videosThe CTR of ads displayed only a few times is unstable,
because when the number of impressions (denominator ofthe CTR) is small, a small change in the number of clicks(the numerator) greatly changes the CTR. Therefore, onlyads displayed more than 500 times are used in the dataset.Furthermore, only ads that were clicked on once or more timeswere used in the dataset, because the CTR of never-clickeddata is always 0 regardless of the number of impressions, andthe concentration of the CTR distribution hinders the networktraining.
The lengths of videos included in the dataset ranged from asshort as a second to as long as minutes. However, as shown inFig. 7, most videos were 5 to 30s long, and the video lengthswere concentrated at 15s in this dataset; consequently, only5-30s videos were used in the dataset.
B. Metadata
The video ad data contain many kinds of metadata. Thesemetadata are classified into qualitative variables, quantitativevariables, and text data. The kinds of metadata and theclassification are listed in Table II. The aim of this work isto predict the CTR before releasing the video ads. Therefore,metadata that are available before the release are only used.
C. Network training
The loss function is the mean squared error, and theoptimizer is the momentum stochastic gradient descent. The
Fig. 7. Lengths of videos. The two dotted lines indicate 5 and 30.
momentum is set to 0.9. The learning epoch is 200. In everyepoch, prediction is performed on the validation dataset inorder to adopt the model that scores the minimum MSEamong the 200 epochs as the best model. The logarithmicallytransformed CTR in (6) was used for learning.
CTR = log10(100 CTRraw + 1). (6)
V. RESULTS
In this section, we first compare our model with the base-line. Then, we give the results of detailed ablation studies.Finally, we show the visualized attention weights for betterunderstanding of the proposed method.
The prediction accuracies of proposed methods and variouscomparison models are listed in Table III. We evaluate theprediction accuracies using two metrics, the root mean squareerror (RMSE) and the correlation coefficient (R).
A. Comparison with baseline
As the baseline, we use an modified model of Nakamura[12] which includes visual and metadata feature extractionnetwork (Fig. 1), because there was no baseline of the CTRprediction model for online video advertisements. We com-pared the baseline (ID: 13) with also the the modified proposedmethod (ID: 14) in which the text features are excluded fromthe input, because the baseline method has only visual andmetadata input without text input. The results demonstratedthat the proposed method (ID: 14,15) had better predictionaccuracy than the baseline.
B. Ablation Studies
Number of the sampling frames
The number n of the sampling frames is influential in theprediction accuracy. When the number n is larger, the visualinformation gets richer. However, when the n is too large, itmight happen that many frames have similar information thatcould be be too much for the model. ID: 11, 12, and 15 inTable III show the performance improvement of the model
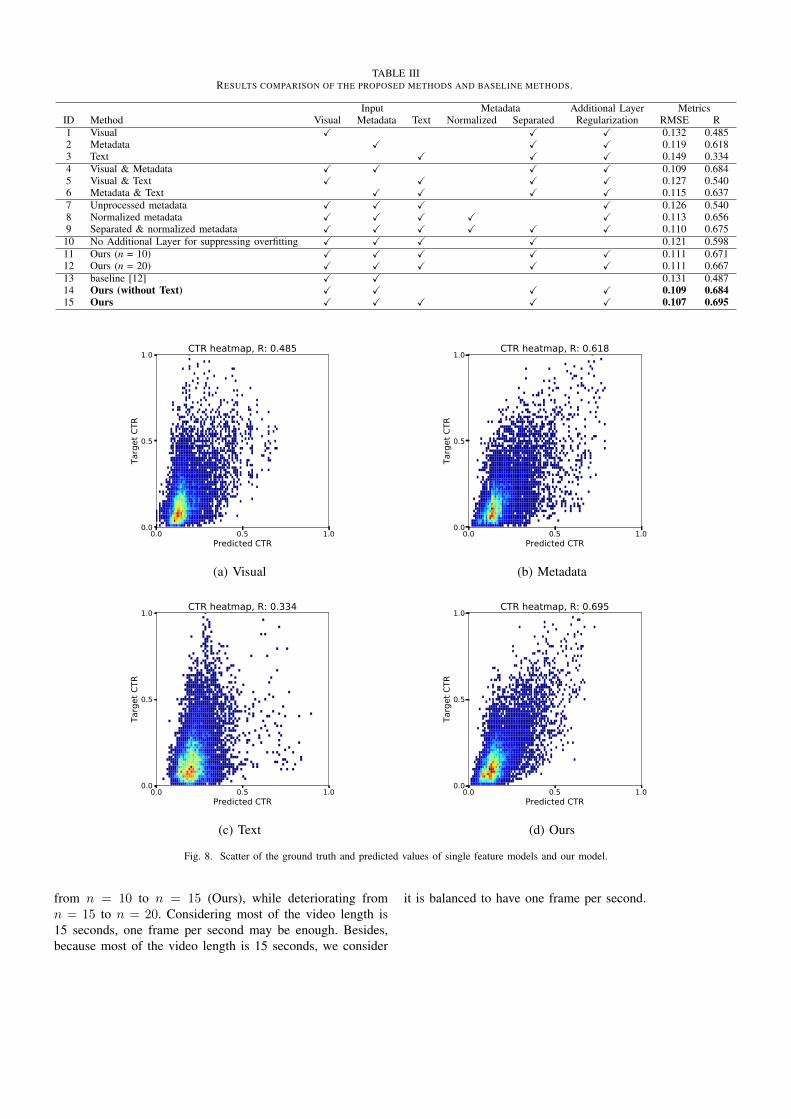
TABLE IIIRESULTS COMPARISON OF THE PROPOSED METHODS AND BASELINE METHODS.
Input Metadata Additional Layer MetricsID Method Visual Metadata Text Normalized Separated Regularization RMSE R1 Visual X X X 0.132 0.4852 Metadata X X X 0.119 0.6183 Text X X X 0.149 0.3344 Visual & Metadata X X X X 0.109 0.6845 Visual & Text X X X X 0.127 0.5406 Metadata & Text X X X X 0.115 0.6377 Unprocessed metadata X X X X 0.126 0.5408 Normalized metadata X X X X X 0.113 0.6569 Separated & normalized metadata X X X X X X 0.110 0.67510 No Additional Layer for suppressing overfitting X X X X 0.121 0.59811 Ours (n = 10) X X X X X 0.111 0.67112 Ours (n = 20) X X X X X 0.111 0.66713 baseline [12] X X 0.131 0.48714 Ours (without Text) X X X X 0.109 0.68415 Ours X X X X X 0.107 0.695
0.0 0.5 1.0Predicted CTR
0.0
0.5
1.0
Targ
et C
TR
CTR heatmap, R: 0.485
(a) Visual
0.0 0.5 1.0Predicted CTR
0.0
0.5
1.0
Targ
et C
TR
CTR heatmap, R: 0.618
(b) Metadata
0.0 0.5 1.0Predicted CTR
0.0
0.5
1.0
Targ
et C
TR
CTR heatmap, R: 0.334
(c) Text
0.0 0.5 1.0Predicted CTR
0.0
0.5
1.0
Targ
et C
TR
CTR heatmap, R: 0.695
(d) Ours
Fig. 8. Scatter of the ground truth and predicted values of single feature models and our model.
from n = 10 to n = 15 (Ours), while deteriorating fromn = 15 to n = 20. Considering most of the video length is15 seconds, one frame per second may be enough. Besides,because most of the video length is 15 seconds, we consider
it is balanced to have one frame per second.
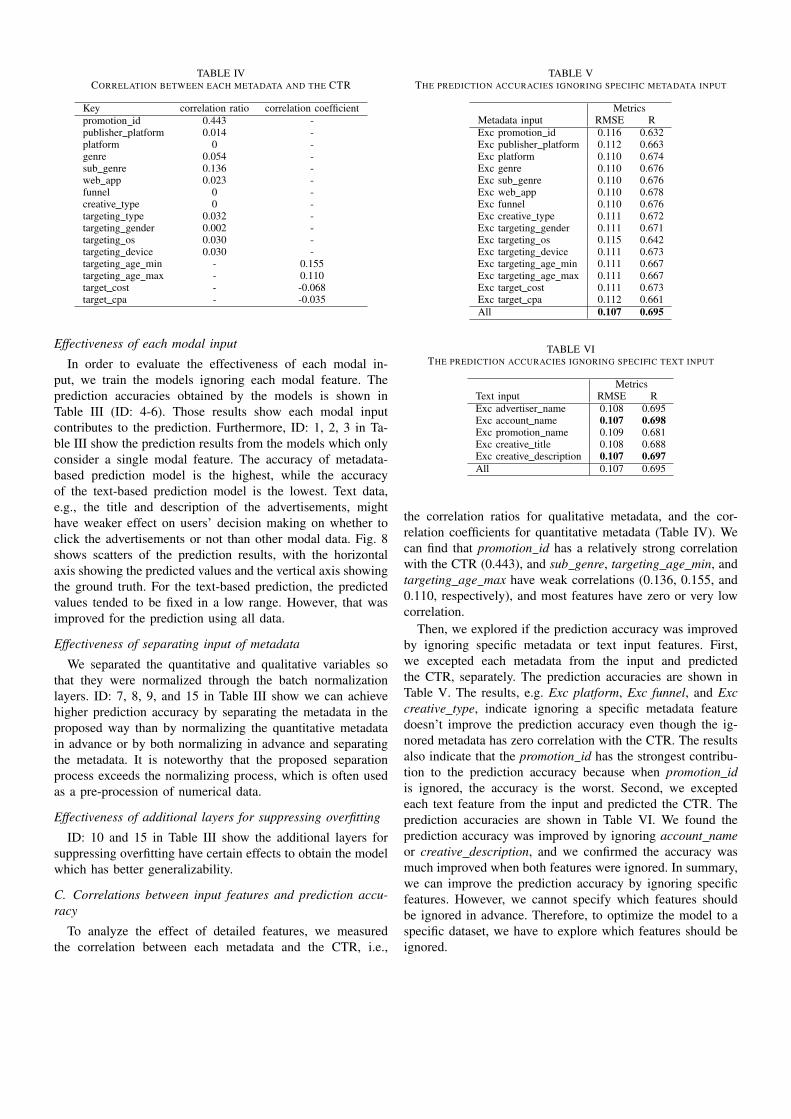
TABLE IVCORRELATION BETWEEN EACH METADATA AND THE CTR
Key correlation ratio correlation coefficientpromotion id 0.443 -publisher platform 0.014 -platform 0 -genre 0.054 -sub genre 0.136 -web app 0.023 -funnel 0 -creative type 0 -targeting type 0.032 -targeting gender 0.002 -targeting os 0.030 -targeting device 0.030 -targeting age min - 0.155targeting age max - 0.110target cost - -0.068target cpa - -0.035
Effectiveness of each modal input
In order to evaluate the effectiveness of each modal in-put, we train the models ignoring each modal feature. Theprediction accuracies obtained by the models is shown inTable III (ID: 4-6). Those results show each modal inputcontributes to the prediction. Furthermore, ID: 1, 2, 3 in Ta-ble III show the prediction results from the models which onlyconsider a single modal feature. The accuracy of metadata-based prediction model is the highest, while the accuracyof the text-based prediction model is the lowest. Text data,e.g., the title and description of the advertisements, mighthave weaker effect on users’ decision making on whether toclick the advertisements or not than other modal data. Fig. 8shows scatters of the prediction results, with the horizontalaxis showing the predicted values and the vertical axis showingthe ground truth. For the text-based prediction, the predictedvalues tended to be fixed in a low range. However, that wasimproved for the prediction using all data.
Effectiveness of separating input of metadata
We separated the quantitative and qualitative variables sothat they were normalized through the batch normalizationlayers. ID: 7, 8, 9, and 15 in Table III show we can achievehigher prediction accuracy by separating the metadata in theproposed way than by normalizing the quantitative metadatain advance or by both normalizing in advance and separatingthe metadata. It is noteworthy that the proposed separationprocess exceeds the normalizing process, which is often usedas a pre-procession of numerical data.
Effectiveness of additional layers for suppressing overfitting
ID: 10 and 15 in Table III show the additional layers forsuppressing overfitting have certain effects to obtain the modelwhich has better generalizability.
C. Correlations between input features and prediction accu-racy
To analyze the effect of detailed features, we measuredthe correlation between each metadata and the CTR, i.e.,
TABLE VTHE PREDICTION ACCURACIES IGNORING SPECIFIC METADATA INPUT
MetricsMetadata input RMSE RExc promotion id 0.116 0.632Exc publisher platform 0.112 0.663Exc platform 0.110 0.674Exc genre 0.110 0.676Exc sub genre 0.110 0.676Exc web app 0.110 0.678Exc funnel 0.110 0.676Exc creative type 0.111 0.672Exc targeting gender 0.111 0.671Exc targeting os 0.115 0.642Exc targeting device 0.111 0.673Exc targeting age min 0.111 0.667Exc targeting age max 0.111 0.667Exc target cost 0.111 0.673Exc target cpa 0.112 0.661All 0.107 0.695
TABLE VITHE PREDICTION ACCURACIES IGNORING SPECIFIC TEXT INPUT
MetricsText input RMSE RExc advertiser name 0.108 0.695Exc account name 0.107 0.698Exc promotion name 0.109 0.681Exc creative title 0.108 0.688Exc creative description 0.107 0.697All 0.107 0.695
the correlation ratios for qualitative metadata, and the cor-relation coefficients for quantitative metadata (Table IV). Wecan find that promotion id has a relatively strong correlationwith the CTR (0.443), and sub genre, targeting age min, andtargeting age max have weak correlations (0.136, 0.155, and0.110, respectively), and most features have zero or very lowcorrelation.
Then, we explored if the prediction accuracy was improvedby ignoring specific metadata or text input features. First,we excepted each metadata from the input and predictedthe CTR, separately. The prediction accuracies are shown inTable V. The results, e.g. Exc platform, Exc funnel, and Exccreative type, indicate ignoring a specific metadata featuredoesn’t improve the prediction accuracy even though the ig-nored metadata has zero correlation with the CTR. The resultsalso indicate that the promotion id has the strongest contribu-tion to the prediction accuracy because when promotion idis ignored, the accuracy is the worst. Second, we exceptedeach text feature from the input and predicted the CTR. Theprediction accuracies are shown in Table VI. We found theprediction accuracy was improved by ignoring account nameor creative description, and we confirmed the accuracy wasmuch improved when both features were ignored. In summary,we can improve the prediction accuracy by ignoring specificfeatures. However, we cannot specify which features shouldbe ignored in advance. Therefore, to optimize the model to aspecific dataset, we have to explore which features should beignored.
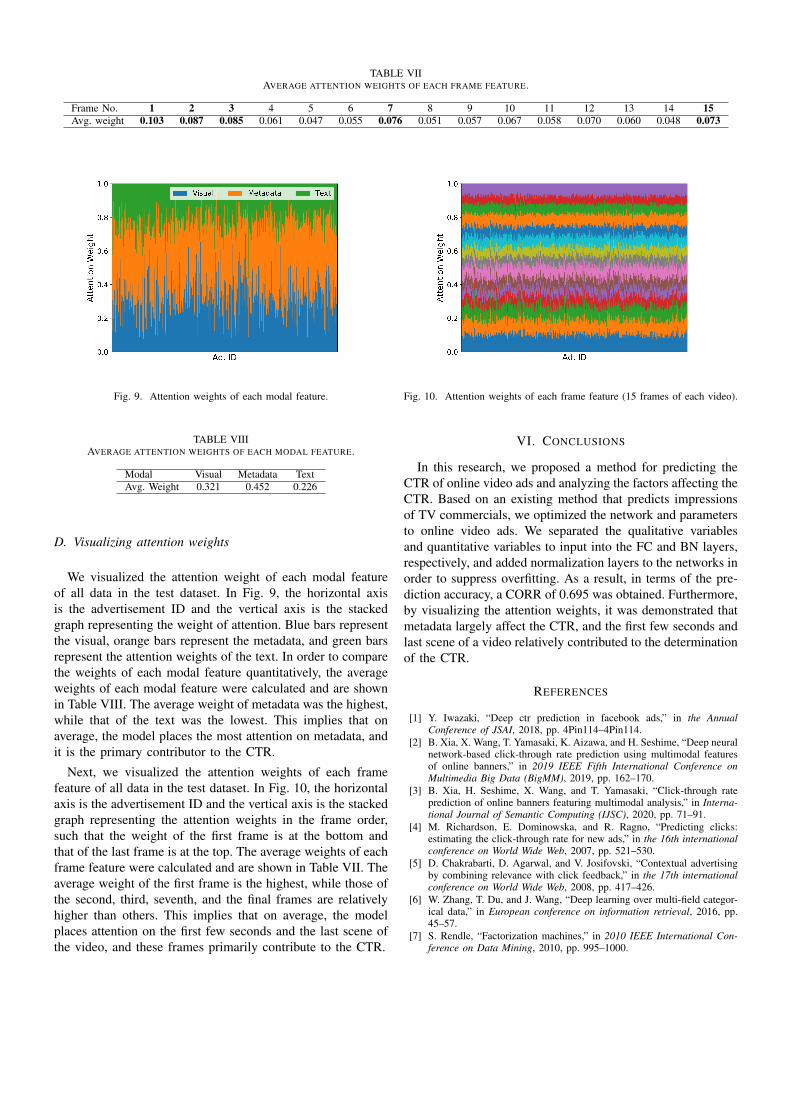
TABLE VIIAVERAGE ATTENTION WEIGHTS OF EACH FRAME FEATURE.
Frame No. 1 2 3 4 5 6 7 8 9 10 11 12 13 14 15Avg. weight 0.103 0.087 0.085 0.061 0.047 0.055 0.076 0.051 0.057 0.067 0.058 0.070 0.060 0.048 0.073
Fig. 9. Attention weights of each modal feature.
TABLE VIIIAVERAGE ATTENTION WEIGHTS OF EACH MODAL FEATURE.
Modal Visual Metadata TextAvg. Weight 0.321 0.452 0.226
D. Visualizing attention weights
We visualized the attention weight of each modal featureof all data in the test dataset. In Fig. 9, the horizontal axisis the advertisement ID and the vertical axis is the stackedgraph representing the weight of attention. Blue bars representthe visual, orange bars represent the metadata, and green barsrepresent the attention weights of the text. In order to comparethe weights of each modal feature quantitatively, the averageweights of each modal feature were calculated and are shownin Table VIII. The average weight of metadata was the highest,while that of the text was the lowest. This implies that onaverage, the model places the most attention on metadata, andit is the primary contributor to the CTR.
Next, we visualized the attention weights of each framefeature of all data in the test dataset. In Fig. 10, the horizontalaxis is the advertisement ID and the vertical axis is the stackedgraph representing the attention weights in the frame order,such that the weight of the first frame is at the bottom andthat of the last frame is at the top. The average weights of eachframe feature were calculated and are shown in Table VII. Theaverage weight of the first frame is the highest, while those ofthe second, third, seventh, and the final frames are relativelyhigher than others. This implies that on average, the modelplaces attention on the first few seconds and the last scene ofthe video, and these frames primarily contribute to the CTR.
Fig. 10. Attention weights of each frame feature (15 frames of each video).
VI. CONCLUSIONS
In this research, we proposed a method for predicting theCTR of online video ads and analyzing the factors affecting theCTR. Based on an existing method that predicts impressionsof TV commercials, we optimized the network and parametersto online video ads. We separated the qualitative variablesand quantitative variables to input into the FC and BN layers,respectively, and added normalization layers to the networks inorder to suppress overfitting. As a result, in terms of the pre-diction accuracy, a CORR of 0.695 was obtained. Furthermore,by visualizing the attention weights, it was demonstrated thatmetadata largely affect the CTR, and the first few seconds andlast scene of a video relatively contributed to the determinationof the CTR.
REFERENCES
[1] Y. Iwazaki, “Deep ctr prediction in facebook ads,” in the AnnualConference of JSAI, 2018, pp. 4Pin114–4Pin114.
[2] B. Xia, X. Wang, T. Yamasaki, K. Aizawa, and H. Seshime, “Deep neuralnetwork-based click-through rate prediction using multimodal featuresof online banners,” in 2019 IEEE Fifth International Conference onMultimedia Big Data (BigMM), 2019, pp. 162–170.
[3] B. Xia, H. Seshime, X. Wang, and T. Yamasaki, “Click-through rateprediction of online banners featuring multimodal analysis,” in Interna-tional Journal of Semantic Computing (IJSC), 2020, pp. 71–91.
[4] M. Richardson, E. Dominowska, and R. Ragno, “Predicting clicks:estimating the click-through rate for new ads,” in the 16th internationalconference on World Wide Web, 2007, pp. 521–530.
[5] D. Chakrabarti, D. Agarwal, and V. Josifovski, “Contextual advertisingby combining relevance with click feedback,” in the 17th internationalconference on World Wide Web, 2008, pp. 417–426.
[6] W. Zhang, T. Du, and J. Wang, “Deep learning over multi-field categor-ical data,” in European conference on information retrieval, 2016, pp.45–57.
[7] S. Rendle, “Factorization machines,” in 2010 IEEE International Con-ference on Data Mining, 2010, pp. 995–1000.

[8] H. Guo, R. TANG, Y. Ye, Z. Li, and X. He, “Deepfm: A factorization-machine based neural network for ctr prediction,” in the Twenty-SixthInternational Joint Conference on Artificial Intelligence, IJCAI-17, 2017,pp. 1725–1731.
[9] J. Lian, X. Zhou, F. Zhang, Z. Chen, X. Xie, and G. Sun, “Xdeepfm:Combining explicit and implicit feature interactions for recommendersystems,” in the 24th ACM SIGKDD International Conference onKnowledge Discovery & Data Mining, 2018, pp. 1754–1763.
[10] J. Chen, B. Sun, H. Li, H. Lu, and X.-S. Hua, “Deep ctr predictionin display advertising,” in the 24th ACM international conference onMultimedia, 2016, pp. 811–820.
[11] A. Vaswani, N. Shazeer, N. Parmar, J. Uszkoreit, L. Jones, A. N. Gomez,L. Kaiser, and I. Polosukhin, “Attention is all you need,” CoRR, vol.abs/1706.03762, 2017.
[12] S. Nakamura, T. Kawahara, and T. Yamasaki, “Prediction of tv advertis-ing video effects by multimodal processing with cnn (in japanese),” inthe Institute of Electronics, Information and Communication Engineerstechnical report, vol. 118, no. 211, 2018, pp. 31–35.
[13] K. He, X. Zhang, S. Ren, and J. Sun, “Deep residual learning for imagerecognition,” CoRR, vol. abs/1512.03385, 2015.
[14] J. Deng, W. Dong, R. Socher, L.-J. Li, K. Li, and L. Fei-Fei, “ImageNet:A Large-Scale Hierarchical Image Database,” in the IEEE conference oncomputer vision and pattern recognition, 2009.
[15] S. Ioffe and C. Szegedy, “Batch normalization: Accelerating deepnetwork training by reducing internal covariate shift,” CoRR, vol.abs/1502.03167, 2015.
[16] J. H. Lau and T. Baldwin, “An empirical evaluation of doc2vec withpractical insights into document embedding generation,” arXiv preprintarXiv:1607.05368, 2016.
[17] R. Rehurek and P. Sojk, “Software framework for topic modelling withlarge corpora,” in the LREC 2010 Workshop on New Challenges for NLPFrameworks, 2010, pp. 45–50.
[18] P. Baldi and P. J. Sadowski, “Understanding dropout,” in Advances inNeural Information Processing Systems 26, 2013, pp. 2814–2822.