Embed Size (px)
Citation preview
1
This article was published in Journal of Applied Polymer Science, 131 (8), Article
number 40148, 2014
http://dx.doi.org/10.1002/app.40148
Preparation and Characterization of Crosslinked PVAL
Membranes Loaded with Boehmite Nanoparticles for
Fuel Cell Applications
Paula Nunes Oliveira,1 Margarida Catarino,2 Carmem Maria Oliveira Mu€ller,1
Lu'cia Branda~o,2 David Alfredo Pacheco Tanaka,2 Jose' Roberto Bertolino,1
Ade'lio M. Mendes,2 Alfredo Tibu'rcio N. Pires1
1Grupo de Estudo em Materiais Polime'ricos, POLIMAT, UFSC, Floriano'polis, Santa
Catarina, Brazil
2LEPAE, DEQ, Universdade do Porto, Faculdade de Engenharia, Portugal
Correspondence to: P. N. Oliveira (Email: [email protected])
ABSTRACT: Composite proton conducting membranes were prepared by doping the membrane,
prepared by crosslinking poly(vinyl alcohol) with sulfosuccinic acid (SSA), with boehmite
[aluminum oxyhydroxide or c-AlO(OH)]. The effect of the SSA and boehmite content on the
membrane performance was studied and the results showed that the values for the ion exchange
capacity (IEC) of the membranes were in the range of 0.45–4.80 mmol g-1, the water content and
the Young’s modulus were dependent on the amount of SSA and nanoparticles. The proton
conductivity was in the range of 10-4 to 10-2 S cm-1 at 25oC and was directly related to the
quantity of sulfonate groups present in the membrane, while the hydrogen permeability at 30oC was
in the range of 10-13 to 10-12 mol cm s-1 cm-2 bar. The proton exchange membrane fuel cell tests
indicated that the composite membranes have good proton conductivity and very low hydrogen
permeability. © 2013 Wiley Periodicals, Inc. J. Appl. Polym. Sci. 2014, 131, 40148.
INTRODUCTION
Fuel cells are one of the clean alternatives to fossil fuels, which have the potential to produce
energy with low emissions and high efficiency. They convert directly the chemical energy of a
fuel into electrical power. When the fuel is hydrogen, the products generated are water, heat, and
energy. PEMFC can be used in power generation systems for on-site electricity generation, in
transportation and in portable devices such as cell phones and computers, offering an attractive
balance between energy storage and volume size.
The proton-conducting membrane is the “heart” of the fuel cell, and must fulfil several
requirements simultaneously, that is: high proton conductivity with electrical isolation, adequate
mechanical, thermal, and chemical stability, and low fuel permeability. The most commonly
2
used membrane is a perfluorinated membrane, Nafion, developed by DuPont.1,2 However,
Nafion membranes present some limitations relating to this application, such as low ionic
conductivity at low humidity, susceptibility to degrade at high temperatures and high cost.3
Several membranes have been evaluated as alternatives to Nafion membranes for PEMFC
applications. Progress have been achieved with membranes prepared from modified aromatic
polymers such as sulfonate poly(arylene ether sulfone),4 sulfonate poly (ether ether ketone),5–7
and sulfonate poly(arylene ether ketone).8,9 Experiments have also been performed using cheap
polymers such as polystyrene ethylene butylene polystyrene (PSEBS),10 and poly(vinyl alcohol)
(PVAL),11,12 which can be converted to sulfonated polymers. Some basic polymers such as
poly(2,5-benzimidazole) (ABPBI)13 and polybenzimidazole (PBI)14 have also been tested.
Among the aforementioned polymers, PVAL is a polymer that presents a high affinity for water and
has been studied as a mem- brane because it offers good film-forming and chemical-resistance
properties.15,16 The high density of AOH functional groups in the polymer chain confers hydrophilic
properties and selectivity, that can be improved through modification of the polymer chemical
structure by crosslinking, grafting, etc. One agent that can be used for the modification of the
polymeric chain through the inclusion of acid groups is sulfosuccinic acid, which besides having
two carboxylic acid groups also has a sulfonic acid group. Rhim et al. prepared membranes by
crosslinking of PVAL with SSA and observed proton conductivity values in the range of 10-3
to 10-2 S cm-1.11 However, the membranes formed by PVAL modified with SSA presented
a relatively low working temperature (at around 80oC) due to the dependence on water to protons
transportation (similar to Nafion).
A great number of alternative strategies have been investigated for the development of proton
conducting membranes in dehydrating environments, i.e., elevated temperatures and reduced
relative humidity, such as hybrid organic–inorganic membranes. These composite membranes
are characterized by the incorporation on a nanometric scale of inorganic (fillers),17 in which
the filler-polymer interaction can range from strong (covalent and ionic) bonds to weak
physical interactions. The addition of an inorganic material in the polymeric membrane often
improves the chemical and mechanical stability and retains the water at higher temperatures thus
increasing the membrane working temperature.18,19 Many inorganic fillers have been studied:
TiO2,20,21 ZrO2,18,22 Zr(HPO4)2.nH2O (ZrP),23,24 zirconium phosphate-sulfo
phenylene phosphonates,25 SiO2,26 and so forth.
The results reported in the literature confirm that these fillers are indeed effective in improving
in the thermal stability of the composite membranes, increasing the water retention at higher
temperatures and improving the mechanical properties.27 The inclusion of nanoparticles of SiO2
in PVAL/SSA membranes was studied by Kim et al., who observed a reduction of free water
ratio due to the presence of silica particles.26
Boehmite and diaspore are the two mineralogical forms of alumina monohydrate (Al2O3.H2O)
or aluminum oxyhydroxide (AlO(OH)) and are the most abundant constituents of bauxite. In
many cases, boehmite (c-AlO(OH)) is the starting material in the synthesis of alumina
3
phases.28,29 These particles with high anisotropy can account for the additional improvement
in the mechanical properties of polymers.30,31 Some examples about incorporation of boehmite
into polymers in order to obtain composite materials can be found in literature. The
inclusion of colloidal boehmite rods in the polyeamine-6 was studied by O€ zdilek et al., and a
mechanical reinforcement of the matrix was verified,31 as well as in the boehmite–based polyeth-
ylene nanocomposites prepared in situ polymerization of ethylene in the boehmite presence.32
On the other hand, the boehmite can also be applied to improve the thermal and the
combustion properties, as shown by Monti and Camino, who reported a significant flame
retardant effect of the nanosize boehmite particles in polyethersulfone (PES).33 Zhang et al.
showed an improvement on the thermal stability and flame retardant properties of the
poly(ethylene terephtalate) (PET) with incorporation of nanoboehmite.34
In this article, the chemical and physical properties of PVAL/ SSA membranes, loaded or not
with c-AlO(OH) or boehmite, were assessed and compared and the membranes loaded with
boehmite, which showed the best properties to application as PEM had their performance
evaluated in a fuel cell.
EXPERIMENTAL
Materials
Poly(vinyl alcohol) (PVAL) (99% hydrolyzed with molecular weight of 89,000 to 98,000 g mol-1)
and sulfosuccinic acid (SSA, 70% aqueous solution) were supplied by Sigma Aldrich Chemical
Co. Boehmite sol nanoparticles (10 wt % aqueous solution) with a size of 10 nm were provided
by Kawaken Fine Chemicals. The products used to develop this study were not purified before
usage.
Membrane Preparation
Aqueous 10 wt % PVAL solutions were prepared by dissolving dry PVAL in water and adding
the SSA to the PVAL solution according to the quantities specified in Table I. The solution was
stirred for 24 h and casted on a polystyrene plate at room temperature and a homogeneous
membrane was obtained after solvent evaporation. The membrane was maintained at 90oC for
1.5 h to promote the crosslinking reaction. For the preparation of composite membranes
nanoparticles of boehmite (5 and 10 wt % relative to the polymer mass) were inserted into PVAL
aqueous solution. After 2 h stirring, SSA was added and the membranes were obtained by casting
and submitted to the thermal treatment to promote the crosslinking reaction as described above,
and afterwards the membranes were evaluated without additional treatment.
Characterization
The membranes were supported in silicon wafers and analyzed by Fourier transform infrared
(FTIR) spectrometry, using a Nicolet Magna IR 860 Instrument (Thermo Nicolet, Madison, WI)
operating within a range of 4000–400 cm-1, at a 2 cm-1 spectral resolution by transmission
mode. The SSA spectrum was obtained from aqueous solution (70% w/v).
4
The thermal stability of the membranes was evaluated using a thermogravimetric analyzer
(TGA) (TGA50-Shimatzu). A constant temperature ramp rate of 10oC min-1 from room
temperature up to 700oC under N2 flow was applied. Before the analysis the membranes were
maintained under vacuum for 24 h.
The TG analysis coupled with infrared spectroscopy was carried out using a TGA from Netzsch
(model STA 449 F1 Jupiter) and a FTIR from Bruker (model TENSOR 27). Initially, the samples
were maintained under vacuum for 24 h at room temperature. Then, the samples were submitted to
a 10oC min-1 constant temperature heating rate from 40oC up to 700oC under N2 flow of 20
mL min-1. The gases generated during the heating were taken to FTIR by nitrogen stream and
the spectroscopic analysis performed every 2 min.
Differential scanning calorimetry (DSC) measurements were performed using a DSC (TA-50
Shimatzu) equipped with a cooling apparatus to determine the free water content of fully hydrated
membranes. After cooling the sample with liquid nitrogen, the experiment began by heating the
sample from -80oC to 30oC using a 5oC min-1 heating rate. Nitrogen gas was used as the
carrier gas at a flow rate of 50 mL min-1. The crystallization and melting temperatures of freezable
water adsorbed in the sample were determined from the temperature at the maximum point
of the corresponding enthalpy peaks.
The freezable water mass (Wc) was obtained through eq. (1):
where H is the melting enthalpy of freezable water, assumed to be same of the bulk water (H
=333.5 J g-1), and q is the heat absorbed during the melting process. The q value was calculated
using the area under the endothermic peak. The procedure to determine the amount of freezable
water does not take into account the differences in the melting enthalpies of the different crystal
structures of ice and thus the maximum relative error computing the freezable water is 6.6%.35 The
mass of nonfreezable bound water was obtained from the difference between the mass of absorbed
water and the total absorbed free water in the membrane.
The dynamic mechanical analysis was performed using a DMA Q800-TA. Initially, the
membranes of PVAL/SSA loaded and unloaded nanoparticles, 0.53 mm wide, were equilibrated
at 100% relative humidity for 24 h. For the test strain deformation, samples were kept at 50oC
for 2 min and then submitted to 0.01 N s-1 rate strength, in which the maximum force applied
was 18 N. The Young’s modulus was computed based on the average strain and stress values
obtained from three determinations for each membrane formulation.
Water Uptake
The water uptake was determined gravimetrically and the mem- branes were previously-dried,
weighed (Wdry) and immersed in water at room temperature. After 24 h, the membranes were
taken out, the solvent on the surface was quickly removed and weighted (Wwet). The water
5
uptake per sample gram was calculated by mass difference between wet and dried membranes
(Wwet - Wdry) and normalized per gram of dried membranes.
Ion Exchange Capacity (IEC)
The IEC of the membranes was determined through acid–base titration. The dry membrane was
immersed in 20 mL of saturated sodium chloride aqueous solution for 24 h in order to exchange
protons for sodium ions. The acid released was subsequently titrated using a 0.01 mol L-1 sodium
hydroxide solution and phenolphthalein as the indicator. IEC was calculated using eq. (2):
where M is the concentration of the titrant (mol L-1), V is the added volume of titrant at the
equivalent point (mL), and Wdry is the dry mass of the sample (g).
Conductivity
The conductivity was measured by AC electrochemical impedance spectroscopy in the frequency
range of 1–500 kHz with signal amplitude of 5 mV and derived from the high frequency
intercept of the complex impedance with the real axis, using a two-electrode arrangement.
Measurements were performed under 100% relative humidity at 25oC.
The impedance measurements were carried out using a Zahner IM6 electrochemical workstation.
The proton conductivity (r) was obtained using the following eq. (3):
where is the proton conductivity (S cm-1), l is the distance between the electrodes (thickness
of membrane, cm), R is the impedance of membrane (), and S is the surface area required for
a proton to penetrate the membrane (electrode area) (cm2).
Gas Permeation Measurements
The membrane permeation to hydrogen was determined by the time lag method and the
experimental set-up used is described in detail in Ref. 36. The experiments were performed at
30oC and 75% relative humidity and prior to the test, the membranes were equilibrated with
water at 75% relative humidity, for 12 h. The membranes denoted by #4, #5, and #6, loaded and
unloaded with boehmite nanoparticles, had shown good results in the proton conductivity tests
and had their gas permeation properties evaluated.
6
PEMFC Tests
The modified PVAL membranes were sandwiched between Toray carbon papers loaded with
catalyst with an effective area of 5 cm2, using a Pt loading of 0.5 mgPt cm-2 (10 wt % Pt/Vul-
can, Electrochem S.A) at the anode and cathode. The PEMFC using with these membranes was
operated at 50oC with a feed flow rate of 200 mL min-1 of hydrogen at 1 bar and 100% relative
humidity, and 400 mL min-1 of air at 1 bar and 90% relative humidity. The PEMFC tests using
reference Nafion 115 membrane were operated under identical conditions. Fuel cells were
characterized by electrochemical impedance spectroscopy (EIS) and polarization curves.
RESULTS AND DISCUSSION
FTIR Spectroscopy
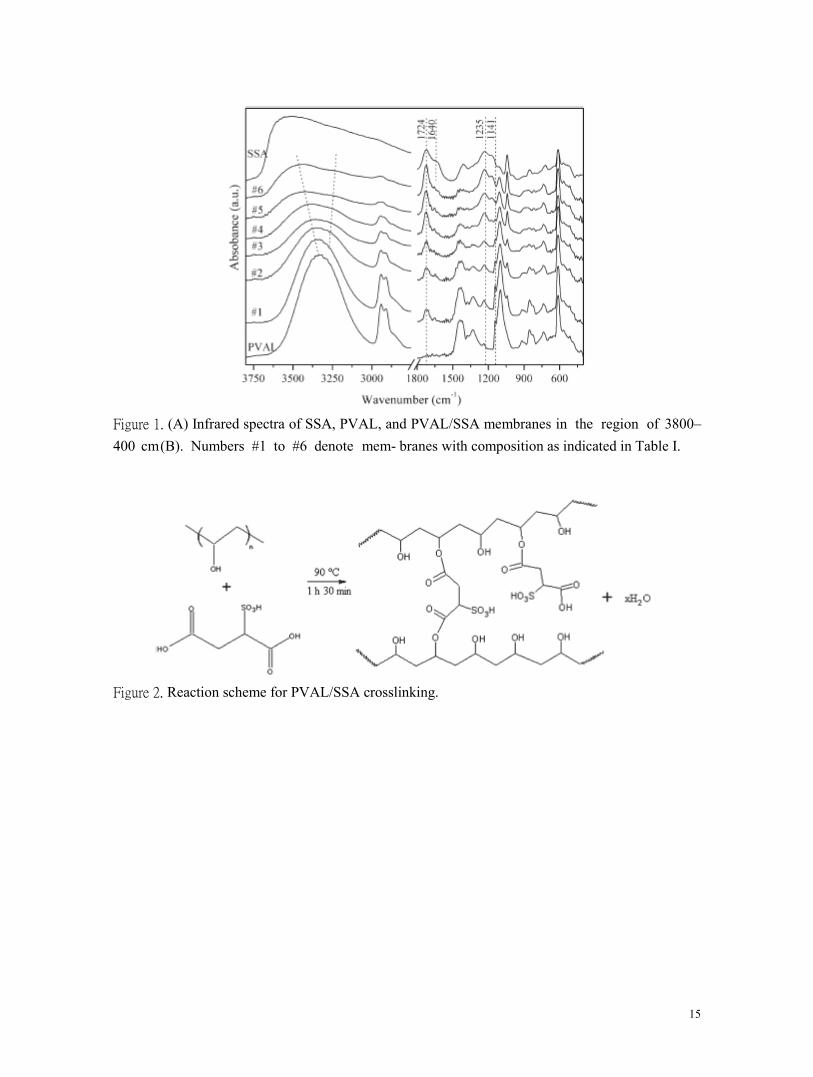
Figure 1 shows the infrared spectra for the PVAL membrane, SSA and PVAL/SSA membranes
in the regions of 3800–2750 cm-1 and 1800–400 cm-1. The PVAL membrane absorption
spectrum shows the characteristic broad absorption bands at 3330 cm-1 (-OH stretching), at
2940 cm-1 (-CH2 stretching), at 1433 cm-1 (C-H deformation) and at 1096 cm-1 (C-O
stretching).12,37 The absorption spectrum of SSA aqueous solution (70% w/v) exhibits a wider
absorption band in the region of 3200–3600 cm-1 related to the OAH stretching vibration in
-SO3H, COOH and free water.38 The absorption band observed at 1632 cm-1 is due to the -
OH angular deformation mode from the water molecules bonded with the –SO3 - group.39
The carboxylic stretching centered at 1724 cm-1 (COOH), the asymmetric O=S-O
stretching at 1167 cm-1, the symmetric S-O stretching at 1041 cm-1 and at 860 cm-1 and
the -CH2- and C-H stretching at 2800–2900 cm-1 and 1300– 1500 cm-1, respectively are also
visible in the spectrum of SSA.11
Intramolecular and intermolecular hydrogen bonding occur between PVAL chains due to high
hydrophilic forces. The intensity of the absorption band at 1141 cm-1 in the PVAL is related with
the polymeric chain crystalline portion. This band has been used as a tool to assess the PVAL
structure, as it is a semi- crystalline synthetic polymer able to form different domains depending
on several process parameters. Figure 1 shows that the intensity of band at 1141 cm-1 decreases
as the sulfosuccinic acid content is increased in the membranes composition. The crystalline
portion is dependent on the number of AOH groups from the PVAL precursor that decreases as
esterification reaction progresses.40,41 A esterification reaction scheme between the hydroxyl
group of PVAL and the carboxyl group of sulfosuccinic acid is shown in Figure 2.
Large bands are observed between 3550 and 3200 cm-1 on the infrared spectra of the PVAL/SSA
membranes (Figure 1). These are linked to the O-H stretching of the water molecules attached to
the ionic domains and to the polar sites in the polymer. In this case is difficult to establish a direct
correlation between the bands intensity due to overlapping. However, with an increase in the
membrane SSA amount the wave number of the O-H stretching vibration shifts to a higher wave
number (ca. 3400 cm-1). This observation suggests that the hydrogen bonding between
7
the -OH groups of PVAL shifted due to a decrease in the intramolecular interactions and also a
new absorption component, which appears at higher wave numbers. It should be noted that the
esterification reaction also decreases the number of free -OH groups in the PVAL and
consequently the intensity of bands related with this group decreases.36
The absorption bands relative to boehmite (-AlO(OH)) overlap the sulfosuccinic acid bands in the
region of 1500–1300 cm-1 and with the symmetric -CH2 stretching at 2800–2900 cm-1. The
interaction between the PVAL and nanoparticles probably occurs by ionic interaction between the
hydroxyl group from the PVAL and the -OH sites of the -AlO(OH). This interaction can cause
significant changes in the dipole moment of AOH and ACO groups in the PVAL and consequently
the intensity and the wave number of the absorption bands may change. Absorption band intensity
can be influenced by the esterification reaction, which decreases the free -OH groups in the PVAL,
and consequently decreases the bands intensity related with this group.40 These characteristics
related with absorption bands and relative intensity at 3000–3600 cm-1 spectra range were
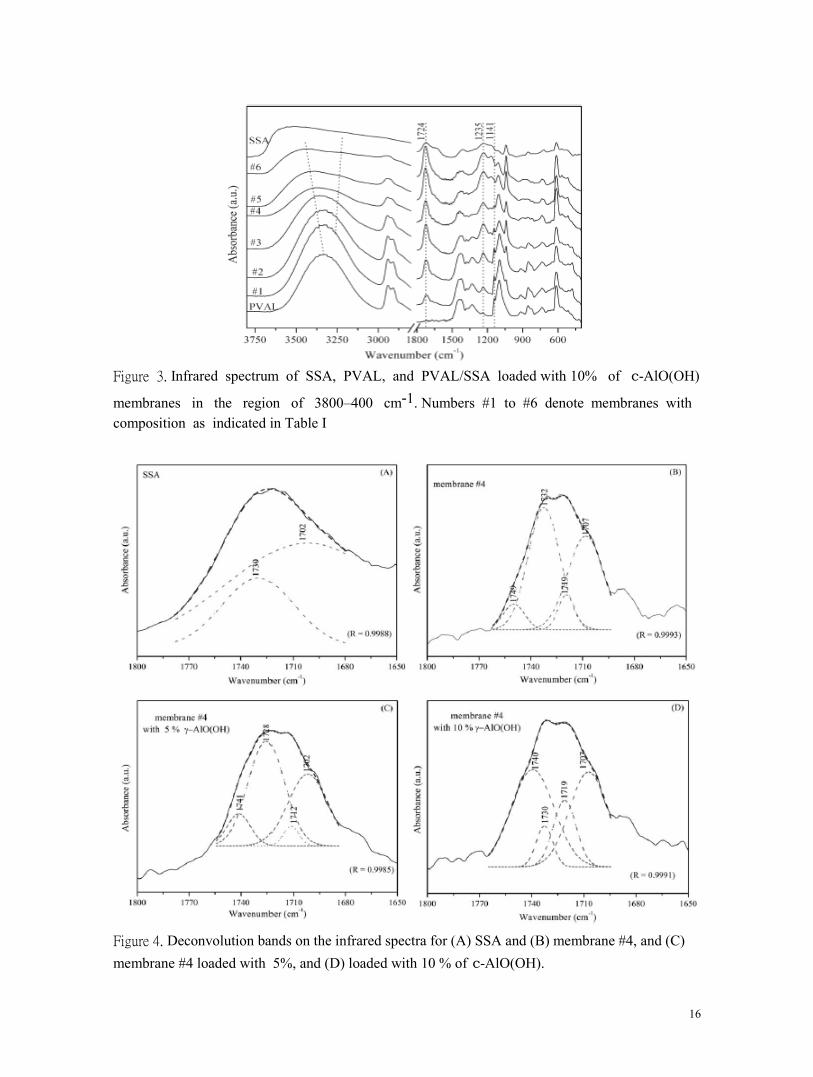
observed in Figure 3.
In the spectrum of the SSA, two carboxylic groups contribute to the band centered at 1724 cm-1.
With the increasing of SSA amount, new contributions from the carboxylic groups appear at
higher wave numbers, evidencing the formation of crosslinking between PVAL and SSA. Figure
4 shows the spectra deconvolution of the 1770–1680 cm-1 wave number range for SSA and of
the 1765–1695 cm-1 wave number range for membrane #4, membrane #4 loaded with 5%, and
loaded with 10% of boehmite. The deconvolution indicates that different carboxylic groups
contribute to the absorption bands in these regions. The absorption bands at the higher wave
number for membranes #4 are attributed to the carboxylic group with the weakest association
with water molecules (i.e., the carboxylic group from the ester). On the other hand, bands at the
lower wave numbers are attributed to the carboxylic group associated with water molecules. The
bands deconvolution analysis was performed to all membranes and showed four bands in all
cases, being this an indicative that a partial crosslinking reaction occurred.
The absorption band characteristic of the ester group (CAO stretching at 1235 cm-1) for
PVAL/SSA membranes loaded with boehmite can be observed in Figure 3. The changes in the
infra- red spectra suggest that the crosslinking reaction occurred between the hydroxyl groups of
the PVAL and the carboxylic groups of the SSA and that the nanoparticles presence did not
interfere in the reaction between PVAL and SSA. The relative intensity of these characteristic
bands increases as the content of sulfosuccinic acid increases. Although this provided clear
evidence of crosslinking, it is difficult to know correctly the cross- linking degree using FTIR
spectrometry; thus other characterization techniques were performed and are discussed below.
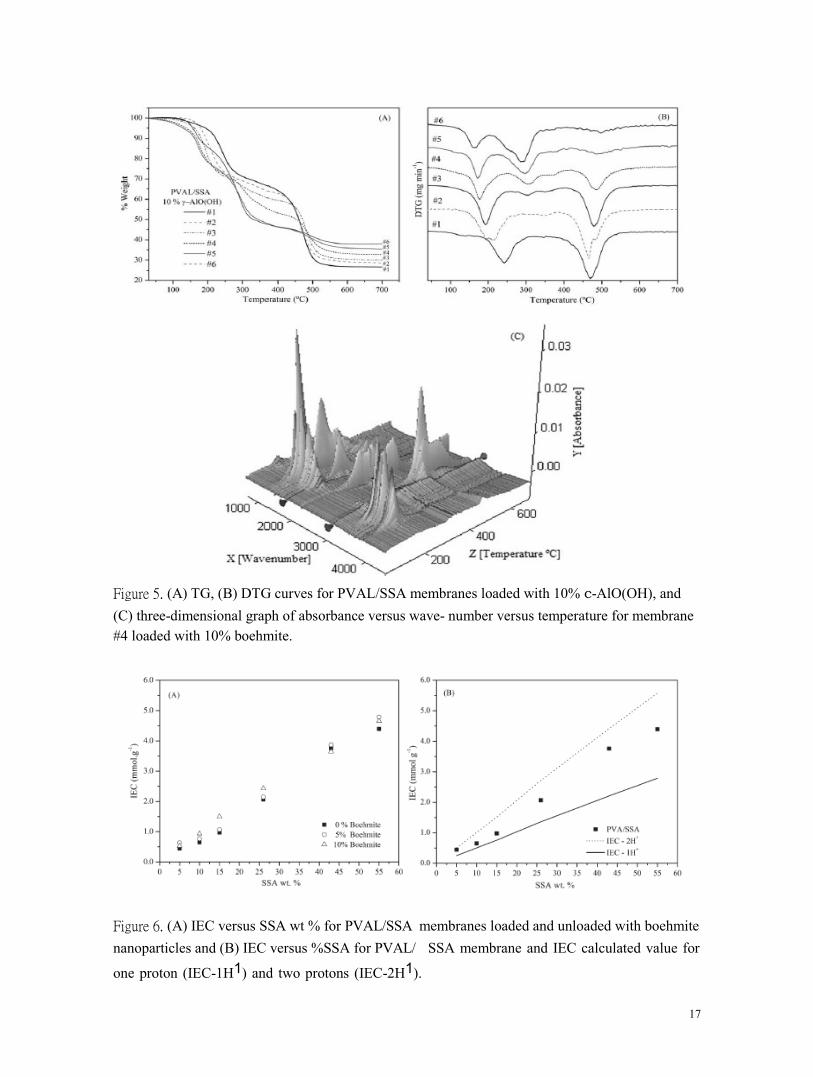
Thermal Analysis
The thermal stability of crosslinked PVAL/SSA membranes loaded or unloaded with boehmite
nanoparticles was investigated by TGA. The thermogravimetric curves of the three types of
membranes presented the same profile, with different residual mass amount because of SSA and
to inorganic material content. The thermogravimetric curves in Figure 5(A) show that mem-
branes have three main degradation stages, as observed in the DTG curves [Figure 5(B)]. These
8
thermogravimetric curves showed the same characteristics for similar systems found in the Ref.
11, 42, in which the weight loss at around 200oC is mostly attributable to the adsorbed water
loss. The second (at around 300oC) and the third (at around 480oC) weight losses are related
to the degradation membrane components. The weight losses in these two steps are directly
associated with the SSA amount in the membrane. A rise in SSA content causes increased
weight loss at around 300oC, and consequently a reduction of the weight loss at around
480oC, and it can be observed clearly in the DTG curves. The remaining contents, upon reaching
700oC increased with increasing SSA content. These thermal analysis allowed to observe that
the membranes loaded with nanoparticules are as thermally stable as the unloaded ones.
Through TG analyser coupled with an infrared spectrometer were obtained the PVAL/SSA
membrane #4 loaded with 10% boehmite spectra, which are shown in Figure 5(C). The mem-
brane analyzed presented a first weight loss at around 200oC, corresponding to absorption bands
of AOH stretching at 3200– 3400 cm-1 and OAH angular deformation at 1620–1640 cm-1, both
related to free water molecules. At 300oC the absorption bands at 1000–1240 cm-1 are related
to symmetric and asymmetric stretching of -SO3H group. At the same temperature, the
absorption band at 2300–2400 cm-1 indicates the presence of CO2, which can be the result of
SSA decomposition and polymer degradation. Above 450oC, the absorption bands in the
spectrum at 3000–2900 cm-1 are related to carbon and hydrogen stretching and bands with
low absorption between 1000 and 1200 cm-1 are related to O=S-O stretching11,38 resulting
from the membrane decomposition. This analysis indicates that membranes are thermally stable
up to 200oC, corroborating with TGA data and that the presence of nanoparticles did not change
the membrane thermal stability.
Water Uptake Tests and Mechanical Properties
Water uptake is an important property to proton conductivity, since it is strongly dependent on the
membrane water content. Membrane hydrophilicity increases with SSA content because of the
presence of a sulfonic acid group, whereas crosslinking also increases with SSA content limiting the
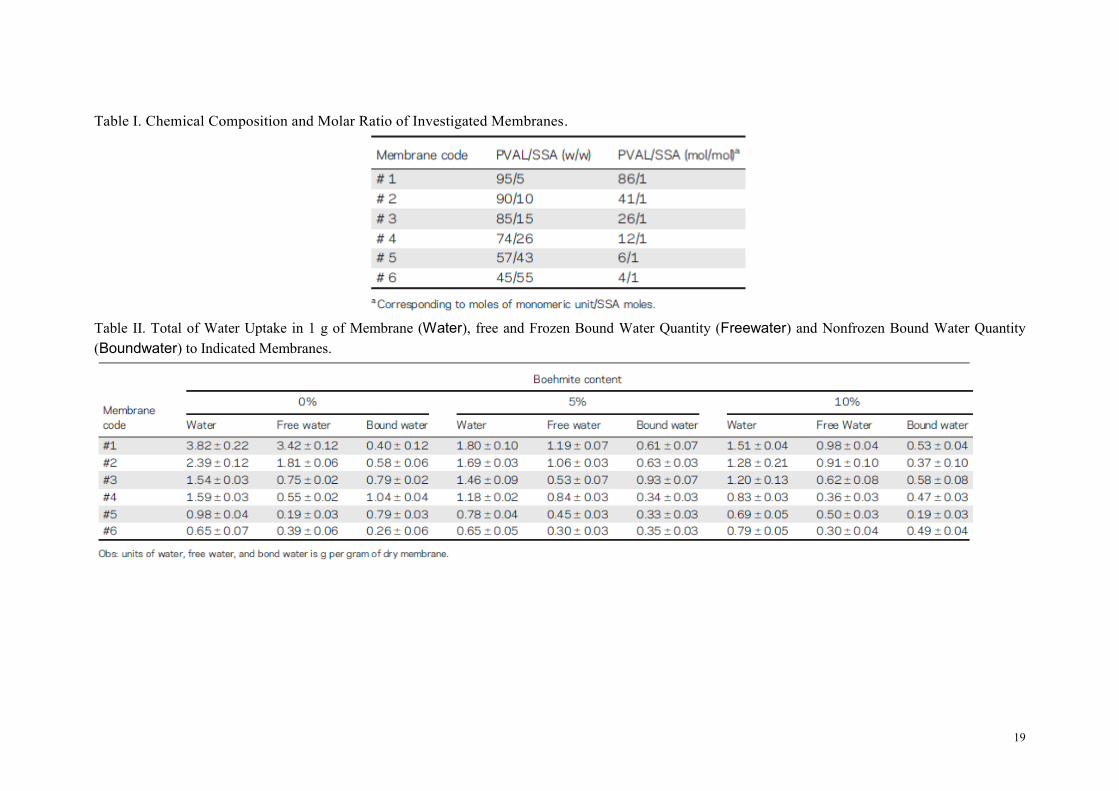
membrane water swelling.11,38 Experimentally, the water uptake decreases as the SSA content
was increased (Table II), indicating that the crosslinking is the dominant effect. The presence of
nanoparticles can con- tribute to improving the mechanical and chemical properties of the
membranes preventing excessive swelling. The water uptake of unloaded PVAL/SSA
membranes is higher as compared to boehmite-loaded PVAL/SSA membranes and the water
uptake decreases as the boehmite load increases in the membranes. This effect is probably
related to the interaction between the hydroxyl groups of the PVAL and nanoparticles, which
reduces the free volume required for water sorption.
A detailed water state analysis in the prepared membranes is necessary to better understand some
membrane properties, as sorption, diffusion, permeation, and transport properties. The absorbed
water in hydrophilic polymers has some thermodynamic properties that allows classify it as free
water, frozen bound water, and nonfrozen bound water.35,42 Free water has the same phase
9
transition temperature as bulk water (0oC) and is not intimately bound to the polymer chain.
Frozen bound water has a phase transition temperature lower than 0oC and is slightly bound to
the polymer or interacts weakly with nonfrozen bound water. Nonfrozen bound water has no
detectable phase transition in the temperature range of -80oC to 0oC, and arises from a strong
interaction with the polymer chain.35
The nonfrozen bound water volume is typically dependent on ionic groups polarity contained in
the polymer chain and its contents can influence directly the membranes transport proper- ties.
Kim et al. showed that the water state is correlated with the proton conductivity, methanol
permeability, and electro-osmotic drag of proton exchange membranes. By reducing the frozen
bound and free water content of the poly(arylene ether sulfone)- based copolymers, they were
able to reduce the water osmotic drag and methanol permeability of the corresponding mem-
branes. Such attractive membrane characteristics were observed at membranes low water
contents as compared to Nafion.43
Hwang et al. investigated prepared membranes using PVAL grafted with 4-formyl-1,3-
benzenedisulfonic acid disodium salt and identified a special microstructural feature without phase
separation that enabled an appreciable free water reduction, being the presence of polar groups in
the polymer chain allowed by large nonfrozen water sorption in the membranes. The large nonfrozen
bound water sorption was the main reason for the attractive DMFC membrane characteristics and a
detailed analysis of the water state revealed that the connected system of narrow water channels
permitted a low methanol permeation with high mobility of protonic charge carriers.42 In this
study, the quantity of nonfrozen bound water in the membranes PVAL/SSA loaded and unloaded
with boehmite nanoparticles was determined using DSC measurements and the results are shown
in Table II.
The data in the Table II show that the content of free water and nonfrozen bound water in the
membranes is dependent on the SSA content. In most cases two ice melting peaks were observed
in the DSC curves, being at the lower temperature associated with frozen water bound to polar
and ionic groups and at 0oC associated free water or freezable water, both were accounted for as
free water and the value is shown in the Table II. The non- frozen bound water amount inside the
membranes increases with the increasing of SSA in the membranes, because of the insertion of
high polarity groups (i.e., -SO3H) in the polymer chain. On the other hand, the crosslinking
reaction of mem- branes #4 to #6 decreases the free hydroxyl groups from PVAL, increasing the
polymer rigidity and consequently decreasing the nonfrozen bound water content in the
membranes.
In the membranes loaded with boehmite nanoparticles the fraction of nonfrozen bound water in
the most instances was higher than in the unloaded membranes, probably due to the presence of
nonfrozen water adsorbed in the boehmite nanoparticles. However, from the membranes #3 can
be observed a decreasing in the nonfrozen bound water quantity, which may be explained by the
increasing of the crosslinking reaction degree with consequent increasing of the polymer rigidity.
And also by an interaction between nanoparticles and polymer chain resulting in the decreasing
of the polymer free volume, being this effect more pronounced on the membranes loaded with
5% of boehmite nanoparticles. The water uptake tests allowed to observe that the nanoparticles
presence inside the membranes prevented membranes swelling; on the other hand, the presence
10
of higher quantity of nonfrozen bound water in the membranes loaded with boehmite
nanoparticles can improve the transport properties through the membrane.
The mechanical properties of the membranes were evaluated by DMA equipment, and was
determined the modulus of elasticity or Young’s modulus, that enabled to verify the materials
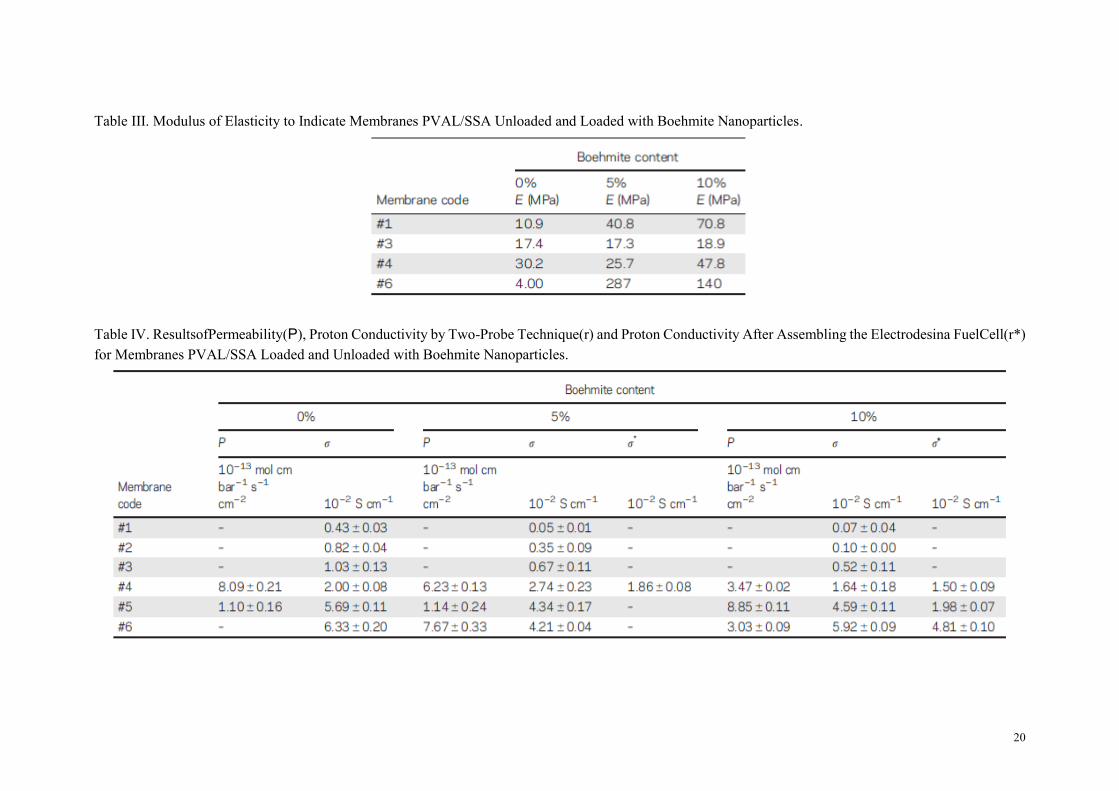
stiff- ness. Table III shows the Young’s modulus of the PVAL/SSA membranes unloaded and
loaded with boehmite nanoparticles. The Young’s modulus values of the membranes without
boehmite increased with the raise of SSA concentration. Probably, the augmentation of acid
concentration induces the formation of greater crosslinking, requiring higher tension to cause the
same deformation in the membrane and indicating higher stiffness. In most cases, water
molecules in the polymers behave as plasticizers, facilitating the movement between chains. In
this case, it is suggested that the lower water absorption, with increasing of the acid
concentration, also contributes to increase the membrane stiffness.
Table III shows that the membranes mechanical properties improved with the nanoparticles
loading. In most cases, the PVAL/SSA membranes loaded with boehmite presented greater
Young’s modulus than the ones unloaded and this effect is probably due to interactions between
boehmite nanoparticles and the functional groups of the polymer and the SSA that make the
polymer chains more rigid. The low water absorption in the membranes loaded with
nanoparticles may also have contributed to their self high value of Young’s modulus. All
membranes #6 exhibited a different behavior from the other membranes; however, the presence
of the nanoparticles in the membrane composition resulted in the increasing of the Young’s
modulus. On the other hand, the membranes #6 deformation loaded with nanoparticles under
tension is too small breaking after a short time, indicating fragility.
Ion Exchange Capacity
The IEC indicates the density of ionizable hydrophilic groups in the membrane polymer matrix
that are responsible for the ionic conductivity of the membrane. The IEC values increase [Figure
6(A)] with the SSA content in the polymer chain. This is because the SSA contains a fixed
sulfonic acid group. Figure 6(B) shows the calculated IEC values required for the neutralization
of one and two protons of the SSA and the experimental IEC values obtained for the different
membranes. The results suggest that there is not a complete crosslinking between the SSA
molecules and the PVAL polymer. The presence of unreacted carboxylic acid groups from the
SSA contributes to a high IEC and thus the IEC values are higher than expected and it may be
an indicative of high protonic conductivity. The IEC values corroborate with FTIR and indicate
that a partial cross- linking between PVAL and SSA had occurred. The crosslinking control was
done through heat treatment, 90oC for 1.5 h, to which membranes were submitted to during
the preparation procedure.
Proton Conductivity
Table IV shows the proton conductivity data (r), obtained by the two-probe technique of the
unloaded and boehmite-loaded PVAL/SSA membranes at 25oC. Proton conductivities are in the
range of 5 x 10⁻⁴ S cm-1 to 6 x 10⁻² S cm-1. The water content in membranes to operate at low
PEMFC temperature (below 90oC) is of relevance to infer the proton conductivity. However,
11
the overall effect observed in Table IV is that the pro- ton conductivity is mostly controlled by
the SSA presence, once the water represents about 70 wt % of membrane weigh (Table II) in
all cases; and added to it, the fuel cell experiments were performed at 100% relative humidity.
As mentioned before, higher SSA concentrations in the PVAL increase crosslinking and decrease
swelling, but higher sulfonic acid concentration and special microstructural features without
phase separation facilitate the proton conductivity. The addition of nanoparticles in membranes
with a moderate to high SSA concentration has a minor effect on the proton conductivity.
However, the presence of nanoparticles, which are not proton conductors, in the mem- branes
with low SSA concentrations, reduces the free volume for water uptake and impair the proton
mobility inside the membrane leading to lower proton conductivity values.
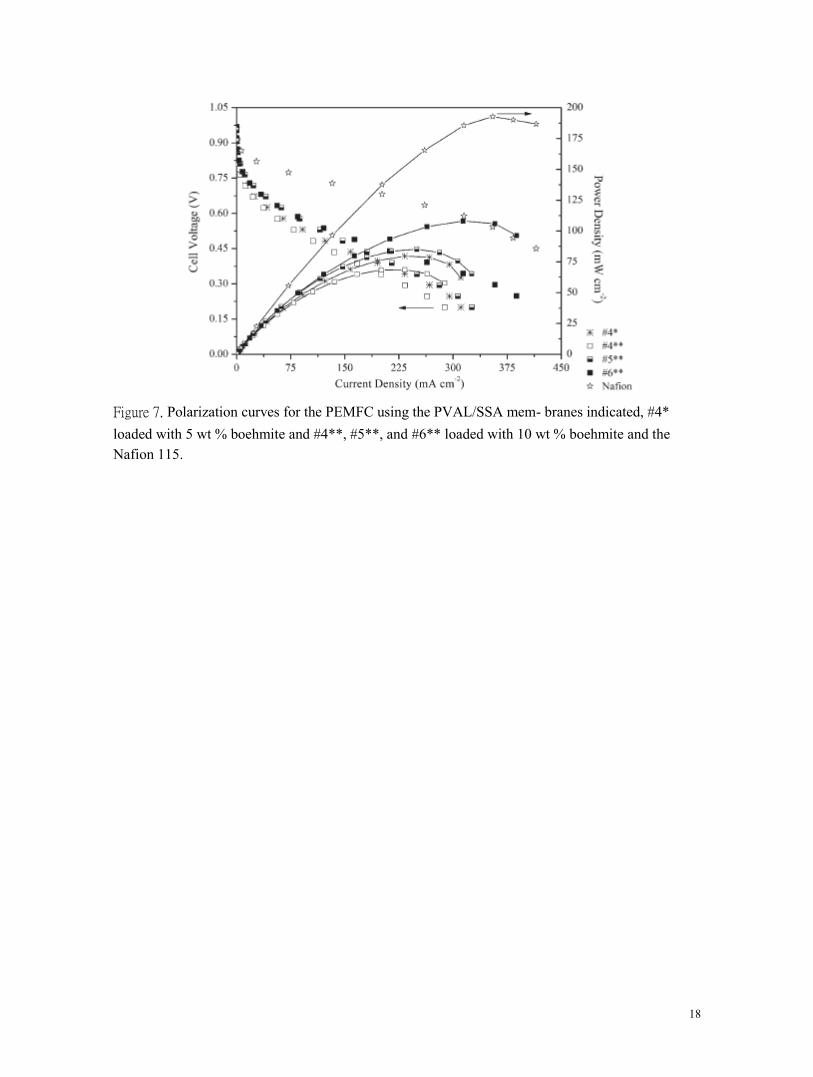
PEMFC Tests
The membranes that presented the highest proton conductivity values in the two-probe tests
(Table IV) were submitted to the fuel cell and permeability testing, being the fuel cell testing
performed only on the membranes loaded with boehmite nanoparticles. Only certain membranes
presented mechanical resistance when inserted in a fuel cell, corroborating with performance of
membranes in the mechanical resistance tests showed in the Table III. The proton conductivity
(*) for the prepared membranes, after assembling the electrodes, in a fuel cell and their
permeability to hydrogen (P) obtained using the time-lag method are shown in the Table IV. The
thicknesses of mem- branes tested in this study were: Nafion with 125 m; membrane #4 with
5% of boehmite 133 m; the membrane #4 with 10% of boehmite 101 m; the membrane #5
with 10% of boehmite 164 m and membrane #6 with 10% of boehmite 199 m. Proton
conductivity for all the membranes increased with SSA concentration. It can be observed proton
conductivity ranges between 1.5 3 10-2 S cm-1 and 4.8 x 10⁻² S cm-1; Nafion under the
same conditions has a proton conductivity of 5.7 x 10⁻² S cm-1. The proton conductivity of
these membranes were higher than other PVAL composite membranes related in the Refs. 26,
44. An increase in the nanoparticles load causes a small decrease in the proton conductivity,
according to the proton conductivity of membranes determined by two-probe technique shown
in Table IV. The hydrogen permeation results for membranes tested are slightly lower than
Nafion that has the hydrogen permeation of 833 x 10-12 mol cm bar-1 s-1 cm-2, and the
results are shown in the Table IV. It was observed a rise in the proton conductivity to membranes
that showed higher permeability to hydrogen and higher water uptake values.
Figure 7 shows that increasing the boehmite content above 5 wt % resulted in a decrease in the
PEMFC performance, which leads to a decrease in the maximum current density (310–289 mA
cm2) and power peak (80–69 mW cm2). The decrease in the PEMFC performance with the
increase in the boehmite load is probably related to the decreasing of the membrane proton
conductivity (Table IV). On the other hand, increasing the SSA content leads to a better
performance because the proton conductivity also increases.
Comparing the best performing membrane, membrane #6 loaded with 10 wt % of boehmite,
with Nafion 115 it can be concluded that Nafion exhibits a maximum power density about two
times greater than this membrane. This result can be explained by the slightly higher proton
conductivity (Table IV) and lower thickness of the Nafion membrane, about 125 mm, as
12
compared with 200 m of membrane #6 loaded with 10 wt % of boehmite. Although the
membranes have presented a lower performance and were more fragile than the Nafion
membrane, the results obtained were great and very promising for using as PEMFC, once low
cost materials were used to prepare the membranes. Further developments should target the
improvement of the mechanical properties of these membranes.
CONCLUSIONS
PVAL/SSA membranes unloaded and loaded with boehmite nanoparticles were prepared and
evaluated as PEMs for PEMFC applications. The results showed that PVAL/SSA loaded with
boehmite can be successfully used in fuel cells fueled with hydrogen. The membrane properties
were strongly dependent on the SSA content both as a crosslinking agent and as a donor of
hydrophilic SO3H groups. The proton conductivity values for the PVAL/SSA/boehmite
prepared membranes were in the range of 1.5 3 10-2 S cm-1 to 4.8 x 10⁻² S cm-1 and the
hydrogen permeability between 3.7 x 10⁻¹³ and 4.16 x 10⁻¹² mol cm bar-1 s-1 cm-2.
Both results are comparable with Nafion 115 membrane that exhibited proton conductivity
and hydrogen permeability of 5.7 x 10⁻² S cm-1 and 8.3 x 10⁻¹² mol cm bar-1 s-1,
respectively.
When inserted in a PEMFC the prepared membrane #6 loaded with 10 wt % of boehmite has
performed equivalently to Nafion 115, taking into consideration the membranes thickness ratio,
and showed to be very stable. PVAL/SSA membranes loaded with 10 wt % of boehmite indicated
to be a very promising material with attractive cost that should be further investigated, and that
should be addressed, especially to mechanical strength.
ACKNOWLEDGMENTS
Financial support received from CAPES and CNPq (Bazil), and Portuguese Foundation for Science
and Technology (FCT) through the projects PTDC/CTM/108454/2008 and PTDC/EQU
EQU/104217/2008 is acknowledged.
REFERENCES
1. Kreuer, K. D. J. Membrane Sci. 2001, 185, 29.
2. Bauer, F.; Denneler, S.; Willert-Porada, M. J. Polym. Sci. Polym. Phys. 2005, 43, 786.
3. Roziere, J.; Jones, D. J. Ann. Rev. Mater. Res. 2003, 33, 503.
4. Park, J.-Y.; Kim, T.-H.; Kim, H. J.; Choi, J.-H.; Hong, Y. T.
Int. J. Hydrogen Energy 2012, 37, 2603.
5. Conceic~ao, T. F.; Bertolino, J. R.; Barra, G. M. O.; Pires, A. T. N. Mater. Sci. Eng. C 2009,
29, 575.
6. Roeder, J.; Zucolotto, V.; Shishatskiy, S.; Bertolino, J. R.; Nunes, S. P.; Pires, A. T. N. J.
Membrane Sci. 2006, 279, 70.
7. Li, H.; Wu, J.; Zhao, C.; Zhang, G.; Zhang, Y.; Shao, K.; Xu, D.; Lin, H.; Han, M.; Na, H. Int.
13
J. Hydrogen Energy 2009, 34, 8622.
8. Lin, H.; Zhao, C.; Cui, Z.; Ma, W.; Fu, T.; Na, H.; Xing, W.
J. Power Sources 2009, 193, 507.
9. Park, K. T.; Chun, J. H.; Kim, S. G.; Chun, B.-H.; Kim, S.
H. Int. J. Hydrogen Energy 2011, 36, 1813.
10. Bhavani, P.; Sangeetha, D. Energy 2011, 36, 3360.
11. Rhim, J.-W.; Park, H. B.; Lee, C.-S.; Jun, J.-H.; Kim, D. S.; Lee, Y. M. J. Membrane Sci. 2004,
238, 143.
12. Tseng, C.-Y.; Ye, Y.-S.; Kao, K.-Y.; Joseph, J.; Shen, W.-C.; Rick, J.; Hwang, B.-J. Int. J.
Hydrogen Energy 2011, 36, 11936.
13. Asensio, J. A.; Go'mez-Romero, P. Fuel Cells 2005, 5, 336.
14. Li, Q.; Jensen, J. O.; Savinell, R. F.; Bjerrum, N. J. Prog. Polym. Sci. 2009, 34, 449.
15. Pivovar, B. S.; Wang, Y.; Cussler, E. L. J. Membrane Sci.
1999, 154, 155.
16. Rhim, J.-W.; Yeom, C.-K.; Kim, S.-W. J. Appl. Chem. 1998,
68, 1717.
17. Jones, D. J.; Roziere, J. Fundamentals, Technology and Appli- cations; In Handebook of Fuel
Cells; Gasteiger, H. A., Lamm, A., Vielstich, W., Yokokawa, H., Eds.; Wiley; Hardcover; 2003.
18. Navarra, M. A.; Croce, F.; Scrosati, B. J. Mater. Chem. 2007,
17, 3210.
19. Yang, C.-C.; Chien, W.-C.; Li, Y. J. J. Power Sources 2010,
195, 3407.
20. Yang, C.-C. J. Membrane Sci. 2007, 288, 51.
21. Amjadi, M.; Rowshanzamir, S.; Peighambardoust, S. J.; Hosseini,
M. G.; Eikani, M. H. Int. J. Hydrogen Energy 2010, 35, 9252.
22. Sacc'a, A.; Gatto, I.; Carbone, A.; Pedicini, R.; Passalacqua, E. J. Power Sources 2006, 163,
47.
23. Kozawa, Y.; Suzuki, S.; Miyayama, M.; Okumiya, T.; Traversa, E. Solid State Ionics 2010,
181, 348.
24. Qian, W.; Shang, Y.; Fang, M.; Wang, S.; Xie, X.; Wang, J.; Wang, W.; Du, J.; Wang, Y.; Mao,
Z. Int. J. Hydrogen Energy 2012, 37, 12919.
25. Alberti, G.; Casciola, M.; Pica, M.; Tarpanelli, T.; Sganappa, M. Fuel Cells 2005, 5, 366.
26. Kim, D. S.; Park, H. B.; Rhim, J. W.; Moo Lee, Y. J. Mem- brane Sci. 2004, 240, 37.
27. Thiam, H. S.; Daud, W. R. W.; Kamarudin, S. K.; Mohammad, A. B.; Kadhum, A. A. H.;
Loh, K. S.; Majlan, E. H. Int. J. Hydrogen Energy 2011, 36, 3187.
28. Kim, S.-M.; Lee, Y.-J.; Jun, K.-W.; Park, J.-Y.; Potdar, H. S. Mater. Chem. Phys. 2007, 104,
56.
29. Boumaza, A.; Favaro, L.; L'edion, J.; Sattonnay, G.; Brubach, J. B.; Berthet, P.; Huntz, A.
14
M.; Roy, P.; T'etot, R. J. Solid State Chem. 2009, 182, 1171.
30. Suzuki, F.; Onozato, K.; Kurokawa, Y., J Appl Chem 1990, 39, 371.
31. O€ zdilek, C.; Kazimierczak, K.; van der Beek, D.; Picken, S. J., Polymer 2004, 45, 5207.
32. Halbach, T. S.; Mu€lhaupt, R., Polymer 2008, 49, 867.
33. Monti, M.; Camino, G., Polym Degrad Stab 2013, 98, 1838.
34. Zhang, J.; Ji, Q.; Zhang, P.; Xia, Y.; Kong, Q. Polym. Degrad. Stab. 2010, 95, 1211.
35. Ping, Z. H.; Nguyen, Q. T.; Chen, S. M.; Zhou, J. Q.; Ding, Y. D. Polymer 2001, 42, 8461.
36. Tomé, L. C.; Goncalves, C. M. B.; Boaventura, M.; Brand~ao, L.; Mendes, A. M.; Silvestre, A. J.
D.; Neto, C. P.; Gandini, A.; Freire, C. S. R.; Marrucho, I. M. Carbohyd Polym. 2011, 83, 836.
37. Kim, D. S.; Guiver, M. D.; Nam, S. Y.; Yun, T. I.; Seo, M. Y.; Kim, S. J.; Hwang, H. S.; Rhim,
J. W. J. Membrane Sci. 2006, 281, 156.
38. Lee, D. K.; Lee, K. J.; Kim, Y. W.; Kim, J. H. Desalination 2008, 233, 104.
39. Buzzoni, R.; Bordiga, S.; Ricchiardi, G.; Spoto, G.; Zecchina, A. J. Phys. Chem. 1995, 99,
11937.
40. Mansur, H. S.; Sadahira, C. M.; Souza, A. N.; Mansur, A. A. P. Mater. Sci. Eng. C 2008, 28,
539.
41. Mallapragada, S. K.; Peppas, N. A.; Colombo, P. J. Biomed. Mater. Res. 1997, 36, 125.
42. Hwang, B.-J.; Joseph, J.; Zeng, Y.-Z.; Lin, C.-W.; Cheng, M.-Y. J. Membrane Sci. 2011, 369,
88.
43. Kim, Y. S.; Dong, L.; Hickner, M. A.; Glass, T. E.; Webb, V.; McGrath, J. E. Macromolecules
2003, 36, 6281.
44. Yang, C.-C. Int. J. Hydrogen Energy 2011, 36, 4419.
15
Figure 1. (A) Infrared spectra of SSA, PVAL, and PVAL/SSA membranes in the region of 3800–
400 cm (B). Numbers #1 to #6 denote mem- branes with composition as indicated in Table I.
Figure 2. Reaction scheme for PVAL/SSA crosslinking.
16
Figure 3. Infrared spectrum of SSA, PVAL, and PVAL/SSA loaded with 10% of c-AlO(OH)
membranes in the region of 3800–400 cm-1. Numbers #1 to #6 denote membranes with
composition as indicated in Table I
Figure 4. Deconvolution bands on the infrared spectra for (A) SSA and (B) membrane #4, and (C)
membrane #4 loaded with 5%, and (D) loaded with 10 % of c-AlO(OH).
17
Figure 5. (A) TG, (B) DTG curves for PVAL/SSA membranes loaded with 10% c-AlO(OH), and
(C) three-dimensional graph of absorbance versus wave- number versus temperature for membrane
#4 loaded with 10% boehmite.
Figure 6. (A) IEC versus SSA wt % for PVAL/SSA membranes loaded and unloaded with boehmite
nanoparticles and (B) IEC versus %SSA for PVAL/ SSA membrane and IEC calculated value for
one proton (IEC-1H1) and two protons (IEC-2H1).
18
Figure 7. Polarization curves for the PEMFC using the PVAL/SSA mem- branes indicated, #4*
loaded with 5 wt % boehmite and #4**, #5**, and #6** loaded with 10 wt % boehmite and the
Nafion 115.
19
Table I. Chemical Composition and Molar Ratio of Investigated Membranes.
Table II. Total of Water Uptake in 1 g of Membrane (Water), free and Frozen Bound Water Quantity (Freewater) and Nonfrozen Bound Water Quantity
(Boundwater) to Indicated Membranes.
20
Table III. Modulus of Elasticity to Indicate Membranes PVAL/SSA Unloaded and Loaded with Boehmite Nanoparticles.
Table IV. ResultsofPermeability(P), Proton Conductivity by Two-Probe Technique(r) and Proton Conductivity After Assembling the Electrodesina FuelCell(r*)
for Membranes PVAL/SSA Loaded and Unloaded with Boehmite Nanoparticles.