Embed Size (px)
Citation preview
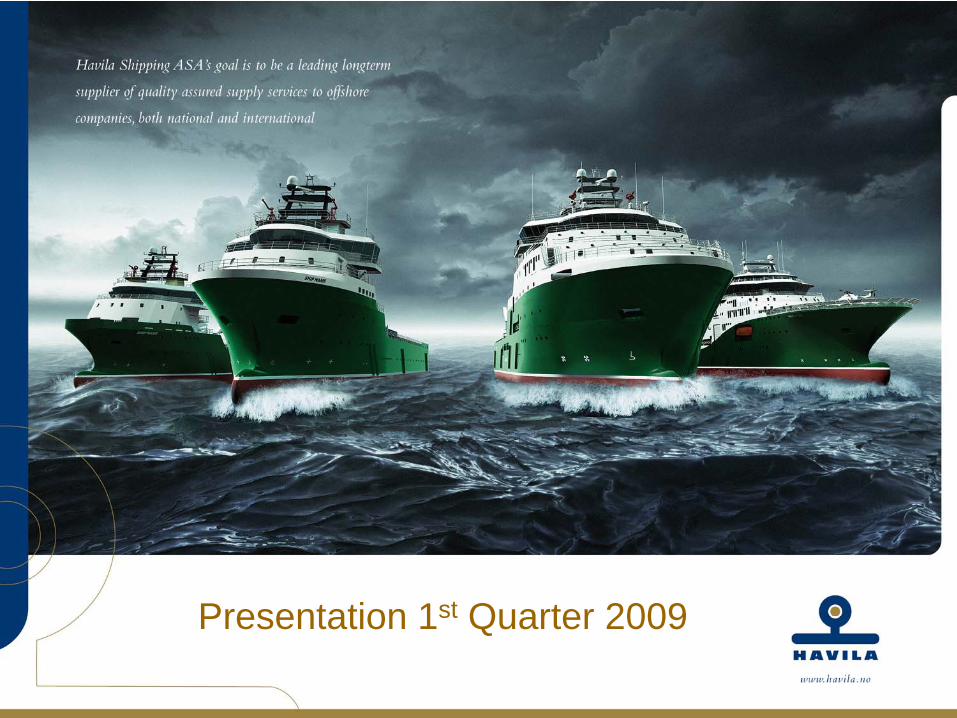
Presentation 1st Quarter 2009
This is Havila Shipping ASA
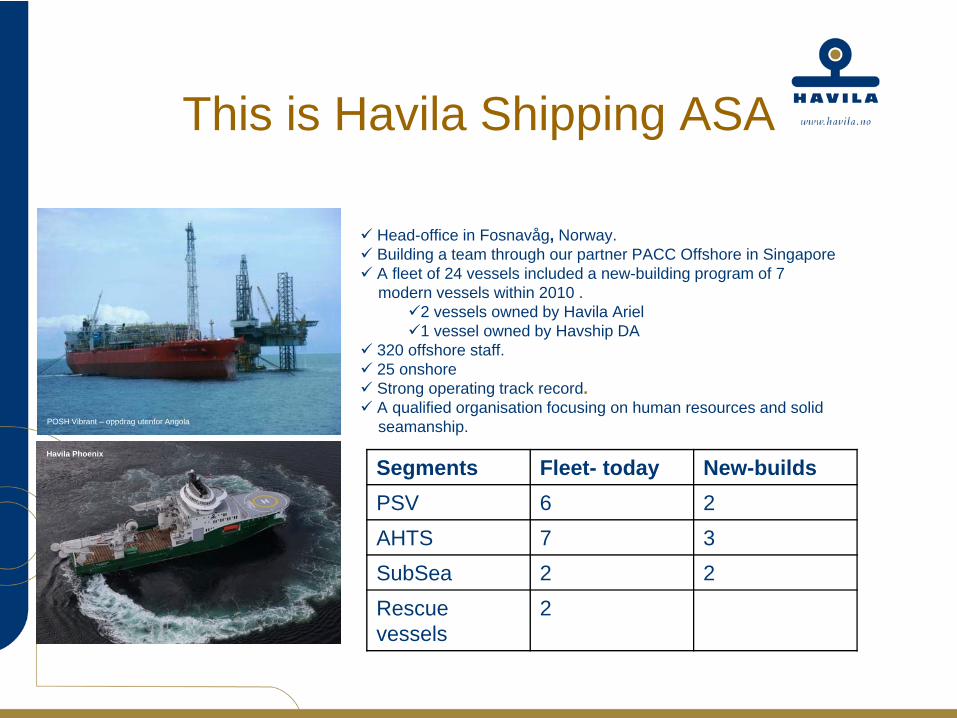
Head-office in Fosnavåg, Norway. Building a team through our partner PACC Offshore in SingaporeA fleet of 24 vessels included a new-building program of 7 modern vessels within 2010 .
2 vessels owned by Havila Ariel 1 vessel owned by Havship DA
320 offshore staff.25 onshoreStrong operating track record. A qualified organisation focusing on human resources and solid seamanship.
Segments Fleet- today New-buildsPSV 6 2AHTS 7 3SubSea 2 2Rescue vessels
2
POSH Vibrant – oppdrag utenfor Angola
Havila Phoenix
Havila Shipping..
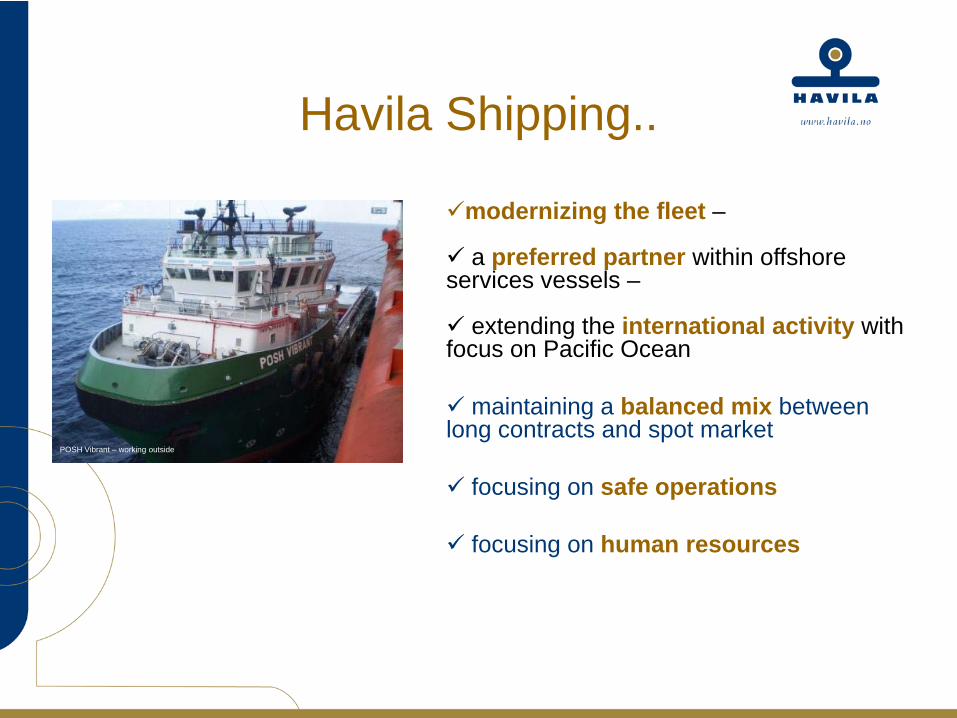
modernizing the fleet –
a preferred partner within offshore services vessels –
extending the international activity with focus on Pacific Ocean
maintaining a balanced mix between long contracts and spot market
focusing on safe operations
focusing on human resources
POSH Vibrant – working outside
Safety & Quality focused
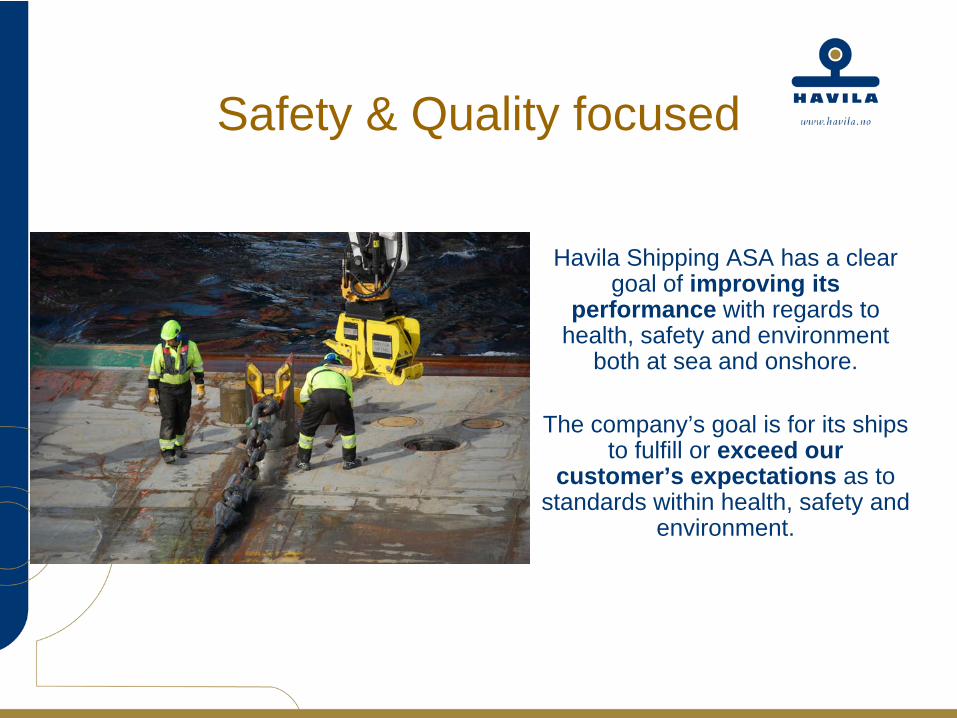
Havila Shipping ASA has a clear goal of improving its
performance with regards to health, safety and environment
both at sea and onshore.
The company’s goal is for its ships to fulfill or exceed our
customer’s expectations as to standards within health, safety and
environment.
1ST QUARTER ACCOUNTS
Havila Phoenix
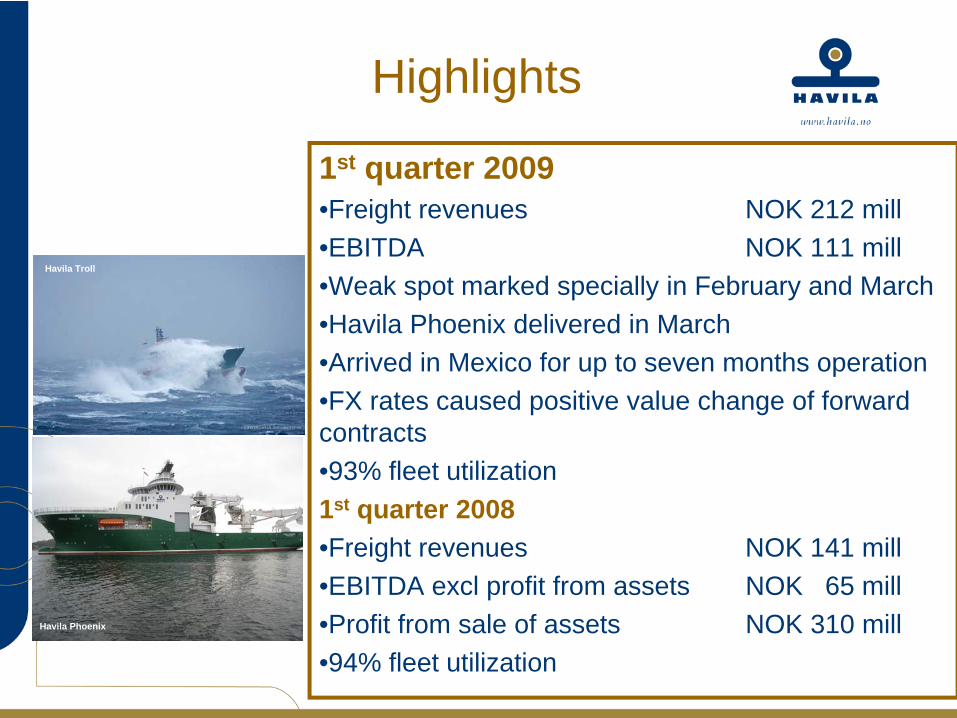
Highlights
1st quarter 2009•Freight revenues NOK 212 mill•EBITDA NOK 111 mill•Weak spot marked specially in February and March•Havila Phoenix delivered in March •Arrived in Mexico for up to seven months operation•FX rates caused positive value change of forward contracts•93% fleet utilization1st quarter 2008•Freight revenues NOK 141 mill•EBITDA excl profit from assets NOK 65 mill•Profit from sale of assets NOK 310 mill•94% fleet utilization
Havila Phoenix
Havila Troll

Main figuresNOK mill Q1 2009 Q1 2008
EX PROFIT FROM ASSETSQ4 2008 Q3 2008
Incomeand gains 212,2 141,3 294,4 216,8
EBITDA 111,4 53% 65,1 46 % 187,8 64 % 114,4 53 %
EBIT 83,3 39% 42,1 30 % 160,9 55 % 89,5 41 %
Pre tax result 164,4 77% 4,7 3 % -86,3 -29 % 16,9 8 %
Comments:• Fleet utilization in Q1: 93%
•Favour 10 years class.•101 million positive non realized value changes on FX loans, derivatives and leasing obligations in Q1•Interest rates drops – lowering interest expenses
•3 m Nibor average 2008: 6,23%•3 m Nibor average Q1: 3,45% -
100
200
300
Q1 09 Q4 08 Q3 08 Q2 08 Q1 08
212
294
217 158 143
111
188
114 63 65 83
161
90 39 42
INCOME EX PROFIT FROM ASSETS EBITDA EBIT
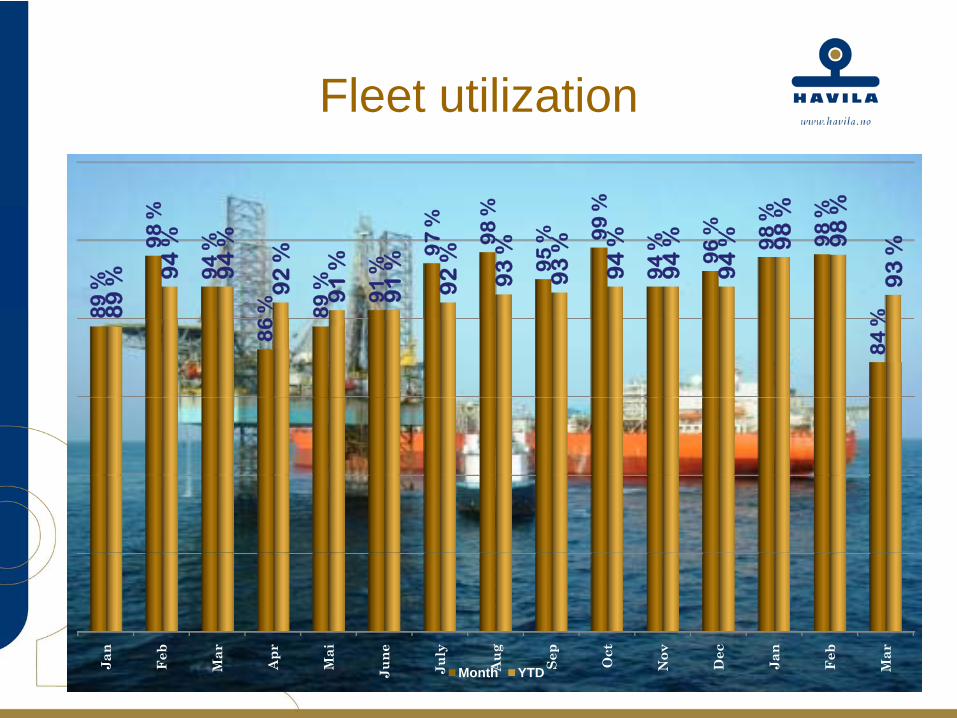
Fleet utilizationJan
Feb
Mar
Apr
Mai
June
July
Aug Sep
Oct
Nov
Dec
Jan
Feb
Mar
89
%
98
%
94
%
86
% 89
% 91
%
97
%
98
%
95
% 99
%
94
% 96
% 98
%
98
%
84
%
89
% 94
%
94
%
92
%
91
%
91
%
92
%
93
%
93
%
94
%
94
%
94
% 98
%
98
%
93
%
Month YTD
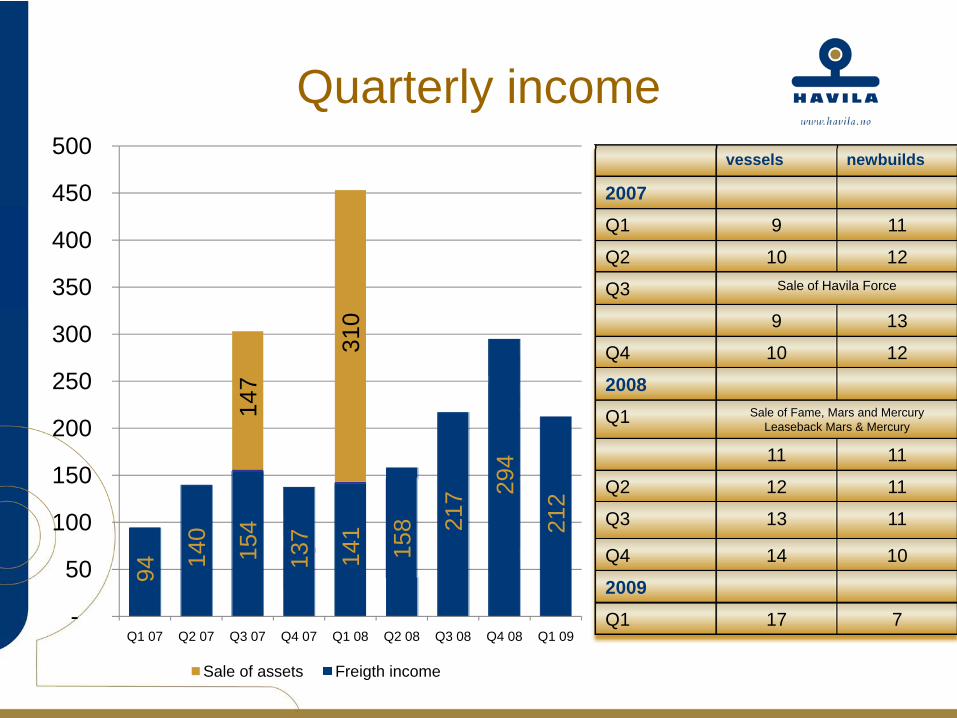
Quarterly income94
140
154
137
141
158 21
7 294
212
147
310
-
50
100
150
200
250
300
350
400
450
500
Q1 07 Q2 07 Q3 07 Q4 07 Q1 08 Q2 08 Q3 08 Q4 08 Q1 09
Sale of assets Freigth income
vessels newbuilds
2007Q1 9 11
Q2 10 12
Q3 Sale of Havila Force
9 13
Q4 10 12
2008Q1 Sale of Fame, Mars and Mercury
Leaseback Mars & Mercury
11 11
Q2 12 11
Q3 13 11
Q4 14 10
2009Q1 17 7
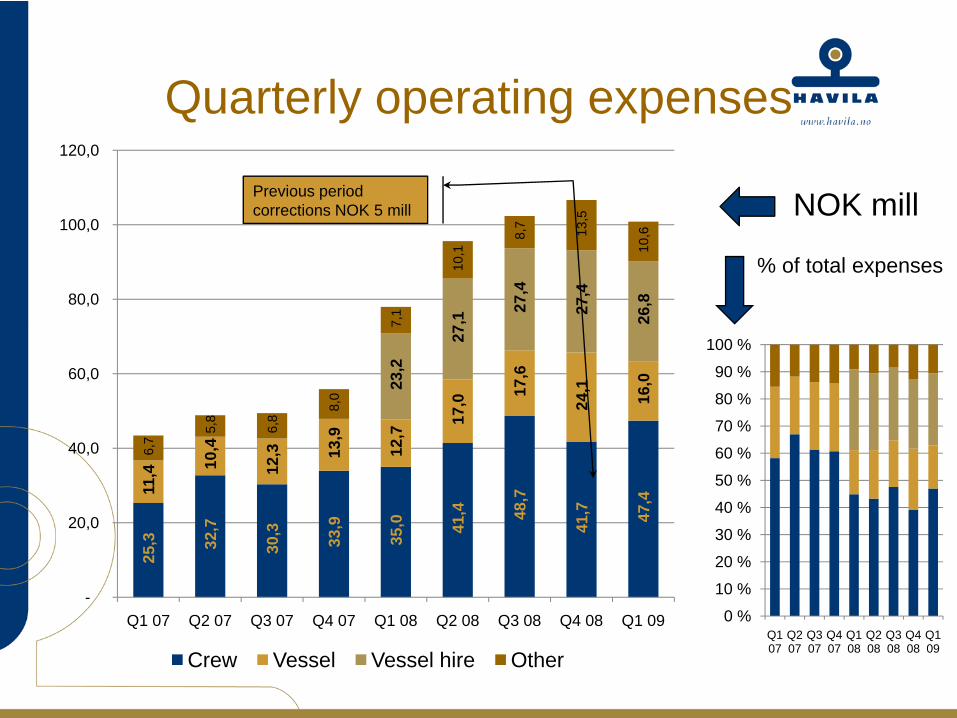
Quarterly operating expenses25
,3
32,7
30,3
33,9
35,0
41,4
48,7
41,7
47,4
11,4
10,4
12,3
13,9
12,7
17,0
17,6
24,1
16,0
23,2
27,1
27,4
27,4
26,8
6,7
5,8
6,8
8,0
7,1
10,1
8,7 13,5
10,6
-
20,0
40,0
60,0
80,0
100,0
120,0
Q1 07 Q2 07 Q3 07 Q4 07 Q1 08 Q2 08 Q3 08 Q4 08 Q1 09
Crew Vessel Vessel hire Other
0 %
10 %
20 %
30 %
40 %
50 %
60 %
70 %
80 %
90 %
100 %
Q1 07
Q2 07
Q3 07
Q4 07
Q1 08
Q2 08
Q3 08
Q4 08
Q1 09
NOK mill
% of total expenses
Previous period corrections NOK 5 mill
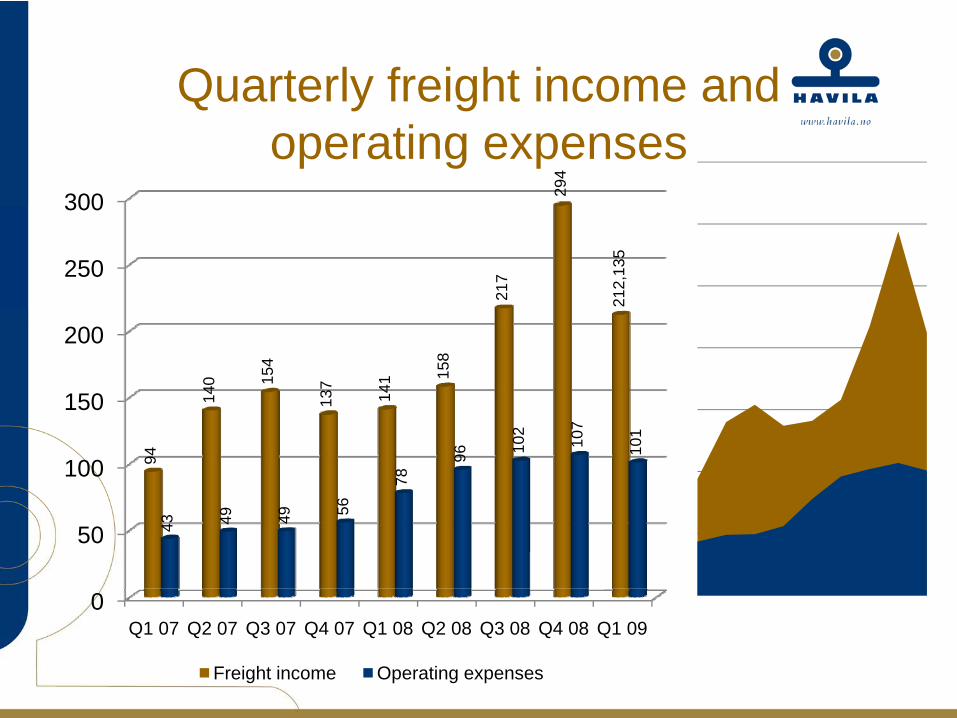
Quarterly freight income and operating expenses
0
50
100
150
200
250
300
Q1 07 Q2 07 Q3 07 Q4 07 Q1 08 Q2 08 Q3 08 Q4 08 Q1 09
94
140 15
4
137
141 15
8
217
294
212,
135
43 49 49 56
78
96 102
107
101
Freight income Operating expenses

Operating profit from segmentsExcluding gains from sale of vessels
19
6 6 16
46
14
15
19 42
58
12
16 33
99
5 20
-
20
40
60
80
100
120
PSV AHTS AHTS Asia RRV SubSea
Q1 08 Q2 08 Q3 08 Q4 08 Q1 09
PSV40 %
AHTS34 %
RRV10 %
SubSea16 %
2008
PSV30 %
AHTS37 %
Asia10 %
RRV9 %
SubSea14 %
2009
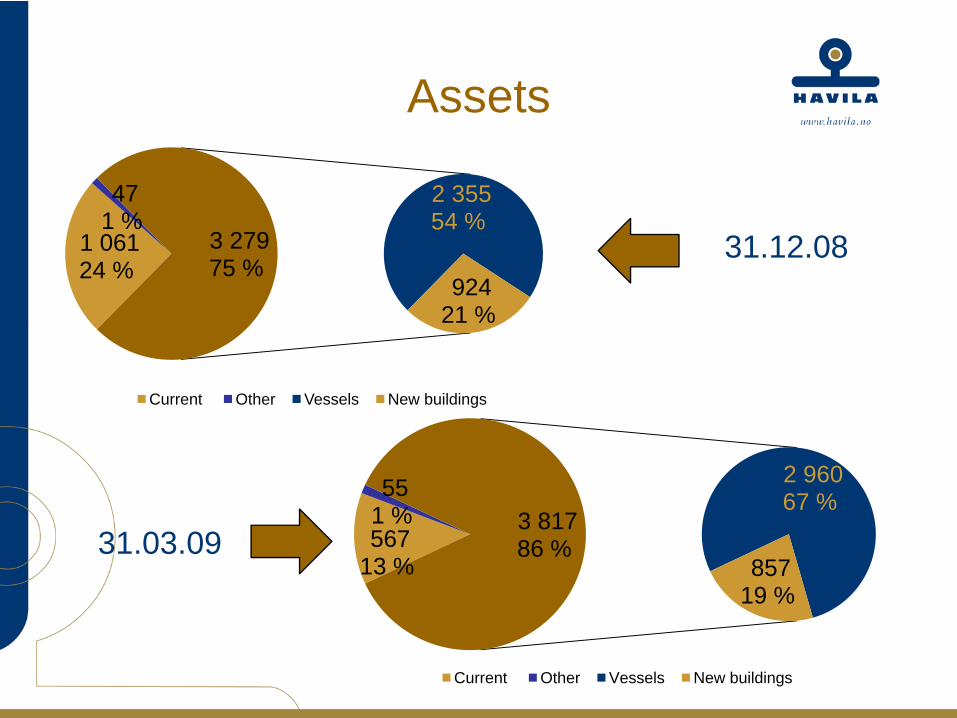
Assets
1 061 24 %
47 1 %
2 355 54 %
924 21 %
3 279 75 %
Current Other Vessels New buildings
567 13 %
55 1 %
2 960 67 %
857 19 %
3 817 86 %
Current Other Vessels New buildings
31.03.09
31.12.08
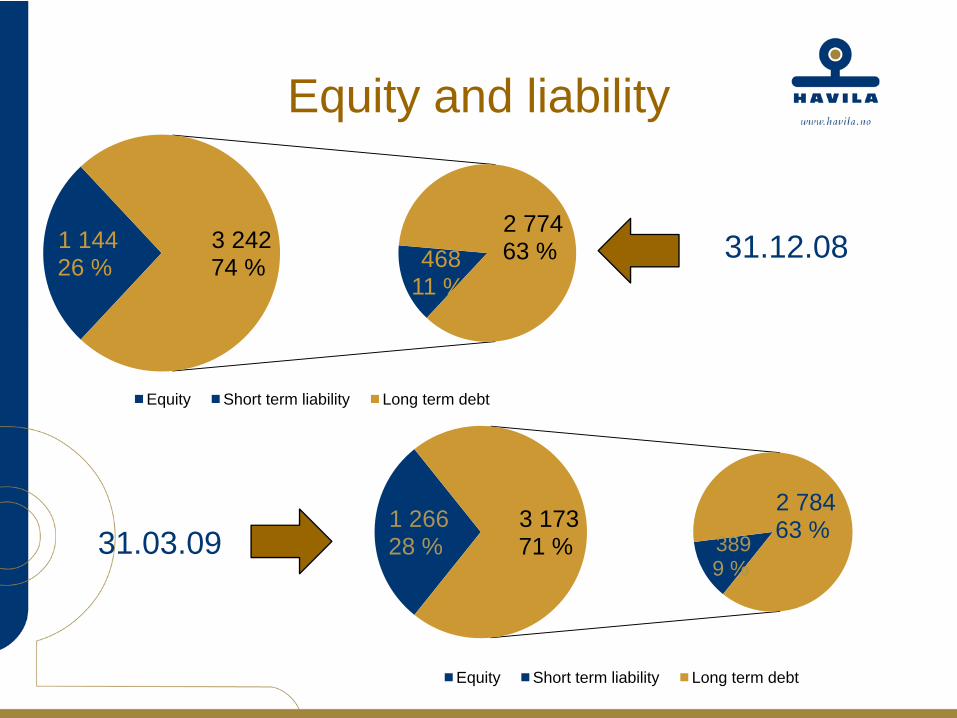
Equity and liability
1 144 26 % 468
11 %
2 774 63 %3 242
74 %
Equity Short term liability Long term debt
31.03.09
31.12.08
1 266 28 % 389
9 %
2 784 63 %3 173
71 %
Equity Short term liability Long term debt
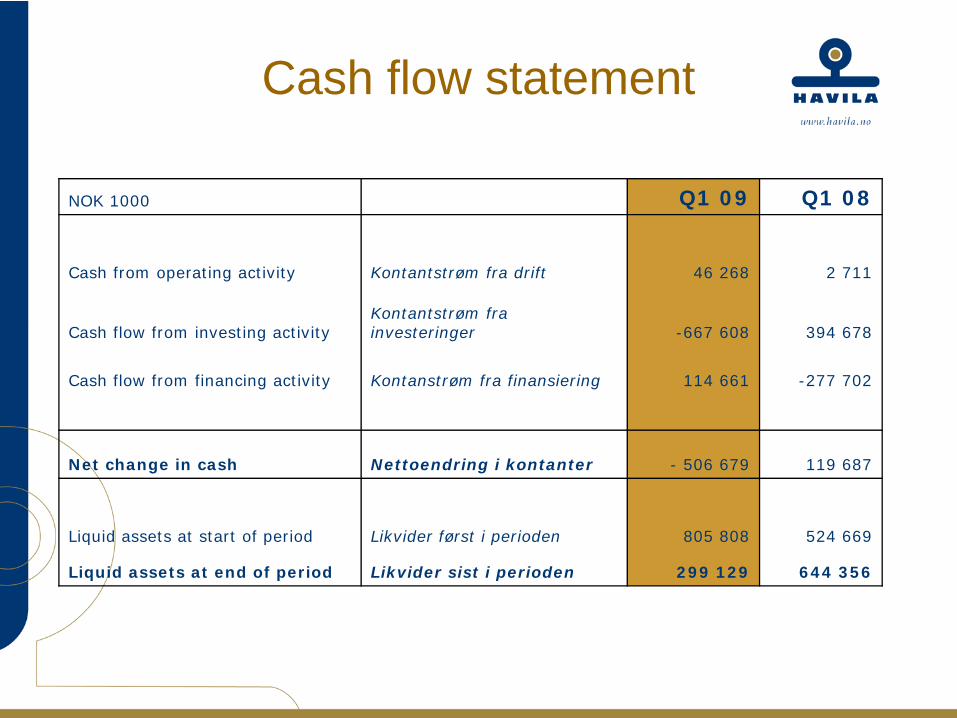
Cash flow statement
NOK 1000 Q1 09 Q1 08
Cash from operating activity Kontantstrøm fra drift 46 268 2 711
Cash flow from investing activityKontantstrøm fra investeringer -667 608 394 678
Cash flow from financing activity Kontanstrøm fra finansiering 114 661 -277 702
Net change in cash Nettoendring i kontanter - 506 679 119 687
Liquid assets at start of period Likvider først i perioden 805 808 524 669
Liquid assets at end of period Likvider sist i perioden 299 129 644 356
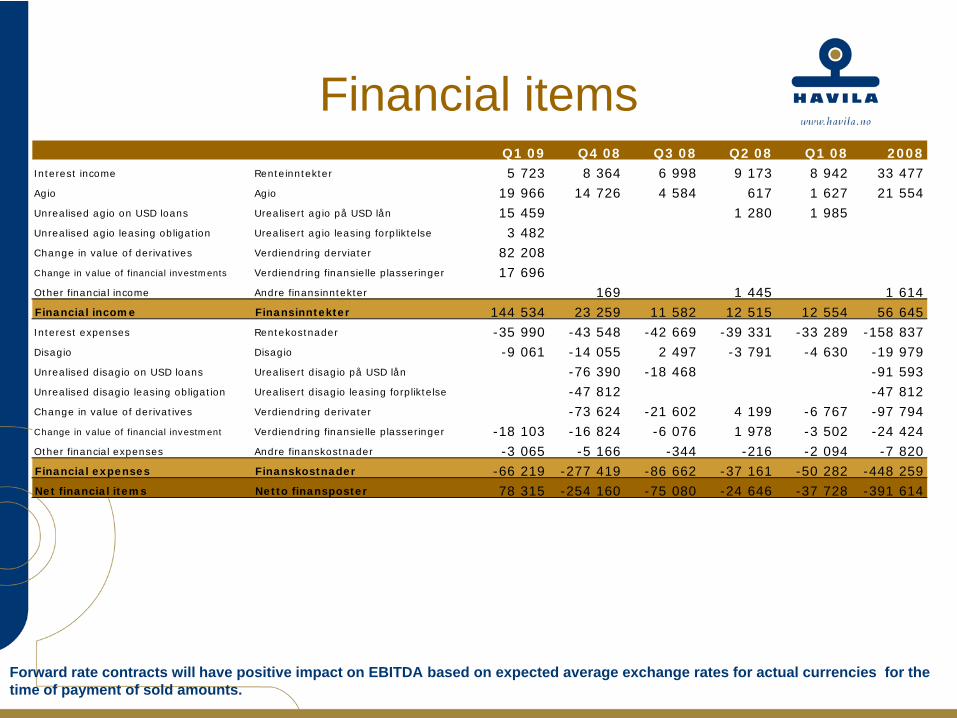
Financial items
Forward rate contracts will have positive impact on EBITDA based on expected average exchange rates for actual currencies for the time of payment of sold amounts.
Q1 09 Q4 08 Q3 08 Q2 08 Q1 08 2008Interest income Renteinntekter 5 723 8 364 6 998 9 173 8 942 33 477Agio Agio 19 966 14 726 4 584 617 1 627 21 554Unrealised agio on USD loans Urealisert agio på USD lån 15 459 1 280 1 985Unrealised agio leasing obligation Urealisert agio leasing forpliktelse 3 482Change in value of derivatives Verdiendring derviater 82 208Change in value of financial investments Verdiendring finansielle plasseringer 17 696Other financial income Andre finansinntekter 169 1 445 1 614Financial income Finansinntekter 144 534 23 259 11 582 12 515 12 554 56 645Interest expenses Rentekostnader -35 990 -43 548 -42 669 -39 331 -33 289 -158 837Disagio Disagio -9 061 -14 055 2 497 -3 791 -4 630 -19 979Unrealised disagio on USD loans Urealisert disagio på USD lån -76 390 -18 468 -91 593Unrealised disagio leasing obligation Urealisert disagio leasing forpliktelse -47 812 -47 812Change in value of derivatives Verdiendring derivater -73 624 -21 602 4 199 -6 767 -97 794Change in value of financial investment Verdiendring finansielle plasseringer -18 103 -16 824 -6 076 1 978 -3 502 -24 424Other financial expenses Andre finanskostnader -3 065 -5 166 -344 -216 -2 094 -7 820Financial expenses Finanskostnader -66 219 -277 419 -86 662 -37 161 -50 282 -448 259Net financial items Netto finansposter 78 315 -254 160 -75 080 -24 646 -37 728 -391 614
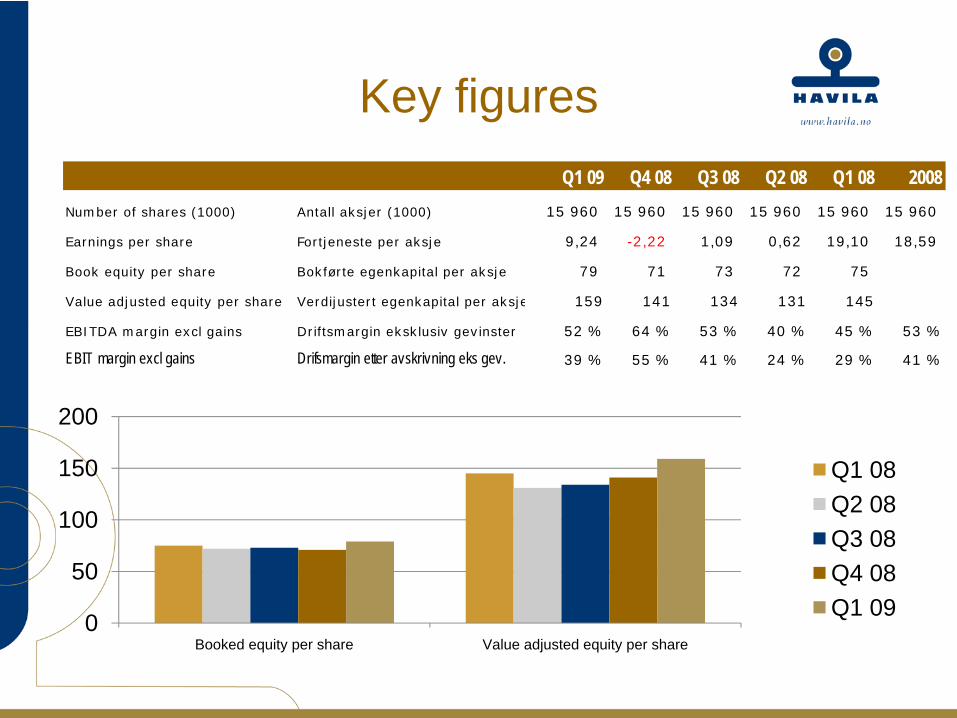
Key figuresQ1 09 Q4 08 Q3 08 Q2 08 Q1 08 2008
Number of shares (1000) Antall aksjer (1000) 15 960 15 960 15 960 15 960 15 960 15 960
Earnings per share Fortjeneste per aksje 9,24 -2,22 1,09 0,62 19,10 18,59
Book equity per share Bokførte egenkapital per aksje 79 71 73 72 75
Value adjusted equity per share Verdijustert egenkapital per aksje 159 141 134 131 145
EBITDA margin excl gains Driftsmargin eksklusiv gevinster 52 % 64 % 53 % 40 % 45 % 53 %
EBIT margin excl gains Drifsmargin etter avskrivning eks gev. 39 % 55 % 41 % 24 % 29 % 41 %
0
50
100
150
200
Booked equity per share Value adjusted equity per share
Q1 08Q2 08Q3 08Q4 08Q1 09
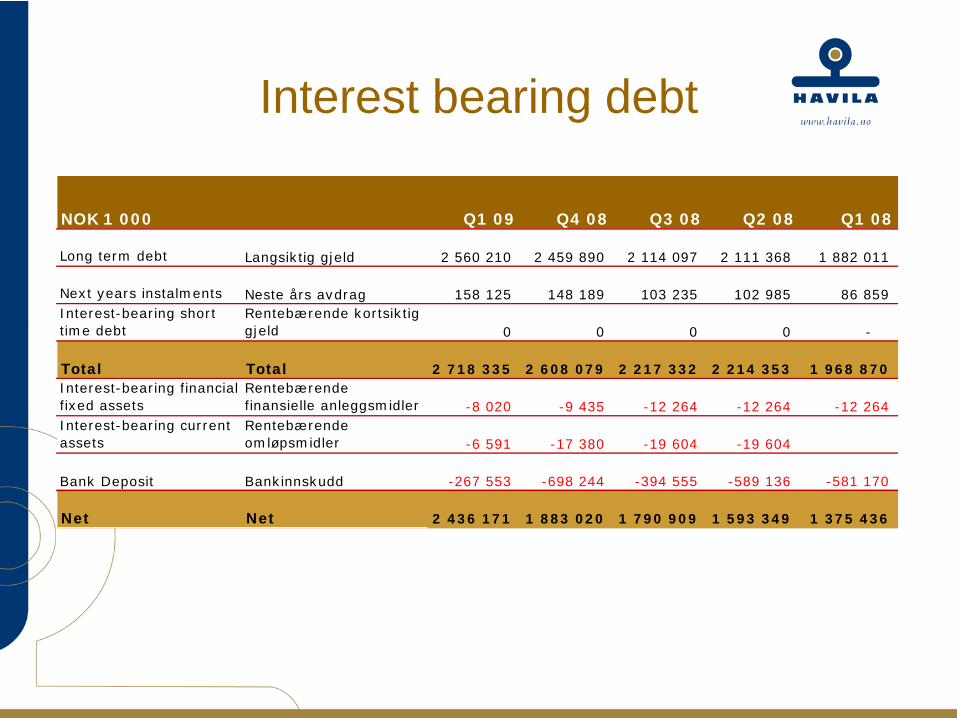
Interest bearing debt
NOK 1 000 Q1 09 Q4 08 Q3 08 Q2 08 Q1 08
Long term debt Langsiktig gjeld 2 560 210 2 459 890 2 114 097 2 111 368 1 882 011
Next years instalments Neste års avdrag 158 125 148 189 103 235 102 985 86 859 Interest-bearing short time debt
Rentebærende kortsiktig gjeld 0 0 0 0 -
Total Total 2 718 335 2 608 079 2 217 332 2 214 353 1 968 870 Interest-bearing financial fixed assets
Rentebærende finansielle anleggsmidler -8 020 -9 435 -12 264 -12 264 -12 264
Interest-bearing current assets
Rentebærende omløpsmidler -6 591 -17 380 -19 604 -19 604
Bank Deposit Bankinnskudd -267 553 -698 244 -394 555 -589 136 -581 170
Net Net 2 436 171 1 883 020 1 790 909 1 593 349 1 375 436
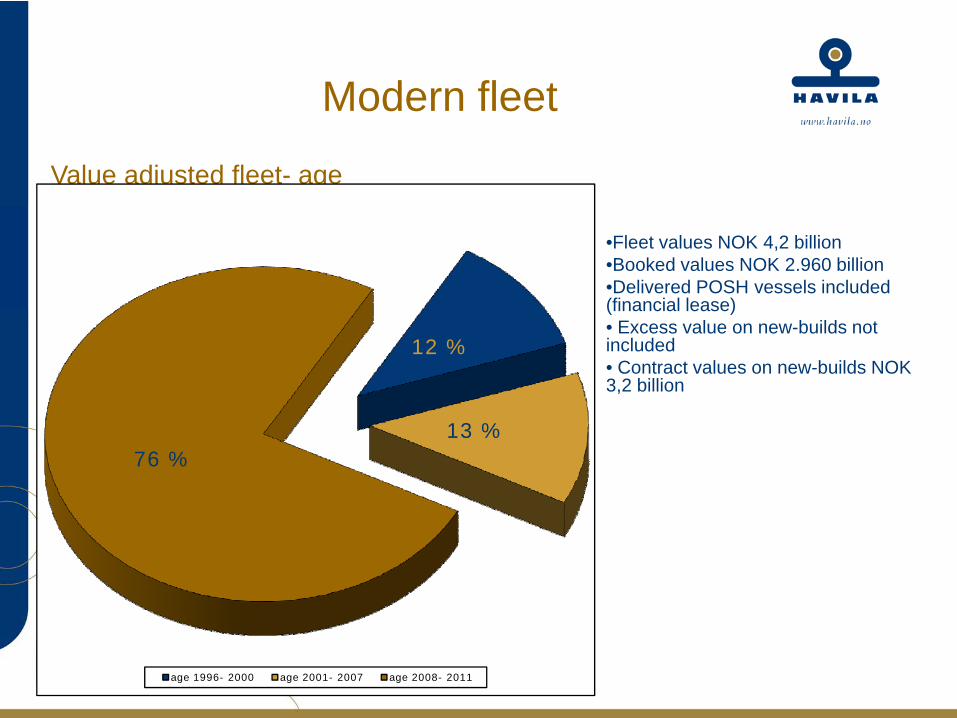
Modern fleet
•Fleet values NOK 4,2 billion •Booked values NOK 2.960 billion•Delivered POSH vessels included (financial lease)• Excess value on new-builds not included• Contract values on new-builds NOK 3,2 billion
Value adjusted fleet- age
12 %
13 %76 %
age 1996- 2000 age 2001- 2007 age 2008- 2011
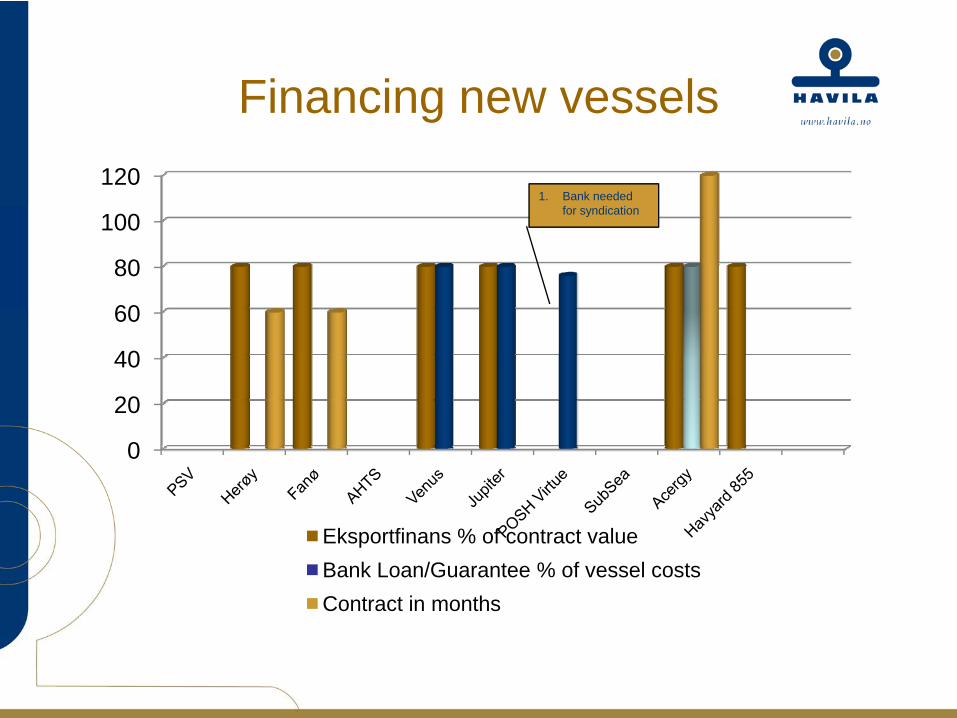
Financing new vessels
0
20
40
60
80
100
120
Eksportfinans % of contract valueBank Loan/Guarantee % of vessel costsContract in months
1. Bank needed for syndication
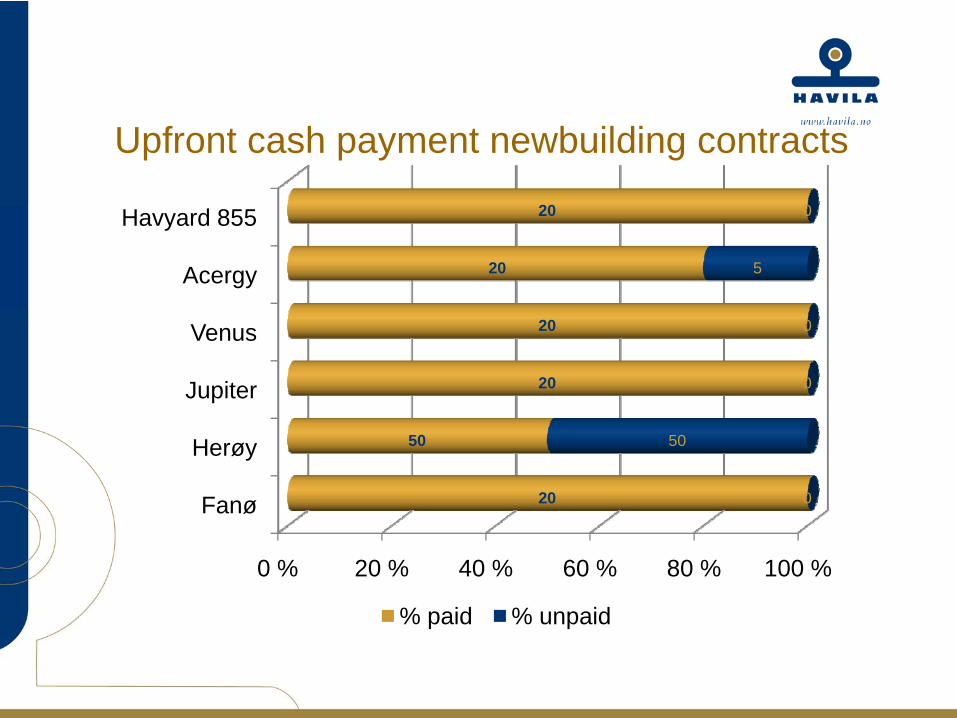
Upfront cash payment newbuilding contracts
0 % 20 % 40 % 60 % 80 % 100 %
Fanø
Herøy
Jupiter
Venus
Acergy
Havyard 855
20
50
20
20
20
20
0
50
0
0
5
0
% paid % unpaid
POSH Havila Pte Ltd, Singapore
Joint venture company established 200650/50 owned by
Pacc Offshore Services Holding Pte Ltdand Havila Shipping ASA through 100% owned company
Tree of four vessels on financial lease contract with purchase option (3rd for delivery in June 09)
One vessels was delivered from yard 3rd AprilPOSH Havila Pte Ltd
In operation since July/August 2008Hire in vessels on bareboat charter from owners
Vessels to be on timecharter in Asian watersImplemented in the accounts as Associated company
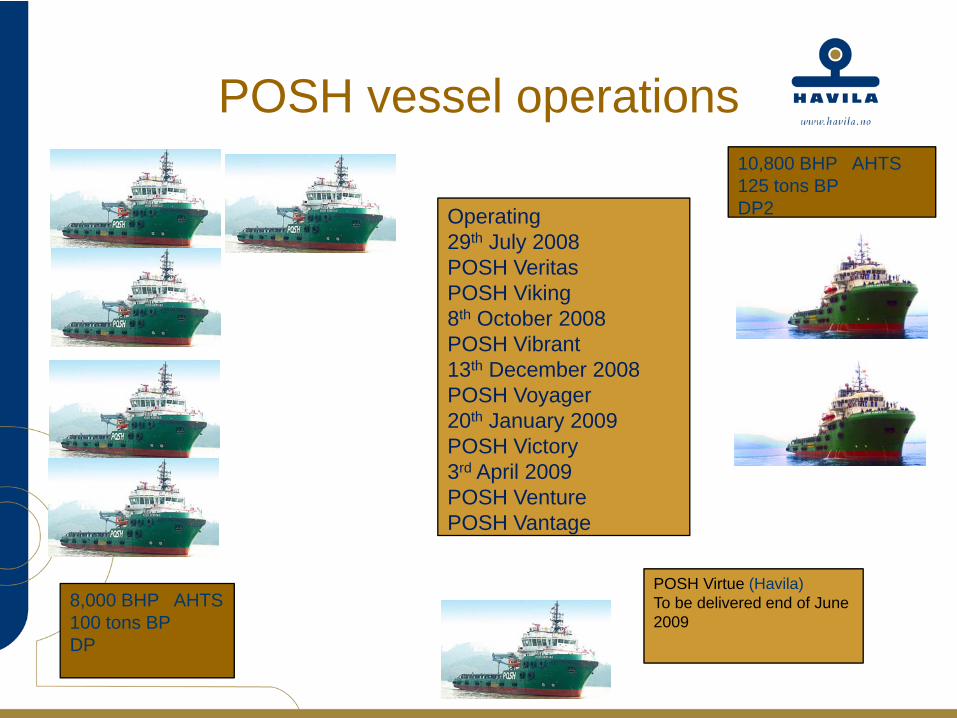
POSH vessel operations
Operating29th July 2008POSH VeritasPOSH Viking 8th October 2008POSH Vibrant13th December 2008POSH Voyager20th January 2009POSH Victory3rd April 2009POSH VenturePOSH Vantage
POSH Virtue (Havila)To be delivered end of June 2009
8,000 BHP AHTS 100 tons BP DP
10,800 BHP AHTS 125 tons BPDP2
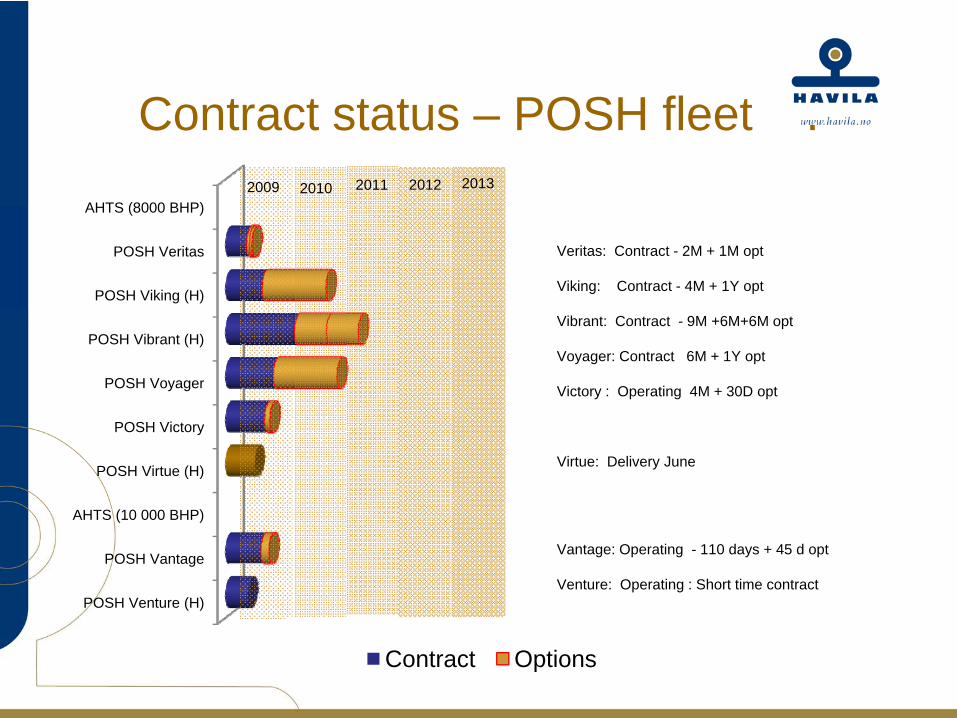
Contract status – POSH fleet .
AHTS (8000 BHP)
POSH Veritas
POSH Viking (H)
POSH Vibrant (H)
POSH Voyager
POSH Victory
POSH Virtue (H)
AHTS (10 000 BHP)
POSH Vantage
POSH Venture (H)
Contract Options
Veritas: Contract - 2M + 1M opt
Viking: Contract - 4M + 1Y opt
Vibrant: Contract - 9M +6M+6M opt
Voyager: Contract 6M + 1Y opt
Victory : Operating 4M + 30D opt
Virtue: Delivery June
Vantage: Operating - 110 days + 45 d opt
Venture: Operating : Short time contract
2009 2010 2011 2012 2013

Fleet utilization Singapore
0 %
10 %
20 %
30 %
40 %
50 %
60 %
70 %
80 %
90 %
100 %Aug
Sept
Oct
Nov Des
Jan
Feb
Mar
74
%
10
0 %
10
0 %
84
%
82
% 86
%
87
%
77
%
68
%
89
% 92
%
90
%
88
%
86
%
87
%
83
%
Month YTD
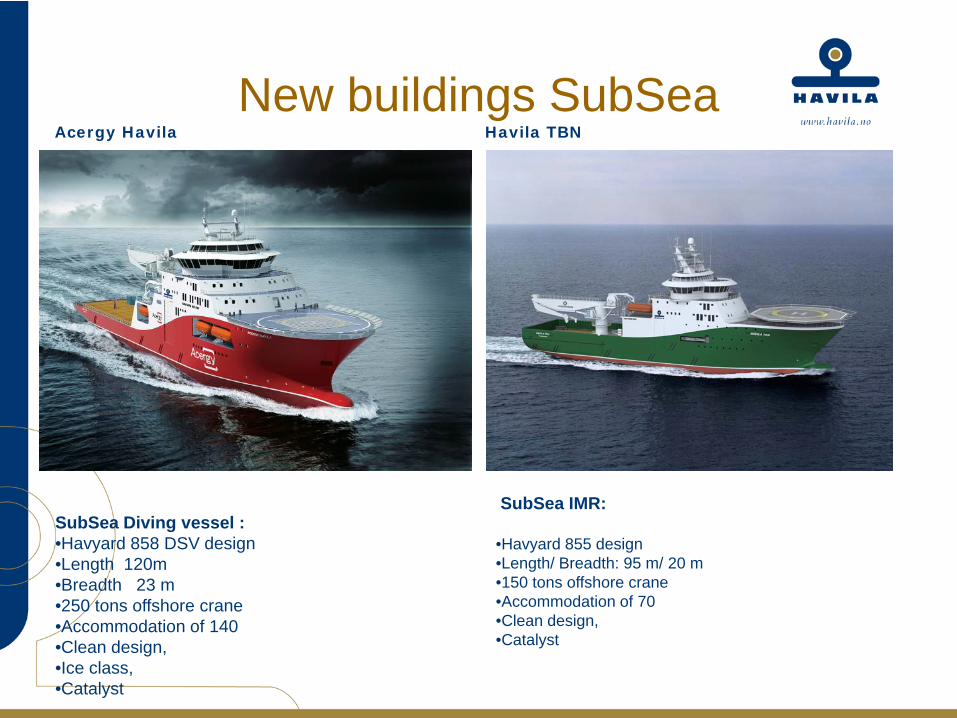
New buildings SubSea
SubSea Diving vessel :•Havyard 858 DSV design•Length 120m•Breadth 23 m•250 tons offshore crane•Accommodation of 140•Clean design, •Ice class, •Catalyst
SubSea IMR:
•Havyard 855 design•Length/ Breadth: 95 m/ 20 m•150 tons offshore crane•Accommodation of 70•Clean design, •Catalyst
Acergy Havila Havila TBN
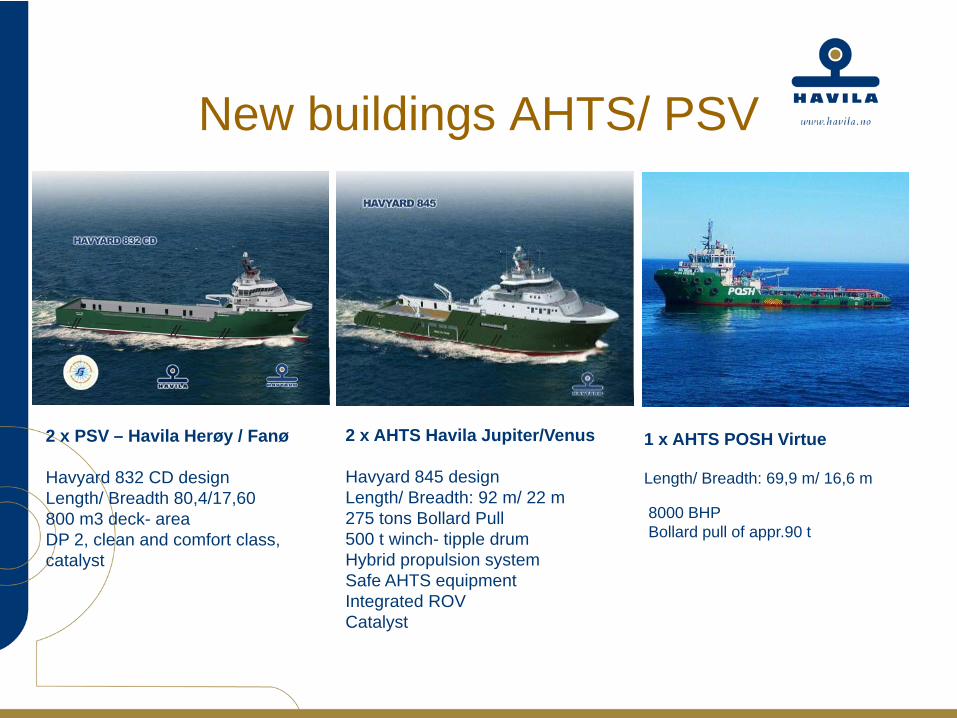
New buildings AHTS/ PSV
2 x AHTS Havila Jupiter/Venus
Havyard 845 designLength/ Breadth: 92 m/ 22 m275 tons Bollard Pull500 t winch- tipple drumHybrid propulsion systemSafe AHTS equipmentIntegrated ROVCatalyst
2 x PSV – Havila Herøy / Fanø
Havyard 832 CD designLength/ Breadth 80,4/17,60800 m3 deck- areaDP 2, clean and comfort class, catalyst
1 x AHTS POSH Virtue
Length/ Breadth: 69,9 m/ 16,6 m
8000 BHPBollard pull of appr.90 t
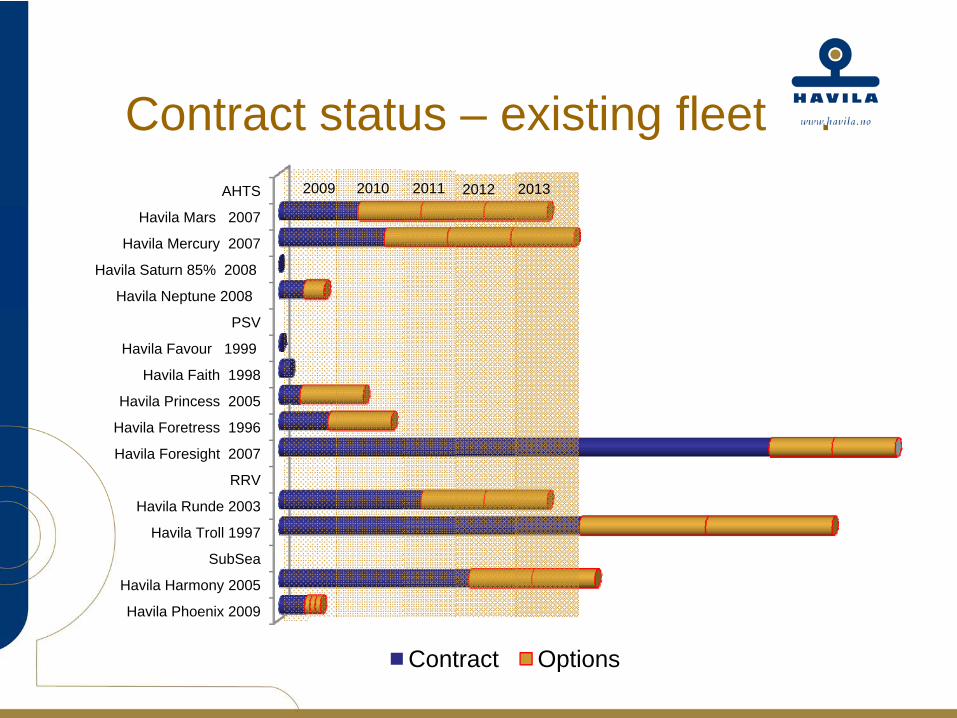
Contract status – existing fleet .AHTS
Havila Mars 2007
Havila Mercury 2007
Havila Saturn 85% 2008
Havila Neptune 2008
PSV
Havila Favour 1999
Havila Faith 1998
Havila Princess 2005
Havila Foretress 1996
Havila Foresight 2007
RRV
Havila Runde 2003
Havila Troll 1997
SubSea
Havila Harmony 2005
Havila Phoenix 2009
Contract Options
2009 2010 2011 2012 2013
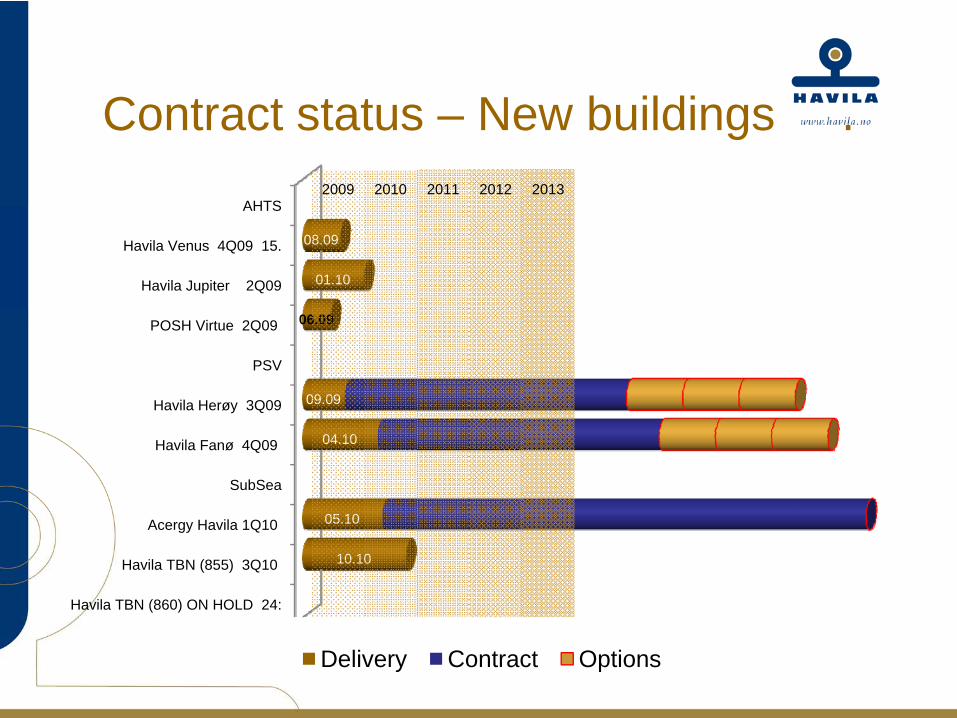
Contract status – New buildings .
AHTS
Havila Venus 4Q09 15.
Havila Jupiter 2Q09
POSH Virtue 2Q09
PSV
Havila Herøy 3Q09
Havila Fanø 4Q09
SubSea
Acergy Havila 1Q10
Havila TBN (855) 3Q10
Havila TBN (860) ON HOLD 24:
08.09
01.10
06.09
09.09
04.10
05.10
10.10
Delivery Contract Options
2009 2010 2011 2012 2013
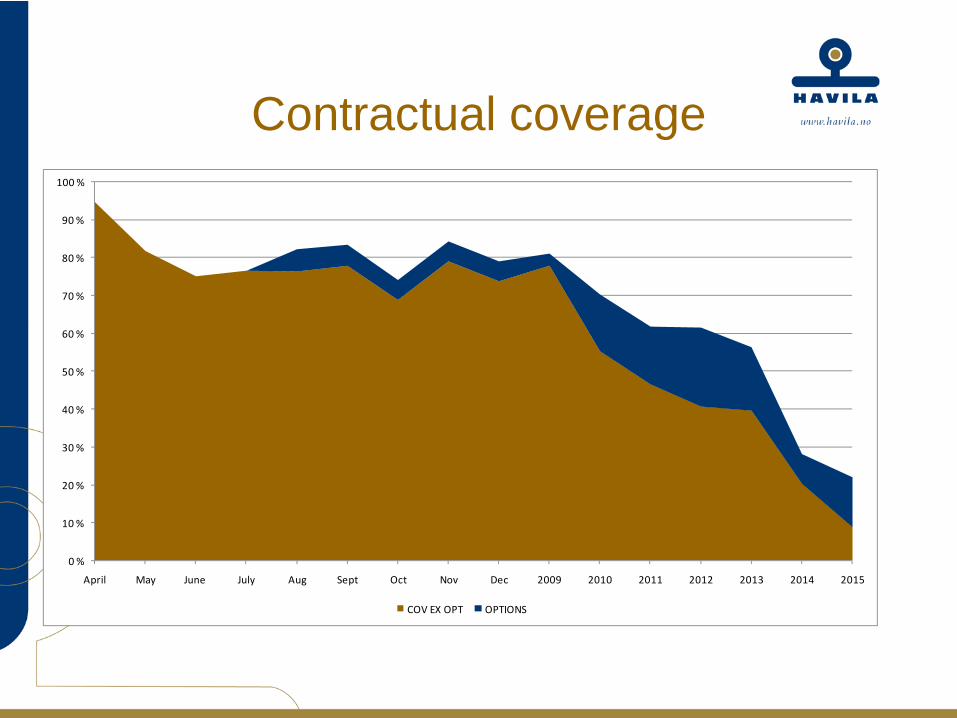
Contractual coverage
0 %
10 %
20 %
30 %
40 %
50 %
60 %
70 %
80 %
90 %
100 %
April May June July Aug Sept Oct Nov Dec 2009 2010 2011 2012 2013 2014 2015
COV EX OPT OPTIONS
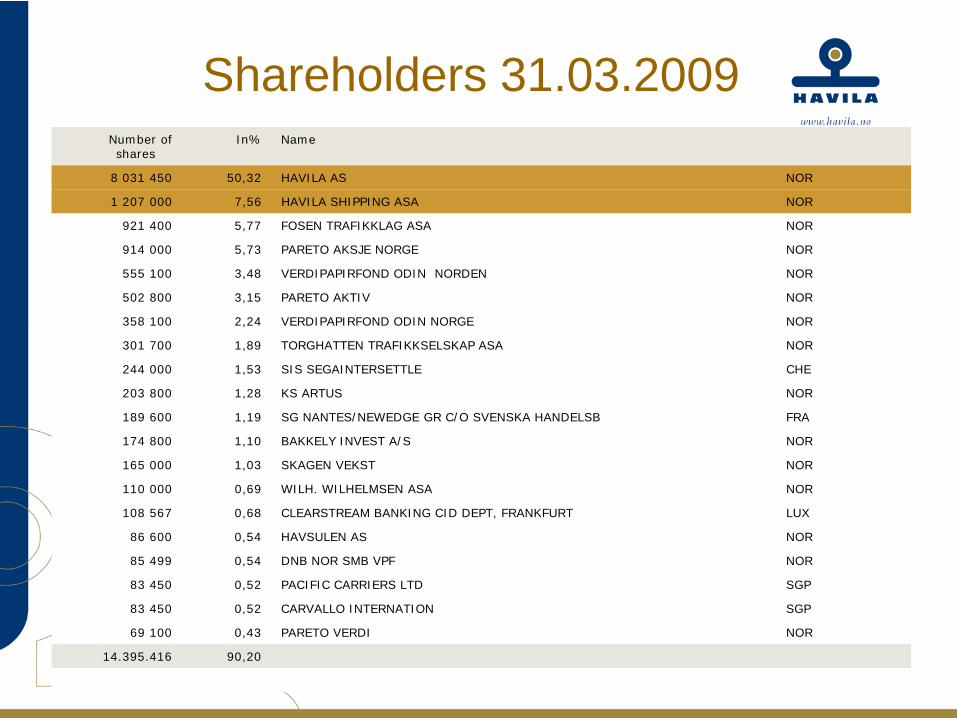
Shareholders 31.03.2009 Number ofshares
In% Name
8 031 450 50,32 HAVILA AS NOR
1 207 000 7,56 HAVILA SHIPPING ASA NOR
921 400 5,77 FOSEN TRAFIKKLAG ASA NOR
914 000 5,73 PARETO AKSJE NORGE NOR
555 100 3,48 VERDIPAPIRFOND ODIN NORDEN NOR
502 800 3,15 PARETO AKTIV NOR
358 100 2,24 VERDIPAPIRFOND ODIN NORGE NOR
301 700 1,89 TORGHATTEN TRAFIKKSELSKAP ASA NOR
244 000 1,53 SIS SEGAINTERSETTLE CHE
203 800 1,28 KS ARTUS NOR
189 600 1,19 SG NANTES/NEWEDGE GR C/O SVENSKA HANDELSB FRA
174 800 1,10 BAKKELY INVEST A/S NOR
165 000 1,03 SKAGEN VEKST NOR
110 000 0,69 WILH. WILHELMSEN ASA NOR
108 567 0,68 CLEARSTREAM BANKING CID DEPT, FRANKFURT LUX
86 600 0,54 HAVSULEN AS NOR
85 499 0,54 DNB NOR SMB VPF NOR
83 450 0,52 PACIFIC CARRIERS LTD SGP
83 450 0,52 CARVALLO INTERNATION SGP
69 100 0,43 PARETO VERDI NOR
14.395.416 90,20
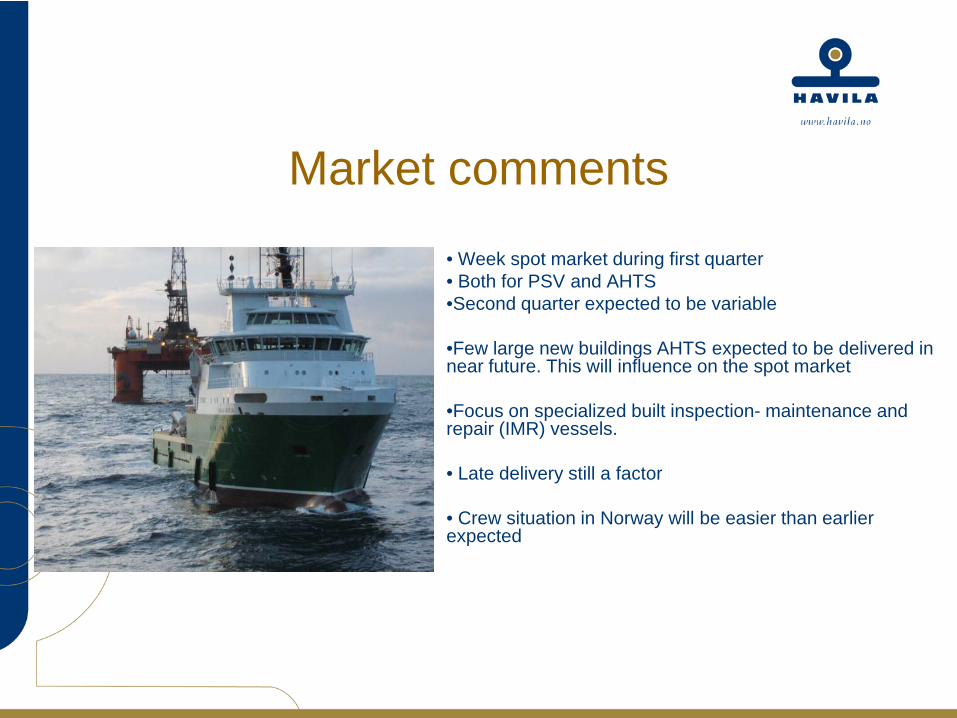
• Week spot market during first quarter• Both for PSV and AHTS•Second quarter expected to be variable
•Few large new buildings AHTS expected to be delivered in near future. This will influence on the spot market
•Focus on specialized built inspection- maintenance and repair (IMR) vessels.
• Late delivery still a factor
• Crew situation in Norway will be easier than earlier expected
Market comments
Vessels in spot market Q2 09AHTS• Havila Saturn in spot marketPSV• Havila Faith on contract with Maersk Oil
UK until May with further options• Havila Favour in Spot market
Summary
• Havila Shipping is focused on modern high-end vessels
• Financing seems available at acceptable margins•3 POSH Vessels financed•4th vessel to be bought late December – financing expected firm •Venus and Jupiter signed•Herøy and Fanø – expected signed during second quarter•Interest rate level reduces the interest expenses with full effect during 2nd quarterstrong financial situation
•Strong international market for high end vessels
•Financial items will fluctuate in the future because of forward FX contracts against USD, EUR and GBP
• The industry is capital intensive and are effected by the financial crises
www.havila.no
Contact: CEO NJÅL SÆVIK (+47) 909 35 722 [email protected] ARNE JOHAN DALE (+47) 909 87 706 [email protected]
Financial calendar 2009•30.07.09 2nd Quarter 2009 •23.10.09 3rd Quarter 2009 •28.01.10 Preliminary result for 2009/4th Quarter

P & L ACCOUNTBALANCE SHEET

P & L account Q1 2009
Other income Andre inntekter 75 - 123 Total income and profit Totale inntekter 212 210 453 120 1 122 451 Crew expenses Mannskapskostnader -47 417 -34 999 -166 725 Vessel expenses Fartøykostnader -15 987 -12 667 -71 429 Hire expenses Leiekostnader -26 810 -23 221 -105 092 Other operating expenses Andre driftskostnader -10 631 -7 058 -39 242 Total operating expenses Totale driftskostnader -100 845 -77 945 -382 487 Profit before depreciation Driftsresultat før avskrivning 111 365 375 175 739 964 Depreciation Avskrivninger -28 072 -22 669 -98 420 Operating profit Driftsresultat 83 293 352 506 641 544 Financial income Finansinntekter 144 534 8 942 56 645 Financial expenses Finanskostnader -66 219 -46 670 -448 259 Net financial items Netto finansposter 78 315 -37 728 -391 614 Assosiated companies Tilknyttet selskap 2 817 - 9 426 Profit before tax Resultat før skatt 164 425 314 778 259 356 Tax Skatt -16 363 -9 757 47 472 Profit after tax Resultat etter skatt 148 062 305 021 306 828 Other income and expenses Andre inntekter og kostnaderConversion difference foreign exch. Omregningsdifferanser valuta -594 394 181 Total profit for the period Totalresultat for perioden 147 468 305 415 307 009 Total profit for the period distributed by Periodens totalresultat fordelt påMinority interests Minoritetsinteresser -21 619 10 383 Majority interest Majoritetsinteresse 147 489 304 796 296 627
147 468 305 415 307 009
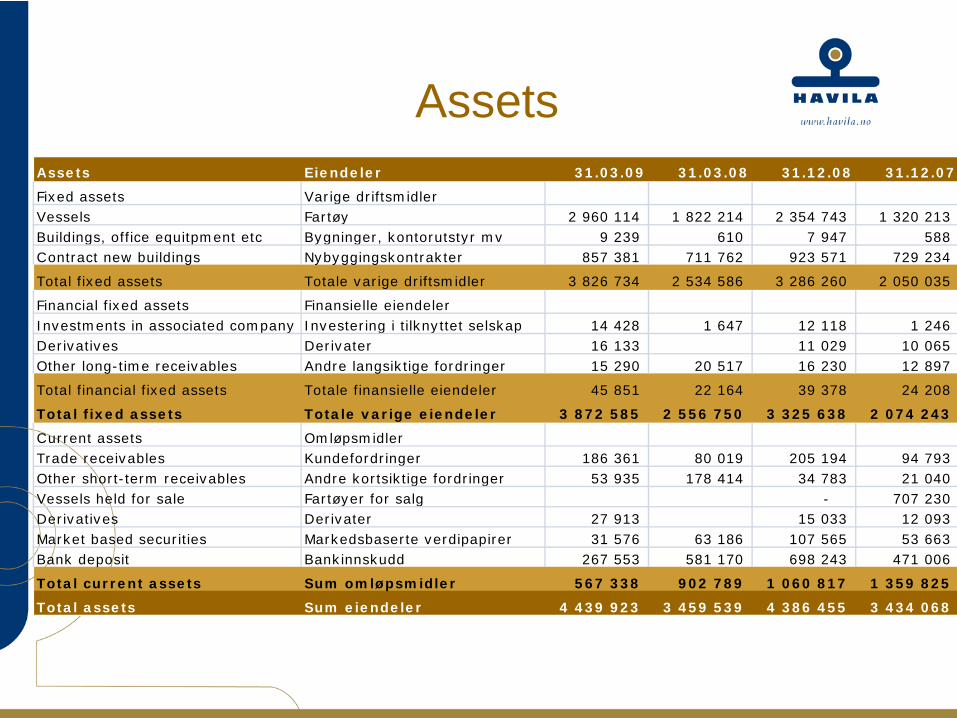
AssetsAssets Eiendeler 31.03.09 31.03.08 31.12.08 31.12.07
Fixed assets Varige driftsmidlerVessels Fartøy 2 960 114 1 822 214 2 354 743 1 320 213 Buildings, office equitpment etc Bygninger, kontorutstyr mv 9 239 610 7 947 588 Contract new buildings Nybyggingskontrakter 857 381 711 762 923 571 729 234
Total fixed assets Totale varige driftsmidler 3 826 734 2 534 586 3 286 260 2 050 035
Financial fixed assets Finansielle eiendelerInvestments in associated company Investering i tilknyttet selskap 14 428 1 647 12 118 1 246 Derivatives Derivater 16 133 11 029 10 065 Other long-time receivables Andre langsiktige fordringer 15 290 20 517 16 230 12 897
Total financial fixed assets Totale finansielle eiendeler 45 851 22 164 39 378 24 208
Total fixed assets Totale varige eiendeler 3 872 585 2 556 750 3 325 638 2 074 243
Current assets OmløpsmidlerTrade receivables Kundefordringer 186 361 80 019 205 194 94 793 Other short-term receivables Andre kortsiktige fordringer 53 935 178 414 34 783 21 040 Vessels held for sale Fartøyer for salg - 707 230 Derivatives Derivater 27 913 15 033 12 093 Market based securities Markedsbaserte verdipapirer 31 576 63 186 107 565 53 663 Bank deposit Bankinnskudd 267 553 581 170 698 243 471 006
Total current assets Sum omløpsmidler 567 338 902 789 1 060 817 1 359 825
Total assets Sum eiendeler 4 439 923 3 459 539 4 386 455 3 434 068
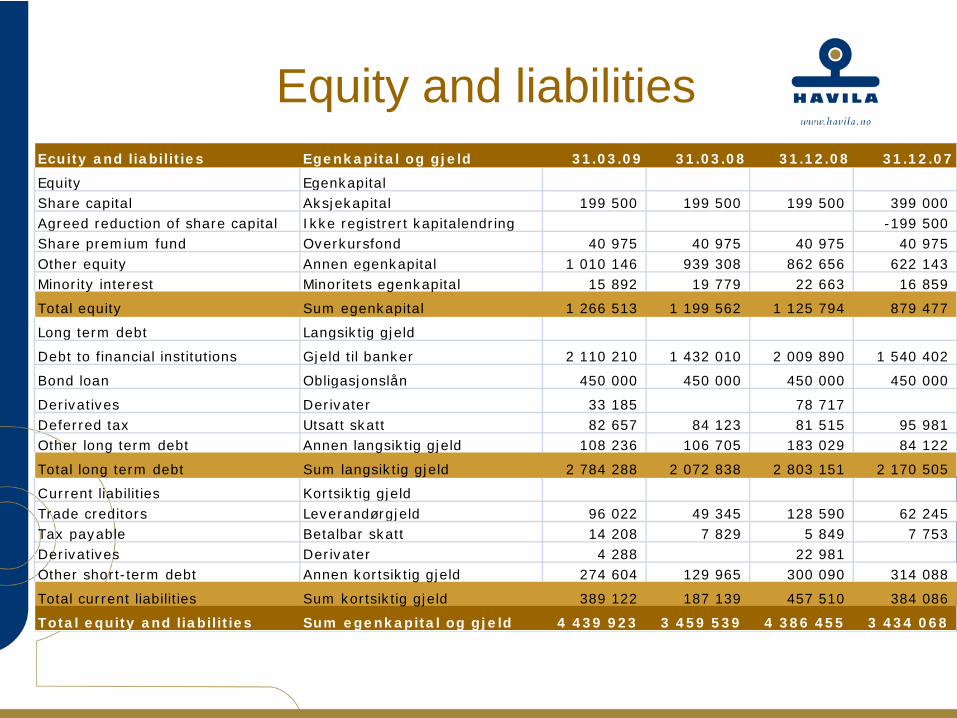
Equity and liabilitiesEcuity and liabilities Egenkapital og gjeld 31.03.09 31.03.08 31.12.08 31.12.07
Equity EgenkapitalShare capital Aksjekapital 199 500 199 500 199 500 399 000 Agreed reduction of share capital Ikke registrert kapitalendring -199 500 Share premium fund Overkursfond 40 975 40 975 40 975 40 975 Other equity Annen egenkapital 1 010 146 939 308 862 656 622 143 Minority interest Minoritets egenkapital 15 892 19 779 22 663 16 859
Total equity Sum egenkapital 1 266 513 1 199 562 1 125 794 879 477
Long term debt Langsiktig gjeld
Debt to financial institutions Gjeld til banker 2 110 210 1 432 010 2 009 890 1 540 402
Bond loan Obligasjonslån 450 000 450 000 450 000 450 000
Derivatives Derivater 33 185 78 717 Deferred tax Utsatt skatt 82 657 84 123 81 515 95 981 Other long term debt Annen langsiktig gjeld 108 236 106 705 183 029 84 122
Total long term debt Sum langsiktig gjeld 2 784 288 2 072 838 2 803 151 2 170 505
Current liabilities Kortsiktig gjeldTrade creditors Leverandørgjeld 96 022 49 345 128 590 62 245 Tax payable Betalbar skatt 14 208 7 829 5 849 7 753 Derivatives Derivater 4 288 22 981 Other short-term debt Annen kortsiktig gjeld 274 604 129 965 300 090 314 088
Total current liabilities Sum kortsiktig gjeld 389 122 187 139 457 510 384 086
Total equity and liabilities Sum egenkapital og gjeld 4 439 923 3 459 539 4 386 455 3 434 068