Embed Size (px)
Citation preview


ÍNDICE Análisis presupuesto 2018:
o Gastoso Ingresos
Análisis comparativo presupuestos años 2018 y 2017:o Gastoso Ingresos
Gráfico de evolución del presupuesto municipal de los últimos 10 años (2008-18).
Evolución de la población municipal 2003-2018.
Otros datos de interés.
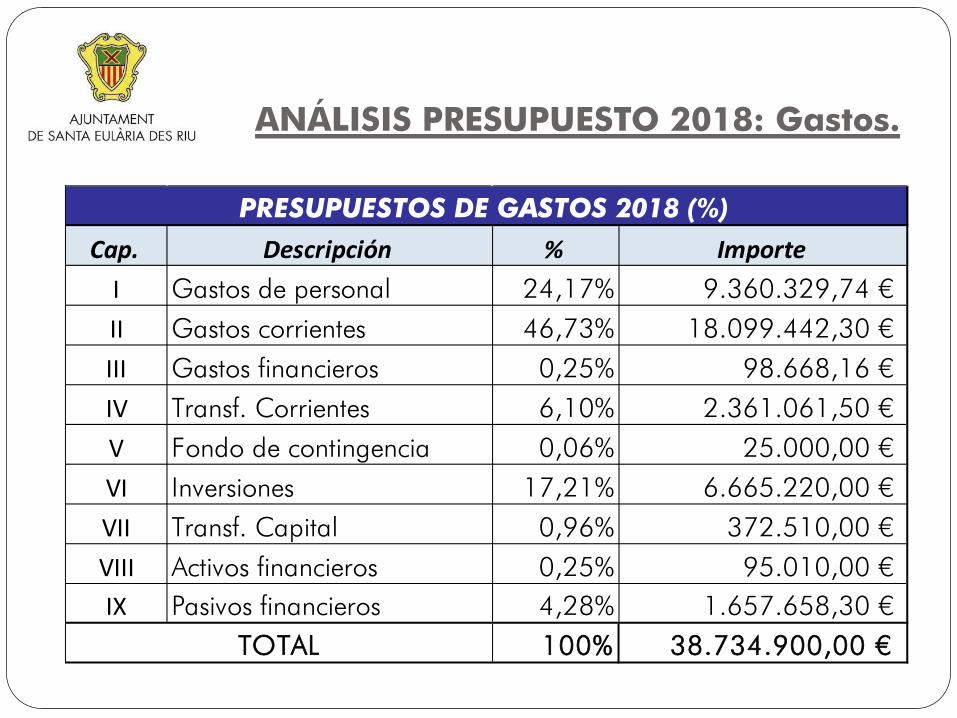
ANÁLISIS PRESUPUESTO 2018: Gastos.
Cap. Descripción % ImporteI Gastos de personal 24,17% 9.360.329,74 € II Gastos corrientes 46,73% 18.099.442,30 € III Gastos financieros 0,25% 98.668,16 € IV Transf. Corrientes 6,10% 2.361.061,50 € V Fondo de contingencia 0,06% 25.000,00 € VI Inversiones 17,21% 6.665.220,00 € VII Transf. Capital 0,96% 372.510,00 € VIII Activos financieros 0,25% 95.010,00 € IX Pasivos financieros 4,28% 1.657.658,30 €
100% 38.734.900,00 €
PRESUPUESTOS DE GASTOS 2018 (%)
TOTAL

ANÁLISIS PRESUPUESTO 2018: Gastos.
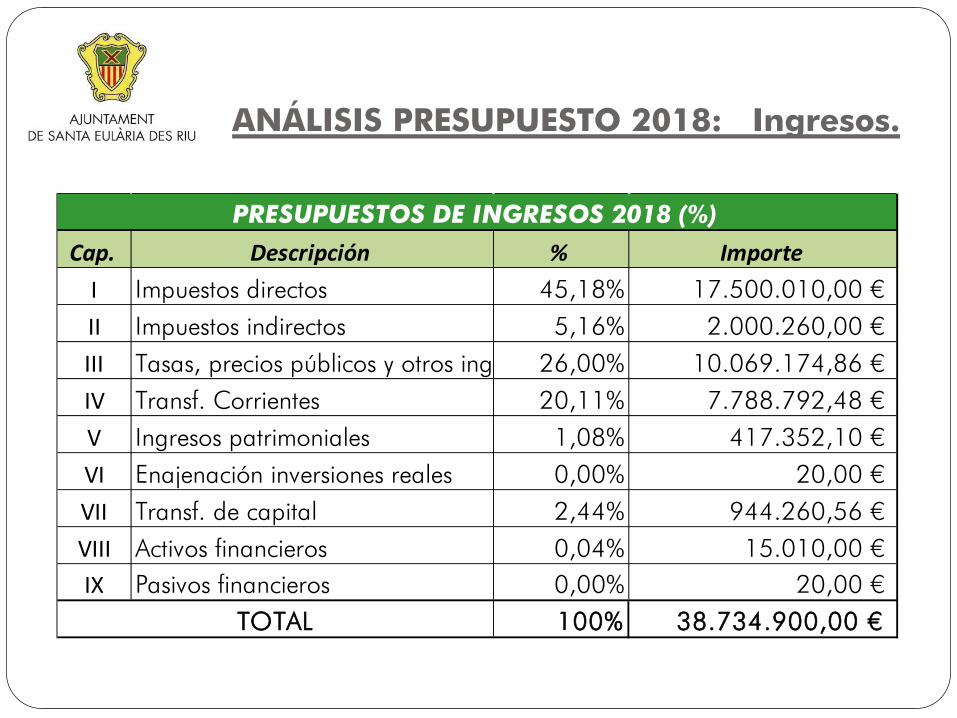
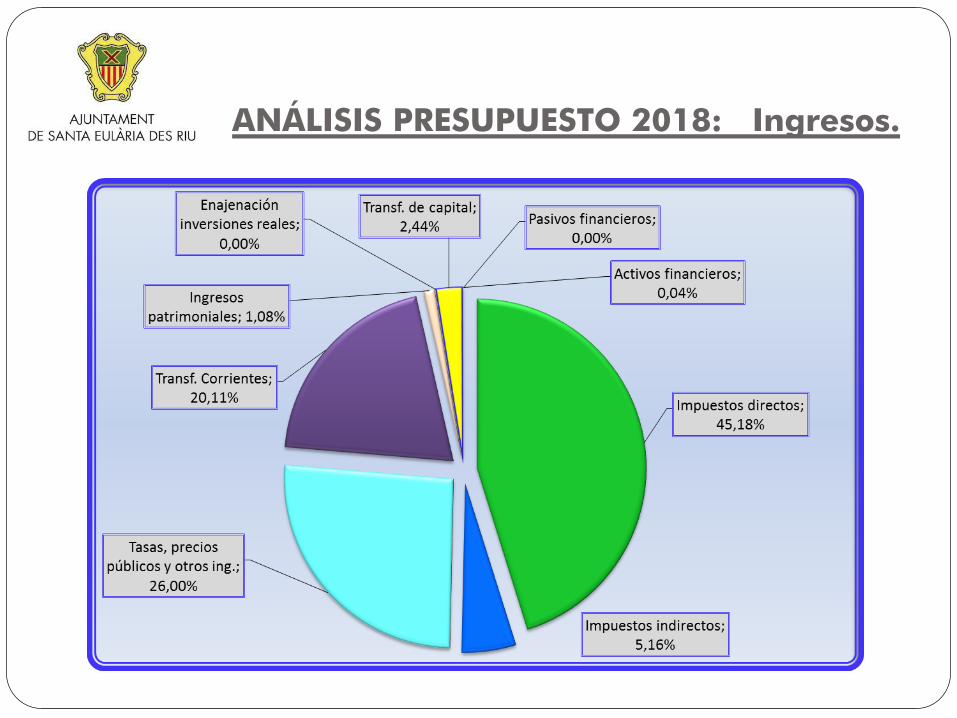
ANÁLISIS PRESUPUESTO 2018: Ingresos.
Cap. Descripción % ImporteI Impuestos directos 45,18% 17.500.010,00 € II Impuestos indirectos 5,16% 2.000.260,00 € III Tasas, precios públicos y otros ing 26,00% 10.069.174,86 € IV Transf. Corrientes 20,11% 7.788.792,48 € V Ingresos patrimoniales 1,08% 417.352,10 € VI Enajenación inversiones reales 0,00% 20,00 € VII Transf. de capital 2,44% 944.260,56 € VIII Activos financieros 0,04% 15.010,00 € IX Pasivos financieros 0,00% 20,00 €
100% 38.734.900,00 €
PRESUPUESTOS DE INGRESOS 2018 (%)
TOTAL
ANÁLISIS PRESUPUESTO 2018: Ingresos.
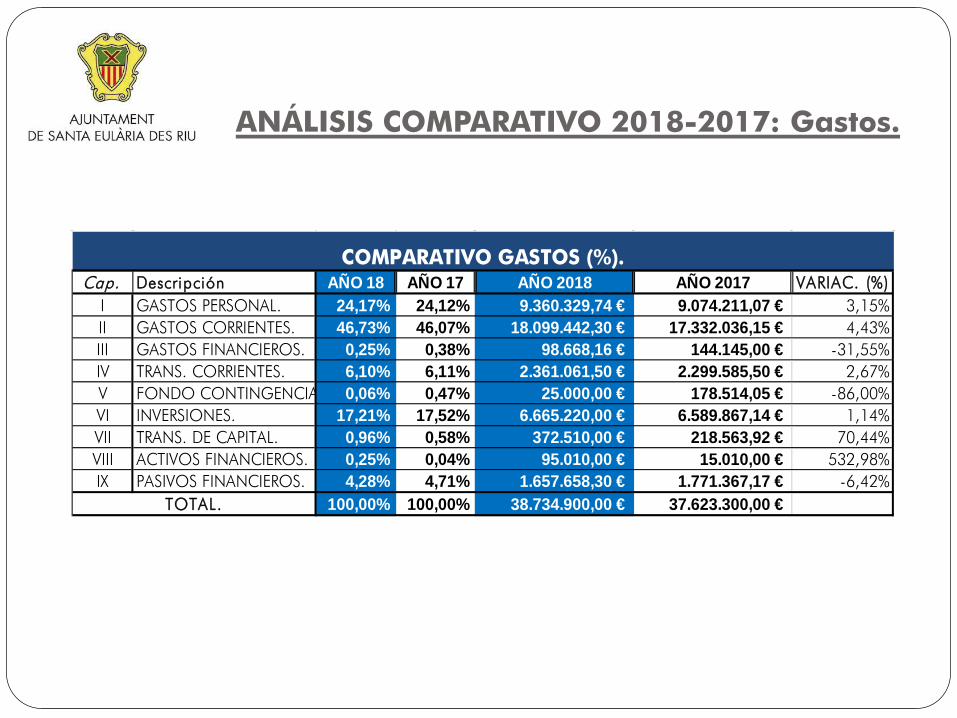
ANÁLISIS COMPARATIVO 2018-2017: Gastos.
Cap. Descripción AÑO 18 AÑO 17 AÑO 2018 AÑO 2017 VARIAC. (%)I GASTOS PERSONAL. 24,17% 24,12% 9.360.329,74 € 9.074.211,07 € 3,15%II GASTOS CORRIENTES. 46,73% 46,07% 18.099.442,30 € 17.332.036,15 € 4,43%III GASTOS FINANCIEROS. 0,25% 0,38% 98.668,16 € 144.145,00 € -31,55%IV TRANS. CORRIENTES. 6,10% 6,11% 2.361.061,50 € 2.299.585,50 € 2,67%V FONDO CONTINGENCIA 0,06% 0,47% 25.000,00 € 178.514,05 € -86,00%VI INVERSIONES. 17,21% 17,52% 6.665.220,00 € 6.589.867,14 € 1,14%VII TRANS. DE CAPITAL. 0,96% 0,58% 372.510,00 € 218.563,92 € 70,44%VIII ACTIVOS FINANCIEROS. 0,25% 0,04% 95.010,00 € 15.010,00 € 532,98%IX PASIVOS FINANCIEROS. 4,28% 4,71% 1.657.658,30 € 1.771.367,17 € -6,42%
100,00% 100,00% 38.734.900,00 € 37.623.300,00 € TOTAL.
COMPARATIVO GASTOS (%).

ANÁLISIS COMPARATIVO 2018-2017: Gastos.
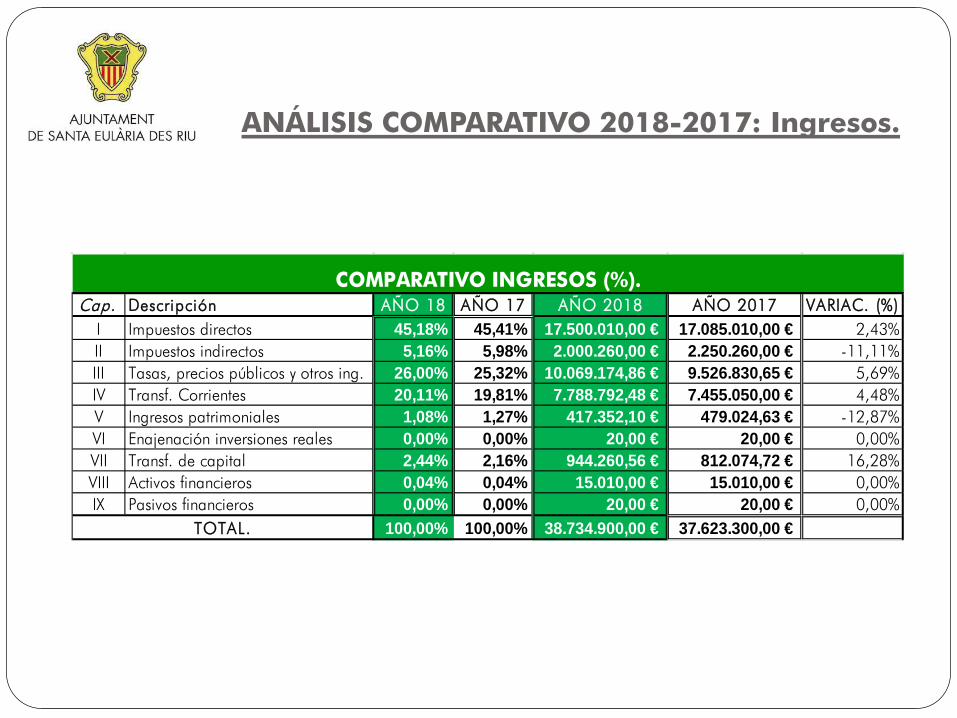
ANÁLISIS COMPARATIVO 2018-2017: Ingresos.
Cap. Descripción AÑO 18 AÑO 17 AÑO 2018 AÑO 2017 VARIAC. (%)I Impuestos directos 45,18% 45,41% 17.500.010,00 € 17.085.010,00 € 2,43%II Impuestos indirectos 5,16% 5,98% 2.000.260,00 € 2.250.260,00 € -11,11%III Tasas, precios públicos y otros ing. 26,00% 25,32% 10.069.174,86 € 9.526.830,65 € 5,69%IV Transf. Corrientes 20,11% 19,81% 7.788.792,48 € 7.455.050,00 € 4,48%V Ingresos patrimoniales 1,08% 1,27% 417.352,10 € 479.024,63 € -12,87%VI Enajenación inversiones reales 0,00% 0,00% 20,00 € 20,00 € 0,00%VII Transf. de capital 2,44% 2,16% 944.260,56 € 812.074,72 € 16,28%VIII Activos financieros 0,04% 0,04% 15.010,00 € 15.010,00 € 0,00%IX Pasivos financieros 0,00% 0,00% 20,00 € 20,00 € 0,00%
100,00% 100,00% 38.734.900,00 € 37.623.300,00 €
COMPARATIVO INGRESOS (%).
TOTAL.

ANÁLISIS COMPARATIVO 2018-2017: Ingresos.

EVOLUCIÓN PRESUPUESTO MUNICIPAL 2008-2018

EVOLUCIÓN POBLACIÓN MUNICIPAL 2003-2016
1 2 3 4 5 6 7 8 9 10 11 12 13 14AÑO 2003 2004 2005 2006 2007 2008 2009 2010 2011 2012 2013 2014 2015 2016Nª HABITANTES 25.918 25.826 26.724 27.152 28.361 30.364 31.314 32.637 33.734 34.946 36.464 36.189 35.812 36.119
OTROS DATOS DE INTERÉS.
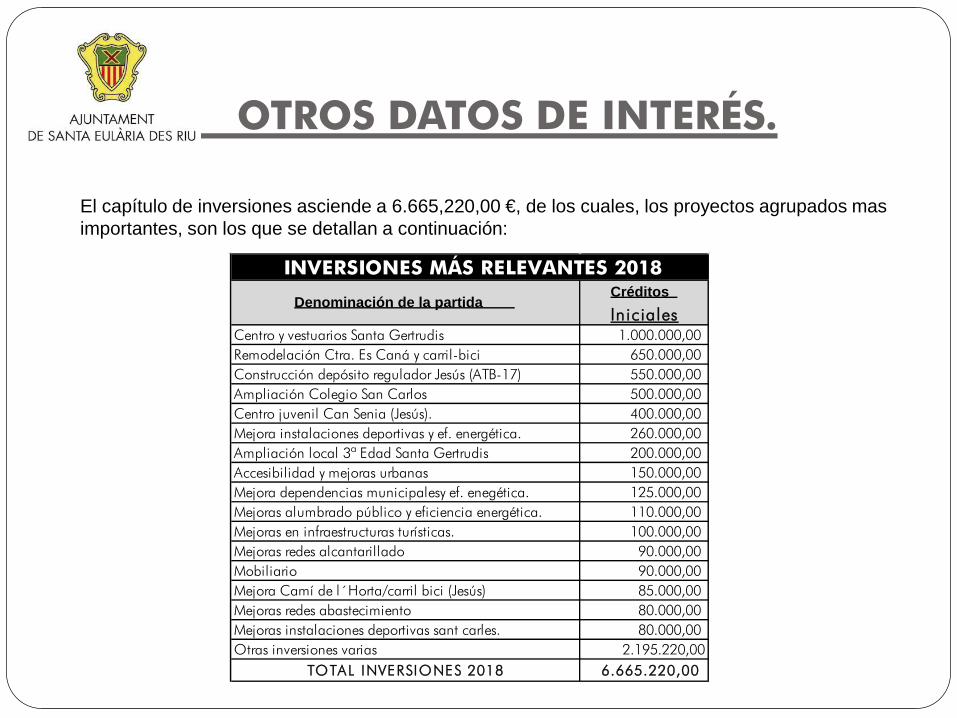
El capítulo de inversiones asciende a 6.665,220,00 €, de los cuales, los proyectos agrupados mas importantes, son los que se detallan a continuación:
CréditosIn iciales
Centro y vestuarios Santa Gertrudis 1.000.000,00Remodelación Ctra. Es Caná y carril-bici 650.000,00Construcción depósito regulador Jesús (ATB-17) 550.000,00Ampliación Colegio San Carlos 500.000,00Centro juvenil Can Senia (Jesús). 400.000,00Mejora instalaciones deportivas y ef. energética. 260.000,00Ampliación local 3ª Edad Santa Gertrudis 200.000,00Accesibilidad y mejoras urbanas 150.000,00Mejora dependencias municipalesy ef. enegética. 125.000,00Mejoras alumbrado público y eficiencia energética. 110.000,00Mejoras en infraestructuras turísticas. 100.000,00Mejoras redes alcantarillado 90.000,00Mobiliario 90.000,00Mejora Camí de l´Horta/carril bici (Jesús) 85.000,00Mejoras redes abastecimiento 80.000,00Mejoras instalaciones deportivas sant carles. 80.000,00Otras inversiones varias 2.195.220,00
TOTAL INVERSIONES 2018 6.665.220,00
Denominación de la partida
INVERSIONES MÁS RELEVANTES 2018

OTROS DATOS DE INTERÉS.
Los proyectos plurianuales para 2018 son los que a continuación se detallan y que ascienden a 2.550.000,00 €:
OBRA 2018 2019 2020 TOTAL
Ampliación colegio Sant Carles 500.000,00 1.800.000,00 2.300.000,00
Centro juvenil Can Sènia - Jesús 400.000,00 600.000,00 1.000.000,00
Centro y vestuarios santa Gertrudis 1.000.000,00 1.500.000,00 2.500.000,00
Remodelación carretera es canar y carril bici 650.000,00 1.400.000,00 750.000,00 2.800.000,00
TOTALES 2.550.000,00 5.300.000,00 750.000,00 8.600.000,00
PROYECTOS PLURIANUALES PRESUPUESTO 2018
OTROS DATOS DE INTERÉS.
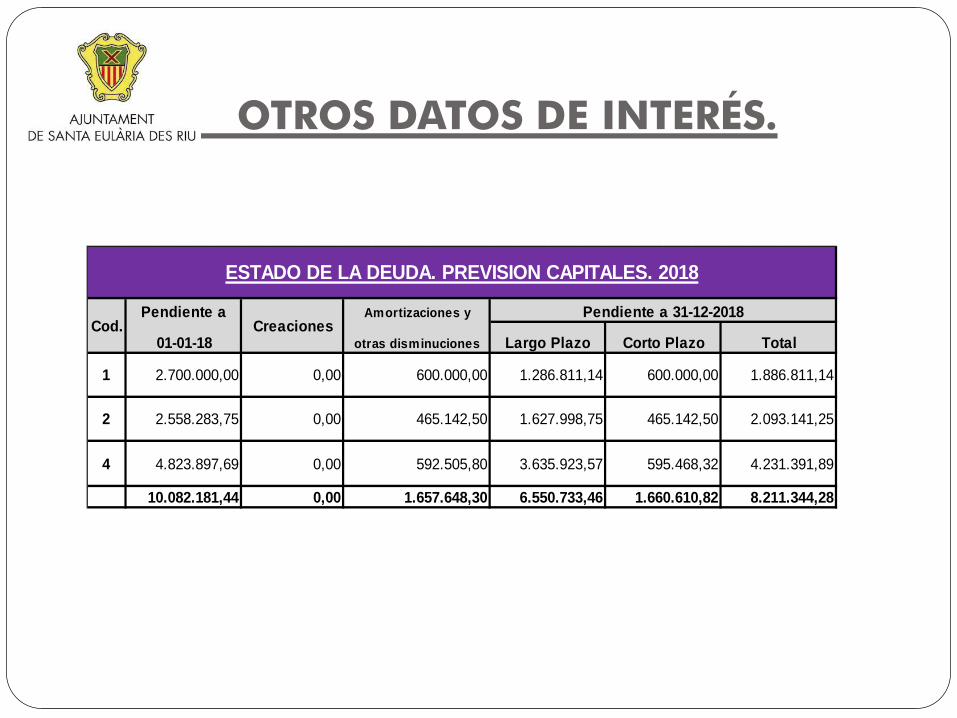
1.660.610,82 8.211.344,28
3.635.923,57
ESTADO DE LA DEUDA. PREVISION CAPITALES. 2018
4 4.823.897,69 0,00 592.505,80 4.231.391,89
10.082.181,44 0,00 1.657.648,30 6.550.733,46
595.468,32
1.886.811,14
0,00 465.142,50 1.627.998,75 465.142,50
Corto Plazo
2.093.141,25
1 2.700.000,00 0,00 600.000,00 1.286.811,14 600.000,00
2 2.558.283,75
Cod.Pendiente a
CreacionesAmortizaciones y Pendiente a 31-12-2018
01-01-18 otras disminuciones TotalLargo Plazo
OTROS DATOS DE INTERÉS.
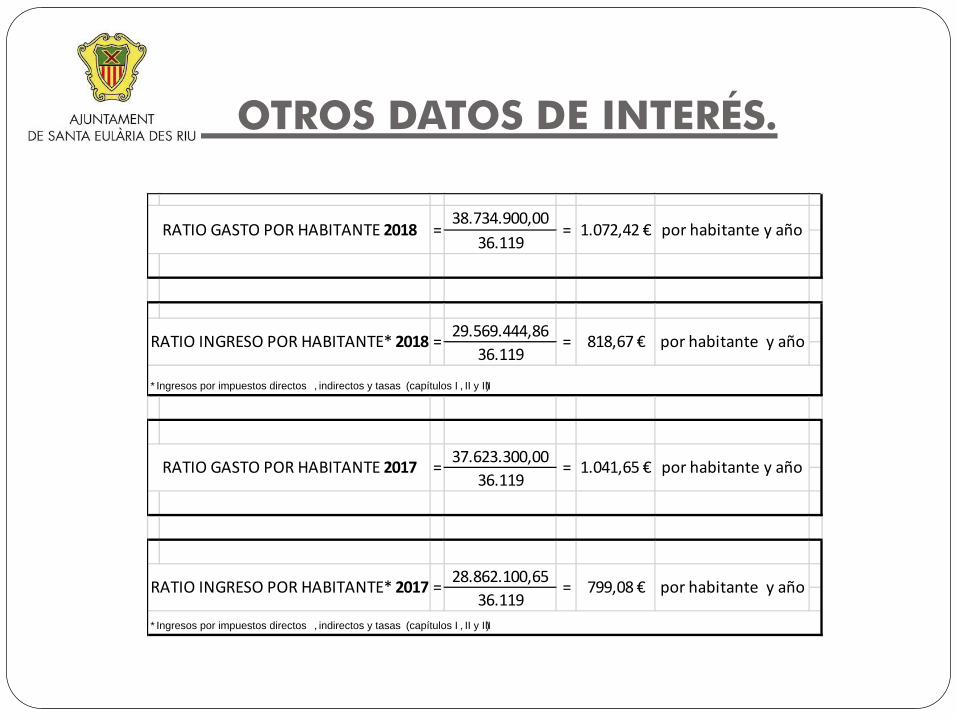
38.734.900,0036.119
29.569.444,8636.119
37.623.300,0036.119
28.862.100,6536.119
* Ingresos por impuestos directos , indirectos y tasas (capítulos I , II y III)
= = 1.072,42 € por habitante y año
= = 818,67 € por habitante y año
RATIO GASTO POR HABITANTE 2018
RATIO INGRESO POR HABITANTE* 2018
RATIO GASTO POR HABITANTE 2017 = = 1.041,65 € por habitante y año
* Ingresos por impuestos directos , indirectos y tasas (capítulos I , II y III)
RATIO INGRESO POR HABITANTE* 2017 = = 799,08 € por habitante y año

GRACIAS POR SU ATENCIÓN