Embed Size (px)
DESCRIPTION
Prevalence of PAH in SSc. 1. Mukerjee D, et al. Ann Rheum Dis 2003; 62:1088-93. 2. Hachulla E, et al. Arthritis Rheum 2005; 52:3792-800. 3. Phung S, et al. Intern Med J 2009; 39:682-91, 4. Vonk MC, et al. Ann Rheum Dis 2009 ; 68:961-5. RHC: Right heart catheterization. - PowerPoint PPT Presentation
Citation preview
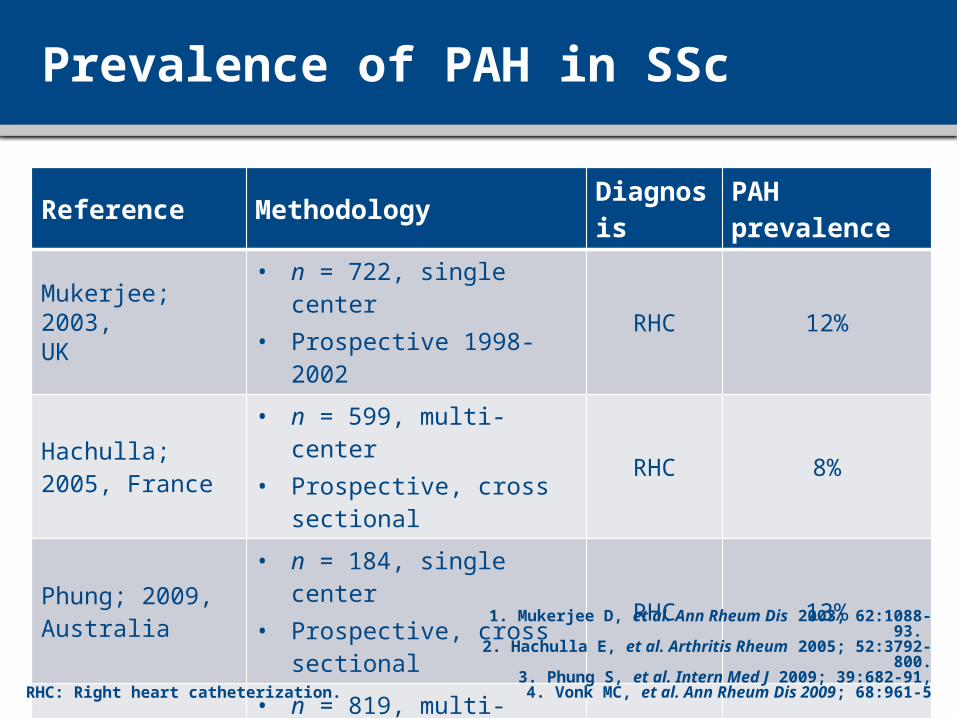
Prevalence of PAH in SSc
Reference Methodology Diagnosis PAH prevalenceMukerjee; 2003, UK
• n = 722, single center• Prospective 1998-2002 RHC 12%
Hachulla; 2005, France
• n = 599, multi-center• Prospective, cross sectional RHC 8%
Phung; 2009, Australia
• n = 184, single center• Prospective, cross sectional RHC 13%
Vonk; 2009,Netherlands
• n = 819, multi-center• Prospective 2005-2007 RHC 9,9%
RHC: Right heart catheterization.
1. Mukerjee D, et al. Ann Rheum Dis 2003; 62:1088-93. 2. Hachulla E, et al. Arthritis Rheum 2005; 52:3792-800.
3. Phung S, et al. Intern Med J 2009; 39:682-91,4. Vonk MC, et al. Ann Rheum Dis 2009; 68:961-5
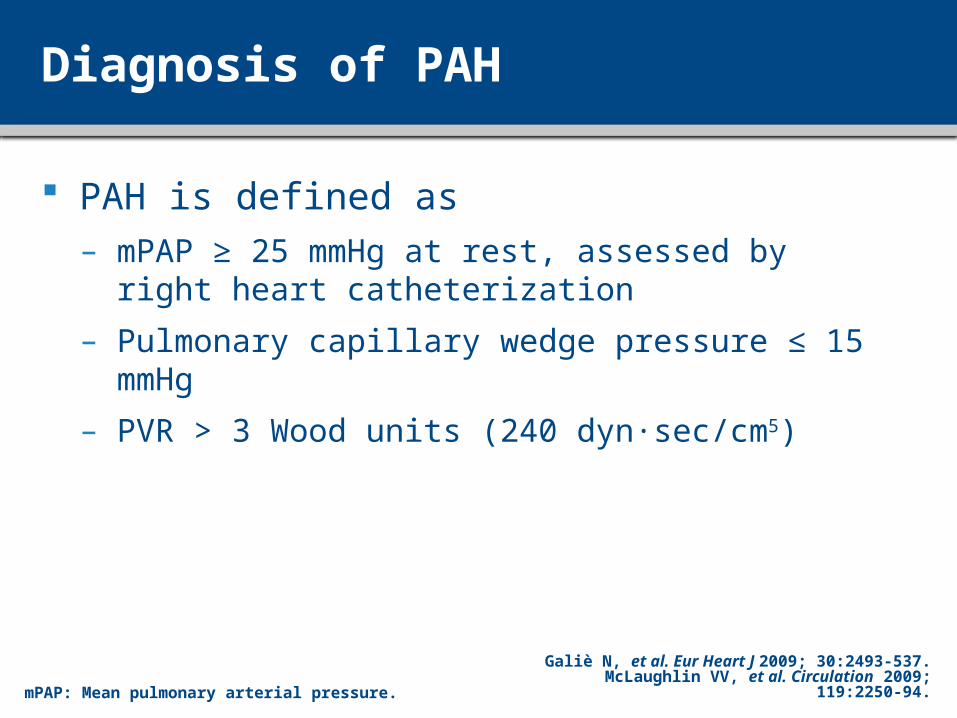
Diagnosis of PAH
PAH is defined as – mPAP ≥ 25 mmHg at rest, assessed by right heart
catheterization
– Pulmonary capillary wedge pressure ≤ 15 mmHg
– PVR > 3 Wood units (240 dyn sec/cm∙ 5)
Galiè N, et al. Eur Heart J 2009; 30:2493-537.McLaughlin VV, et al. Circulation 2009; 119:2250-94.mPAP: Mean pulmonary arterial pressure.
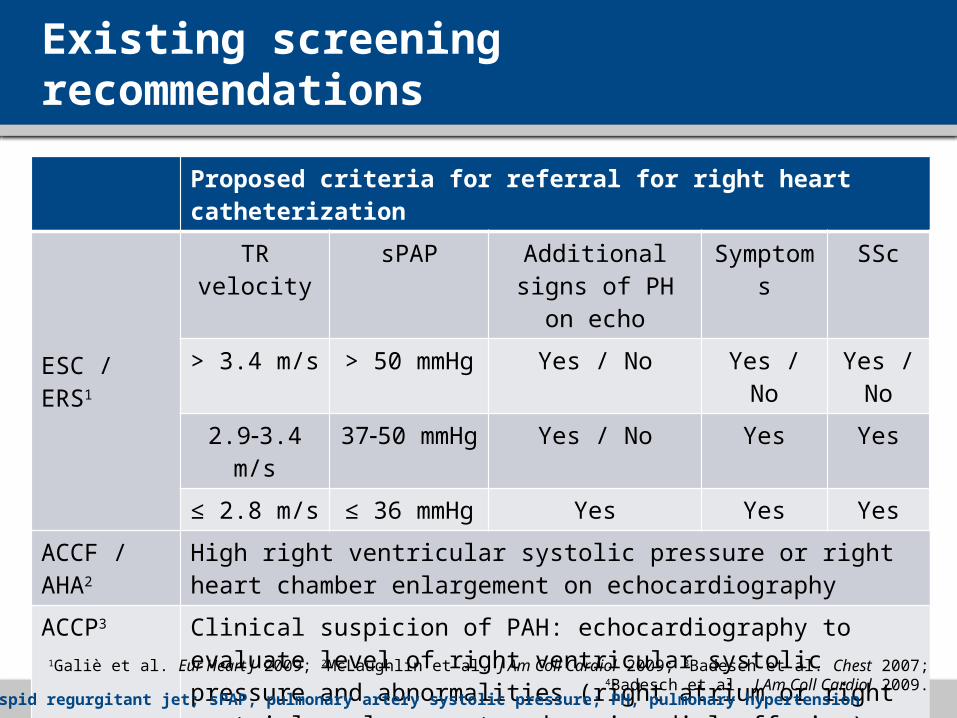
Existing screening recommendations
Proposed criteria for referral for right heart catheterization
ESC / ERS1
TR velocity sPAP Additional signs of PH on echo
Symptoms SSc
> 3.4 m/s > 50 mmHg Yes / No Yes / No Yes / No
2.93.4 m/s 3750 mmHg Yes / No Yes Yes
≤ 2.8 m/s ≤ 36 mmHg Yes Yes Yes
ACCF / AHA2 High right ventricular systolic pressure or right heart chamber enlargement on echocardiography
ACCP3 Clinical suspicion of PAH: echocardiography to evaluate level of right ventricular systolic pressure and abnormalities (right atrium or right ventricle enlargement and pericardial effusion)
Dana Point4 No recommendation
ESC / ERS, European Society of Cardiology / European Respiratory Society; ACCF / AHA, American College of Cardiology Foundation / American Heart Association; ACCP, American College of Chest Physicians
1Galiè et al. Eur Heart J 2009; 2McLaughlin et al. J Am Coll Cardiol 2009; 3Badesch et al. Chest 2007; 4Badesch et al. J Am Coll Cardiol 2009.
TR, tricuspid regurgitant jet; sPAP, pulmonary artery systolic pressure; PH, pulmonary hypertension
Background
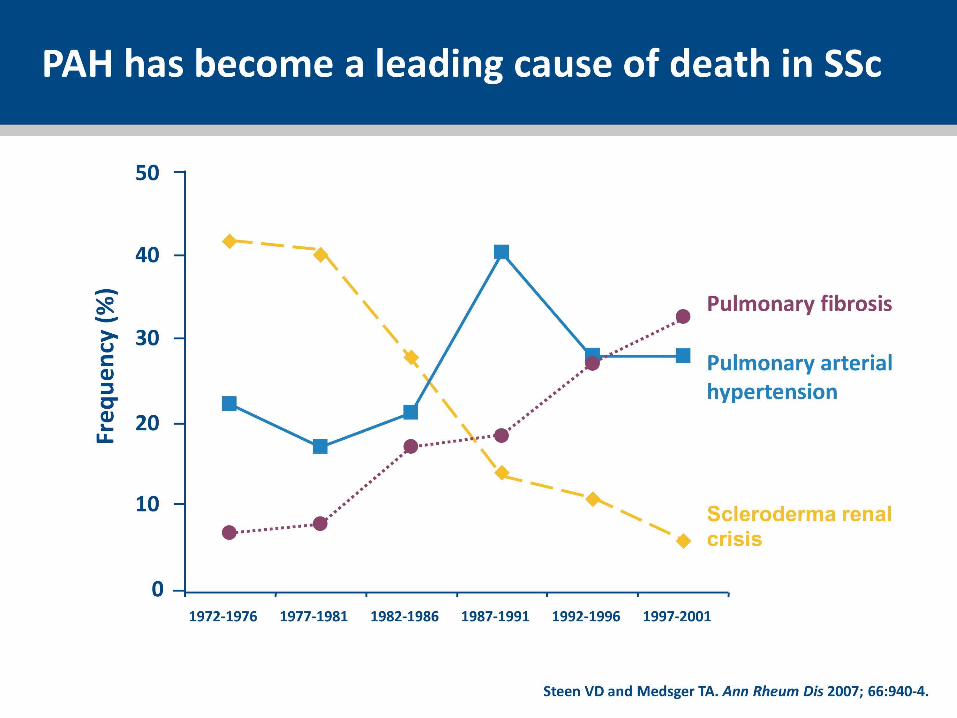
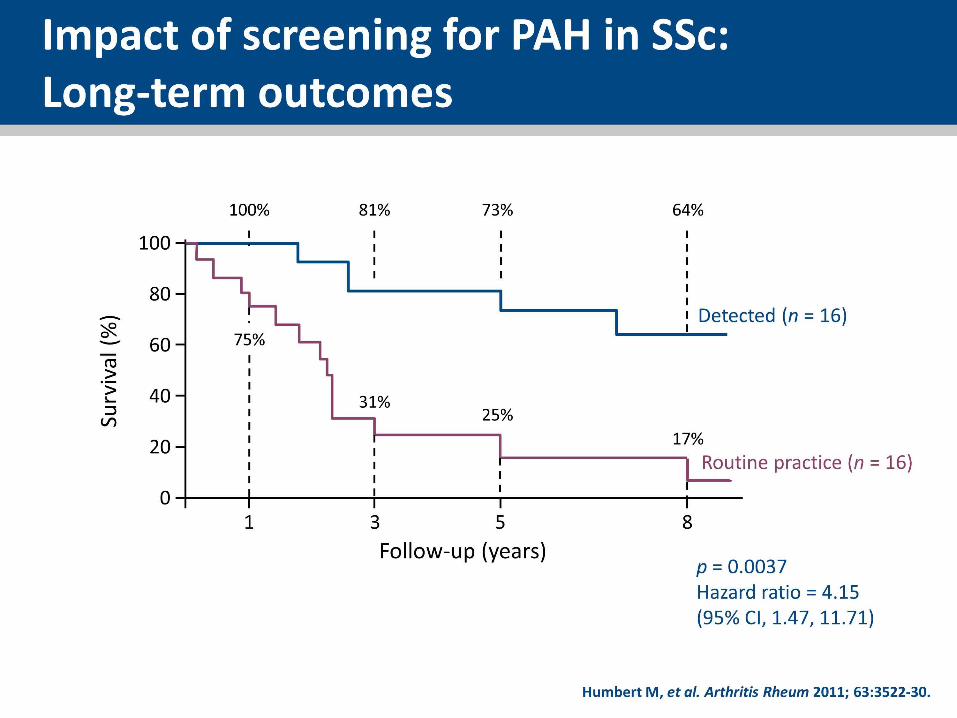
PAH is the leading cause of death in SSc patients1,2
Screening may lead to earlier diagnosis and intervention and thus to improved outcomes
Current screening is based on consensus rather than robust evidence
No single laboratory test is shown to be adequate
PAH, pulmonary arterial hypertension; SSc, systemic sclerosis
1Steen and Medsger. Ann Rheum Dis 2007; 2Tyndall et al. Ann Rheum Dis 2010.
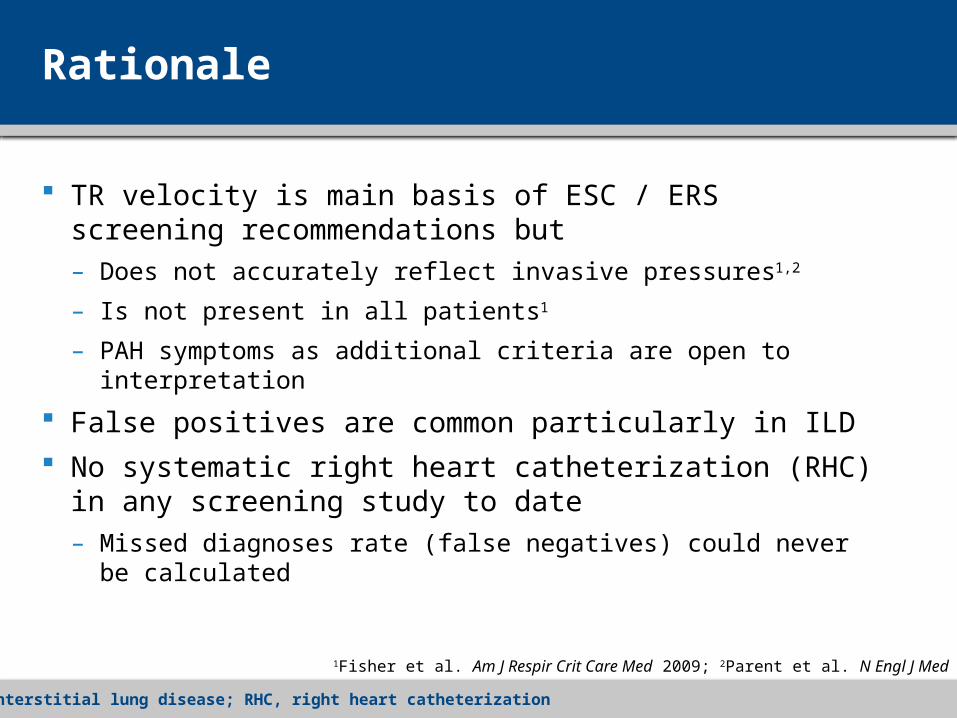
Rationale
TR velocity is main basis of ESC / ERS screening recommendations but– Does not accurately reflect invasive pressures1,2
– Is not present in all patients1
– PAH symptoms as additional criteria are open to interpretation
False positives are common particularly in ILD No systematic right heart catheterization (RHC) in any
screening study to date– Missed diagnoses rate (false negatives) could never be calculated
1Fisher et al. Am J Respir Crit Care Med 2009; 2Parent et al. N Engl J Med 2011.
ILD, interstitial lung disease; RHC, right heart catheterization
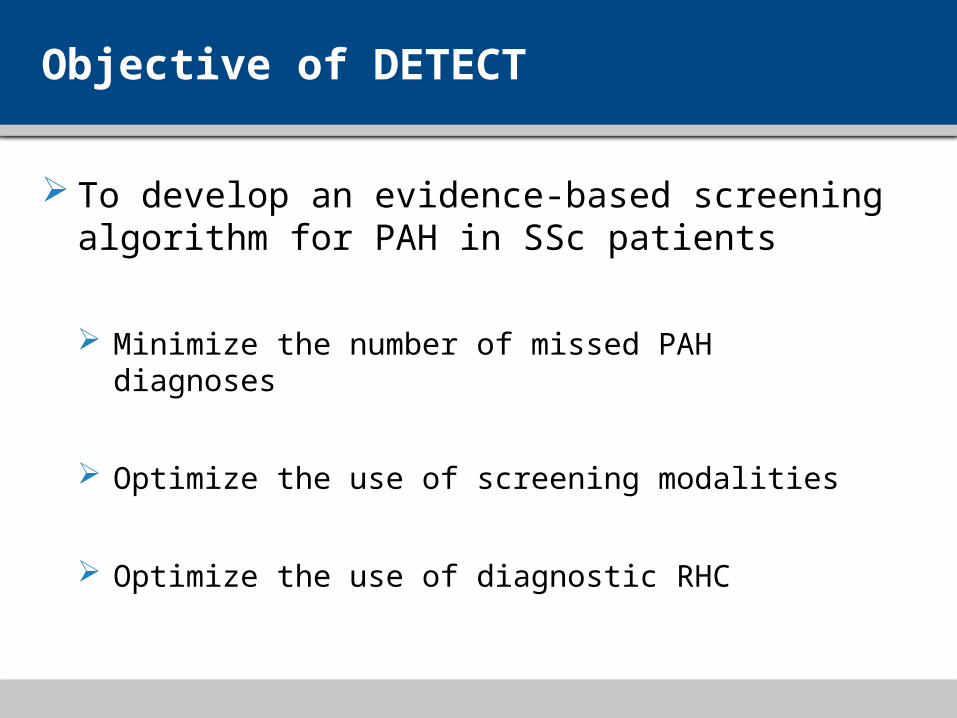
Objective of DETECT
To develop an evidence-based screening algorithm for PAH in SSc patients
Minimize the number of missed PAH diagnoses
Optimize the use of screening modalities
Optimize the use of diagnostic RHC
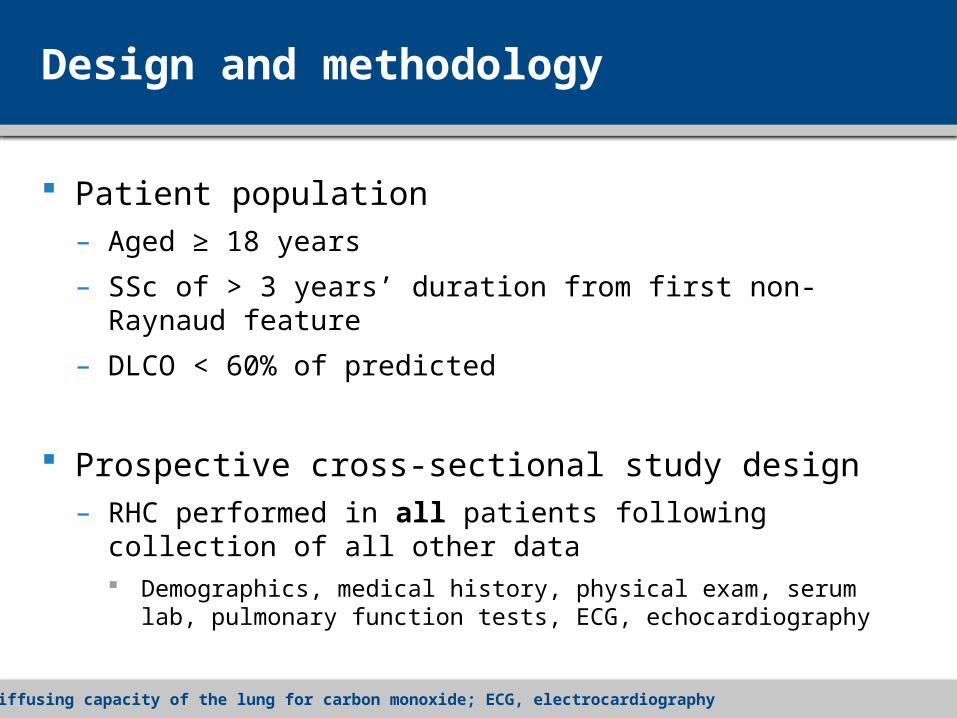
Design and methodology
Patient population– Aged ≥ 18 years
– SSc of > 3 years’ duration from first non-Raynaud feature
– DLCO < 60% of predicted
Prospective cross-sectional study design– RHC performed in all patients following collection of all
other data Demographics, medical history, physical exam, serum lab,
pulmonary function tests, ECG, echocardiography
DLCO, diffusing capacity of the lung for carbon monoxide; ECG, electrocardiography
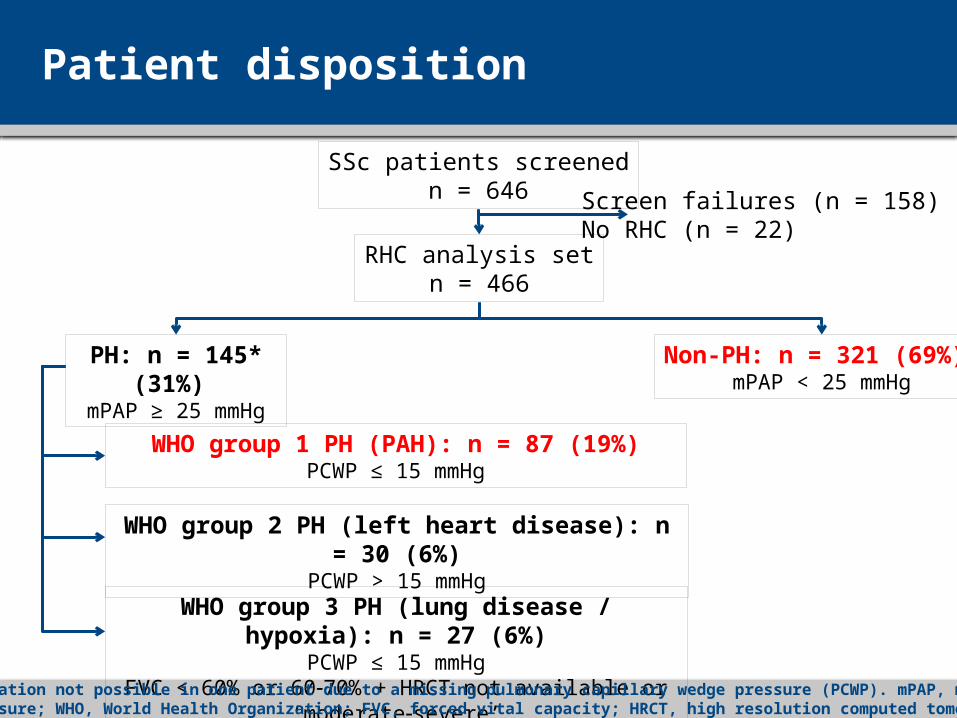
Patient disposition
SSc patients screenedn = 646
RHC analysis setn = 466
Screen failures (n = 158)No RHC (n = 22)
PH: n = 145* (31%) mPAP ≥ 25 mmHg
Non-PH: n = 321 (69%) mPAP < 25 mmHg
WHO group 1 PH (PAH): n = 87 (19%)PCWP ≤ 15 mmHg
WHO group 2 PH (left heart disease): n = 30 (6%)PCWP > 15 mmHg
WHO group 3 PH (lung disease / hypoxia): n = 27 (6%)PCWP ≤ 15 mmHg
FVC < 60% or 6070% + HRCT not available or ‘moderatesevere’*PH classification not possible in one patient due to a missing pulmonary capillary wedge pressure (PCWP). mPAP, mean pulmonary arterial pressure; WHO, World Health Organization; FVC, forced vital capacity; HRCT, high resolution computed tomography
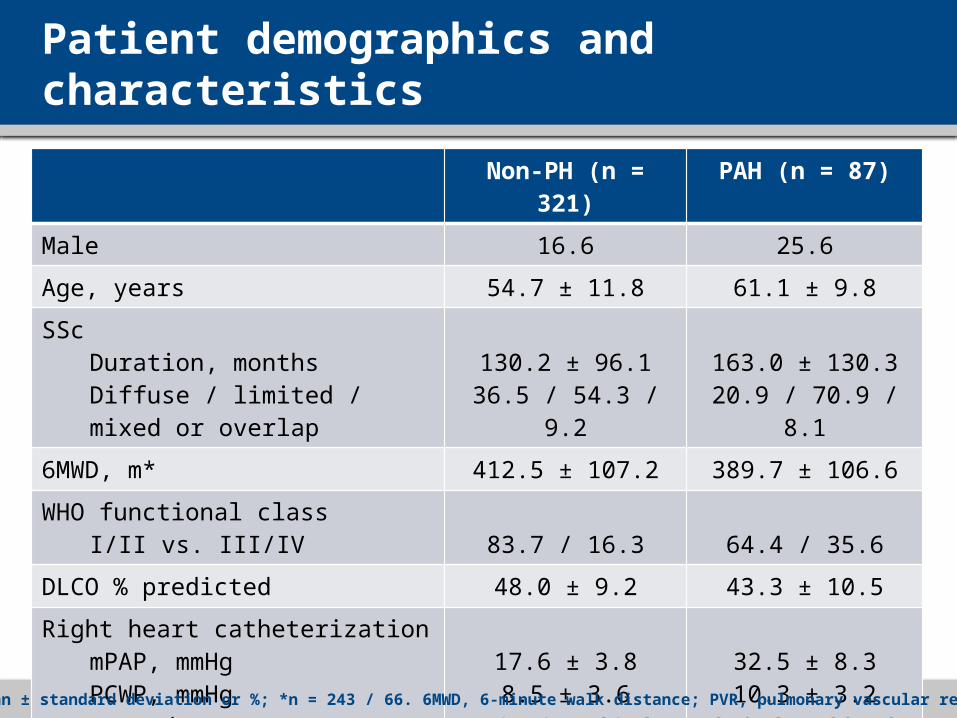
Patient demographics and characteristics
Non-PH (n = 321) PAH (n = 87)Male 16.6 25.6Age, years 54.7 ± 11.8 61.1 ± 9.8SSc
Duration, monthsDiffuse / limited / mixed or overlap
130.2 ± 96.136.5 / 54.3 / 9.2
163.0 ± 130.320.9 / 70.9 / 8.1
6MWD, m* 412.5 ± 107.2 389.7 ± 106.6WHO functional class
I/II vs. III/IV 83.7 / 16.3 64.4 / 35.6DLCO % predicted 48.0 ± 9.2 43.3 ± 10.5Right heart catheterization
mPAP, mmHgPCWP, mmHgPVR, dyn·sec/cm5
Cardiac index, L/min/m2
17.6 ± 3.88.5 ± 3.6
145.4 ± 64.63.0 ± 0.7
32.5 ± 8.310.3 ± 3.2
370.6 ± 225.82.9 ± 0.6
Data are mean ± standard deviation or %; *n = 243 / 66. 6MWD, 6-minute walk distance; PVR, pulmonary vascular resistance
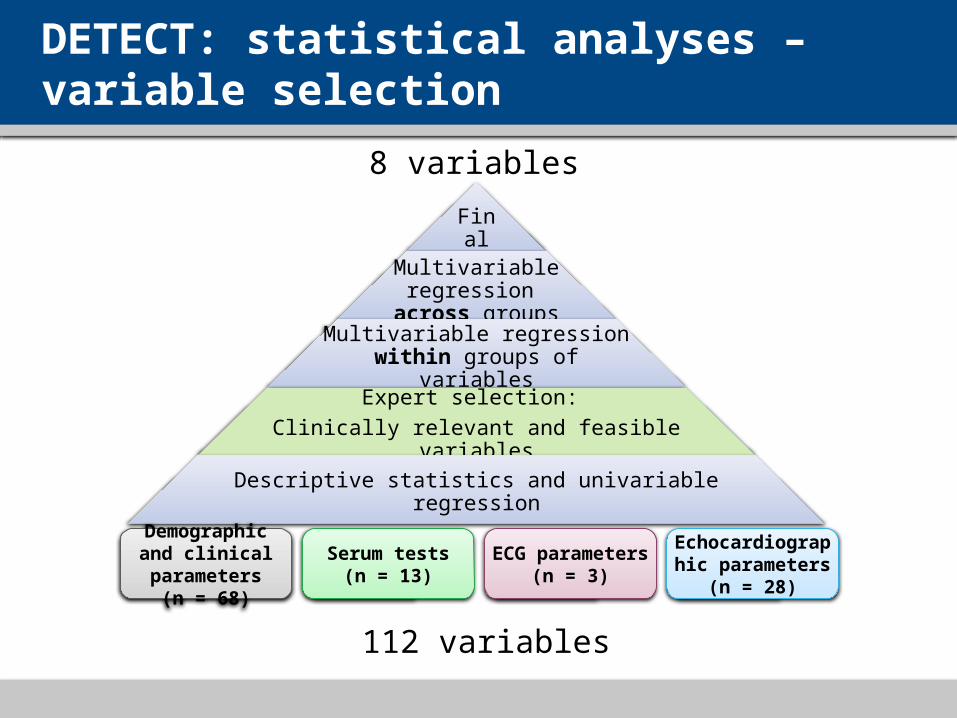
DETECT: statistical analyses – variable selection
Final
Multivariable regression
across groupsMultivariable regression
within groups of variables
Expert selection: Clinically relevant and feasible variables
Descriptive statistics and univariable regression
Demographic and clinical parameters
(n = 68)
Serum tests(n = 13)
ECG parameters(n = 3)
Echocardiographic parameters
(n = 28)
112 variables
8 variables
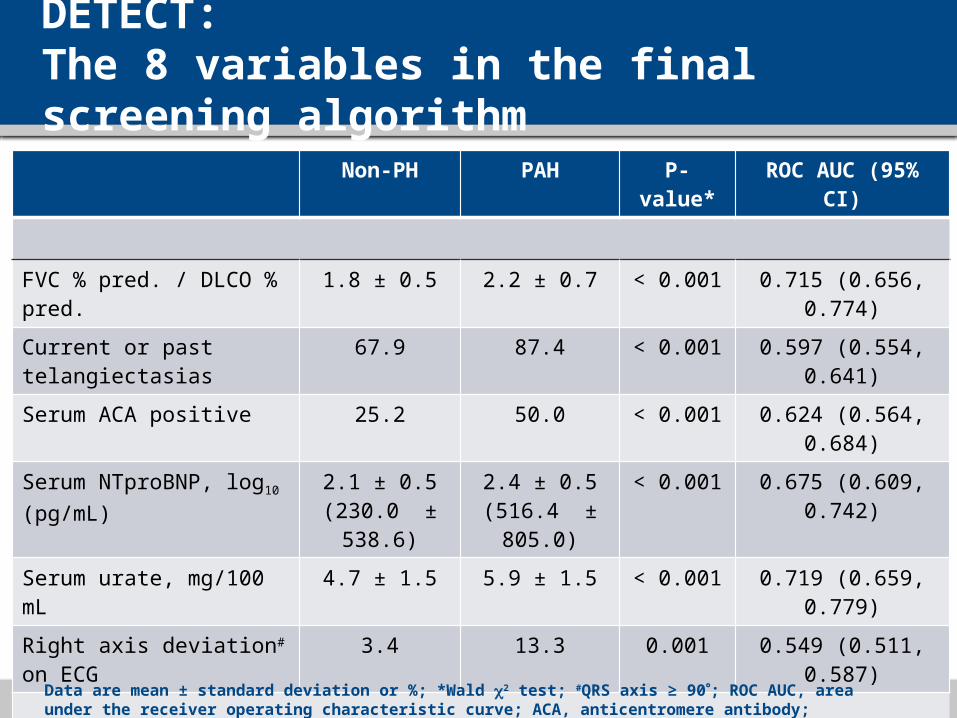
DETECT: The 8 variables in the final screening algorithm
Non-PH PAH P-value* ROC AUC (95% CI)
FVC % pred. / DLCO % pred. 1.8 ± 0.5 2.2 ± 0.7 < 0.001 0.715 (0.656, 0.774)
Current or past telangiectasias 67.9 87.4 < 0.001 0.597 (0.554, 0.641)
Serum ACA positive 25.2 50.0 < 0.001 0.624 (0.564, 0.684)
Serum NTproBNP, log10
(pg/mL)2.1 ± 0.5
(230.0 ± 538.6)2.4 ± 0.5
(516.4 ± 805.0)< 0.001 0.675 (0.609, 0.742)
Serum urate, mg/100 mL 4.7 ± 1.5 5.9 ± 1.5 < 0.001 0.719 (0.659, 0.779)
Right axis deviation# on ECG 3.4 13.3 0.001 0.549 (0.511, 0.587)
Right atrium area, cm2 13.4 ± 4.7 17.1 ± 6.2 < 0.001 0.712 (0.650, 0.773)
TR velocity, m/s 2.4 ± 0.6 3.0 ± 0.8 < 0.001 0.795 (0.737, 0.853)
Data are mean ± standard deviation or %; *Wald 2 test; #QRS axis ≥ 90; ROC AUC, area under the receiver operating characteristic curve; ACA, anticentromere antibody; NTproBNP, N-terminal pro-brain natriuretic peptide
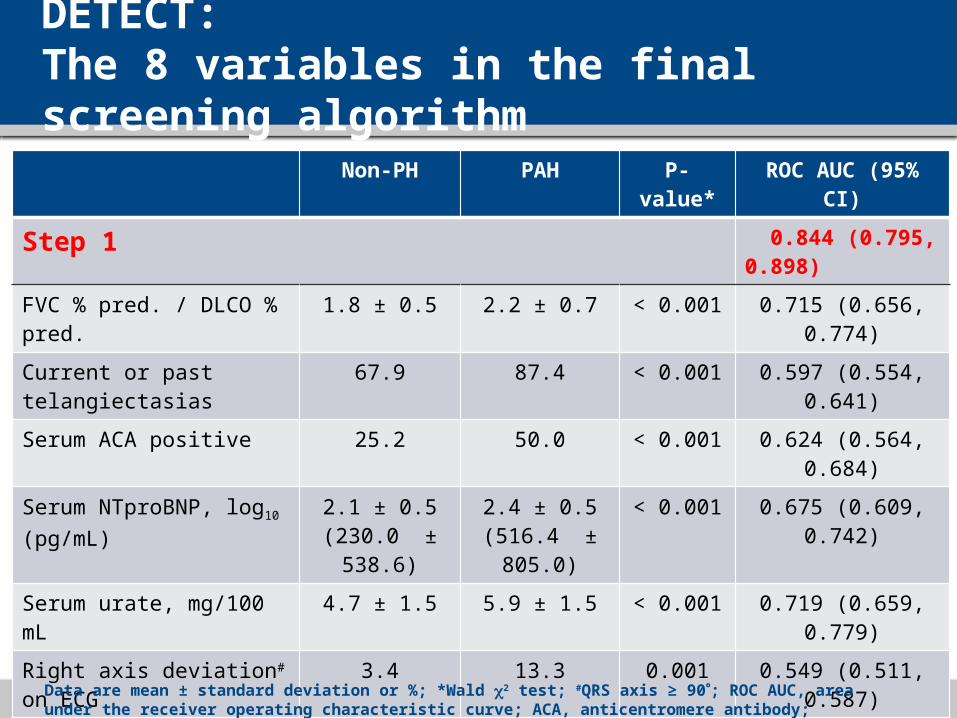
DETECT: The 8 variables in the final screening algorithm
Non-PH PAH P-value* ROC AUC (95% CI)
Step 1 0.844 (0.795, 0.898)
FVC % pred. / DLCO % pred. 1.8 ± 0.5 2.2 ± 0.7 < 0.001 0.715 (0.656, 0.774)
Current or past telangiectasias 67.9 87.4 < 0.001 0.597 (0.554, 0.641)
Serum ACA positive 25.2 50.0 < 0.001 0.624 (0.564, 0.684)
Serum NTproBNP, log10
(pg/mL)2.1 ± 0.5
(230.0 ± 538.6)2.4 ± 0.5
(516.4 ± 805.0)< 0.001 0.675 (0.609, 0.742)
Serum urate, mg/100 mL 4.7 ± 1.5 5.9 ± 1.5 < 0.001 0.719 (0.659, 0.779)
Right axis deviation# on ECG 3.4 13.3 0.001 0.549 (0.511, 0.587)
Step 2 0.881 (0.824, 0.923)
Right atrium area, cm2 13.4 ± 4.7 17.1 ± 6.2 < 0.001 0.712 (0.650, 0.773)
TR velocity, m/s 2.4 ± 0.6 3.0 ± 0.8 < 0.001 0.795 (0.737, 0.853)
Data are mean ± standard deviation or %; *Wald 2 test; #QRS axis ≥ 90; ROC AUC, area under the receiver operating characteristic curve; ACA, anticentromere antibody; NTproBNP, N-terminal pro-brain natriuretic peptide
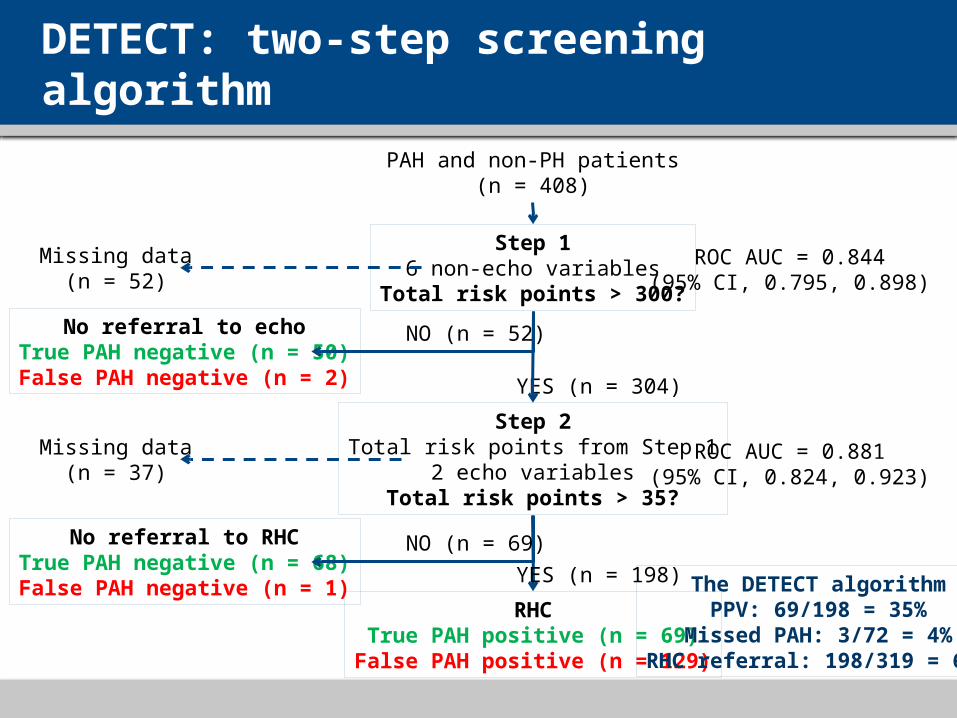
DETECT: two-step screening algorithm
PAH and non-PH patients(n = 408)
RHCTrue PAH positive (n = 69)
False PAH positive (n = 129)
YES (n = 198)
No referral to RHCTrue PAH negative (n = 68)False PAH negative (n = 1)
NO (n = 69)
No referral to echoTrue PAH negative (n = 50)False PAH negative (n = 2)
NO (n = 52)
YES (n = 304)
Step 16 non-echo variables
Total risk points > 300?
Missing data(n = 52)
ROC AUC = 0.844(95% CI, 0.795, 0.898)
Step 2Total risk points from Step 1
2 echo variablesTotal risk points > 35?
Missing data(n = 37)
ROC AUC = 0.881(95% CI, 0.824, 0.923)
The DETECT algorithmPPV: 69/198 = 35%
Missed PAH: 3/72 = 4%RHC referral: 198/319 = 62%
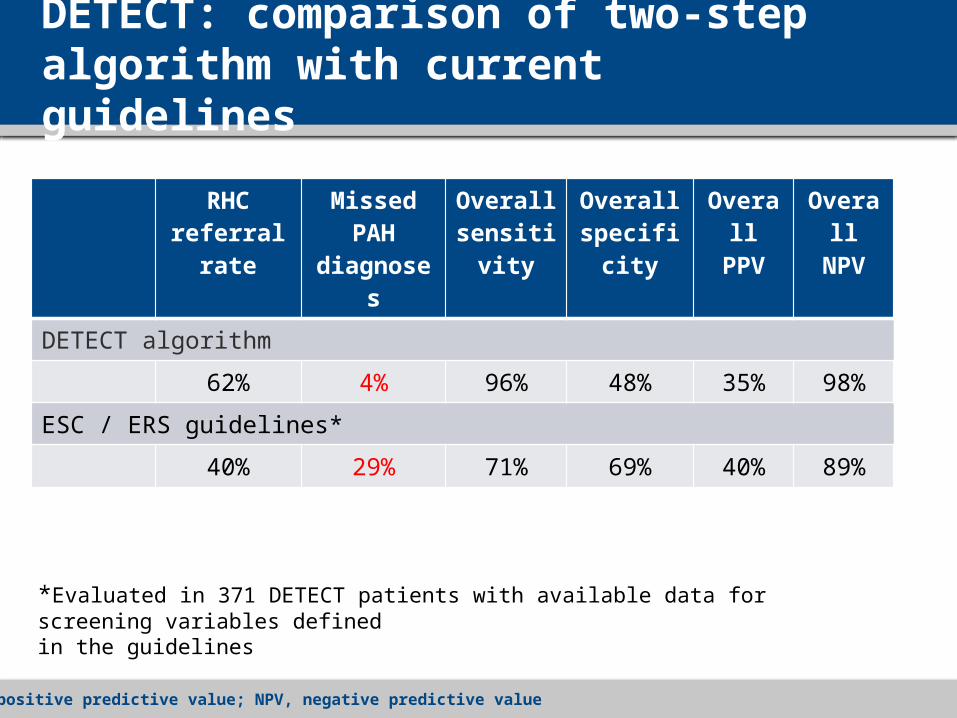
DETECT: comparison of two-step algorithm with current guidelines
RHC referral rate
Missed PAH diagnoses
Overall sensitivity
Overall specificity
Overall PPV
Overall NPV
DETECT algorithm
62% 4% 96% 48% 35% 98%
ESC / ERS guidelines*
40% 29% 71% 69% 40% 89%
*Evaluated in 371 DETECT patients with available data for screening variables defined in the guidelines
PPV, positive predictive value; NPV, negative predictive value
DETECT: limitations
Results obtained in a high-risk SSc population– SSc of > 3 years’ duration
– Inclusion criterion DLCO < 60%
– More RHC compared to ESC guidelines (62%-40%)
Cross-sectional design– Frequency of screening cannot be recommended
DETECT: conclusions
The two-step evidence-based DETECT algorithm– Is a sensitive, non-invasive screening tool for detection of
PAH in SSc patients
– Minimizes missed diagnoses
– Identifies PAH earlier in a mildly symptomatic population
– Addresses resource utilization of RHC
The DETECT algorithm has the potential to revise standards of care in SSc patients