Embed Size (px)
Citation preview
econstor www.econstor.eu
Der Open-Access-Publikationsserver der ZBW – Leibniz-Informationszentrum WirtschaftThe Open Access Publication Server of the ZBW – Leibniz Information Centre for Economics
Standard-Nutzungsbedingungen:
Die Dokumente auf EconStor dürfen zu eigenen wissenschaftlichenZwecken und zum Privatgebrauch gespeichert und kopiert werden.
Sie dürfen die Dokumente nicht für öffentliche oder kommerzielleZwecke vervielfältigen, öffentlich ausstellen, öffentlich zugänglichmachen, vertreiben oder anderweitig nutzen.
Sofern die Verfasser die Dokumente unter Open-Content-Lizenzen(insbesondere CC-Lizenzen) zur Verfügung gestellt haben sollten,gelten abweichend von diesen Nutzungsbedingungen die in der dortgenannten Lizenz gewährten Nutzungsrechte.
Terms of use:
Documents in EconStor may be saved and copied for yourpersonal and scholarly purposes.
You are not to copy documents for public or commercialpurposes, to exhibit the documents publicly, to make thempublicly available on the internet, or to distribute or otherwiseuse the documents in public.
If the documents have been made available under an OpenContent Licence (especially Creative Commons Licences), youmay exercise further usage rights as specified in the indicatedlicence.
zbw Leibniz-Informationszentrum WirtschaftLeibniz Information Centre for Economics
Hetschko, Clemens; Knabe, Andreas; Schöb, Ronnie
Working Paper
Looking Back in Anger? Retirement andUnemployment Scarring
CESifo Working Paper, No. 4784
Provided in Cooperation with:Ifo Institute – Leibniz Institute for Economic Research at the University ofMunich
Suggested Citation: Hetschko, Clemens; Knabe, Andreas; Schöb, Ronnie (2014) : Looking Backin Anger? Retirement and Unemployment Scarring, CESifo Working Paper, No. 4784
This Version is available at:http://hdl.handle.net/10419/96853
Looking Back in Anger? Retirement and Unemployment Scarring
Clemens Hetschko Andreas Knabe Ronnie Schöb
CESIFO WORKING PAPER NO. 4784 CATEGORY 4: LABOUR MARKETS
MAY 2014
An electronic version of the paper may be downloaded • from the SSRN website: www.SSRN.com • from the RePEc website: www.RePEc.org
• from the CESifo website: Twww.CESifo-group.org/wp T
CESifo Working Paper No. 4784
Looking Back in Anger? Retirement and Unemployment Scarring
Abstract Previous studies find that past unemployment reduces life satisfaction even after reemployment for non-monetary reasons (unemployment scarring). It is not clear, however, whether this scarring is only caused by employment-related factors, such as worsened working conditions, or increased future uncertainty as regards income and employment. Using German panel data, we identify non-employment-related scarring by examining the transition of unemployed people to retirement as a life event after which employment-related scarring does not matter anymore. We find evidence for non-employment-related non-monetary unemployment scarring for people who were unemployed for the first time in their life directly prior to retirement, but not for people with earlier unemployment experiences.
JEL-Code: I310, J260.
Keywords: unemployment scarring, life satisfaction, retirement.
Clemens Hetschko*
Free University Berlin School of Business and Economics
Boltzmannstraße 20 Germany – 14195 Berlin
Andreas Knabe
Otto von Guericke University Chair in Public Economics
Universitätsplatz 2 Germany - 39106 Magdeburg
Magdeburg / Germany
Ronnie Schöb Free University Berlin
School of Business and Economics Boltzmannstraße 20
Germany – 14195 Berlin [email protected]
*corresponding author April 2014 We are very grateful to C. Katharina Spieß as well as participants of the SOEP seminar at DIW Berlin and the IAAEU seminar at the University of Trier.
1
1. Unemployment, scarring and well-being
Involuntary unemployment affects the lives of people in several ways. The immediate loss of
income and the gain in leisure time only partly explain the effect of unemployment on
subjective well-being. Even full compensation of the income loss due to unemployment would
not raise an unemployed person’s life satisfaction to the level it was during employment (see
e.g. Winkelmann and Winkelmann 1998, Blanchflower and Oswald 2004). Among other
reasons, deviating from the social norm to work, which negatively affects social identity,
explains at least to some extent why the pain of unemployment goes far beyond that caused by
the income loss (see e.g. Clark 2003, Stutzer and Lalive 2004, Schöb 2013).
Unemployment not only hurts as long as one is unemployed – it also leaves scars. A job
loss diminishes future employment prospects, with the result that it affects people even when
they become reemployed. The new job might be characterized, inter alia, by higher job
insecurity and thus higher income volatility, lower (expected) wages, and worse working
conditions (see e.g. Arulampalam, Gregg and Gregory 2001, Brand 2006, Dieckhoff 2011). The
longer people are unemployed, the more they may lose human capital and send worsened
productivity signals. Other factors that intensify with time, such as social relations within firms,
are also likely to suffer as a result of multiple unemployment spells. These scars, which we call
employment-related scars, might explain why life satisfaction does not recover fully after
finding a new job (Clark, Georgellis and Sanfey 2001, Knabe and Rätzel 2011, Young 2012).
Even decades later, early career unemployment seems to have a detrimental effect on current
well-being (Bell and Blanchflower 2011, Daly and Delaney 2013). Moreover, each further job
loss lowers life satisfaction during subsequent employment and unemployment spells
(Luhmann and Eid 2009). It is, however, also conceivable that unemployment scarring goes
beyond working life insofar as unemployment experience has long-lasting effects on other life
domains and, hence, leaves non-employment-related scars on workers’ well-being.
In this study, we analyse the existence of non-employment-related scarring effects of
unemployment. For this purpose, we focus on retired people with different unemployment
experience during their working lives. By definition, retirees cannot suffer from employment-
related scars as long as they do not intend to return to the workforce. They do not need to worry
about job characteristics or job security anymore. Their future income path is determined by
their pension and income volatility has vanished. Non-employment-related scars, however, may
persist. Some of these non-employment-related scars are of monetary nature. People with
previous unemployment experience may have saved less and contributed less to public pension
2
systems than employed people and, hence, receive lower pensions after retirement and possess
less wealth. Other non-employment-related scars are of non-monetary nature. People with
previous unemployment experience may look back in anger when assessing their life because,
for example, a past career with multiple violations of the social norm to work leaves their self-
image after retiring devastated. To the extent that the factors that cause monetary scarring can
be observed in the data, the transition to retirement provides a unique life event that can be
employed to identify non-monetary non-employment-related scars.
Hetschko, Knabe and Schöb (2014) document that people retiring from unemployment
report significantly lower life satisfaction before, as well as after, retirement compared to those
who retire from employment. The gap diminishes in the transition process but does not vanish.
This suggests that there could be non-employment-related scars remaining after retirement.
However, the gap could also result if unhappy people are more likely to be unemployed during
their working life. If this were the case, retired people with unemployment experience would
simply continue to report lower life satisfaction in the aggregate, without there being a causal
effect of unemployment on post-retirement life satisfaction.
We provide an empirical test to identify the different possible channels that explain the gap
in life satisfaction between retired people with and without previous experience of
unemployment. In a first step, we use cross-sectional data to find out whether there is a gap in
life satisfaction between retirees with and without this experience and to identify potential
factors that correlate with the magnitude of the gap. We find that retirees’ well-being is indeed
lower, the longer they have experienced unemployment during their careers. Lower income and
wealth, differences in personality and differences in socio-demographic characteristics can only
explain part of this gap. This indicates that unemployment leaves scars that cannot be attributed
to current employment or future employment prospects.
In a second step, we turn to a longitudinal analysis of changes in life satisfaction when
people retire. We test whether such non-employment-related scars exist against the alternative
explanation that time-invariant unobservables affecting baseline well-being differ between
retirees with unemployment experience and those without. To do so, we focus on the final
unemployment spell and analyse whether it lowers subjective well-being after retirement
compared to subjective well-being reported in times of employment before retirement. We find
evidence that an unemployment spell directly before retirement reduces life satisfaction after
retiring when people had never been unemployed before. In contrast, when people experienced
unemployment at earlier times during their career, the final unemployment spell does not scar.
3
We conclude that it may be only the first unemployment experience in life that leaves non-
employment-related non-monetary scars.
Our findings complement the research on unemployment scarring by showing that non-
monetary scarring may affect workers’ lives beyond employment-related aspects, such as job
quality and job insecurity, and, additionally, contribute to the investigation of well-being effects
of retirement (see e.g. Bonsang and Klein 2012, Hetschko, Knabe and Schöb 2014).
In the following section, we show how retirement can be used to test scarring beyond
employment-related aspects and explain why German data is especially well suited for this
identification strategy. In Section 3, we describe how we process German Socio-Economic
Panel (SOEP) data for this purpose. Section 4 provides the descriptive statistics. The two
sections following that show the results of the cross-sectional analysis (Section 5) and the
longitudinal approach (Section 6). In Section 7, we discuss our findings and conclude.
2. Retirement and non-employment-related scars from unemployment
We provide a new approach to identifying unemployment scarring beyond employment-related
aspects by examining the transition to retirement. In fact, Germans’ retirement entries are nearly
always definite in the sense that retirees do not intend to return to the labour market in the
future. The public pension system enables most people to continue living under material
conditions after retirement similar to those before retirement without having to work anymore.
Basic income support and the public health system ensure that this applies even to the small
minority of retirees who were frequently unemployed during their working lives. Hence, the
vast majority of retired people neither work nor intend to return to the workforce and, hence,
stop worrying about current or future work experience. Insecurity about future employment
prospects, which has been identified as a pathway of unemployment scarring (Knabe and Rätzel
2011, Lange 2013), disappears after retiring. However, if unemployment causes scars beyond
aspects that matter during working life only, the transition to retirement cannot heal them. These
non-employment-related scars should still be measurable after retirement, especially if the last
period of unemployment does not date back too long.
Scars are long-lasting consequences of having been unemployed that persist even after
changing one’s employment status, in particular after becoming reemployed or entering
retirement, irrespective of what caused these changes. Thus, comparing the life satisfaction of
retirees with and without earlier unemployment experience reveals whether unemployment
leaves non-employment-related scars or not. Some of these scars might be monetary. When
4
past unemployment leads to lower wage incomes during a person’s working life, savings and
contributions to public pension systems might have been affected negatively as well. Hence,
controlling for income and wealth in the econometric analysis allows us to detect any remaining
non-monetary non-employment-related scars.
As a first step, we test whether the well-being difference between retirees from
unemployment and employment persists once relevant personal characteristics are controlled
for in a cross-sectional setting. By making use of biographical data, we can even account for
unemployment experiences taking place before people took part in the survey. We conduct a
regression analysis explaining the individual life satisfaction LS after retirement as a result of
binary variables for employment status and unemployment experience combinations before
retirement. The variable
E equals one for people retiring from employment who never experienced unemployment
during their careers and zero otherwise;
U equals one for people retiring from unemployment who did not experience
unemployment before the last spell and zero otherwise;
UEXP equals one for people retiring from unemployment who have also experienced
unemployment before the last spell and zero otherwise;
EEXP equals one for people retiring from employment who have experienced
unemployment during their working life and zero otherwise.
A large share of the variation in life satisfaction between individuals is caused by personal
characteristics such as personality traits or other dispositions (Lykken and Tellegen 1996).
These differences bias our estimates as long as they affect both unemployment and subjective
well-being simultaneously. We address this issue by considering personality traits (vector P )
and socio-demographic characteristics (vector SD ) in the regression analysis. The latter
contains information on income and wealth, and thus allows us to separate monetary aspects of
non-employment-related scarring effects of unemployment from their non-monetary aspects.
The corresponding econometric model estimates life satisfaction at the first interview after
retiring as a function of contemporaneous characteristics, past labour market experiences, time
effects (vector of dummies Y indicating the year of retirement) and an error term ( ):
1 2 3i i i i i i i iLS U UEXP EEXP P' SD' Y ' . (I)
A negative coefficient 1 might be interpreted as non-monetary non-employment-related
scarring of the last unemployment spell. If 2 1 , earlier unemployment experience are
5
negatively related to the life satisfaction of people retiring from unemployment. The same
applies for those who had some unemployment experiences but retire from employment, when
3 .
Some of the control variables considered in (I) might also represent pathways of
unemployment scarring, for instance when job losses make people less optimistic in general. In
this respect, taking into account controls that are positively influenced by unemployment and
that themselves have a negative influence on life satisfaction (or vice versa) estimates the lower
bound of the non-employment-related non-monetary scarring effect of unemployment.
Even if the cross-sectional approach shows differences in well-being for the different sub-
groups, it cannot be ruled out that this difference is due to unobservable personal characteristics,
with the result that the observed gap in life satisfaction between retirees from unemployment
and retirees from employment would also have been present when they were still in
employment. Any difference we find in the cross-sectional analysis, i.e. any negative sign of
1 2 3, , , can only be attributed to non-employment-related scarring if the well-being of a
person who retires from unemployment is lower than her reported well-being would have been
had she not experienced the last unemployment spell. We tackle this problem by proceeding
with a longitudinal analysis in which we focus on the last unemployment experience and
compare the life satisfaction change from preceding times in employment with the time in
retirement for people who experienced unemployment directly before retirement. This
longitudinal approach includes observations of the same individuals at different points in time
t in employment, unemployment and retirement. Personal time-invariant characteristics are
controlled for by introducing individual fixed-effects such that time-independent factors
cannot bias our estimates. We estimate the following model, where E, U, UEXP and EEXP are
defined as before, indicating retirement with different labour market experiences. The variable
UNEMP denotes being unemployed in year t:
1 2 3 4 5it it it it it it it t i itLS U EEXP UEXP E UNEMP SD ' . (II)
3. Data
Our analysis relies on 28 waves (1984-2011) of the German Socio Economic Panel (SOEP), a
representative survey of the population in Germany (Wagner et al. 2007).1 Each year, about
20,000 individuals from about 11,000 households are interviewed and provide information on
1 The general setting of the present study is closely related to Hetschko, Knabe and Schöb (2014).
6
their well-being, income, employment status, education, health, etc. The great advantage of the
SOEP lies in its panel structure, which allows us to follow the same individual over a long time
period and thus gives us the opportunity to compare both the life circumstances of different
persons and the subjective well-being of the same person before and after retirement.
During the time period used for our study, people in Germany could receive retirement
benefits when they reached the statutory retirement age of 65 years and fulfilled some additional
conditions (most importantly, a minimum number of years of contributions to the public
pension system). Early retirement was possible at the age of 63 and – if the person was female
or unemployed – even at the age of 60, provided that certain conditions were met. In these
cases, monthly pensions were lowered by 0.3% for every month a person retired before reaching
the statutory retirement age. Those who retired “because of unemployment” (Altersrente wegen
Arbeitslosigkeit; § 237 SGB VI) were eligible for pensions at the age of 60 years if they had
been unemployed for at least 52 weeks since the age of 58.5 and had been insured for at least
15 years in the public pensions system (Mindestversicherungszeit). As of 1992, they
additionally need to have contributed for eight of the last ten years before retirement
(Pflichtbeitragszeit). Furthermore, the early retirement age of 60 for the unemployed is
gradually increasing for people born after 1941 and converging to that of employed people
(Lühning 2006).
In the SOEP, people provide information about their current employment status, such as
whether they are unemployed, employed or retired. Thanks to the SOEP’s panel structure, we
can identify retired people who were either unemployed or employed prior to retirement. We
further distinguish these two groups by overall unemployment experience. SOEP respondents
fill out a one-time biographical questionnaire in which they, inter alia, report their whole
employment history in detail. Together with their employment situation reported at subsequent
interviews, these pieces of information are used to aggregate lifetime unemployment experience
in years. Combining this with the previous employment status of recently retired people, we
obtain 2 2 groups of retirees who were either employed or unemployed before retirement and
retired with or without unemployment experience beyond the last spell. Our cross-sectional
analysis considers these four groups at the first interview after retiring. The longitudinal
approach adds observations during employment and unemployment spells before retirement
and in their retirement years. Other groups on the labour market are not considered (e.g. people
in workfare schemes).
7
To ensure that future employment prospects do not matter anymore to the interviewed
persons, we only consider retirees who are at least 50 years old and continuously report to be
retired without returning to any other employment status later in their lives. 95% of these people
already state directly after retirement that they are not going to return to work in the future.
Hence, the quasi-experimental setting we need in order to analyse potential scarring beyond
worrying about future employment prospects is guaranteed to a very large extent.
To rule out the issue that unobservable events shift individual life satisfaction baselines over
the life cycle and affect the results of the longitudinal approach, we only consider employed
and unemployed people who are at least 50 years old as well. The cross-sectional approach
makes use of information on “Big Five” traits (openness to experiences, neuroticism,
conscientiousness, agreeableness and extraversion) to account for the simultaneous impact of
personality on well-being and employment. As this data is only available for 2005 and 2009,
we have to transfer the information to observations of the same person in other years, counting
on the stability of personality traits (Specht et al. 2011). The data of 2005 describe personality
traits between 1996 and 2006 in our analysis, and information from the 2009 wave is transferred
to the time span from 2007 to 2011. Three self-assessments assemble each personality trait. We
pool the five characteristics using the mean value of the three answers (each given on seven-
point scales). For the econometric analysis, we assign people, depending on the position of their
individual values within the distribution of each trait, to high (highest quartile), medium (lower
and upper middle quartile) and low (lowest quartile) manifestations. Robustness checks address
the sensitivity of our results against the sample restrictions we make.
We measure subjective well-being using people’s self-assessment of how satisfied they are
with their lives in general. In the SOEP, respondents are asked every year to answer the
following question:
“In conclusion, we would like to ask you about your satisfaction with your life in general. Please answer according to the following scale: 0 means ‘completely dissatisfied’, 10 means ‘completely satisfied’. How satisfied are you with your life, all things considered?”
Data about disposable household income is provided by a self-report of the household head.
We calculate equivalence incomes for each person by dividing their real household income (at
2006 prices) by the weighted sum of household members using the modified OECD scale (1
for the first adult, 0.5 for every additional person who is at least 14 years old, 0.3 for every
person younger than 14 years). We also use information about the presence of children and
people in need of care in the household as well as about age, sex, educational level, partner
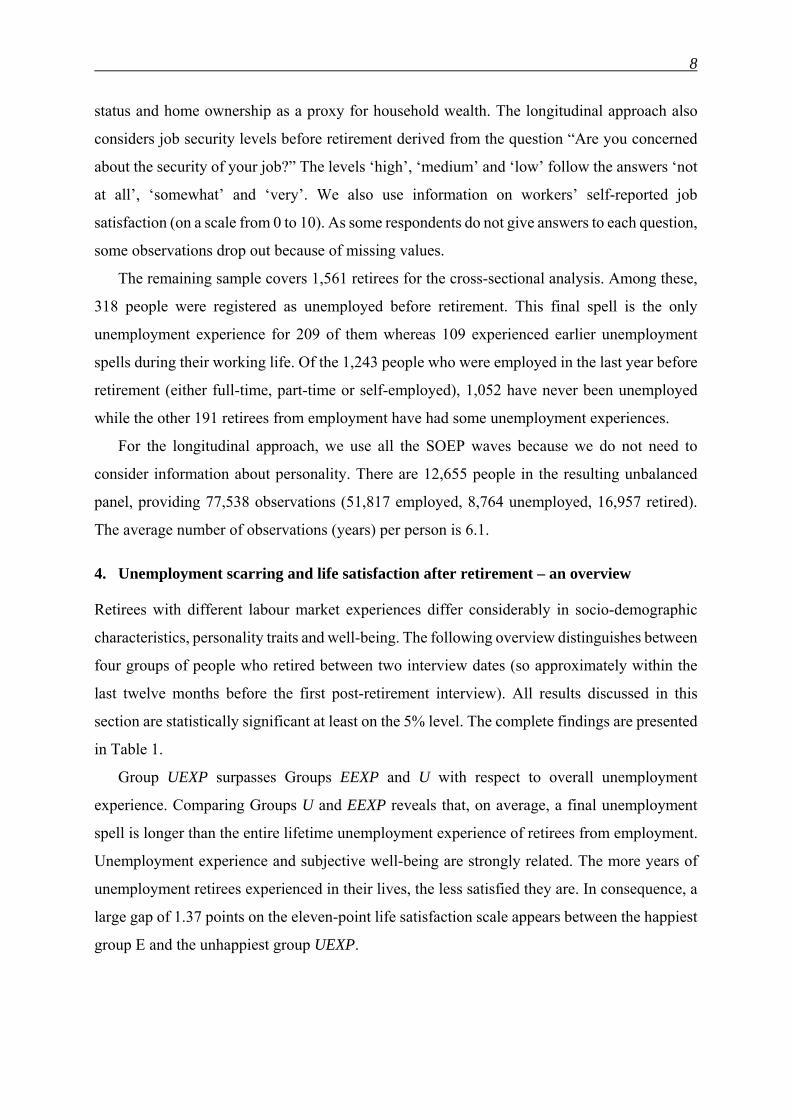
8
status and home ownership as a proxy for household wealth. The longitudinal approach also
considers job security levels before retirement derived from the question “Are you concerned
about the security of your job?” The levels ‘high’, ‘medium’ and ‘low’ follow the answers ‘not
at all’, ‘somewhat’ and ‘very’. We also use information on workers’ self-reported job
satisfaction (on a scale from 0 to 10). As some respondents do not give answers to each question,
some observations drop out because of missing values.
The remaining sample covers 1,561 retirees for the cross-sectional analysis. Among these,
318 people were registered as unemployed before retirement. This final spell is the only
unemployment experience for 209 of them whereas 109 experienced earlier unemployment
spells during their working life. Of the 1,243 people who were employed in the last year before
retirement (either full-time, part-time or self-employed), 1,052 have never been unemployed
while the other 191 retirees from employment have had some unemployment experiences.
For the longitudinal approach, we use all the SOEP waves because we do not need to
consider information about personality. There are 12,655 people in the resulting unbalanced
panel, providing 77,538 observations (51,817 employed, 8,764 unemployed, 16,957 retired).
The average number of observations (years) per person is 6.1.
4. Unemployment scarring and life satisfaction after retirement – an overview
Retirees with different labour market experiences differ considerably in socio-demographic
characteristics, personality traits and well-being. The following overview distinguishes between
four groups of people who retired between two interview dates (so approximately within the
last twelve months before the first post-retirement interview). All results discussed in this
section are statistically significant at least on the 5% level. The complete findings are presented
in Table 1.
Group UEXP surpasses Groups EEXP and U with respect to overall unemployment
experience. Comparing Groups U and EEXP reveals that, on average, a final unemployment
spell is longer than the entire lifetime unemployment experience of retirees from employment.
Unemployment experience and subjective well-being are strongly related. The more years of
unemployment retirees experienced in their lives, the less satisfied they are. In consequence, a
large gap of 1.37 points on the eleven-point life satisfaction scale appears between the happiest
group E and the unhappiest group UEXP.
9
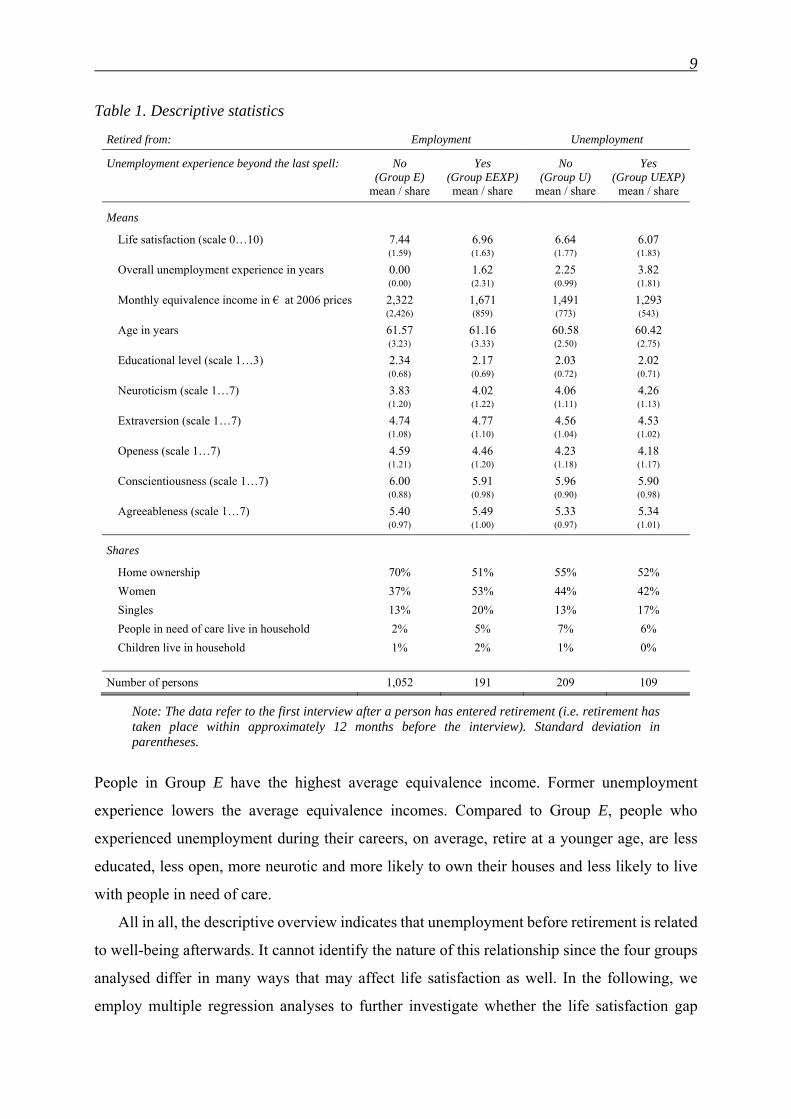
Table 1. Descriptive statistics
Retired from: Employment Unemployment
Unemployment experience beyond the last spell:
No (Group E)
Yes (Group EEXP)
No (Group U)
Yes (Group UEXP)
mean / share mean / share mean / share mean / share
Means
Life satisfaction (scale 0…10) 7.44 6.96 6.64 6.07 (1.59) (1.63) (1.77) (1.83)
Overall unemployment experience in years 0.00 1.62 2.25 3.82 (0.00) (2.31) (0.99) (1.81)
Monthly equivalence income in € at 2006 prices 2,322 1,671 1,491 1,293 (2,426) (859) (773) (543)
Age in years 61.57 61.16 60.58 60.42 (3.23) (3.33) (2.50) (2.75)
Educational level (scale 1…3) 2.34 2.17 2.03 2.02 (0.68) (0.69) (0.72) (0.71)
Neuroticism (scale 1…7) 3.83 4.02 4.06 4.26 (1.20) (1.22) (1.11) (1.13)
Extraversion (scale 1…7) 4.74 4.77 4.56 4.53 (1.08) (1.10) (1.04) (1.02)
Openess (scale 1…7) 4.59 4.46 4.23 4.18 (1.21) (1.20) (1.18) (1.17)
Conscientiousness (scale 1…7) 6.00 5.91 5.96 5.90 (0.88) (0.98) (0.90) (0.98)
Agreeableness (scale 1…7) 5.40 5.49 5.33 5.34 (0.97) (1.00) (0.97) (1.01)
Shares
Home ownership 70% 51% 55% 52%
Women 37% 53% 44% 42%
Singles 13% 20% 13% 17%
People in need of care live in household 2% 5% 7% 6%
Children live in household 1% 2% 1% 0%
Number of persons 1,052 191 209 109
Note: The data refer to the first interview after a person has entered retirement (i.e. retirement has taken place within approximately 12 months before the interview). Standard deviation in parentheses.
People in Group E have the highest average equivalence income. Former unemployment
experience lowers the average equivalence incomes. Compared to Group E, people who
experienced unemployment during their careers, on average, retire at a younger age, are less
educated, less open, more neurotic and more likely to own their houses and less likely to live
with people in need of care.
All in all, the descriptive overview indicates that unemployment before retirement is related
to well-being afterwards. It cannot identify the nature of this relationship since the four groups
analysed differ in many ways that may affect life satisfaction as well. In the following, we
employ multiple regression analyses to further investigate whether the life satisfaction gap
10
between retired people who experienced unemployment and those who did not is explained by
unemployment scarring or other differences.
5. A first glance at retirement and unemployment scarring
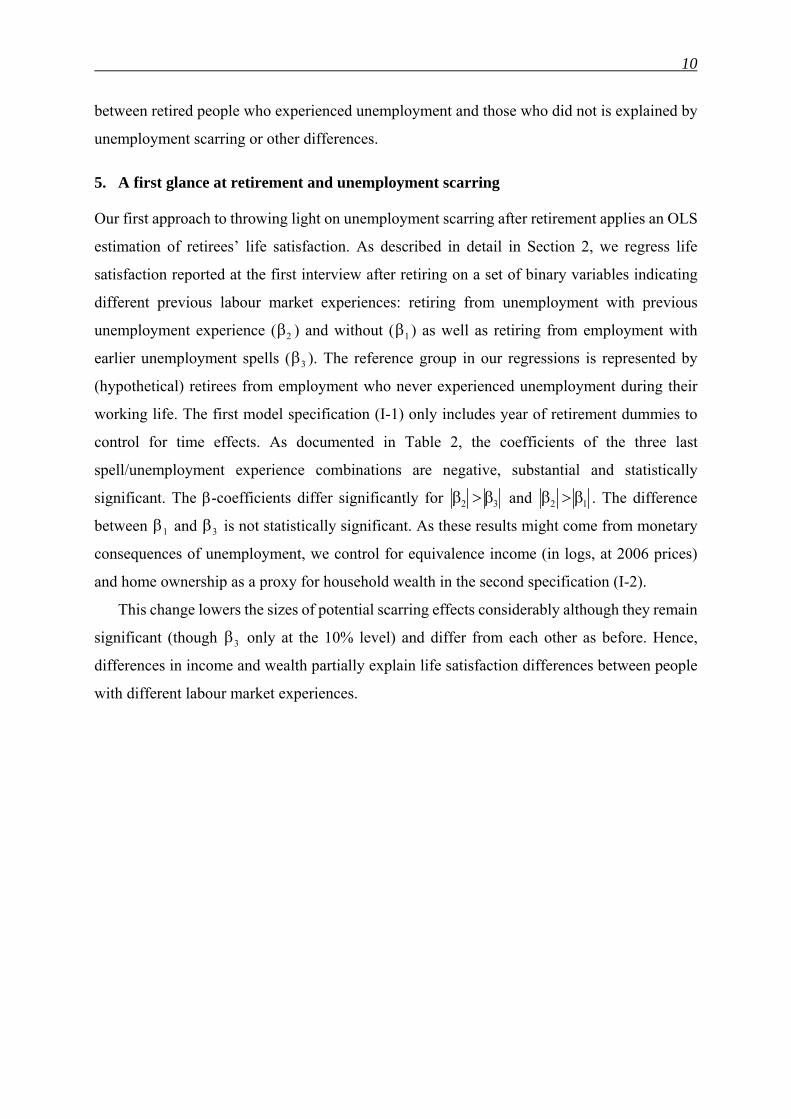
Our first approach to throwing light on unemployment scarring after retirement applies an OLS
estimation of retirees’ life satisfaction. As described in detail in Section 2, we regress life
satisfaction reported at the first interview after retiring on a set of binary variables indicating
different previous labour market experiences: retiring from unemployment with previous
unemployment experience ( 2 ) and without ( 1 ) as well as retiring from employment with
earlier unemployment spells ( 3 ). The reference group in our regressions is represented by
(hypothetical) retirees from employment who never experienced unemployment during their
working life. The first model specification (I-1) only includes year of retirement dummies to
control for time effects. As documented in Table 2, the coefficients of the three last
spell/unemployment experience combinations are negative, substantial and statistically
significant. The -coefficients differ significantly for 2 3 and 2 1 . The difference
between 1 and 3 is not statistically significant. As these results might come from monetary
consequences of unemployment, we control for equivalence income (in logs, at 2006 prices)
and home ownership as a proxy for household wealth in the second specification (I-2).
This change lowers the sizes of potential scarring effects considerably although they remain
significant (though 3 only at the 10% level) and differ from each other as before. Hence,
differences in income and wealth partially explain life satisfaction differences between people
with different labour market experiences.
11
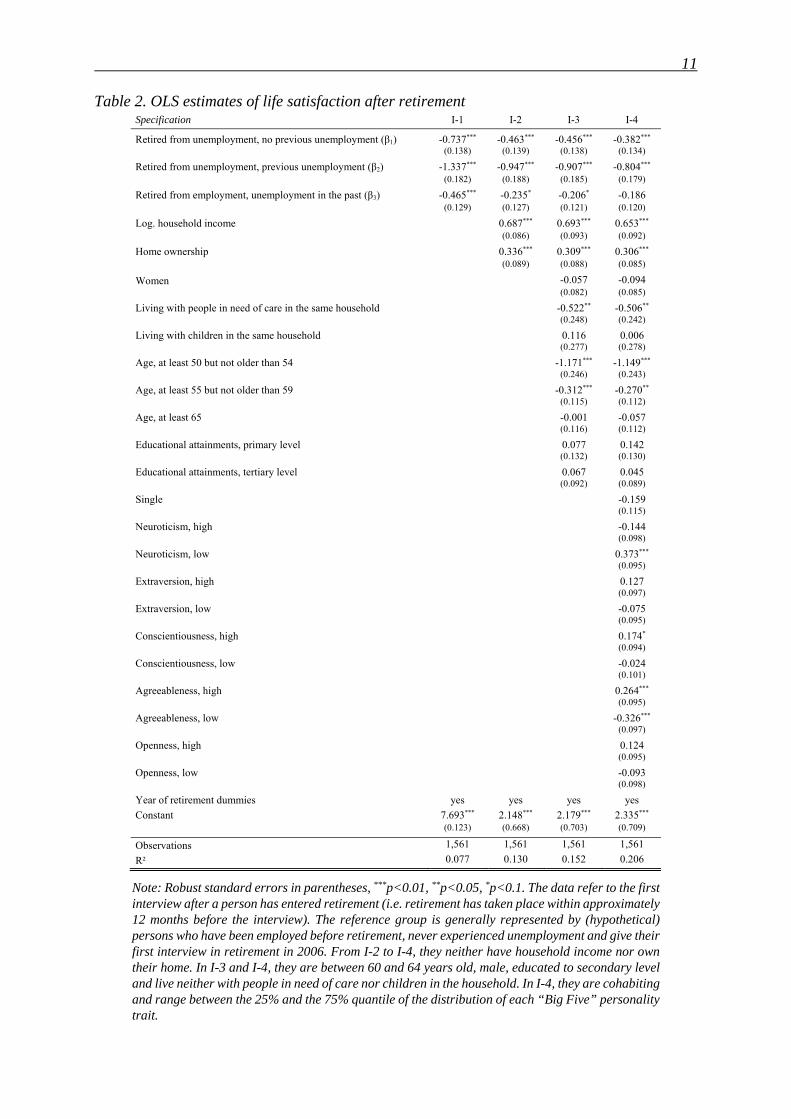
Table 2. OLS estimates of life satisfaction after retirement Specification I-1 I-2 I-3 I-4
Retired from unemployment, no previous unemployment (β1) -0.737*** -0.463*** -0.456*** -0.382*** (0.138) (0.139) (0.138) (0.134)
Retired from unemployment, previous unemployment (β2) -1.337*** -0.947*** -0.907*** -0.804*** (0.182) (0.188) (0.185) (0.179)
Retired from employment, unemployment in the past (β3) -0.465*** -0.235* -0.206* -0.186 (0.129) (0.127) (0.121) (0.120)
Log. household income 0.687*** 0.693*** 0.653*** (0.086) (0.093) (0.092)
Home ownership 0.336*** 0.309*** 0.306*** (0.089) (0.088) (0.085)
Women -0.057 -0.094
(0.082) (0.085)
Living with people in need of care in the same household -0.522** -0.506**
(0.248) (0.242)
Living with children in the same household 0.116 0.006
(0.277) (0.278)
Age, at least 50 but not older than 54 -1.171*** -1.149***
(0.246) (0.243)
Age, at least 55 but not older than 59 -0.312*** -0.270**
(0.115) (0.112)
Age, at least 65 -0.001 -0.057
(0.116) (0.112)
Educational attainments, primary level 0.077 0.142
(0.132) (0.130)
Educational attainments, tertiary level 0.067 0.045
(0.092) (0.089)
Single -0.159 (0.115)
Neuroticism, high -0.144 (0.098)
Neuroticism, low 0.373*** (0.095)
Extraversion, high 0.127 (0.097)
Extraversion, low -0.075 (0.095)
Conscientiousness, high 0.174* (0.094)
Conscientiousness, low -0.024 (0.101)
Agreeableness, high 0.264*** (0.095)
Agreeableness, low -0.326*** (0.097)
Openness, high 0.124 (0.095)
Openness, low -0.093 (0.098)
Year of retirement dummies yes yes yes yes
Constant 7.693*** 2.148*** 2.179*** 2.335*** (0.123) (0.668) (0.703) (0.709)
Observations 1,561 1,561 1,561 1,561
R² 0.077 0.130 0.152 0.206
Note: Robust standard errors in parentheses, ***p<0.01, **p<0.05, *p<0.1. The data refer to the first interview after a person has entered retirement (i.e. retirement has taken place within approximately 12 months before the interview). The reference group is generally represented by (hypothetical) persons who have been employed before retirement, never experienced unemployment and give their first interview in retirement in 2006. From I-2 to I-4, they neither have household income nor own their home. In I-3 and I-4, they are between 60 and 64 years old, male, educated to secondary level and live neither with people in need of care nor children in the household. In I-4, they are cohabiting and range between the 25% and the 75% quantile of the distribution of each “Big Five” personality trait.
12
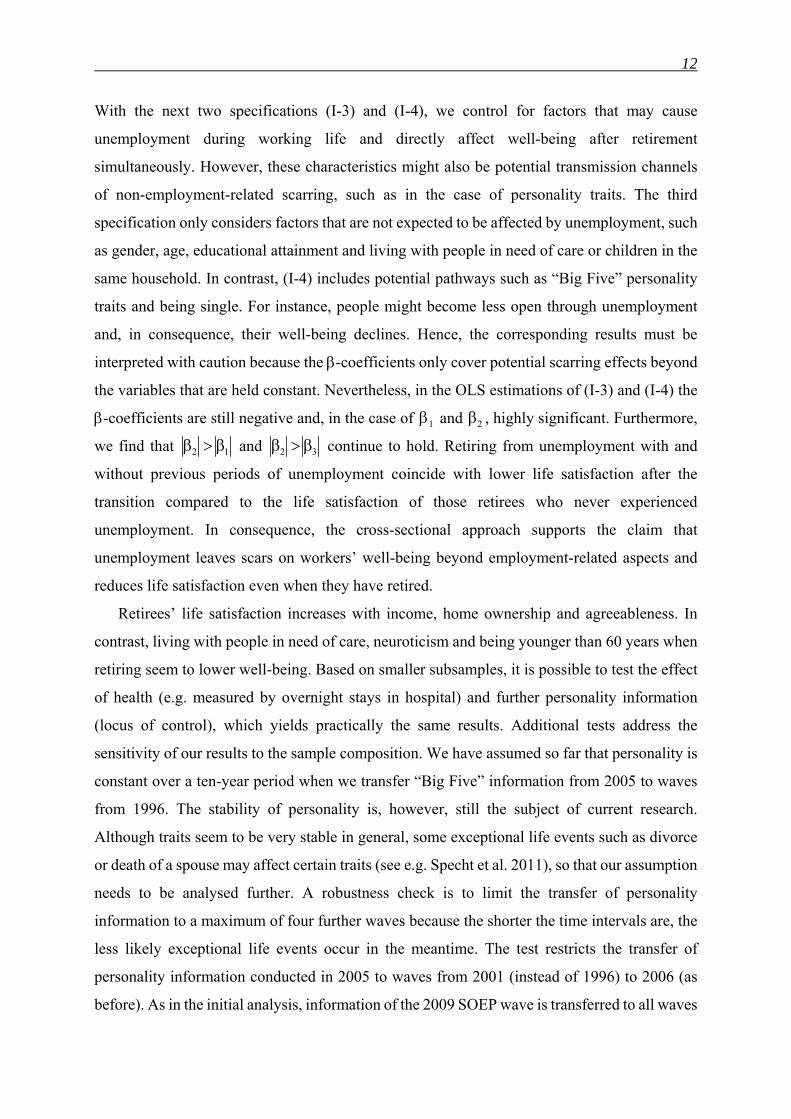
With the next two specifications (I-3) and (I-4), we control for factors that may cause
unemployment during working life and directly affect well-being after retirement
simultaneously. However, these characteristics might also be potential transmission channels
of non-employment-related scarring, such as in the case of personality traits. The third
specification only considers factors that are not expected to be affected by unemployment, such
as gender, age, educational attainment and living with people in need of care or children in the
same household. In contrast, (I-4) includes potential pathways such as “Big Five” personality
traits and being single. For instance, people might become less open through unemployment
and, in consequence, their well-being declines. Hence, the corresponding results must be
interpreted with caution because the -coefficients only cover potential scarring effects beyond
the variables that are held constant. Nevertheless, in the OLS estimations of (I-3) and (I-4) the
-coefficients are still negative and, in the case of 1 and 2 , highly significant. Furthermore,
we find that 2 1 and 2 3 continue to hold. Retiring from unemployment with and
without previous periods of unemployment coincide with lower life satisfaction after the
transition compared to the life satisfaction of those retirees who never experienced
unemployment. In consequence, the cross-sectional approach supports the claim that
unemployment leaves scars on workers’ well-being beyond employment-related aspects and
reduces life satisfaction even when they have retired.
Retirees’ life satisfaction increases with income, home ownership and agreeableness. In
contrast, living with people in need of care, neuroticism and being younger than 60 years when
retiring seem to lower well-being. Based on smaller subsamples, it is possible to test the effect
of health (e.g. measured by overnight stays in hospital) and further personality information
(locus of control), which yields practically the same results. Additional tests address the
sensitivity of our results to the sample composition. We have assumed so far that personality is
constant over a ten-year period when we transfer “Big Five” information from 2005 to waves
from 1996. The stability of personality is, however, still the subject of current research.
Although traits seem to be very stable in general, some exceptional life events such as divorce
or death of a spouse may affect certain traits (see e.g. Specht et al. 2011), so that our assumption
needs to be analysed further. A robustness check is to limit the transfer of personality
information to a maximum of four further waves because the shorter the time intervals are, the
less likely exceptional life events occur in the meantime. The test restricts the transfer of
personality information conducted in 2005 to waves from 2001 (instead of 1996) to 2006 (as
before). As in the initial analysis, information of the 2009 SOEP wave is transferred to all waves
13
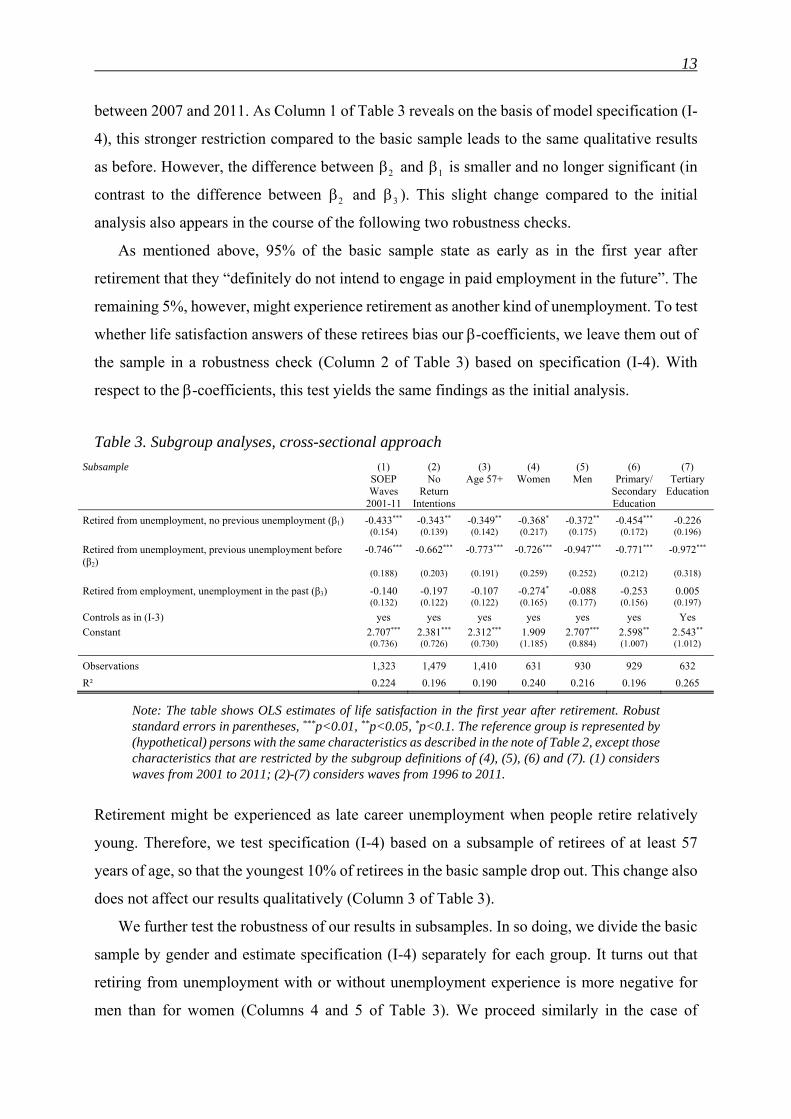
between 2007 and 2011. As Column 1 of Table 3 reveals on the basis of model specification (I-
4), this stronger restriction compared to the basic sample leads to the same qualitative results
as before. However, the difference between 2 and 1 is smaller and no longer significant (in
contrast to the difference between 2 and 3 ). This slight change compared to the initial
analysis also appears in the course of the following two robustness checks.
As mentioned above, 95% of the basic sample state as early as in the first year after
retirement that they “definitely do not intend to engage in paid employment in the future”. The
remaining 5%, however, might experience retirement as another kind of unemployment. To test
whether life satisfaction answers of these retirees bias our -coefficients, we leave them out of
the sample in a robustness check (Column 2 of Table 3) based on specification (I-4). With
respect to the -coefficients, this test yields the same findings as the initial analysis.
Table 3. Subgroup analyses, cross-sectional approach
Subsample (1) SOEP Waves
2001-11
(2) No
Return Intentions
(3) Age 57+
(4) Women
(5) Men
(6) Primary/
Secondary Education
(7) Tertiary
Education
Retired from unemployment, no previous unemployment (β1) -0.433*** -0.343** -0.349** -0.368* -0.372** -0.454*** -0.226 (0.154) (0.139) (0.142) (0.217) (0.175) (0.172) (0.196)
Retired from unemployment, previous unemployment before (β2)
-0.746*** -0.662*** -0.773*** -0.726*** -0.947*** -0.771*** -0.972***
(0.188) (0.203) (0.191) (0.259) (0.252) (0.212) (0.318)
Retired from employment, unemployment in the past (β3) -0.140 -0.197 -0.107 -0.274* -0.088 -0.253 0.005 (0.132) (0.122) (0.122) (0.165) (0.177) (0.156) (0.197)
Controls as in (I-3) yes yes yes yes yes yes Yes
Constant 2.707*** 2.381*** 2.312*** 1.909 2.707*** 2.598** 2.543** (0.736) (0.726) (0.730) (1.185) (0.884) (1.007) (1.012)
Observations 1,323 1,479 1,410 631 930 929 632
R² 0.224 0.196 0.190 0.240 0.216 0.196 0.265
Note: The table shows OLS estimates of life satisfaction in the first year after retirement. Robust standard errors in parentheses, ***p<0.01, **p<0.05, *p<0.1. The reference group is represented by (hypothetical) persons with the same characteristics as described in the note of Table 2, except those characteristics that are restricted by the subgroup definitions of (4), (5), (6) and (7). (1) considers waves from 2001 to 2011; (2)-(7) considers waves from 1996 to 2011.
Retirement might be experienced as late career unemployment when people retire relatively
young. Therefore, we test specification (I-4) based on a subsample of retirees of at least 57
years of age, so that the youngest 10% of retirees in the basic sample drop out. This change also
does not affect our results qualitatively (Column 3 of Table 3).
We further test the robustness of our results in subsamples. In so doing, we divide the basic
sample by gender and estimate specification (I-4) separately for each group. It turns out that
retiring from unemployment with or without unemployment experience is more negative for
men than for women (Columns 4 and 5 of Table 3). We proceed similarly in the case of
14
educational levels as we test (I-4) in subsamples of people with a university or polytechnic
degree (education at the tertiary level) as well as with lower attainments (primary and secondary
level). We find that retirees of the highly educated subsample with earlier unemployment
experience report much lower life satisfaction after they retired from unemployment than those
without earlier unemployment experience (Columns 6 and 7 of Table 3). In contrast, 1 and 2
are more similar for people with primary/secondary education. In sum, the results on gender
and education subgroups do not differ qualitatively from those of the main sample although the
negative 1 -coefficients lose size and significance in the cases of women and highly educated
people. Among the gender and education subsamples, we find 2 1 (not statistically
significant for women and the highly educated) and 2 3 (always statistically significant).
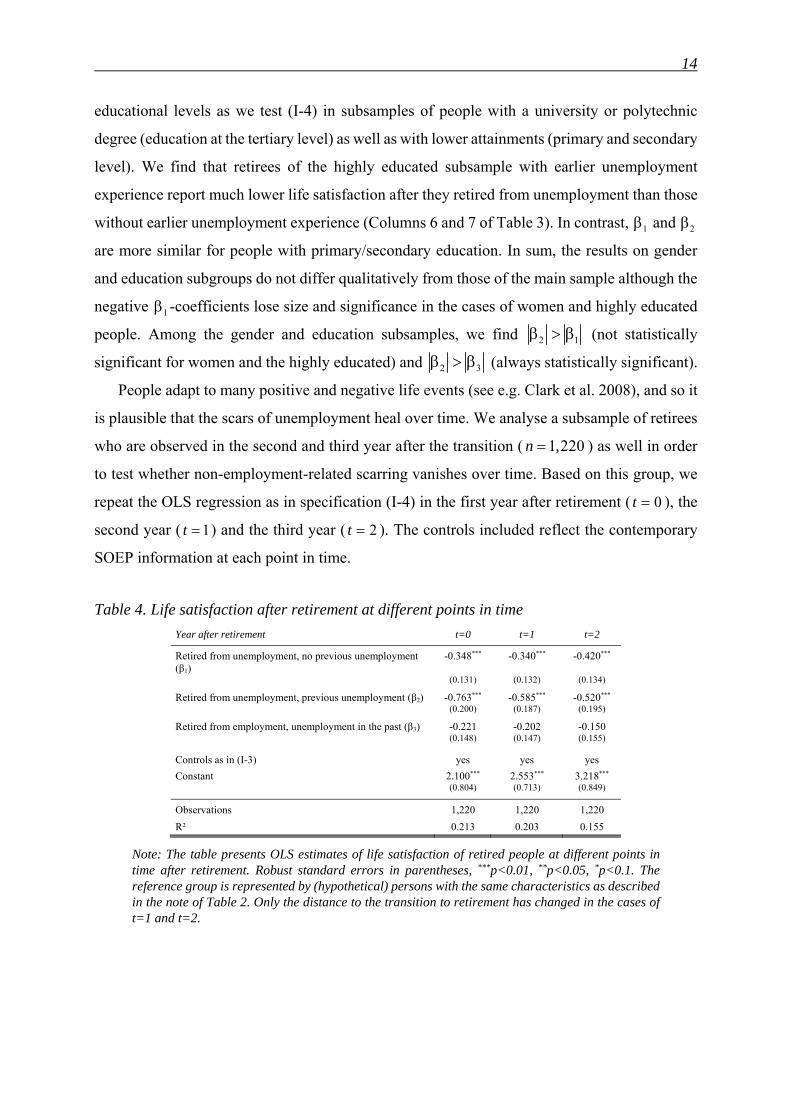
People adapt to many positive and negative life events (see e.g. Clark et al. 2008), and so it
is plausible that the scars of unemployment heal over time. We analyse a subsample of retirees
who are observed in the second and third year after the transition ( 1 220n , ) as well in order
to test whether non-employment-related scarring vanishes over time. Based on this group, we
repeat the OLS regression as in specification (I-4) in the first year after retirement ( 0t ), the
second year ( 1t ) and the third year ( 2t ). The controls included reflect the contemporary
SOEP information at each point in time.
Table 4. Life satisfaction after retirement at different points in time
Year after retirement t=0 t=1 t=2
Retired from unemployment, no previous unemployment (β1)
-0.348*** -0.340*** -0.420***
(0.131) (0.132) (0.134)
Retired from unemployment, previous unemployment (β2) -0.763*** -0.585*** -0.520*** (0.200) (0.187) (0.195)
Retired from employment, unemployment in the past (β3) -0.221 -0.202 -0.150 (0.148) (0.147) (0.155)
Controls as in (I-3) yes yes yes
Constant 2.100*** 2.553*** 3.218*** (0.804) (0.713) (0.849)
Observations 1,220 1,220 1,220
R² 0.213 0.203 0.155
Note: The table presents OLS estimates of life satisfaction of retired people at different points in time after retirement. Robust standard errors in parentheses, ***p<0.01, **p<0.05, *p<0.1. The reference group is represented by (hypothetical) persons with the same characteristics as described in the note of Table 2. Only the distance to the transition to retirement has changed in the cases of t=1 and t=2.
15
As Table 4 shows, the effect of having retired from a single unemployment spell, 1 , increases
(though not significantly) between 0t and 2t . In contrast, the coefficient of having retired
from unemployment with previous unemployment experience, 2 , diminishes over time (but
not significantly). However, it is still negative and highly significant in 2t . Hence, 1 and
2 seem to converge. The effect of having retired from employment with unemployment
experience in the past ( 3 ) diminishes insignificantly over time. It remains insignificantly
different from zero across all periods.
6. Scarring through the last spell
The results of our cross-sectional analysis are compatible with the hypothesis that
unemployment leaves scars beyond working life. However, unobserved time-invariant personal
characteristics might also explain both unemployment before retirement and relatively low life
satisfaction afterwards. To identify potential non-employment-related scars, we employ the
panel fixed-effects approach described in Section 2 and determine the impact of a final
unemployment experience prior to retirement on life satisfaction afterwards. Individual fixed
effects capture time-invariant individual differences in life satisfaction. The estimated
coefficients of our regression equation (II) thus show how a change in the explanatory variables
affect the life satisfaction of the same person over time, instead of making comparisons between
different persons as in the cross-section regression. As a further advantage, we avoid having to
control for potential pathways of non-employment-related unemployment scarring.
Our model (II) is specified further with the four binary variables U, UEXP, E and EEXP
being differentiated according to the time since the transition to retirement. In so doing, we
separate short-term scarring effects from longer-run ones. All in all, we use eight binary
variables representing 2 2 2 combinations of employment states before retirement
previous unemployment experience point in time after retirement (transition types).
The corresponding OLS estimates are presented in Table 5. Besides individual and time
fixed effects, the first specification (II-1) considers the eight transition types as well as binary
variables for being unemployed, being unemployed directly before retirement and being
employed directly before retirement. The reference category is being employed (in any year
except in the year immediately before retirement). The differentiation between employment and
unemployment directly prior to retirement and employment and unemployment in earlier
periods should separate the effects of normal periods of these states from potential anticipation
effects that might occur directly before the retirement transition.
16
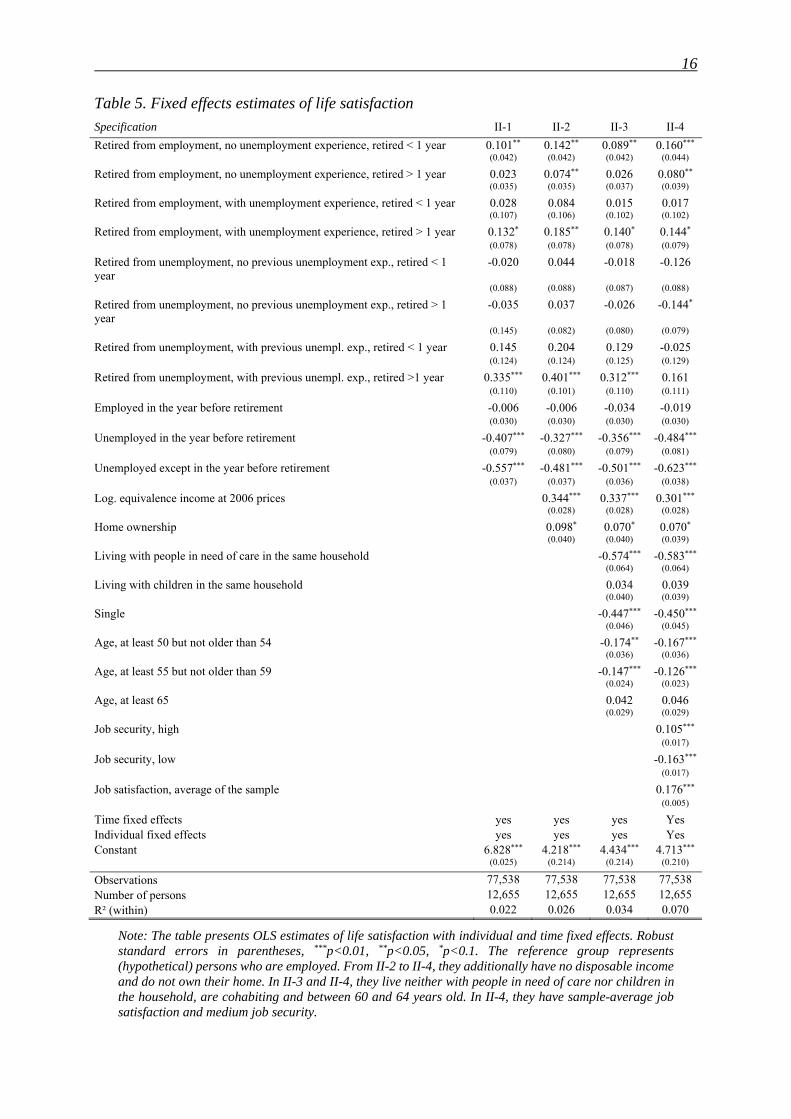
Table 5. Fixed effects estimates of life satisfaction
Specification II-1 II-2 II-3 II-4
Retired from employment, no unemployment experience, retired < 1 year 0.101** 0.142** 0.089** 0.160***
(0.042) (0.042) (0.042) (0.044)
Retired from employment, no unemployment experience, retired > 1 year 0.023 0.074** 0.026 0.080** (0.035) (0.035) (0.037) (0.039)
Retired from employment, with unemployment experience, retired < 1 year 0.028 0.084 0.015 0.017 (0.107) (0.106) (0.102) (0.102)
Retired from employment, with unemployment experience, retired > 1 year 0.132* 0.185** 0.140* 0.144* (0.078) (0.078) (0.078) (0.079)
Retired from unemployment, no previous unemployment exp., retired < 1 year
-0.020 0.044 -0.018 -0.126
(0.088) (0.088) (0.087) (0.088)
Retired from unemployment, no previous unemployment exp., retired > 1 year
-0.035 0.037 -0.026 -0.144*
(0.145) (0.082) (0.080) (0.079)
Retired from unemployment, with previous unempl. exp., retired < 1 year 0.145 0.204 0.129 -0.025 (0.124) (0.124) (0.125) (0.129)
Retired from unemployment, with previous unempl. exp., retired >1 year 0.335*** 0.401*** 0.312*** 0.161 (0.110) (0.101) (0.110) (0.111)
Employed in the year before retirement -0.006 -0.006 -0.034 -0.019 (0.030) (0.030) (0.030) (0.030)
Unemployed in the year before retirement -0.407*** -0.327*** -0.356*** -0.484***
(0.079) (0.080) (0.079) (0.081)
Unemployed except in the year before retirement -0.557*** -0.481*** -0.501*** -0.623***
(0.037) (0.037) (0.036) (0.038)
Log. equivalence income at 2006 prices 0.344*** 0.337*** 0.301*** (0.028) (0.028) (0.028)
Home ownership 0.098* 0.070* 0.070* (0.040) (0.040) (0.039)
Living with people in need of care in the same household -0.574*** -0.583***
(0.064) (0.064)
Living with children in the same household 0.034 0.039 (0.040) (0.039)
Single -0.447*** -0.450***
(0.046) (0.045)
Age, at least 50 but not older than 54 -0.174** -0.167***
(0.036) (0.036)
Age, at least 55 but not older than 59 -0.147*** -0.126***
(0.024) (0.023)
Age, at least 65 0.042 0.046 (0.029) (0.029)
Job security, high 0.105*** (0.017)
Job security, low -0.163***
(0.017)
Job satisfaction, average of the sample 0.176*** (0.005)
Time fixed effects yes yes yes Yes Individual fixed effects yes yes yes Yes Constant 6.828*** 4.218*** 4.434*** 4.713***
(0.025) (0.214) (0.214) (0.210)
Observations 77,538 77,538 77,538 77,538 Number of persons 12,655 12,655 12,655 12,655 R² (within) 0.022 0.026 0.034 0.070
Note: The table presents OLS estimates of life satisfaction with individual and time fixed effects. Robust standard errors in parentheses, ***p<0.01, **p<0.05, *p<0.1. The reference group represents (hypothetical) persons who are employed. From II-2 to II-4, they additionally have no disposable income and do not own their home. In II-3 and II-4, they live neither with people in need of care nor children in the household, are cohabiting and between 60 and 64 years old. In II-4, they have sample-average job satisfaction and medium job security.
17
The second specification (II-2) adds income and home ownership, and the third specification
(II-3) introduces further socio-demographic characteristics.2 None of these specifications reveal
non-monetary non-employment-related scarring effects. Compared to times of employment,
people retiring from unemployment with previous unemployment experiences benefit from
retirement.
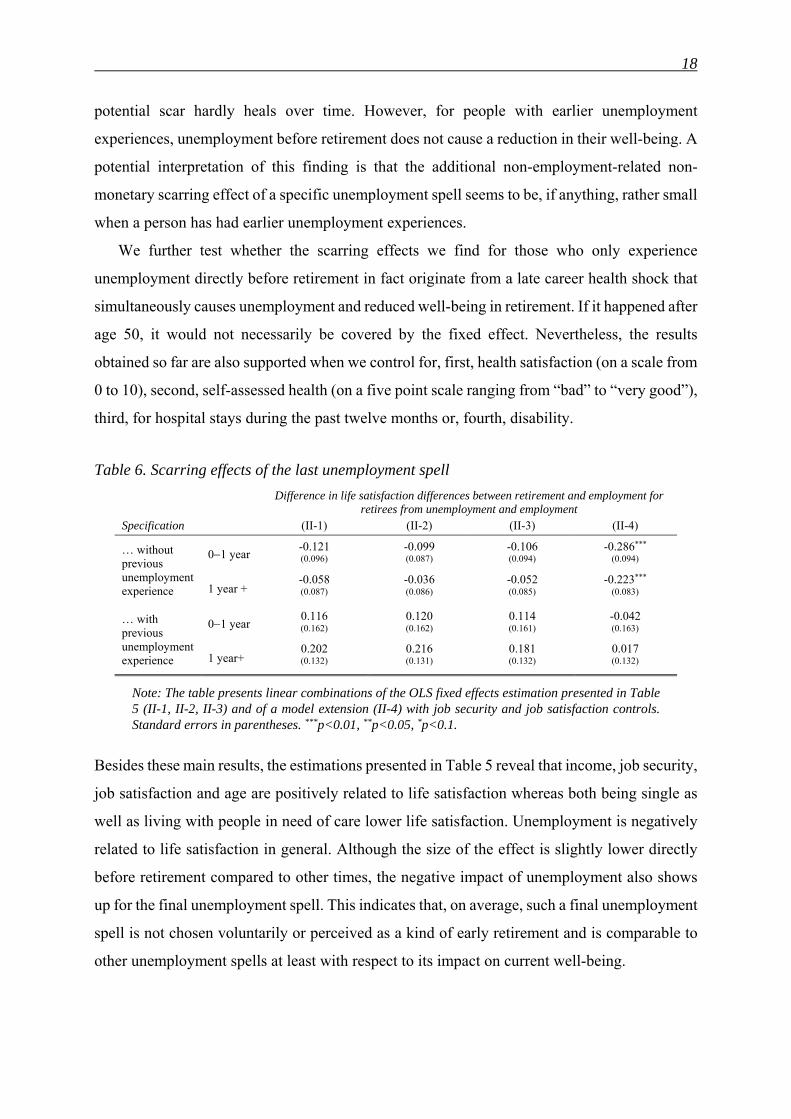
It is plausible that the transition to retirement genuinely affects well-being through non-
monetary non-employment-related channels. If true, it is the difference-in-differences that
measures the actual non-employment-related scarring effect: the change in life satisfaction
since periods of employment for retirees from unemployment minus the change in life
satisfaction from employment to retirement, given the same level of unemployment experience
and the same point in time after retirement. Scars are detected if the values are negative.
Specifications II-1, II-2, II-3 in Table 6 display the corresponding values which are calculated
as the sums of the coefficients from the estimations of (II) given in Table 5. These sums are
slightly positive for people with previous unemployment experience and slightly negative
otherwise, but statistically never significantly different from zero.
This strategy does not take into account that retirement might affect people who retire from
unemployment differently from those who retire from employment because their job conditions
differed as well. One could imagine that unpleasant job characteristics, in particular job
insecurity prior to unemployment, or low work motivation during late career employment were
more prevalent among people who eventually retired from unemployment. This would explain
why these people seem to experience a larger increase in life satisfaction upon retirement,
relative to their life satisfaction when employed, than people who retire from employment, as
indicated by some of our estimates. If true, this larger increase in life satisfaction countervails
non-employment-related non-monetary unemployment scarring. To address this issue, we test
a further model specification (II-4) in which we include job security and job satisfaction as
additional controls for insecurity, unpleasant job characteristics and low motivation in times of
employment. In the process, we interpret job satisfaction as an aggregate measure of both
situational conditions (e.g. job characteristics) and personal characteristics (e.g. motivation).
The resulting difference in life satisfaction differences between retirement and employment for
people retiring from employment and from unemployment is displayed in column II-4 in Table
6. It is significantly negative when the final unemployment spell was the only one, which might
be interpreted as non-employment-related non-monetary unemployment scarring. If at all, this
2 We postpone the description and discussion of the fourth specification for the time being.
18
potential scar hardly heals over time. However, for people with earlier unemployment
experiences, unemployment before retirement does not cause a reduction in their well-being. A
potential interpretation of this finding is that the additional non-employment-related non-
monetary scarring effect of a specific unemployment spell seems to be, if anything, rather small
when a person has had earlier unemployment experiences.
We further test whether the scarring effects we find for those who only experience
unemployment directly before retirement in fact originate from a late career health shock that
simultaneously causes unemployment and reduced well-being in retirement. If it happened after
age 50, it would not necessarily be covered by the fixed effect. Nevertheless, the results
obtained so far are also supported when we control for, first, health satisfaction (on a scale from
0 to 10), second, self-assessed health (on a five point scale ranging from “bad” to “very good”),
third, for hospital stays during the past twelve months or, fourth, disability.
Table 6. Scarring effects of the last unemployment spell
Difference in life satisfaction differences between retirement and employment for
retirees from unemployment and employment Specification (II-1) (II-2) (II-3) (II-4)
… without previous unemployment experience
01 year -0.121 -0.099 -0.106 -0.286*** (0.096) (0.087) (0.094) (0.094)
1 year + -0.058 -0.036 -0.052 -0.223*** (0.087) (0.086) (0.085) (0.083)
… with previous unemployment experience
01 year 0.116 0.120 0.114 -0.042 (0.162) (0.162) (0.161) (0.163)
1 year+ 0.202 0.216 0.181 0.017 (0.132) (0.131) (0.132) (0.132)
Note: The table presents linear combinations of the OLS fixed effects estimation presented in Table 5 (II-1, II-2, II-3) and of a model extension (II-4) with job security and job satisfaction controls. Standard errors in parentheses. ***p<0.01, **p<0.05, *p<0.1.
Besides these main results, the estimations presented in Table 5 reveal that income, job security,
job satisfaction and age are positively related to life satisfaction whereas both being single as
well as living with people in need of care lower life satisfaction. Unemployment is negatively
related to life satisfaction in general. Although the size of the effect is slightly lower directly
before retirement compared to other times, the negative impact of unemployment also shows
up for the final unemployment spell. This indicates that, on average, such a final unemployment
spell is not chosen voluntarily or perceived as a kind of early retirement and is comparable to
other unemployment spells at least with respect to its impact on current well-being.
19
Being employed in the year directly prior to retirement does not affect well-being differently
than being employed in earlier years. The overall increase in life satisfaction upon retirement
of a person who was unemployed immediately before retirement depends on i) the difference
in life satisfaction of being retired and being employed and ii) the contemporaneous loss in
well-being experienced in the last unemployment spell. Indeed, overall life satisfaction
increases for this group as the respective sum of coefficients is positive and statistically
significant (with and without previous unemployment experience) and remains positive after
the first year of retirement. This confirms the results of Hetschko, Knabe and Schöb (2014), by
employing a more extensive panel analysis.
Our approach to distinguishing between employment-related and non-employment-related
non-monetary scarring might fail for those who intend to return to the workforce after a short
retirement spell. As mentioned above, only a very small minority of retirees could imagine
returning to the workforce. We exclude this group in a first robustness check, and re-estimate
specifications (II-3) and (II-4), which include job security and job satisfaction controls. We
obtain practically the same results as before.
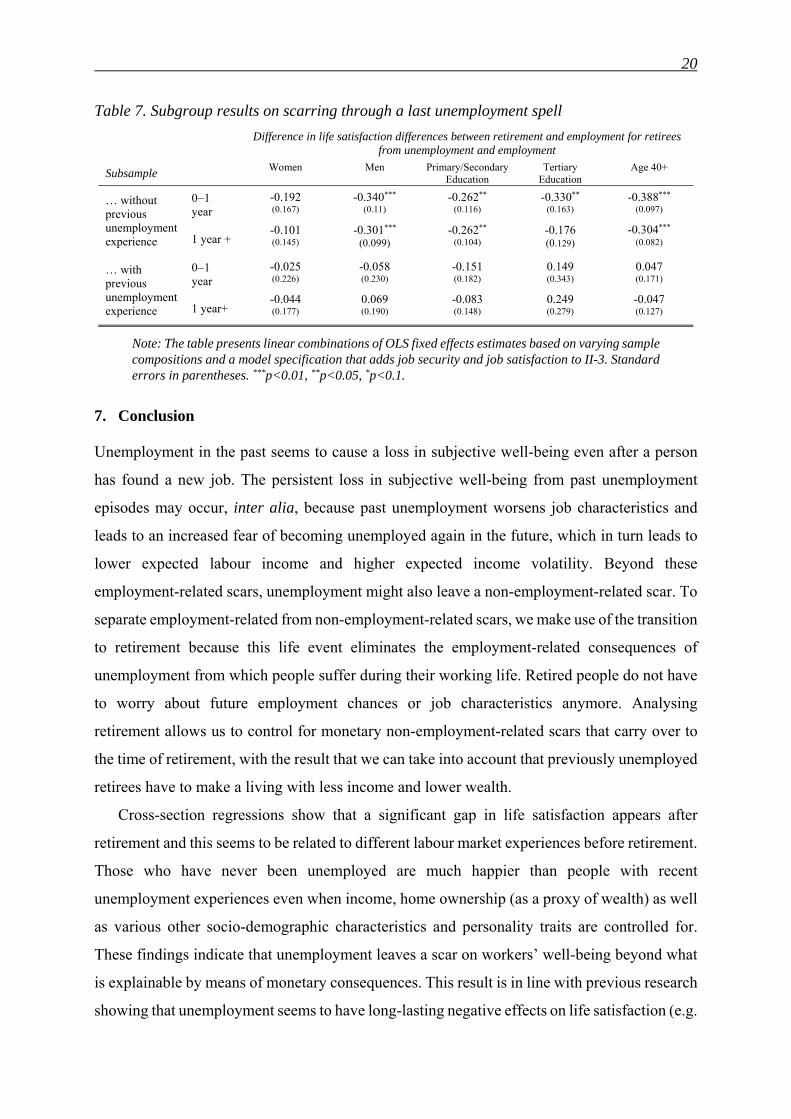
We further test whether subgroups of retirees suffer from a final unemployment spell by
estimating model (II-4) separately for women and men as well as for people with different
educational attainments. Table 7 presents the corresponding linear combinations of coefficients
indicating non-employment-related non-monetary scarring (as in Table 6). Men and the group
of people with primary or secondary education who retired from a singular unemployment spell
show significant negative differences that might indicate unemployment scarring. However,
these findings do not correspond with the difference found for retirees with previous
unemployment experience. For the subgroups of women and highly educated people, we do not
find statistically robust evidence for non-employment-related non-monetary scarring.
Finally, we test the sensitivity of our results to the age limitation we applied to our sample.
We enlarge the sample with people who are between 40 and 50 years old and apply specification
(II-4) again. These estimates, presented in the last column of Table 7, indicate that expanding
the analysis to earlier career stages does not affect our main findings.
20
Table 7. Subgroup results on scarring through a last unemployment spell
Difference in life satisfaction differences between retirement and employment for retirees
from unemployment and employment
Subsample Women Men Primary/Secondary Education
Tertiary Education
Age 40+
… without previous unemployment experience
01 year
-0.192 -0.340*** -0.262** -0.330** -0.388*** (0.167) (0.11) (0.116) (0.163) (0.097)
1 year + -0.101 -0.301*** -0.262** -0.176 -0.304*** (0.145) (0.099) (0.104) (0.129) (0.082)
… with previous unemployment experience
01 year
-0.025 -0.058 -0.151 0.149 0.047 (0.226) (0.230) (0.182) (0.343) (0.171)
1 year+ -0.044 0.069 -0.083 0.249 -0.047 (0.177) (0.190) (0.148) (0.279) (0.127)
Note: The table presents linear combinations of OLS fixed effects estimates based on varying sample compositions and a model specification that adds job security and job satisfaction to II-3. Standard errors in parentheses. ***p<0.01, **p<0.05, *p<0.1.
7. Conclusion
Unemployment in the past seems to cause a loss in subjective well-being even after a person
has found a new job. The persistent loss in subjective well-being from past unemployment
episodes may occur, inter alia, because past unemployment worsens job characteristics and
leads to an increased fear of becoming unemployed again in the future, which in turn leads to
lower expected labour income and higher expected income volatility. Beyond these
employment-related scars, unemployment might also leave a non-employment-related scar. To
separate employment-related from non-employment-related scars, we make use of the transition
to retirement because this life event eliminates the employment-related consequences of
unemployment from which people suffer during their working life. Retired people do not have
to worry about future employment chances or job characteristics anymore. Analysing
retirement allows us to control for monetary non-employment-related scars that carry over to
the time of retirement, with the result that we can take into account that previously unemployed
retirees have to make a living with less income and lower wealth.
Cross-section regressions show that a significant gap in life satisfaction appears after
retirement and this seems to be related to different labour market experiences before retirement.
Those who have never been unemployed are much happier than people with recent
unemployment experiences even when income, home ownership (as a proxy of wealth) as well
as various other socio-demographic characteristics and personality traits are controlled for.
These findings indicate that unemployment leaves a scar on workers’ well-being beyond what
is explainable by means of monetary consequences. This result is in line with previous research
showing that unemployment seems to have long-lasting negative effects on life satisfaction (e.g.
21
Luhmann and Eid 2009, Bell and Blanchflower 2011, Daly and Delaney 2013). It is also
compatible with the analysis by Knabe and Rätzel (2011), who show that a large part, but not
all, of the non-monetary scarring effect can be explained by worsened job prospects.
The cross-sectional identification of scarring effects suffers from the disadvantage that
unobservable personal characteristics explaining both unemployment before retirement and low
well-being afterwards cannot be fully controlled. Therefore, we employ a longitudinal analysis
of the life satisfaction change experienced by the same people between employment and
retirement, considering previous unemployment and employment spells as well. We find that a
final unemployment spell affects well-being after retirement negatively when people have not
already experienced unemployment at an earlier point in time. For people who have had
previous unemployment experiences in their life, an additional unemployment spell
immediately before retirement does not cause (further) reductions in their life satisfaction after
retirement. This suggests that additional non-employment-related non-monetary scars caused
by repeated unemployment spells are rather small compared to the scar resulting from the first
unemployment experience. Hence, unemployment does indeed scar – and the first cut is the
deepest.
22
References
Angrist, Joshua D. and Jörn-Steffen Pischke (2009): Mostly Harmless Econometrics: An Empiricist’s Companion, Princeton University Press: Princeton.
Arulampalam, Wiji, Paul Gregg and Mary Gregory (2001): “Unemployment Scarring”, Economic Journal 111(475), 577-584.
Bell, David N. F. and David G. Blanchflower (2011): “Young people and the Great Recession”, Oxford Review of Economic Policy 27(2), 241–267.
Bonsang, Eric and Tobias J. Klein (2012): “Retirement and Subjective Well-Being”, Journal of Economic Behavior & Organization 83(3), 311-329.
Blanchflower, David G. and Andrew J. Oswald (2004): “Well-Being Over Time in Britain and the USA”, Journal of Public Economics 88(7-8), 1359-1386.
Brand, Jennie (2006): “The Effects of Job Displacement on Job Quality: Findings from the Wisconsin Longitudinal Study”, Research in Social Stratification and Mobility 24(3), 275-98.
Clark, Andrew E. (2003): “Unemployment as a Social Norm: Psychological Evidence from Panel Data”, Journal of Labor Economics 21(2), 323-351.
Clark, Andrew E., Yannis Georgellis and Peter Sanfey (2001): “Scarring: The Psychological Impact of Past Unemployment”, Economica 68(270), 221-241.
Clark, Andrew E., Ed Diener, Yannis Georgellis and Richard E. Lucas (2008): “Lags and Leads in Life Satisfaction: A Test of the Baseline Hypothesis”, Economic Journal 118(529), F222-F243.
Daly, Michael and Liam Delaney (2013): “The scarring effect of unemployment throughout adulthood on psychological distress at age 50: Estimates controlling for early adulthood distress and childhood psychological factors”, Social Science & Medicine 80(0), 19-23.
Dieckhoff, Martina (2011): “The Effect of Unemployment on Subsequent Job Quality in Europe: A Comparative Study of Four Countries”, Acta Sociologica 54(3), 233-249.
Hetschko, Clemens, Andreas Knabe and Ronnie Schöb (2014): “Changing Identity: Retiring from Unemployment”, Economic Journal 124(575), 149-166.
Jahoda, Marie (1981): Work, Employment, and Unemployment: Values, Theories, and Approaches in Social Research, American Psychologist 36(2), 184-191.
Knabe, Andreas and Steffen Rätzel (2011): “Scarring or Scaring? The Psychological Impact of Past Unemployment and Future Unemployment Risk”, Economica 78, 283-293.
Lange, Thomas (2013): “Scarred from the past or afraid of the future? Unemployment and job satisfaction across European labour markets”, International Journal of Human Resource Management 24(6), 1096-1112.
Lühning, Rolf (2006): Entwicklung des Leistungsrechts der gesetzlichen Rentenversicherung in der Bundesrepublik Deutschland seit der großen Rentenreform von 1957 (1957-2004), Logos: Berlin.
Luhmann, Maike and Michael Eid (2009): “Does it really feel the same? Changes in life satisfaction following repeated life events”, Journal of Personality and Social Psychology 97(2), 363-381.
Lykken, David and Auke Tellegen (1996): “Happiness is a Stochastic Phenomenon”, Psychological Science 7(3), 186-189.
Schöb, Ronnie (2013): “Unemployment and Identity”, CESifo Economic Studies 59(1), 149-180.
SGB VI: Sozialgesetzbuch. Sechstes Buch: Gesetzliche Rentenversicherung, in its version of 28th April 2011.
Specht, Jule, Boris Egloff and Stefan C. Schmukle (2011): “Stability and Change of Prsonality across the Life Course: The Impact of Age and Major Life Events on Mean-level and

23
Rank-order Stability of the Big Five”, Journal of Personality and Social Psychology 101(4), 862-882.
Stutzer, Alois and Rafael Lalive (2004): “The Role of Social Work Norms in Job Searching and Subjective Well-Being”, Journal of the European Economic Association 2(4), 696-719.
Wagner, Gert G., Joachim R. Frick and Jürgen Schupp (2007): “The German Socio-Economic Panel Study (SOEP) - Scope, Evolution and Enhancements”, Schmollers Jahrbuch 127(1), 139-169.
Winkelmann, Liliana and Rainer Winkelmann (1998): “Why Are the Unemployed So Unhappy? Evidence from Panel Data”, Economica 65(257), 1-15.
Young, Cristobal (2012): “Losing a Job: The Nonpecuniary Cost of Unemployment in the United States”, Social Forces 91(2), 609-634.