Embed Size (px)
Citation preview

Prof. Dr. Jegatheswaran Ratnasingam Faculty of Forestry, Universiti Putra Malaysia,
43400 UPM, Serdang, Selangor,
Malaysia.
Paper presented at International Timber Conference in conjunction with Sarawak Grand Timber Expo & Conference, 7 -8 June 2013,
Kuching, Sarawak.

Special thanks to my graduate students, Chong Yen Yoon, Geetha Ramasamy, Asa Naim Rusli & Ang Aik Fei for the detailed research into the subject.
This presentation is an excerpt of a detailed report presented to the International Labour Organization on the innovation and human capital development in the South East Asian wood industry – ILO/WP/72-1P (2012).

Agricultural-based economy (1970s)
(rubber, tin and palm oil)
Manufacturing
(electric and electronic, food, chemicals, petroleum…)
90% of the manufacturing sector are dominated by
small and medium enterprises (SMEs) with electrical
and electronic as the largest export product since 1980s.
1.0 Introduction
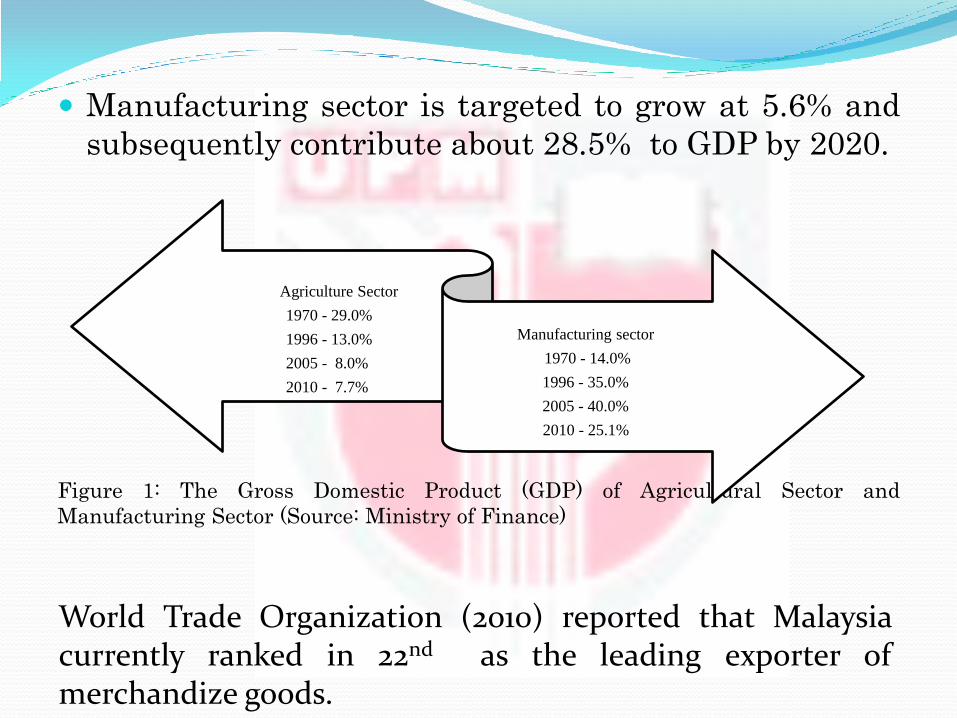
Manufacturing sector is targeted to grow at 5.6% and
subsequently contribute about 28.5% to GDP by 2020.
Figure 1: The Gross Domestic Product (GDP) of Agricultural Sector and
Manufacturing Sector (Source: Ministry of Finance)
Agriculture Sector
1970 - 29.0%
1996 - 13.0%
2005 - 8.0%
2010 - 7.7%
Manufacturing sector
1970 - 14.0%
1996 - 35.0%
2005 - 40.0%
2010 - 25.1%
World Trade Organization (2010) reported that Malaysia currently ranked in 22nd as the leading exporter of merchandize goods.

2.0 Innovation Concept Innovation has long been argued to be the engine of
growth.
Innovation in wood processing keeps the industry competitive from other materials, such as plastics, metals and steel.
Innovation is not a single action but a total process of interrelated sub processes.
It is not just the conception of a new idea, nor the invention of a new device, nor the development of a new market.
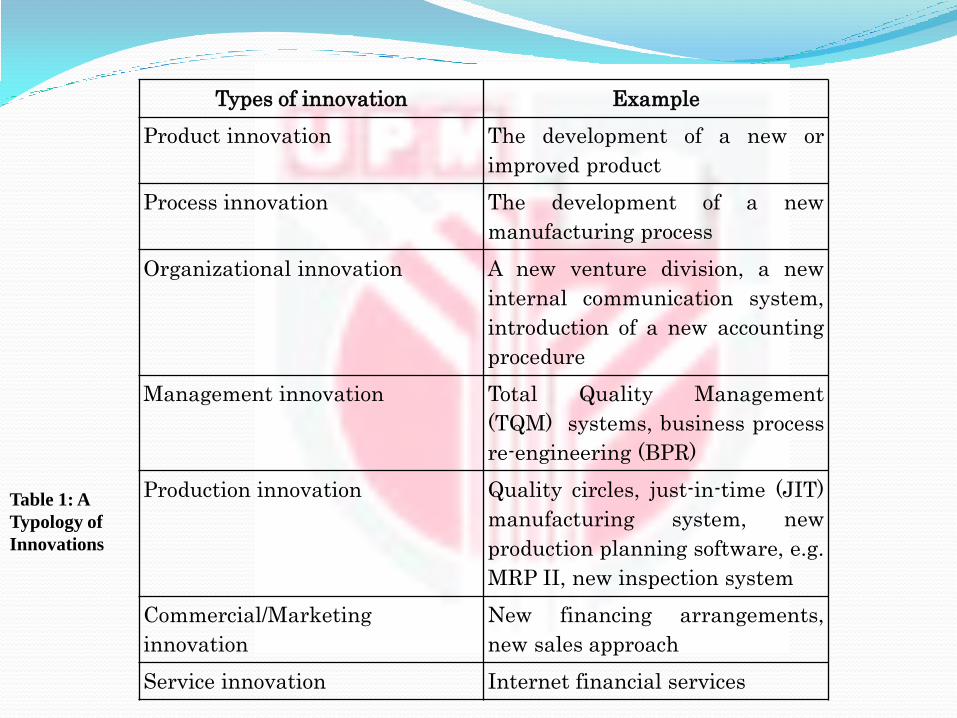
Types of innovation Example
Product innovation The development of a new or
improved product
Process innovation The development of a new
manufacturing process
Organizational innovation A new venture division, a new
internal communication system,
introduction of a new accounting
procedure
Management innovation Total Quality Management
(TQM) systems, business process
re-engineering (BPR)
Production innovation Quality circles, just-in-time (JIT)
manufacturing system, new
production planning software, e.g.
MRP II, new inspection system
Commercial/Marketing
innovation
New financing arrangements,
new sales approach
Service innovation Internet financial services
Table 1: A
Typology of
Innovations
The evidence from the Global Competitive Report (2011) indicated that the Malaysian innovation capacity in global ranking was 25 out of 144 countries. With the increase in Malaysia’s GDP per capital to
US$9,700 from US$8,423; Malaysia has upgraded to the
transition stage towards the "innovation-driven" stage of
development

Innovation Aspect China
Ranking
MALAYSIA
RANKING
U.S
Ranking
Capacity for innovation 21 25 6
Quality of scientific research institutions 39 32 4
Company spending on R&D 22 16 6
University-industry collaboration in R&D 25 22 1
Gov. procurement of advanced tech. products 12 8 5
Availability of scientists and engineers 35 33 4
Utility patents per million population 51 29 3
Table 2: Malaysia Innovation Performance at the Global Stage
(Sources: The Global Competitive Report, 2010-2011)

3.0 The Malaysian Wood Industry
The industry has contributed to the nation’s economic
growth, as well as its foreign exchange earnings.
There are 3991 wood industries providing employment
more than 300,000 people.
In 2010, the wood-based sector contributed to 3.7
percent of the GDP and 3.2 percent of the country’s
total merchandise export.

The transformation was carried out through the
Industrial Master Plan, to improve and enhance the
productivity growth of the manufacturing sector.
The 1st Industrial Master Plan (IMP-1) (1986 – 1995)
was not showing encouraging progressions which did not
achieve the goal completely. Thus, a slightly modification
was carried out in 2nd Industrial Master Plan (IMP-2)
(1996–2005) to strengthen the productivity growth in
manufacturing sectors.
Primary Processing Secondary Processing

Year Primary wood
product (%)
Secondary wood
product (%)
1990 68 32
1995 59 41
1999 50 50
Table 4: Constituents of Wood Products Export
Malaysian wood based industry recorded
reduction in primary wood products while
secondary wood products grew 9 percent at the
end of IMP-1.
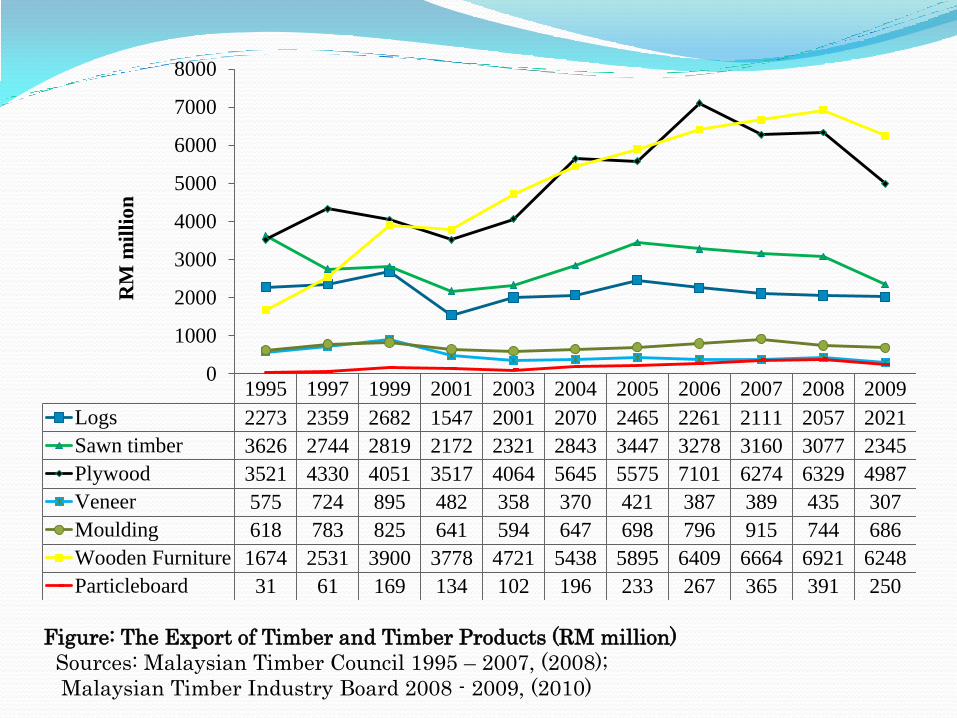
1995 1997 1999 2001 2003 2004 2005 2006 2007 2008 2009
Logs 2273 2359 2682 1547 2001 2070 2465 2261 2111 2057 2021
Sawn timber 3626 2744 2819 2172 2321 2843 3447 3278 3160 3077 2345
Plywood 3521 4330 4051 3517 4064 5645 5575 7101 6274 6329 4987
Veneer 575 724 895 482 358 370 421 387 389 435 307
Moulding 618 783 825 641 594 647 698 796 915 744 686
Wooden Furniture 1674 2531 3900 3778 4721 5438 5895 6409 6664 6921 6248
Particleboard 31 61 169 134 102 196 233 267 365 391 250
0
1000
2000
3000
4000
5000
6000
7000
8000
RM
mil
lio
n
Figure: The Export of Timber and Timber Products (RM million)
Sources: Malaysian Timber Council 1995 – 2007, (2008);
Malaysian Timber Industry Board 2008 - 2009, (2010)
4.0 Issues and Challenges of the Industry
Malaysia has comparative advantage due to its
abundant resources.
But the supply has been unsustainable.
The total average annual log production from natural
forest in Malaysia is declining.
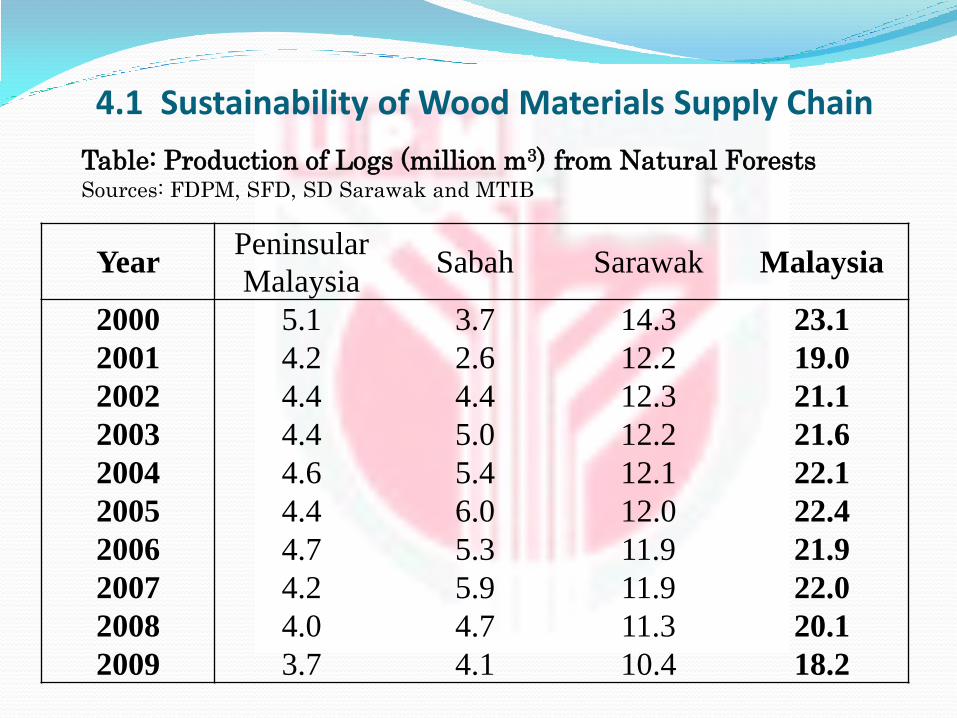
Year Peninsular
Malaysia Sabah Sarawak Malaysia
2000 5.1 3.7 14.3 23.1 2001 4.2 2.6 12.2 19.0 2002 4.4 4.4 12.3 21.1 2003 4.4 5.0 12.2 21.6 2004 4.6 5.4 12.1 22.1 2005 4.4 6.0 12.0 22.4 2006 4.7 5.3 11.9 21.9 2007 4.2 5.9 11.9 22.0 2008 4.0 4.7 11.3 20.1 2009 3.7 4.1 10.4 18.2
Table: Production of Logs (million m3) from Natural Forests Sources: FDPM, SFD, SD Sarawak and MTIB
4.1 Sustainability of Wood Materials Supply Chain

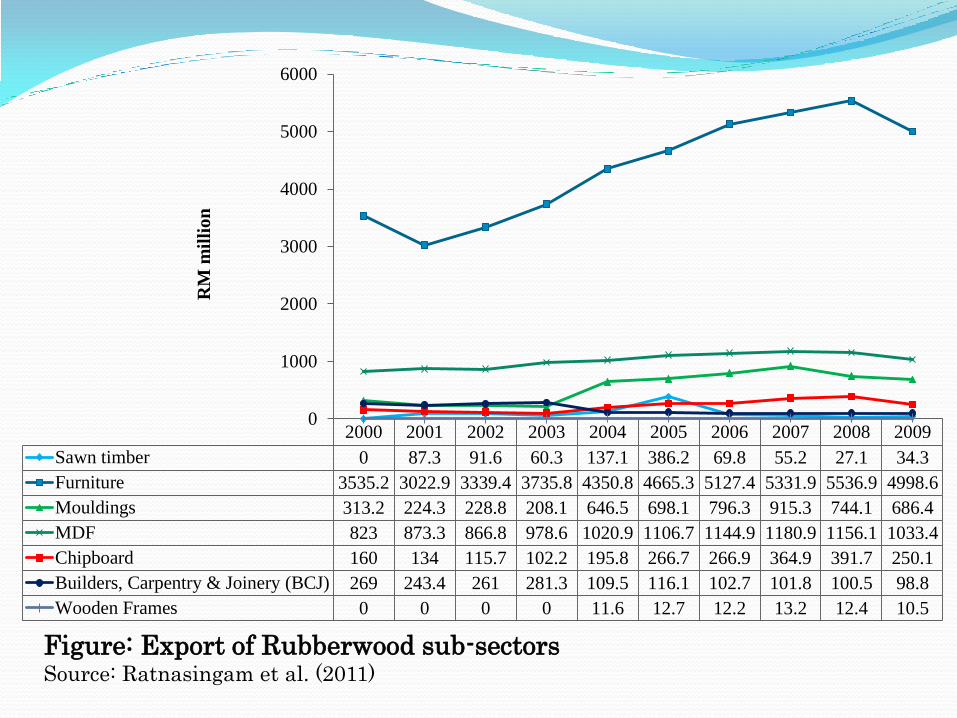
Rubberwood has emerged as an important alternative
wood material.
Rubberwood has been widely use in the industrial
sector due to its availability and low price compared to
tropical hardwood.
Export value of Rubberwood products has been
steadily growing over the years (almost 83% of total
furniture exports derived from Rubberwood products)
2000 2001 2002 2003 2004 2005 2006 2007 2008 2009
Sawn timber 0 87.3 91.6 60.3 137.1 386.2 69.8 55.2 27.1 34.3
Furniture 3535.2 3022.9 3339.4 3735.8 4350.8 4665.3 5127.4 5331.9 5536.9 4998.6
Mouldings 313.2 224.3 228.8 208.1 646.5 698.1 796.3 915.3 744.1 686.4
MDF 823 873.3 866.8 978.6 1020.9 1106.7 1144.9 1180.9 1156.1 1033.4
Chipboard 160 134 115.7 102.2 195.8 266.7 266.9 364.9 391.7 250.1
Builders, Carpentry & Joinery (BCJ) 269 243.4 261 281.3 109.5 116.1 102.7 101.8 100.5 98.8
Wooden Frames 0 0 0 0 11.6 12.7 12.2 13.2 12.4 10.5
0
1000
2000
3000
4000
5000
6000
RM
mil
lio
n
Figure: Export of Rubberwood sub-sectors Source: Ratnasingam et al. (2011)

4.2 Legality and Environment Certification
Malaysian Timber Certification Scheme (MTCS)
endorsed by Program for the Endorsement of Forest
Certification schemes (PEFC), Forest Stewardship
Council (FSC) certified forest management unit (FMU).
Only 353 out of thousands companies in wood industry
were the holder of certificate of chain-of-custody.
Costing - the main reason that appear hinder companies
from seeking CoC.

Forest
Certification
Systems
FMC
Holders
CoC
Holders
Combined
FMC and
CoC
Controlled
Wood Forest
Management
PEFC/MTCS 9 167 - -
FSC 0 177 7 2
Table: Amount of Holders for Forest Management Certificate (FMC), CoC,
Combined FMC and CoC and Controlled Wood Forest Management under
PEFC and FSC Forest Certification Systems in Malaysia (2012)
Source: PEFC and FSC

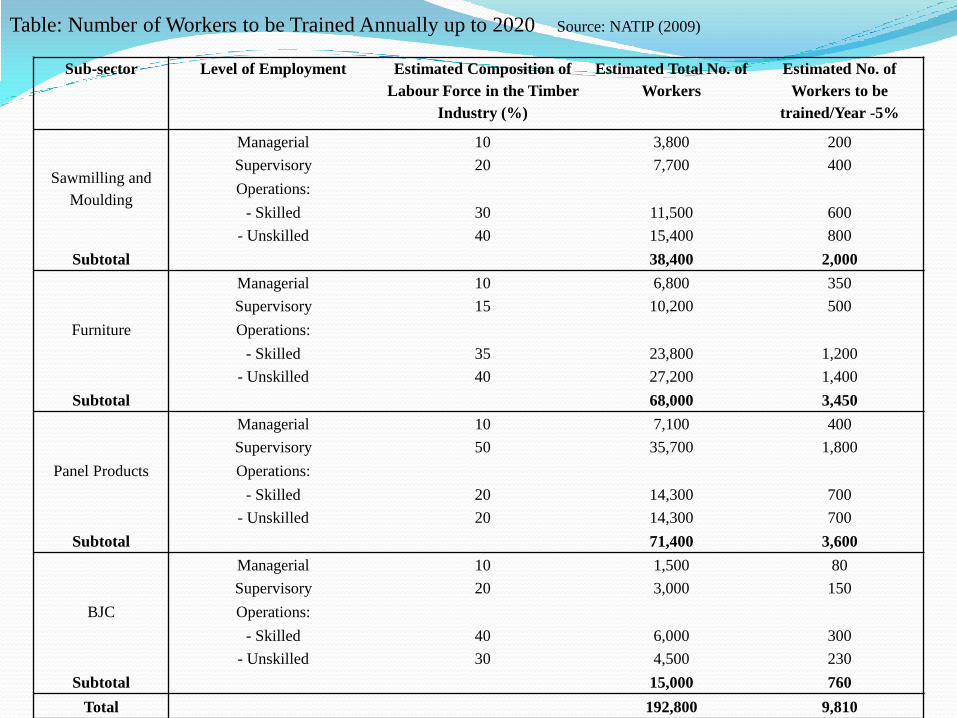
4.3 Human Capital
There were 71,400 workers were employed in the panel
products sub-sector (37%), followed by furniture 68,000
(35%) and sawmilling and moldings 38,400 (20%).
The actual requirement for human capital particularly in
upper level was 5,650 / year but the higher education
institutions provide 2,076 graduates/year. This
represented 36.7% of the requirement gap of the industry
(NATIP, 2009).
There is a need for more skilled workers at all levels such
as (i) managerial, (ii) supervisory and (iii) operational.
Proposed training would consist 1,030 workers at the
managerial level; 2,850 at the supervisory level; and 5,930
at the operational level.
Sub-sector Level of Employment Estimated Composition of
Labour Force in the Timber
Industry (%)
Estimated Total No. of
Workers
Estimated No. of
Workers to be
trained/Year -5%
Sawmilling and
Moulding
Managerial 10 3,800 200
Supervisory 20 7,700 400
Operations:
- Skilled 30 11,500 600
- Unskilled 40 15,400 800
Subtotal 38,400 2,000
Furniture
Managerial 10 6,800 350
Supervisory 15 10,200 500
Operations:
- Skilled 35 23,800 1,200
- Unskilled 40 27,200 1,400
Subtotal 68,000 3,450
Panel Products
Managerial 10 7,100 400
Supervisory 50 35,700 1,800
Operations:
- Skilled 20 14,300 700
- Unskilled 20 14,300 700
Subtotal 71,400 3,600
BJC
Managerial 10 1,500 80
Supervisory 20 3,000 150
Operations:
- Skilled 40 6,000 300
- Unskilled 30 4,500 230
Subtotal 15,000 760
Total 192,800 9,810
Table: Number of Workers to be Trained Annually up to 2020 Source: NATIP (2009)

4.4 Inconsistency in Policy Direction
Ministry of International Trade and Industry (MITI), Ministry
of Plantation and Commodities (MPIC), Ministry of Human
Resources (MOHR), and Ministry of Home Affairs (MOHA),
Ministry of Science, Technology and Innovation (MOSTI),
Ministry of Natural Resources and Environment (MNRE) …
MITI and MPIC - urge to increase productivity
MOHR and MOHA - urge reduce the intake of foreign workers
MOSTI - technology funding for wood industry limited
Forest Research Institute Malaysia (FRIM) of MNRE - R&D
focus spread to both upstream and downstream timber
industry

5.0 Current Status of Innovation
• Malaysia's wood industry is a mature industry.
• However, its operational strategies is at an infancy
stage.
• Malaysia is the largest exporter of sawn timber and the
second largest supplier of plywood as well as 10th
largest exporter of furniture in the world.
• Malaysian wood-based products are comparative
advantage driven!
• Malaysian furniture industry is still a mass producer of
“commodity” type furniture.

Year Value Added
(RM mil)
Value Added
Growth (%)
VA
Intensity
Producti
vity
Productivity
Growth (%)
1988 206 48.2% 56.1% 2.28 4.7%
1993 596 41.2% 34.9% 1.54 0.1%
1999 1,582 23.1% 34.4% 1.53 -1.3%
2003 2,223 1.0% 30.0% 1.43 0.1%
2008 2,833 7.2% 23.3% 1.30 1.2%
Table: Productivity and value addition in the Malaysian furniture industry
Source: Department of Statistics Malaysia
Although the industrial growth rate became consistent and
more stable, but the value addition trend somewhat declined.

Period
Average Value
Added
(RM mil)
Average Value
Added Annual
Growth Rate (%)
Value Added
Intensity (%)
First IMP (1986-1995) 393.7 32.8 42.4
MP-5 (1986-1990) 172.0 30.7 49.8
MP-6 (1991-1995) 615.4 34.5 34.9
Second IMP (1996-2004) 1,875.6 11.8 28.4
MP-7 (1996-2000) 1,526.5 21.6 34.0
MP-8 (2001-2004) 2,224.8 5.1 30.0
Table: Comparison of value addition between first and second IMP
Source: Department of Statistics Malaysia
5.1 Innovation Process in Wood Sector
The sources of innovation must cover the external factors
(such as customer desire and awareness) and internal
factors (such as management, human capital, processing
and new product development (NDP) and technology) to
fulfill the development requirement of innovation in
Malaysian wood-based industry.

Figure: The Sources of Innovation Pyramid
Malaysian wood-based industry should start with the
incremental innovations as the starting phase to build a
confident and positive movement and consequently
shaping a systematic development progress of
innovation process from time to time.
In this early stage, Malaysia should begin to emphasize
more on the aesthetics innovation and innovation of use.
The approaches in these two types of sources innovation
is believed could minimize the costs, time and
compatible with existing manufacturing processes and
current technology industry.

5.2 Drivers of Innovation
• emerging technologies, that leads to technology
innovation or technology-driven process
• competitor actions, which encourage advancement of
value creation market-driven, especially community
toward green concept;
• new ideas from customers, strategic partners, and
employees, which involve the total workforce; and
• emerging changes in the external environment.

• A number of factors hindered the innovative efforts in the
Malaysian wood industry.
• The most significant factors such as knowledge to innovate,
marketing and promotion, and R&D were the high cost of
innovation, perceived economic risks, a lack of information
on markets, uncertainty regarding the demand for
innovative goods or services, and a lack of information on
technology.
• In general, cost and market related factors were the two
main factors that hampered innovation. They were followed
by knowledge-based factors, institutional factors and other
factors.
6.0 Constraints to Innovation in the Wood Industry
7.0 Growth Strategies
• Value Adding (form vs. function)
• Productivity Increase (human capital)
• Efficiency (technical change)
• Better Use of Materials (proper selection based on
market demand)
• Expand the Market (promotion & marketing)

8.0 Lessons for the Sarawak Timber Industry
Take advantage of the diverse culture – to develop new themes/motive/design for innovative wood product
Pay attention to resource diversity
Train competent human capital – that will drive the industry forward
Move away from traditional commodity product – offer a living concept – not a product
Expand cluster system to engage SMEs

9.0 Conclusion
The wood industry in Malaysia will remain
buoyant as long as the comparative advantage
remains intact, but with increasing global
competition, shifting towards competitive
advantage is crucial in the near future!

For Any Enquiries Centre of excellence in innovative wood products and
market intelligence.
Contact:
Prof. Dr. Jegatheswaran Ratnasingam
Faculty of Forestry, Universiti Putra Malaysia,
43400 UPM, Serdang, Selangor, Malaysia.
Tel: +603-89467175
Fax: +603-89432514
E-mail: [email protected]

Thank You and I will be happy to take your questions.