Embed Size (px)
Citation preview
Suggestions for getting an A• How to deal with equations?
– Don’t panic!– If you understand an equation, you can
understand the process it describes
• Why so many graphs?– Teach you how to read (and draw) different
kinds of graphs– Illustrate principals and processes
• When in doubt, think about what’s happening with the physics.

Suggestions for getting an A• How to deal with equations?
– Don’t panic!– If you understand an equation, you can
understand the process it describes
• Why so many graphs?– Illustrate principals and processes– Teach you how to read (and draw) different
kinds of graphs
• When in doubt, think about what’s happening with the physics.

Suggestions for getting an A• How to deal with equations?
– Don’t panic– If you understand an equation, you can
understand the process it describes
• Why so many graphs?– Illustrate principals and processes– Teach you how to read (and draw) different
kinds of graphs
• When in doubt, think about what’s happening with the physics. Ask questions!
An informal survey…

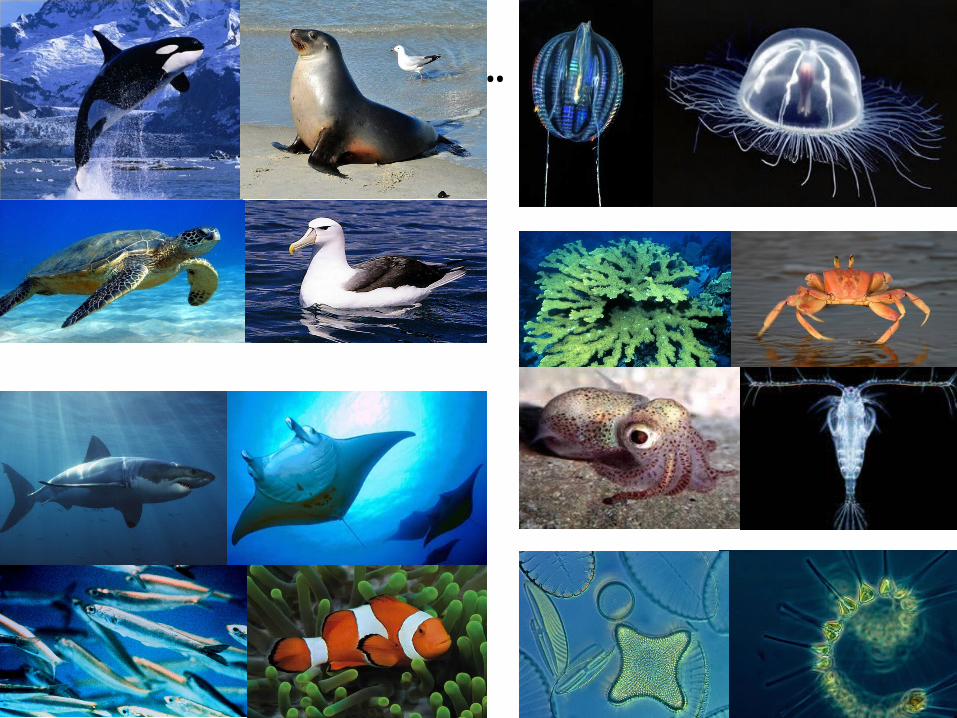
Biology of mixed layer
• Primary production
by Phytoplankton - small drifting organisms
that photosynthesize
• Competition and limits on production
• Critical and compensation depths

Photosynthesis (P)
Carbon dioxide (C,O)
+ Water (H,O)
+ Nutrients (N,P)
+ Light energy
Oxygen (O)
+ Organic matter (C,H,O,N,P)
proteinsfats carbohydrates nucleic acids
Requires chloroplasts
Plants, algae
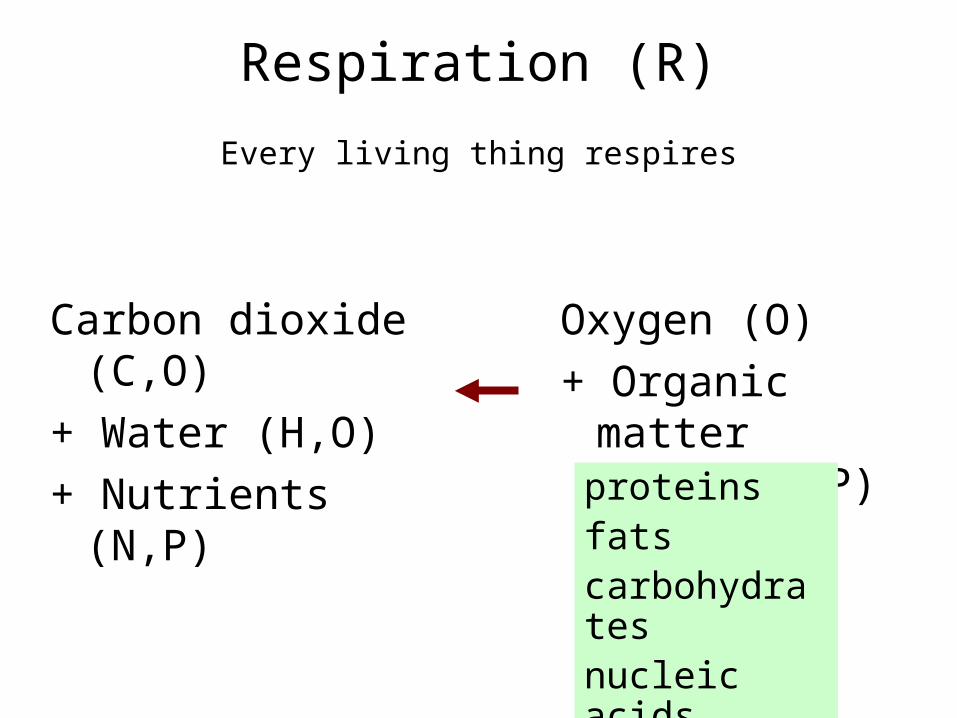
Respiration (R)
Carbon dioxide (C,O)
+ Water (H,O)
+ Nutrients (N,P)
Oxygen (O)
+ Organic matter (C,H,O,N,P)
proteinsfats carbohydrates nucleic acids
Every living thing respires

Primary Production - Definitions
Gross Primary Production (GPP) = rate of carbon fixation by photosynthesis units = [Mass / Area / Time], e.g. [g C m-2 y-1]
Respiration (R) =
rate of carbon (CO2) loss through metabolism
Net Primary Production (NPP) = GPP - ΣR
Need GPP>ΣR for net growth!
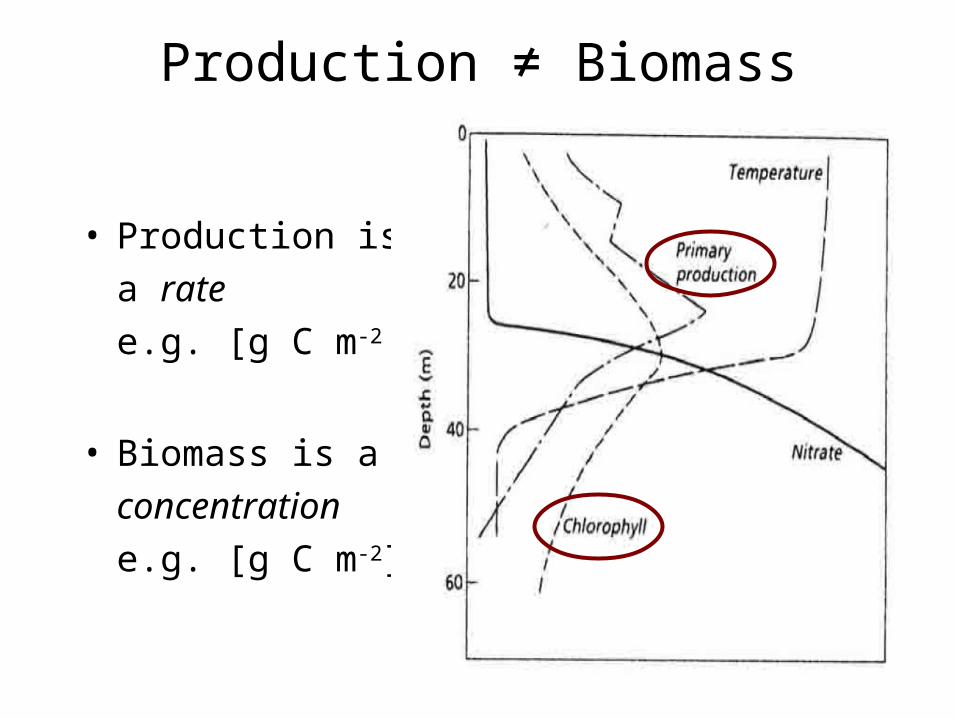
Production ≠ Biomass
• Production is
a rate
e.g. [g C m-2 y-1]
• Biomass is a
concentration
e.g. [g C m-2]

“Paradox of the Plankton” There are many species of phytoplankton,
despite few limiting resources and lots of mixing.
Phytoplankton (single-celled primary producers) have various competitive strategies that enable coexistence.

• Large (5-2000 μm)
• Have unique life cycle & blooms
• Small (2-25 μm)
• Have CaCO3 tests
• Large (2-200 μm)
• Have silica frustules
• Small (<1 μm) or Large (0.5-4 mm)
• Nitrogen fixers
Four major playersCyanobacteria Diatoms
Coccolithophores Dinoflagellates
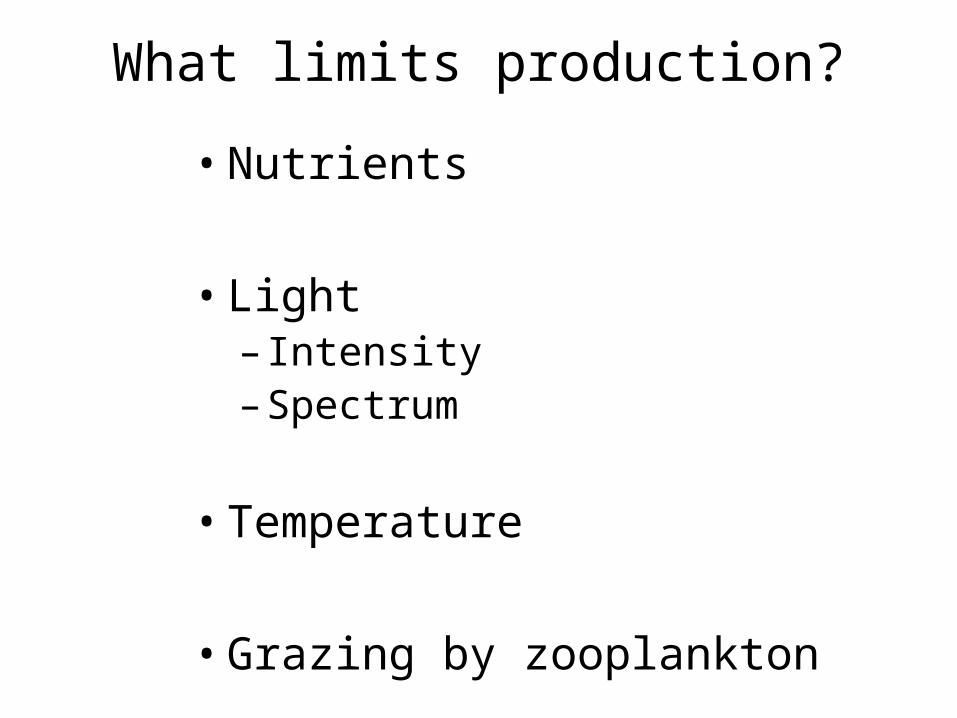
What limits production?
• Nutrients
• Light– Intensity– Spectrum
• Temperature
• Grazing by zooplankton
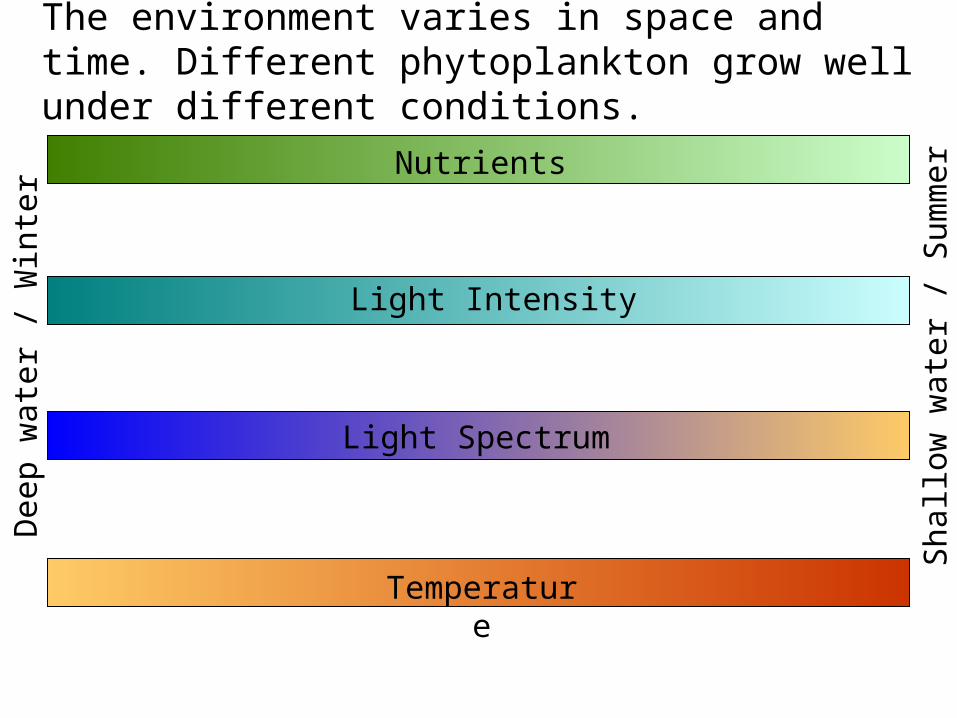
The environment varies in space and time. Different phytoplankton grow well under different conditions.
High LowNutrients
Low High Light Intensity
Narrow BroadLight Spectrum
Low HighTemperature
Dee
p w
ater
/ W
inte
r
Sha
llow
wat
er /
Sum
mer

Nutrients
• N, P, Si, Fe• Nitrogen is most often limiting in ocean• Bioavailable forms of inorganic N:
–Nitrate (NO3-)
–Ammonium (NH4+)
–Nitrite (NO2-)
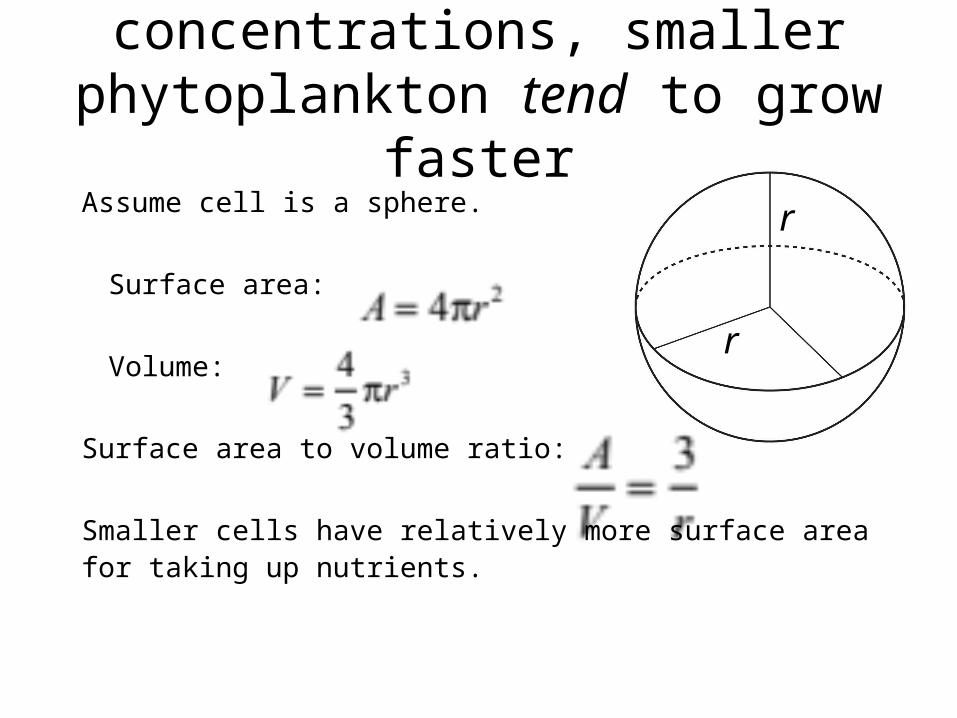
At low nutrient concentrations, smaller phytoplankton tend to grow faster
Assume cell is a sphere.
Surface area:
Volume:
Surface area to volume ratio:
Smaller cells have relatively more surface areafor taking up nutrients.
r
r
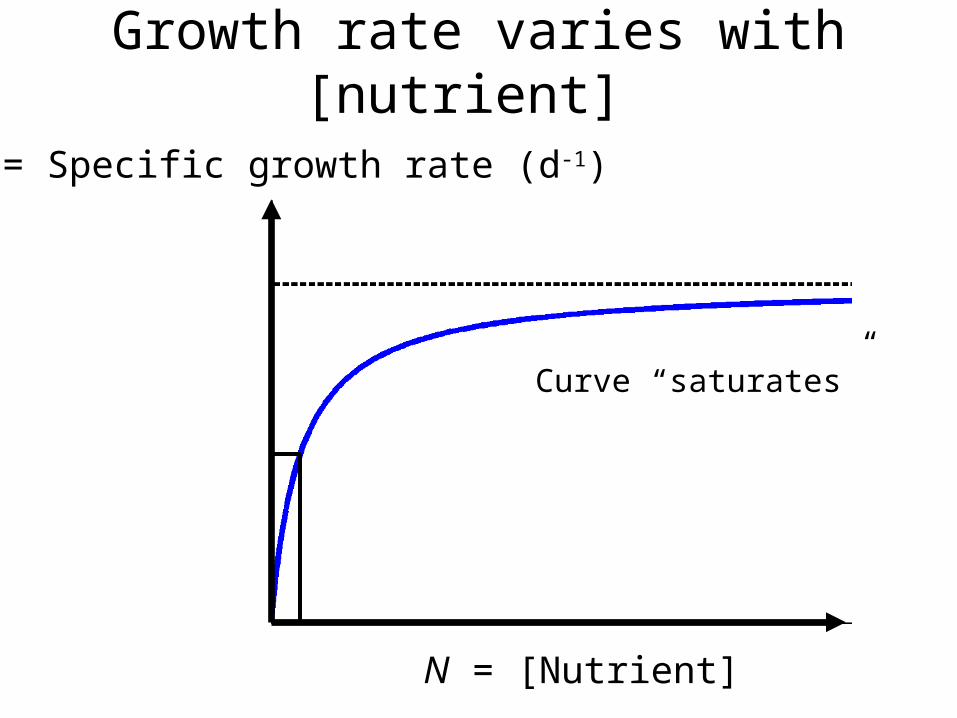
N = [Nutrient]
μ = Specific growth rate (d-1)
Growth rate varies with [nutrient]
Curve “saturates”
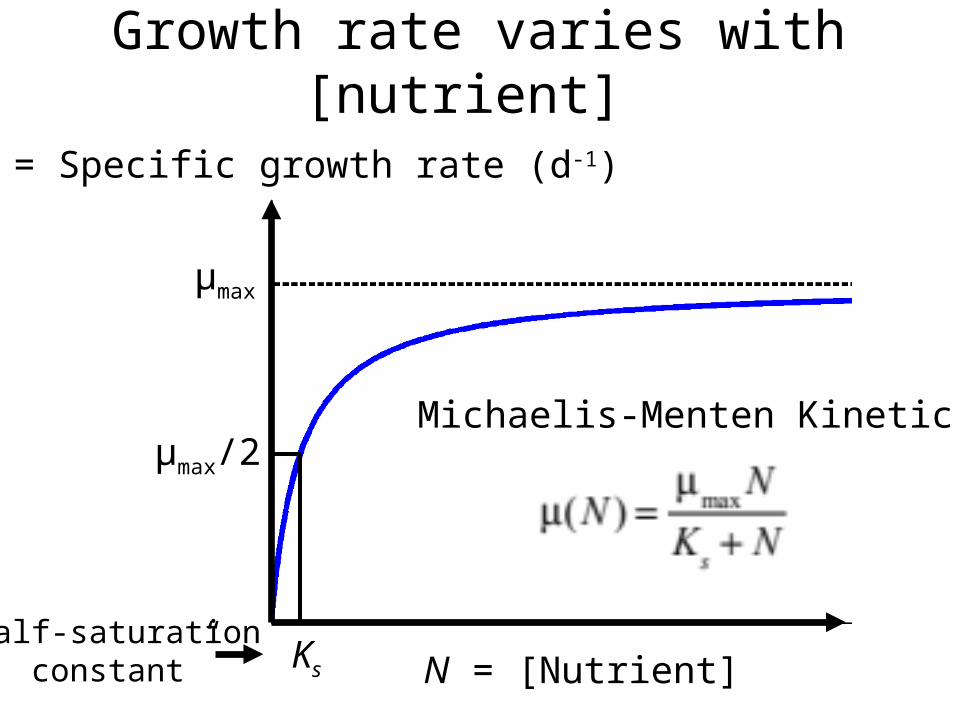
Ks
μmax/2
μmax
N = [Nutrient]
μ = Specific growth rate (d-1)
Growth rate varies with [nutrient]
Michaelis-Menten Kinetics
“half-saturation constant”

Diatoms
•High μmax
•High Ks
Coccolithophores
•Low μmax •Low Ks
High or variable nutrientsHigh mixing, upwellingLow average irradianceHigh turbulence
Chronically low nutrientsStratified conditionsHigh average irradiance Low turbulence
Different strategies of nutrient use
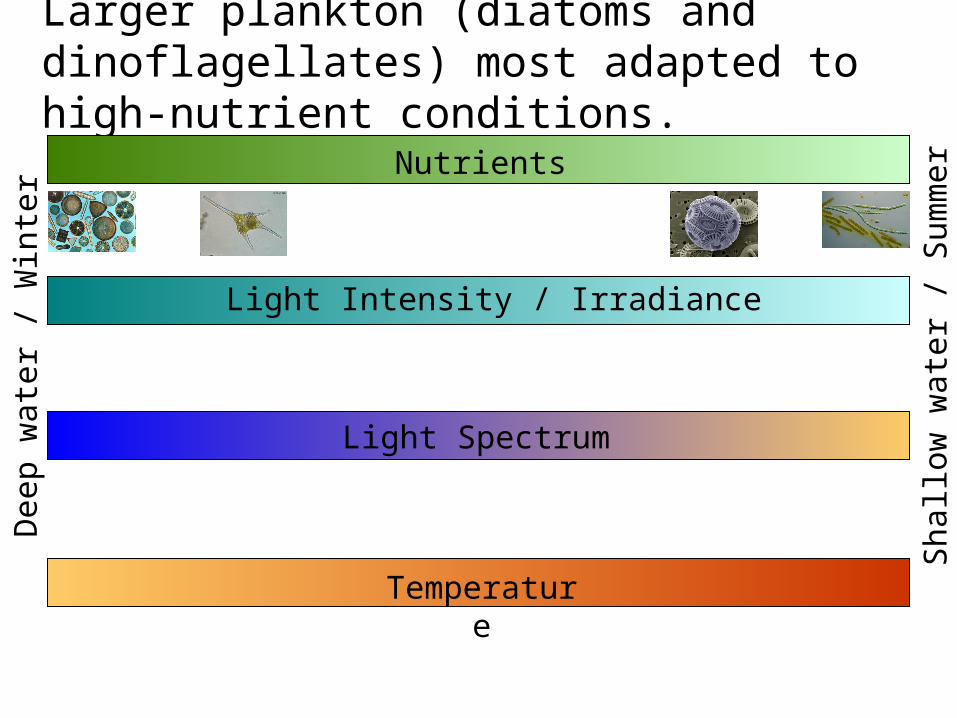
Larger plankton (diatoms and dinoflagellates) most adapted to high-nutrient conditions.
High LowNutrients
Low High Light Intensity / Irradiance
Narrow BroadLight Spectrum
Low HighTemperature
Dee
p w
ater
/ W
inte
r
Sha
llow
wat
er /
Sum
mer
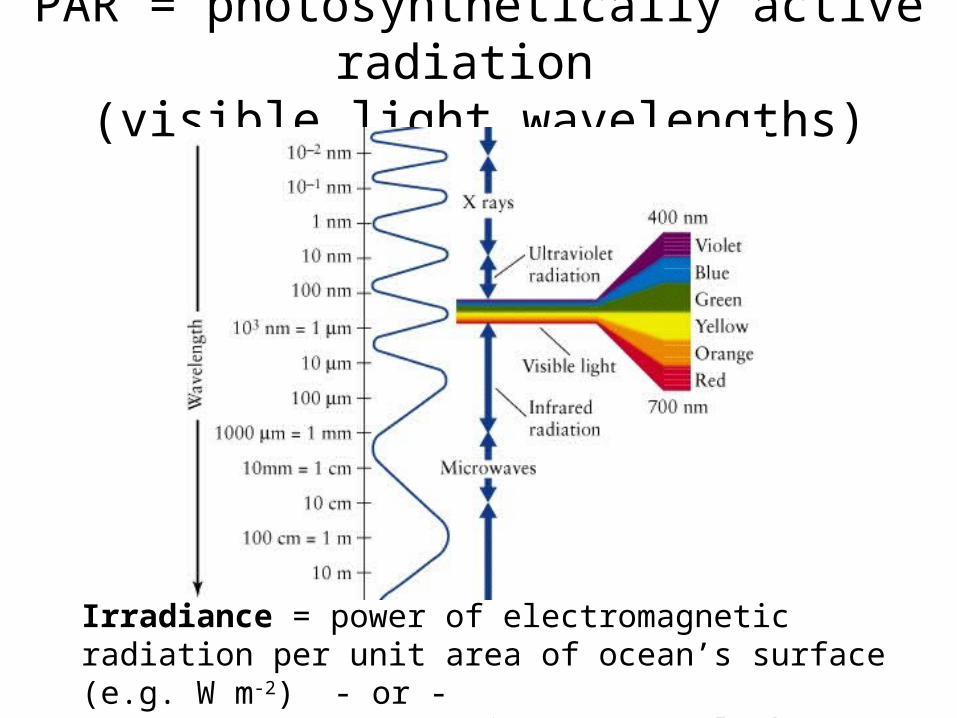
PAR = photosynthetically active radiation (visible light wavelengths)
Irradiance = power of electromagnetic radiation per unit area of ocean’s surface (e.g. W m-2) - or -energy per area per time (e.g. mol photons m-2 s-2).
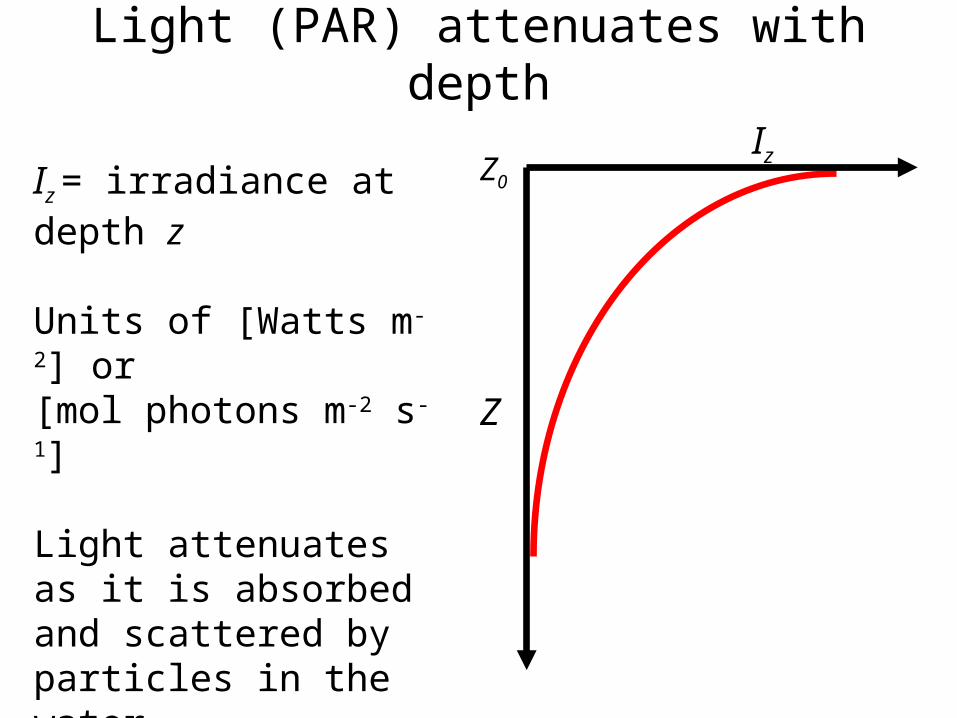
Light (PAR) attenuates with depth
Iz = irradiance at depth z
Units of [Watts m-2] or[mol photons m-2 s-1]
Light attenuates as it is absorbed and scattered by particles in the water.
Z
IzZ0

Hiscock et al. 2008
Average Primary Production saturates at high PAR (photosynthetically active radiation)
Inside Fe patchOutside Fe patch
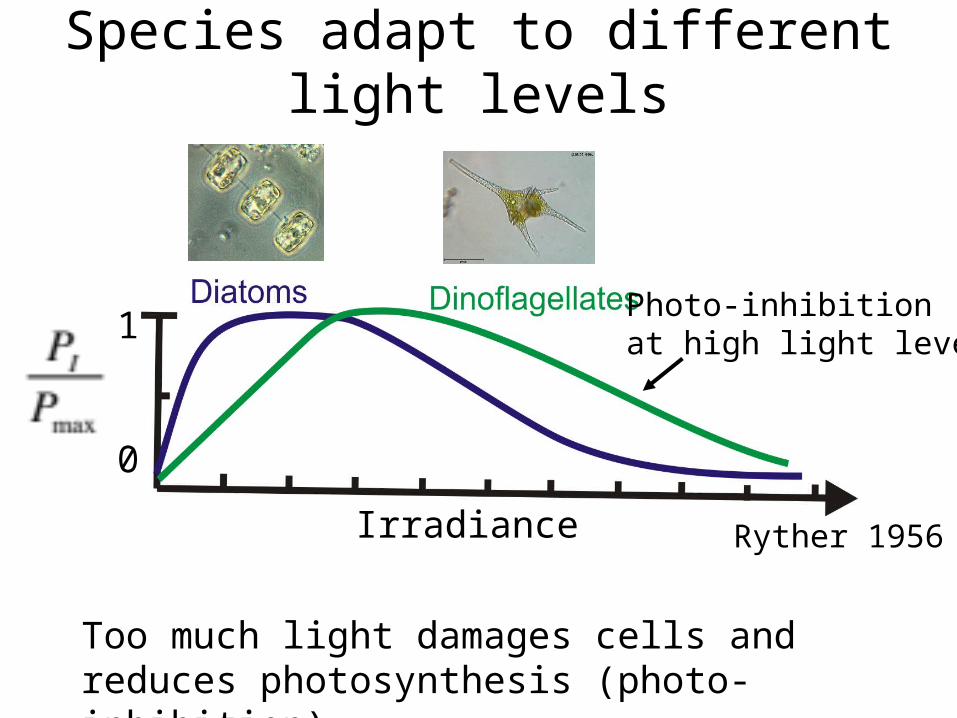
Species adapt to different light levels
Irradiance
1
0
Ryther 1956
Photo-inhibition at high light levels
Too much light damages cells and reduces photosynthesis (photo-inhibition)
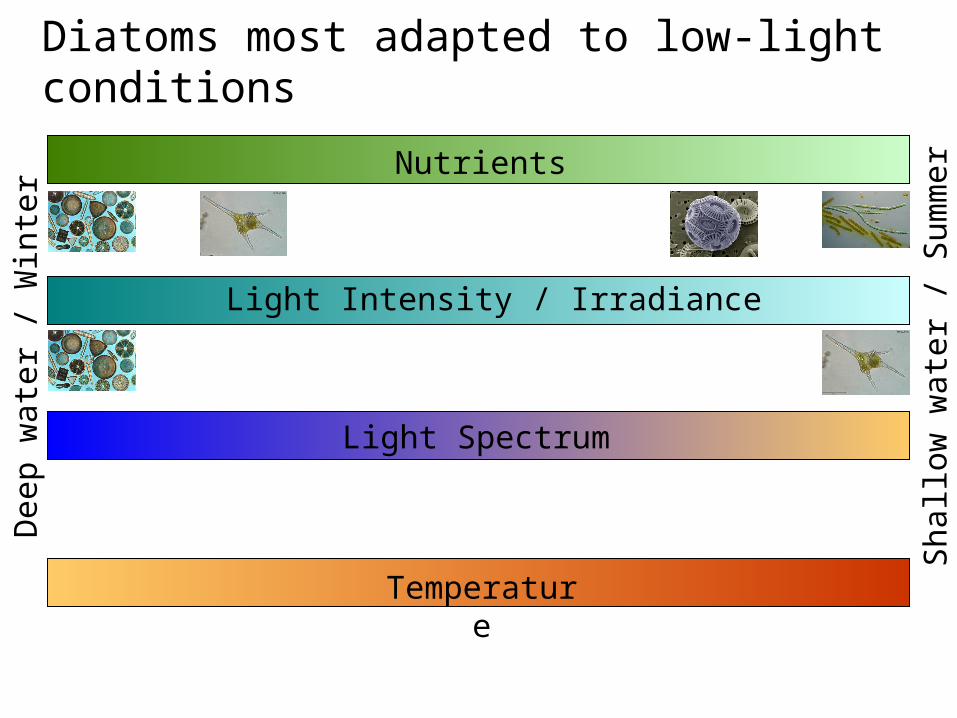
Diatoms most adapted to low-light conditions
High LowNutrients
Low High Light Intensity / Irradiance
Narrow BroadLight Spectrum
Low HighTemperature
Dee
p w
ater
/ W
inte
r
Sha
llow
wat
er /
Sum
mer

Attenuation varies with wavelength.
More wavelengths are available near the surface.
Plankton use colored pigments to harvest light at different wavelengths.
violet red

Different color pigments absorb different wavelengths of light
Pigments (colored molecules)
Phytoplankton with different pigments
Chlorophyll*

Phytoplankton with multiple pigments capture more wavelengths
• All phytoplankton have chlorophyll• Coccolithophores and diatoms have carotenoids• Cyanobacteria have phycoerythrin, phycocyanin

Coccolithophores and Cyanobacteria most adapted to broad spectrum of light found in shallower mixed layer
High LowNutrients
Low High Light Intensity / Irradiance
Narrow BroadLight Spectrum
Low HighTemperature
Dee
p w
ater
/ W
inte
r
Sha
llow
wat
er /
Sum
mer
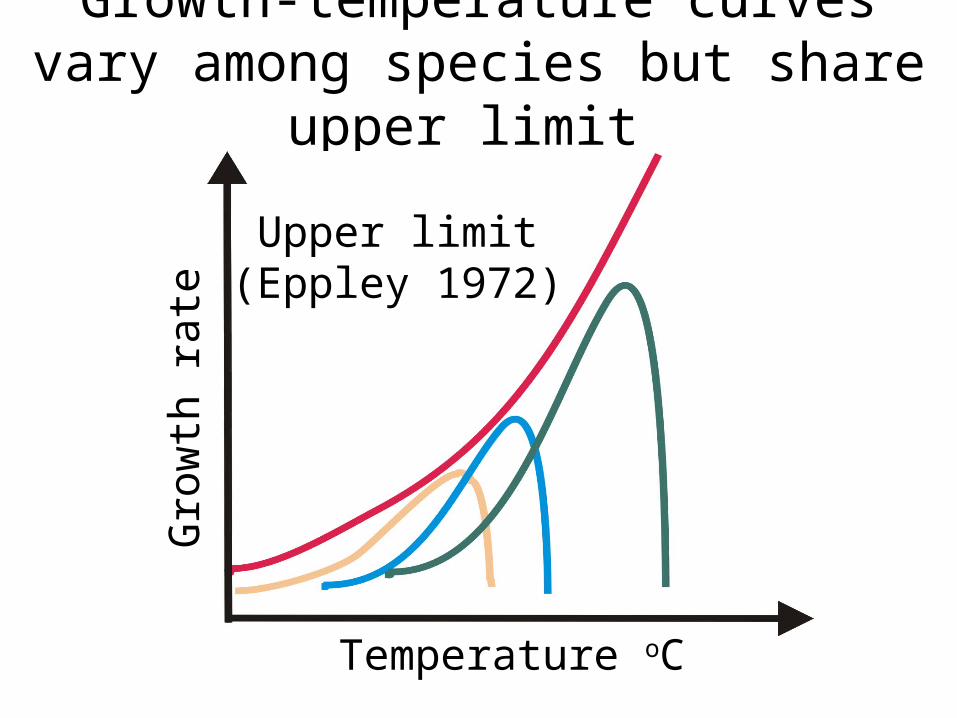
Growth-temperature curves vary among species but share upper limit
Temperature oC
Gro
wth
rat
eUpper limit
(Eppley 1972)

Diatoms grow fastest at low temperatures
Temperature oC
Div
isio
ns p
er d
ayDiatoms Flagellates

Diatoms most adapted to colder temperatures
High LowNutrients
Low High Light Intensity / Irradiance
Narrow BroadLight Spectrum
Low HighTemperature
Dee
p w
ater
/ W
inte
r
Sha
llow
wat
er /
Sum
mer

Keep in mind the physics & chemistry of the mixed layer
Nutrients
Light & HeatWind

Primary production varies with depth
Respiration
Dep
th
Photosynthesis
Dep
th
+biomass
-biomass
(Requires light)
(Independent of light)

Compensation Depth
Dep
th
P>R Biomass increases
P = R Compensation depth
P<R Biomass decreases
R P

Critical Depth
0
GPP=ΣRNet Primary Production (NPP) = 0Critical depth
Dep
th
R P
Gross Primary Production(GPP)
Sum of Respiration(ΣR)

Dep
th
R P
Bottom of mixed layer
Critical depth
If critical depth > mixed layer depth, GPP>ΣR, NPP >0
Gross Primary Production(GPP)
Sum of Respiration(ΣR)

Dep
th
R P
Critical depth
Bottom of mixed layer
If critical depth < mixed layer depth, GPP<ΣR, NPP<0
Gross Primary Production(GPP)
Sum of Respiration(ΣR)

Dep
th
Respiration Photosynthesis
Critical depth concept is critical!
• Understand why R is a straight line
• Understand why P is an exponential curve
• Know the difference between:
critical depth
and
compensation depth