Embed Size (px)
Citation preview

LABORATORY OF APPLIED THERMODYNAMICS
ARISTOTLE UNIVERSITY THESSALONIKI
SCHOOL OF ENGINEERING
DEPT. OF MECHANICAL ENGINEERING
1
Zissis Samaras Professor
WLTP: How will the new Regulation
affect CO2 emissions from modern passenger cars?
Lisbon, 7 June 2016
Outline
Introduction – The NEDC-WLTP Correlation Exercise
Measurement findings and ΔCO2 analysis
Evaluation of current CO2 reduction technologies
CO2MPAS validation campaign
A look to Japan
Concluding remarks
2
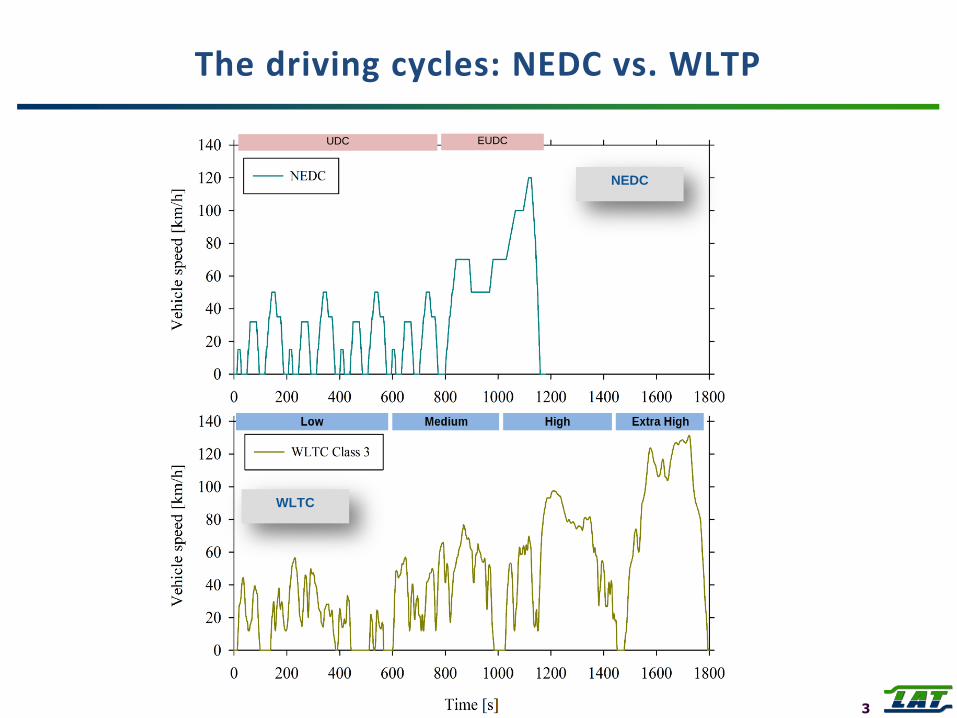
The driving cycles: NEDC vs. WLTP
3
UDC EUDC
NEDC
WLTC
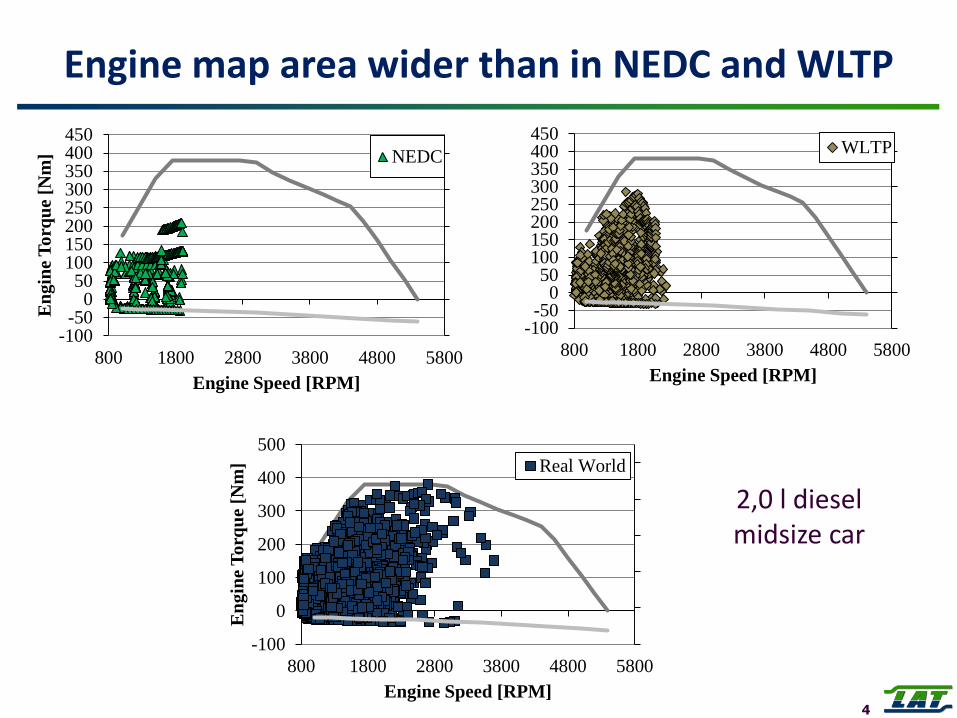
Engine map area wider than in NEDC and WLTP
-100-50
050
100150200250300350400450
800 1800 2800 3800 4800 5800
En
gin
e T
orq
ue
[Nm
]
Engine Speed [RPM]
NEDC
-100-50
050
100150200250300350400450
800 1800 2800 3800 4800 5800
Engine Speed [RPM]
WLTP
-100
0
100
200
300
400
500
800 1800 2800 3800 4800 5800
En
gin
e T
orq
ue
[Nm
]
Engine Speed [RPM]
Real World
2,0 l diesel midsize car
4
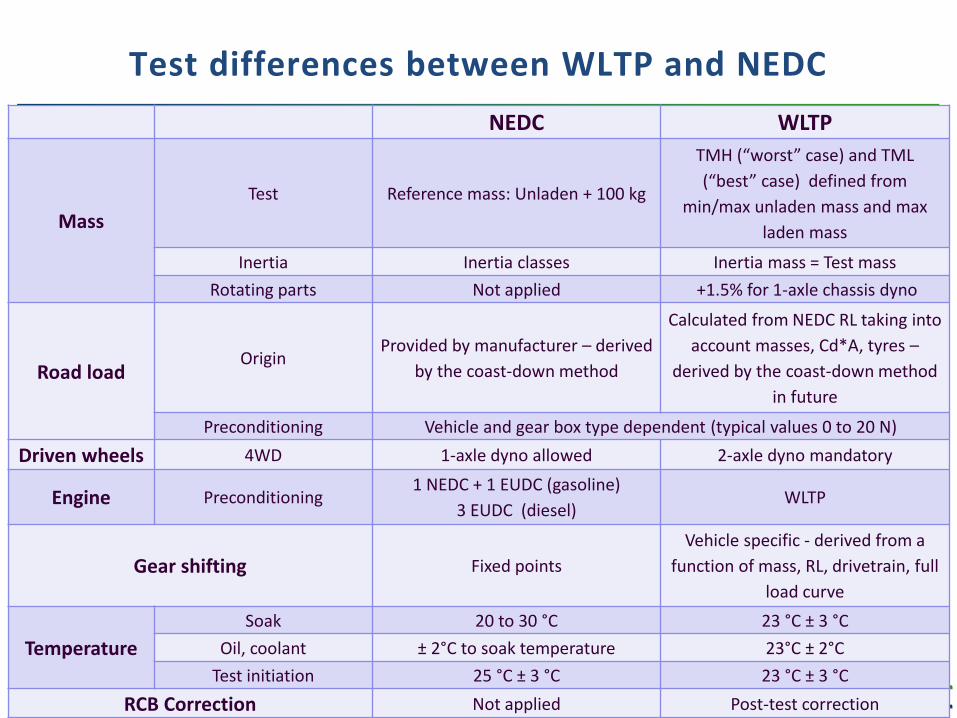
Test differences between WLTP and NEDC
5
NEDC WLTP
Mass
Test Reference mass: Unladen + 100 kg
TMH (“worst” case) and TML
(“best” case) defined from
min/max unladen mass and max
laden mass
Inertia Inertia classes Inertia mass = Test mass
Rotating parts Not applied +1.5% for 1-axle chassis dyno
Road load Origin
Provided by manufacturer – derived
by the coast-down method
Calculated from NEDC RL taking into
account masses, Cd*A, tyres –
derived by the coast-down method
in future
Preconditioning Vehicle and gear box type dependent (typical values 0 to 20 N)
Driven wheels 4WD 1-axle dyno allowed 2-axle dyno mandatory
Engine Preconditioning 1 NEDC + 1 EUDC (gasoline)
3 EUDC (diesel) WLTP
Gear shifting Fixed points
Vehicle specific - derived from a
function of mass, RL, drivetrain, full
load curve
Temperature
Soak 20 to 30 °C 23 °C ± 3 °C
Oil, coolant ± 2°C to soak temperature 23°C ± 2°C
Test initiation 25 °C ± 3 °C 23 °C ± 3 °C
RCB Correction Not applied Post-test correction
WLTP-NEDC Correlation Methodology
6
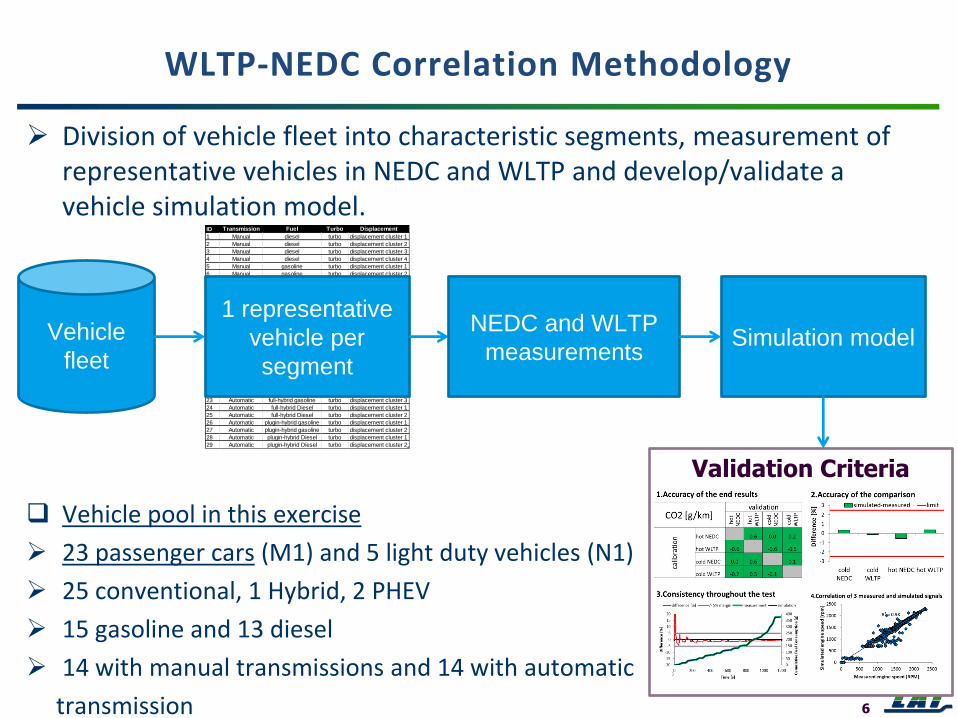
Division of vehicle fleet into characteristic segments, measurement of representative vehicles in NEDC and WLTP and develop/validate a vehicle simulation model.
Vehicle pool in this exercise
23 passenger cars (M1) and 5 light duty vehicles (N1)
25 conventional, 1 Hybrid, 2 PHEV
15 gasoline and 13 diesel
14 with manual transmissions and 14 with automatic
transmission
Vehicle
fleet
ID Transmission Fuel Turbo Displacement
1 Manual diesel turbo displacement cluster 1
2 Manual diesel turbo displacement cluster 2
3 Manual diesel turbo displacement cluster 3
4 Manual diesel turbo displacement cluster 4
5 Manual gasoline turbo displacement cluster 1
6 Manual gasoline turbo displacement cluster 2
7 Manual gasoline turbo displacement cluster 3
8 Manual gasoline turbo displacement cluster 4
9 Manual gasoline non-turbo displacement cluster 1
10 Manual gasoline non-turbo displacement cluster 2
11 Automatic diesel turbo displacement cluster 1
12 Automatic diesel turbo displacement cluster 2
13 Automatic diesel turbo displacement cluster 3
14 Automatic diesel turbo displacement cluster 4
15 Automatic gasoline turbo displacement cluster 1
16 Automatic gasoline turbo displacement cluster 2
17 Automatic gasoline turbo displacement cluster 3
18 Automatic gasoline turbo displacement cluster 4
19 Automatic gasoline non-turbo displacement cluster 1
20 Automatic gasoline non-turbo displacement cluster 2
21 Automatic full-hybrid gasoline turbo displacement cluster 1
22 Automatic full-hybrid gasoline turbo displacement cluster 2
23 Automatic full-hybrid gasoline turbo displacement cluster 3
24 Automatic full-hybrid Diesel turbo displacement cluster 1
25 Automatic full-hybrid Diesel turbo displacement cluster 2
26 Automatic plugin-hybrid gasoline turbo displacement cluster 1
27 Automatic plugin-hybrid gasoline turbo displacement cluster 2
28 Automatic plugin-hybrid Diesel turbo displacement cluster 1
29 Automatic plugin-hybrid Diesel turbo displacement cluster 2
1 representative
vehicle per
segment
NEDC and WLTP
measurements Simulation model
Validation Criteria
Outline
Introduction – The NEDC-WLTP Correlation Exercise
Measurement findings and ΔCO2 analysis
Evaluation of current CO2 reduction technologies
CO2MPAS validation campaign
A look to Japan
Concluding remarks
7
Results: WLTP vs NEDC
8
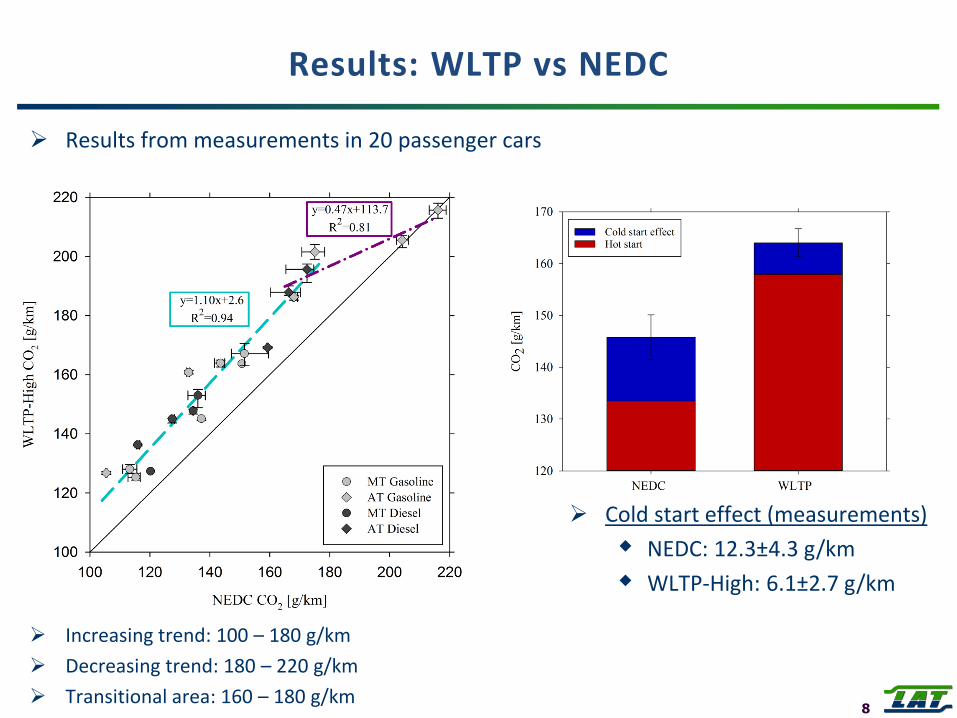
Cold start effect (measurements)
NEDC: 12.3±4.3 g/km
WLTP-High: 6.1±2.7 g/km
Increasing trend: 100 – 180 g/km
Decreasing trend: 180 – 220 g/km
Transitional area: 160 – 180 g/km
Results from measurements in 20 passenger cars
Results: Coast-down-time – Chassis preconditioning
9
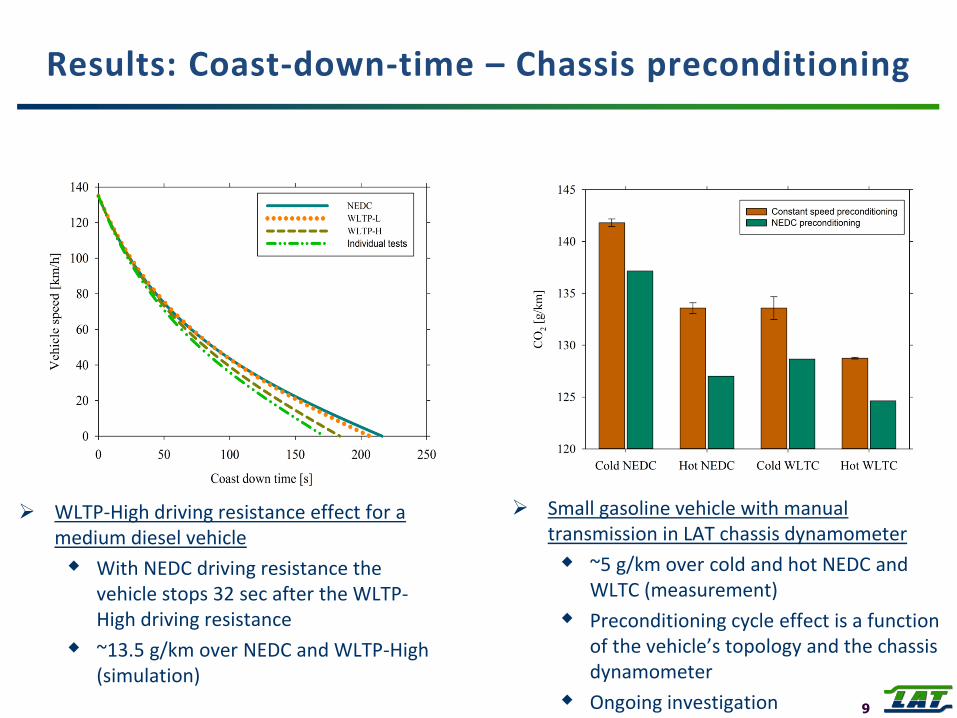
WLTP-High driving resistance effect for a medium diesel vehicle
With NEDC driving resistance the vehicle stops 32 sec after the WLTP-High driving resistance
~13.5 g/km over NEDC and WLTP-High (simulation)
Small gasoline vehicle with manual transmission in LAT chassis dynamometer
~5 g/km over cold and hot NEDC and WLTC (measurement)
Preconditioning cycle effect is a function of the vehicle’s topology and the chassis dynamometer
Ongoing investigation
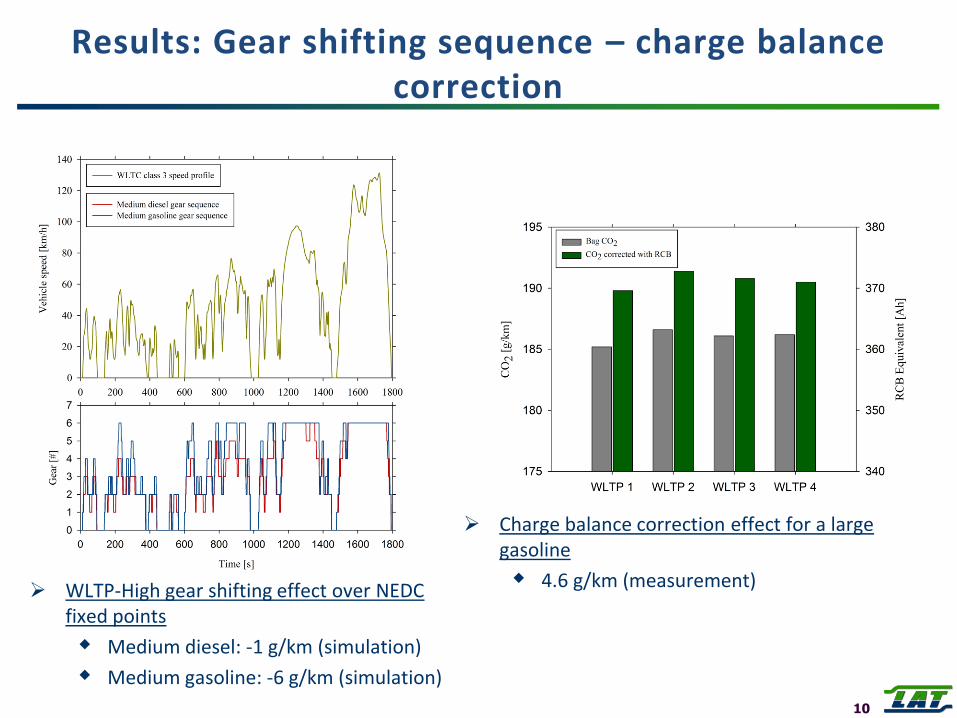
Results: Gear shifting sequence – charge balance correction
10
WLTP-High gear shifting effect over NEDC fixed points
Medium diesel: -1 g/km (simulation)
Medium gasoline: -6 g/km (simulation)
Charge balance correction effect for a large gasoline
4.6 g/km (measurement)
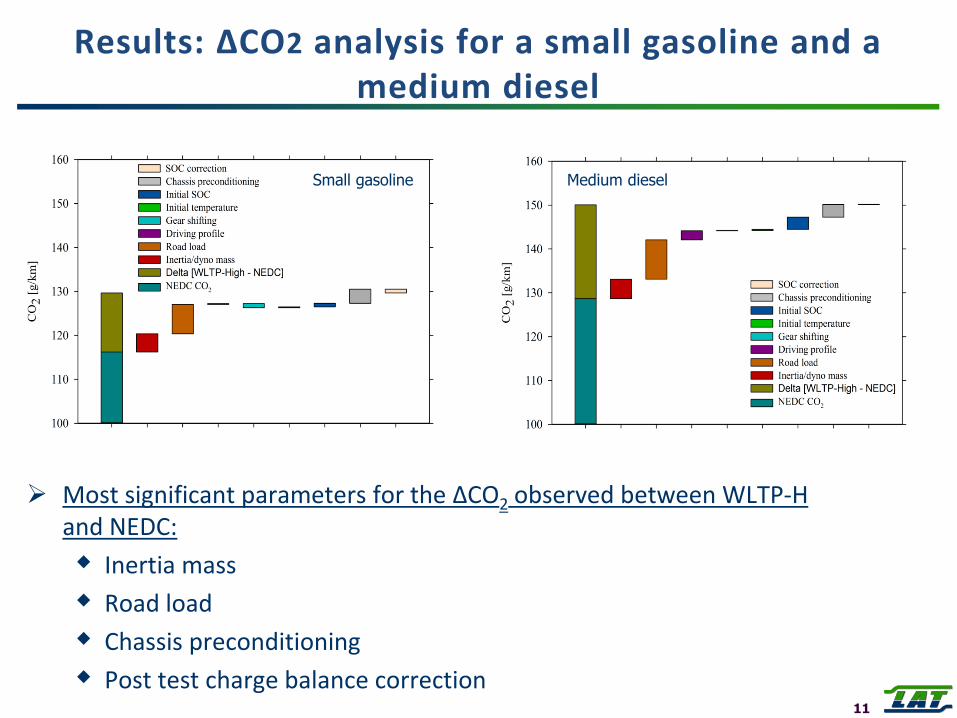
Results: ΔCO2 analysis for a small gasoline and a medium diesel
11
Small gasoline Medium diesel
Most significant parameters for the ΔCO2 observed between WLTP-H and NEDC:
Inertia mass
Road load
Chassis preconditioning
Post test charge balance correction
Outline
Introduction – The NEDC-WLTP Correlation Exercise
Measurement findings and ΔCO2 analysis
Evaluation of current CO2 reduction technologies
CO2MPAS validation campaign
A look to Japan
Concluding remarks
12
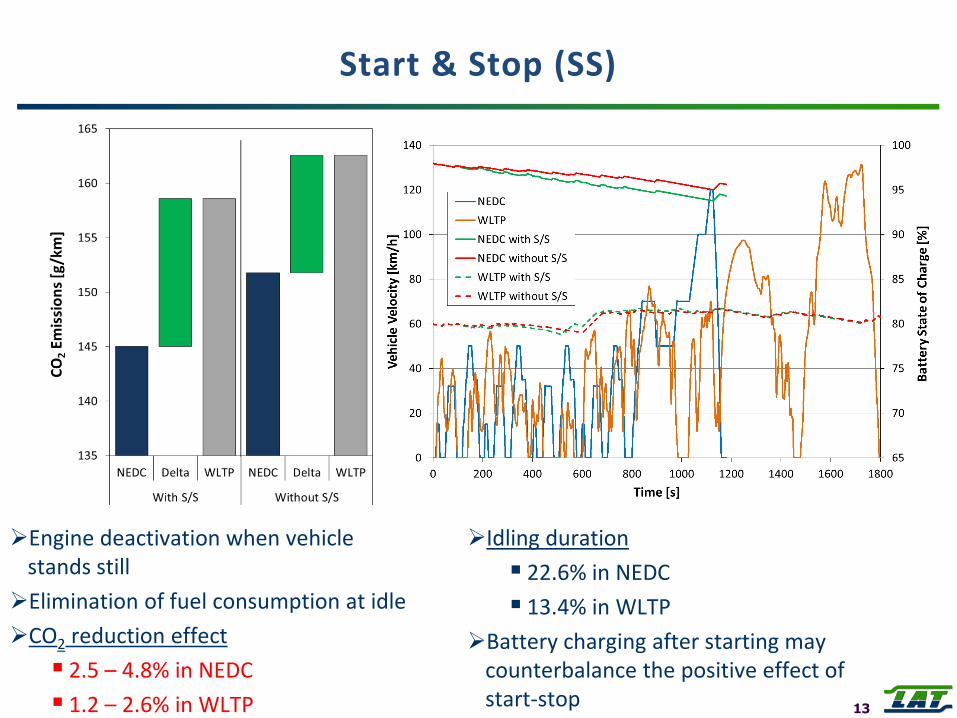
Start & Stop (SS)
13
Engine deactivation when vehicle stands still
Elimination of fuel consumption at idle
CO2 reduction effect
2.5 – 4.8% in NEDC
1.2 – 2.6% in WLTP
Idling duration
22.6% in NEDC
13.4% in WLTP
Battery charging after starting may counterbalance the positive effect of start-stop
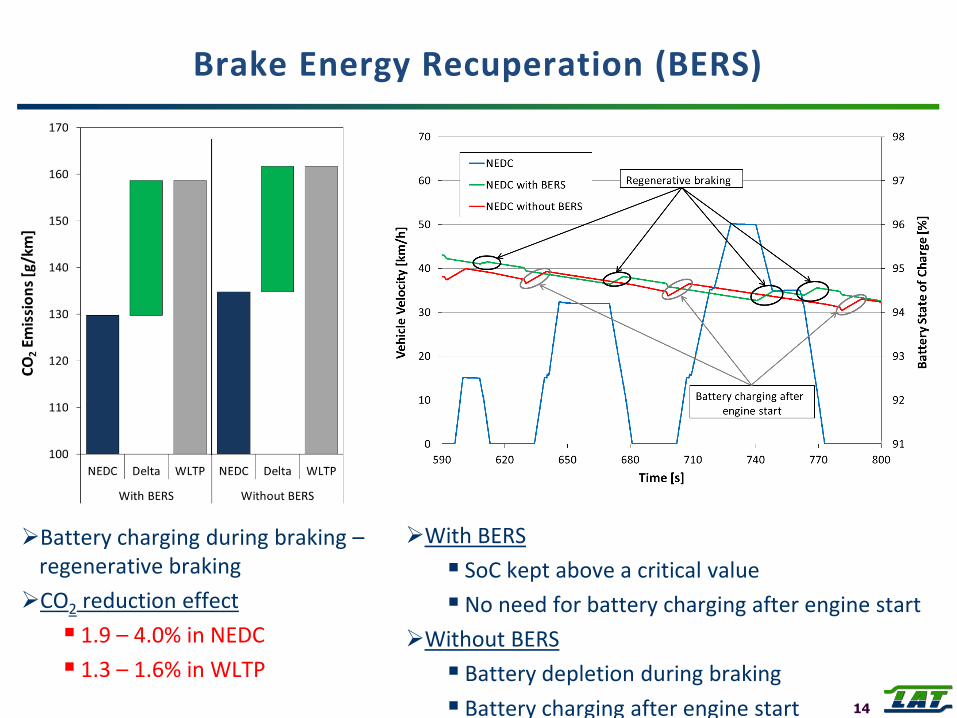
Brake Energy Recuperation (BERS)
14
Battery charging during braking – regenerative braking
CO2 reduction effect
1.9 – 4.0% in NEDC
1.3 – 1.6% in WLTP
With BERS
SoC kept above a critical value
No need for battery charging after engine start
Without BERS
Battery depletion during braking
Battery charging after engine start
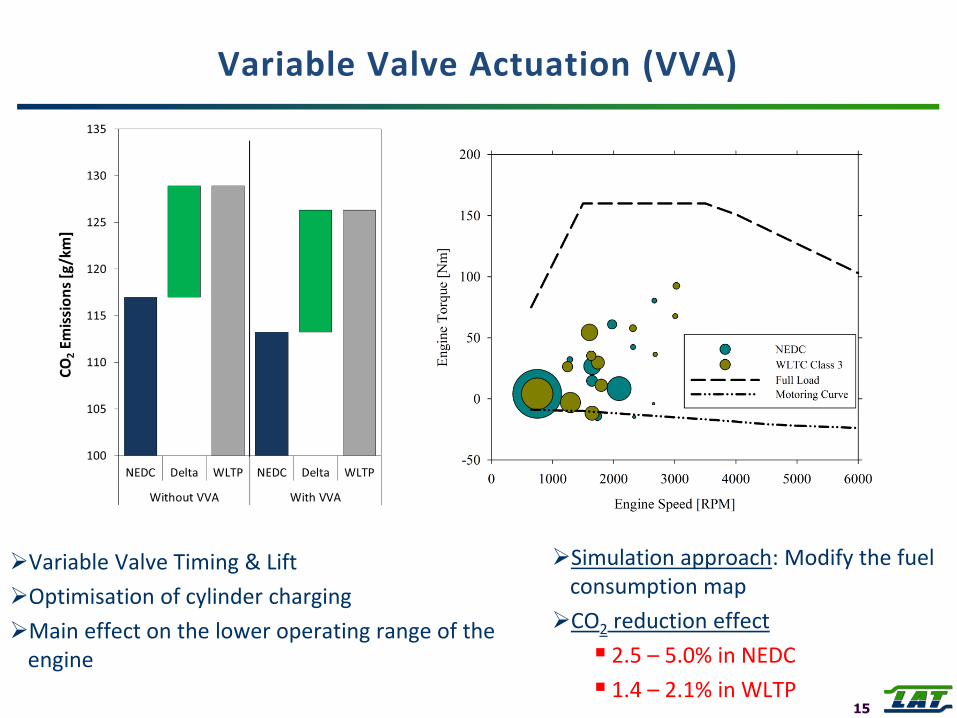
Variable Valve Actuation (VVA)
15
Variable Valve Timing & Lift
Optimisation of cylinder charging
Main effect on the lower operating range of the engine
Simulation approach: Modify the fuel consumption map
CO2 reduction effect
2.5 – 5.0% in NEDC
1.4 – 2.1% in WLTP
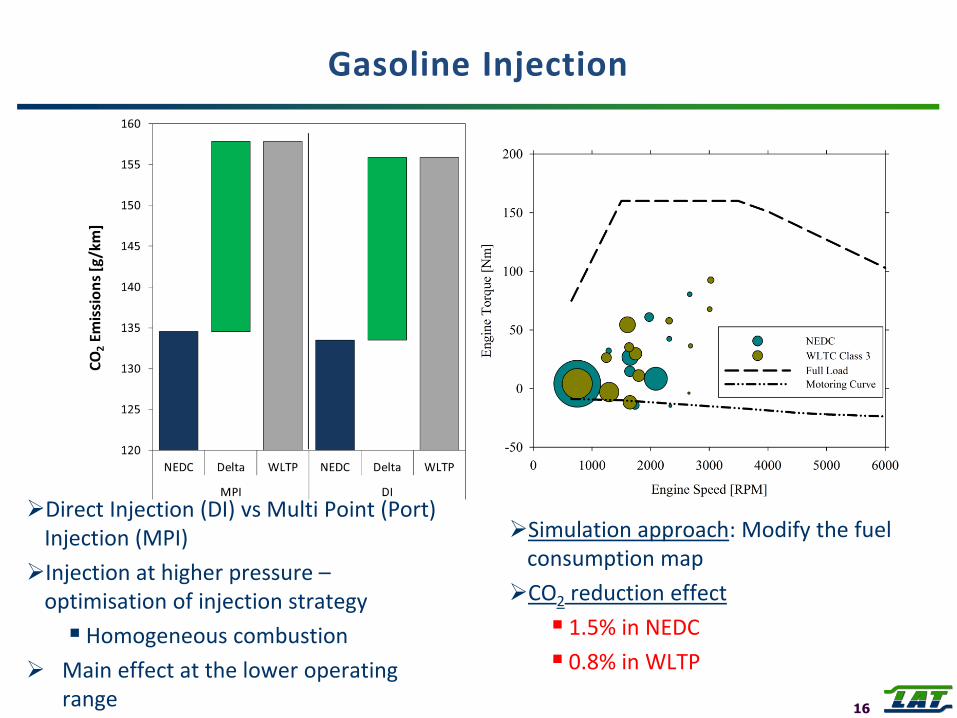
Gasoline Injection
16
Direct Injection (DI) vs Multi Point (Port) Injection (MPI)
Injection at higher pressure – optimisation of injection strategy
Homogeneous combustion
Main effect at the lower operating range
Simulation approach: Modify the fuel consumption map
CO2 reduction effect
1.5% in NEDC
0.8% in WLTP
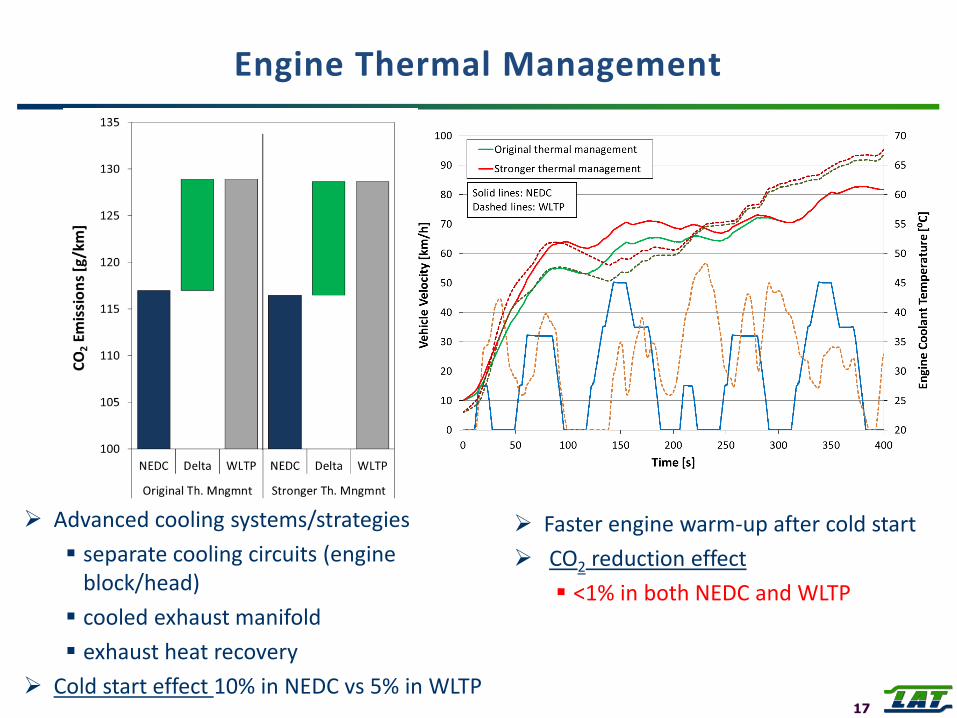
Engine Thermal Management
17
Advanced cooling systems/strategies
separate cooling circuits (engine block/head)
cooled exhaust manifold
exhaust heat recovery
Cold start effect 10% in NEDC vs 5% in WLTP
Faster engine warm-up after cold start
CO2 reduction effect
<1% in both NEDC and WLTP
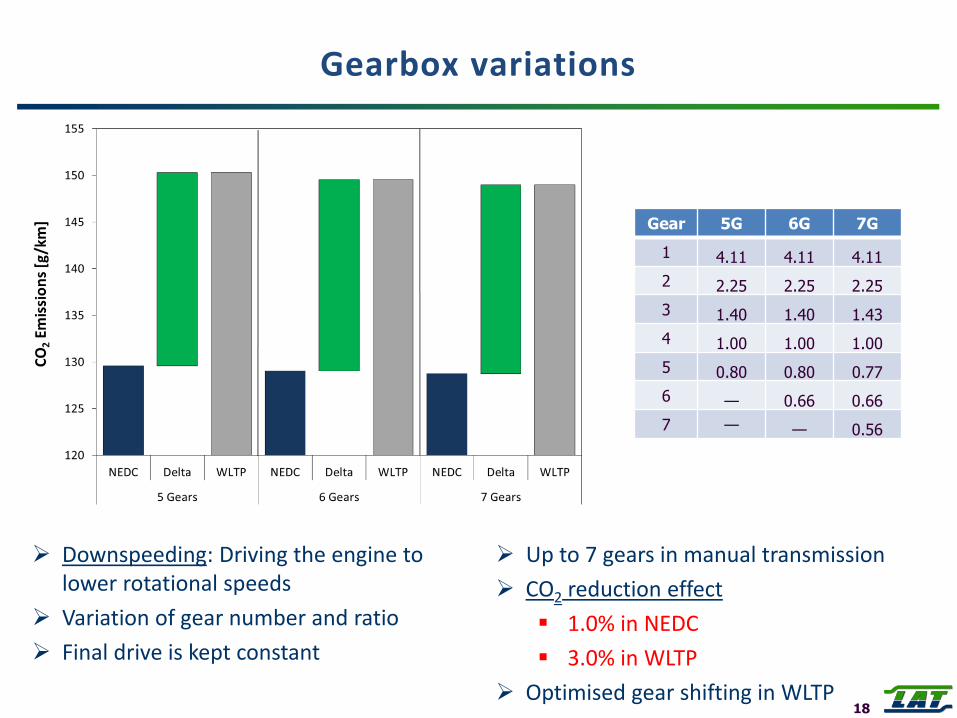
Gearbox variations
18
Gear 5G 6G 7G
1 4.11 4.11 4.11
2 2.25 2.25 2.25
3 1.40 1.40 1.43
4 1.00 1.00 1.00
5 0.80 0.80 0.77
6 — 0.66 0.66
7 — — 0.56
Downspeeding: Driving the engine to lower rotational speeds
Variation of gear number and ratio
Final drive is kept constant
Up to 7 gears in manual transmission
CO2 reduction effect
1.0% in NEDC
3.0% in WLTP
Optimised gear shifting in WLTP
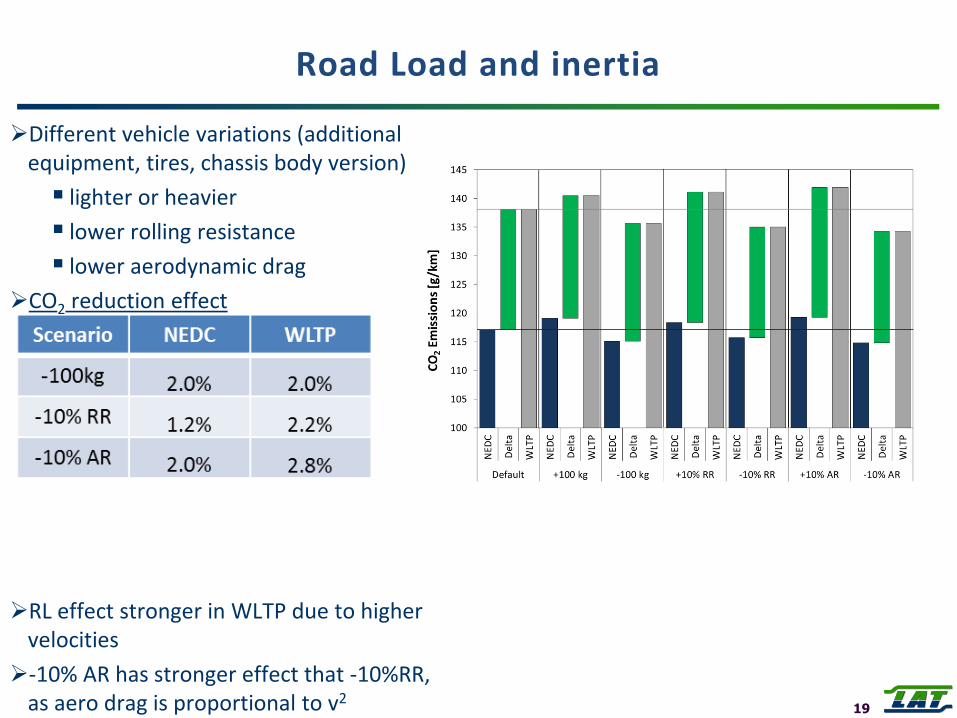
Road Load and inertia
Different vehicle variations (additional equipment, tires, chassis body version)
lighter or heavier
lower rolling resistance
lower aerodynamic drag
CO2 reduction effect
RL effect stronger in WLTP due to higher velocities
-10% AR has stronger effect that -10%RR, as aero drag is proportional to v2
19
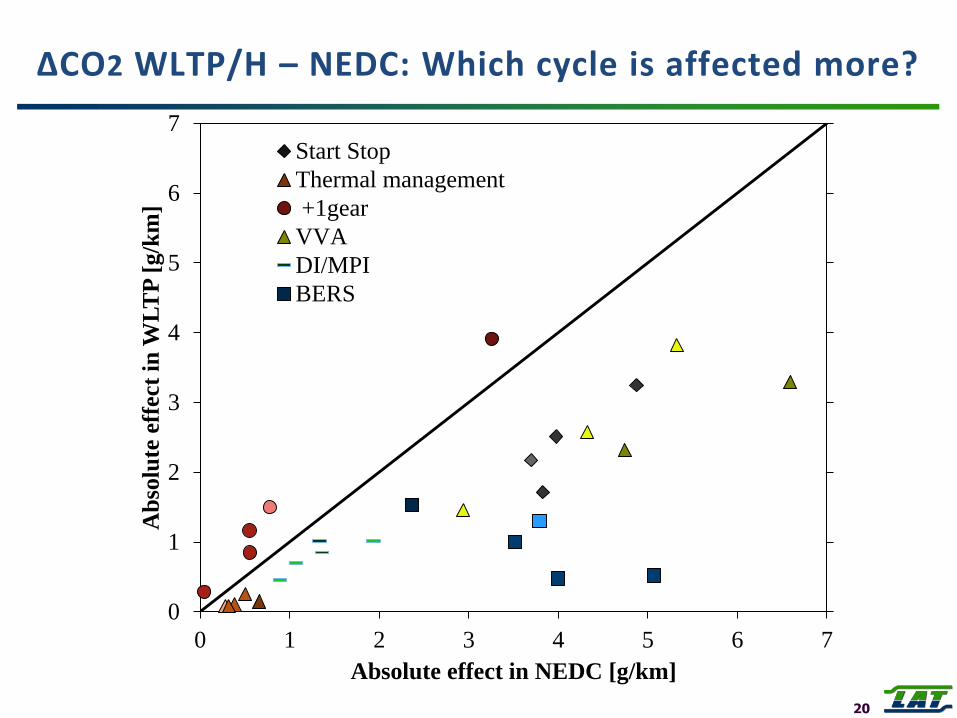
ΔCO2 WLTP/H – NEDC: Which cycle is affected more?
20
0
1
2
3
4
5
6
7
0 1 2 3 4 5 6 7
Ab
solu
te e
ffect
in
WL
TP
[g/k
m]
Absolute effect in NEDC [g/km]
Start Stop
Thermal management
+1gear
VVA
DI/MPI
BERS
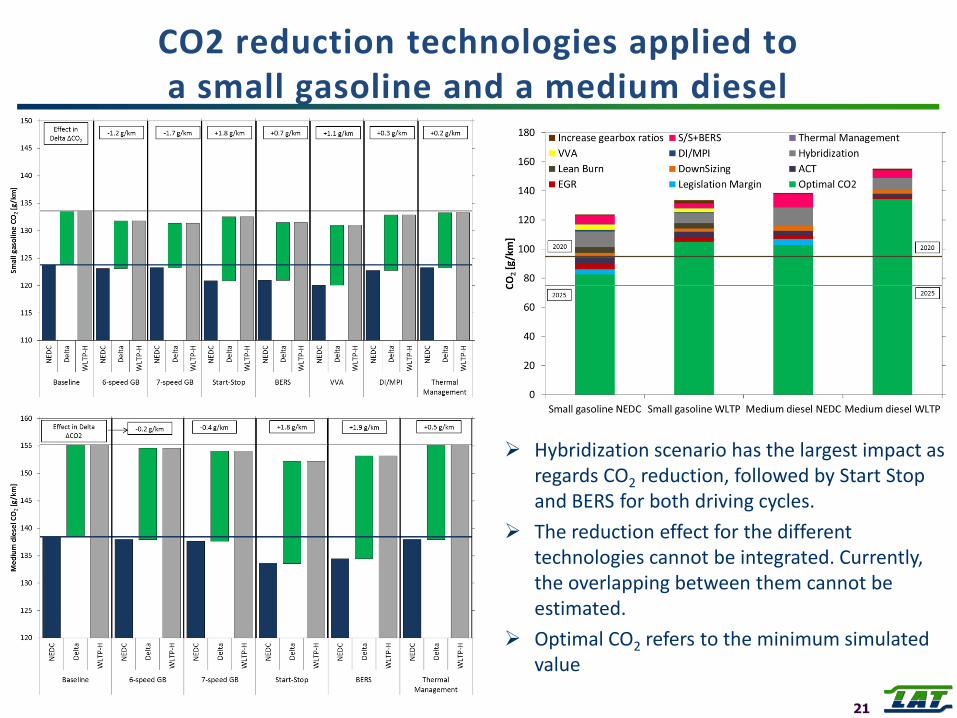
CO2 reduction technologies applied to a small gasoline and a medium diesel
21
Hybridization scenario has the largest impact as regards CO2 reduction, followed by Start Stop and BERS for both driving cycles.
The reduction effect for the different technologies cannot be integrated. Currently, the overlapping between them cannot be estimated.
Optimal CO2 refers to the minimum simulated value
Outline
Introduction – The NEDC-WLTP Correlation Exercise
Measurement findings and ΔCO2 analysis
Evaluation of current CO2 reduction technologies
CO2MPAS validation campaign
A look to Japan
Concluding remarks
22
23
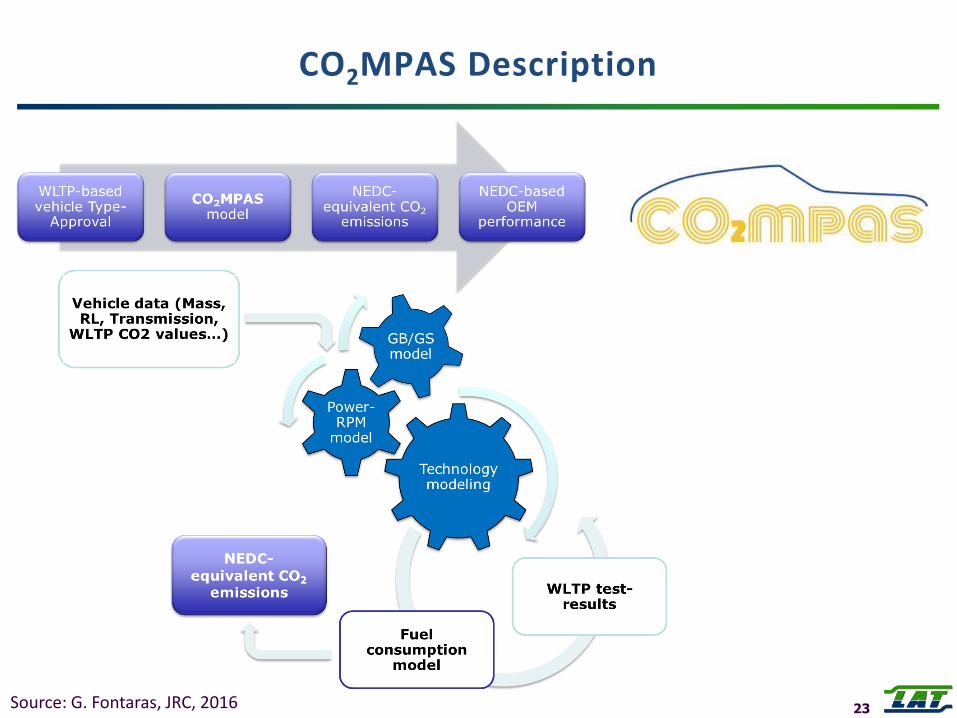
CO2MPAS Description
Source: G. Fontaras, JRC, 2016
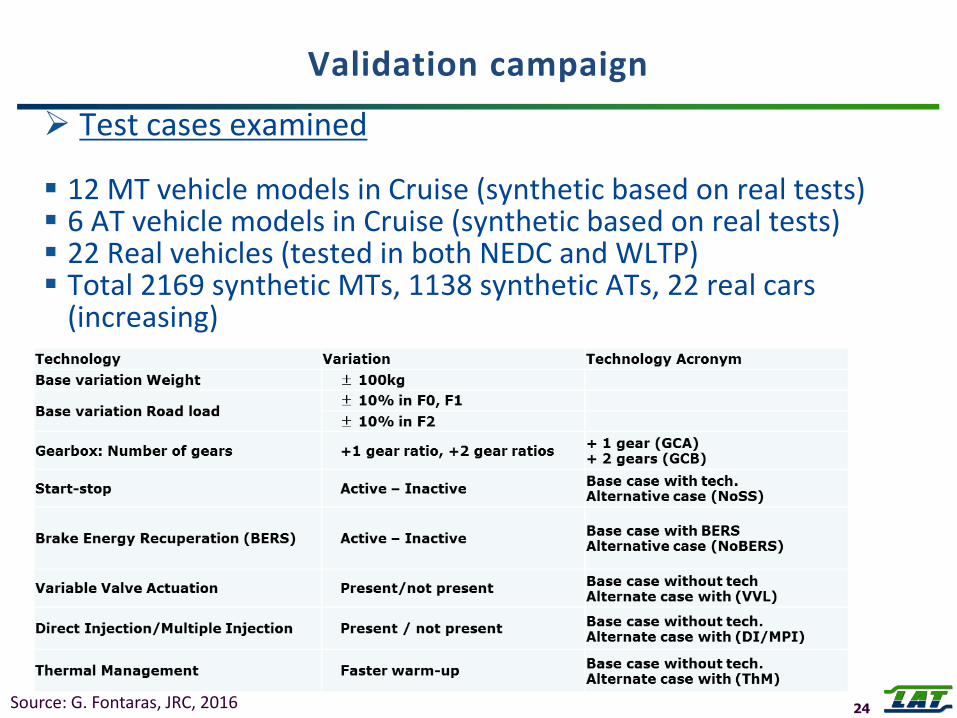
Validation campaign
24
Test cases examined
12 MT vehicle models in Cruise (synthetic based on real tests) 6 AT vehicle models in Cruise (synthetic based on real tests) 22 Real vehicles (tested in both NEDC and WLTP) Total 2169 synthetic MTs, 1138 synthetic ATs, 22 real cars
(increasing)
Source: G. Fontaras, JRC, 2016
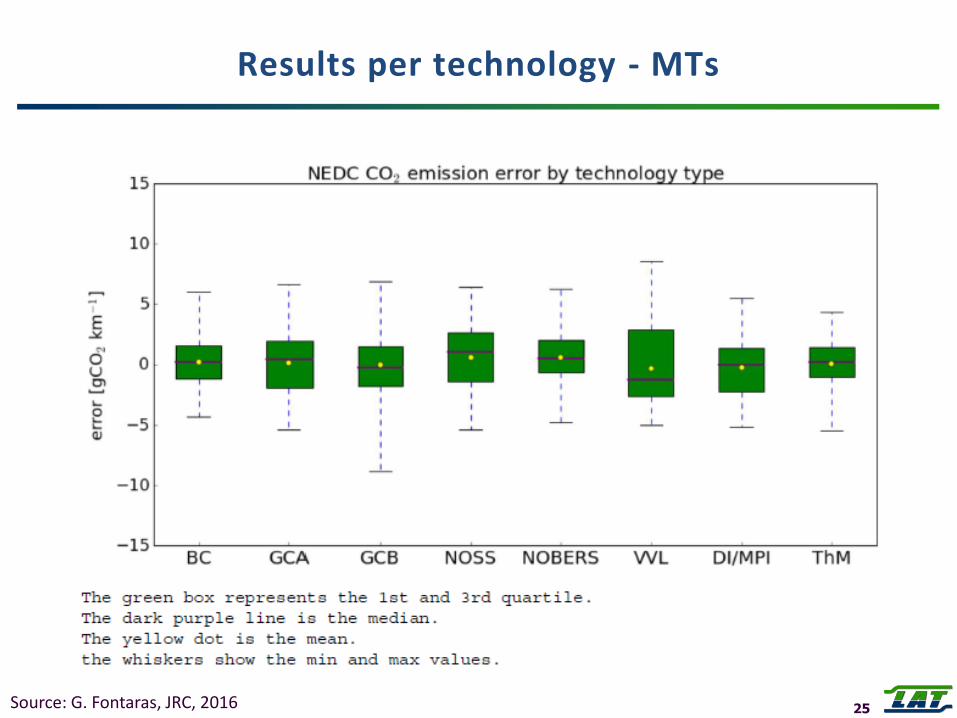
Results per technology - MTs
25 Source: G. Fontaras, JRC, 2016
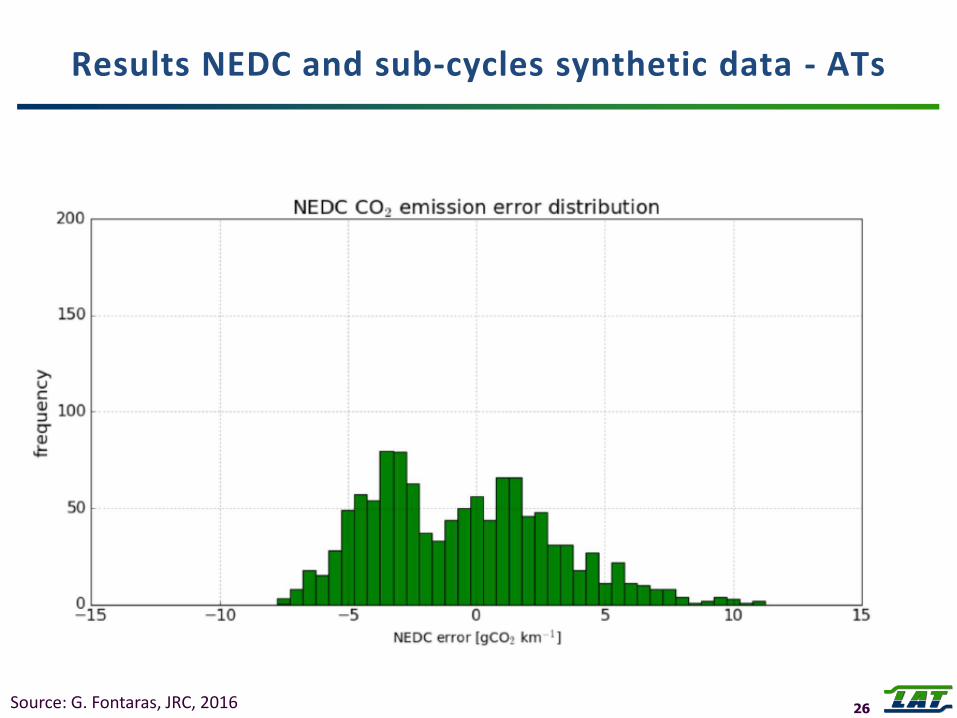
Results NEDC and sub-cycles synthetic data - ATs
26 Source: G. Fontaras, JRC, 2016
Outline
Introduction – The NEDC-WLTP Correlation Exercise
Measurement findings and ΔCO2 analysis
Evaluation of current CO2 reduction technologies
CO2MPAS validation campaign
A look to Japan
Concluding remarks
27
0
20
40
60
80
100
0 200 400 600 800 1000 1200
time s
speed
km/h
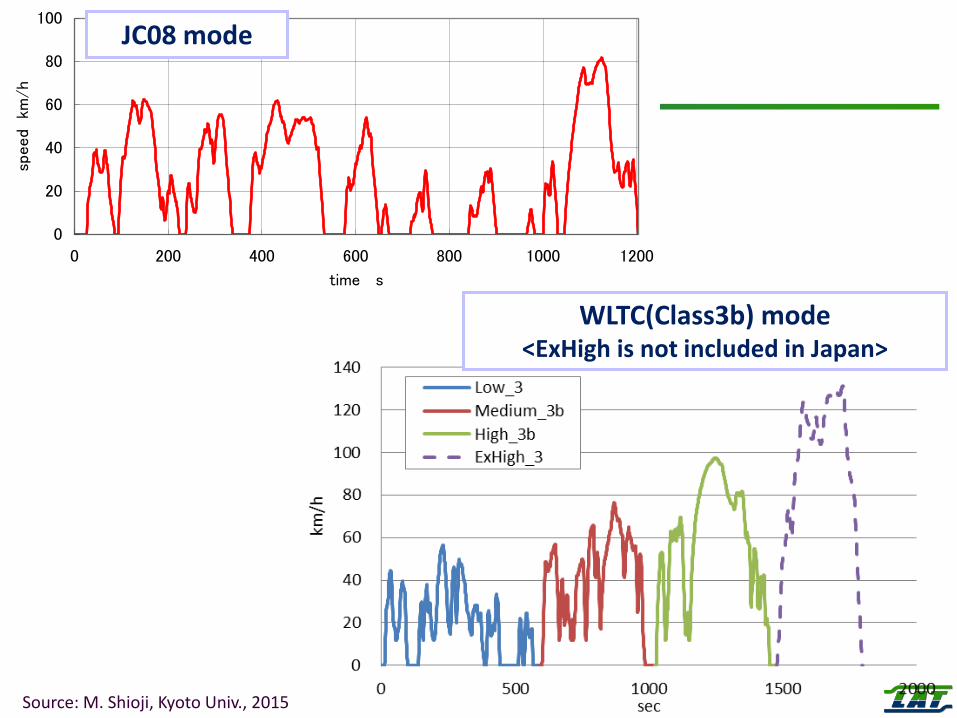
JC08 mode
WLTC(Class3b) mode <ExHigh is not included in Japan>
Source: M. Shioji, Kyoto Univ., 2015
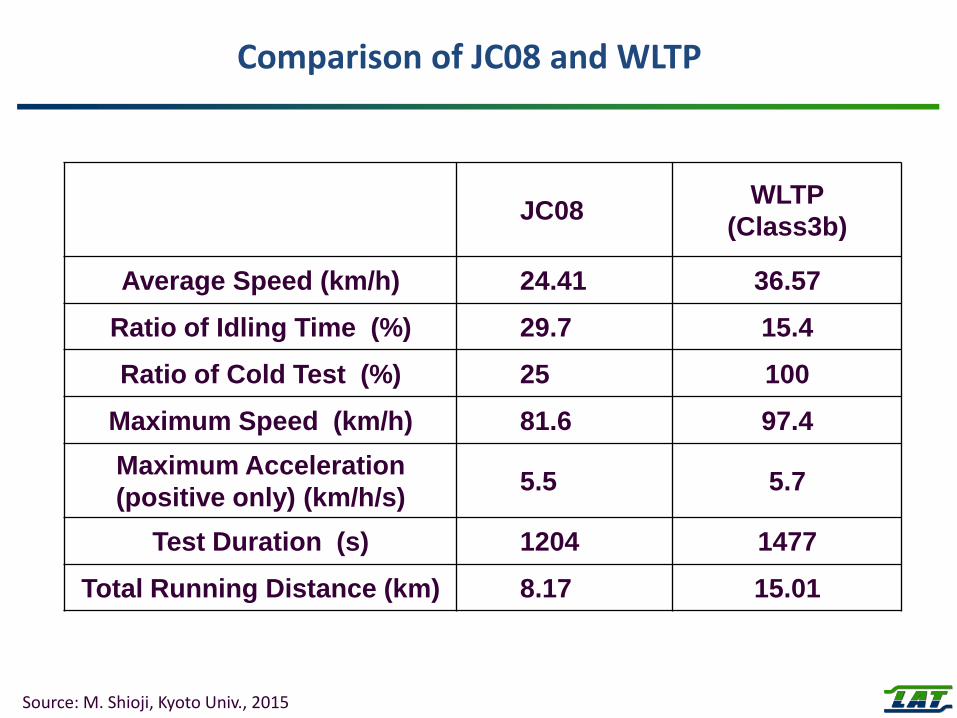
JC08 WLTP
(Class3b)
Average Speed (km/h) 24.41 36.57
Ratio of Idling Time (%) 29.7 15.4
Ratio of Cold Test (%) 25 100
Maximum Speed (km/h) 81.6 97.4
Maximum Acceleration
(positive only) (km/h/s) 5.5 5.7
Test Duration (s) 1204 1477
Total Running Distance (km) 8.17 15.01
Comparison of JC08 and WLTP
Source: M. Shioji, Kyoto Univ., 2015
0.0
5.0
10.0
15.0
20.0
25.0
30.0
35.0
40.0
0.0 5.0 10.0 15.0 20.0 25.0 30.0 35.0 40.0 Mileage (JC08) km/L
Mile
ag
e (W
LT
P)
km
/L
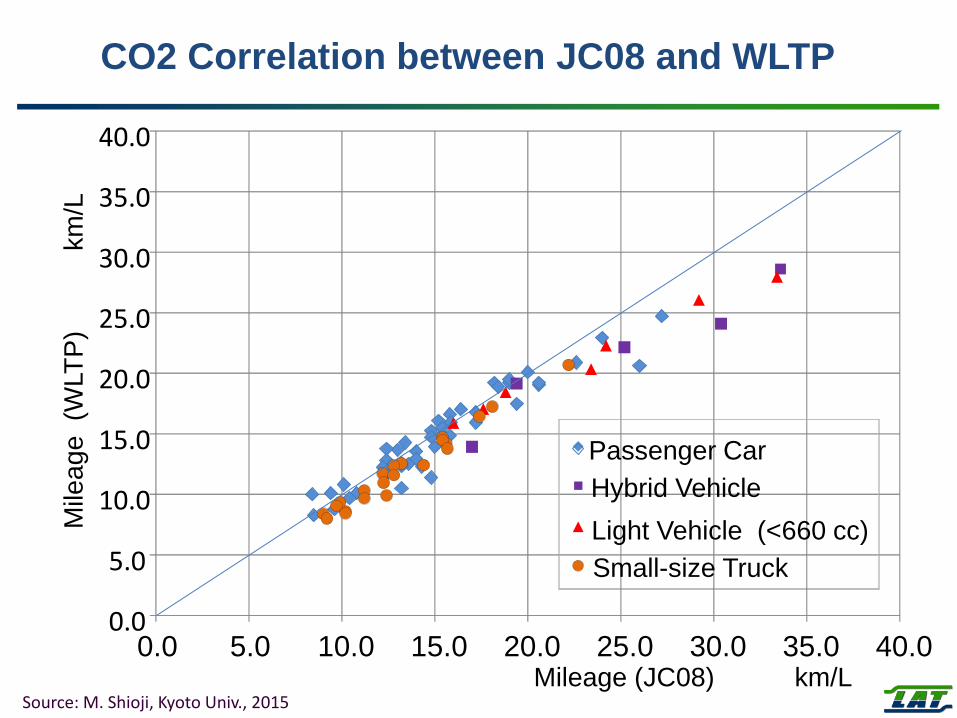
Passenger Car
Hybrid Vehicle
Light Vehicle (<660 cc)
Small-size Truck
CO2 Correlation between JC08 and WLTP
Source: M. Shioji, Kyoto Univ., 2015
Outline
Introduction – The NEDC-WLTP Correlation Exercise
Measurement findings and ΔCO2 analysis
Evaluation of current CO2 reduction technologies
CO2MPAS validation campaign
A look to Japan
Concluding remarks
31
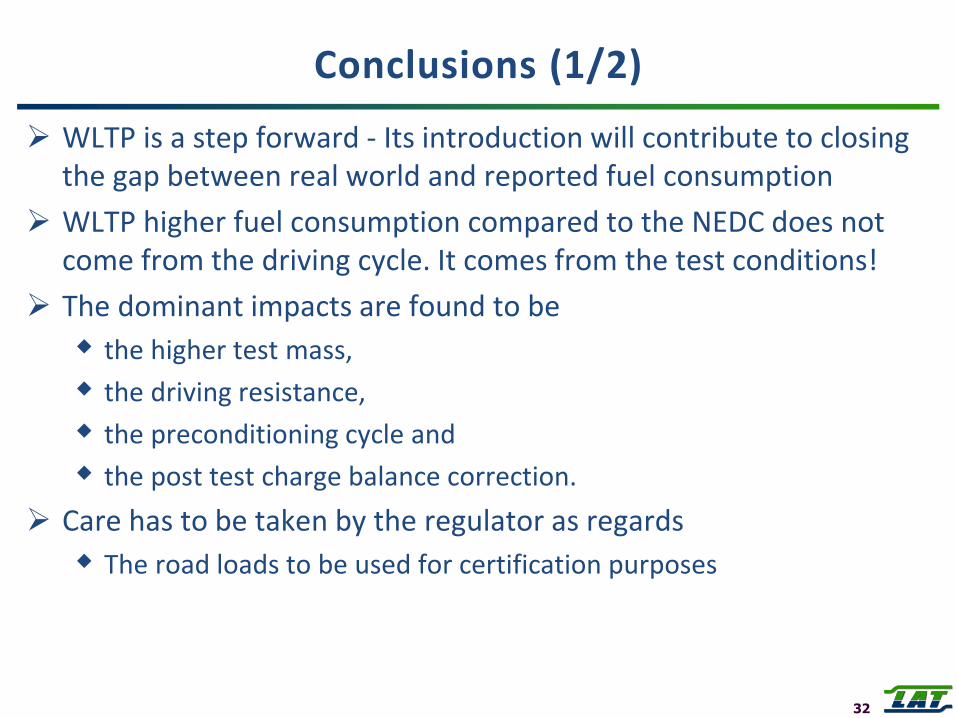
Conclusions (1/2)
WLTP is a step forward - Its introduction will contribute to closing the gap between real world and reported fuel consumption
WLTP higher fuel consumption compared to the NEDC does not come from the driving cycle. It comes from the test conditions!
The dominant impacts are found to be
the higher test mass,
the driving resistance,
the preconditioning cycle and
the post test charge balance correction.
Care has to be taken by the regulator as regards
The road loads to be used for certification purposes
32
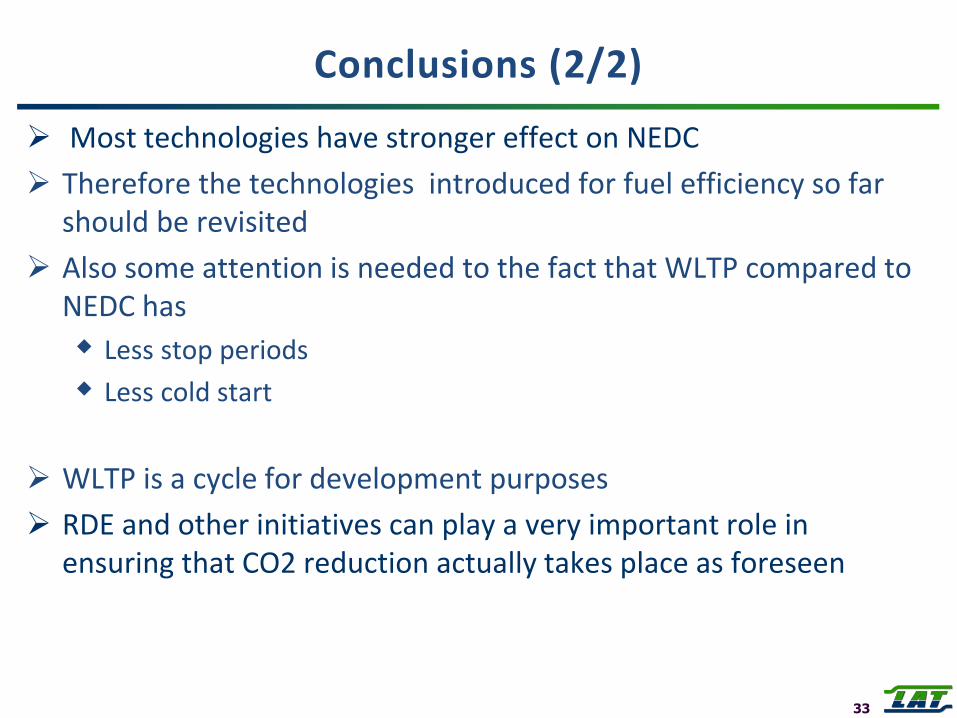
Conclusions (2/2)
Most technologies have stronger effect on NEDC
Therefore the technologies introduced for fuel efficiency so far should be revisited
Also some attention is needed to the fact that WLTP compared to NEDC has
Less stop periods
Less cold start
WLTP is a cycle for development purposes
RDE and other initiatives can play a very important role in ensuring that CO2 reduction actually takes place as foreseen
33
Thank you for your attention!
34

Back up
35
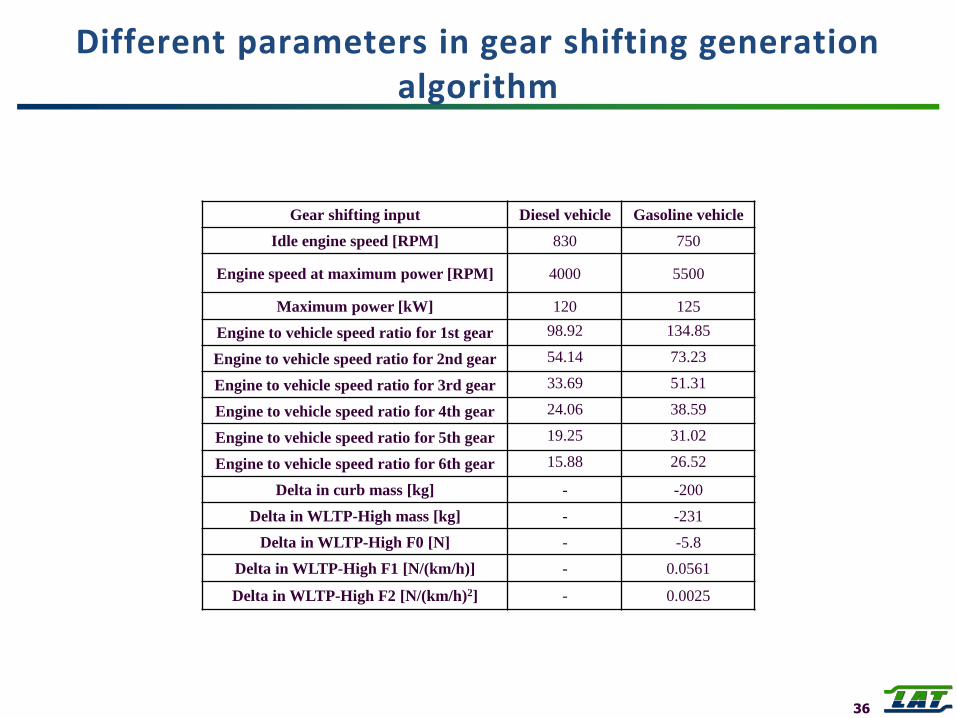
Different parameters in gear shifting generation algorithm
Gear shifting input Diesel vehicle Gasoline vehicle
Idle engine speed [RPM] 830 750
Engine speed at maximum power [RPM] 4000 5500
Maximum power [kW] 120 125
Engine to vehicle speed ratio for 1st gear 98.92 134.85
Engine to vehicle speed ratio for 2nd gear 54.14 73.23
Engine to vehicle speed ratio for 3rd gear 33.69 51.31
Engine to vehicle speed ratio for 4th gear 24.06 38.59
Engine to vehicle speed ratio for 5th gear 19.25 31.02
Engine to vehicle speed ratio for 6th gear 15.88 26.52
Delta in curb mass [kg] - -200
Delta in WLTP-High mass [kg] - -231
Delta in WLTP-High F0 [N] - -5.8
Delta in WLTP-High F1 [N/(km/h)] - 0.0561
Delta in WLTP-High F2 [N/(km/h)2] - 0.0025
36
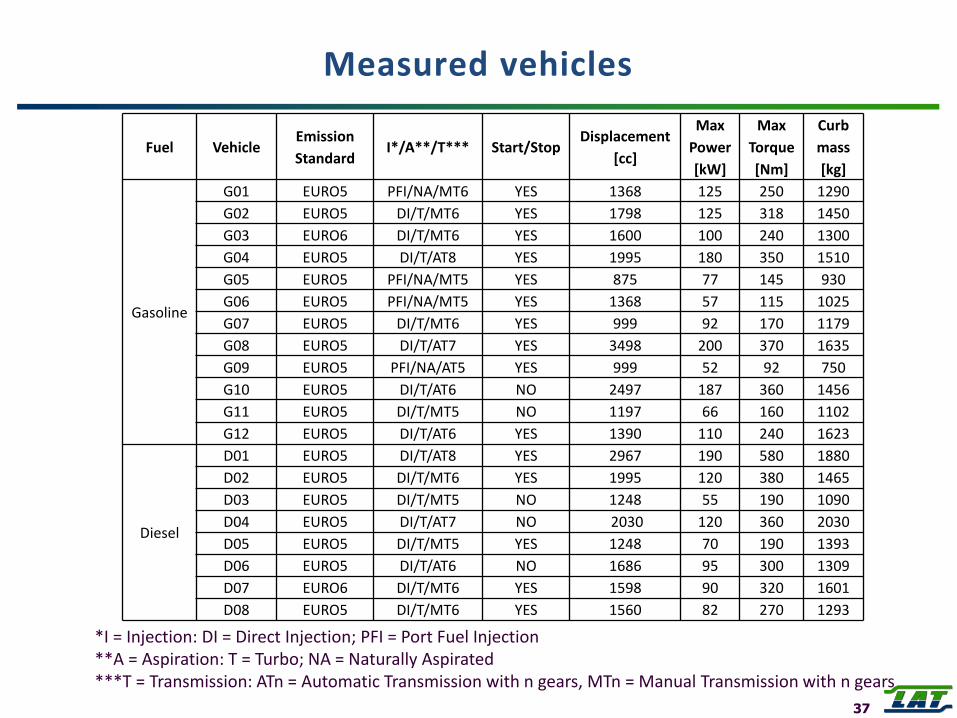
Measured vehicles
Fuel Vehicle Emission
Standard I*/A**/T*** Start/Stop
Displacement
[cc]
Max
Power
[kW]
Max
Torque
[Nm]
Curb
mass
[kg]
Gasoline
G01 EURO5 PFI/NA/MT6 YES 1368 125 250 1290
G02 EURO5 DI/T/MT6 YES 1798 125 318 1450
G03 EURO6 DI/T/MT6 YES 1600 100 240 1300
G04 EURO5 DI/T/AT8 YES 1995 180 350 1510
G05 EURO5 PFI/NA/MT5 YES 875 77 145 930
G06 EURO5 PFI/NA/MT5 YES 1368 57 115 1025
G07 EURO5 DI/T/MT6 YES 999 92 170 1179
G08 EURO5 DI/T/AT7 YES 3498 200 370 1635
G09 EURO5 PFI/NA/AT5 YES 999 52 92 750
G10 EURO5 DI/T/AT6 NO 2497 187 360 1456
G11 EURO5 DI/T/MT5 NO 1197 66 160 1102
G12 EURO5 DI/T/AT6 YES 1390 110 240 1623
Diesel
D01 EURO5 DI/T/AT8 YES 2967 190 580 1880
D02 EURO5 DI/T/MT6 YES 1995 120 380 1465
D03 EURO5 DI/T/MT5 NO 1248 55 190 1090
D04 EURO5 DI/T/AT7 NO 2030 120 360 2030
D05 EURO5 DI/T/MT5 YES 1248 70 190 1393
D06 EURO5 DI/T/AT6 NO 1686 95 300 1309
D07 EURO6 DI/T/MT6 YES 1598 90 320 1601
D08 EURO5 DI/T/MT6 YES 1560 82 270 1293
37
*I = Injection: DI = Direct Injection; PFI = Port Fuel Injection **A = Aspiration: T = Turbo; NA = Naturally Aspirated ***T = Transmission: ATn = Automatic Transmission with n gears, MTn = Manual Transmission with n gears


![Pagina 1 - QN Motori...Consumo energia elettrica ciclo misto (NEDC) (kWh/100km) - - - - - 13,2 - Emissioni CO 2 (g/km) 126 126 [126] 139 136] 141 [137] 159 146] [49] 169 [158] Omologazione](https://img.pdfslide.tips/doc/110x75/609536d606413432652b8f4b/pagina-1-qn-motori-consumo-energia-elettrica-ciclo-misto-nedc-kwh100km.jpg)