Embed Size (px)
Citation preview


Profili brzina i njihov utjecaj na optimizaciju

Ključni podatak u optimizaciji:
Vrijeme putovanja između lokacija A i B
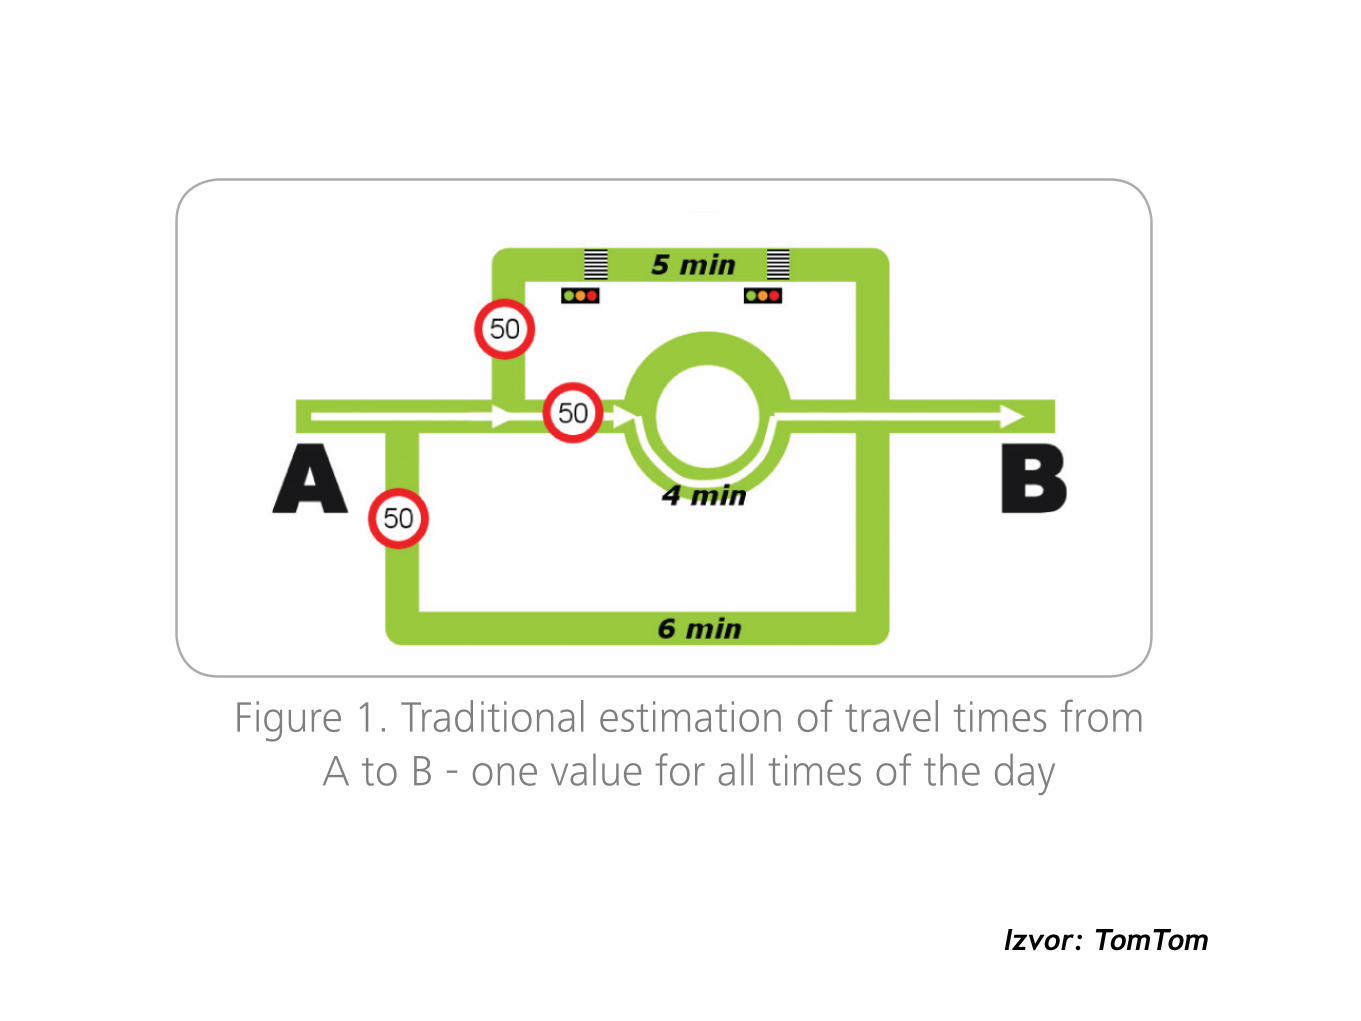
Kojim putem treba proći da bi putovanje trajalo najkraće?

Najkraća ruta nije uvijek i najbrža (Zagreb - Split)!
Treba nam vrijeme putovanja po svakoj prometnici

Klasificirajmo prometnice po "važnosti" i odredimo mjerenjem prosječnu brzinu kretanja
Tipično 5-8 različitih tipova
Prosječna brzina bez obzira na tip vozila, dan u tjednu, vrijeme u danu, godišnje doba
Pojednostavljeni pristup

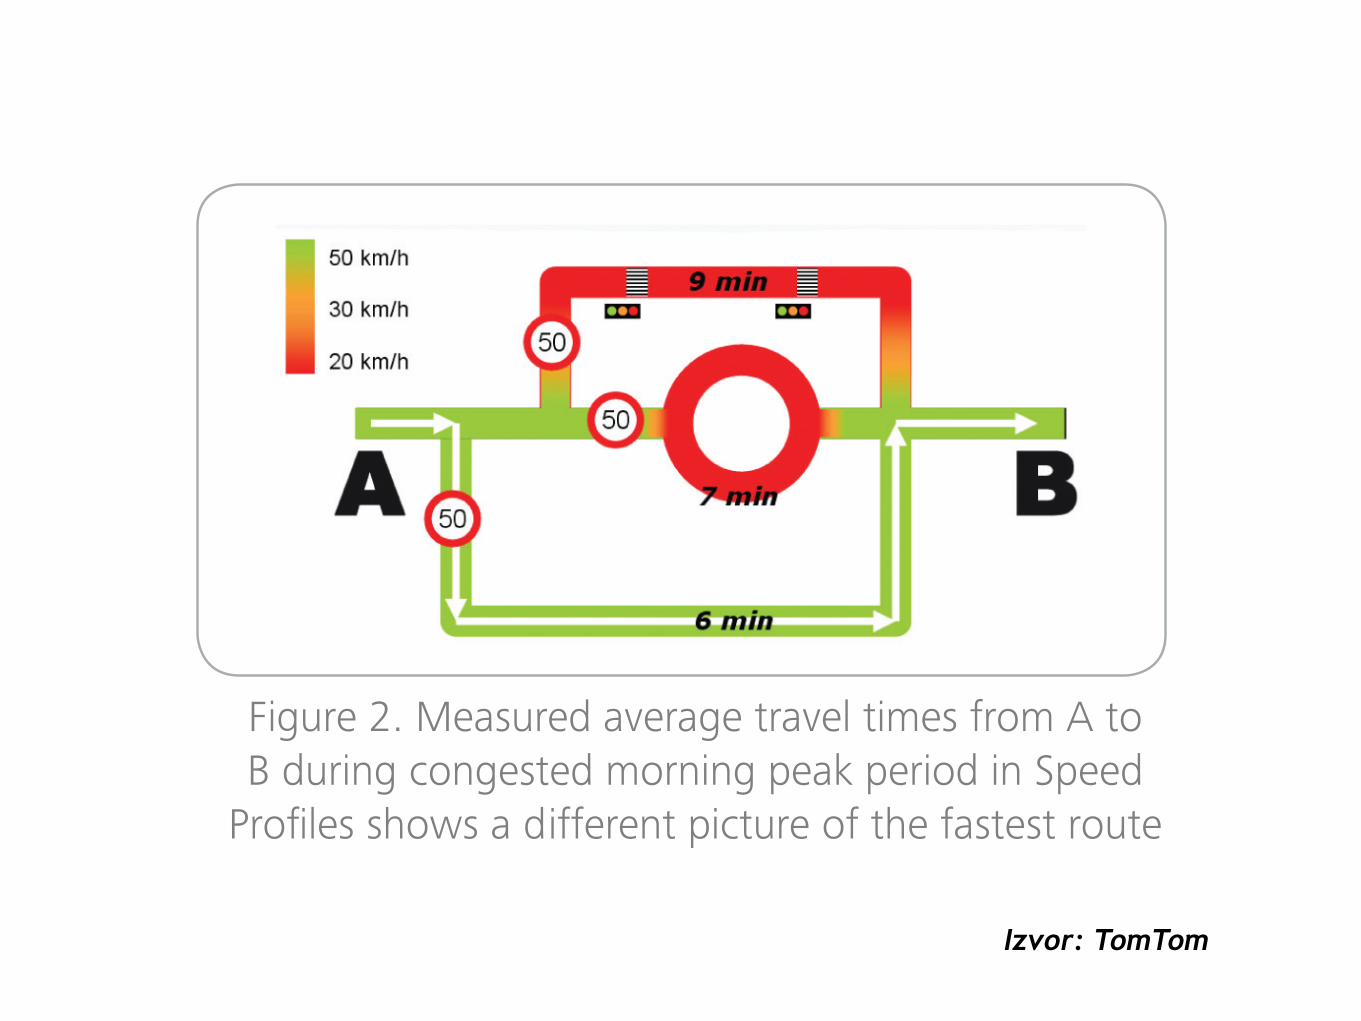
Ako vozilo krene u 7:15 stići će u 7:30, ali ako krene u 7:30 stići će u 8:05
Optimizacija može sugerirati raspored koji se ne može provesti
Očigledni problemi

Profili brzina
ATEC ITS France Congress, Paris, France, January 29th
2014
3 | P a g e
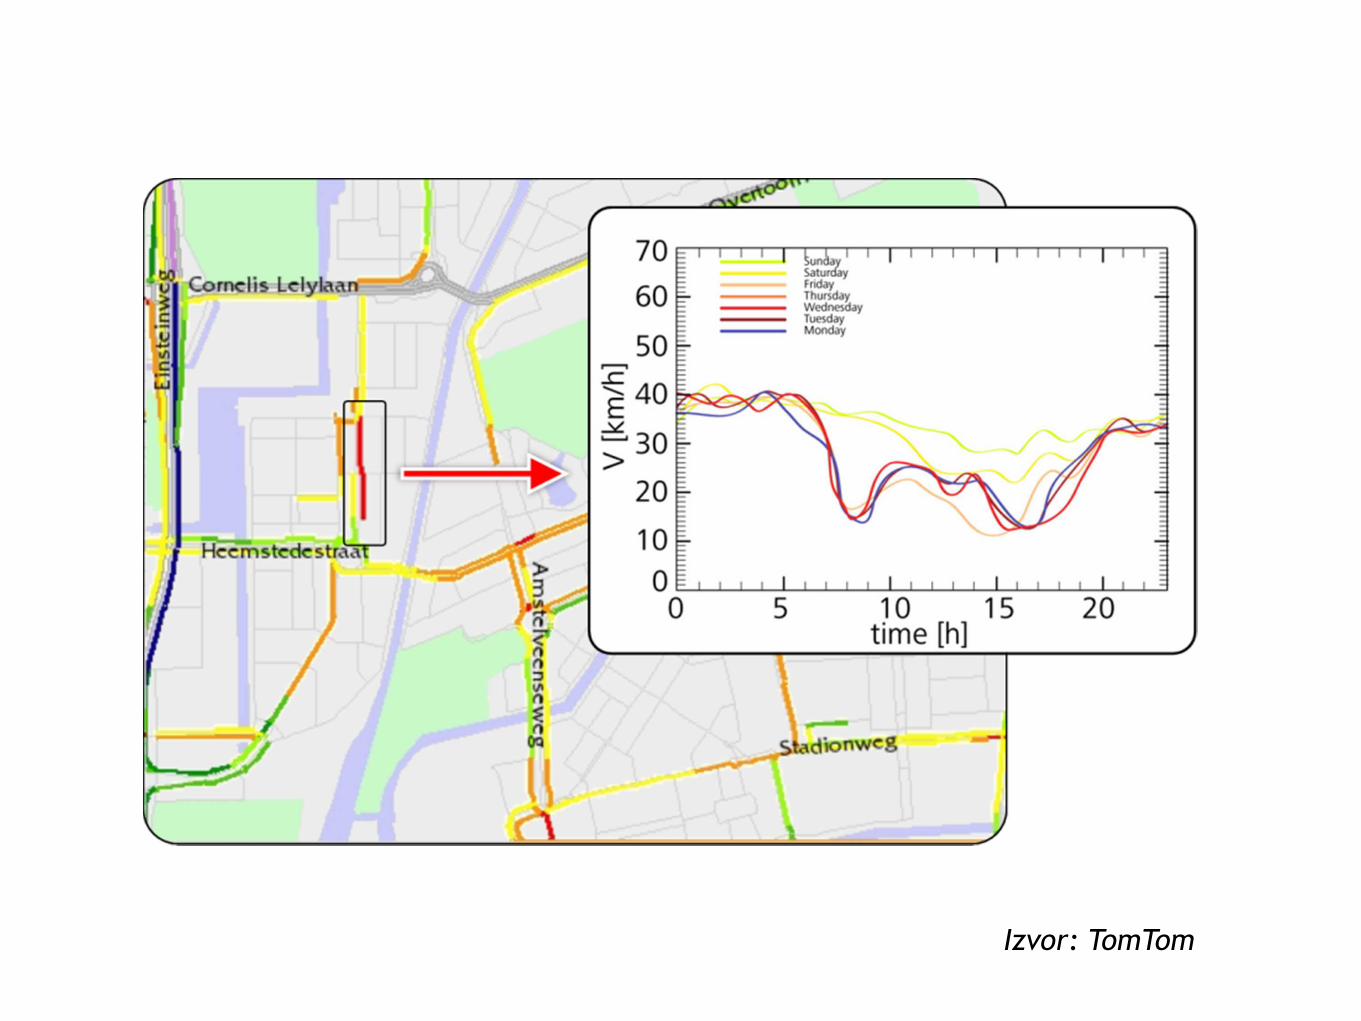
In addition to real time GPS traffic data, historical GPS speed data is used as a background source. ‘Speed Profiles’ details time-
dependent speed characteristics along a road element (unique value for time-of-the-day and day-of-the-week). Speed Profiles
are derived from aggregating hundreds of billions of anonymous GPS measurements from millions of devices that reflect world-
wide consumer driving patterns. Travel data is analysed
and normalized to ensure the highest degree of accuracy.
Speed values are assigned to each routable road element
in the map. The data is updated quarterly for changes in
map data as well as to enhance freshness and coverage
of the historical data. Image 1.4 shows an example of a
road element Speed Profile. Speed Profile data contains
data for a 5 minute interval for each day of the week. As
you can see in the image the speed values change over
time, showing speeds around 40 km/h around midnight
and clear drops in speed during the weekday rush hours.
Image 1.4; Speed Profile example in Amsterdam.
Heat maps can visualize the volume of probes and the distribution over the road network. These heat-maps are essentially black
sheets with all measurements plotted in top of this. The brighter the colour the more measurements were received. Please note
that these are only TomTom devices (not 3rd
party devices). For traffic data creation also other GPS measurements are added. In
the images below you find a heatmap for Europe and North America1
.
Image 1.5; TomTom GPS measurements for Q1 2013.
Using Floating Car Data from various sources result in a number of benefits compared to other ways of measuring travel time
and speed information. As cars drive on all roads that are open for traffic it is possible to measure with floating car data travel
times and speeds on all roads, even when construction works take place, forcing traffic for example to go on a temporary lane or
drive on the other side of the dual carriageway. Also when new roads are opened congestion can easily and quick be reported.
Additionally, the system does not have to wait until a vehicle has reached the end of a road section before the travel time is
calculated as data can be received regularly along the route. This is especially an advantage in slow traffic conditions when
it takes a long time before a vehicle has travelled to the end of a road section. Floating Car Data enables TomTom to accurately
measure the speeds, also in case of low speeds or standstill conditions.
1 Please note that TomTom is not limited to these countries but can collect data for any location on the world.
Izvor: TomTom

Preciznije mjerenje vremena putovanja
Računaju se iz prikupljenih GPS tragova
Profili brzina
Optimizacija postaje bitno kompliciranija!
Izvor: TomTom
maps & content | real time & historical traffic | lbs
www.tomtom.com/licensing
© 2
012
Tom
Tom
. All
right
s re
serv
ed.
2012.12.I.SP.EN
Features and Benefits
End User Benefit
By selecting the quickest routes, users may:
Reduce travel timeSave money by consuming less fuelEnhance the navigation experienceMinimise environmental impactLower stress by avoiding congestion
Formats
For MultiNet map products:
DBF format for ShapefileTxt-based format for GDF relational and sequential products
FEATURE BENEFIT
High AccuracyAggregates real speed data from millions of anonymous, consumer GPS devices, providing true average speeds on individual road segments.
Results in greater route time accuracy.
Broad CoverageThe content covers highways, urban and rural arterials, and secondary roads in more than 40 countries throughout Europe, North America and beyond, with coverage growing at a rapid pace.
Quickly deploy in multiple markets with one global platform.
Detailed GranularityComprehensive traffic patterns are captured for every five minute interval for each day of the week.
Provides greater product quality.
Compact Data FootprintA compact design results in less than a 2% increase in data size as an add-on to the map content.
Efficient use of memory lowers build costs, allowing use on all device models.
One Global SpecificationConsistent format in all countries eliminates the need to standardise and stitch together data from different suppliers.
Saves time and money on global development.
Figure 2. Measured average travel times from A to B during congested morning peak period in Speed
Profiles shows a different picture of the fastest route
Figure 1. Traditional estimation of travel times from A to B - one value for all times of the day
Izvor: TomTom
ATEC ITS France Congress, Paris, France, January 29th
2014
7 | P a g e
Relevant in QBENCH is that there needs to be a definition of the congestion threshold.
Due to the fact that this threshold is open to configure it is possible that different
analysis based on the same data show different results. The congestion threshold of
TomTom is 50% of the overnight freeflow. Next to the threshold there is also an error
tolerance and standstill cut-off as you cannot measure travel time over data that is
not moving. Besides the definitions there is an option to assign different weight to
penalties for over-reported delays versus under reported delays.
With QBENCH it is possible to visualize the traffic data quality. An example is
displayed in image 1.13 whereby the green area represents data within the tolerance,
yellow within increased tolerance (positive or negative) and red displays all
traveltimes in excess of higher tolerances. Image 1.14 provides an example of
QBENCH results for California, USA for Q3 2011. The yellow and red areas contain a
combination of too positive and too negative traveltimes.
Image 1.13 (above); QBENCH principals. Image 1.14 (left); QBENCH results for
Q3 2011 for California.
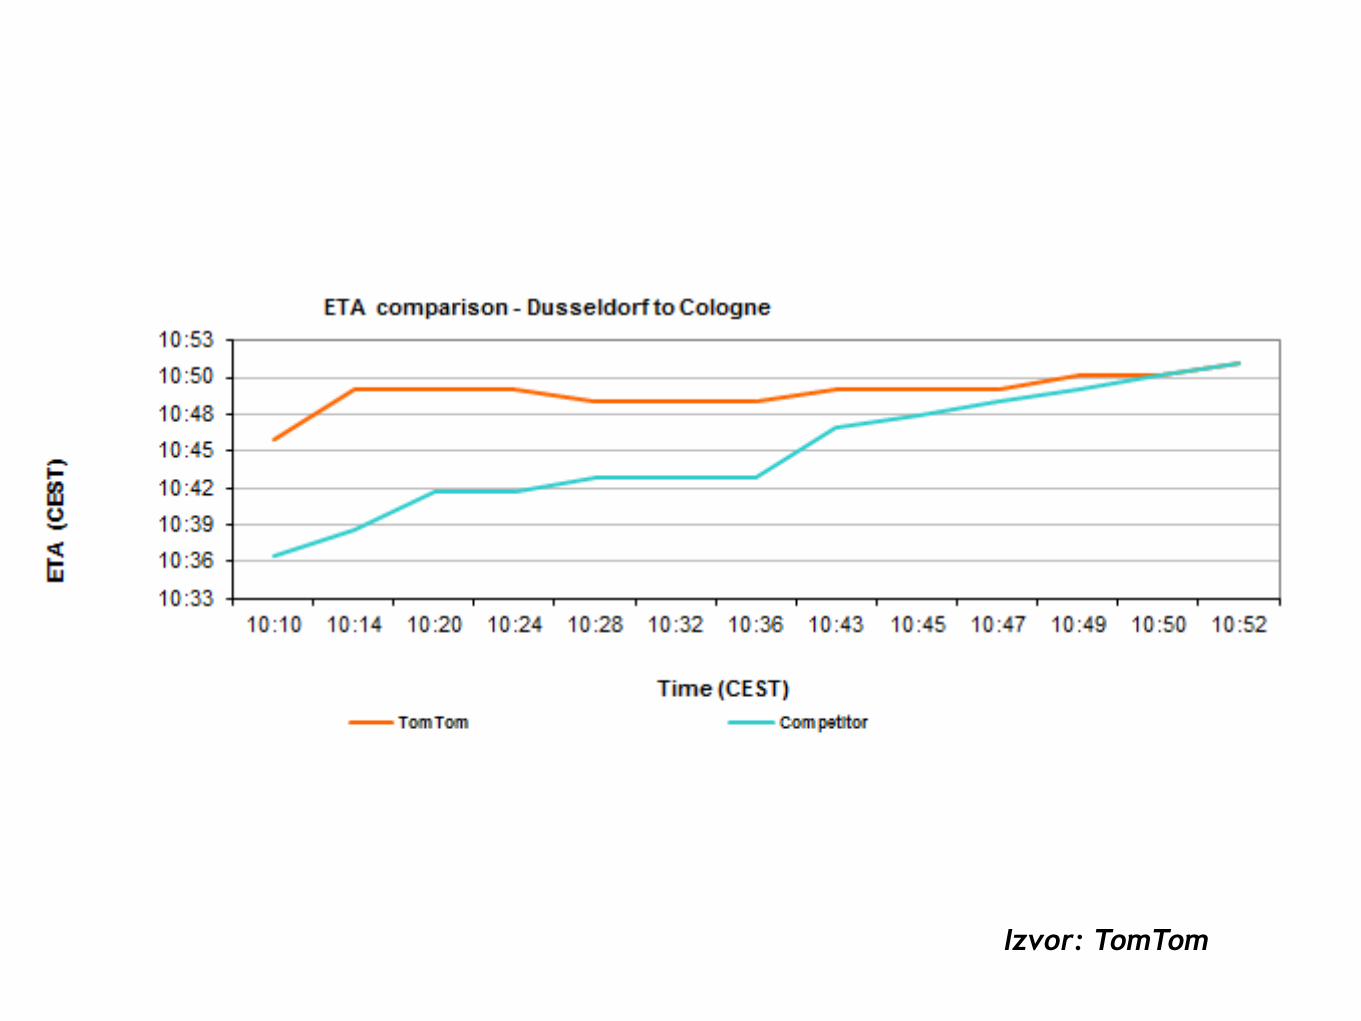
On the road Several different techniques have been described in this paper for statistically measuring traffic information quality, but it is
important not to lose the link to reality. Drivers use the data to navigate to where they want to be as quickly as possible and it is
important to appreciate the user experience in the traffic information process. Hence it will always be essential to execute
occasional drive tests to support the statistical quality test results. Despite the low sample size that test drives provide (it is not
possible to drive past all jams) it does provide a view of how data is used. It will show the impact that the accuracy of the
information displayed and estimated time of arrival (ETA) have on the user experience. Image 1.14 provides an example of a trip
in the congested Ruhr area in Germany and how ETA calculations with TomTom traffic are more stable over time then a
competitive traffic service.
Image 1.15 (above): travel time comparisons. TomTom ETA is more stable over time.
These tests are conducted by both TomTom and independent organizations validating quality or comparing different service
providers. Image 1.16 shows how a typical test drive is carried out with many different navigation devices placed in a car driving
in traffic.
Image 1.16 (right): test drive set-up, testing traffic data in
Paris City center.


![JAVNI INFRASTRUKTURNI SUSTAVI · JAVNI INFRASTRUKTURNI SUSTAVI BRZINA Brzina je polazni parametar u dimenzioniranju tlocrtnih i visinskih elemenata ceste. Brzina [m/s, km/h] je vektorska](https://img.pdfslide.tips/doc/110x75/6066a6067826c81db525d54f/javni-infrastrukturni-javni-infrastrukturni-sustavi-brzina-brzina-je-polazni-parametar.jpg)