Embed Size (px)
Citation preview

arX
iv:1
304.
3770
v2 [
astr
o-ph
.SR
] 16
May
201
3
Pulsation Analysis of the High Amplitude δ Scuti Star CW Serpentis
J. S. Niu
Astronomy Department, Beijing Normal University, Beijing100875, China
J. N. Fu
Astronomy Department, Beijing Normal University, Beijing100875, China
W. K. Zong
Astronomy Department, Beijing Normal University, Beijing100875, China
Received ; accepted

– 2 –
ABSTRACT
Time-series photometric observations were made for the High Amplitudeδ Scuti
star CW Ser between 2011 and 2012 at the Xinglong Station of National Astronomical
Observatories of China. After the frequency analysis of thelight curves, we confirmed
the fundamental frequency off = 5.28677 cd−1, together with 8 harmonics of the
fundamental frequency, 7 of which are newly detected. No additional frequencies
were detected. TheO − C diagram, produced with the 21 newly determined times
of maximum light combined with those provided in the literature, helps to obtain a
new ephemeris formula of the times of maximum light with the pulsation period of
0.189150355± 0.000000003 days.
Subject headings:stars:variables:δ Scuti — stars: individual: CW Ser — techniques:
photometric

– 3 –
1. Introduction
δ Scuti stars are a class of pulsating variable stars that liesin the classical instability strip
cross the main sequence on the Hertzsprung-Russell diagram, whose pulsations are driven by the
κ−mechanism which drives the pulsations of both Cepheids and the RR Lyrae stars as well. With
masses between 1.5 and 2.5M⊙, periods between 0.03 and 0.3 days, luminosities between 10and
50L⊙, δ Scuti stars pulsate with amplitudes from mmag up to tenths ofa magnitude (Breger 2000).
The high-amplitudeδ Scuti stars (hereafter HADS) are a subgroup ofδ Scuti stars as slow
rotators with one or two dominant radial modes whose amplitudes are larger than 0.1 mag,
although some of them may have low-amplitude, non-radial modes in addition to the main
pulsation modes (Poretti 2003). It is interesting to probe whether the non-radial mode is an overall
property of the pulsations of all HADS.
Pulsations of the HADS CW Serpentis (hereafter CW Ser (= HIP 077798,α2000 = 15h52m10s,
δ2000 = 06◦05′26′′, < V >= 11m.83, P0 = 0d.1892, ∆V = 0m.47, A-F) were discovered by
Hoffmeister (1935). Gieren et al. (1975) made time-series photometry for CW Ser, derived two
times of maximum light and the period value ofP = 0d.18915054 ± 0.00000001. CW Ser has
been observed only by a few runs since its pulsation period israther long. The spectral type
of CW Ser was classified as F by Halprin & Moon (1983) and Lopez de Coca et al. (1990) by
using theuvbyβ photometry. Xu et al. (2002) calibrated it’s spectral type as A-F. There were also
several runs of photometric observations carried out in Konkoly observatory from 1975 to 2005
(Gieren et al. 1975; Agerer & Hubscher 1996; Agerer & Huebscher 1998; Agerer et al. 1999,
2001; Hubscher et al. 2005).
In the following sections, we present a detailed study of thepulsations and period changes of

– 4 –
CW Ser, mainly based on extended time-series photometric observations from 2011 to 2012 at
the Xinglong Station of National Astronomical Observatories of China (NAOC). The organization
of the paper is: Section 2 describes the data collection and reduction; Section 3 introduces the
pulsation analysis of the new data; Section 4 discusses the calculated changes of the peirod with
theO − C method; Section 5 gives our conclusions.
2. Observations and Data Reduction
Time-series photometric observations for CW Ser were made with the 85-cm telescope
located at the Xinglong Station of NAOC between March 2011 and June 2012. The 85-cm
telescope was equipped with a standard Johnson-Cousin-Bessel multicolour filter system and a
PI1024 BFT CCD camera mounted on the primary focus (Zhou et al. 2009). The CCD camera has
1024× 1024 pixels, corresponding to a field of view of16.5′
× 16.5′
, Since March 2012, this CCD
camera was replaced by a PI512 BFT, which has512× 512 pixels corresponding to a field of view
of 15′
× 15′
. The observations were carried out through a standard JohnsonV filter with exposure
time ranging from 20 to 150 seconds, depending on the atmospheric conditions. A journal of the
new observations is listed in Table 1.
Table 1: Journal of the new observations inV with the 85-cm telescope between 2011 and 2012.
CCD Year Month Nights Frames
PI BFT1024 2011 March 4 1,249
May 7 2,247
PI BFT512 2012 March 5 830
April 2 245
In total, 4,571 CCD frames of data were collected for CW Ser within 18 nights. Figure
1 shows an image of CW Ser taken with the 85-cm telescope, where the comparison star and

– 5 –
the check star are marked (see Table 2). After bias, dark and flat-field corrections, aperture
photometry was performed by using the DAOPHOT program of IRAF. The light curves were then
produced by computing the magnitude differences between CWSer and the comparison star.
The standard deviations of the magnitude differences between the check star and the comparison
star yielded an estimation of photometry precisions, with the typical value of0m.003 in good
observation conditions and0m.011 in poor cases. Although there were slight zero-point shifts,
we adjusted it with the fit light curves of the data for every month (assuming the frequencies are
stable in one month).
Table 2: Information of the comparison and the check star.
ID Star-Name α(2000) δ(2000) V (mag)
Comparison USNOA2 0900-0829250415h53m17s.32 +05◦59′
13′′
.6 11.15
Check USNOA2 0900-0829369015h53m24s.81 +05◦59′
15′′
.5 13.50
Figure 2 shows the light curves of CW Ser in JohnsonV band observed with the 85-cm
telescope in 2011 and 2012, which were used to make frequencyanalysis.
3. PULSATION ANALYSIS
Frequency analysis was performed with the light curves of CWSer in 2011-2012 with the
software PERIOD04 (Lenz & Breger 2005), which makes Fouriertransformations of the light
curves to search for significant peaks in the amplitude spectra. The light curves are fitted with the
following formula,
m = m0 +∑
i
Ai sin(2π(fit+ φi)). (1)
The solutions with frequencies whose signal-to-noise ratios (S/N) are larger than 4.0 (Breger et al.
1993) were listed in Table 3. The solid curves in Figure 2 showthe fits with the frequency solution
in 2011-2012. From Table 3, one notes that the 8 frequencies are composed of the fundamental

– 6 –
Fig. 1.— CW Ser, the comparison star and the check star, marked in an image taken with the
85-cm telescope. The field of view is16.5′ × 16.5′. North is down and East is to the right.

– 7 –
5628.3 5628.4 5628.5 5628.6 5628.7
0.5
0.7
0.9
1.1 5629.2 5629.3 5629.4 5629.5
0.5
0.7
0.9
1.1 5630.2 5630.3 5630.4 5630.5
0.5
0.7
0.9
1.1
5631.2 5631.3 5631.4 5631.5
0.5
0.7
0.9
1.1 5695.0 5695.1 5695.2 5695.3 5695.4
0.5
0.7
0.9
1.1 5696.1 5696.2 5696.3 5696.4
0.5
0.7
0.9
1.1
5697.1 5697.2 5697.3 5697.4
0.5
0.7
0.9
1.1 5700.2 5700.3 5700.4 5700.5 5700.6
0.5
0.7
0.9
1.1 5703.1 5703.2 5703.3 5703.4
0.5
0.7
0.9
1.1
5704.0 5704.1 5704.2 5704.3 5704.4
0.5
0.7
0.9
1.1 5705.0 5705.1 5705.2 5705.3 5705.4
0.5
0.7
0.9
1.1 6062.1 6062.2 6062.3 6062.4
0.5
0.7
0.9
1.1
6063.1 6063.2 6063.3 6063.4 6063.5
0.5
0.7
0.9
1.1 6064.1 6064.2 6064.3 6064.4 6064.5
0.5
0.7
0.9
1.1 6065.1 6065.2 6065.3 6065.4 6065.5
0.5
0.7
0.9
1.1
6068.1 6068.2 6068.3 6068.4
0.5
0.7
0.9
1.1 6089.0 6089.1 6089.2 6089.3 6089.4
0.5
0.7
0.9
1.1 6090.1 6090.2 6090.3 6090.4
0.5
0.7
0.9
1.1
HJD - 2450000
Differential V
(mag
)
Fig. 2.— Light curves of CW Ser in theV band from 2011 to 2012. The solid curves represent the
fitting with the 8-frequency solution listed in Table 3.

– 8 –
frequency and its 7 harmonics while no other frequencies in addition to the fundamental frequency
and the harmonics are detected.
As can be seen from Figure 2, the constructed curves fit well the observed light curves, which
shows that the fundamental frequency and its harmonics can explain the pulsation behavior of CW
Ser.
Figure 3 shows the window function of the light curves inV of CW Ser from 2011 to 2012.
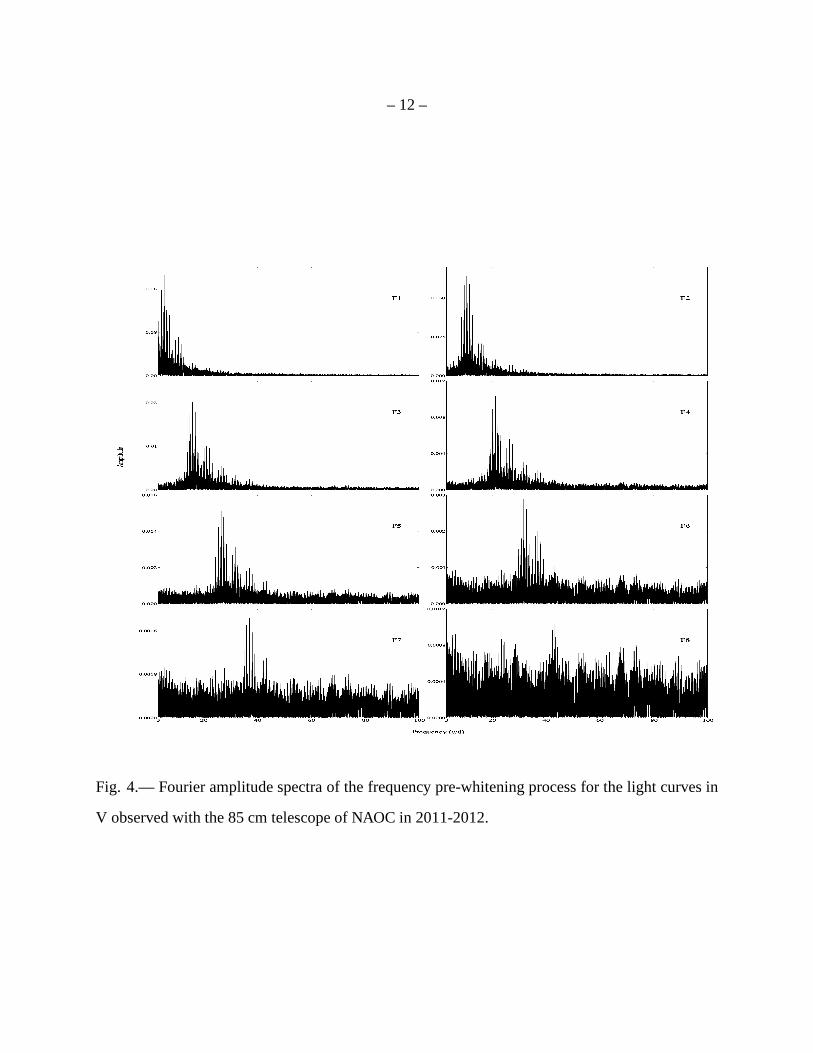
Figure 4 shows the amplitude spectra of the frequency pre-whitening process. Note that the peaks
located in the low-frequency domain (0 − 3 c d−1) are not considered as significant signals of the
variable star due to the instrument sensitivity instability and variations of sky transparency in the
low frequency domain.
Table 3: Multiple frequencies of CW Ser in 2011-2012.
Frequency (c d−1) Amp (mmg) S/N
f0 5.28677 187.34 47.1
2f0 10.57354 66.37 39.4
3f0 15.86032 19.86 27.2
4f0 21.14712 10.11 17.9
5f0 26.43660 5.02 15.6
6f0 31.72064 2.83 7.8
7f0 37.00211 1.81 6.0
8f0 43.29979 1.04 4.9
4. The O − C Diagram
With the new observations from 2011 to 2012, the light curvesaround the maximum light
were fitted with third polynomials, which are sufficient to derive times of maximum light. 21 new

– 9 –
times of maximum light inV band are determined with the date in 2011-2012.
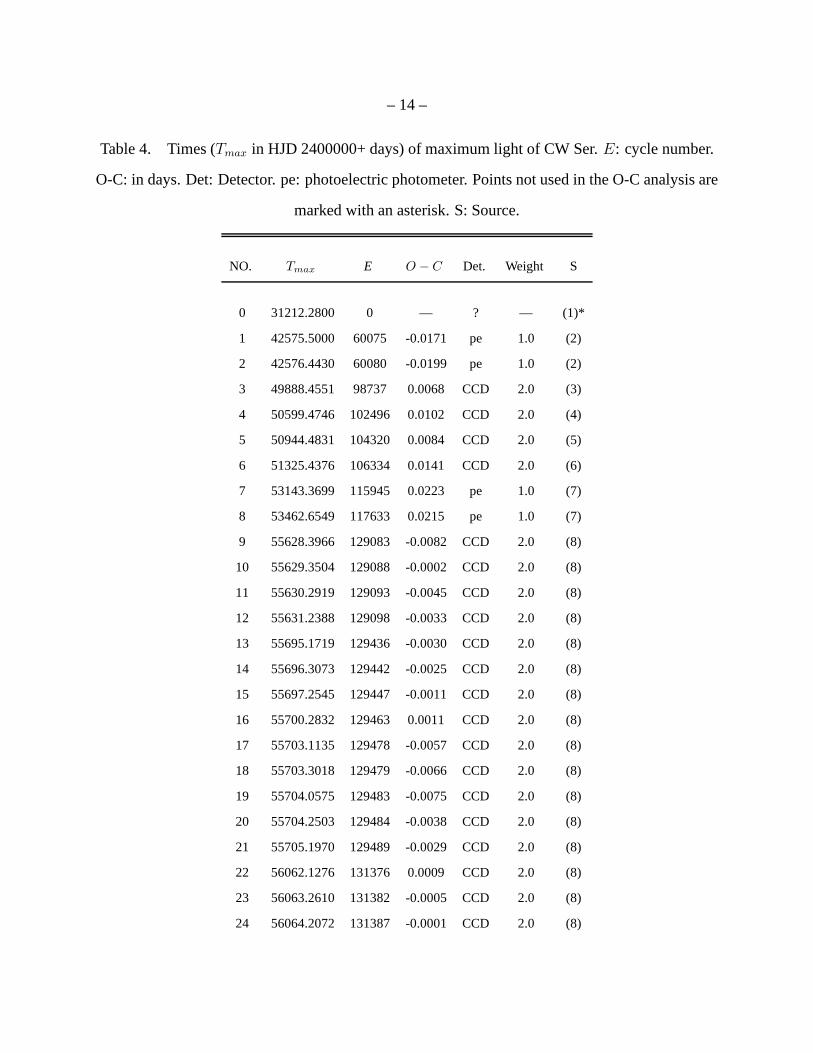
In order to make theO − C analysis for the period change of CW Ser, the maximum times
newly determined were combined with those provided by Gieren et al. (1975), Agerer & Hubscher
(1996), Agerer & Huebscher (1998), Agerer et al. (1999), Agerer et al. (2001) and Hubscher et al.
(2005). In total, 30 times of maximum light are collected andlisted in Table 4, where the first time
of maximum light is not included since we do not know the used detector and the data precision.
In addition, there exists a large time gap between the first time of maximum light and the other
data points.
TheO − C values are calculated and listed in Table 4 as well. TheO − C diagram is shown
in Figure 5. A straight-line fit to the 30 times of light maximayields the ephemeris formula,
HJDmax = 2431212.3095(8) + 0.189150355(3)E (2)
, with a standard deviation ofσ = 0.0091(7) days.
Since there are too free data points in theO − C diagram, we do not try to make a
second-order polynomial fit to estimate the period change rate.
5. Conclusions and Discussion
On the basis of the time-series photometric data from 2011 to2012, we determined the
fundamental frequency of pulsation as5.28677 ± 0.00001 c d−1. No additional frequencies
were resolved in the residual spectrum after prewhitening the fundamental frequency and its 7
harmonics. The light variations of CW Ser can be well reproduced with the fundamental radial
mode and its 7 harmonics.

– 10 –
Analysis of the light curves of CW Ser suggests that no nonradial mode pulsations with
amplitudes larger than1.04mmag are detected, which shows that nonradial mode is not an overall
property of the pulsations of all HADS at this amplitude level.
The 7 harmonics resolved in the pulsaitons of CW Ser indicatethe distortion of the light
curves from the standard sinusoidal function, which does not help the asteroseismological analysis
for CW Ser since no new independent modes are presented. However, the existence of multiple
harmonics shed lights on the nonlinear behaviour of the pulsation-excitation zone in the star.
According theO−C method, we provide a new ephemeris formula of the times of maximum
light with the pulsation period of0.189150355± 0.000000003 days
More observations, includeing high duty-cycle time-series photometry and high quality
spectroscopic observations, are extremely needed to caluculate the period change rate of CW Ser
and deduce the properties of this HADS.
6. Acknowledgments
This work was supported by the National Natural Science Foundation of China (NSFC)
under U1231202. The research is partially supported by the National Program of China (973
Program 2013CB834900) and the Fundamental Research Funds for Central Universities.

– 11 –
Fig. 3.— Spectral window of the light curves inV for CW Ser from 2011 to 2012.
– 12 –
Fig. 4.— Fourier amplitude spectra of the frequency pre-whitening process for the light curves in
V observed with the 85 cm telescope of NAOC in 2011-2012.

– 13 –
6 7 8 9 10 11 12 13 14
x 104
−0.03
−0.02
−0.01
0
0.01
0.02
0.03
E (Integer)
O −
C (d
ay)
Fig. 5.—O − C diagram constructed with the data from the literature (cross) and the new data
(open circle). TheO − C values are in days. E: cycle number.
– 14 –
Table 4. Times (Tmax in HJD 2400000+ days) of maximum light of CW Ser.E: cycle number.
O-C: in days. Det: Detector. pe: photoelectric photometer.Points not used in the O-C analysis are
marked with an asterisk. S: Source.
NO. Tmax E O − C Det. Weight S
0 31212.2800 0 — ? — (1)*
1 42575.5000 60075 -0.0171 pe 1.0 (2)
2 42576.4430 60080 -0.0199 pe 1.0 (2)
3 49888.4551 98737 0.0068 CCD 2.0 (3)
4 50599.4746 102496 0.0102 CCD 2.0 (4)
5 50944.4831 104320 0.0084 CCD 2.0 (5)
6 51325.4376 106334 0.0141 CCD 2.0 (6)
7 53143.3699 115945 0.0223 pe 1.0 (7)
8 53462.6549 117633 0.0215 pe 1.0 (7)
9 55628.3966 129083 -0.0082 CCD 2.0 (8)
10 55629.3504 129088 -0.0002 CCD 2.0 (8)
11 55630.2919 129093 -0.0045 CCD 2.0 (8)
12 55631.2388 129098 -0.0033 CCD 2.0 (8)
13 55695.1719 129436 -0.0030 CCD 2.0 (8)
14 55696.3073 129442 -0.0025 CCD 2.0 (8)
15 55697.2545 129447 -0.0011 CCD 2.0 (8)
16 55700.2832 129463 0.0011 CCD 2.0 (8)
17 55703.1135 129478 -0.0057 CCD 2.0 (8)
18 55703.3018 129479 -0.0066 CCD 2.0 (8)
19 55704.0575 129483 -0.0075 CCD 2.0 (8)
20 55704.2503 129484 -0.0038 CCD 2.0 (8)
21 55705.1970 129489 -0.0029 CCD 2.0 (8)
22 56062.1276 131376 0.0009 CCD 2.0 (8)
23 56063.2610 131382 -0.0005 CCD 2.0 (8)
24 56064.2072 131387 -0.0001 CCD 2.0 (8)

– 15 –
Table 4—Continued
NO. Tmax E O − C Det. Weight S
25 56065.1490 131392 -0.0040 CCD 2.0 (8)
26 56065.3436 131393 0.0013 CCD 2.0 (8)
27 56068.1823 131408 0.0028 CCD 2.0 (8)
28 56089.1783 131519 0.0031 CCD 2.0 (8)
29 56090.1231 131524 0.0021 CCD 2.0 (8)
Note. — Sources: (1) Hoffmeister (1935); (2) Gieren et al. (1975);
(3) Agerer & Hubscher (1996); (4) Agerer & Huebscher (1998);(5)
Agerer et al. (1999); (6) Agerer et al. (2001); (7) Hubscher et al.
(2005); (8) this work.

– 16 –
REFERENCES
Agerer, F., Dahm, M., & Hubscher, J. 1999, Information Bulletin on Variable Stars, 4712, 1
Agerer, F., Dahm, M., & Hubscher, J. 2001, Information Bulletin on Variable Stars, 5017, 1
Agerer, F., & Hubscher, J. 1996, Information Bulletin on Variable Stars, 4382, 1
Agerer, F., & Huebscher, J. 1998, Information Bulletin on Variable Stars, 4606, 1
Breger, M. 2000, in Delta Scuti and Related Stars,Astronomical Society of the Pacific Conference
Series, vol. 210, edited by M. Breger & M. Montgomery, 3
Breger, M., Stich, J., Garrido, R., et al. 1993, A&A, 271, 482
Gieren, W., Gieseking, F., & Hoffmann, M. 1975, InformationBulletin on Variable Stars, 1055, 1
Halprin, L., & Moon, T. T. 1983, Ap&SS, 91, 43
Hoffmeister, C. 1935, Astronomische Nachrichten, 255, 401
Hubscher, J., Paschke, A., & Walter, F. 2005, Information Bulletin on Variable Stars, 5657, 1
Lenz, P., & Breger, M. 2005, Communications in Asteroseismology, 146, 53
Lopez de Coca, P., Rolland, A., Rodriguez, E., & Garrido, R. 1990, A&AS, 83, 51
Poretti, E. 2003, A&A, 409, 1031
Xu, Y., Li, Z.-P., Deng, L.-C., & Xiong, D.-R. 2002, Chinese J. Astron. Astrophys., 2, 441
Zhou, A.-Y., Jiang, X.-J., Zhang, Y.-P., & Wei, J.-Y. 2009, Research in Astronomy and
Astrophysics, 9, 349
This manuscript was prepared with the AAS LATEX macros v5.2.