Embed Size (px)
Citation preview
Supporting Information
Structural studies of cesium, lithium/cesium and
sodium/cesium bis(trimethylsilyl)amide (HMDS)
complexes
Ana I. Ojeda-Amador, Antonio J. Martínez-Martínez, Alan R. Kennedy and Charles T.
O'Hara
WestCHEM, Department of Pure and Applied Chemistry, University of Strathclyde, Glasgow, G1 1XL, United Kingdom
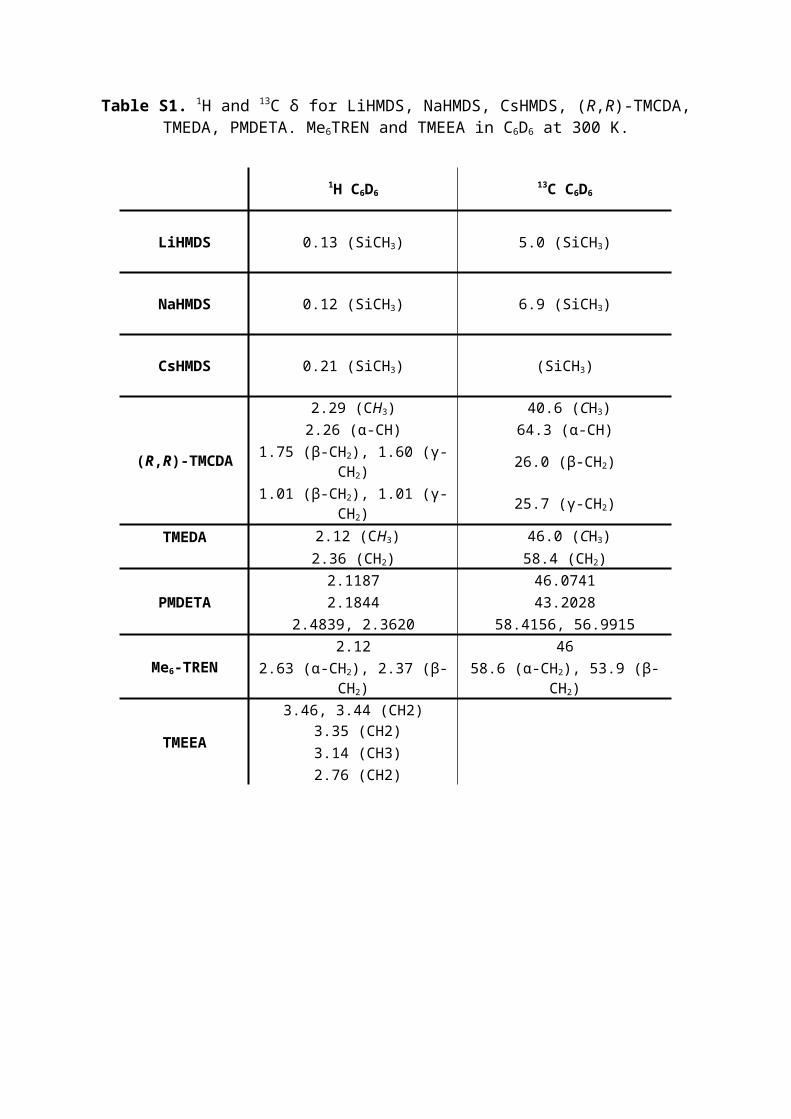
Table S1. 1H and 13C δ for LiHMDS, NaHMDS, CsHMDS, (R,R)-TMCDA, TMEDA, PMDETA. Me6TREN and TMEEA in C6D6 at 300 K.
1H C6D613C C6D6
LiHMDS 0.13 (SiCH3) 5.0 (SiCH3)
NaHMDS 0.12 (SiCH3) 6.9 (SiCH3)
CsHMDS 0.21 (SiCH3) (SiCH3)
(R,R)-TMCDA
2.29 (CH3) 40.6 (CH3)2.26 (α-CH) 64.3 (α-CH)
1.75 (β-CH2), 1.60 (γ-CH2) 26.0 (β-CH2)1.01 (β-CH2), 1.01 (γ-CH2) 25.7 (γ-CH2)
TMEDA
2.12 (CH3) 46.0 (CH3)2.36 (CH2) 58.4 (CH2)
PMDETA2.1187 46.07412.1844 43.2028
2.4839, 2.3620 58.4156, 56.9915
Me6-TREN2.12 46
2.63 (α-CH2), 2.37 (β-CH2) 58.6 (α-CH2), 53.9 (β-CH2)
TMEEA
3.46, 3.44 (CH2) 3.35 (CH2) 3.14 (CH3) 2.76 (CH2)
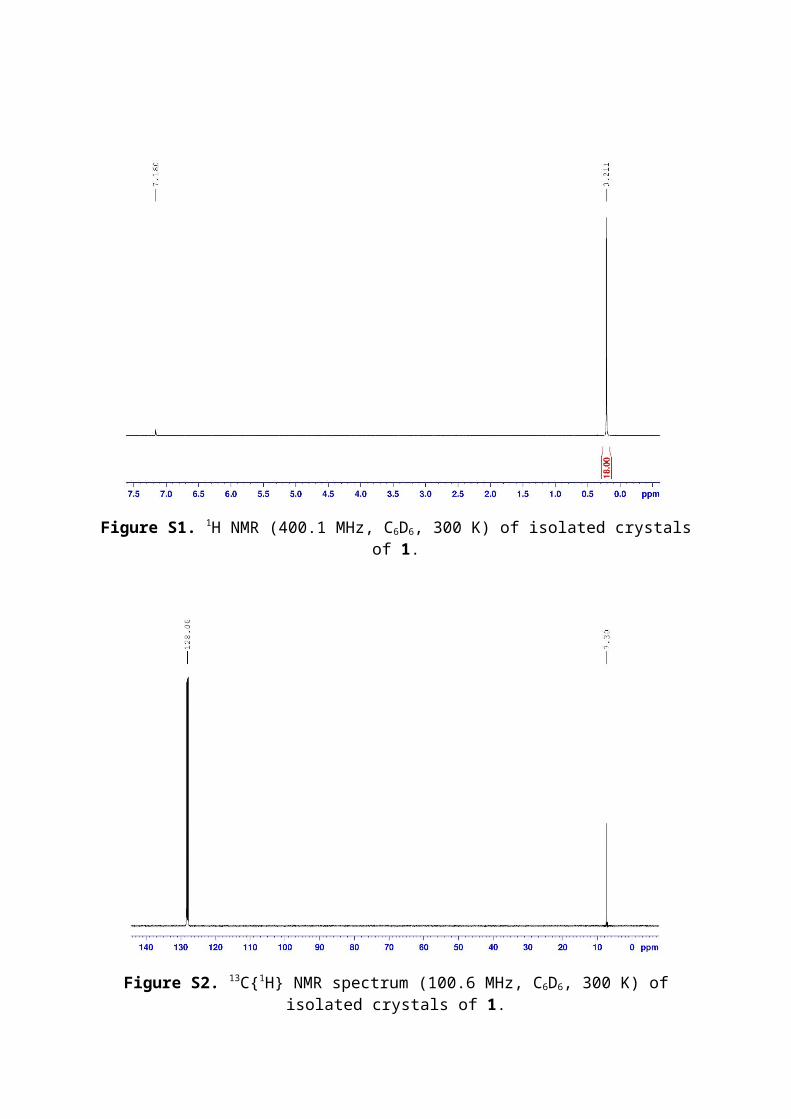
Figure S1. 1H NMR (400.1 MHz, C6D6, 300 K) of isolated crystals of 1.
Figure S2. 13C{1H} NMR spectrum (100.6 MHz, C6D6, 300 K) of isolated crystals of 1.
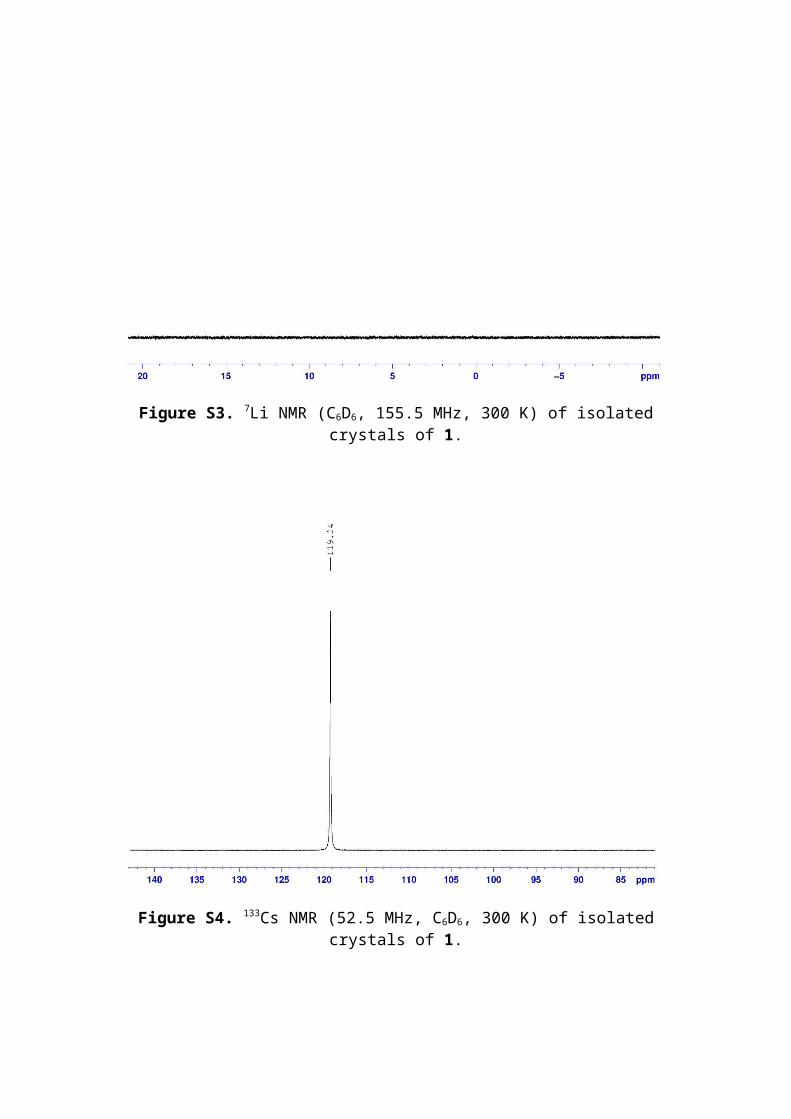
Figure S3. 7Li NMR (C6D6, 155.5 MHz, 300 K) of isolated crystals of 1.
Figure S4. 133Cs NMR (52.5 MHz, C6D6, 300 K) of isolated crystals of 1.
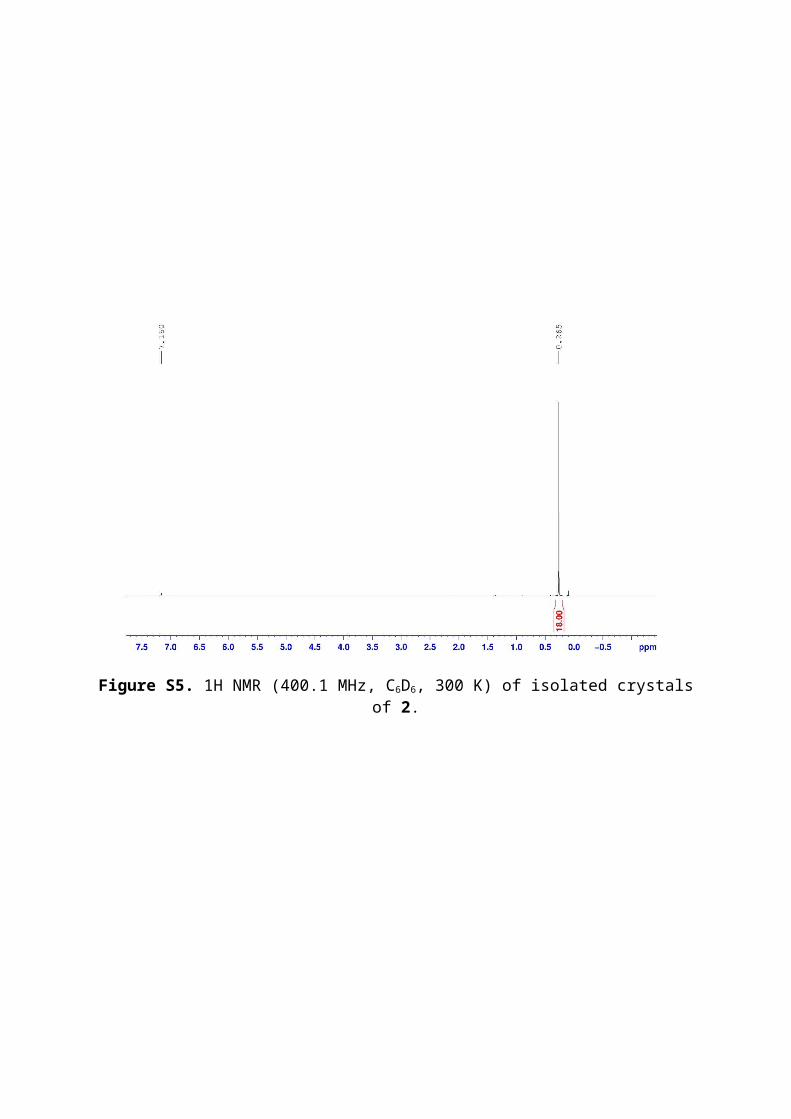
Figure S5. 1H NMR (400.1 MHz, C6D6, 300 K) of isolated crystals of 2.
Figure S6. 13C{1H} NMR spectrum (100.6 MHz, C6D6, 300 K) of isolated crystals of 2.
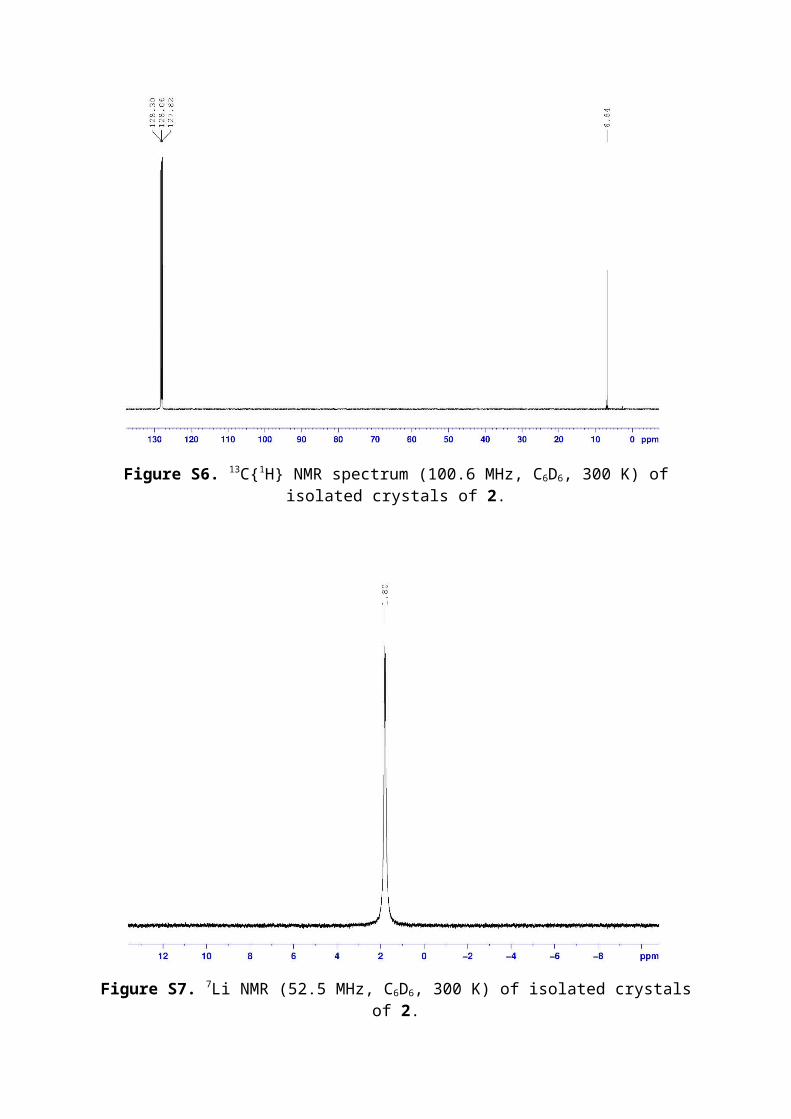
Figure S7. 7Li NMR (52.5 MHz, C6D6, 300 K) of isolated crystals of 2.
Figure S8. 133Cs NMR (52.5 MHz, C6D6, 300 K) of isolated crystals of 2.
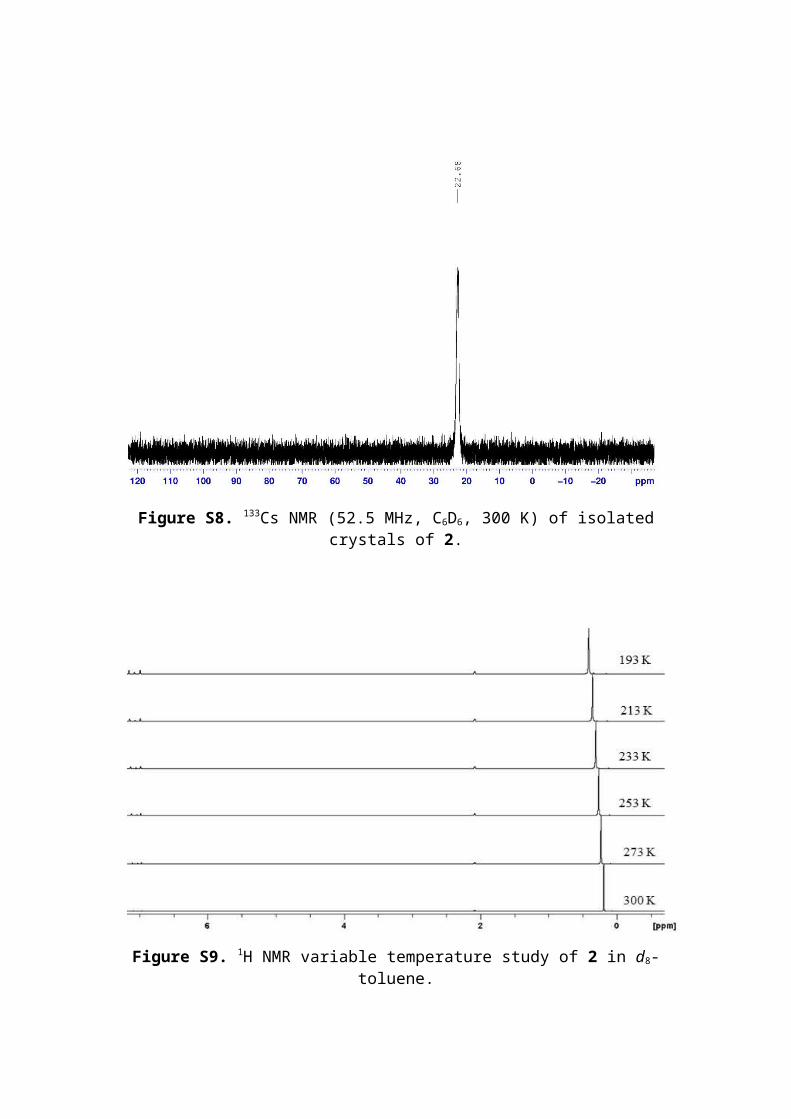
Figure S9. 1H NMR variable temperature study of 2 in d8-toluene.
Figure S10. 1H NMR (400.1 MHz, C6D6, 300 K) of isolated crystals of 3.
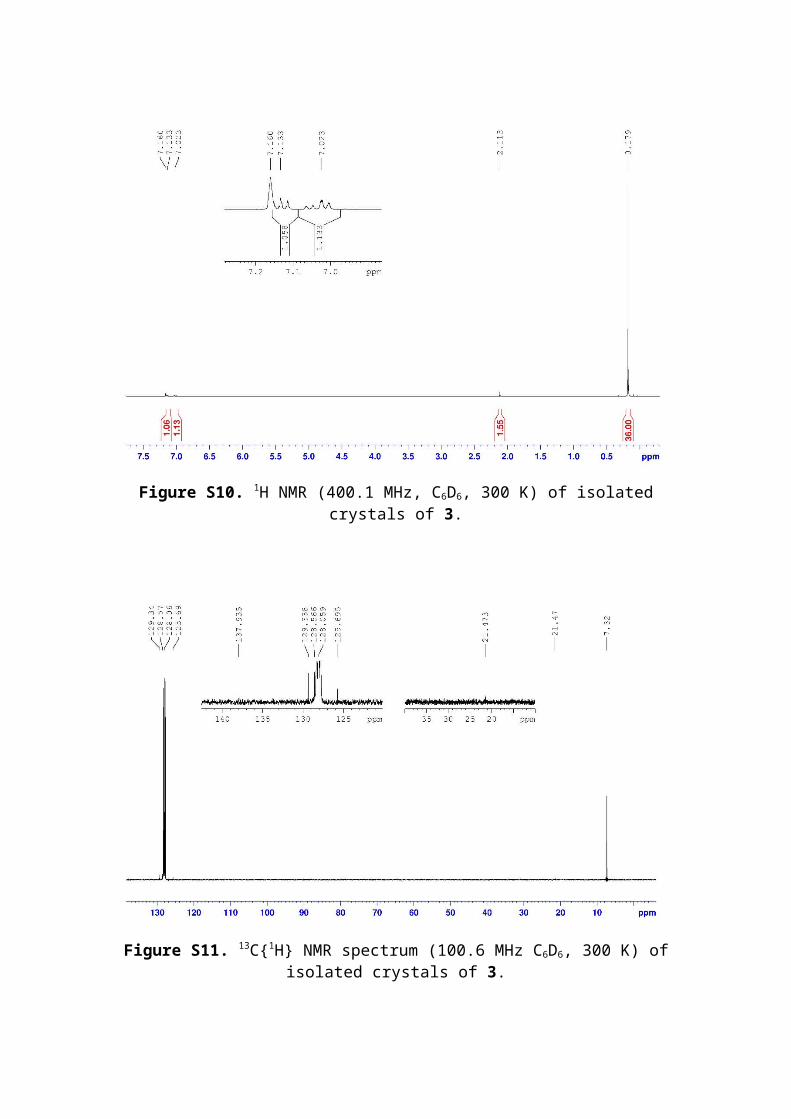
Figure S11. 13C{1H} NMR spectrum (100.6 MHz C6D6, 300 K) of isolated crystals of 3.
Figure S12. 133Cs NMR (52.5 MHz, C6D6, 300 K) of isolated crystals of 3.
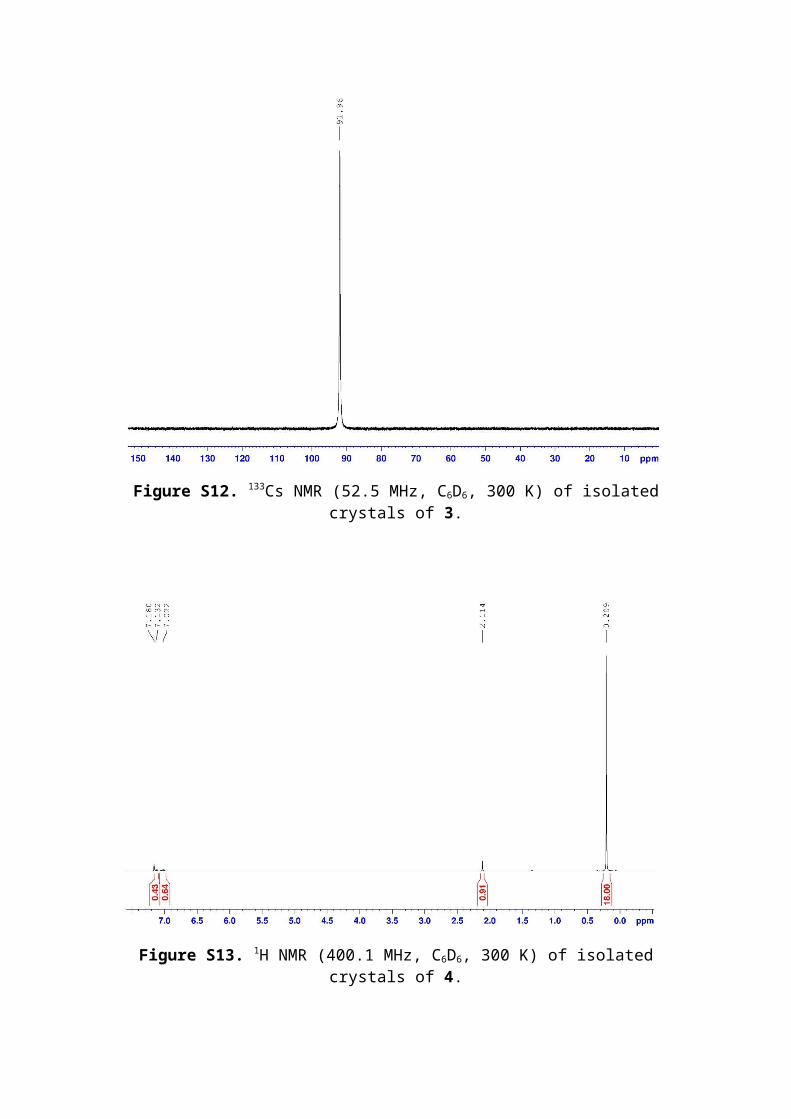
Figure S13. 1H NMR (400.1 MHz, C6D6, 300 K) of isolated crystals of 4.
Figure S14. 13C{1H} NMR spectrum (100.6 MHz, C6D6, 300 K) of isolated crystals of 4.
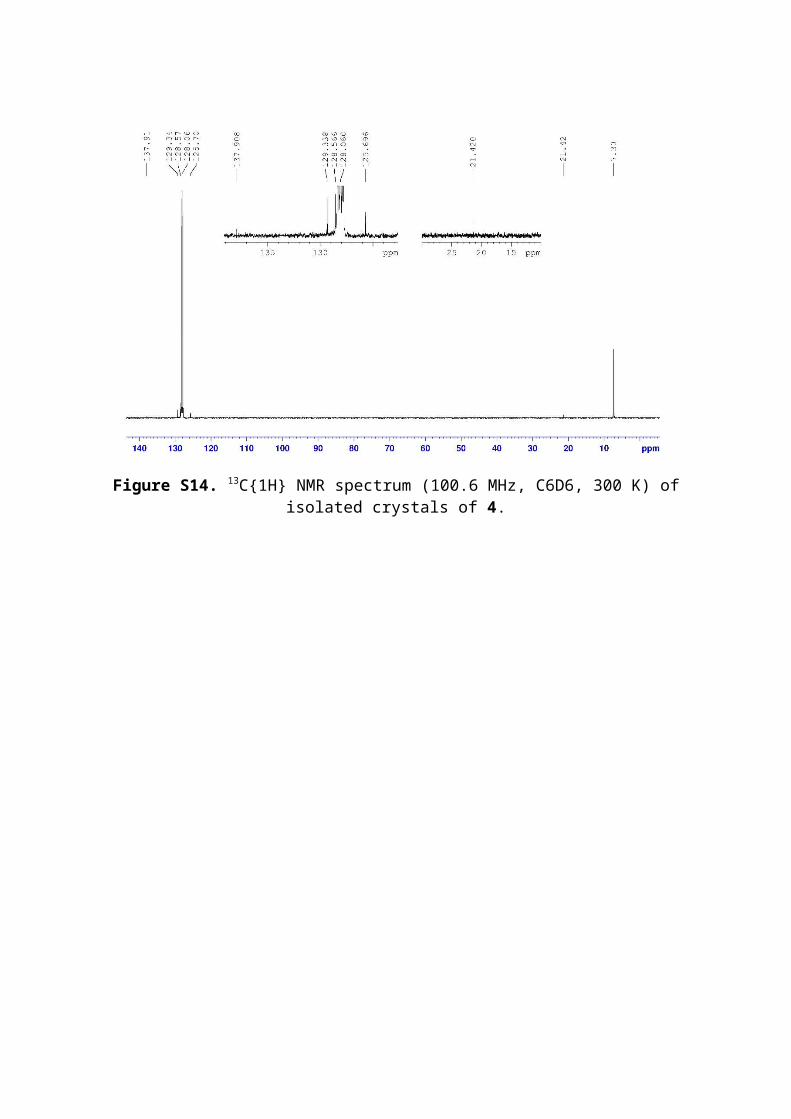
Figure S15. 133Cs NMR (52.5 MHz, C6D6, 300 K) of isolated crystals of 4.
Figure S16. 1H NMR (400.1 MHz, C6D6, 300 K) of isolated crystals of 5.
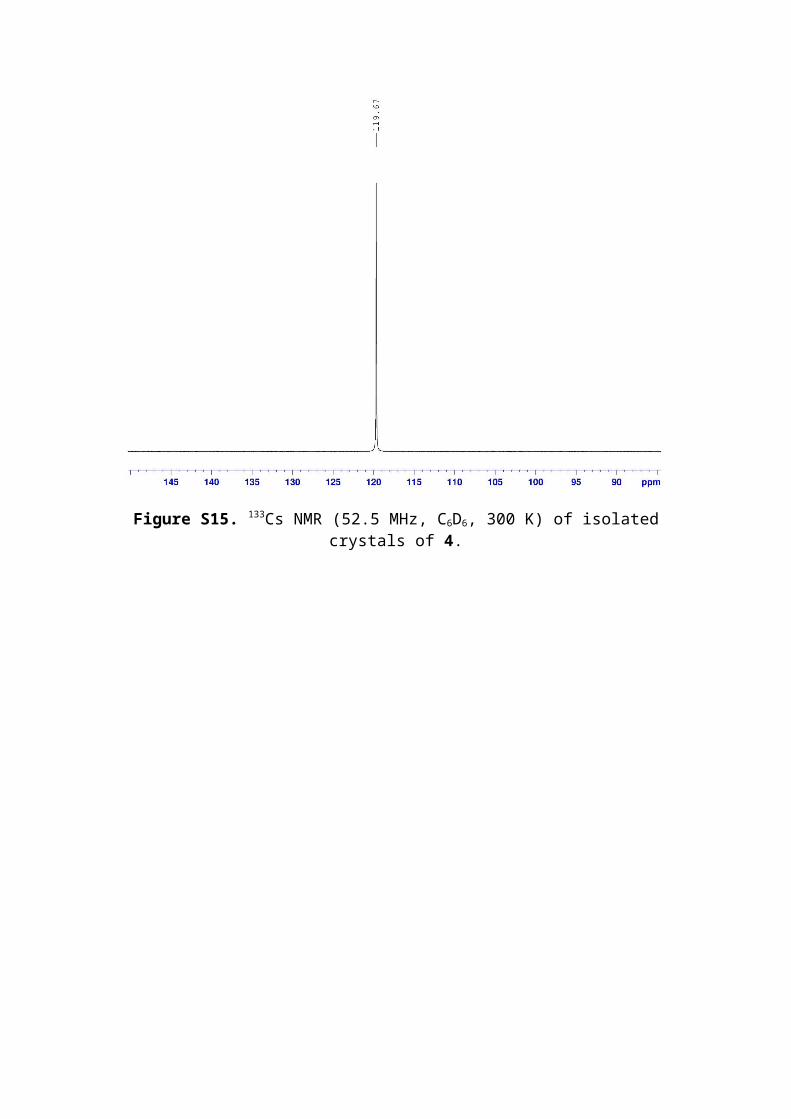
Figure S17. 13C{1H} NMR spectrum (100.6 MHz, C6D6, 300 K) of isolated crystals of 5.
Figure S18. 133Cs NMR (52.5 MHz, C6D6, 300 K) of isolated crystals of 5.
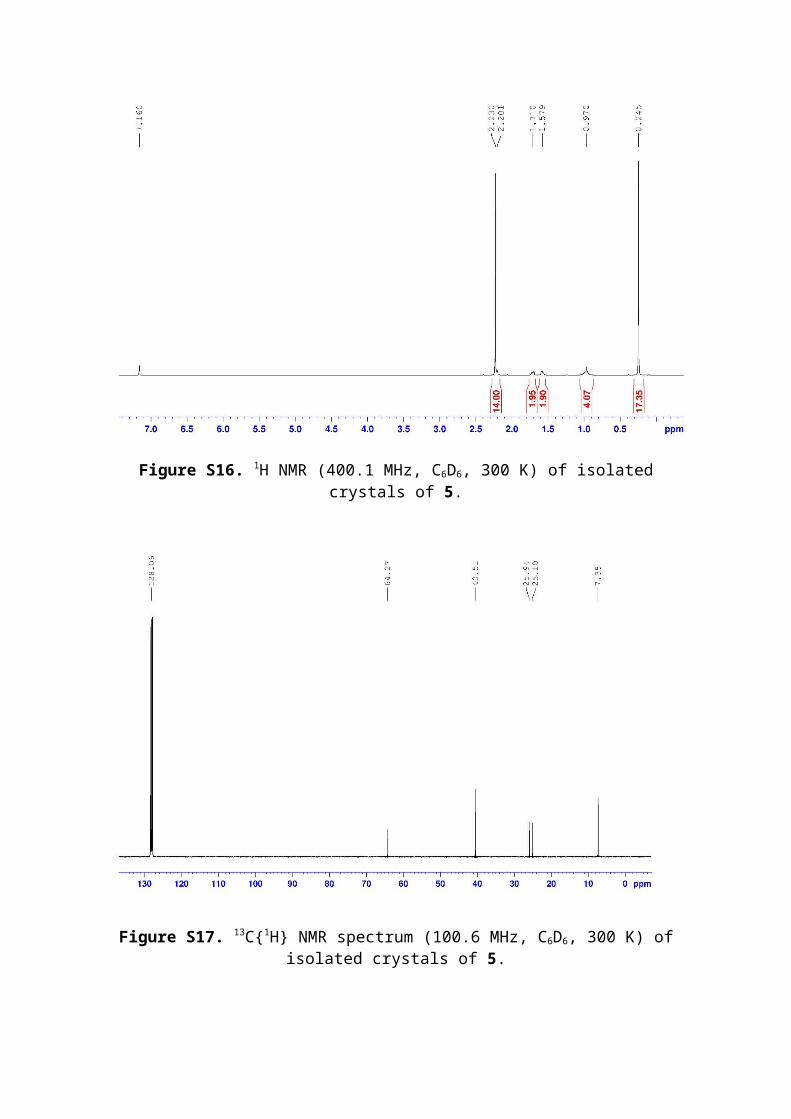
Figure S19. 1H NMR (400.1 MHz, C6D6, 300 K) of isolated crystals of 6.
Figure S20. 13C{1H} NMR spectrum (100.6 MHz, C6D6, 300 K) of isolated crystals of 6.
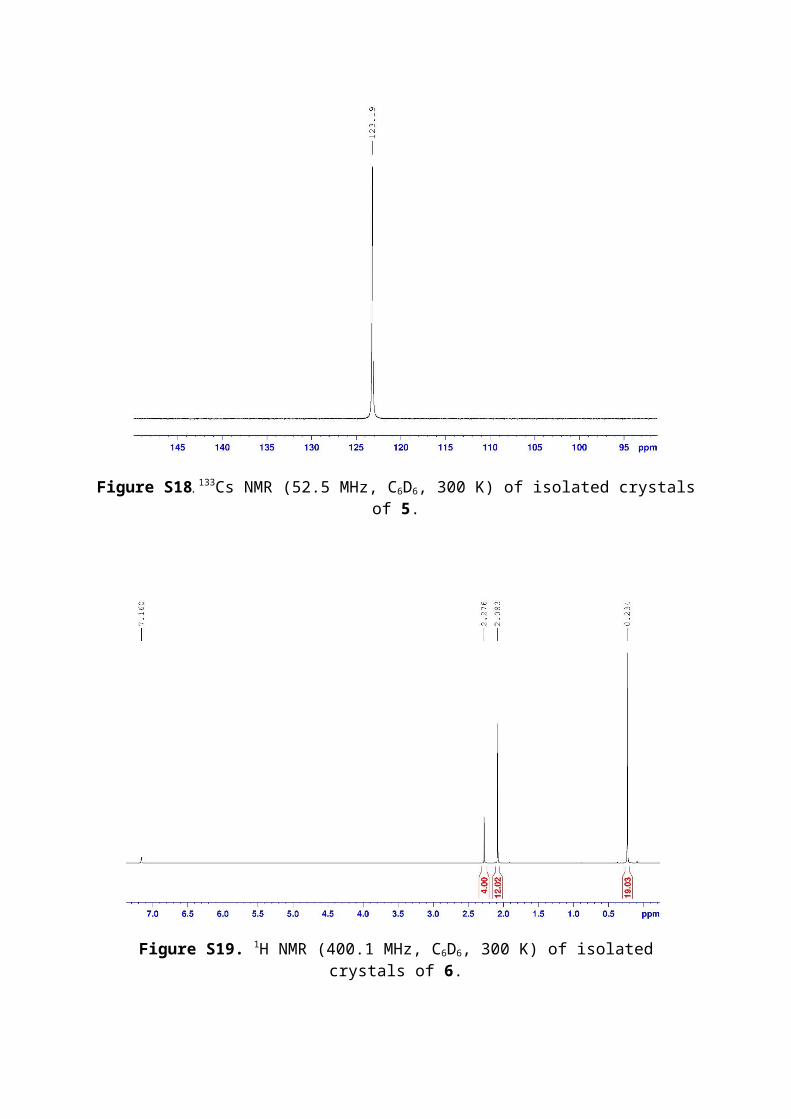
Figure S21. 133Cs NMR (52.5 MHz, C6D6, 300 K) of isolated crystals of 6.
Figure S22. Variable temperature 1H NMR study of a solution of 6 in d8-toluene from 300 K to 203 K, showing coordination of TMEDA to CsHMDS at 203 K.
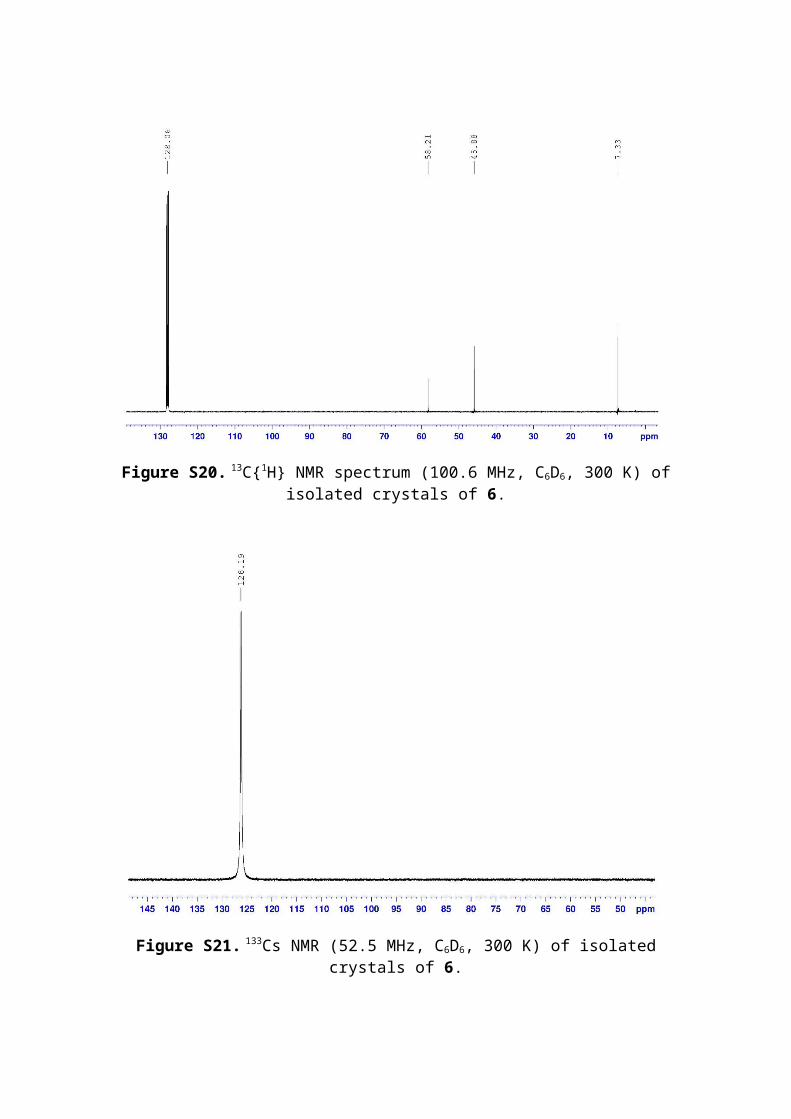
Figure S23. 133Cs NMR (52.5 MHz, d8-tol, 300 K) of isolated crystals of 6.
Figure S24. 133Cs NMR (52.5 MHz, d8-tol, 258 K) of isolated crystals of 6.
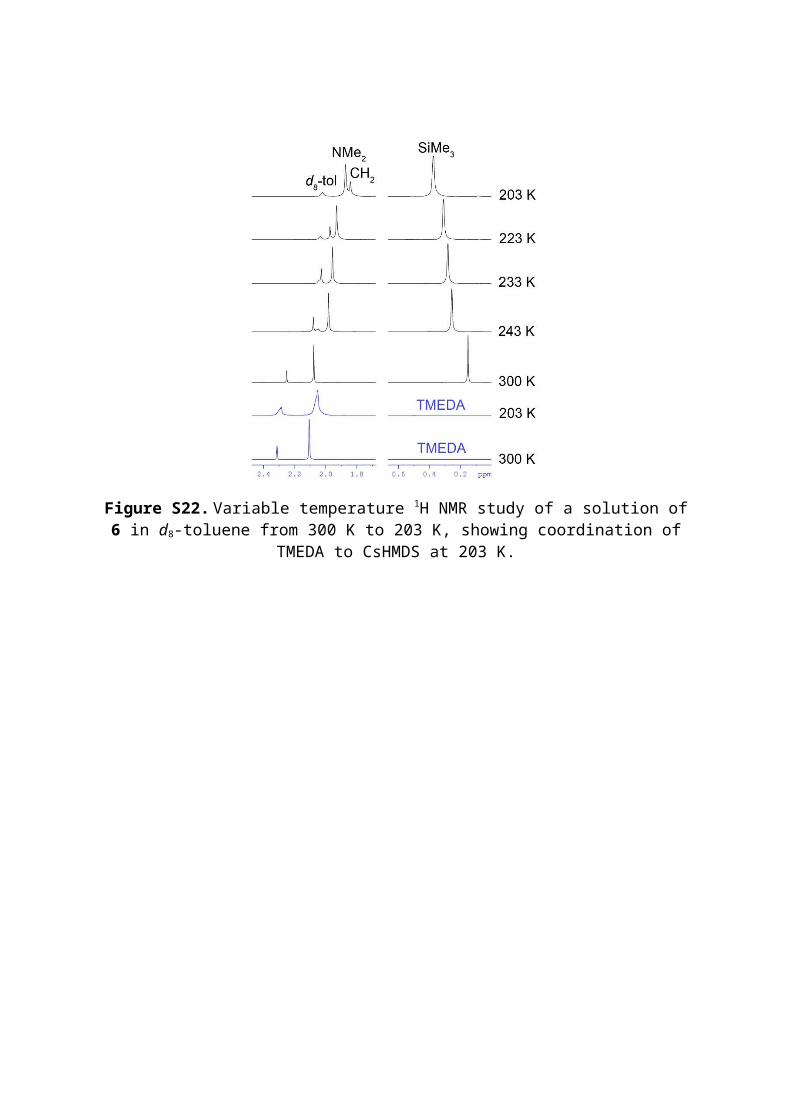
Figure S25. 133Cs NMR (52.5 MHz, d8-tol, 203 K) of isolated crystals of 6.
300 K
243 K
203 K
Figure S26. Variable temperature 1H NMR study of a d8-toluene solution of TMEDA at 300 K, 243 K and 203 K.
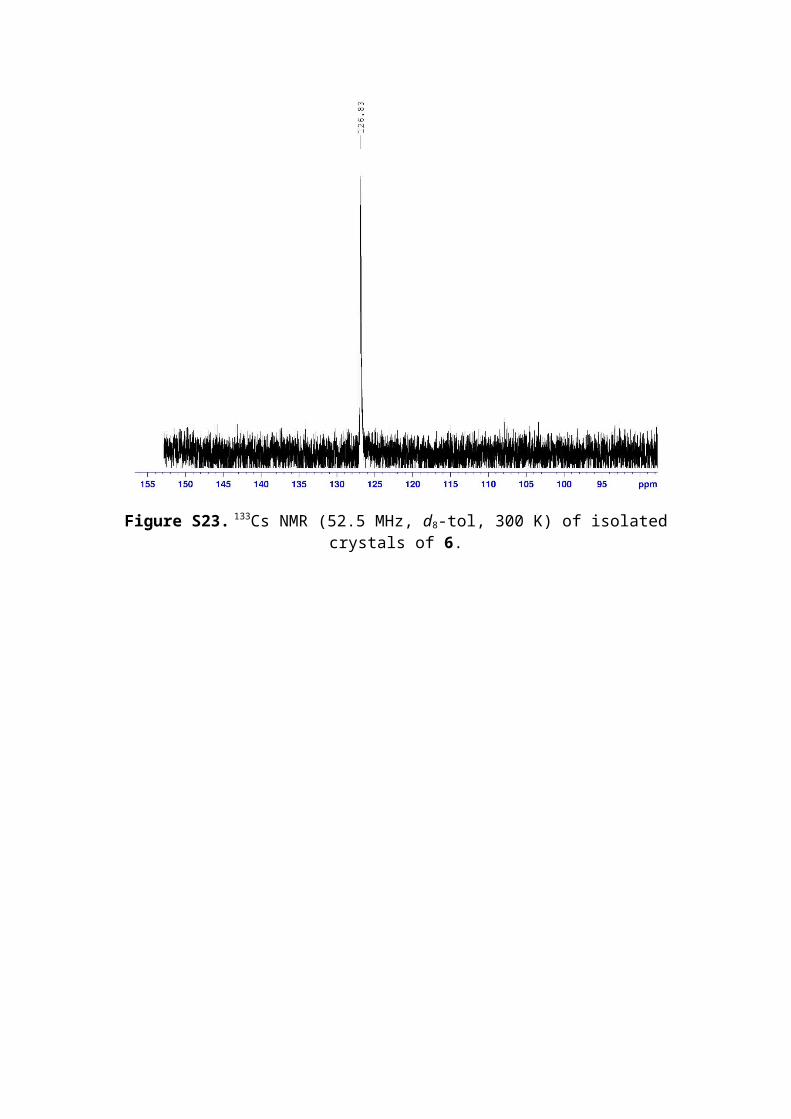
Figure S27. 1H NMR (400.1 MHz, C6D6, 300 K) of isolated crystals of 7.
Figure S28. 13C{1H} NMR spectrum (100.6 MHz, C6D6, 300 K) of isolated crystals of 7.
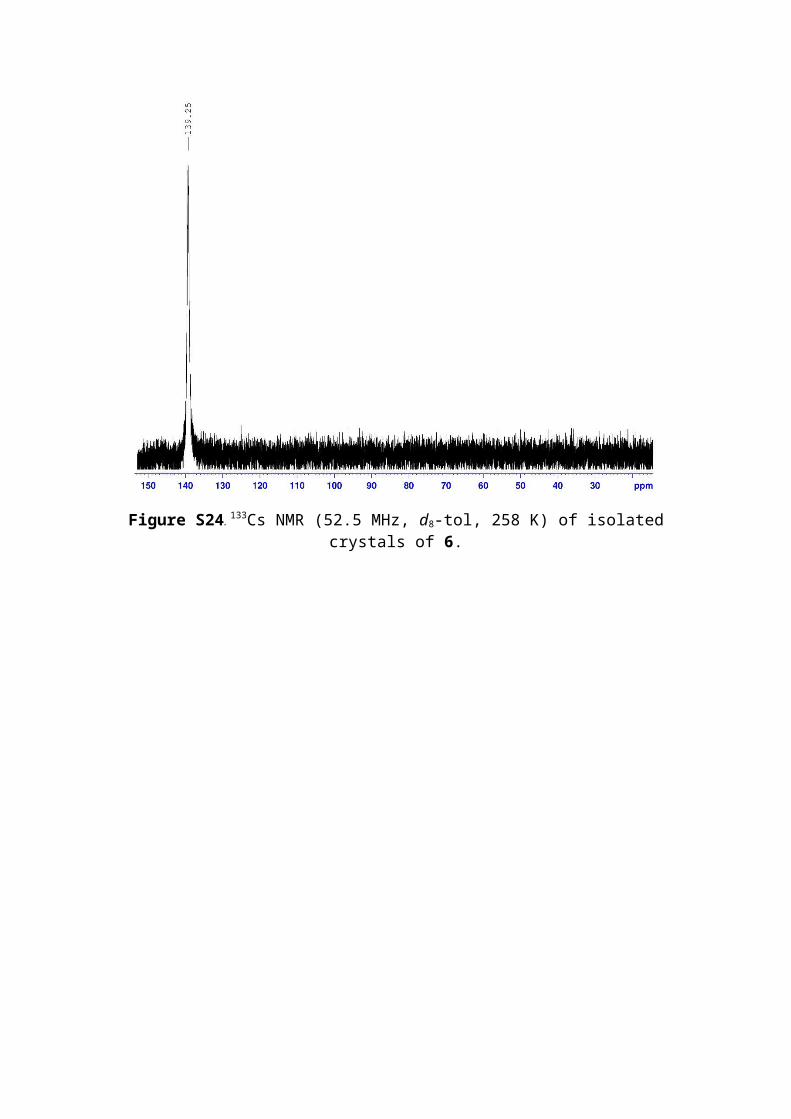
Figure S29. 133Cs NMR (52.5, C6D6, 300 K) of isolated crystals of 7.
Figure S30. 1H NMR (400.1 MHz, C6D6, 300 K) of isolated crystals of 8.
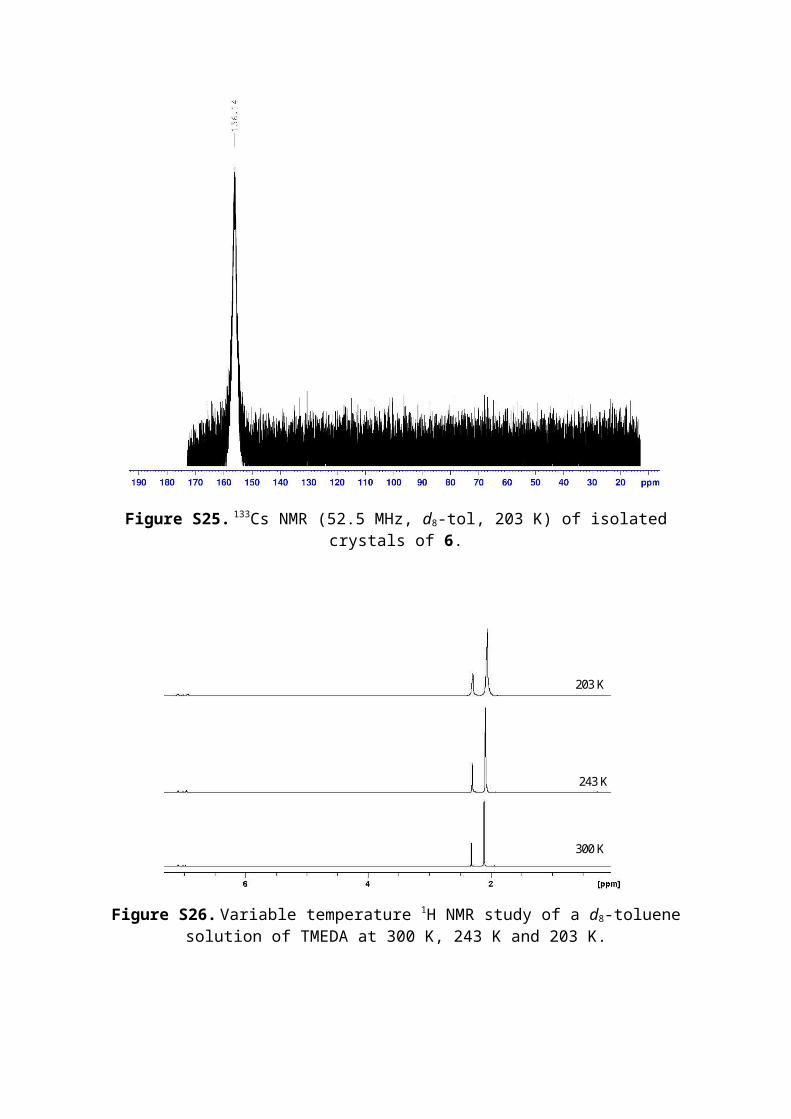
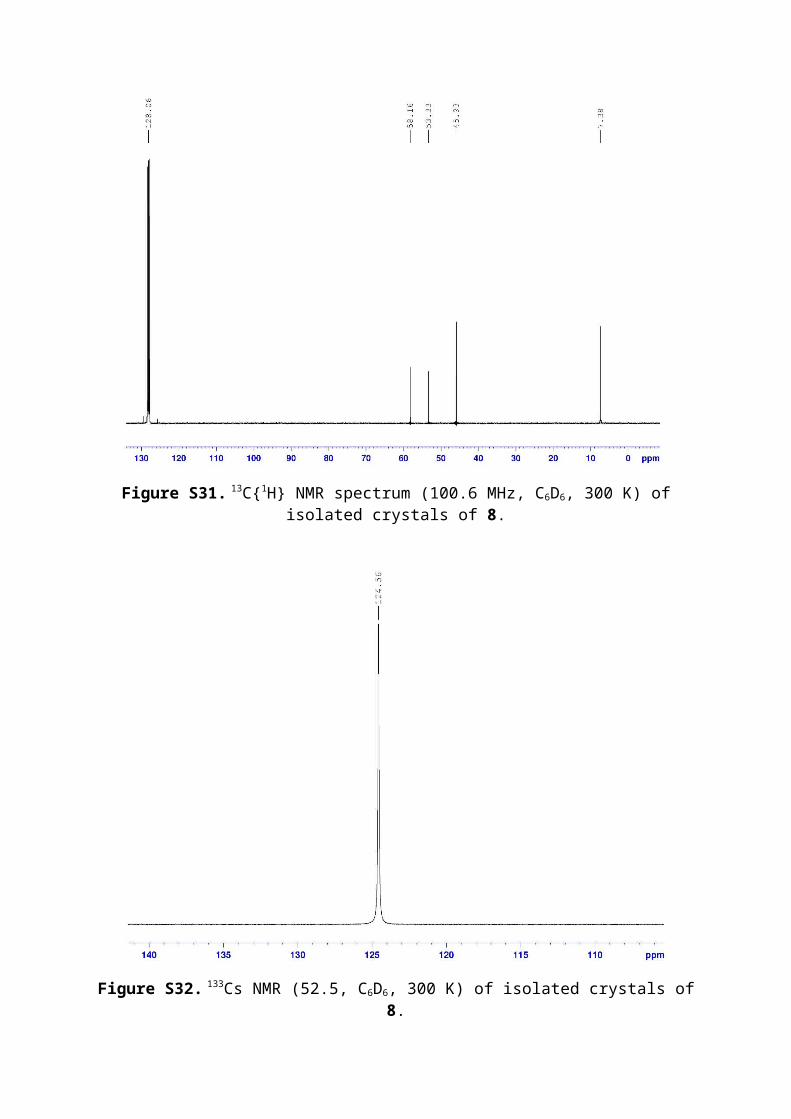
Figure S31. 13C{1H} NMR spectrum (100.6 MHz, C6D6, 300 K) of isolated crystals of 8.
Figure S32. 133Cs NMR (52.5, C6D6, 300 K) of isolated crystals of 8.
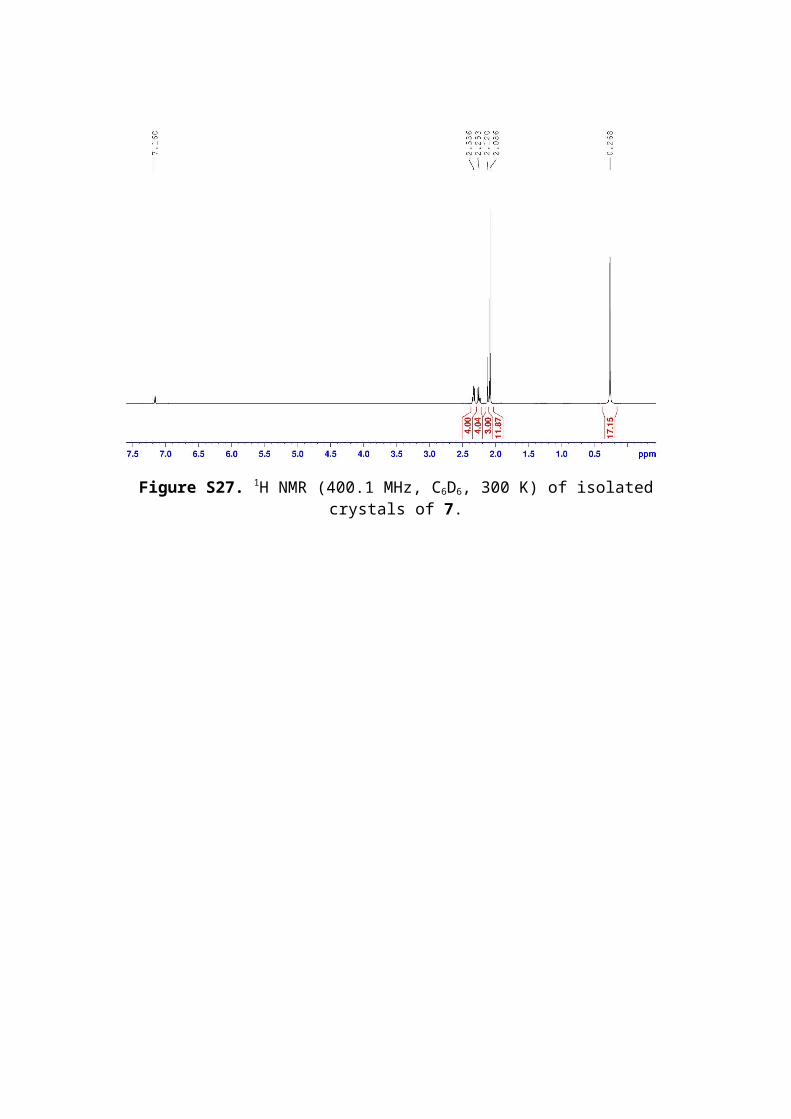
Figure S33. 1H NMR (400.1 MHz, C6D6, 300 K) of isolated crystals of 9.
Figure S34. 13C{1H} NMR spectrum (100.6 MHz, C6D6, 300 K) of isolated crystals of 9.
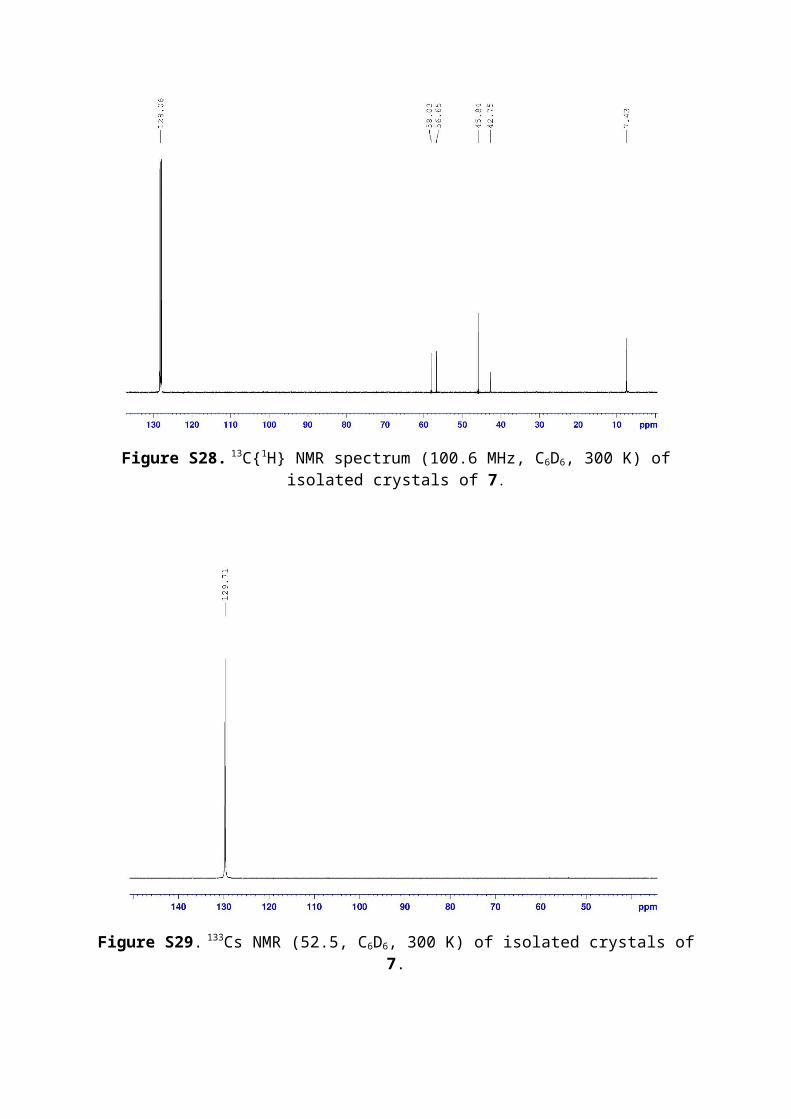
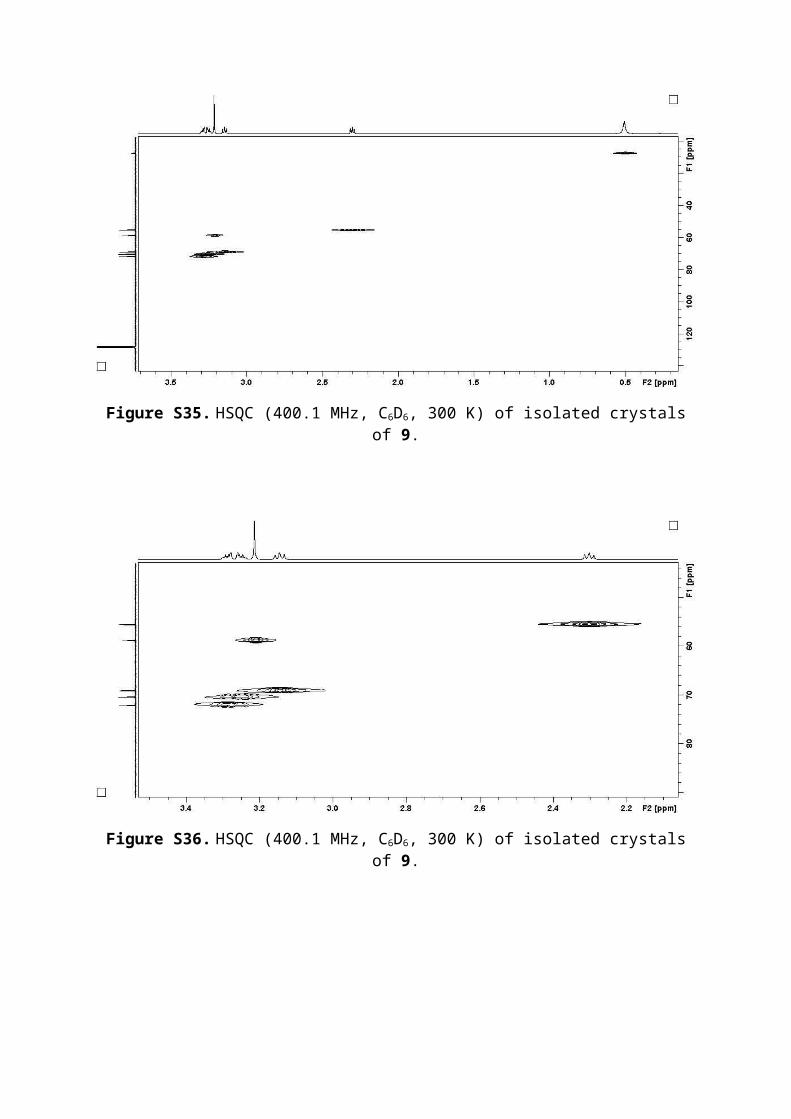
Figure S35. HSQC (400.1 MHz, C6D6, 300 K) of isolated crystals of 9.
Figure S36. HSQC (400.1 MHz, C6D6, 300 K) of isolated crystals of 9.
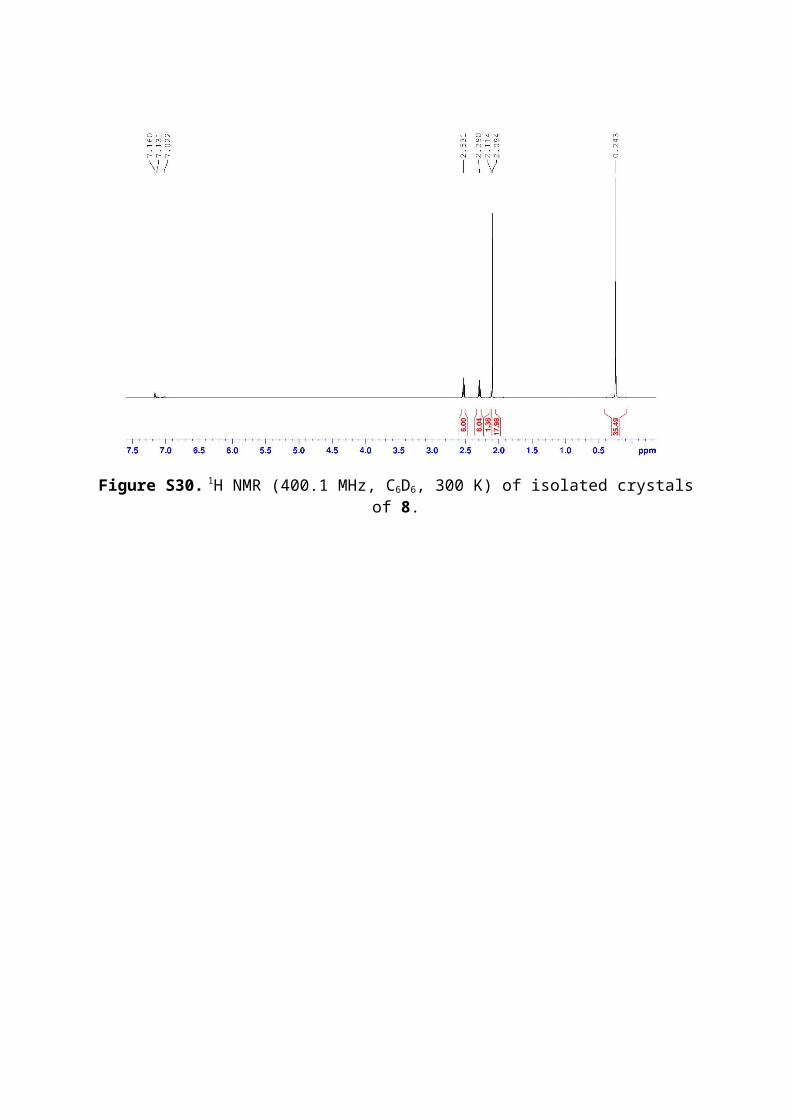
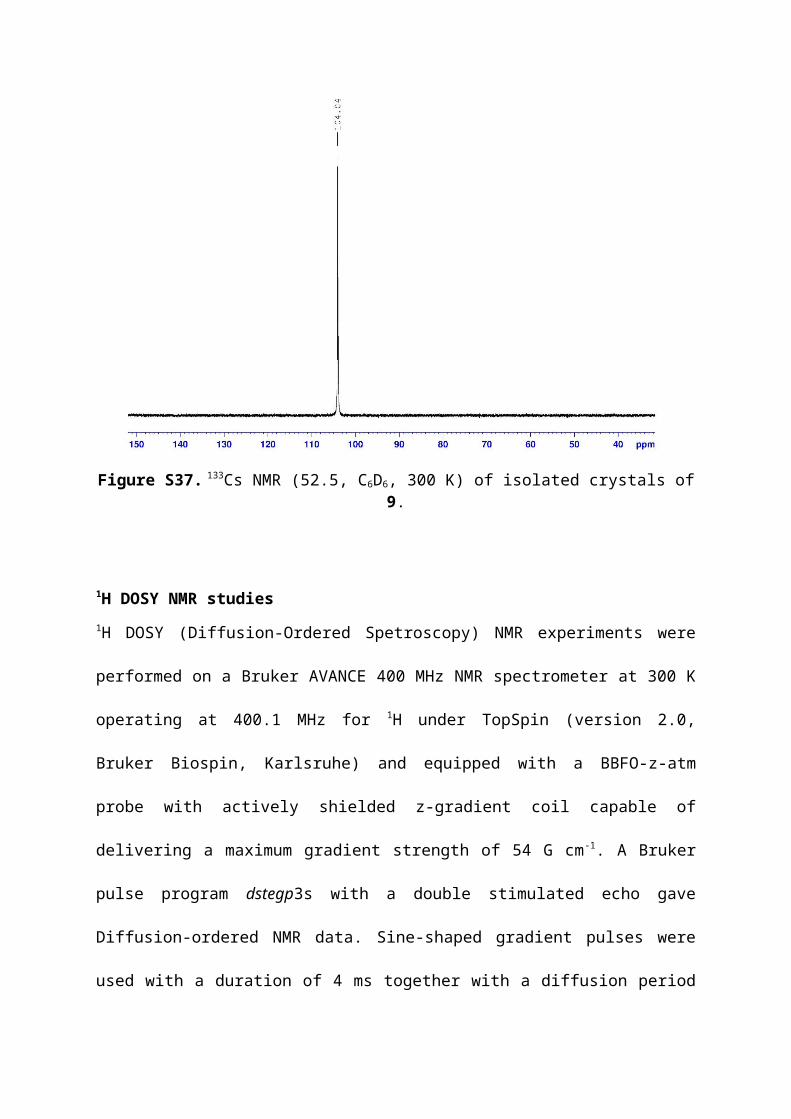
Figure S37. 133Cs NMR (52.5, C6D6, 300 K) of isolated crystals of 9.
1H DOSY NMR studies1H DOSY (Diffusion-Ordered Spetroscopy) NMR experiments were performed on a Bruker
AVANCE 400 MHz NMR spectrometer at 300 K operating at 400.1 MHz for 1H under
TopSpin (version 2.0, Bruker Biospin, Karlsruhe) and equipped with a BBFO-z-atm probe
with actively shielded z-gradient coil capable of delivering a maximum gradient strength of
54 G cm-1. A Bruker pulse program dstegp3s with a double stimulated echo gave Diffusion-
ordered NMR data. Sine-shaped gradient pulses were used with a duration of 4 ms together
with a diffusion period of 100 ms. Gradient recovery delays of 200 μs followed the
application of each gradient pulse. Fourir transformation generates pseudo-2D data by of the
time-domain data. DOSY plot were generated by use of DOSY processing module of
TopSpin. Diffusion coefficients were calculated by fitting intensity data to the Stejskal-
Tanner expression. Accurate Molecular Weight and aggregation state of compounds present
in solution was determine by using external calibration curves with normalized diffusion
coefficients as reported by Stalke.1 The number of species present in solution was obtained by
using the diffusion coefficients for the signals corresponding to the corresponding compound.
Samples preparation for DOSY NMR studies: d8-Toluene solutions of compounds 4, 6, 8
and 9 with a concentration of between 15-50 mM were prepared and added into an NMR tube
containing equimolar amounts of TMS as internal standard to carry out 1H NMR studies
presented herein.
1H DOSY NMR study of 2 in d8-toluene at 300 K
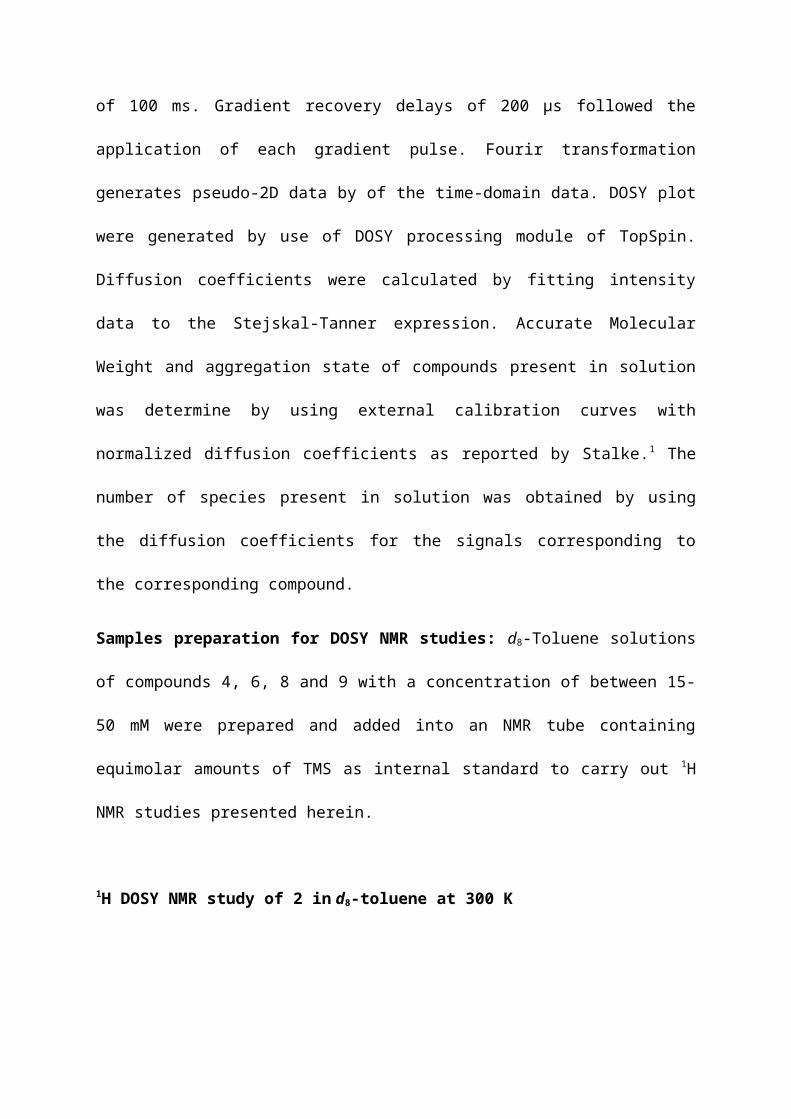
Figure S38. 1H DOSY NMR of 2 in d8-toluene at 300 K.
Dref = Diffusion Coefficient Internal Reference (TMS) [m2/s]
Dx = Diffusion Coefficient Analyte [m2/s]
LogDx,norm = normalized Diffusion Coefficient Analyte
Calculation of logDx,norm allows to estimate MWs of analytes from their diffusion coefficients.
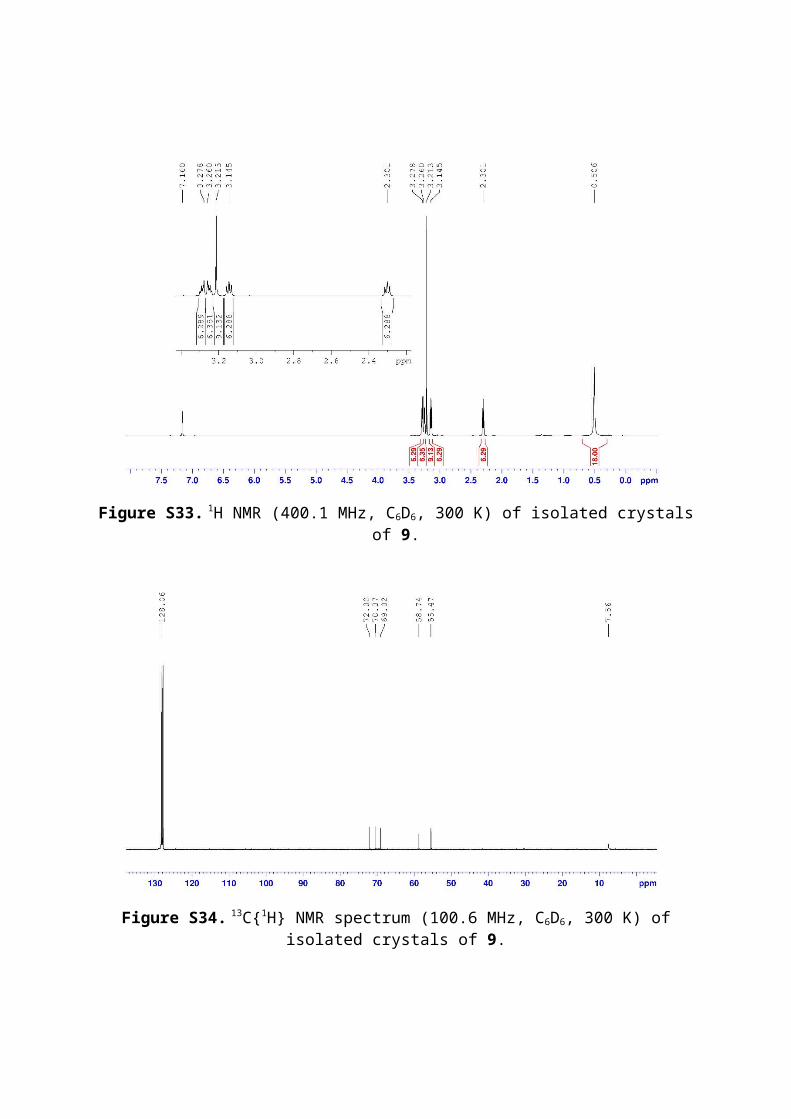
Table S2. Diffusion coefficients for the internal reference (TMS) and for the species present in d8-toluene solution. Calculation of logDx,norm.
Dref TMS (m2s-1) Dx (m2s-1) LogDx,norm
2.149E-9 9.268 E-10 -9.1098
The diffusion coefficient value obtained for 2 in d8-toluene from 1H DOSY NMR study was
compared to the diffusion coefficients of the homometallic species LiHMDS (Table S4) and
CsHMDS (Table S6) in the same deuterated solvent. The diffusion coefficient for 2 appears
in a middle way between the diffusion coefficients obtained from the homometallic
counterparts building 2.
1H DOSY NMR study of 3 in d8-toluene at 300 K
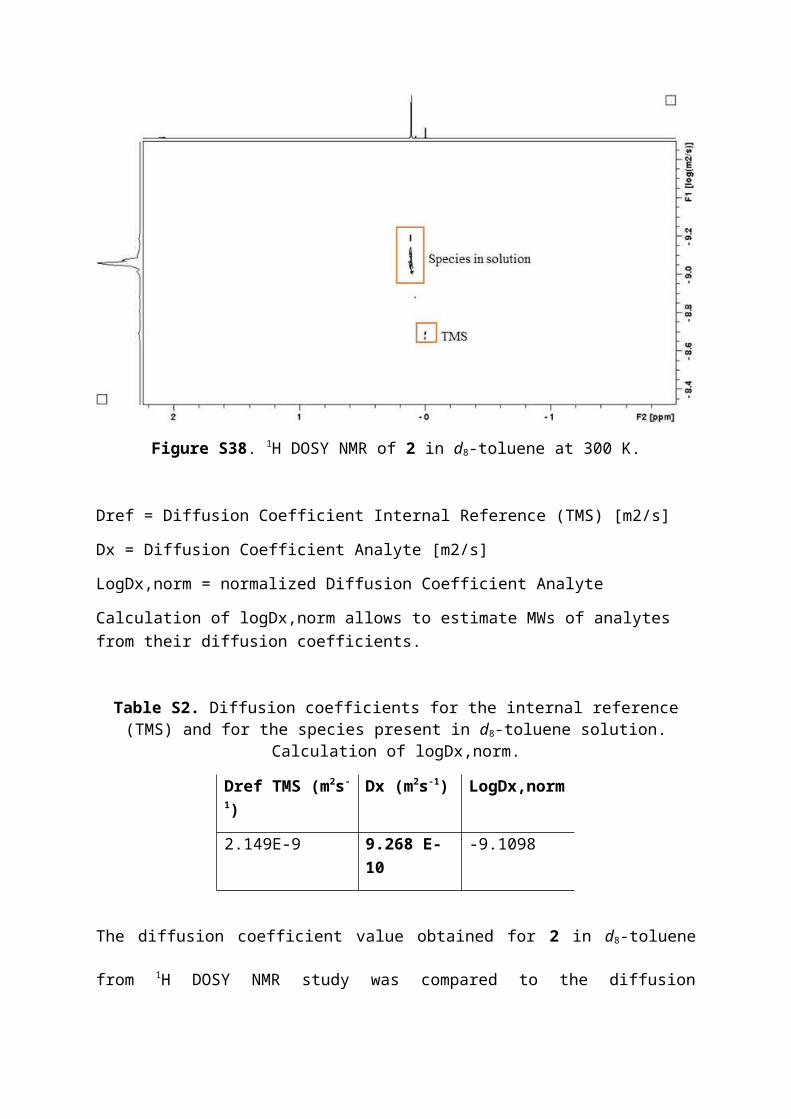
Figure S39. 1H DOSY NMR of 3 in d8-toluene at 300 K
Table S3. Diffusion coefficients for the internal reference (TMS) and for the species present in d8-toluene solution. Calculation of logDx,norm.
Dref TMS (m2s-1) Dx (m2s-1) LogDx,norm
2.016E-9 8.654E-10 -9.1118
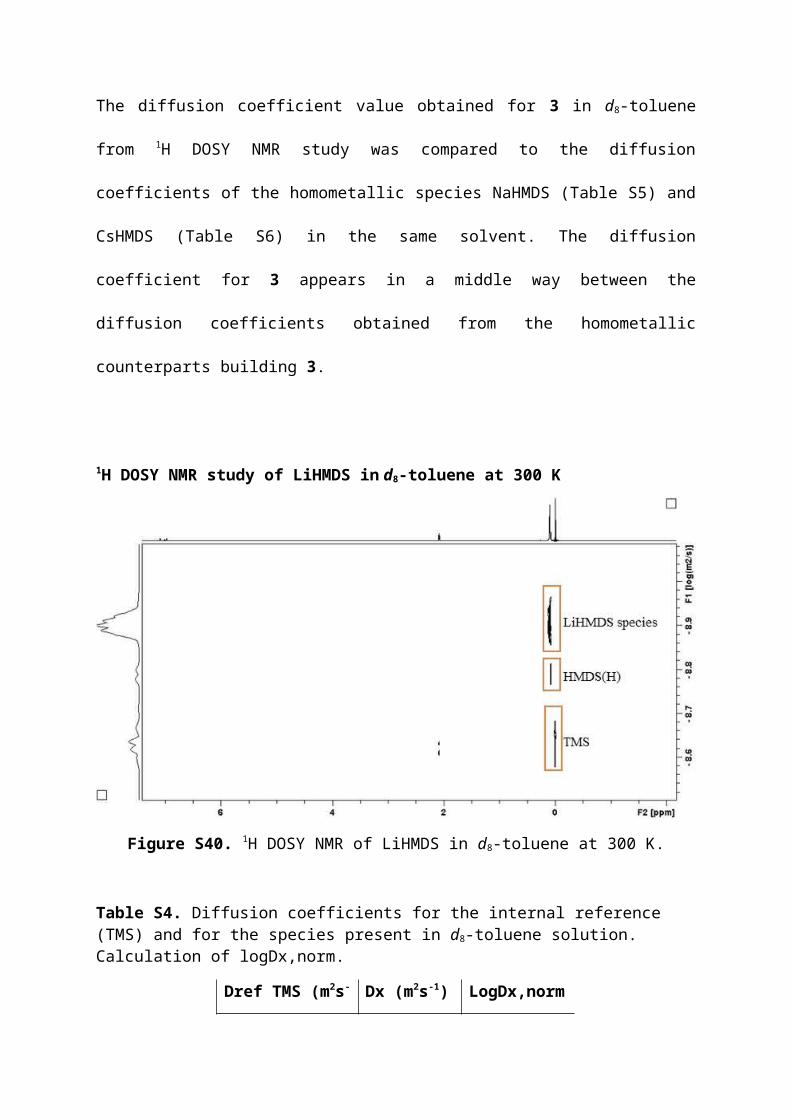
The diffusion coefficient value obtained for 3 in d8-toluene from 1H DOSY NMR study was
compared to the diffusion coefficients of the homometallic species NaHMDS (Table S5) and
CsHMDS (Table S6) in the same solvent. The diffusion coefficient for 3 appears in a middle
way between the diffusion coefficients obtained from the homometallic counterparts building
3.
1H DOSY NMR study of LiHMDS in d8-toluene at 300 K
Figure S40. 1H DOSY NMR of LiHMDS in d8-toluene at 300 K.
Table S4. Diffusion coefficients for the internal reference (TMS) and for the species present in d8-toluene solution. Calculation of logDx,norm.
Dref TMS (m2s-1) Dx (m2s-1) LogDx,norm
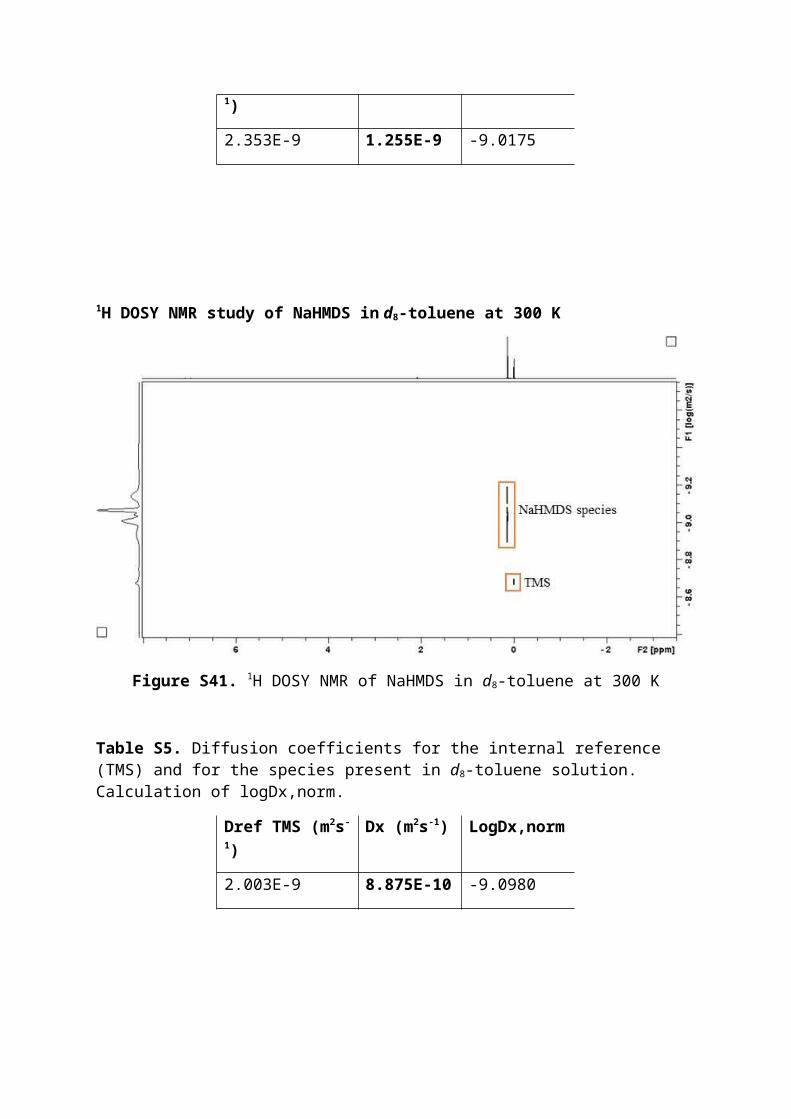
2.353E-9 1.255E-9 -9.0175
1H DOSY NMR study of NaHMDS in d8-toluene at 300 K
Figure S41. 1H DOSY NMR of NaHMDS in d8-toluene at 300 K
Table S5. Diffusion coefficients for the internal reference (TMS) and for the species present in d8-toluene solution. Calculation of logDx,norm.
Dref TMS (m2s-1) Dx (m2s-1) LogDx,norm
2.003E-9 8.875E-10 -9.0980
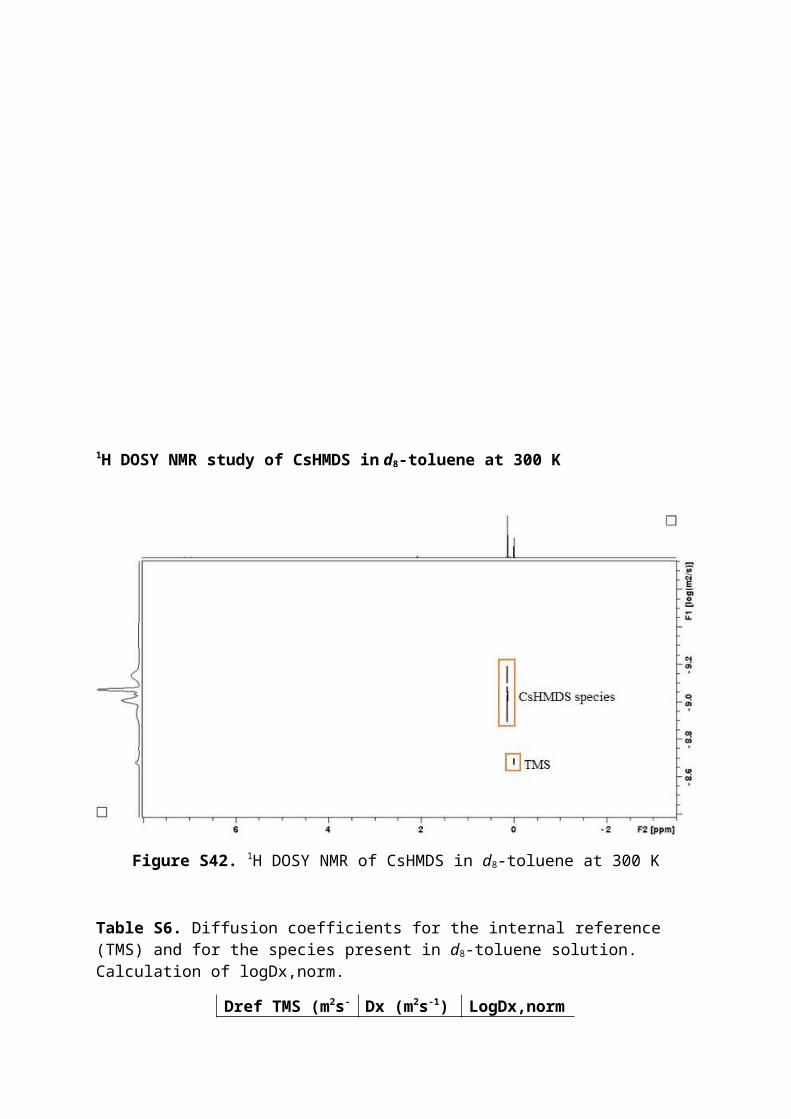
1H DOSY NMR study of CsHMDS in d8-toluene at 300 K
Figure S42. 1H DOSY NMR of CsHMDS in d8-toluene at 300 K
Table S6. Diffusion coefficients for the internal reference (TMS) and for the species present in d8-toluene solution. Calculation of logDx,norm.
Dref TMS (m2s-1) Dx (m2s-1) LogDx,norm
2.097E-9 8.764E-10 -9.1234
1H DOSY NMR study of 6 in d8-toluene at 300 K
Figure S43. 1H DOSY NMR of 6 in d8-toluene at 300 K
Table S7. Diffusion coefficients for the internal reference (TMS) and for the species present in d8-toluene solution. Calculation of logDx,norm.
Dref TMS (m2s-1)
Dx SiMe3
in 6 (m2s-1)Dx
TMEDA in 6 (m2s-1)
Dx 6 (m2s-1)
Dx free TMEDA (m2s-
1)
Dx CsHMDS (m2s-1)
2.178E-9 9.583E-10 1.805E-9 6.11E-10 2.00E-9 8.764E-10
The different values obtained for the diffusion coefficients of the HMDS and TMEDA
ligands in 6 is an indicative that the two moieties are not part of the same molecule in arene
solvents. The expected diffusion coefficient for free TMEDA presents a value of 2.00E-9, a
bigger diffusion coefficient than that obtained for TMEDA in 6 (Dx TMEDA = 1.805E-9). In
this line, the diffusion coefficient for the HMDS group in 6 (Dx SiMe3 = 9.583E-10) is
bigger than the expected diffusion coefficient for 6 (6.11E-10). This result is in agreement
with a competition between the bidentate ligand (TMEDA) and molecules of solvent (d8-
toluene) to coordinate the cesium cation. Thus, the smaller diffusion coefficient obtained for
the TMEDA signal in 6 compared to the expected value for free TMEDA suggests that the
ligand is coordinating to the cesium atom and thus the molecular weight of the species in
solution is higher than that of the free ligand. For the same reason, the higher diffusion
coefficient obtained for the SiMe3 group in 6 compared to the expected for 6, is due to de-
coordination of the ligand from the cesium cation explained by a coordination competition
stablished with the solvent, and giving a species in solution with a smaller molecular weight.
1H DOSY NMR study of 8 in d8-toluene at 300 K
Figure S44. 1H DOSY NMR of 8 in d8-toluene at 300 K
Table S8. Diffusion coefficients for the internal reference (TMS) and for the species present in d8-toluene solution. Calculation of logDx,norm
Dref TMS (m2s-1)
Dx SiMe3 in 6 (m2s-1)
Dx Me6TREN in 6 (m2s-1)
Dx CsHMDS·Me6TREN (m2s-1)
Dx Me6TREN (m2s-1)
2.037E-9 9.038E-10 1.0148E-9 6.92E-10 1.240E-9
The different values obtained for the diffusion coefficients of the HMDS and Me6TREN
ligands conforming 8 is an indicative that the two moieties are not part of the same molecule
in arene solvents. The expected diffusion coefficient for free Me6TREN presents a value of
1.24E-9, a bigger diffusion coefficient than that obtained for Me6TREN in 8 (Dx Me6TREN =
1.014E-9). In this line, the diffusion coefficient for the HMDS group in 8 (Dx SiMe3 =
9.038E-10) is bigger than the expected diffusion coefficient for CsHMDS·Me6TREN
(6.92E-10). This result is in agreement with a competition between the tetradentate ligand
(Me6TREN) and molecules of solvent (d8-toluene) to coordinate the cesium cation. Thus, the
smaller diffusion coefficient obtained for the Me6TREN signal in 8 compared to the expected
value for free Me6TREN suggests that the ligand is coordinating to the cesium atom and thus
the molecular weight of the species in solution is higher than that of the free ligand. For the
same reason, the higher diffusion coefficient obtained for the SiMe3 group in 8 compared to
the expected for 8, is due to de-coordination of the ligand from the cesium cation explained
by a coordination competition stablished with the solvent, and giving a species in solution
with a smaller molecular weight.
1H DOSY NMR study of 9 in d8-toluene at 300 K
Figure S45. 1H DOSY NMR of 9 in d8-toluene at 300 K
Table S9. Diffusion coefficients for the internal reference (TMS) and for the species present in d8-toluene solution. Calculation of logDx,norm
Dref TMS (m2s-1) Dx SiMe3 (m2s-1)
Dx TMEEA (m2s-1) Dx 9 (m2s-1)
Dx free TMEEA
(m2s-1)
2.074E-9 8.755E-10 8.351E-10 6.930E-10 1.030E-9
The different values obtained for the diffusion coefficients of the HMDS and TMEEA
ligands conforming 9 is an indicative that the two moieties are not part of the same molecule
in arene solvents. The expected diffusion coefficient for free TMEEA presents a value of
1.030E-9, a bigger diffusion coefficient than that obtained for TMEEA in 9 (Dx TMEEA =
8.351E-10). In this line, the diffusion coefficient for the HMDS group in 9 (Dx SiMe3 =
8.755E-10) is bigger than the expected diffusion coefficient for 9 (6.93E-10). This result is in
agreement with a competition between the heptadentate ligand (TMEEA) and molecules of
solvent (d8-toluene) to coordinate the cesium cation. Thus, the smaller diffusion coefficient
obtained for the TMEEA signal in 9 compared to the expected value for free TMEEA
suggests that the ligand is coordinating to the cesium atom and thus the molecular weight of
the species in solution is higher than that of the free ligand. For the same reason, the higher
diffusion coefficient obtained for the SiMe3 group in 9 compared to the expected for 9, is due
to de-coordination of the ligand from the cesium cation explained by a coordination
competition stablished with the solvent, and giving a species in solution with a smaller
molecular weight.
References
1. Neufeld, R.; Stalke, D., Chem. Sci. 2015, 6, 3354-3364.


![Metabolomics of Cerebrospinal Fluid from Humans Treated ...containing approximately 5 mmol/L of DSS-d6 [3-(trimethylsilyl)-1-propanesulfonic acid-d6], 0.2% NaN3, in 99.8% D2O to 585](https://img.pdfslide.tips/doc/110x75/606fdac6c261e3030c21e77e/metabolomics-of-cerebrospinal-fluid-from-humans-treated-containing-approximately.jpg)


![Synthese, Struktur und Reaktivität des Lithium [tris … · 2018. 12. 19. · tellanide 1 [tris(trimethylsilyl)silyl]tellane (2), methyl [tris(trimethylsilyl)silyl]tellane (4) and](https://img.pdfslide.tips/doc/110x75/60a9ffe87521f7616c34a4a7/synthese-struktur-und-reaktivitt-des-lithium-tris-2018-12-19-tellanide.jpg)


![Rapport nanoregister, handelsjaar 2016 · Web viewonato(2-) N5,N6,O5,O6]nickel and Silanamine, 1,1,1-trimethyl-N-(trimethylsilyl)-, hydrolysis products with silica. More than 50%](https://img.pdfslide.tips/doc/110x75/60aa95069f41d06db155677b/rapport-nanoregister-handelsjaar-2016-web-view-onato2-n5n6o5o6nickel-and.jpg)