Embed Size (px)
Citation preview
Hindawi Publishing CorporationJournal of Biomedicine and BiotechnologyVolume 2012, Article ID 715928, 10 pagesdoi:10.1155/2012/715928
Research Article
Quantitation of Pyrrole-Imidazole Polyamide inRat Plasma by High-Performance Liquid ChromatographyCoupled with UV Detection
Tomonori Kamei,1 Takahiko Aoyama,1 Chihiro Tanaka,1
Takafumi Nagashima,1 Yukio Aoyama,1 Hiroyuki Hayashi,2 Hiroki Nagase,3
Takahiro Ueno,4 Noboru Fukuda,4 and Yoshiaki Matsumoto1
1 Department of Clinical Pharmacokinetics, School of Pharmacy, Nihon University, 7-7-1 Narashinodai, Chiba,Funabashi City 274-8555, Japan
2 Department of Clinical Pharmacotherapy, School of Pharmacy, Nihon University, 7-7-1 Narashinodai, Chiba,Funabashi City 274-8555, Japan
3 Chiba Cancer Center Research Institute, 666-2, Nitonacho, Chuo-ku, Chiba, Chiba City 260-8717, Japan4 Department of Medicine, School of Medicine, Nihon University, Tokyo 173-8610, Japan
Correspondence should be addressed to Yoshiaki Matsumoto, [email protected]
Received 9 March 2012; Accepted 16 April 2012
Academic Editor: John B. Vincent
Copyright © 2012 Tomonori Kamei et al. This is an open access article distributed under the Creative Commons AttributionLicense, which permits unrestricted use, distribution, and reproduction in any medium, provided the original work is properlycited.
A simple and robust method using high-performance liquid chromatography with UV detection was developed and validatedfor the determination of six pyrrole-imidazole (PI) polyamides (HN.49, TGF-β1f, TGF-β1t, HN.50f, HN.50t, and LOX-1) in ratplasma. After the plasma proteins were precipitated with methanol containing phenacetin as an internal standard, the analytes wereseparated on a Luna C18 (2) (5 μm, 4.6× 150 mm). Calibration curves were linear over the range of 0.5 to 200 μg/mL for HN.49,0.25 to 200 μg/mL for TGF-β1f, TGF-β1t, HN.50t, and LOX-1, 1 to 200 μg/mL for HN.50f in rat plasma. The inter- and intradayprecision were below 15%, and the accuracy was within 15% at the quality controls. The validated method was successfully appliedto sample analysis for the pharmacokinetic study.
1. Introduction
Pyrrole(Py)-imidazole(Im) (PI) polyamides are small syn-thetic molecules composed of aromatic rings of N-meth-ylpyrrole and N-methylimidazole amino acids [1]. Syn-thetic polyamides recognize and bind to specific nucleotidesequences in the minor groove of double-helical DNA withhigh affinity [2]. Various sequence-specific DNA-binding PIpolyamides have been developed to regulate gene expressionby targeting the promoter regions of enhancer and tran-scription factor-binding elements in vitro [3]. PI polyamidetargeting rat transforming growth factor (TGF)-β1 has beenreported to inhibit the expressions of TGF-β1 mRNA andprotein in the renal cortext of Dahl-S rats. The targeted PIpolyamide also reduced glomerulosclerosis and interstitial
fibrosis without side effects. These observations indicate thatPI polyamides will be effective for TGF-β1-related diseases,including progressive renal injury [4, 5]. PI polyamidestargeting human aurora kinase A (AURKA) and B (AURKB)promoters significantly inhibited the promoter activities,and mRNA and protein expression levels of AURKA andAURKB. They also demonstrated a marked antiproliferativesynergy in human tumor cell lines as a result of inductionof apoptosis-mediated severe catastrophe of cell-cycle pro-gression [6]. PI polyamides specifically inhibited lectin-likeoxidized low-density lipoprotein receptor-1 mRNA expres-sion and apoptosis induced by oxidized low-density lipopro-tein and angiotensin II in human umbilical vein endothelialcells [7]. PI polyamide that targets the activator protein-1-binding site of the matrix metalloproteinase (MMP)-9
2 Journal of Biomedicine and Biotechnology
N
N
N
NO
O N
O
N
O
N
N
N
NO
N
N
O
N
ON
O
O
N
O
NN
N
N
N
NN
O
O
N
O
N
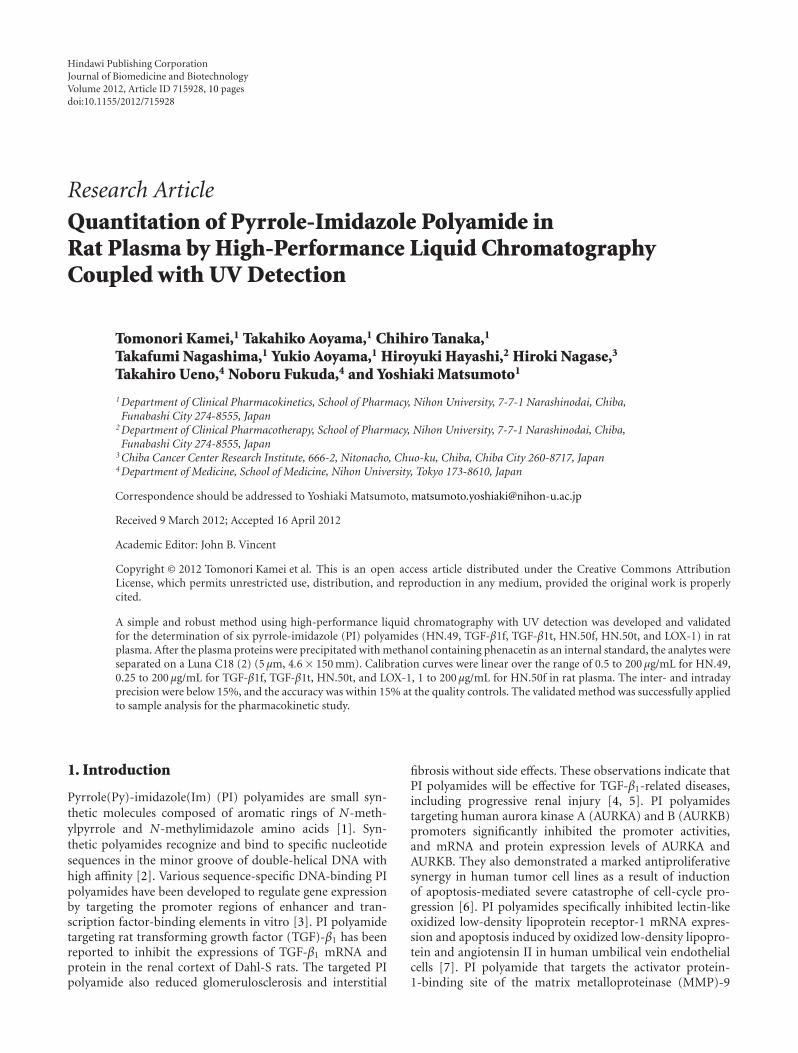
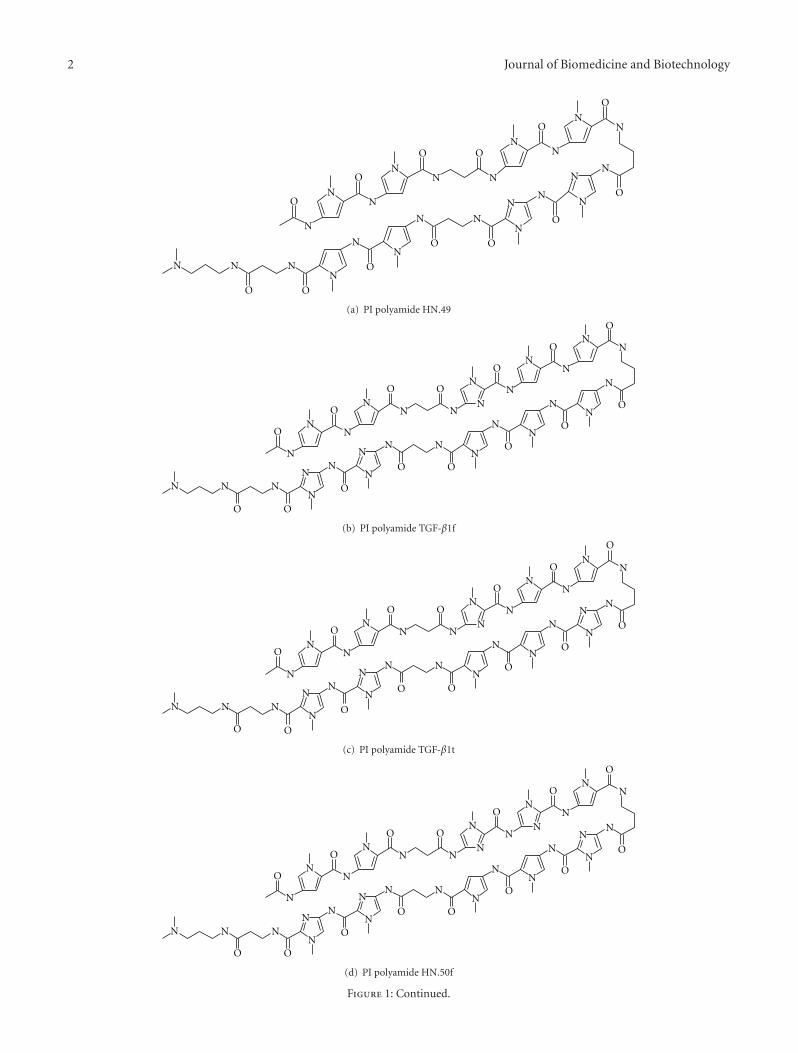
(a) PI polyamide HN.49
N
N
N
N
N
N
N
N
N
N
NN
N
NNN
O O
O O
O
O
O
O
N
N
N
N
N
N
N
N
N N
N
N
N
O
O
O
OO
O
O
(b) PI polyamide TGF-β1f
N
N
N
N
N
N
N
N
N
N
N
NN
N
NNN
O O
O O
O
O
O
O
N
N
N
N
N
N
N
N
N N
N
N
N
O
O
O
OO
O
O
(c) PI polyamide TGF-β1t
N
N
N
N
N
N
N
N
N
N
N
N
N
N
N
N
NO
O N
O
N
O
O
N
N
O
O
N
O
N
O
N
O
N
N
O
N
ON
O
O
N
O
NN
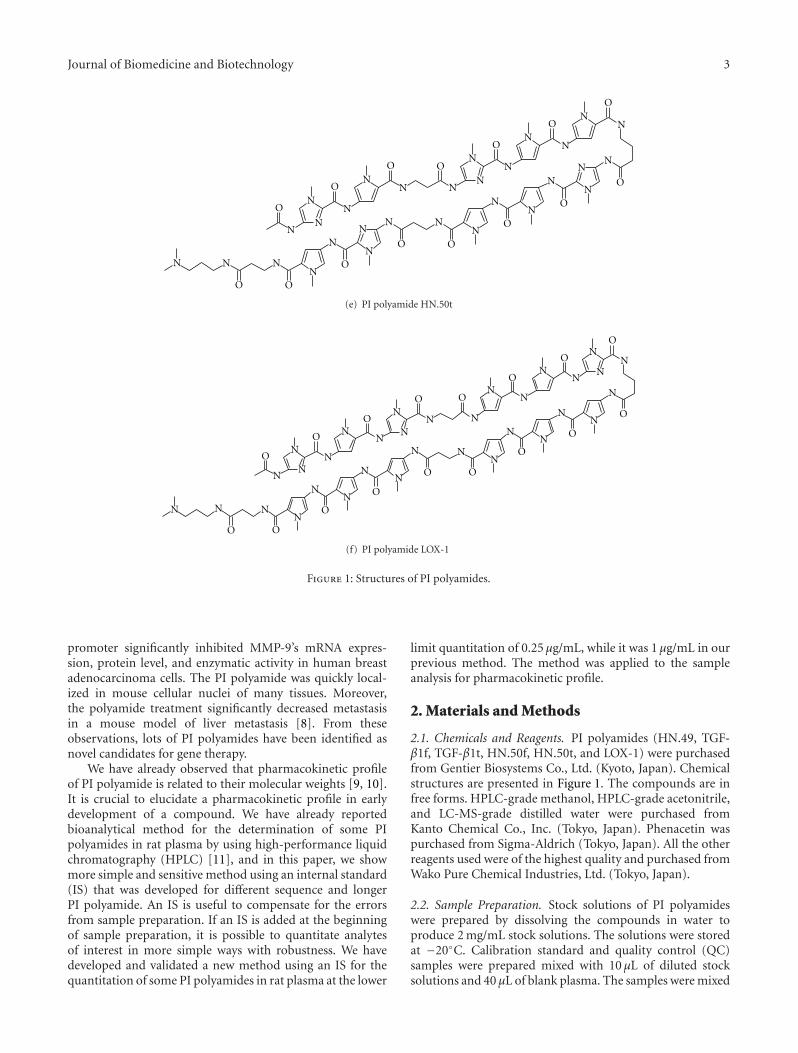
(d) PI polyamide HN.50f
Figure 1: Continued.
Journal of Biomedicine and Biotechnology 3
N
N
N
N
N
N
N
N
N
N
N
N
N
N
N
NO
O N
O
N
O
O
N
N
O
O
N
O
N
O
N
O
N
N
O
N
ON
O
O
N
O
NN
(e) PI polyamide HN.50t
N
N
N
N
O N
N
O
ON
NN
O
N
ON
N
ON
N
ON
N
N
N
O
O
N
N
N
N
O
O
NN
OO
N
N
N
N
N
O
O
NN
OO
NN
(f) PI polyamide LOX-1
Figure 1: Structures of PI polyamides.
promoter significantly inhibited MMP-9’s mRNA expres-sion, protein level, and enzymatic activity in human breastadenocarcinoma cells. The PI polyamide was quickly local-ized in mouse cellular nuclei of many tissues. Moreover,the polyamide treatment significantly decreased metastasisin a mouse model of liver metastasis [8]. From theseobservations, lots of PI polyamides have been identified asnovel candidates for gene therapy.
We have already observed that pharmacokinetic profileof PI polyamide is related to their molecular weights [9, 10].It is crucial to elucidate a pharmacokinetic profile in earlydevelopment of a compound. We have already reportedbioanalytical method for the determination of some PIpolyamides in rat plasma by using high-performance liquidchromatography (HPLC) [11], and in this paper, we showmore simple and sensitive method using an internal standard(IS) that was developed for different sequence and longerPI polyamide. An IS is useful to compensate for the errorsfrom sample preparation. If an IS is added at the beginningof sample preparation, it is possible to quantitate analytesof interest in more simple ways with robustness. We havedeveloped and validated a new method using an IS for thequantitation of some PI polyamides in rat plasma at the lower
limit quantitation of 0.25 μg/mL, while it was 1 μg/mL in ourprevious method. The method was applied to the sampleanalysis for pharmacokinetic profile.
2. Materials and Methods
2.1. Chemicals and Reagents. PI polyamides (HN.49, TGF-β1f, TGF-β1t, HN.50f, HN.50t, and LOX-1) were purchasedfrom Gentier Biosystems Co., Ltd. (Kyoto, Japan). Chemicalstructures are presented in Figure 1. The compounds are infree forms. HPLC-grade methanol, HPLC-grade acetonitrile,and LC-MS-grade distilled water were purchased fromKanto Chemical Co., Inc. (Tokyo, Japan). Phenacetin waspurchased from Sigma-Aldrich (Tokyo, Japan). All the otherreagents used were of the highest quality and purchased fromWako Pure Chemical Industries, Ltd. (Tokyo, Japan).
2.2. Sample Preparation. Stock solutions of PI polyamideswere prepared by dissolving the compounds in water toproduce 2 mg/mL stock solutions. The solutions were storedat −20◦C. Calibration standard and quality control (QC)samples were prepared mixed with 10 μL of diluted stocksolutions and 40 μL of blank plasma. The samples were mixed
4 Journal of Biomedicine and Biotechnology
0
5000
10000
15000
20000
25000
30000
0 5 10 15
Time (min)
(mV
)Phenacetin
−50002.5 7.5 12.5
(a) Phenacetin
Phenacetin
HN.49
0
5000
10000
15000
20000
25000
30000
0 5 10 15
Time (min)
(mV
)
−50002.5 7.5 12.5
(b) Phenacetin+HN.49
Phenacetin
0
5000
10000
15000
20000
25000
30000
0 5 10 15
Time (min)
(mV
)
−50002.5 7.5 12.5
TGF-β1f
(c) Phenacetin+TGF-β 1f
Phenacetin
TGF-β1t
0
5000
10000
15000
20000
25000
30000
0 5 10 15
Time (min)
(mV
)
−50002.5 7.5 12.5
(d) Phenacetin+TGF-β1t
Phenacetin
HN.50f
0
5000
10000
15000
20000
25000
30000
0 5 10 15
Time (min)
(mV
)
−50002.5 7.5 12.5
(e) Phenacetin+HN.50f
Phenacetin
HN.50t
0
5000
10000
15000
20000
25000
30000
0 5 10 15
Time (min)
(mV
)
−50002.5 7.5 12.5
(f) Phenacetin+HN.50t
Figure 2: Continued.
Journal of Biomedicine and Biotechnology 5
Phenacetin
LOX-1
0
5000
10000
15000
20000
25000
30000
0 5 10 15
Time (min)
(mV
)
−50002.5 7.5 12.5
(g) Phenacetin+LOX-1
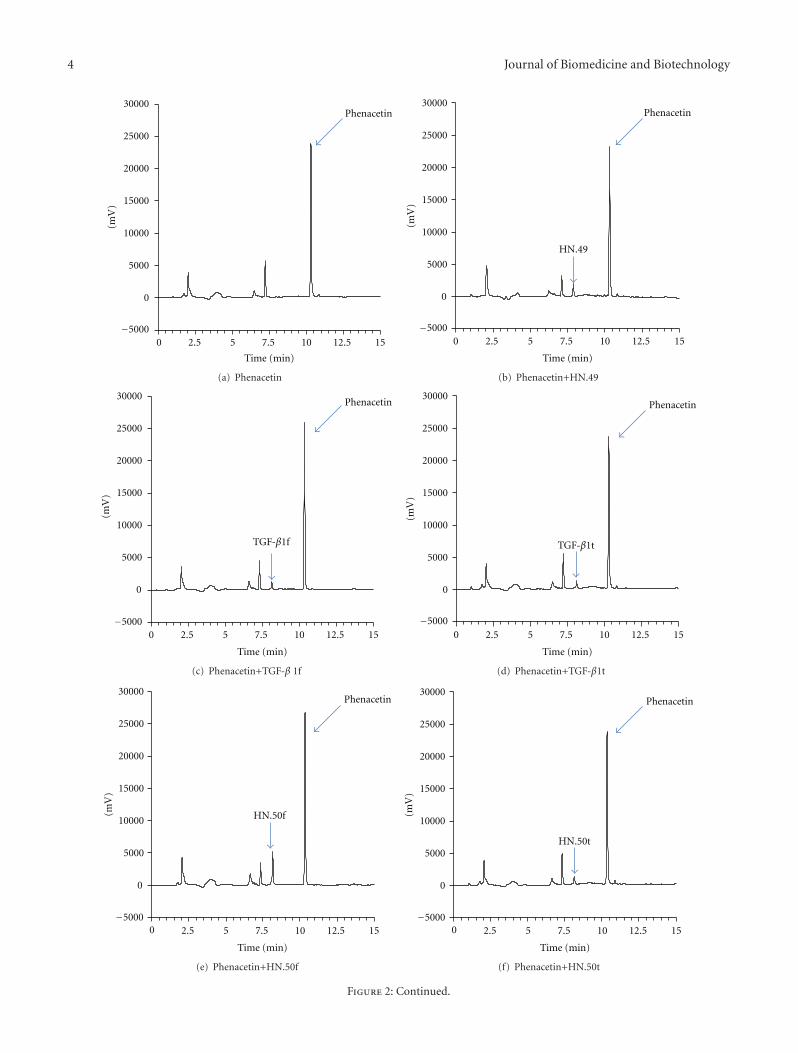
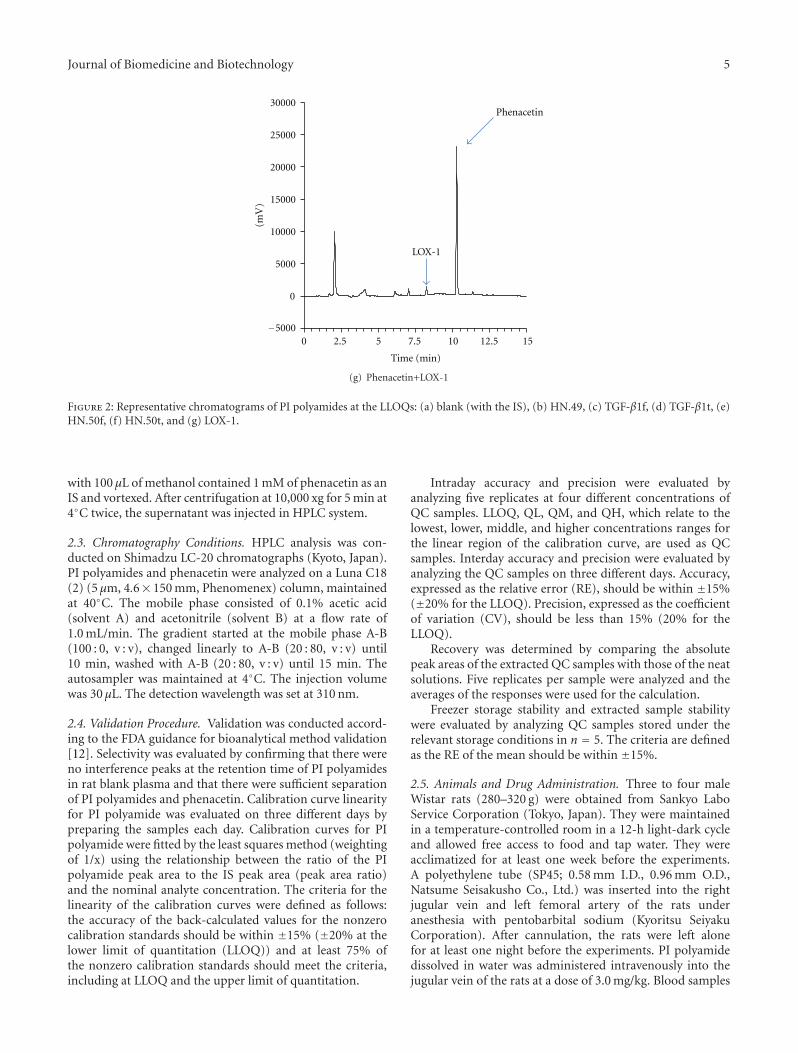
Figure 2: Representative chromatograms of PI polyamides at the LLOQs: (a) blank (with the IS), (b) HN.49, (c) TGF-β1f, (d) TGF-β1t, (e)HN.50f, (f) HN.50t, and (g) LOX-1.
with 100 μL of methanol contained 1 mM of phenacetin as anIS and vortexed. After centrifugation at 10,000 xg for 5 min at4◦C twice, the supernatant was injected in HPLC system.
2.3. Chromatography Conditions. HPLC analysis was con-ducted on Shimadzu LC-20 chromatographs (Kyoto, Japan).PI polyamides and phenacetin were analyzed on a Luna C18(2) (5 μm, 4.6× 150 mm, Phenomenex) column, maintainedat 40◦C. The mobile phase consisted of 0.1% acetic acid(solvent A) and acetonitrile (solvent B) at a flow rate of1.0 mL/min. The gradient started at the mobile phase A-B(100 : 0, v : v), changed linearly to A-B (20 : 80, v : v) until10 min, washed with A-B (20 : 80, v : v) until 15 min. Theautosampler was maintained at 4◦C. The injection volumewas 30 μL. The detection wavelength was set at 310 nm.
2.4. Validation Procedure. Validation was conducted accord-ing to the FDA guidance for bioanalytical method validation[12]. Selectivity was evaluated by confirming that there wereno interference peaks at the retention time of PI polyamidesin rat blank plasma and that there were sufficient separationof PI polyamides and phenacetin. Calibration curve linearityfor PI polyamide was evaluated on three different days bypreparing the samples each day. Calibration curves for PIpolyamide were fitted by the least squares method (weightingof 1/x) using the relationship between the ratio of the PIpolyamide peak area to the IS peak area (peak area ratio)and the nominal analyte concentration. The criteria for thelinearity of the calibration curves were defined as follows:the accuracy of the back-calculated values for the nonzerocalibration standards should be within ±15% (±20% at thelower limit of quantitation (LLOQ)) and at least 75% ofthe nonzero calibration standards should meet the criteria,including at LLOQ and the upper limit of quantitation.
Intraday accuracy and precision were evaluated byanalyzing five replicates at four different concentrations ofQC samples. LLOQ, QL, QM, and QH, which relate to thelowest, lower, middle, and higher concentrations ranges forthe linear region of the calibration curve, are used as QCsamples. Interday accuracy and precision were evaluated byanalyzing the QC samples on three different days. Accuracy,expressed as the relative error (RE), should be within ±15%(±20% for the LLOQ). Precision, expressed as the coefficientof variation (CV), should be less than 15% (20% for theLLOQ).
Recovery was determined by comparing the absolutepeak areas of the extracted QC samples with those of the neatsolutions. Five replicates per sample were analyzed and theaverages of the responses were used for the calculation.
Freezer storage stability and extracted sample stabilitywere evaluated by analyzing QC samples stored under therelevant storage conditions in n = 5. The criteria are definedas the RE of the mean should be within ±15%.
2.5. Animals and Drug Administration. Three to four maleWistar rats (280–320 g) were obtained from Sankyo LaboService Corporation (Tokyo, Japan). They were maintainedin a temperature-controlled room in a 12-h light-dark cycleand allowed free access to food and tap water. They wereacclimatized for at least one week before the experiments.A polyethylene tube (SP45; 0.58 mm I.D., 0.96 mm O.D.,Natsume Seisakusho Co., Ltd.) was inserted into the rightjugular vein and left femoral artery of the rats underanesthesia with pentobarbital sodium (Kyoritsu SeiyakuCorporation). After cannulation, the rats were left alonefor at least one night before the experiments. PI polyamidedissolved in water was administered intravenously into thejugular vein of the rats at a dose of 3.0 mg/kg. Blood samples
6 Journal of Biomedicine and Biotechnology
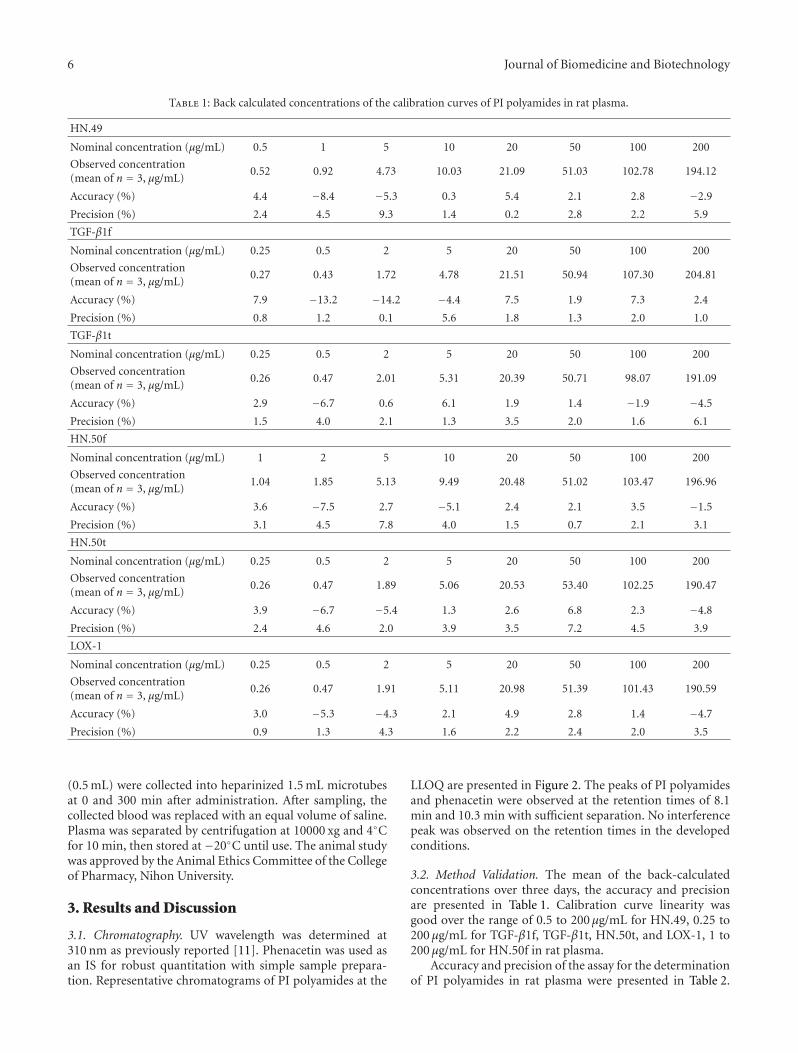
Table 1: Back calculated concentrations of the calibration curves of PI polyamides in rat plasma.
HN.49
Nominal concentration (μg/mL) 0.5 1 5 10 20 50 100 200
Observed concentration(mean of n = 3, μg/mL)
0.52 0.92 4.73 10.03 21.09 51.03 102.78 194.12
Accuracy (%) 4.4 −8.4 −5.3 0.3 5.4 2.1 2.8 −2.9
Precision (%) 2.4 4.5 9.3 1.4 0.2 2.8 2.2 5.9
TGF-β1f
Nominal concentration (μg/mL) 0.25 0.5 2 5 20 50 100 200
Observed concentration(mean of n = 3, μg/mL)
0.27 0.43 1.72 4.78 21.51 50.94 107.30 204.81
Accuracy (%) 7.9 −13.2 −14.2 −4.4 7.5 1.9 7.3 2.4
Precision (%) 0.8 1.2 0.1 5.6 1.8 1.3 2.0 1.0
TGF-β1t
Nominal concentration (μg/mL) 0.25 0.5 2 5 20 50 100 200
Observed concentration(mean of n = 3, μg/mL)
0.26 0.47 2.01 5.31 20.39 50.71 98.07 191.09
Accuracy (%) 2.9 −6.7 0.6 6.1 1.9 1.4 −1.9 −4.5
Precision (%) 1.5 4.0 2.1 1.3 3.5 2.0 1.6 6.1
HN.50f
Nominal concentration (μg/mL) 1 2 5 10 20 50 100 200
Observed concentration(mean of n = 3, μg/mL)
1.04 1.85 5.13 9.49 20.48 51.02 103.47 196.96
Accuracy (%) 3.6 −7.5 2.7 −5.1 2.4 2.1 3.5 −1.5
Precision (%) 3.1 4.5 7.8 4.0 1.5 0.7 2.1 3.1
HN.50t
Nominal concentration (μg/mL) 0.25 0.5 2 5 20 50 100 200
Observed concentration(mean of n = 3, μg/mL)
0.26 0.47 1.89 5.06 20.53 53.40 102.25 190.47
Accuracy (%) 3.9 −6.7 −5.4 1.3 2.6 6.8 2.3 −4.8
Precision (%) 2.4 4.6 2.0 3.9 3.5 7.2 4.5 3.9
LOX-1
Nominal concentration (μg/mL) 0.25 0.5 2 5 20 50 100 200
Observed concentration(mean of n = 3, μg/mL)
0.26 0.47 1.91 5.11 20.98 51.39 101.43 190.59
Accuracy (%) 3.0 −5.3 −4.3 2.1 4.9 2.8 1.4 −4.7
Precision (%) 0.9 1.3 4.3 1.6 2.2 2.4 2.0 3.5
(0.5 mL) were collected into heparinized 1.5 mL microtubesat 0 and 300 min after administration. After sampling, thecollected blood was replaced with an equal volume of saline.Plasma was separated by centrifugation at 10000 xg and 4◦Cfor 10 min, then stored at −20◦C until use. The animal studywas approved by the Animal Ethics Committee of the Collegeof Pharmacy, Nihon University.
3. Results and Discussion
3.1. Chromatography. UV wavelength was determined at310 nm as previously reported [11]. Phenacetin was used asan IS for robust quantitation with simple sample prepara-tion. Representative chromatograms of PI polyamides at the
LLOQ are presented in Figure 2. The peaks of PI polyamidesand phenacetin were observed at the retention times of 8.1min and 10.3 min with sufficient separation. No interferencepeak was observed on the retention times in the developedconditions.
3.2. Method Validation. The mean of the back-calculatedconcentrations over three days, the accuracy and precisionare presented in Table 1. Calibration curve linearity wasgood over the range of 0.5 to 200 μg/mL for HN.49, 0.25 to200 μg/mL for TGF-β1f, TGF-β1t, HN.50t, and LOX-1, 1 to200 μg/mL for HN.50f in rat plasma.
Accuracy and precision of the assay for the determinationof PI polyamides in rat plasma were presented in Table 2.
Journal of Biomedicine and Biotechnology 7
Table 2: Intra-day and inter-day accuracy and precision of QC samples for PI polyamides in rat plasma.
HN.49
Intraday (n = 5) Interday (n = 15)
Nominal concentration(μg/mL)
LLOQ QL QM QH LLOQ QL QM QH
0.5 1 100 160 0.5 1 100 160
Observed concentration(mean, μg/mL)
0.49 0.86 104.03 144.73 0.52 0.90 103.54 154.50
Accuracy (%) −1.2 −14.4 4.0 −9.6 3.8 −10.2 3.5 −3.4
Precision (%) 2.8 1.1 2.2 1.1 5.3 7.2 2.0 5.2
TGF-β1f
Intra-day (n = 5) Inter-day (n = 15)
Nominal concentration(μg/mL)
LLOQ QL QM QH LLOQ QL QM QH
0.25 0.5 100 160 0.25 0.5 100 160
Observed concentration(mean, μg/mL)
0.23 0.43 109.03 160.89 0.25 0.45 104.28 159.49
Accuracy (%) −9.1 −13.9 9.0 0.6 1.2 −10.6 4.3 −0.3
Precision (%) 3.4 1.6 0.9 1.9 9.3 6.3 5.2 1.8
TGF-β1t
Intra-day (n = 5) Inter-day (n = 15)
Nominal concentration(μg/mL)
LLOQ QL QM QH LLOQ QL QM QH
0.25 0.5 100 160 0.25 0.5 100 160
Observed concentration(mean, μg/mL)
0.24 0.43 101.52 147.62 0.23 0.43 100.70 149.11
Accuracy (%) −4.7 −13.4 1.5 −7.7 −7.4 −14.4 0.7 −6.8
Precision (%) 9.5 4.7 4.5 0.4 11.9 4.1 3.9 1.9
HN.50f
Intra-day (n = 5) Inter-day (n = 15)
Nominal concentration(μg/mL)
LLOQ QL QM QH LLOQ QL QM QH
1 2 100 160 1 2 100 160
Observed concentration(mean, μg/mL)
1.09 1.76 109.24 172.59 1.08 1.86 107.07 171.06
Accuracy (%) 9.4 −11.9 9.2 7.9 7.5 −6.8 7.1 6.9
Precision (%) 3.3 1.2 1.7 1.8 3.9 4.2 4.2 3.6
HN.50t
Intra-day (n = 5) Inter-day (n = 15)
Nominal concentration(μg/mL)
LLOQ QL QM QH LLOQ QL QM QH
0.25 0.5 100 160 0.25 0.5 100 160
Observed concentration(mean, μg/mL)
0.25 0.43 97.49 143.77 0.25 0.44 97.71 149.61
Accuracy (%) 0.4 −14.2 −2.5 −10.1 0.6 −13.0 −2.3 −6.5
Precision (%) 7.7 2.6 3.6 1.8 9.0 4.5 4.4 3.4
LOX-1
Intra-day (n = 5) Inter-day (n = 15)
Nominal concentration(μg/mL)
LLOQ QL QM QH LLOQ QL QM QH
0.25 0.5 100 160 0.25 0.5 100 160
Observed concentration(mean, μg/mL)
0.24 0.45 97.93 144.45 0.25 0.45 98.95 145.94
Accuracy (%) −2.9 −10.9 −2.1 −9.7 −1.1 −10.6 −1.1 −8.8
Precision (%) 2.4 2.9 2.5 2.6 4.5 2.0 4.0 6.4
8 Journal of Biomedicine and Biotechnology
Table 3: Recovery.
HN.49
Nominal concentration (μg/mL)LLOQ QL QM QH
0.5 1 100 160
Recovery (%) 85.6 107 91.7 93.3
Precision (%) 11.4 8.6 4.6 9.6
TGF-β1f
Nominal concentration (μg/mL)LLOQ QL QM QH
0.25 0.5 100 160
Recovery (%) 76.3 101 101 98.8
Precision (%) 3.6 2.2 3.8 2.4
TGF-β1t
Nominal concentration (μg/mL)LLOQ QL QM QH
0.25 0.5 100 160
Recovery (%) 101 96.5 98.2 101
Precision (%) 7.8 2.5 1.2 3.2
HN.50f
Nominal concentration (μg/mL)LLOQ QL QM QH
1 2 100 160
Recovery (%) 99.2 92.1 88.2 89.7
Precision (%) 3.0 5.3 0.8 9.4
HN.50t
Nominal concentration (μg/mL)LLOQ QL QM QH
0.25 0.5 100 160
Recovery (%) 87.2 84.4 95.6 96.7
Precision (%) 10.1 8.2 1.2 4.3
LOX-1
Nominal concentration (μg/mL)LLOQ QL QM QH
0.25 0.5 100 160
Recovery (%) 78.3 80.6 92.7 85.8
Precision (%) 4.2 1.0 1.4 2.7
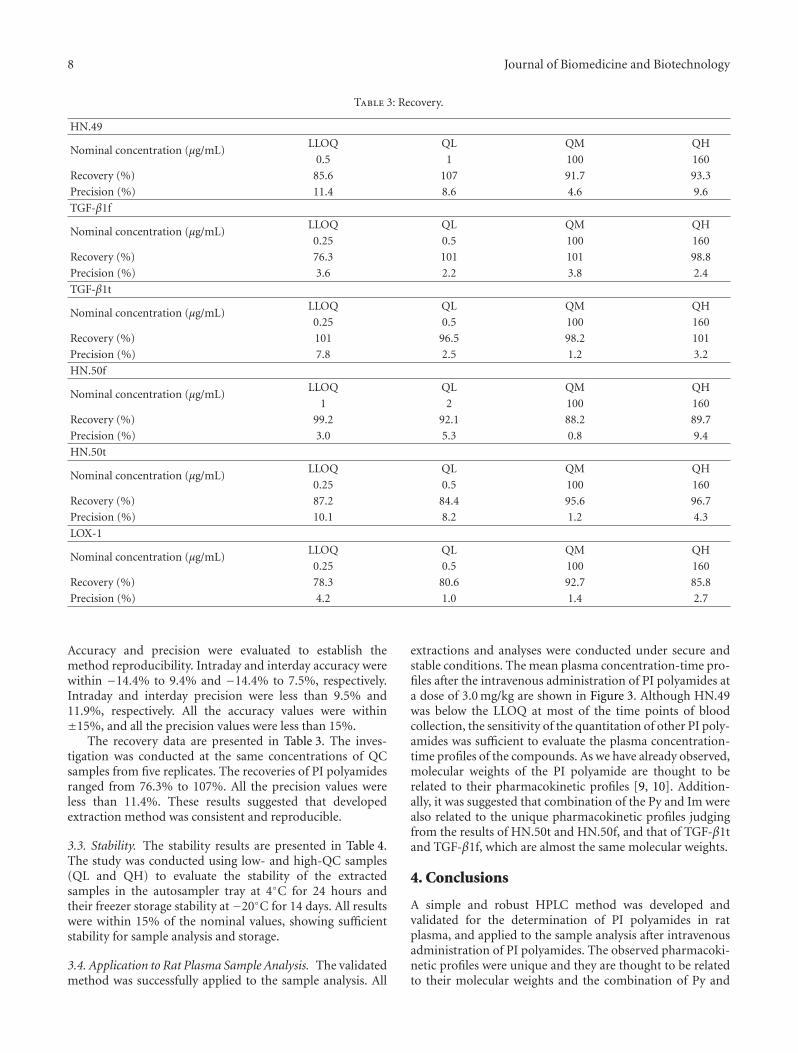
Accuracy and precision were evaluated to establish themethod reproducibility. Intraday and interday accuracy werewithin −14.4% to 9.4% and −14.4% to 7.5%, respectively.Intraday and interday precision were less than 9.5% and11.9%, respectively. All the accuracy values were within±15%, and all the precision values were less than 15%.
The recovery data are presented in Table 3. The inves-tigation was conducted at the same concentrations of QCsamples from five replicates. The recoveries of PI polyamidesranged from 76.3% to 107%. All the precision values wereless than 11.4%. These results suggested that developedextraction method was consistent and reproducible.
3.3. Stability. The stability results are presented in Table 4.The study was conducted using low- and high-QC samples(QL and QH) to evaluate the stability of the extractedsamples in the autosampler tray at 4◦C for 24 hours andtheir freezer storage stability at −20◦C for 14 days. All resultswere within 15% of the nominal values, showing sufficientstability for sample analysis and storage.
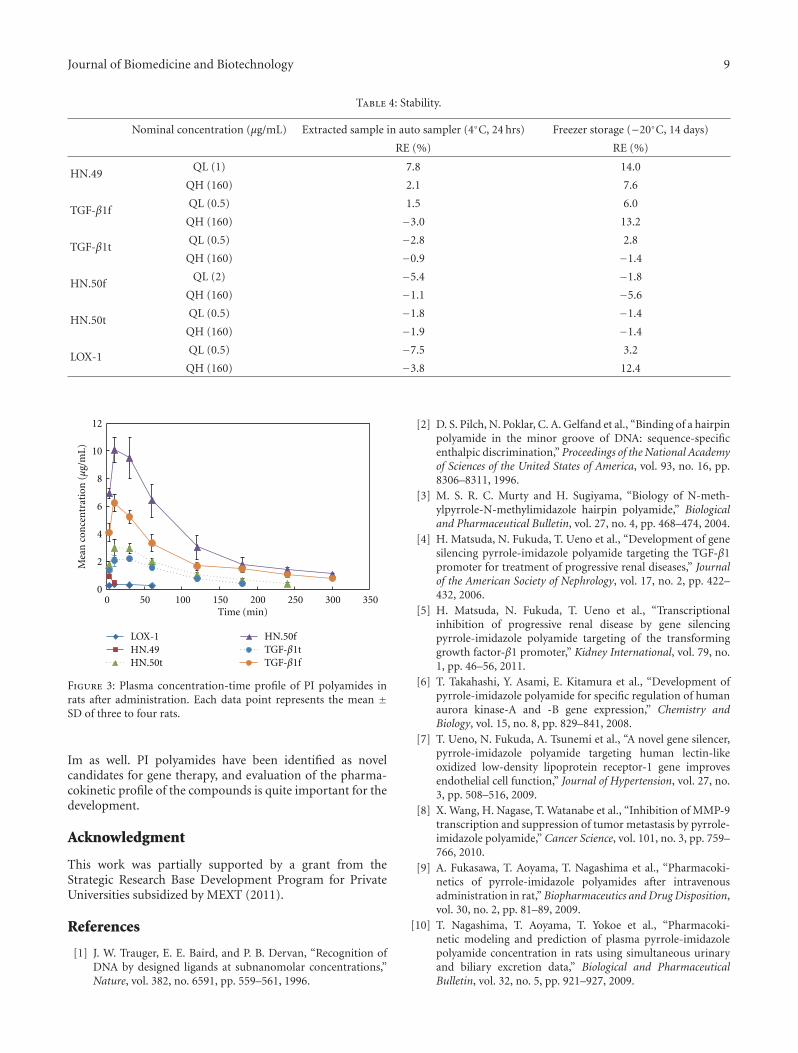
3.4. Application to Rat Plasma Sample Analysis. The validatedmethod was successfully applied to the sample analysis. All
extractions and analyses were conducted under secure andstable conditions. The mean plasma concentration-time pro-files after the intravenous administration of PI polyamides ata dose of 3.0 mg/kg are shown in Figure 3. Although HN.49was below the LLOQ at most of the time points of bloodcollection, the sensitivity of the quantitation of other PI poly-amides was sufficient to evaluate the plasma concentration-time profiles of the compounds. As we have already observed,molecular weights of the PI polyamide are thought to berelated to their pharmacokinetic profiles [9, 10]. Addition-ally, it was suggested that combination of the Py and Im werealso related to the unique pharmacokinetic profiles judgingfrom the results of HN.50t and HN.50f, and that of TGF-β1tand TGF-β1f, which are almost the same molecular weights.
4. Conclusions
A simple and robust HPLC method was developed andvalidated for the determination of PI polyamides in ratplasma, and applied to the sample analysis after intravenousadministration of PI polyamides. The observed pharmacoki-netic profiles were unique and they are thought to be relatedto their molecular weights and the combination of Py and
Journal of Biomedicine and Biotechnology 9
Table 4: Stability.
Nominal concentration (μg/mL) Extracted sample in auto sampler (4◦C, 24 hrs) Freezer storage (−20◦C, 14 days)
RE (%) RE (%)
HN.49QL (1) 7.8 14.0
QH (160) 2.1 7.6
TGF-β1fQL (0.5) 1.5 6.0
QH (160) −3.0 13.2
TGF-β1tQL (0.5) −2.8 2.8
QH (160) −0.9 −1.4
HN.50fQL (2) −5.4 −1.8
QH (160) −1.1 −5.6
HN.50tQL (0.5) −1.8 −1.4
QH (160) −1.9 −1.4
LOX-1QL (0.5) −7.5 3.2
QH (160) −3.8 12.4
0
2
4
6
8
10
12
0 50 100 150 200 250 300 350Time (min)
HN.49HN.50t
HN.50f
Mea
n c
once
ntr
atio
n (μ
g/m
L)
LOX-1TGF-β1tTGF-β1f
Figure 3: Plasma concentration-time profile of PI polyamides inrats after administration. Each data point represents the mean ±SD of three to four rats.
Im as well. PI polyamides have been identified as novelcandidates for gene therapy, and evaluation of the pharma-cokinetic profile of the compounds is quite important for thedevelopment.
Acknowledgment
This work was partially supported by a grant from theStrategic Research Base Development Program for PrivateUniversities subsidized by MEXT (2011).
References
[1] J. W. Trauger, E. E. Baird, and P. B. Dervan, “Recognition ofDNA by designed ligands at subnanomolar concentrations,”Nature, vol. 382, no. 6591, pp. 559–561, 1996.
[2] D. S. Pilch, N. Poklar, C. A. Gelfand et al., “Binding of a hairpinpolyamide in the minor groove of DNA: sequence-specificenthalpic discrimination,” Proceedings of the National Academyof Sciences of the United States of America, vol. 93, no. 16, pp.8306–8311, 1996.
[3] M. S. R. C. Murty and H. Sugiyama, “Biology of N-meth-ylpyrrole-N-methylimidazole hairpin polyamide,” Biologicaland Pharmaceutical Bulletin, vol. 27, no. 4, pp. 468–474, 2004.
[4] H. Matsuda, N. Fukuda, T. Ueno et al., “Development of genesilencing pyrrole-imidazole polyamide targeting the TGF-β1promoter for treatment of progressive renal diseases,” Journalof the American Society of Nephrology, vol. 17, no. 2, pp. 422–432, 2006.
[5] H. Matsuda, N. Fukuda, T. Ueno et al., “Transcriptionalinhibition of progressive renal disease by gene silencingpyrrole-imidazole polyamide targeting of the transforminggrowth factor-β1 promoter,” Kidney International, vol. 79, no.1, pp. 46–56, 2011.
[6] T. Takahashi, Y. Asami, E. Kitamura et al., “Development ofpyrrole-imidazole polyamide for specific regulation of humanaurora kinase-A and -B gene expression,” Chemistry andBiology, vol. 15, no. 8, pp. 829–841, 2008.
[7] T. Ueno, N. Fukuda, A. Tsunemi et al., “A novel gene silencer,pyrrole-imidazole polyamide targeting human lectin-likeoxidized low-density lipoprotein receptor-1 gene improvesendothelial cell function,” Journal of Hypertension, vol. 27, no.3, pp. 508–516, 2009.
[8] X. Wang, H. Nagase, T. Watanabe et al., “Inhibition of MMP-9transcription and suppression of tumor metastasis by pyrrole-imidazole polyamide,” Cancer Science, vol. 101, no. 3, pp. 759–766, 2010.
[9] A. Fukasawa, T. Aoyama, T. Nagashima et al., “Pharmacoki-netics of pyrrole-imidazole polyamides after intravenousadministration in rat,” Biopharmaceutics and Drug Disposition,vol. 30, no. 2, pp. 81–89, 2009.
[10] T. Nagashima, T. Aoyama, T. Yokoe et al., “Pharmacoki-netic modeling and prediction of plasma pyrrole-imidazolepolyamide concentration in rats using simultaneous urinaryand biliary excretion data,” Biological and PharmaceuticalBulletin, vol. 32, no. 5, pp. 921–927, 2009.

10 Journal of Biomedicine and Biotechnology
[11] A. Fukasawa, T. Nagashima, T. Aoyama et al., “Optimizationand validation of a high-performance liquid chromatographicmethod with UV detection for the determination of pyrrole-imidazole polyamides in rat plasma,” Journal of Chromatogra-phy B, vol. 859, no. 2, pp. 272–275, 2007.
[12] Guidance for Industry, Bioanalytical Method Validation, Foodand Drug Administration Center for Drug Evaluation andResearch (CDER), Center for Veterinary Medicine (CVM),2001.

Submit your manuscripts athttp://www.hindawi.com
Hindawi Publishing Corporationhttp://www.hindawi.com Volume 2014
Anatomy Research International
PeptidesInternational Journal of
Hindawi Publishing Corporationhttp://www.hindawi.com Volume 2014
Hindawi Publishing Corporation http://www.hindawi.com
International Journal of
Volume 2014
Zoology
Hindawi Publishing Corporationhttp://www.hindawi.com Volume 2014
Molecular Biology International
GenomicsInternational Journal of
Hindawi Publishing Corporationhttp://www.hindawi.com Volume 2014
The Scientific World JournalHindawi Publishing Corporation http://www.hindawi.com Volume 2014
Hindawi Publishing Corporationhttp://www.hindawi.com Volume 2014
BioinformaticsAdvances in
Marine BiologyJournal of
Hindawi Publishing Corporationhttp://www.hindawi.com Volume 2014
Hindawi Publishing Corporationhttp://www.hindawi.com Volume 2014
Signal TransductionJournal of
Hindawi Publishing Corporationhttp://www.hindawi.com Volume 2014
BioMed Research International
Evolutionary BiologyInternational Journal of
Hindawi Publishing Corporationhttp://www.hindawi.com Volume 2014
Hindawi Publishing Corporationhttp://www.hindawi.com Volume 2014
Biochemistry Research International
ArchaeaHindawi Publishing Corporationhttp://www.hindawi.com Volume 2014
Hindawi Publishing Corporationhttp://www.hindawi.com Volume 2014
Genetics Research International
Hindawi Publishing Corporationhttp://www.hindawi.com Volume 2014
Advances in
Virolog y
Hindawi Publishing Corporationhttp://www.hindawi.com
Nucleic AcidsJournal of
Volume 2014
Stem CellsInternational
Hindawi Publishing Corporationhttp://www.hindawi.com Volume 2014
Hindawi Publishing Corporationhttp://www.hindawi.com Volume 2014
Enzyme Research
Hindawi Publishing Corporationhttp://www.hindawi.com Volume 2014
International Journal of
Microbiology