Embed Size (px)
Citation preview

Rail Safety IDEA Program
RAILROAD BRIDGE DYNAMICS AND RATINGS
Final Report for Rail Safety IDEA Project 24
Prepared by:
Kevin Bollinger,
Hatch Mott MacDonald
Chicago, IL
June 2015
Innovations Deserving Exploratory Analysis (IDEA) Programs
Managed by the Transportation Research Board
This IDEA project was funded by the Safety IDEA Program.
The TRB currently manages the following three IDEA programs:
NCHRP IDEA Program, which focuses on advances in the design, construction, and maintenance
of highway systems, is funded by American Association of State Highway and Transportation
Officials (AASHTO) as part of the National Cooperative Highway Research Program (NCHRP).
Safety IDEA Program, which focuses on innovative approaches for improving railroad safety and
performance. The Safety IDEA program is funded by the Federal Railroad Administration
(FRA).
The Transit IDEA Program, which supports development and testing of innovative concepts and
methods for advancing transit practice, is funded by the Federal Transit Administration (FTA) as
part of the Transit Cooperative Research Program (TCRP).
Management of the three IDEA programs is coordinated to promote the development and testing of
innovative concepts, methods, and technologies.
For information on the IDEA programs, check the IDEA website (www.trb.org/idea). For questions,
contact the IDEA programs office by telephone at (202) 334-3310.
IDEA Programs
Transportation Research Board
500 Fifth Street, NW
Washington, DC 20001
The project that is the subject of this contractor-authored report was a part of the Innovations
Deserving Exploratory Analysis (IDEA) Programs, which are managed by the Transportation
Research Board (TRB) with the approval of the Governing Board of the National Research Council.
The members of the oversight committee that monitored the project and reviewed the report were
chosen for their special competencies and with regard for appropriate balance. The views expressed
in this report are those of the contractor who conducted the investigation documented in this report
and do not necessarily reflect those of the Transportation Research Board, the National Research
Council, or the sponsors of the IDEA Programs. This document has not been edited by TRB.
The Transportation Research Board of the National Academies, the National Research Council, and
the organizations that sponsor the IDEA Programs do not endorse products or manufacturers. Trade
or manufacturers' names appear herein solely because they are considered essential to the object of
the investigation.

Railroad Bridge Dynamics and Ratings
IDEA Program Final Report
For the Period May 2013 through November 2014
Contract Number: Safety-24
Prepared for the IDEA Program
Transportation Research Board
National Research Council
Kevin Bollinger
120 S. LaSalle Street, Suite 1240
Chicago, IL 60603
June 2015

Acknowledgments
This research was supported by the National Academies’ Transportation Research Board (TRB) IDEA Program. The
project, “High-Speed Rail Bridge Dynamics and Ratings,” is part of the Safety IDEA Program, which is funded by the
Federal Railroad Administration. Charles Taylor was the TRB Project Manager.
The author would like to acknowledge the guidance and support provided by the members of the project’s Expert
Review Panel:
Craig Rolwood, PE, Project Director, Structure Design, Amtrak
Duane Otter, Ph.D., PE, Transportation Technology Center Inc.
David Place, P.Eng, Project Director—Crossrail, Mott MacDonald
The author would also like to acknowledge the support of Jim Richter Deputy Chief Engineer, Structures of Amtrak
and Amtrak personnel for their active participation in the project, timely answers to questions, access to equipment, and
right of entry to property for field testing.
Rail Safety IDEA PROGRAM COMMITTEE
CHAIR
CONRAD RUPPERT JR.
University of Illinois
MEMBERS
MICHAEL FRANKE Amtrak
PETER FRENCH
Association of American Railroads
BRAD KERCHOF Norfolk Southern Railway
HENRY LEES JR.
BNSF Railway
STEPHEN POPKIN
Research and Innovative Technology Administration
.
FRA LIAISON TAREK OMAR
Federal Railroad Administration
NTSB LIAISON STEPHEN KLEJST
National Transportation Safety Board
TRB LIAISON
SCOTT BABCOCK
Transportation Research Board
TRB TCRP Staff STEPHAN A. PARKER, Senior Program Officer Transit
Cooperative Research Program
IDEA PROGRAMS STAFF STEPHEN R. GODWIN, Director for Studies and Special
Programs
JON M. WILLIAMS, Program Director, IDEA and Synthesis
Studies
JO ALLEN GAUSE, Senior Program Officer
CHUCK TAYLOR, Senior Program Officer
DEMISHA WILLIAMS, Senior Program Assistant
EXPERT REVIEW PANEL CRAIG ROLWOOD, Amtrak DUANE OTTER, Transportation Technology Center Inc.
DAVID PLACE, Crossrail, Mott MacDonald
TABLE OF CONTENTS
1 EXECUTIVE SUMMARY .................................................................................................................................. 1
2 MATERIALS REVIEWED ................................................................................................................................. 2
3 NORMAL RATING CALCULATION .............................................................................................................. 3
3.1 AMTRAK BRIDGE 155.85 OVER THE USQUEPAUG RIVER IN RHODE ISLAND .................... 3 3.2 NORMAL RATING CALCULATIONS ................................................................................................. 4
4 DETERMINATION OF DYNAMIC VERTICAL EFFECTS ......................................................................... 4
4.1 MODELING ............................................................................................................................................... 5 4.2 DYNAMIC EQUATIONS AND CALCULATION SOFTWARE ......................................................... 5
4.2.1 The Moving Load Model ............................................................................................................ 5 4.2.2 Natural Frequency and Damping Equations ............................................................................ 7 4.2.3 Moving Load Model with Vehicle-Bridge Interaction Considerations ................................... 8 4.2.4 Wheel Load Case ......................................................................................................................... 8
4.3 MODEL AND FIELD RESULTS .......................................................................................................... 10 4.3.1 Model Verification ..................................................................................................................... 10 4.3.2 Work Train Model Information............................................................................................... 10 4.3.3 Acela Train Model Information ............................................................................................... 12 4.3.4 Byers Report .............................................................................................................................. 13
4.4 RESONANT SPEEDS ............................................................................................................................. 15 4.5 CANCELLATION ................................................................................................................................... 15 4.6 DYNAMIC VERTICAL EFFECT (DVE) ............................................................................................. 15
5 FIELD TESTING ............................................................................................................................................... 16
5.1 OVERVIEW ............................................................................................................................................. 16 5.2 BRIDGE DESCRIPTION ....................................................................................................................... 16 5.3 INSTRUMENTATION DESCRIPTION ............................................................................................... 17 5.4 MONITORING PROCEDURE .............................................................................................................. 17
5.4.1 TRAINS MONITORED ........................................................................................................... 18 5.4.2 MONITORING RESULTS ...................................................................................................... 19
6 PROPOSED RATING PROCEDURE ............................................................................................................. 23
6.1 NORMAL RATINGS CONSIDERING DYNAMIC CHARACTERISTICS .................................... 23
7 BRIDGE LENGTH AND TRAIN SPEED COMPARISONS ........................................................................ 24
7.1 COMPARISON OF BRIDGE LENGTHS ............................................................................................ 24
8 CONCLUSIONS AND RECOMMENDATIONS ............................................................................................ 26
9 FUTURE RESEARCH AND CRITERIA DEVELOPMENT ........................................................................ 26
10 REFERENCES ................................................................................................................................................... 27

LIST OF TABLES
TABLE 4.1 COMPARISONS OF IMPACT VALUES BETWEEN THE BYERS REPORT
AND MATHEMATICAL MODELING
TABLE 6.1 NORMAL BRIDGE RATINGS FOR BR.155.85
LIST OF FIGURES
FIGURE 3.1 Span details of elevation, plan, and section views (N.Y. N.H. & H.R.R.).
FIGURE 4.1 Motion of a constant force f along a simply supported beam of span l at velocity c.
FIGURE 4.2 Load configuration.
FIGURE 4.3 Six mph train speed inducted girder deflections at midspan.
FIGURE 4.4 Forty-one mph train speed induced girder deflections at midspan.
FIGURE 4.5 One-hundred and twenty mph train speed induced girder deflections at midspan superimposed on the
quasi-static 6 mph train.
FIGURE 4.6 One-hundred and twenty mph train speed induced girder bending moments at midspan superimposed
on the quasi-static 6 mph train.
FIGURE 4.7 One-hundred and forty-five mph train speed induced girder deflections at midspan superimposed on the
quasi-static 6 mph train.
FIGURE 4.8 One-hundred and forty-five mph train speed induced girder bending moments at midspan superimposed
on the quasi-static 6 mph train.
FIGURE 4.9 Page 1100 of the Byers report illustrating mean percent impact values.
FIGURE 5.1 Amtrak Bridge155.85.
FIGURE 5.2 String potentiometer mounted near girder bearing.
FIGURE 5.3A Midspan deflection of east span girders (Amtrak work train, 6 mph).
FIGURE 5.3B Midspan strain of east-span girders at lower strain gage location 16.125 in. below section centroid -
(Amtrak work train, 6 mph).
FIGURE 5.4A Midspan deflection of east span girders (Amtrak work train, 41 mph).
FIGURE 5.4B Midspan strain of east span girders at lower strain gage location 16.125 in. below section centroid
(Amtrak work train, 41 mph).
FIGURE 5.5A Midspan deflection of east span girders (Amtrak Acela train, 120 mph).
FIGURE 5.5B Midspan strain of east span girders at lower strain gage location 6.125 in. below section centroid
(Amtrak Acela train, 120 mph).
FIGURE 5.6A Midspan deflection of east span girders (Amtrak Acela train, 145 mph).
FIGURE 5.6B Midspan strain of east span girders at lower strain gage location 16.125in. below section centroid
(Amtrak Acela train, 145 mph).
FIGURE 6.1 Flow chart.
FIGURE 7.1 Dynamic vertical effects for a 15-foot span bridge.
FIGURE 7.2 Dynamic vertical effects for bridge 155.85 (36-foot span).
FIGURE 7.3 Dynamic vertical effects for a 60-foot span bridge.
FIGURE 7.4 Dynamic vertical effects for a 80-foot span bridge.
FIGURE 7.5 Dynamic vertical effects for a 100-foot span bridge.
FIGURE 7.6 Dynamic vertical effects for a 150-foot span bridge.
1
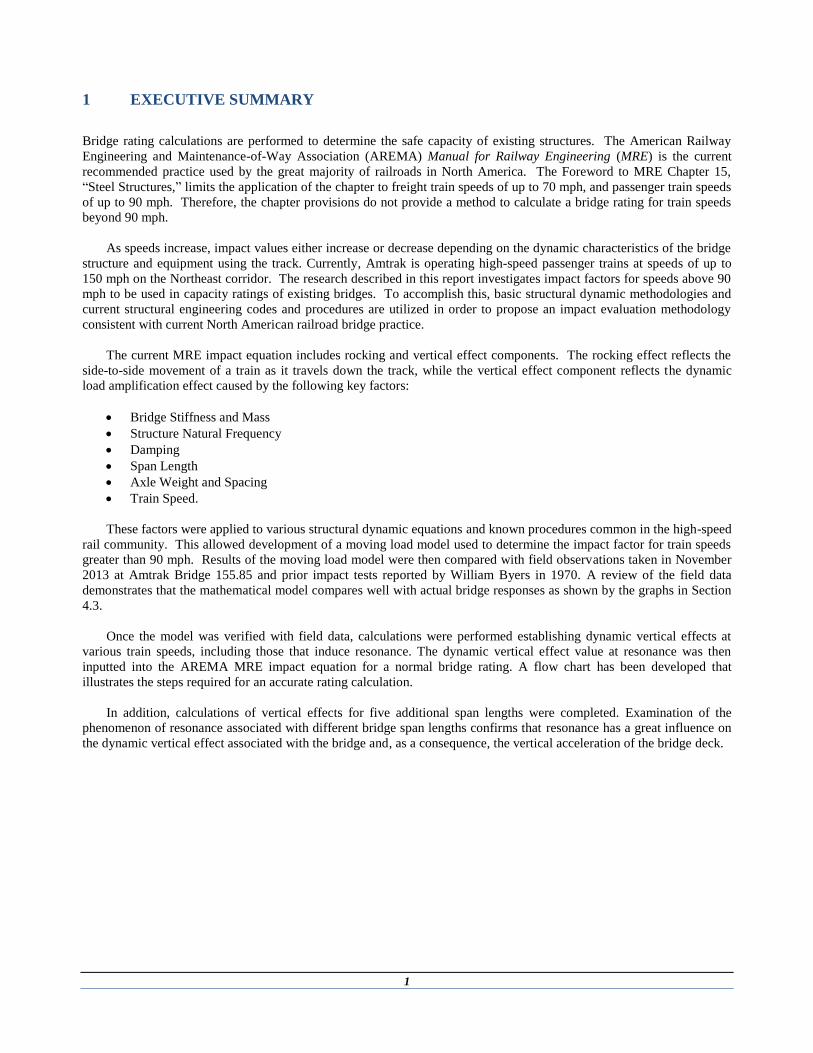
1 EXECUTIVE SUMMARY
Bridge rating calculations are performed to determine the safe capacity of existing structures. The American Railway
Engineering and Maintenance-of-Way Association (AREMA) Manual for Railway Engineering (MRE) is the current
recommended practice used by the great majority of railroads in North America. The Foreword to MRE Chapter 15,
“Steel Structures,” limits the application of the chapter to freight train speeds of up to 70 mph, and passenger train speeds
of up to 90 mph. Therefore, the chapter provisions do not provide a method to calculate a bridge rating for train speeds
beyond 90 mph.
As speeds increase, impact values either increase or decrease depending on the dynamic characteristics of the bridge
structure and equipment using the track. Currently, Amtrak is operating high-speed passenger trains at speeds of up to
150 mph on the Northeast corridor. The research described in this report investigates impact factors for speeds above 90
mph to be used in capacity ratings of existing bridges. To accomplish this, basic structural dynamic methodologies and
current structural engineering codes and procedures are utilized in order to propose an impact evaluation methodology
consistent with current North American railroad bridge practice.
The current MRE impact equation includes rocking and vertical effect components. The rocking effect reflects the
side-to-side movement of a train as it travels down the track, while the vertical effect component reflects the dynamic
load amplification effect caused by the following key factors:
Bridge Stiffness and Mass
Structure Natural Frequency
Damping
Span Length
Axle Weight and Spacing
Train Speed.
These factors were applied to various structural dynamic equations and known procedures common in the high-speed
rail community. This allowed development of a moving load model used to determine the impact factor for train speeds
greater than 90 mph. Results of the moving load model were then compared with field observations taken in November
2013 at Amtrak Bridge 155.85 and prior impact tests reported by William Byers in 1970. A review of the field data
demonstrates that the mathematical model compares well with actual bridge responses as shown by the graphs in Section
4.3.
Once the model was verified with field data, calculations were performed establishing dynamic vertical effects at
various train speeds, including those that induce resonance. The dynamic vertical effect value at resonance was then
inputted into the AREMA MRE impact equation for a normal bridge rating. A flow chart has been developed that
illustrates the steps required for an accurate rating calculation.
In addition, calculations of vertical effects for five additional span lengths were completed. Examination of the
phenomenon of resonance associated with different bridge span lengths confirms that resonance has a great influence on
the dynamic vertical effect associated with the bridge and, as a consequence, the vertical acceleration of the bridge deck.
2
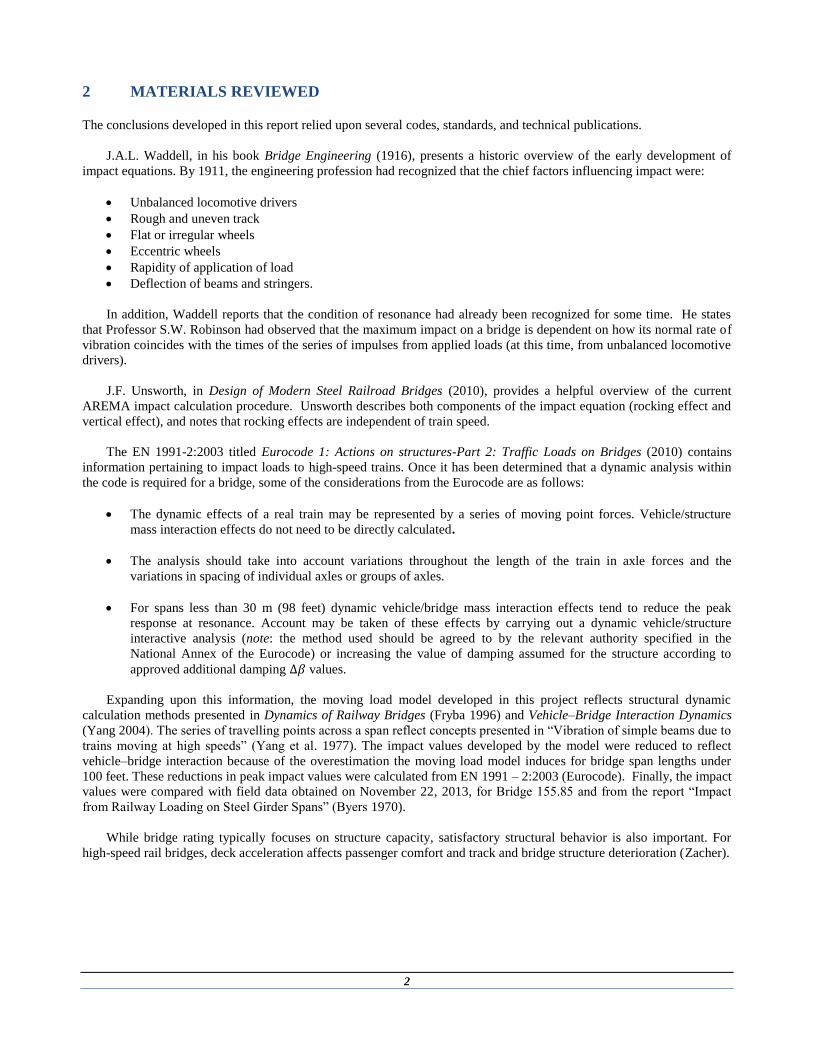
2 MATERIALS REVIEWED The conclusions developed in this report relied upon several codes, standards, and technical publications.
J.A.L. Waddell, in his book Bridge Engineering (1916), presents a historic overview of the early development of
impact equations. By 1911, the engineering profession had recognized that the chief factors influencing impact were:
Unbalanced locomotive drivers
Rough and uneven track
Flat or irregular wheels
Eccentric wheels
Rapidity of application of load
Deflection of beams and stringers.
In addition, Waddell reports that the condition of resonance had already been recognized for some time. He states
that Professor S.W. Robinson had observed that the maximum impact on a bridge is dependent on how its normal rate of
vibration coincides with the times of the series of impulses from applied loads (at this time, from unbalanced locomotive
drivers).
J.F. Unsworth, in Design of Modern Steel Railroad Bridges (2010), provides a helpful overview of the current
AREMA impact calculation procedure. Unsworth describes both components of the impact equation (rocking effect and
vertical effect), and notes that rocking effects are independent of train speed.
The EN 1991-2:2003 titled Eurocode 1: Actions on structures-Part 2: Traffic Loads on Bridges (2010) contains
information pertaining to impact loads to high-speed trains. Once it has been determined that a dynamic analysis within
the code is required for a bridge, some of the considerations from the Eurocode are as follows:
The dynamic effects of a real train may be represented by a series of moving point forces. Vehicle/structure
mass interaction effects do not need to be directly calculated.
The analysis should take into account variations throughout the length of the train in axle forces and the
variations in spacing of individual axles or groups of axles.
For spans less than 30 m (98 feet) dynamic vehicle/bridge mass interaction effects tend to reduce the peak
response at resonance. Account may be taken of these effects by carrying out a dynamic vehicle/structure
interactive analysis (note: the method used should be agreed to by the relevant authority specified in the
National Annex of the Eurocode) or increasing the value of damping assumed for the structure according to
approved additional damping ∆𝛽 values.
Expanding upon this information, the moving load model developed in this project reflects structural dynamic
calculation methods presented in Dynamics of Railway Bridges (Fryba 1996) and Vehicle–Bridge Interaction Dynamics
(Yang 2004). The series of travelling points across a span reflect concepts presented in “Vibration of simple beams due to
trains moving at high speeds” (Yang et al. 1977). The impact values developed by the model were reduced to reflect
vehicle–bridge interaction because of the overestimation the moving load model induces for bridge span lengths under
100 feet. These reductions in peak impact values were calculated from EN 1991 – 2:2003 (Eurocode). Finally, the impact
values were compared with field data obtained on November 22, 2013, for Bridge 155.85 and from the report “Impact
from Railway Loading on Steel Girder Spans” (Byers 1970).
While bridge rating typically focuses on structure capacity, satisfactory structural behavior is also important. For
high-speed rail bridges, deck acceleration affects passenger comfort and track and bridge structure deterioration (Zacher).
3
3 NORMAL RATING CALCULATION
AREMA’s Manual for Railway Engineering, Chapter 15, “Steel Structures, Part 7” (2009), and Amtrak’s Engineering
Practices titled Bridge Load Rating Policy (2011) establish criteria for rating calculations of existing steel railway
bridges. The MRE describes calculations for the normal rating of a bridge, determining the capacity appropriate for day-
to-day use of the structure. It also describes calculations for the maximum rating of a bridge, the capacity appropriate for
occasional use of the structure (typically rare, heavy loads). Unless otherwise specifically noted, this report will focus on
the determination of normal ratings. The same impact factor is used for the calculation of both the normal and maximum
structure ratings.
The capacity of the member to be rated will be determined by the Cooper E Live Load applied to the member. The
Cooper E Equivalents of 2 HHP-8 Electric Locomotives and a train of six Horizon Fleet Coach Cars are provided in
Amtrak’s Bridge Load Rating Policy. The calculations take into consideration normal rating live loads plus impact
stresses and fatigue rating procedures. Since the historic use of the existing line is not known, fatigue procedures will not
be considered in this report. Final stress evaluations are based on applying an impact value as a percentage of the live
load to the static load. Section 7.3.1 states “Rating of existing bridges in terms of carrying capacity shall be determined
by the computation of stress based on authentic records of the design, details, materials, workmanship and physical
condition, including data obtained by inspection (and tests if the records are not complete).” Rating calculations were
based on the available structure drawings.
3.1 AMTRAK BRIDGE 155.85 OVER THE USQUEPAUG RIVER IN RHODE ISLAND
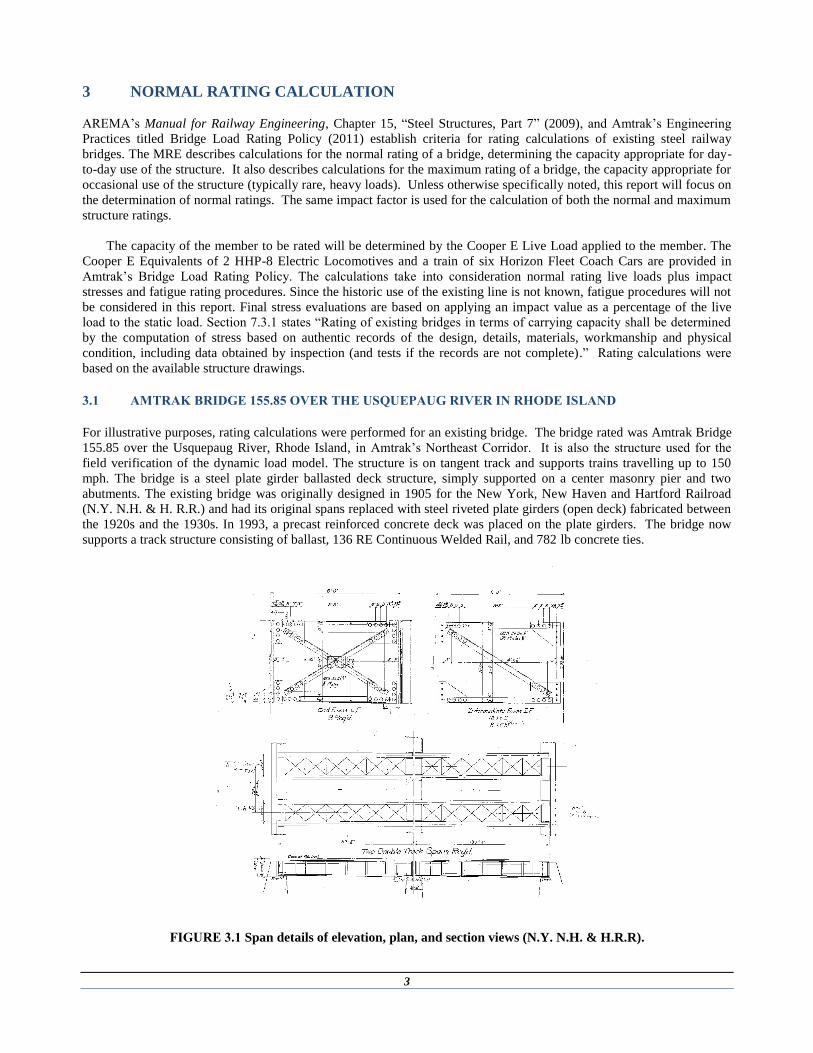
For illustrative purposes, rating calculations were performed for an existing bridge. The bridge rated was Amtrak Bridge
155.85 over the Usquepaug River, Rhode Island, in Amtrak’s Northeast Corridor. It is also the structure used for the
field verification of the dynamic load model. The structure is on tangent track and supports trains travelling up to 150
mph. The bridge is a steel plate girder ballasted deck structure, simply supported on a center masonry pier and two
abutments. The existing bridge was originally designed in 1905 for the New York, New Haven and Hartford Railroad
(N.Y. N.H. & H. R.R.) and had its original spans replaced with steel riveted plate girders (open deck) fabricated between
the 1920s and the 1930s. In 1993, a precast reinforced concrete deck was placed on the plate girders. The bridge now
supports a track structure consisting of ballast, 136 RE Continuous Welded Rail, and 782 lb concrete ties.
FIGURE 3.1 Span details of elevation, plan, and section views (N.Y. N.H. & H.R.R).
4
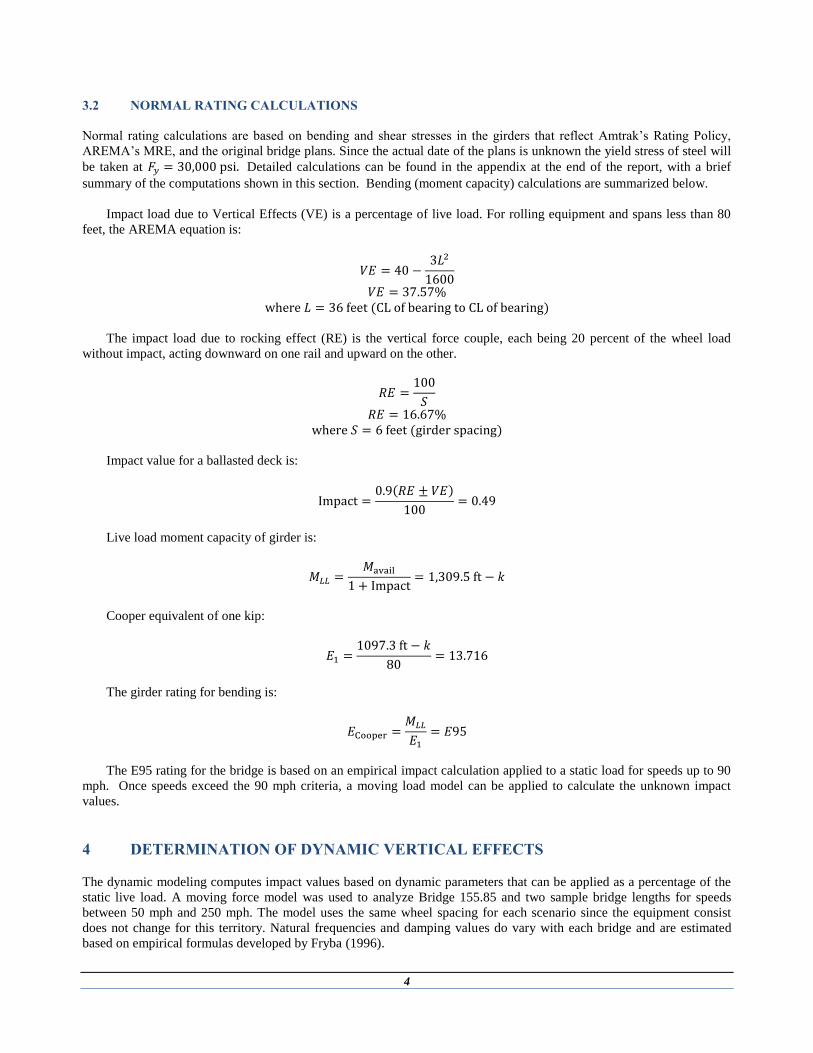
3.2 NORMAL RATING CALCULATIONS
Normal rating calculations are based on bending and shear stresses in the girders that reflect Amtrak’s Rating Policy,
AREMA’s MRE, and the original bridge plans. Since the actual date of the plans is unknown the yield stress of steel will
be taken at 𝐹𝑦 = 30,000 psi. Detailed calculations can be found in the appendix at the end of the report, with a brief
summary of the computations shown in this section. Bending (moment capacity) calculations are summarized below.
Impact load due to Vertical Effects (VE) is a percentage of live load. For rolling equipment and spans less than 80
feet, the AREMA equation is:
𝑉𝐸 = 40 −3𝐿2
1600
𝑉𝐸 = 37.57%
where 𝐿 = 36 feet (CL of bearing to CL of bearing)
The impact load due to rocking effect (RE) is the vertical force couple, each being 20 percent of the wheel load
without impact, acting downward on one rail and upward on the other.
𝑅𝐸 =100
𝑆
𝑅𝐸 = 16.67%
where 𝑆 = 6 feet (girder spacing)
Impact value for a ballasted deck is:
Impact =0.9(𝑅𝐸 ± 𝑉𝐸)
100= 0.49
Live load moment capacity of girder is:
𝑀𝐿𝐿 =𝑀avail
1 + Impact= 1,309.5 ft − 𝑘
Cooper equivalent of one kip:
𝐸1 =1097.3 ft − 𝑘
80= 13.716
The girder rating for bending is:
𝐸Cooper =𝑀𝐿𝐿
𝐸1
= 𝐸95
The E95 rating for the bridge is based on an empirical impact calculation applied to a static load for speeds up to 90
mph. Once speeds exceed the 90 mph criteria, a moving load model can be applied to calculate the unknown impact
values.
4 DETERMINATION OF DYNAMIC VERTICAL EFFECTS
The dynamic modeling computes impact values based on dynamic parameters that can be applied as a percentage of the
static live load. A moving force model was used to analyze Bridge 155.85 and two sample bridge lengths for speeds
between 50 mph and 250 mph. The model uses the same wheel spacing for each scenario since the equipment consist
does not change for this territory. Natural frequencies and damping values do vary with each bridge and are estimated
based on empirical formulas developed by Fryba (1996).
5
Note that the proposed model does not consider all of the potential factors affecting impact. Some of the neglected
factors include the interaction of the structure with the suspension system of the train and direct consideration of the mass
and inertial effects of the train load. These simplifying assumptions follow the procedure given in the Eurocode;
however, the code does account for this interaction by increasing the damping coefficient to the moving load model. This
same procedure is used to account for bridge–vehicle interaction effects within the model.
It is not customary within the high-speed rail industry to include vehicle–bridge interaction calculations to determine
impact values. Wang states the moving load problem can be regarded as a special case of the more general formulation
that considers the various dynamic properties of the moving vehicles. The moving load model is the simplest model that
can be conceived, which has been frequently adopted by researchers in studying the vehicle-induced bridge vibrations.
With this model, the essential dynamic characteristics of the bridge caused by the moving action of the vehicle can be
captured with a sufficient degree of accuracy.
4.1 MODELING
When developing the base line model, the input values, boundary conditions, and solutions were compared with
measurements taken in the field for Bridge 155.85. The model is calibrated to a first natural frequency of 11.5 hertz,
damping ratio of 3.58% (or 0.23 logarithmic decrement of damping), coach car , wheel spacing of 87 feet-6 in., and train
speeds of 121 mph and 145 mph.
4.2 DYNAMIC EQUATIONS AND CALCULATION SOFTWARE
The dynamic equations used in the calculations reflect commonly used theories and computations for varying spaced
loads moving across a simply supported beam. The exact solutions to the equations of motion were used at time step
intervals for the respective axle configuration. The calculations for the model were performed using Mathcad version 15
and Microsoft Excel 2010 software.
4.2.1 The Moving Load Model
In many cases, especially when the vehicle to bridge mass ratio is small, the elastic and inertial effects of the vehicles
may be ignored and much simpler models can be adopted for the vehicles. One typical example is the simulation of a
moving vehicle over a bridge as a single moving load, which has been conventionally referred to as the moving load
model (Yang 2004).
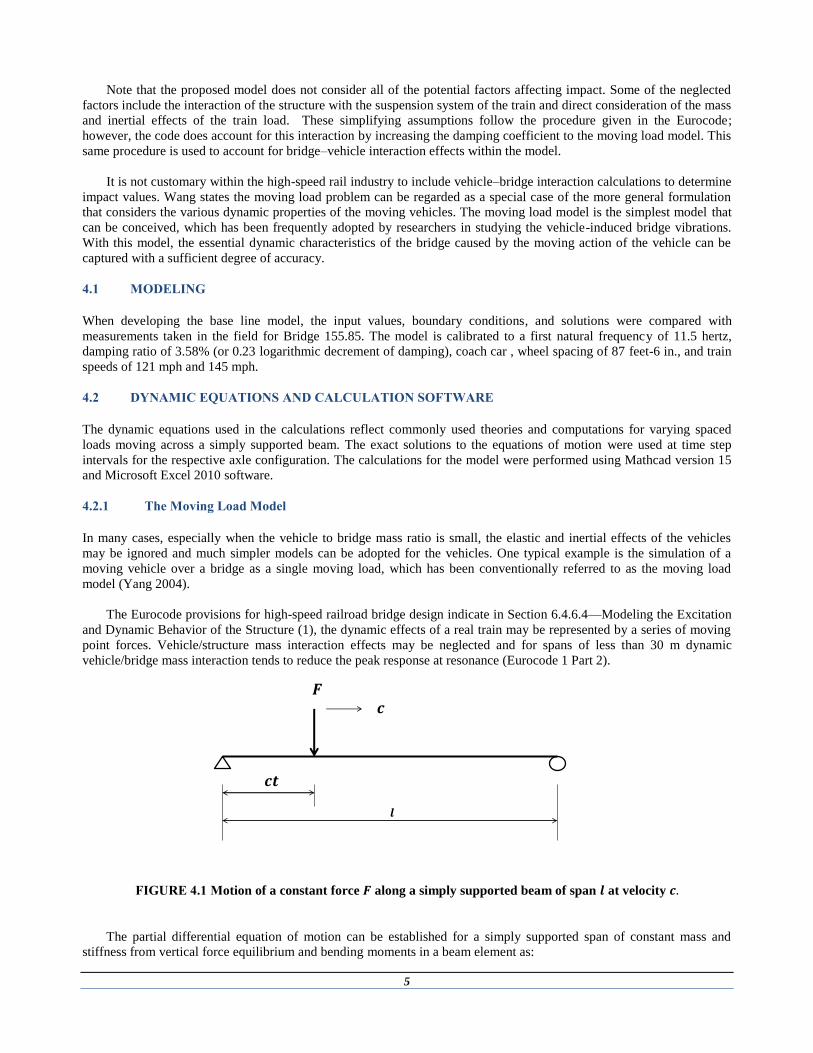
The Eurocode provisions for high-speed railroad bridge design indicate in Section 6.4.6.4—Modeling the Excitation
and Dynamic Behavior of the Structure (1), the dynamic effects of a real train may be represented by a series of moving
point forces. Vehicle/structure mass interaction effects may be neglected and for spans of less than 30 m dynamic
vehicle/bridge mass interaction tends to reduce the peak response at resonance (Eurocode 1 Part 2).
FIGURE 4.1 Motion of a constant force 𝑭 along a simply supported beam of span 𝒍 at velocity 𝒄.
The partial differential equation of motion can be established for a simply supported span of constant mass and
stiffness from vertical force equilibrium and bending moments in a beam element as:
𝑭𝒄
𝒄
𝒍

6
𝐸𝐼𝜕4𝑣(𝑥, 𝑡)
𝜕𝑥4 + 𝜇
𝜕2𝑣(𝑥, 𝑡)
𝜕𝑡2+ 2𝜇𝜔𝑏
𝜕𝑣(𝑥, 𝑡)
𝜕𝑡= 𝛿(𝑥 − 𝑐𝑡)𝐹
𝑣(𝑥, 𝑡) Displacement in the direction of the 𝑦 axis
𝑥 coordinate in the direction of the 𝑥 axis
𝑡 time
𝑐 motion velocity (velocity of force along the 𝑥 axis)
𝐹 Force
𝑙 Length
𝐸 Modulus of Elasticity
𝐼 Inertia
𝜇 mass per unit length of a beam
𝜔𝑏circular frequency with damping
The exact solution to the motion of a constant 𝐹 along a simply supported beam is:
𝑣(𝑥, 𝑡) = 𝑣0 ∑1
𝑗2[𝑗2(𝑗2 − 𝛼2)2 + 4𝛼2𝛽2]∙ [𝑗2(𝑗2 − 𝛼2) sin 𝑗𝜔𝑡 −
𝑗𝛼[𝑗2(𝑗2 − 𝛼2) − 2𝛽2]
(𝑗4 − 𝛽2)1/2𝑒−𝜔𝑏𝑡
∞
𝑗=1
∙ sin𝜔𝑗′𝑡 − 2𝑗𝛼𝛽(cos 𝑗𝜔𝑡 − 𝑒−𝜔𝑏𝑡 cos𝜔𝑗
′𝑡)] sin𝑗𝜋𝑥
𝑙
Static deflection of the beam at midspan due to force 𝐹 applied at the same point:
𝑣0 =2𝐹
𝜇𝑙𝜔𝑗2 =
2𝐹𝑙3
𝜋4𝐸𝐼
Dimensionless velocity (speed) parameter:
𝛼 =𝜔
𝜔1
=𝑐
2𝑓1𝑙
Dimensionless damping parameter (damping ratio):
𝛽 =𝜔𝑏
𝜔1
=𝜗
2𝜋
Circular frequency of force passage:
𝜔 =𝜋𝑐
𝑙
Circular frequency of damped vibrations of unloaded beam at subcritical damping (𝜔𝑏 < 𝜔𝑗):
𝜔𝑗′2 = 𝜔𝑗
2 − 𝜔𝑏2

7
Circular frequency of undamped vibrations of unloaded simply supported beam:
𝜔𝑗2 =
𝑗4𝜋4
𝑙4𝐸𝐼
𝜇, 𝑓𝑖 =
𝜔𝑗
2𝜋
Natural circular frequency of the system:
𝜔0 = (𝑘
𝑚)1/2
Natural frequency of a simply supported beam:
𝜔1 = 𝜋2√𝐸𝐼
𝜇𝑙4
Logarithmic decrement of damping on the basis of 𝑛 successive vibrations where 𝑠𝑛 is the amplitude after the 𝑛th
cycle:
𝜗 =1
𝑛𝑙𝑛
𝑠0𝑠𝑛
Logarithmic decrement of damping to the constant:
𝜗 =𝜔𝑏
𝑓𝑑
Speed parameter:
𝛼 =𝜋𝑐
𝜔𝐿
Mode of vibration (1st Mode is to be used):
𝑗 = 1,2,3 ….
4.2.2 Natural Frequency and Damping Equations
The most important dynamic characteristic of a railway bridge is its natural frequency, which characterizes the extent to
which the bridge is sensitive to dynamic loads (Fryba 1999). Moving force loads at different frequencies excite the
structural system if the velocities are close to the structure’s natural frequency.
Natural frequency of a simply supported beam:
𝜔1 = 𝜋2√𝐸𝐼
𝜇𝑙4
𝑓1 =𝜔1
2𝜋
Plate girder bridge with ballast—First natural frequency empirical equation (Fryba1996):
𝑓1 = 59(𝑙 3.28⁄ )−0.7
8
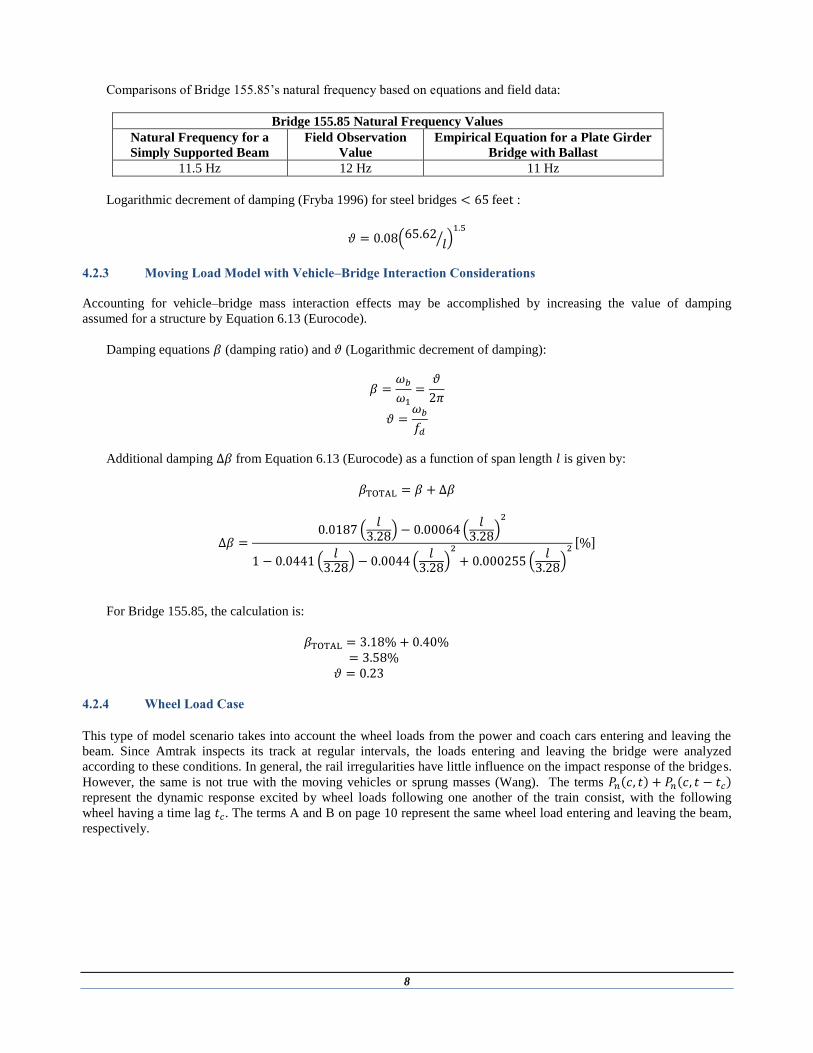
Comparisons of Bridge 155.85’s natural frequency based on equations and field data:
Bridge 155.85 Natural Frequency Values
Natural Frequency for a
Simply Supported Beam
Field Observation
Value
Empirical Equation for a Plate Girder
Bridge with Ballast
11.5 Hz 12 Hz 11 Hz
Logarithmic decrement of damping (Fryba 1996) for steel bridges < 65 feet :
𝜗 = 0.08(65.62 𝑙⁄ )1.5
4.2.3 Moving Load Model with Vehicle–Bridge Interaction Considerations
Accounting for vehicle–bridge mass interaction effects may be accomplished by increasing the value of damping
assumed for a structure by Equation 6.13 (Eurocode).
Damping equations 𝛽 (damping ratio) and 𝜗 (Logarithmic decrement of damping):
𝛽 =𝜔𝑏
𝜔1
=𝜗
2𝜋
𝜗 =𝜔𝑏
𝑓𝑑
Additional damping ∆𝛽 from Equation 6.13 (Eurocode) as a function of span length 𝑙 is given by:
𝛽TOTAL = 𝛽 + ∆𝛽
Δ𝛽 =0.0187 (
𝑙3.28
) − 0.00064 (𝑙
3.28)2
1 − 0.0441 (𝑙
3.28) − 0.0044 (
𝑙3.28
)2
+ 0.000255 (𝑙
3.28)2[%]
For Bridge 155.85, the calculation is:
𝛽TOTAL = 3.18% + 0.40%
= 3.58%
𝜗 = 0.23
4.2.4 Wheel Load Case
This type of model scenario takes into account the wheel loads from the power and coach cars entering and leaving the
beam. Since Amtrak inspects its track at regular intervals, the loads entering and leaving the bridge were analyzed
according to these conditions. In general, the rail irregularities have little influence on the impact response of the bridges.
However, the same is not true with the moving vehicles or sprung masses (Wang). The terms 𝑃𝑛(𝑐, 𝑡) + 𝑃𝑛(𝑐, 𝑡 − 𝑡𝑐)
represent the dynamic response excited by wheel loads following one another of the train consist, with the following
wheel having a time lag 𝑡𝑐. The terms A and B on page 10 represent the same wheel load entering and leaving the beam,
respectively.

9
FIGURE 4.2 Load configuration.
𝐹 is the resultant wheel load applied at the axle
𝐿𝑐 is the distance between the front and rear wheels of the car
𝐿𝑡 is the distance between the wheels within the truck assembly
𝐿𝑑 is the distance between the wheels of the coupler.
𝑃𝑛(𝑐, 𝑡) = Dynamic response excited by the initial wheel
𝑃𝑛(𝑐, 𝑡 − 𝑡𝑐) = Dynamic response excited by the following wheel.
Vertical deflection:
𝜈(𝑥, 𝑡) = ∑𝑞𝑛(𝑡) sin𝑛𝜋𝑥
𝑙
∞
𝑛=1
Vertical coordinate:
𝑞𝑛(𝑡) =2𝑝𝑙3
𝐸𝐼𝜋4[𝑃𝑛(𝑐, 𝑡) + 𝑃𝑛(𝑐, 𝑡 − 𝑡𝑐)]
Bending moment:
𝑀(𝑥, 𝑡) = ∑𝑞𝑚𝑛(𝑡) sin𝑛𝜋𝑥
𝑙
∞
𝑛=1
Bending moment coordinate:
𝑞𝑚𝑛(𝑡) =2𝑝𝑙
𝜋2[𝑃𝑛(𝑐, 𝑡) + 𝑃𝑛(𝑐, 𝑡 − 𝑡𝑐)]
Dynamic response excited by the front wheel:
𝑃𝑛(𝑐, 𝑡) = ∑1
(1 − 𝛼2)2 + 4(𝛽𝛼)2[𝐴 ∙ 𝐻(𝑡 − 𝑡𝑘) + (−1)𝑛+1𝐵 ∙ 𝐻 (𝑡 − 𝑡𝑘 −
𝑙
𝑐)]
𝑁
𝑘=1
10
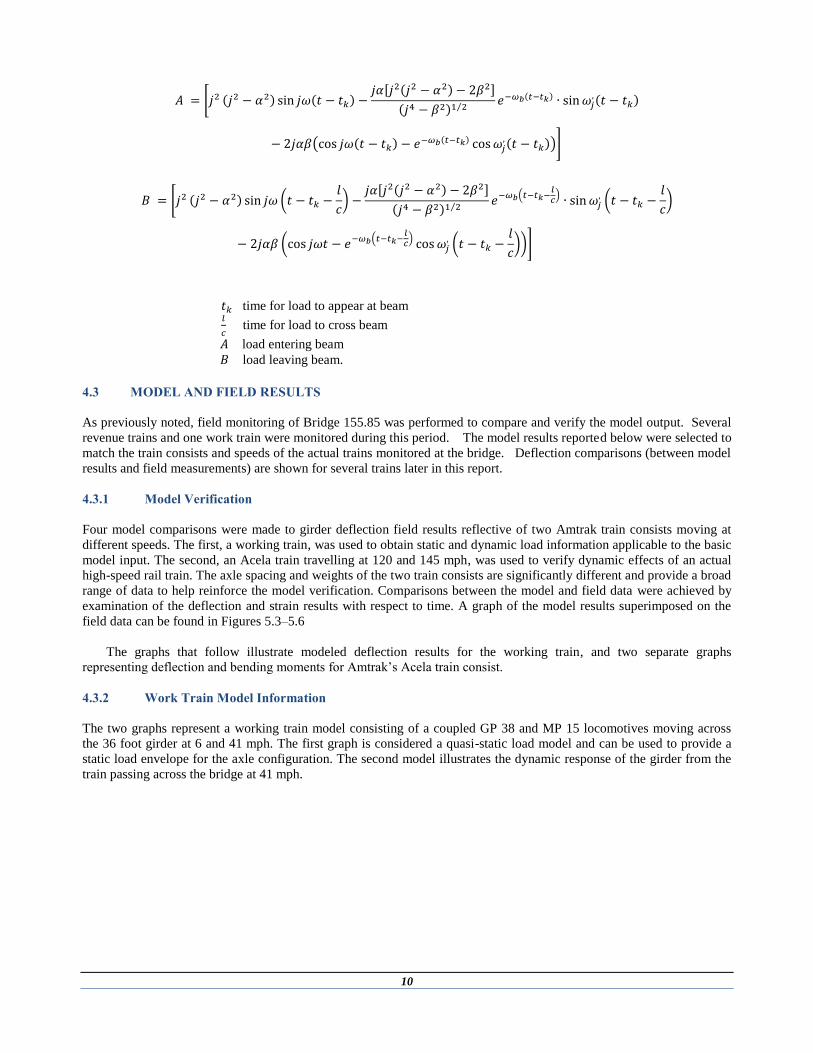
𝐴 = [𝑗2 (𝑗2 − 𝛼2) sin 𝑗𝜔(𝑡 − 𝑡𝑘) −𝑗𝛼[𝑗2(𝑗2 − 𝛼2) − 2𝛽2]
(𝑗4 − 𝛽2)1 2⁄𝑒−𝜔𝑏(𝑡−𝑡𝑘) ∙ sin𝜔𝑗
,(𝑡 − 𝑡𝑘)
− 2𝑗𝛼𝛽(cos 𝑗𝜔(𝑡 − 𝑡𝑘) − 𝑒−𝜔𝑏(𝑡−𝑡𝑘) cos𝜔𝑗,(𝑡 − 𝑡𝑘))]
𝐵 = [𝑗2 (𝑗2 − 𝛼2) sin 𝑗𝜔 (𝑡 − 𝑡𝑘 −𝑙
𝑐) −
𝑗𝛼[𝑗2(𝑗2 − 𝛼2) − 2𝛽2]
(𝑗4 − 𝛽2)1 2⁄𝑒−𝜔𝑏(𝑡−𝑡𝑘−
𝑙𝑐) ∙ sin𝜔𝑗
, (𝑡 − 𝑡𝑘 −𝑙
𝑐)
− 2𝑗𝛼𝛽 (cos 𝑗𝜔𝑡 − 𝑒−𝜔𝑏(𝑡−𝑡𝑘−𝑙𝑐) cos𝜔𝑗
, (𝑡 − 𝑡𝑘 −𝑙
𝑐))]
𝑡𝑘 time for load to appear at beam 𝑙
𝑐 time for load to cross beam
𝐴 load entering beam
𝐵 load leaving beam.
4.3 MODEL AND FIELD RESULTS
As previously noted, field monitoring of Bridge 155.85 was performed to compare and verify the model output. Several
revenue trains and one work train were monitored during this period. The model results reported below were selected to
match the train consists and speeds of the actual trains monitored at the bridge. Deflection comparisons (between model
results and field measurements) are shown for several trains later in this report.
4.3.1 Model Verification
Four model comparisons were made to girder deflection field results reflective of two Amtrak train consists moving at
different speeds. The first, a working train, was used to obtain static and dynamic load information applicable to the basic
model input. The second, an Acela train travelling at 120 and 145 mph, was used to verify dynamic effects of an actual
high-speed rail train. The axle spacing and weights of the two train consists are significantly different and provide a broad
range of data to help reinforce the model verification. Comparisons between the model and field data were achieved by
examination of the deflection and strain results with respect to time. A graph of the model results superimposed on the
field data can be found in Figures 5.3–5.6
The graphs that follow illustrate modeled deflection results for the working train, and two separate graphs
representing deflection and bending moments for Amtrak’s Acela train consist.
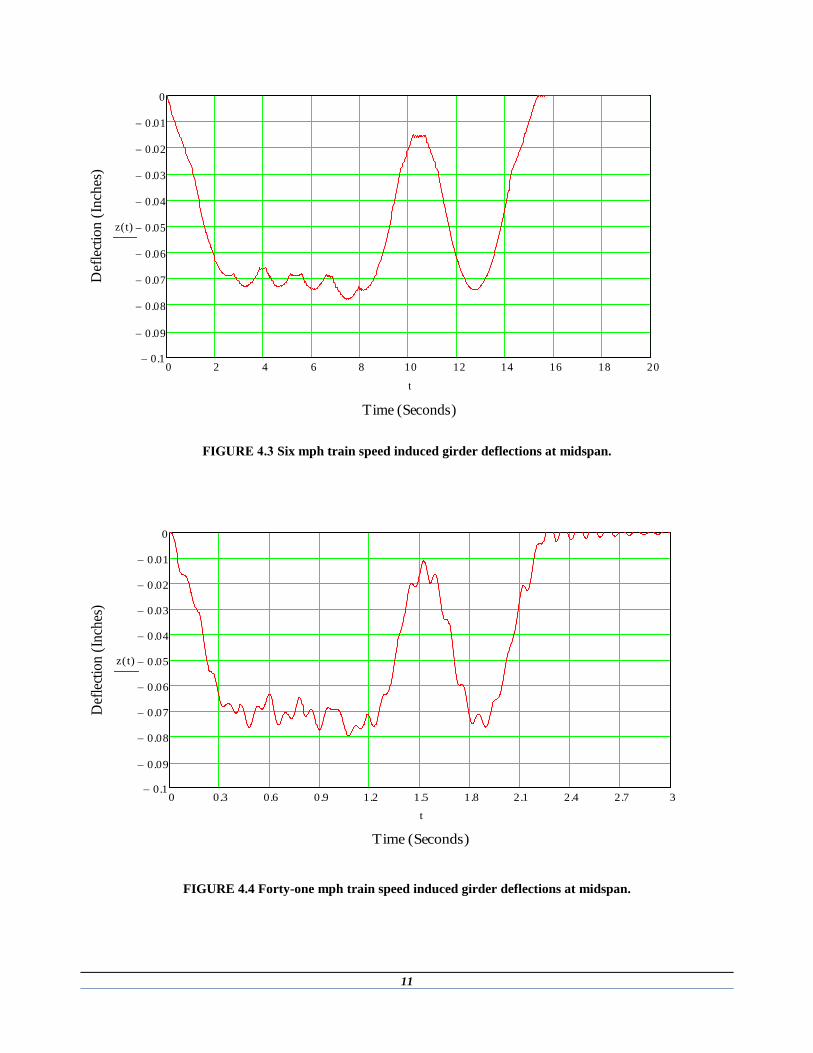
4.3.2 Work Train Model Information
The two graphs represent a working train model consisting of a coupled GP 38 and MP 15 locomotives moving across
the 36 foot girder at 6 and 41 mph. The first graph is considered a quasi-static load model and can be used to provide a
static load envelope for the axle configuration. The second model illustrates the dynamic response of the girder from the
train passing across the bridge at 41 mph.
11
FIGURE 4.3 Six mph train speed induced girder deflections at midspan.
FIGURE 4.4 Forty-one mph train speed induced girder deflections at midspan.
0 2 4 6 8 10 12 14 16 18 200.1
0.09
0.08
0.07
0.06
0.05
0.04
0.03
0.02
0.01
0
Time (Seconds)
Def
lect
ion
(In
ches
)
z t( )
t
0 0.3 0.6 0.9 1.2 1.5 1.8 2.1 2.4 2.7 30.1
0.09
0.08
0.07
0.06
0.05
0.04
0.03
0.02
0.01
0
Time (Seconds)
Def
lect
ion
(In
ches
)
z t( )
t
12
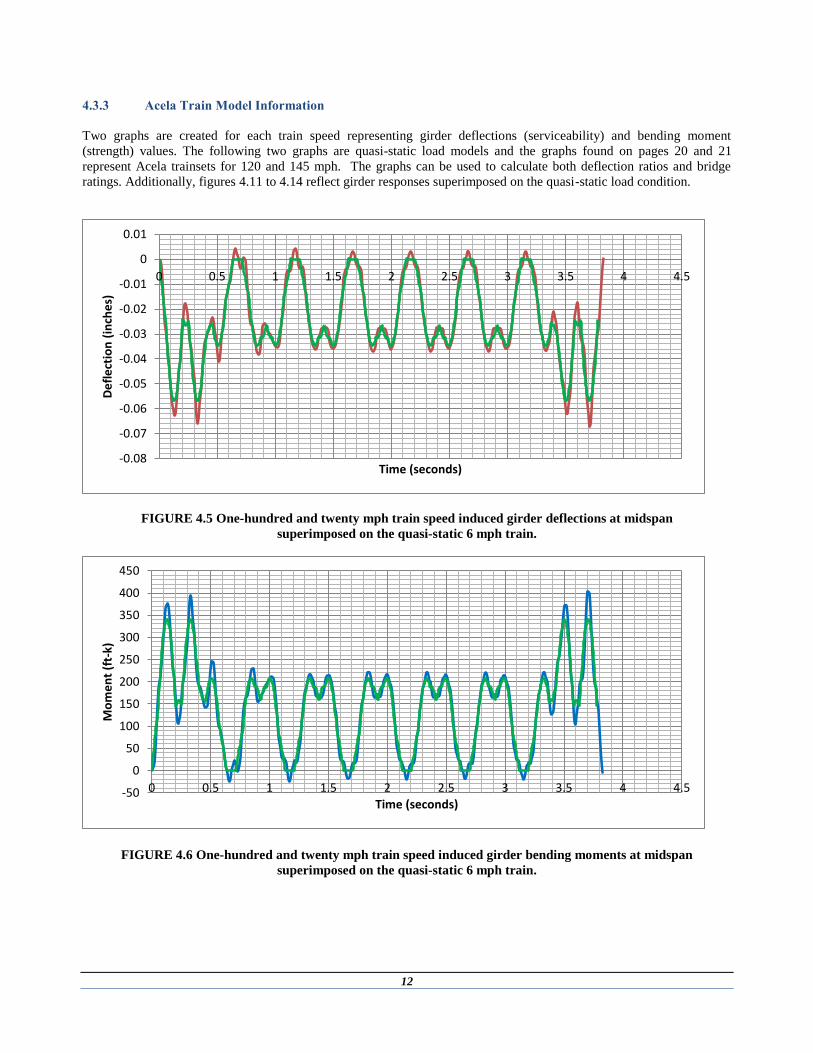
4.3.3 Acela Train Model Information
Two graphs are created for each train speed representing girder deflections (serviceability) and bending moment
(strength) values. The following two graphs are quasi-static load models and the graphs found on pages 20 and 21
represent Acela trainsets for 120 and 145 mph. The graphs can be used to calculate both deflection ratios and bridge
ratings. Additionally, figures 4.11 to 4.14 reflect girder responses superimposed on the quasi-static load condition.
FIGURE 4.5 One-hundred and twenty mph train speed induced girder deflections at midspan
superimposed on the quasi-static 6 mph train.
FIGURE 4.6 One-hundred and twenty mph train speed induced girder bending moments at midspan
superimposed on the quasi-static 6 mph train.
-0.08
-0.07
-0.06
-0.05
-0.04
-0.03
-0.02
-0.01
0
0.01
0 0.5 1 1.5 2 2.5 3 3.5 4 4.5
De
fle
ctio
n (
inch
es)
Time (seconds)
-50
0
50
100
150
200
250
300
350
400
450
0 0.5 1 1.5 2 2.5 3 3.5 4 4.5
Mo
me
nt
(ft-
k)
Time (seconds)

13
FIGURE 4.7 One-hundred and forty-five mph train speed induced girder deflections at midspan
superimposed on the quasi-static 6 mph train.
FIGURE 4.8 One-hundred and forty-five mph train speed induced girder bending moments at midspan
superimposed on the quasi-static 6 mph train.
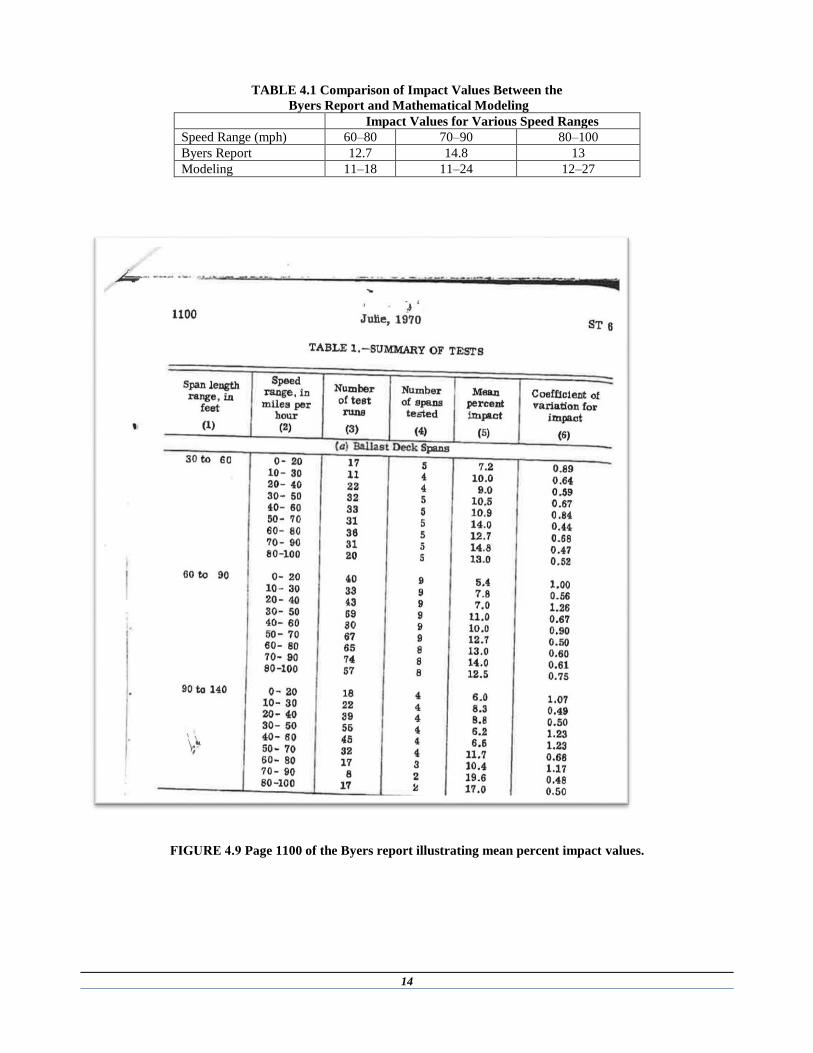
4.3.4 Byers Report
The 1970 article “Impact from Railway Loading on Steel Girder Span” prepared by William Byers, provides a table that
illustrates some of the impact values associated with several types of bridges, various train speeds, and different bridge
lengths. Examination of “Table 1—Summary of Tests,” shows increasing impact values as speed increases over lower
speed ranges. However, the observed impact values reduce over the highest range of speeds (80–100 mph). This could
represent a resonant speed observed from data taken back in 1970 and is reflected for all bridge lengths. In addition, the
values from the model are consistent with the impact values shown in the table for a ballast deck span.
-0.07
-0.06
-0.05
-0.04
-0.03
-0.02
-0.01
0
0.01
0 0.5 1 1.5 2 2.5 3 3.5
De
fle
ctio
n (
inch
es)
Time (Seconds)
-50
0
50
100
150
200
250
300
350
400
0 0.5 1 1.5 2 2.5 3 3.5
Mo
me
nt
(ft-
k)
Time (Seconds)
14
TABLE 4.1 Comparison of Impact Values Between the
Byers Report and Mathematical Modeling
Impact Values for Various Speed Ranges
Speed Range (mph) 60–80 70–90 80–100
Byers Report 12.7 14.8 13
Modeling 11–18 11–24 12–27
FIGURE 4.9 Page 1100 of the Byers report illustrating mean percent impact values.
15
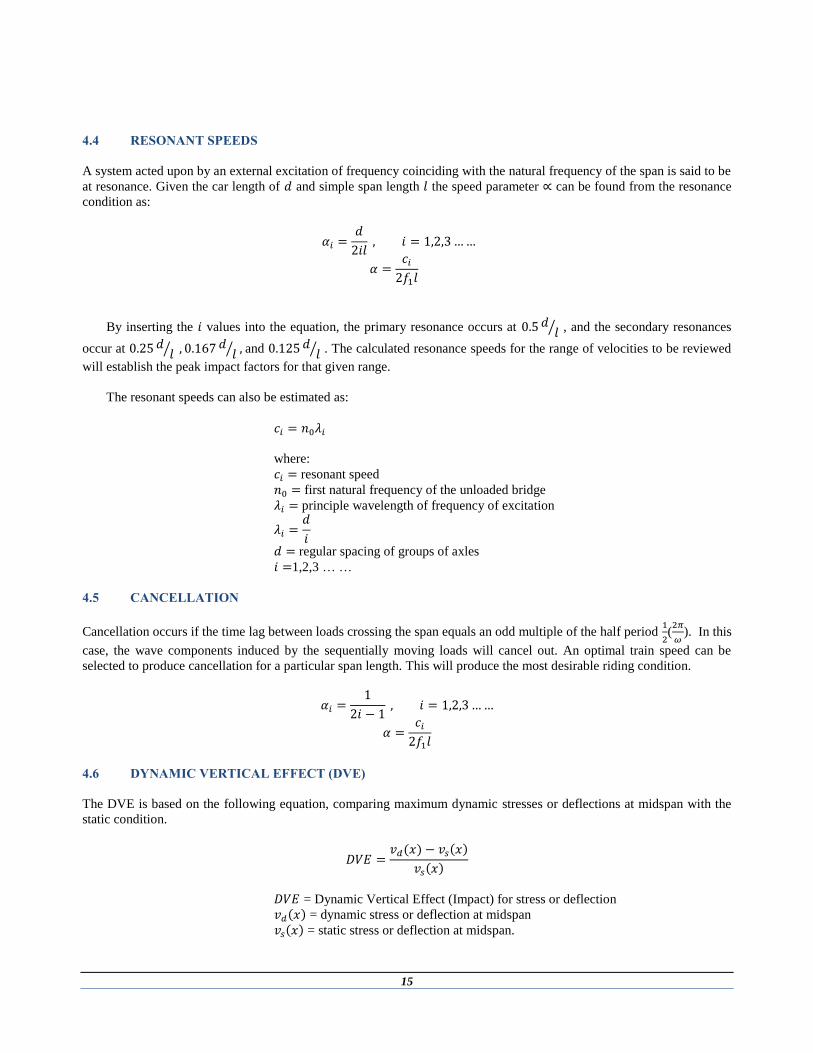
4.4 RESONANT SPEEDS
A system acted upon by an external excitation of frequency coinciding with the natural frequency of the span is said to be
at resonance. Given the car length of 𝑑 and simple span length 𝑙 the speed parameter ∝ can be found from the resonance
condition as:
𝛼𝑖 =𝑑
2𝑖𝑙 , 𝑖 = 1,2,3……
𝛼 =𝑐𝑖
2𝑓1𝑙
By inserting the 𝑖 values into the equation, the primary resonance occurs at 0.5 𝑑𝑙⁄ , and the secondary resonances
occur at 0.25 𝑑𝑙⁄ , 0.167 𝑑
𝑙⁄ , and 0.125 𝑑𝑙⁄ . The calculated resonance speeds for the range of velocities to be reviewed
will establish the peak impact factors for that given range.
The resonant speeds can also be estimated as:
𝑐𝑖 = 𝑛0𝜆𝑖
where:
𝑐𝑖 = resonant speed
𝑛0 = first natural frequency of the unloaded bridge
𝜆𝑖 = principle wavelength of frequency of excitation
𝜆𝑖 =𝑑
𝑖
𝑑 = regular spacing of groups of axles
𝑖 =1,2,3 … …
4.5 CANCELLATION
Cancellation occurs if the time lag between loads crossing the span equals an odd multiple of the half period 1
2(2𝜋
𝜔). In this
case, the wave components induced by the sequentially moving loads will cancel out. An optimal train speed can be
selected to produce cancellation for a particular span length. This will produce the most desirable riding condition.
𝛼𝑖 =1
2𝑖 − 1 , 𝑖 = 1,2,3……
𝛼 =𝑐𝑖
2𝑓1𝑙
4.6 DYNAMIC VERTICAL EFFECT (DVE)
The DVE is based on the following equation, comparing maximum dynamic stresses or deflections at midspan with the
static condition.
𝐷𝑉𝐸 =𝑣𝑑(𝑥) − 𝑣𝑠(𝑥)
𝑣𝑠(𝑥)
𝐷𝑉𝐸 = Dynamic Vertical Effect (Impact) for stress or deflection
𝑣𝑑(𝑥) = dynamic stress or deflection at midspan
𝑣𝑠(𝑥) = static stress or deflection at midspan.

16
5 FIELD TESTING
5.1 OVERVIEW
The monitoring effort was directed by Gary T. Fry, Ph.D. Dr. Fry has extensive experience in instrumentation and
monitoring of railroad bridges. Dr. Fry was assisted by W.N. Marianos, Jr., Ph.D., and Carlos Puerto. The
instrumentation and testing were conducted on November 21 and 22, 2013. The weather was overcast on November 21,
with steady drizzle and rain on November 22. The temperature was in the 30s both days.
Mr. Kevin Bollinger, project manager for Hatch Mott MacDonald, was on-site through the monitoring process. On-
track safety was provided by Amtrak watchmen/flaggers. General assistance was provided by Amtrak Bridge and
Building Department personnel. Mr. Craig Rolwood, Project Director, Structures Design for Amtrak, was on-site for the
monitoring as well.
5.2 BRIDGE DESCRIPTION
Bridge155.85 is a two-span structure crossing the Usquepaug River. The spans are steel deck plate girders with precast
concrete ballast deck panels. The deck plate girders are riveted spans fabricated prior to 1933. According to the bridge
plans, the deck panels were added around 1993.
Two railroad tracks cross the river at this site. Separate structures carry the eastbound and westbound tracks.
FIGURE 5.1 Amtrak Bridge 155.85.
The bridge was selected for monitoring by Amtrak, in coordination with Hatch Mott MacDonald personnel. It is
considered to be representative of a number of spans on the Northeast Corridor high-speed rail line.
17
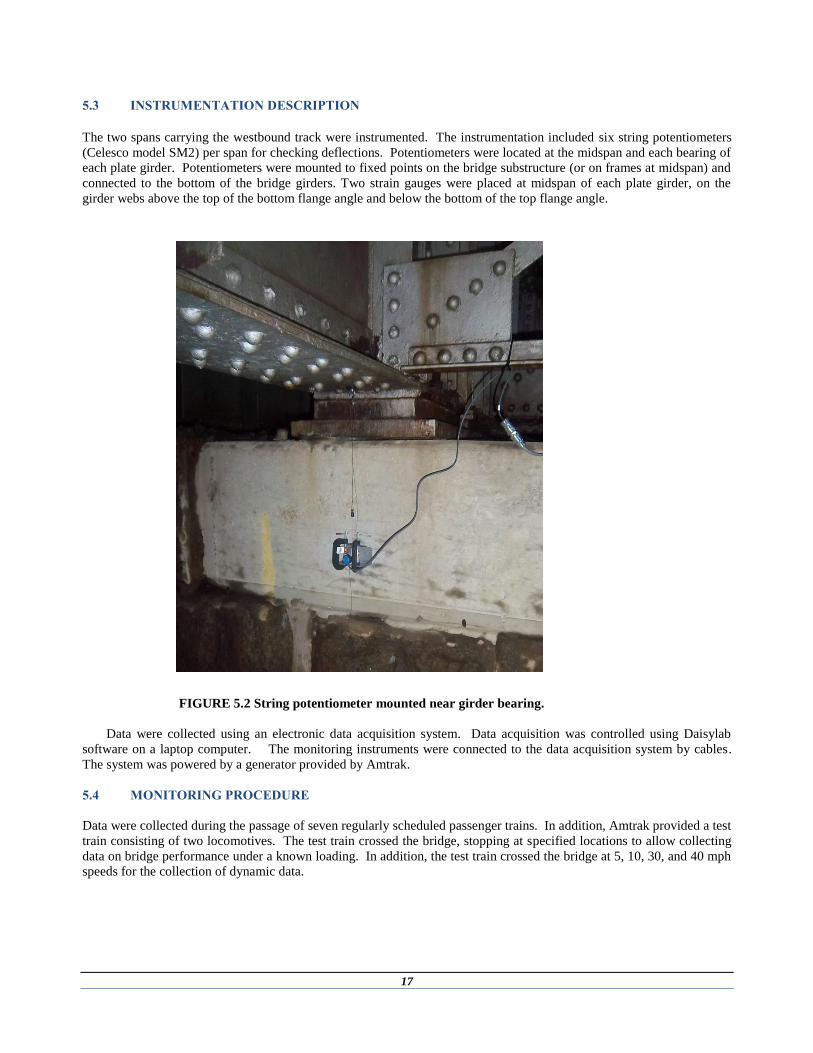
5.3 INSTRUMENTATION DESCRIPTION
The two spans carrying the westbound track were instrumented. The instrumentation included six string potentiometers
(Celesco model SM2) per span for checking deflections. Potentiometers were located at the midspan and each bearing of
each plate girder. Potentiometers were mounted to fixed points on the bridge substructure (or on frames at midspan) and
connected to the bottom of the bridge girders. Two strain gauges were placed at midspan of each plate girder, on the
girder webs above the top of the bottom flange angle and below the bottom of the top flange angle.
FIGURE 5.2 String potentiometer mounted near girder bearing.
Data were collected using an electronic data acquisition system. Data acquisition was controlled using Daisylab
software on a laptop computer. The monitoring instruments were connected to the data acquisition system by cables.
The system was powered by a generator provided by Amtrak.
5.4 MONITORING PROCEDURE
Data were collected during the passage of seven regularly scheduled passenger trains. In addition, Amtrak provided a test
train consisting of two locomotives. The test train crossed the bridge, stopping at specified locations to allow collecting
data on bridge performance under a known loading. In addition, the test train crossed the bridge at 5, 10, 30, and 40 mph
speeds for the collection of dynamic data.
18
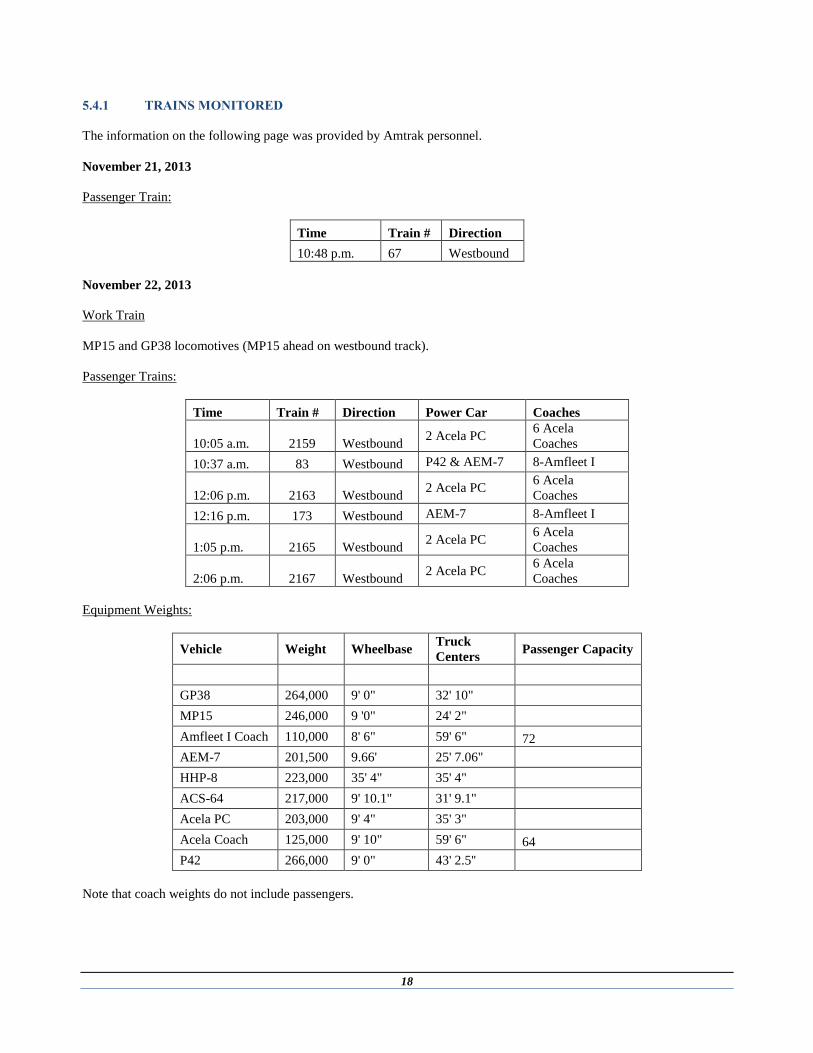
5.4.1 TRAINS MONITORED
The information on the following page was provided by Amtrak personnel.
November 21, 2013
Passenger Train:
Time Train # Direction
10:48 p.m. 67 Westbound
November 22, 2013
Work Train
MP15 and GP38 locomotives (MP15 ahead on westbound track).
Passenger Trains:
Time Train # Direction Power Car Coaches
10:05 a.m. 2159 Westbound 2 Acela PC
6 Acela
Coaches
10:37 a.m. 83 Westbound P42 & AEM-7 8-Amfleet I
12:06 p.m. 2163 Westbound 2 Acela PC
6 Acela
Coaches
12:16 p.m. 173 Westbound AEM-7 8-Amfleet I
1:05 p.m. 2165 Westbound 2 Acela PC
6 Acela
Coaches
2:06 p.m. 2167 Westbound 2 Acela PC
6 Acela
Coaches
Equipment Weights:
Vehicle Weight Wheelbase Truck
Centers Passenger Capacity
GP38 264,000 9' 0" 32' 10"
MP15 246,000 9 '0" 24' 2"
Amfleet I Coach 110,000 8' 6" 59' 6" 72
AEM-7 201,500 9.66' 25' 7.06"
HHP-8 223,000 35' 4" 35' 4"
ACS-64 217,000 9' 10.1" 31' 9.1"
Acela PC 203,000 9' 4" 35' 3"
Acela Coach 125,000 9' 10" 59' 6" 64
P42 266,000 9' 0" 43' 2.5''
Note that coach weights do not include passengers.

19
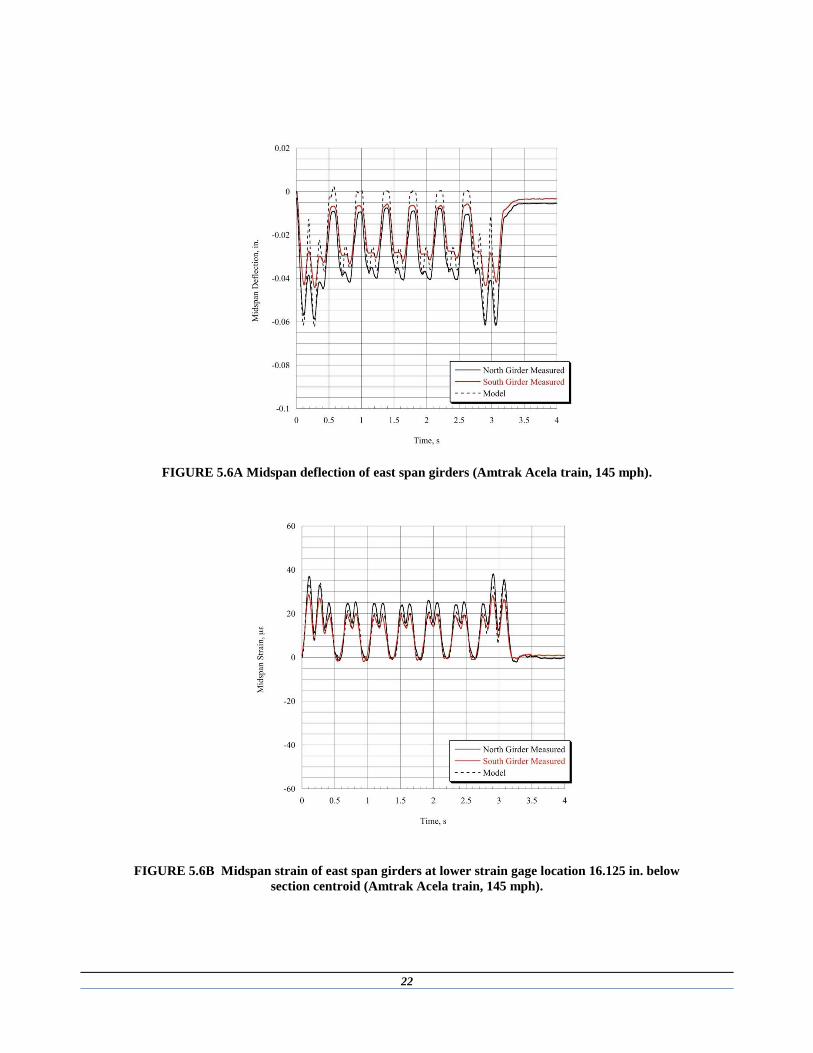
5.4.2 MONITORING RESULTS
The following charts show the calculated model results for several trains overlaid with the field measurements for these
trains. The measurements compared are for midspan deflections. Note that since revenue trains could not be stopped on
the bridge for static measurements, calculation of impact factors cannot be directly made from field measurements.
FIGURE 5.3A Midspan deflection of east span girders (Amtrak work train, 6 mph).
FIGURE 5.3B Midspan strain of east span girders at lower strain gage location 16.125 in. below section centroid
(Amtrak work train, 6 mph).
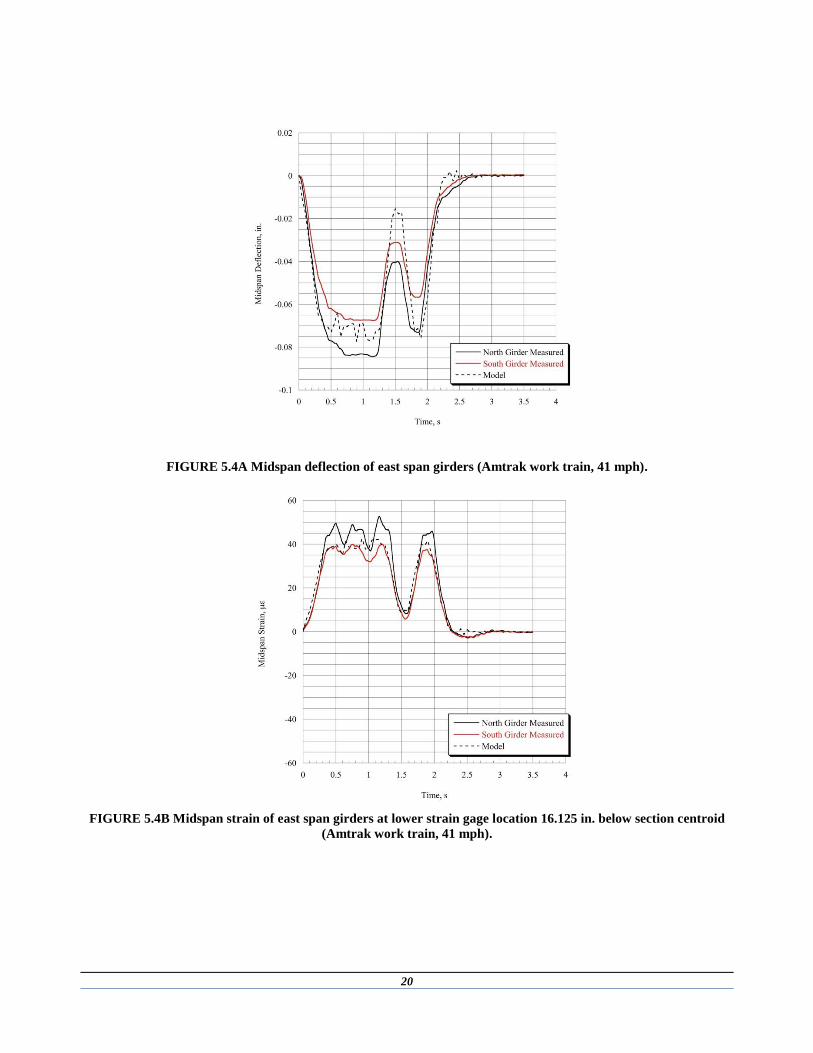
20
FIGURE 5.4A Midspan deflection of east span girders (Amtrak work train, 41 mph).
FIGURE 5.4B Midspan strain of east span girders at lower strain gage location 16.125 in. below section centroid
(Amtrak work train, 41 mph).

21
FIGURE 5.5A Midspan deflection of east span girders (Amtrak Acela train, 120 mph).
FIGURE 5.5B Midspan strain of east span girders at lower strain gage location 6.125 in. below
section centroid (Amtrak Acela train, 120 mph).
22
FIGURE 5.6A Midspan deflection of east span girders (Amtrak Acela train, 145 mph).
FIGURE 5.6B Midspan strain of east span girders at lower strain gage location 16.125 in. below
section centroid (Amtrak Acela train, 145 mph).
23
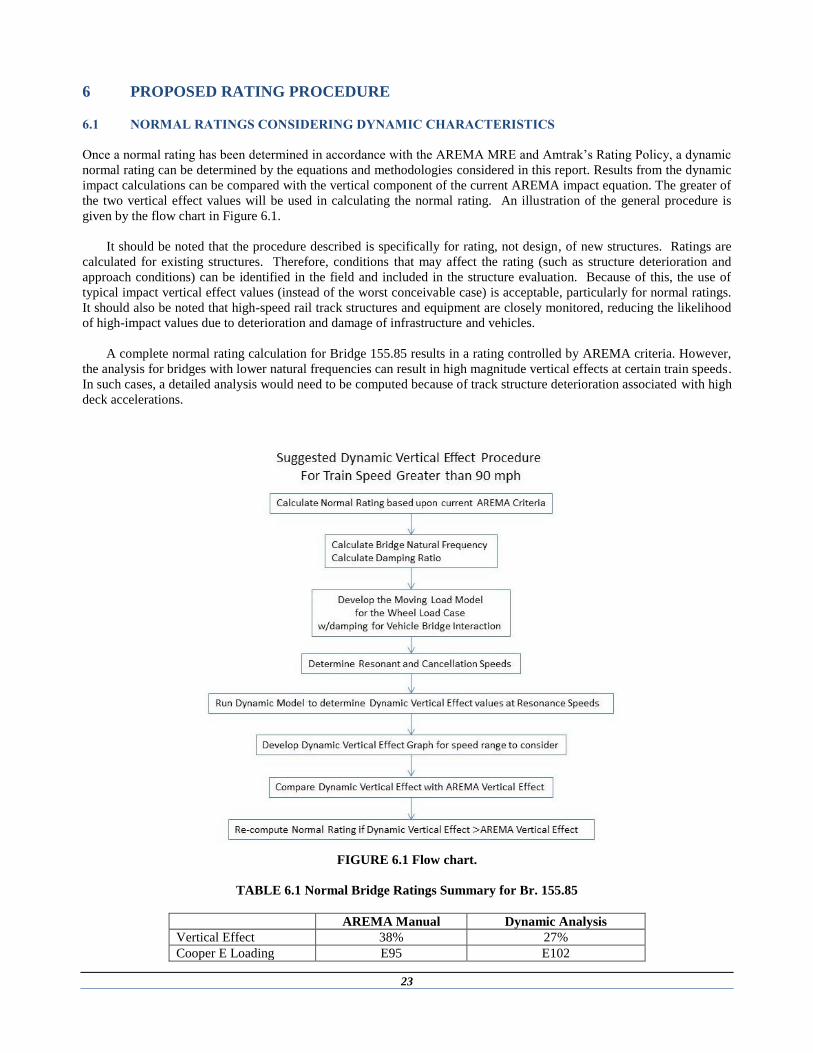
6 PROPOSED RATING PROCEDURE
6.1 NORMAL RATINGS CONSIDERING DYNAMIC CHARACTERISTICS
Once a normal rating has been determined in accordance with the AREMA MRE and Amtrak’s Rating Policy, a dynamic
normal rating can be determined by the equations and methodologies considered in this report. Results from the dynamic
impact calculations can be compared with the vertical component of the current AREMA impact equation. The greater of
the two vertical effect values will be used in calculating the normal rating. An illustration of the general procedure is
given by the flow chart in Figure 6.1.
It should be noted that the procedure described is specifically for rating, not design, of new structures. Ratings are
calculated for existing structures. Therefore, conditions that may affect the rating (such as structure deterioration and
approach conditions) can be identified in the field and included in the structure evaluation. Because of this, the use of
typical impact vertical effect values (instead of the worst conceivable case) is acceptable, particularly for normal ratings.
It should also be noted that high-speed rail track structures and equipment are closely monitored, reducing the likelihood
of high-impact values due to deterioration and damage of infrastructure and vehicles.
A complete normal rating calculation for Bridge 155.85 results in a rating controlled by AREMA criteria. However,
the analysis for bridges with lower natural frequencies can result in high magnitude vertical effects at certain train speeds.
In such cases, a detailed analysis would need to be computed because of track structure deterioration associated with high
deck accelerations.
FIGURE 6.1 Flow chart.
TABLE 6.1 Normal Bridge Ratings Summary for Br. 155.85
AREMA Manual Dynamic Analysis
Vertical Effect 38% 27%
Cooper E Loading E95 E102

24
7 BRIDGE LENGTH AND TRAIN SPEED COMPARISONS
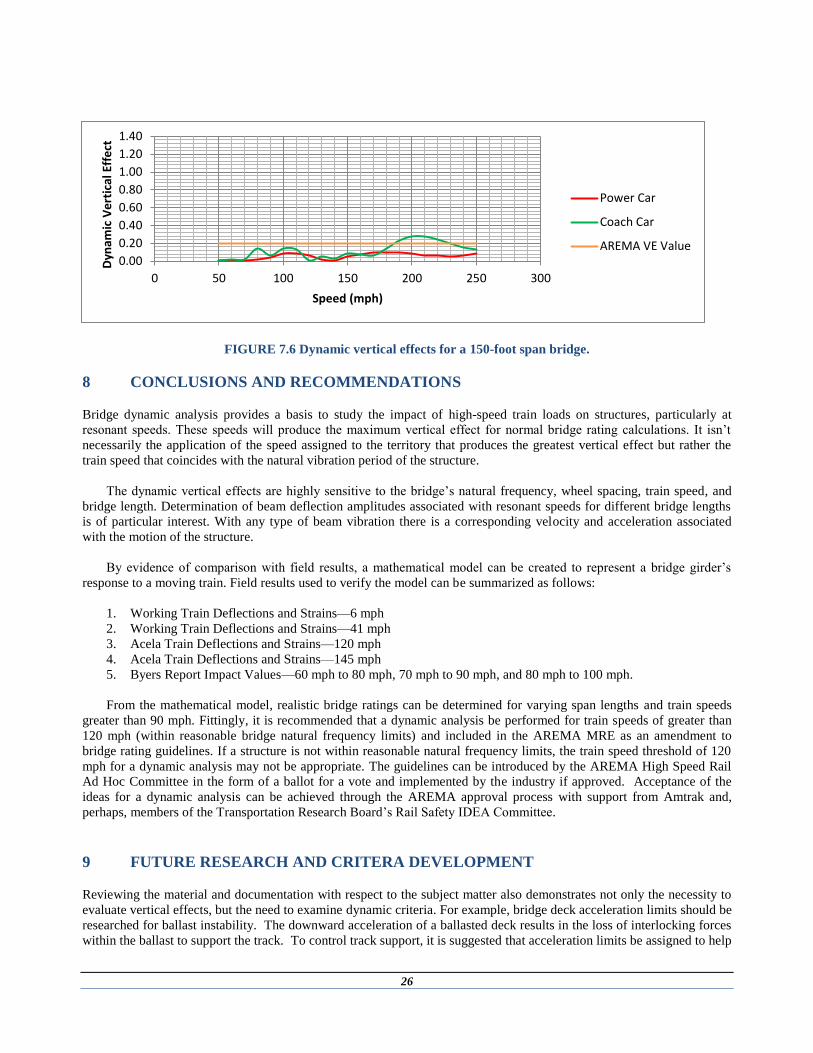
7.1 COMPARISON OF BRIDGE LENGTHS
Figures 7.1–7.6 illustrate the dynamic vertical effect versus train speed for bridge span lengths of 15, 36, 60, 80, 100, and
150 feet. The orange line represents AREMA’s current vertical effect impact value limit for a 90 mph train (maximum
train speed). The field observations recorded in November 2013 for bridge 155.85 compare well with the calculated
deflection values for the 36-foot bridge length. The impact values associated with all the girder spans are also plotted for
comparison. The dynamic vertical effect for each bridge length is calculated with different known bridge frequencies and
damping for a ballasted steel girder bridge (Fryba 1999). The natural frequency and wheel spacing greatly influence the
magnitude of the responses, and any final bridge evaluation needs to take into account calculated bridge natural
frequencies.
Graphs representing span lengths 15, 60, and 80 feet illustrate coach car vertical effect values of 75% to 85%, and
should be considered in the analysis of a bridge load rating. Even though the coach car is not as heavy as a power car, it
has similar deflection values to that of a power car and need to be taken into consideration. These observations, which
are significant, also demonstrate that the Coach Car Cooper E Equivalents associated with these impact values are below
the normal loading rating of a typical E80 North American Railroad Bridge.
FIGURE 7.1 Dynamic vertical effects for a 15-foot span bridge.
FIGURE 7.2 Dynamic vertical effects for Bridge 155.85 (36-foot span).
0.00
0.20
0.40
0.60
0.80
1.00
1.20
1.40
0 50 100 150 200 250 300
Dyn
amic
Ve
rtic
al E
ffe
ct
Speed (mph)
Power Car
Coach Car
AREMA VE Value
0.00
0.20
0.40
0.60
0.80
1.00
1.20
1.40
0 50 100 150 200 250 300
Dyn
amic
Ve
rtic
al E
ffe
ct
Speed (mph)
Power Car
Coach Car
AREMA VE Value

25
FIGURE 7.3 Dynamic vertical effects for a 60-foot span bridge.
FIGURE 7.4 Dynamic vertical effects for an 80--foot span bridge.
FIGURE 7.5 Dynamic vertical effects for a 100-foot span bridge.
-0.20
0.00
0.20
0.40
0.60
0.80
1.00
1.20
1.40
0 50 100 150 200 250 300
Dyn
amic
Ve
rtic
al E
ffe
ct
Speed (mph)
Power Car
Coach Car
AREMA VE Value
0.00
0.20
0.40
0.60
0.80
1.00
1.20
1.40
0 50 100 150 200 250 300
Dyn
amic
Ve
rtic
al E
ffe
ct
Speed (mph)
Power Car
Coach Car
AREMA VE Value
-0.20
0.00
0.20
0.40
0.60
0.80
1.00
1.20
1.40
0 50 100 150 200 250 300
Dyn
amic
Ve
rtic
al E
ffe
ct
Speed (mph)
Power Car
Coach Car
AREMA VE Value
26
FIGURE 7.6 Dynamic vertical effects for a 150-foot span bridge.
8 CONCLUSIONS AND RECOMMENDATIONS
Bridge dynamic analysis provides a basis to study the impact of high-speed train loads on structures, particularly at
resonant speeds. These speeds will produce the maximum vertical effect for normal bridge rating calculations. It isn’t
necessarily the application of the speed assigned to the territory that produces the greatest vertical effect but rather the
train speed that coincides with the natural vibration period of the structure.
The dynamic vertical effects are highly sensitive to the bridge’s natural frequency, wheel spacing, train speed, and
bridge length. Determination of beam deflection amplitudes associated with resonant speeds for different bridge lengths
is of particular interest. With any type of beam vibration there is a corresponding velocity and acceleration associated
with the motion of the structure.
By evidence of comparison with field results, a mathematical model can be created to represent a bridge girder’s
response to a moving train. Field results used to verify the model can be summarized as follows:
1. Working Train Deflections and Strains—6 mph
2. Working Train Deflections and Strains—41 mph
3. Acela Train Deflections and Strains—120 mph
4. Acela Train Deflections and Strains—145 mph
5. Byers Report Impact Values—60 mph to 80 mph, 70 mph to 90 mph, and 80 mph to 100 mph.
From the mathematical model, realistic bridge ratings can be determined for varying span lengths and train speeds
greater than 90 mph. Fittingly, it is recommended that a dynamic analysis be performed for train speeds of greater than
120 mph (within reasonable bridge natural frequency limits) and included in the AREMA MRE as an amendment to
bridge rating guidelines. If a structure is not within reasonable natural frequency limits, the train speed threshold of 120
mph for a dynamic analysis may not be appropriate. The guidelines can be introduced by the AREMA High Speed Rail
Ad Hoc Committee in the form of a ballot for a vote and implemented by the industry if approved. Acceptance of the
ideas for a dynamic analysis can be achieved through the AREMA approval process with support from Amtrak and,
perhaps, members of the Transportation Research Board’s Rail Safety IDEA Committee.
9 FUTURE RESEARCH AND CRITERA DEVELOPMENT
Reviewing the material and documentation with respect to the subject matter also demonstrates not only the necessity to
evaluate vertical effects, but the need to examine dynamic criteria. For example, bridge deck acceleration limits should be
researched for ballast instability. The downward acceleration of a ballasted deck results in the loss of interlocking forces
within the ballast to support the track. To control track support, it is suggested that acceleration limits be assigned to help
0.00
0.20
0.40
0.60
0.80
1.00
1.20
1.40
0 50 100 150 200 250 300
Dyn
amic
Ve
rtic
al E
ffe
ct
Speed (mph)
Power Car
Coach Car
AREMA VE Value
27
reduce the potential for ballast instability. In addition to bridge deck accelerations, other areas of research or criteria
development may include, are but not limited to:
Torsional vibration
Bridge natural frequency limits
Set of formal procedures for a complete analysis
Suspension systems (outside scope of project).
10 REFERENCES
Amtrak, Locomotive and Car Diagrams (Permission granted by Amtrak for its use).
Amtrak, Engineering Practices, Bridge Load Rating Policy, Amtrak, Philadelphia Pa., 2011.
Amtrak, Plans: “N.Y. NH. & H. R. R. New London to Providence Bridge 155.85 over Usquepaug River, 1.89 Miles
East of Kenyons Sta. R.I.”, Amtrak, Philadelphia, Pa., Nov. 1904.
AREMA, Manual of Railway Engineering, American Railway Engineering and Maintenance-of-Way Association,
Lanham Md., 2009.
Biggs, J., Introduction to Structural Dynamics, McGraw–Hill, New York, N.Y., 1964.
Byers, W., “Impact From Railway Loading on Steel Girder Spans,” Journal of the Structural Division, Proceedings
of the American Society of Civil Engineers, June 1970, pp. 1093–1103.
Eurocode 1: Actions on structures—Part 2 Traffic Loads on Bridges, British Standard BS EN 1991-2:2003,
Eurocode, Brussels, Belgium, 2010.
Fryba, L., Dynamics of Railway Bridges, 1st ed., Thomas Telford House, London, England, 1996.
Fryba, L., Vibration of Solids and Structures under Moving Loads, 3rd ed., Thomas Telford House, London,
England, 1999.
Kunz, F.C., Design of Steel Bridges, 1st ed., McGraw–Hill Book Co., New York, N.Y., 1915.
Museros, P., Romero, M.L., Poy, A., Alarcon, E., “Advances in the analysis of short span railway bridges for high-
speed lines,” Computers & Structures, Vol. 2002, 80 pp. 2121–2132.
Paz, M. and W. Leigh, Structural Dynamics Theory and Computation, 5th ed., Springer Science Business Media,
LLC, New York, N.Y., 2004.
Unsworth, J.F., Design of Modern Steel Railway Bridges, CRC Press, Boca Raton, Fla., 2010.
Waddell, J.A.L., Bridge Engineering, 1st ed., John Wiley & Sons, Inc., New York, N.Y., 1916.
Yang, Y.-B., Vehicle–Bridge Interaction Dynamics: With Applications to High Speed Railways, World Scientific
Publishing Company, Inc., River Edge, N.J., 2004.
Yang, Y.-Bin, J.-D. Yau, and L.-C. Hsu, “Vibration of simple beams due to trains moving at high speeds,”
Engineering Structures, Vol. 19, No. 11, 1977, pp. 936–944.
Zacher, M., “Dynamic of Railroad Bridges,” presentation at the 5th ADAMS/Rail User Conference, Haarlem, the
Netherlands, 2000.