Embed Size (px)
Citation preview

Rainfall Frequency/Magnitude Atlas
for the
SouthCentral United States
by
Gregory E. Faiers
Department of Geography
University of Pittsburgh at Johnstown
Johnstown, PA 15902
Barry D. Keim
Department of Geography
University of New Hampshire
Durham, NH 03824
Robert A. Muller, Director
Southern Regional Climate Center
Department of Geography and Anthropology
Louisiana State University
Baton Rouge, LA 70803
SRCC Technical Report 971
Geoscience Publications
Department of Geography and Anthropology
Louisiana State University
Baton Rouge, LA

CONTENTS
Introduction
Justification
Geographic Patterns and Relationships to TP40
Rainfall Frequency/Magnitude Maps
Appendix
Bibliography
Frequencymagnitude relationships of heavyrainfall events are commonly utilized in designprojects by providing useful guidelines toengineers, planners, and hydrologists aboutfuture expectable storm events. Despite its age,the most widely used publication employingthese relationships is Technical Paper No. 40(hereafter referred to as TP40) by DavidHershfield (1961). TP40 examined extremerainfall events in the United States and provided“expectable” precipitation amounts forrecurrence intervals from 1 to 100 years fordurations from 30 minutes to 24 hours. Otherpapers addressing this topic include WeatherBureau Technical Papers No. 2 (1947) onmaximum recorded rainfall from 5 minutes to24 hours at firstorder stations; No. 24 (1954)rainfall return periods for 5 minutes to 4 hours;No. 29 (1958) which presents rainfall intensitydurationfrequency distributions; No. 49 (1964)on 2 to 10 day rainfalls for return periods from 2to 100 years; and Hydro35 (Frederick et al.,1977) which examines 5 to 60 minute rainfallfor the central and eastern United States.
The rainfall frequency and magnitudepatterns illustrated in TP40 need to bereexamined:
* because there are 35 additional years ofprecipitation data since its publication in 1961
* because of recent concerns aboutglobal climate change
* because of the short periods of recordin TP40 with less than half of the stationshaving more than 15 years of record; and
* because of the very generalizedanalysis for the 48 conterminous states.
There can also be great spatial variabilityin frequencymagnitude relationships over shortdistances, especially in mountainous areas(Haiden et al., 1992; Zurndorfer, 1990).
Another serious limitation is that since
the publication of TP40, it has become widelyaccepted that there is no single statisticaldistribution which provides the best fit forextreme precipitation data in all climate regionsof the country (Sevruk and Geiger, 1981; Huff1990). Alternative statistical approaches havealso been suggested in recent publications(Hosking, 199; Huff and Angel, 1992; Wilks,1992; Zwiers and Ross, 1992). Concerns werefurther increased by the findings of Sorrell andHamilton (1989) who found that the 24hour,100year value from TP40 was exceeded over 3times more often than expected in Michigan andby Angel and Huff (1991) who found thatIllinois and Wisconsin had almost twice asmany 100year, 24hour events as anticipated byTP40.
In the South Central United States,extreme precipitation events, and the floods theygenerate have occurred frequently in the 1980sand 1990s. Recent examples include:
* June 26July 1, 1989 – rainfall up to 20inches from Tropical Storm Allison resulted inflooding across Much of Louisiana and portionsof eastern Texas and western Mississippi;
* November 7, 1989 – heavy rains of upto 19 inches fell in the New Orleans area(NOAA, 1989);
* May 18, 1990 – 13 inches of rain wereobserved in just nine hours at Hot Springs,Arkansas;
* October 5, 1991 – a 75 minuteaccumulation of 6 inches, along with a 12houraccumulation of 10 inches, was reported atTuskahoma, Oklahoma;
* October 1519, 1994 – storm totals ofnear 30 inches occurred north of Houston and 8inch storm totals or more were widespreadacross southeastern Texas (Muller and Faiers,1995);
* May 89, 1995 – rainfall in excess of25 inches fell in parts of Hancock County,
INTRODUCTION
Mississippi, with 10 to 20 inches over much ofmetropolitan New Orleans accompanied bysignificant flooding over much of lowlyingNew Orleans and Slidell, Louisiana (Muller etal., 1995),
The question of an increasing frequencyof events in recent decades has also been notedin professional publications and reports.Belville and Stewart (1983) found an unusualnumber of rain events in excess of 10 inches inLouisiana in 1982 and 1983. Widespread recordflooding associated with persistent frontalrainfall was reported during March and April of1990 in eastern Texas and Oklahoma by Jensen(1990). It was also found that recentmagnitudes of New Orleans storms weresignificantly larger than storms over thepreceding 100 years and heavy rainfall eventsappear to be increasing in frequency (Keim andMuller, 1992; 1993). Muller and Faiers (1984)had found earlier that most record peak stageson rivers in the EastCentral climate division of Louisiana had occurred since 1973 with anincreasing trend throughout the 1970s and early1980s. Hirschboeck and Coxe (1991) detected
increases in urban flash flooding in theLouisiana cities of Monroe and Alexandria. Finally, Keim (1997) found an increasing trendin heavy rainfalls at several locations along anaxis extending from northeastern Texas throughthe Appalachians.
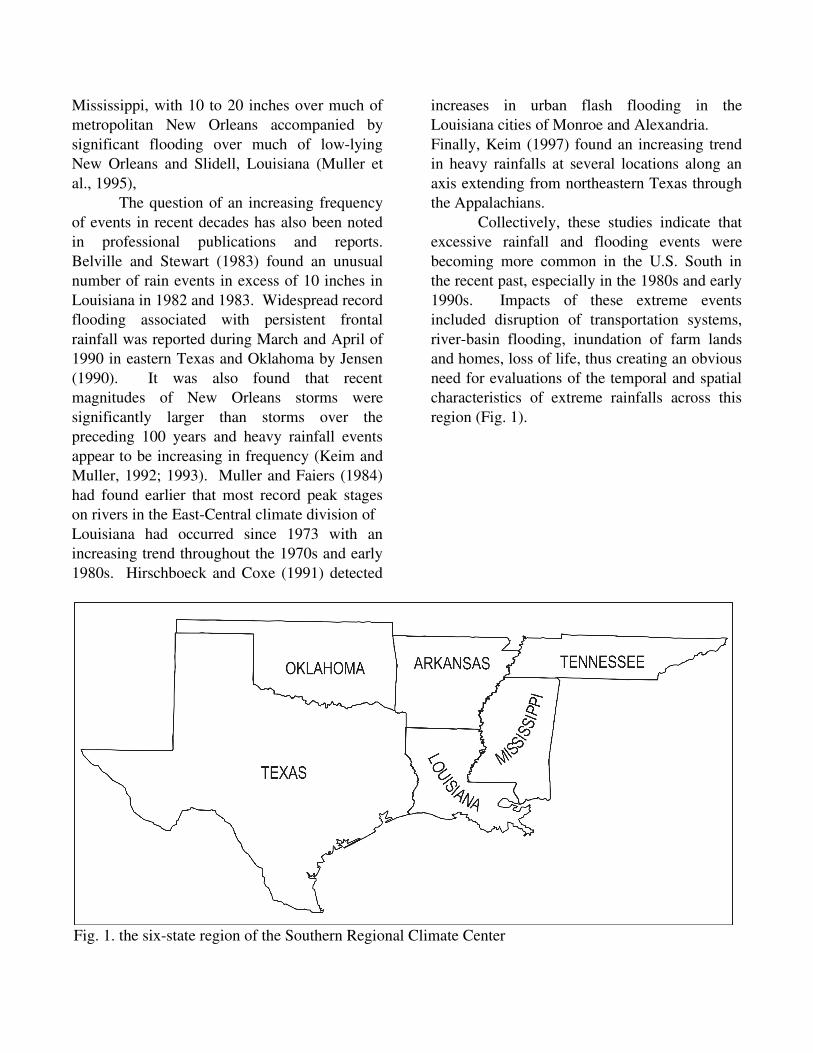
Collectively, these studies indicate thatexcessive rainfall and flooding events werebecoming more common in the U.S. South inthe recent past, especially in the 1980s and early1990s. Impacts of these extreme eventsincluded disruption of transportation systems,riverbasin flooding, inundation of farm landsand homes, loss of life, thus creating an obviousneed for evaluations of the temporal and spatialcharacteristics of extreme rainfalls across thisregion (Fig. 1).
Fig. 1. the sixstate region of the Southern Regional Climate Center

Several of the Regional Climate Centers (RCCs)have undertaken reevaluations of extremerainfall frequencymagnitude relationshipswithin their respective regions (Changnon et al.,1992; Huff and Angel. 1992; Knappenbergerand Michaels, 1993; Wilks and Cember, 1993).A pilot study was also undertaken by theSouthern RegionalClimate Center (SRCC) to evaluate extremerainfall frequencymagnitude relationshipsacross the state of Louisiana (Faiers et al.,1994a). In this study, methods used weresimilar to those employed in TP40, but longerperiods of record, including data through the1980s and part of the 1990s, were used to derivethe quantile estimates; quantiles are estimatesrepreseting return periods and associated stormmagnitudes. Patterns from the updated maps forLouisiana were compared to those in TP40 (Fig.2). Overall storm magnitudes did not varygreatly between the two studies, but the SRCCproduct depicted a more complex spatial patternwith shifts in the regions of extreme rainfallmaxima from southeastern to southwesternLouisiana.
The findings from this pilot study, aswell as results from other regional studies,verified the need for a regional format across thesixstate region of the SRCC, and for greaterspatial resolution of the “expected” extremerainfalls than depicted in TP40. Furthermore,frequencymagnitude relationships of extremerainfall have had a high user demand, rankingamong the most commonly requested data setsat the SRCC. As a result, deriving accuratefrequencymagnitude estimates of extremeprecipitation across the six southern states of theFig. 2. Twentyfourhour 2year rainfalls inLouisiana according to the Technical Paper No. 40and our updated version using similar methods.Source: Faiers et al., 1994a.
JUSTIFICATION

SRCC (Fig. 2) became part of the researchagenda at the SRCC. This research yieldedmore regionally representative estimates thanTP40, and it should support improved drainageand containment designs. This documentsummarizes the new estimates of therelationships for durations of 3, 6, 12,
and 24 hours for 2, 5, 10, 25, 50, and 100year return periods with regionalscale maps.Text sections describe the geographical patternsand the primary differences to TP40. Thedevelopment of the data sets and methods areincluded as an appendix.

ThreeHour Storms
Figures 3.1 to 3.6 represent the rainfallmagnitudes for 3hour storms at each of theselected recurrence intervals. Much of thegeographical pattern that emerges here becomeseven more apparent at the longer recurrenceintervals and extended durations. The generalpattern of quantile estimates depicts a regionalmaxima along the Gulf Coast extending fromsoutheastern Texas into southwestern Louisiana.Another area with relatively large stormmagnitudes occurs over the coastal areas ofsoutheastern Louisiana and coastal Mississippi.At the longer recurrence intervals, thesoutheastern Texas to southwestern Louisianacoastal maxima becomes larger than theestimates for southeastern Louisiana and coastalMississippi. Storm magnitudes decrease to thenorth and west of these two maximum areasalong the coast, with another local maximumdeveloping over the OuachitaOzark mountainregions of Arkansas and eastern Oklahoma wereorographic precipitation increases stormmagnitudes. Another region of greater stormmagnitudes generated by orographicprecipitation occurs along the BalconesEscarpment and Hill Country west andsouthwest of Austin and San Antonio extendingsouthwestward towards the Rio Grande River.This is an area plagued by an unusually highnumber of catastrophic flood events(Hirschboeck, 1987a).
In eastern Tennessee, there is again astrong orographic increase of averageprecipitation and magnitudes of individualstorm events across the western margins of the
Great Smoky Mountains and the Appalachiansystem of mountains and valleys as a whole. Asdetailed by Haiden et al. (1992) local variationsin extreme rainfall magnitudes can vary greatlyover short distances, but they cannot be depictedin this regional study because of thegeographical scale of the maps and also becauseof insufficient station densities in themountainous terrain, with high mountain crestsadjacent to deep valleys.
The upper tributaries of the TennesseeRiver system have eroded "rainshadow" valleyswhere average precipitation and the magnitudesof extreme events tend to be significantly lowerthan adjacent uplands. The very broad HolstonRiver Valley northeast of Knoxville is a rainshadow region large enough to be representedon the maps. Storm magnitudes there are muchlower and similar to those found in the semiaridand arid regions of western Texas andOklahoma. Another smaller region withrelatively lower magnitudes is located west ofLake Pontchartrain is southern Louisiana. Theanomalous region was also identified in aregional study conducted by the NationalWeather Service Office of Hydrology (Vogel,1992). At this time, a definitive explanation forthis anomaly has not been found; however someatmospheric mesoscale interaction with LakePontchartrain during extreme rainfall events iscertainly a possibility.
When comparing the 3hour storm mapsto those in TP40, the 2year recurrence intervalis strikingly similar in magnitude and spatialpattern, but the likeness decreases withsuccessively longer recurrence intervals. This isnot surprising because TP40 was able toaccurately estimate shorter recurrence intervalseven with its short station records, but at longer
GEOGRAPHICAL PATTERNS AND RELATIONSHIPS TO TP40
Figures 3.1 through 6.6 referred to in this section are
all located in the atlas section starting on page 11

recurrence intervals, these records wereinadequate. With the longer periods of recordused in this analysis, we are more comfortablewith the longer recurrence interval estimatesthan those displayed in TP40. In both versionsof the 3hour 2year storm, the 3.5inch isohyetextends roughly from coastal Mississippiwestward along the coast. The SRCC version,however, continues this interrupted isohyetwestward to Gavleston, while TP40 terminatesthis isohyet south of Lake Charles, LA. The 3inch and 2.5 inch isohyets in the SRCC map aredisplaced farther to the north than in TP40, andTP40 does not depict the orographicenhancements of the Ouachitas and Ozarks,which are not captured at any recurrenceinterval nor for any duration in TP40. Thisnorthward displacement suggests higher rainfalltotals in the SRCC maps. The two documentstend to be more similar to the west and east,with the following exceptions depicted in theSRCC maps: (1) the recognition of theBalcones Escarpment and Hill Country in Texasas a zone of increased storm magnitudes, (2)more of a southeastnorthwest orientation of theisohyets in extreme western Texas, which mirrorthe orientation of the Davis Mountains, (3) agreater emphasis placed on the rain shadow ineastern Tennessee, and (4) the lower magnitudeanomaly depicted west of Lake Pontchartrain inLouisiana.
These differences appear in maps of alldurations and recurrence intervals, with thedifferences accentuated at longer recurrenceintervals. Finally, with the 3hour 100yearstorms, it becomes apparent that the coastalareas of the region have the greatest increases inmagnitude over those found in TP40, while thedifferences to the west and north are more ininterpretations of orographic and rainshadowpatterns. There is also a shift in the location ofstorm maxima, with the SRCC product showingthe greatest magnitudes from the upper TexasCoast into southwestern Louisiana, while TP40
always has the regional maxima in the extremeMississippi River Delta area of Louisiana. It isalso interesting to note that the magnitudes of 3hour 100year storms range as high as 11 inchesalong the southeastern Texas and southwesternLouisiana coasts. Quantile estimates drop toabout 5 inches along the northern borders of theregion, and down to less than 3 inches acrossmuch of extreme western Texas around andsoutheast of El Paso, and also in the rainshadowof the Holston River valley in northeasternTennessee in the vicinity of Bristol.
SixHour Storms
At the shorter recurrence intervals, 6hourstorms (Figs. 4.1 to 4.6) are relatively similarbetween this document and TP40, andgeographical patterns and deviations are similarto the relationships found for the 3hour storms.Again, as the recurrence intervals increase, thedifferences increase with the same changes aspreviously discussed. For example, for the 6hour 100year storm, the greatest magnitudedepicted is 10 inches in extreme southeasternLouisiana in the TP40 version, while the SRCCmap (Fig. 4.6) depicts the greatest magnitudes(12 inches) along an axis from west ofGalveston into coastal southwestern Louisiana.Along the north and west fringes of the studyregion, both reports still depict similarmagnitudes. The lowest estimates are less than 3inches from El Paso southeastward down theRio Grande. In the rainshadow valley of theHolston River in northeastern, Tennessee, theestimates are less than 4 inches.
TwelveHour Storms
As storm durations increase to 12 hours (Figs.5.1 to 5.6) and magnitudes increase, thepreviously established relationships between the

documents are sustained and the absoluteincreases in magnitudes along the Gulf Coastbecome more apparent. For example, on the12hour 100 year SRCC isohyet map (Fig. 5.6),the Lake Charles area of southwestern Louisianahas a magnitude of approximately 14 inches,while TP40 depicts a value of just under 11inches. Also, in the upland areas of westernArkansas, there are locations with 100yearreturn estimates of more than 11 inches, about 3inches greater than in TP40. There are still smallareas in the vicinity of El Paso with less than 3inches, and less than 4 inches in the HolstonRiver valley in northeastern Tennessee.
TwentyFourHour Storms
Finally, for the 24hour durations (Figs. 6.1 to6.6), there are similar differences between TP40and this document, with the differences tendingto be greater for the longer return periods. Themaximum differences in storm estimates arefound in the coastal TexassouthwesternLouisiana areas and in the OuachitaOzarkMountains where the 100year stormmagnitudes are again about 3 inches greater inthe SRCC product (Fig 6.6). The greatestmagnitudes for 100year events are about 16inches between Galveston and Lake Charles,more than 14 inches over extreme southeasternLouisiana, and more than 12 inches across mostof the Ouachita Mountains in western Arkansasand eastern Oklahoma. Minimum stormmagnitudes of less than 4 inches are restricted tothe Rio Grande Valley southeast of El Pasotoward the Big Bend country, and again lessthan 5 inches in the rainshadow areas of theHolston River valley in northeastern Tennessee. Quantile estimates are almost the same as inTP40 for the west, north and east fringes of theregion.
Summary and Conclusions
* The magnitudes of extreme events vary insystematic patterns geographically for alldurations and return periods, with maximumintensities along the Gulf Coast in the vicinity ofthe Texas and Louisiana border, decreasinggradually to the northeast and north, and muchmore rapidly towards the northwest, west, andsouthwest.
* This generalized regional pattern is interruptedwith steep increases where mountain barriersand broad uplands induce additional orographicprecipitation, and equally steep decreases across"rainshadow" valleys.
* Threehour twoyear storms range from about3.5 inches along the southeastern Texas andsouthern Louisiana coasts down to less than 1.5inches in extreme western Texas and Oklahoma,with the magnitudes of 100year storms rangingfrom 11 inches along the coasts of southeasternTexas and southwestern Louisiana down to lessthan 3 inches in extreme western Texas and inrainshadow valleys of northeastern Tennessee.
* Twentyfourhour twoyear storms range from6 inches along the southeastern Texas andsouthern Louisiana coasts down to less than 2inches in extreme western Texas, with themagnitudes of 100year storms ranging from 16inches along the southeastern Texas tosouthwestern Louisiana coasts, down to about 4inches along the Rio Grande valley southeast ofEl Paso.
* When magnitudes in this report are comparedto TP40, differences are small and insignificantover the western half of Texas and all ofOklahoma.

* Magnitudes in this report are greater thanTP40 across most of Louisiana, Mississippi, andTennessee, with the greater increases of about10 percent for the longer return periods from 25to 100 years.
* Magnitudes in this report are also greater forupland areas with orographic precipitation suchas the Ouachitas and Ozarks of Arkansas andOklahoma, and lower in large rainshadowvalleys in northeastern Tennessee.

Rainfall Frequency/Magnitude
Maps
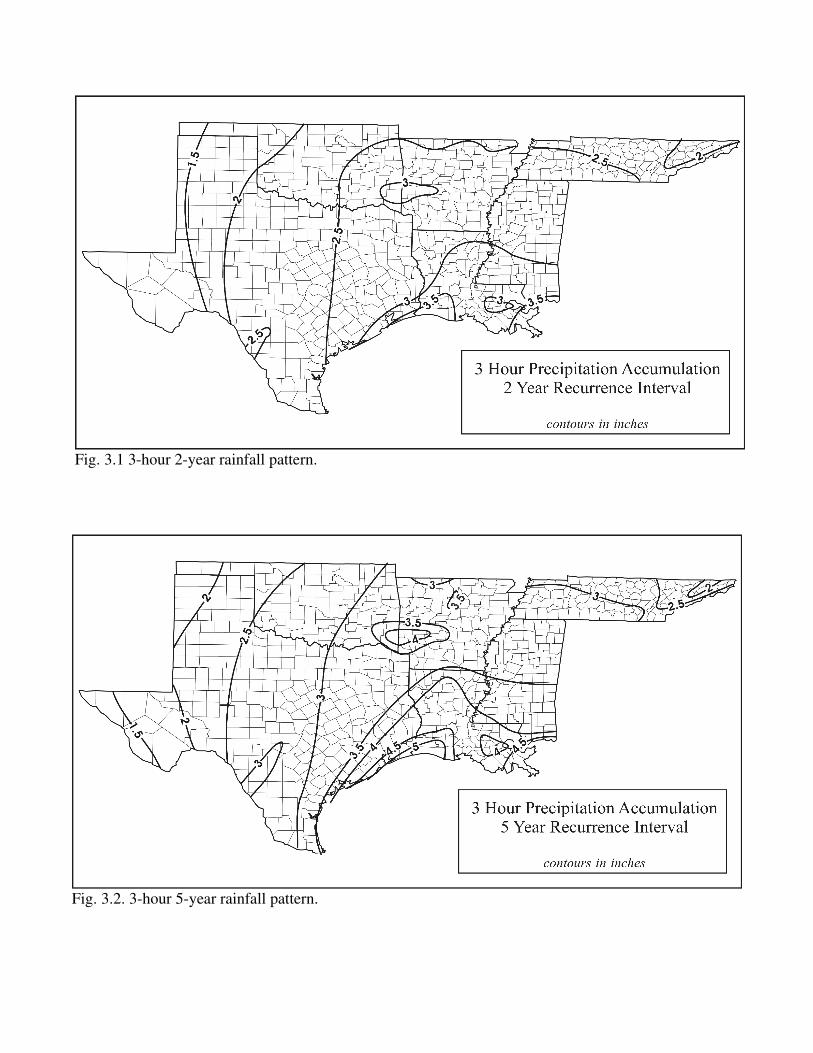
Fig. 3.1 3hour 2year rainfall pattern.
Fig. 3.2. 3hour 5year rainfall pattern.

Fig. 3.3 3hour 10year rainfall pattern.
Fig. 3.4. 3hour 25year rainfall pattern
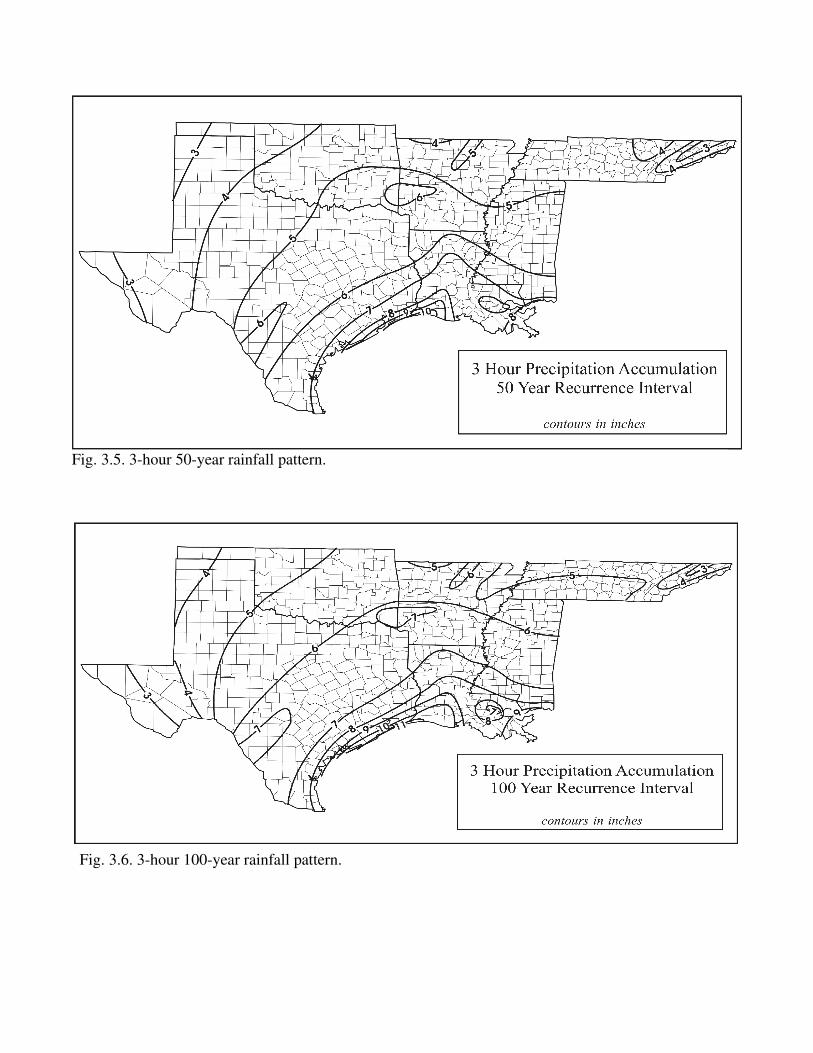
Fig. 3.5. 3hour 50year rainfall pattern.
Fig. 3.6. 3hour 100year rainfall pattern.

Fig. 4.2. 6hour 5year rainfall pattern.
Fig. 4.1. 6hour 2year rainfall pattern
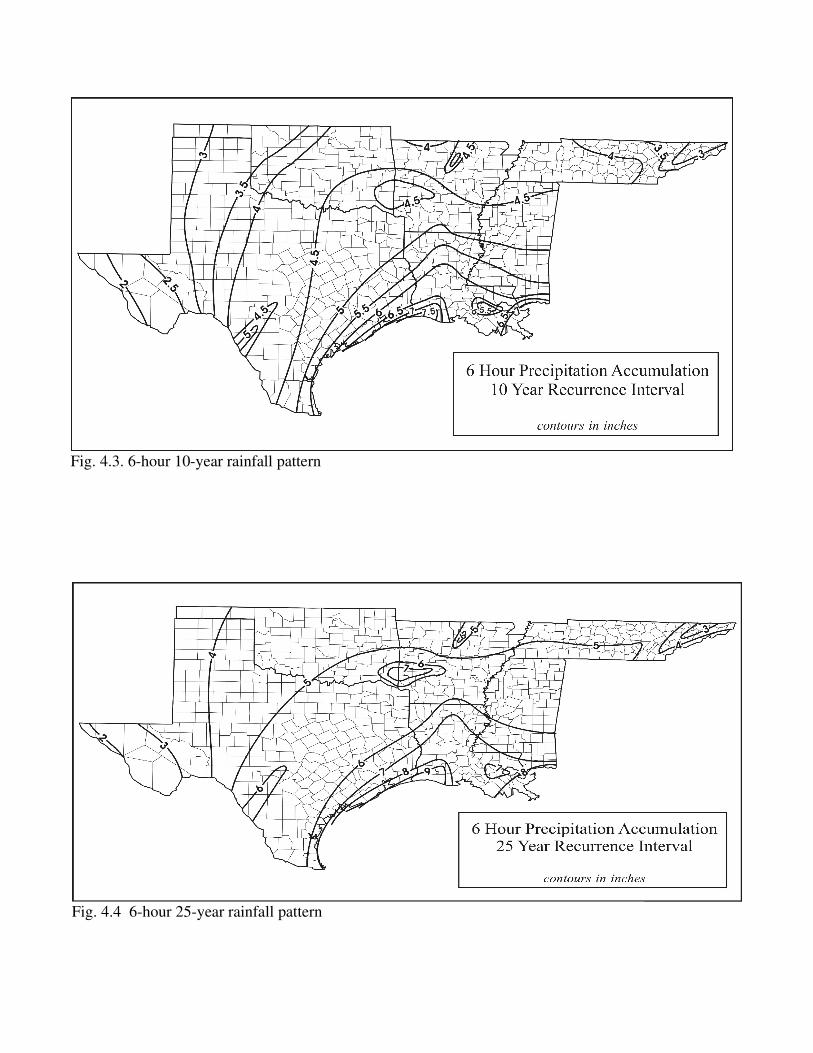
Fig. 4.3. 6hour 10year rainfall pattern
Fig. 4.4 6hour 25year rainfall pattern

Fig. 6hour 50year rainfall pattern.
Fig. 4.6. 6hour 100year rainfall pattern.

Fig. 5.2. 12hour 5year rainfall pattern
Fig. 5.1. 12hour 2year rainfall pattern.
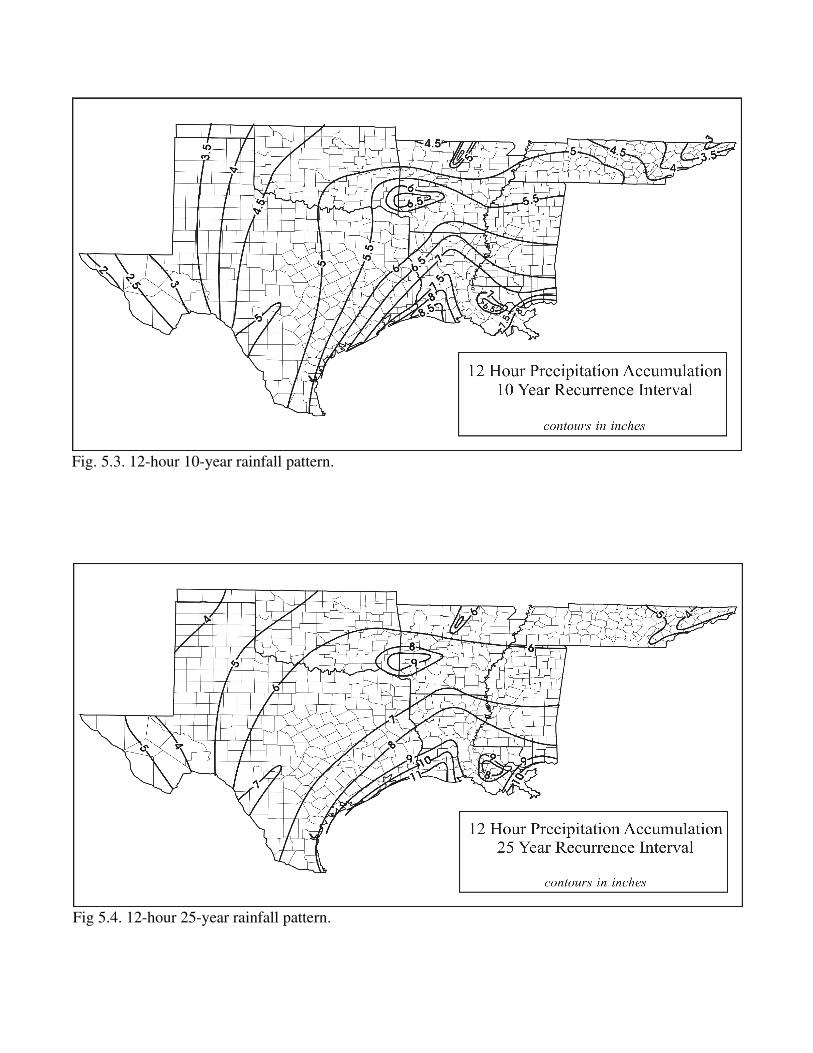
Fig. 5.3. 12hour 10year rainfall pattern.
Fig 5.4. 12hour 25year rainfall pattern.

Fig. 5.5. 12hour 50year rainfall pattern.
Fig. 5.6. 12hour 100year rainfall pattern.
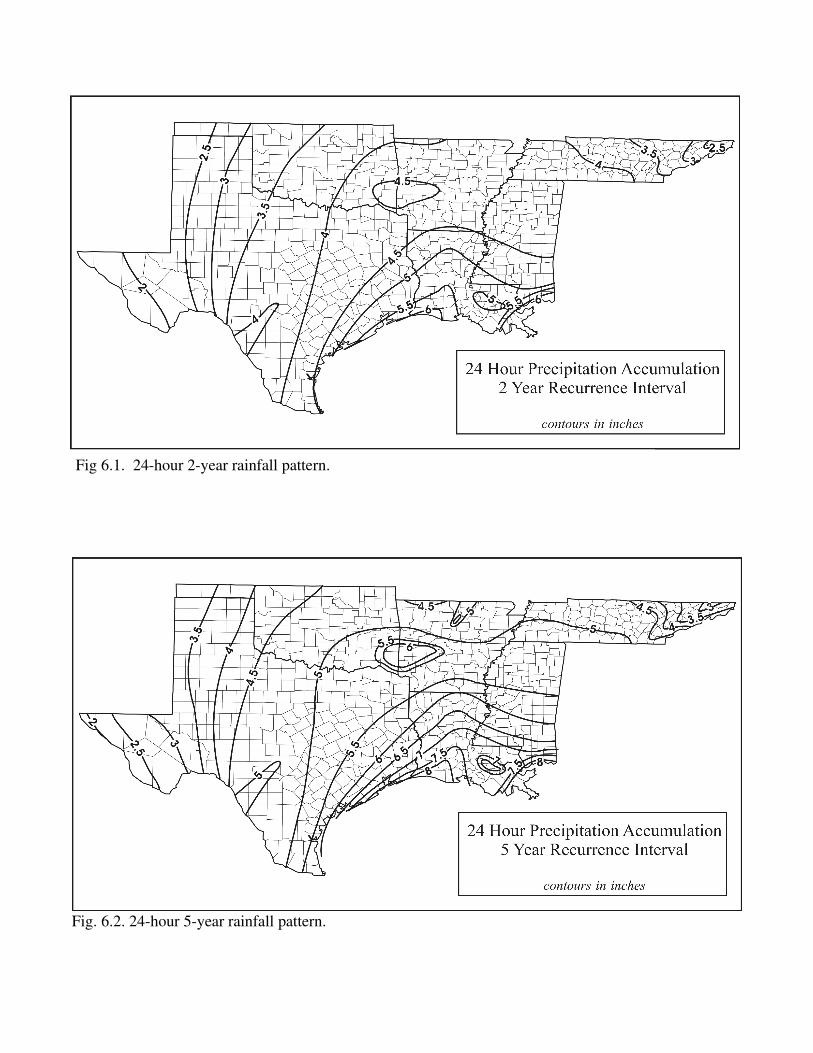
Fig 6.1. 24hour 2year rainfall pattern.
Fig. 6.2. 24hour 5year rainfall pattern.
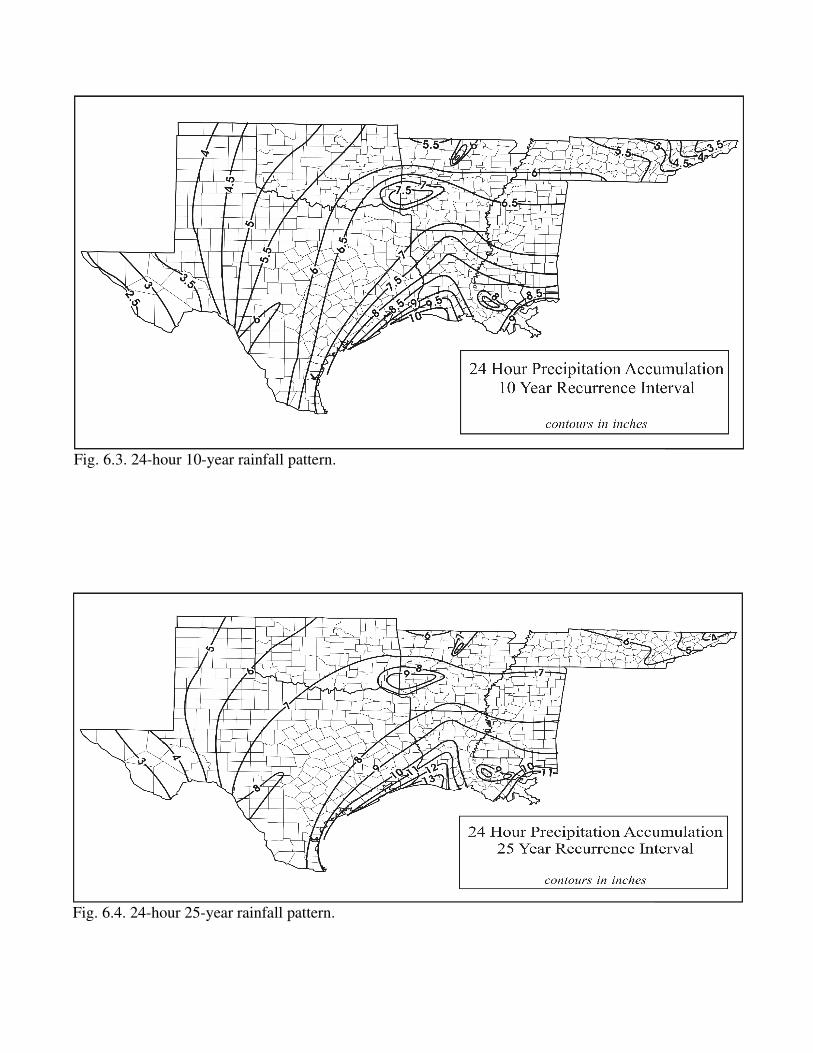
Fig. 6.3. 24hour 10year rainfall pattern.
Fig. 6.4. 24hour 25year rainfall pattern.

Fig. 6.5. 24hour 50year rainfall pattern.
Fig. 6.6. 24hour 100year rainfall pattern.

APPENDIX
Data Series
Only cooperative and firstorder station data ofNational Weather Service (NWS) are utilized inthis study. The data were organized into partialduration series (PDS). PDS were selected overannual series (AS) data because they generatemore accurate exceedence probabilities inextreme rainfall analyses (Hershfield 1961;Dunne and Leopold 1978). The primarydifference between these two series is that anAS includes only the largest precipitation eventfrom every year, while PDS contain the largestevents at a given site regardless of when theyoccur during the period of record. Thedifference is important because some calendaryears have several extreme events which areincluded in the PDS, but would be excluded inan AS. Typically AS data are adjusted to PDSusing coefficients (Hershfield, 1961), but use ofPDS in this study made these transformationsunnecessary.
Climatic variability from year to year isrecognized, but there is no recognition ofclimatic trends or changes through the years ofrecord. The period of record for most sitesranges from 1949 through 1991, but records atsome sites began around 1930, and a few siteshave data which date back into the late 1800s.Only in cases where regional anomalies werestudied in detail were records with less than 40years utilized in this research, with some recordsbeing updated through 1994 when needed.
Homogeneity of Data
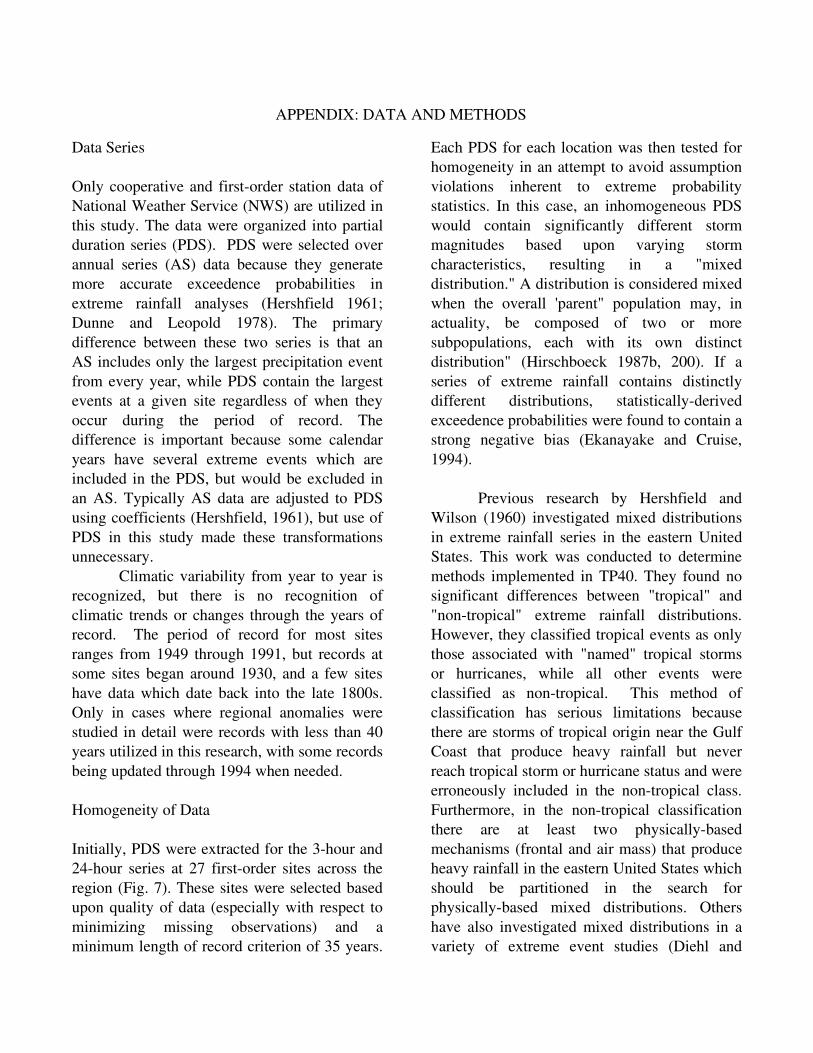
Initially, PDS were extracted for the 3hour and24hour series at 27 firstorder sites across theregion (Fig. 7). These sites were selected basedupon quality of data (especially with respect tominimizing missing observations) and aminimum length of record criterion of 35 years.
Each PDS for each location was then tested forhomogeneity in an attempt to avoid assumptionviolations inherent to extreme probabilitystatistics. In this case, an inhomogeneous PDSwould contain significantly different stormmagnitudes based upon varying stormcharacteristics, resulting in a "mixeddistribution." A distribution is considered mixedwhen the overall 'parent" population may, inactuality, be composed of two or moresubpopulations, each with its own distinctdistribution" (Hirschboeck 1987b, 200). If aseries of extreme rainfall contains distinctlydifferent distributions, statisticallyderivedexceedence probabilities were found to contain astrong negative bias (Ekanayake and Cruise,1994).
Previous research by Hershfield andWilson (1960) investigated mixed distributionsin extreme rainfall series in the eastern UnitedStates. This work was conducted to determinemethods implemented in TP40. They found nosignificant differences between "tropical" and"nontropical" extreme rainfall distributions.However, they classified tropical events as onlythose associated with "named" tropical stormsor hurricanes, while all other events wereclassified as nontropical. This method ofclassification has serious limitations becausethere are storms of tropical origin near the GulfCoast that produce heavy rainfall but neverreach tropical storm or hurricane status and wereerroneously included in the nontropical class.Furthermore, in the nontropical classificationthere are at least two physicallybasedmechanisms (frontal and air mass) that produceheavy rainfall in the eastern United States whichshould be partitioned in the search forphysicallybased mixed distributions. Othershave also investigated mixed distributions in avariety of extreme event studies (Diehl and
APPENDIX: DATA AND METHODS
Potter, 1987; Singh, 1987; Cruise and Arora,1990).
To test for mixed distributions, eachstorm in each series was classified as frontal(FR), tropical disturbance (TD), combinedfrontal and tropical disturbances (FTD), and airmass (AM). Similar classifications have beenutilized and described in detail in previousstudies of heavy rainfall (Matsumoto, 1989;Faiers et al. 1994b;Keim and Faiers, 1996). Thecombined FTD category was created becausethese synoptic weather systems sometimesinteract to produce great atmospheric instabilityand enhanced heavy rainfall. An analysis ofthese heavyrainfall producing classes allow forthe determination of whether extreme rainfallevents of different origins can be pooledtogether as members of the same probabilitydistribution across the South Central UnitedStates.
To determine statistically whether thereare differences between the magnitudes of thestorms by synoptic weather types, the Kruskal
Wallis one way nonparametric analysis ofvariance test (Barber 1988), an extension of theMannWhitney test, was used. In situationswhen data are censored at a fixed point (as is thecase with these data), Bradley (1968)recommends use of the MannWhitney test andthat the truncated data be accounted for using atechnique developed by Halperin (1960).However, this modification is only accurate ifno more than 75% of the population is censored.Clearly, in the analysis of extreme rainfallevents, well over 75% of rain events arecensored from the samples, making therecommended adjustment inappropriate. Thisadjustment was found appropriate for analysisof flood data, but has never been applied to theanalysis of extreme rainfall because of the largepercentage of censored rainfall events.Therefore, the unadjusted KruskalWallis testwas used and potential errors in the results wererecognized.
Table 1 shows the KruskalWallis testfor statistics and probabilities for 3hour and 24hour storm distributions at the 27 NWS sites
Fig. 7. Twentyseven firstorder stations of the National Weather Service.

across the region. Only 26 sites are shown ineach table because, in both cases, there was onestation which had all of its series produced byone weather type. None of the 24hour seriesindicated mixed distributions. However, foursites, Chattanooga, Galveston, New Orleans,and San Angelo, have significantly differentdistributions at the .05 level in the 3hour series.These differences result from the fact that thereare more air mass storms in the shorter durationevents, and these storms tend to be clustered onthe lower end of the distributions. Given thatonly four of the 27 sites indicate the presence ofmixed distributions, the regionwide data weretreated as though they were homogeneous, andpooling together storms produced by thesevarious mechanisms does not produce thenegative bias an noted by Ekanayake and Cruise(1994).
Deriving Quantile Estimates
Since no mixed distribution problems exist inthe PDS for the region, valid quantile estimatescan be derived. To derive the quantiles severalprobability distributions and other techniqueswere investigated to determine the best singlemethod for regionwide implementation.Random sampling using PDS across the regionproduced highly varied results. To demonstratethese differences, a pilot study of the arid TransPecos climate division (Fig. 8) was undertaken.This was conducted to evaluate the performanceof four commonly used probabilitydistributions, in addition to the HuffAngel loglog regression method wich was used to createthe Rainfall Frequency Atlas of the Midwest(Huff and Angel, 1992) and a related semilogregression method developed at the SRCC. Thefour additional probability distributions used tofit the PDS include the Generalized ExtremeValue (GEV), Three Parameter Log Normal(3PLOGN), Log Pearson Type III (LOGP III),and Wakeby. Daily rainfall records at 24
Table 1. Kruskal-Wallis Probabilities of "Mixed"Rainfall Distributions.
LOCATION 3-HOUR K-WSTATISTICAND P.
24-HOUR K-WSTATISTIC AND
P.
AMARILLO 1.85 .17 ---- ----
AUSTIN 5.27 .15 3.06 .22
BATON ROUGE 2.77 .43 6.92 .07
BRISTOL 3.84 .28 6.34 .10
BROWNSVILLE 2.28 .52 3.03 .39
CHATTANOOGA 8.62 .03 2.41 .12
CORPUS CHRISTI 3.81 .28 6.54 .09
EL PASO 2.10 .55 3.19 .36
FORT SMITH 1.30 .52 3.86 .28
GALVESTON 9.97 .01 6.53 .09
JACKSON 1.09 .78 5.53 .14
KNOXVILLE 1.09 .58 0.21 .65
LAKE CHARLES 1.08 .78 5.08 .17
LUBBOCK 1.63 .44 5.42 .14
MEMPHIS 5.12 .16 1.28 .53
MERIDIAN 3.55 .31 2.10 .35
MIDLAND 5.49 .14 0.67 .88
NASHVILLE 1.17 .56 0.32 .85
NEW ORLEANS 7.62 .05 1.29 .52
OKLAHOMA CITY 0.43 .81 0.50 .78
PORT ARTHUR 1.32 .73 5.88 .12
SAN ANGELO 6.37 .04 3.66 .16
SAN ANTONIO 0.41 .81 0.56 .90
SHREVEPORT ---- ---- 2.49 .48
TULSA 0.77 .68 2.04 .36
WACO 1.23 .75 3.73 .29
WICHITA FALLS 2.92 .23 3.35 .19
cooperative stations of the NWS in the TransPecos climate division (Fig. 8) provided the datanecessary to derive the extreme rainfallfrequencymagnitude relationships. These selected sites have record lengths between 30and 74 years, while most are approximately 45years in length, beginning in the late 1940s andcontinuing through 1991. PDS were extractedfrom these daily records.
Each of the six methods were fit to thePDS data using the Weibull plotting positionformula:
P= R/n + 1where P = probability, R = rank of the storm

(where the largest storm = 1), and n= thenumber of storms in the series (which is basedon record length). To determine which methodprovided the best fit to the Weibull plottingpositions, the quantile estimates from eachmethod for the 1,2,5,10, 25, and 50yearstorms were tested against the plotting positions,the quantile estimates from each method for the1,2,5, 10,25, and 50year storms were testedagainst the plotting positions using linearregression and determining the mean squareerror. The fitting procedure only analyzedrecurrence intervals up to the length of therecord under examination since recurrenceintervals beyond the length of record cannot bederived using the Weibull plotting positionformula. For example, the longest recordincluded in this analysis is only 74 years, andreturn periods up to 75 years (due to the +1 inthe numerator of the Weibull formula) wereincluded in the analysis for that site becausethere are no plots beyond 75 years. This
technique for determining "best fit" is
commonly used in evaluating frequencymagnitude relationships (Bobee and Robitaille,1976; Naghavi et al., 1991; Huff and Angel,1992).
In addition to the probabilitydistributions, the HuffAngel estimates werederived by determining the base common logsfor each of the PDS storm magnitudes and theWeibull estimated quantiles and performinglinear regression between these values. In theSRCC method, the only recurrence intervalswere logged and linear regression was usedagain to determine the relationships and allowfor the estimation of storm quantiles. The SRCCmethod is therefore very closely related to theHuffAngel method.
In the pilot study of the TransPecosclimate division, daily cooperative station datawere used because of the use of dailycooperative station data in the final analysis ofthe entire region. Storm estimates based onobservational daily records (observations madeonce every 24 hours, with the hour ofobservation varying from station to station)were increased by 13 % to make themequivalent to 24hour movingwindow storms(rather than storms based on discreteobservational days). Shortcomings of the hourlydata records make their utilization less desirablefor extreme rainfall studies (Faiers et al.,1994a), thereby making the 1.13 adjustmentnecessary. This coefficient is becomingstandard since it was found to be appropriateacross the United States (Hershfield, 1961), inthe Midwest (Huff and Angel, 1992), inLouisiana (Faiers et al., 1994a) and SRCCresearch indicates that it fits across the SouthCentral United States.
In most instances, the mean square errorfor the four probability distributions were small
Fig. 8. NWS cooperative stations in the TransPecos climate division of NWS.

ranging from .0009 inches (3PLOGN at ElPaso) to .3545 inches (GEV at Sanderson). Nosingle distribution performed well at all sites,with every distribution being the worst fit at onesite or more. Wakeby and LOGP III fit theobserved data across the region most adequately(Table 2). Wakeby was the best fit at 10 siteswhile LOGP III fit best at six sites. However,the LOGP III distribution was the second best fitat many sites (14) causing it to have almost thesame cumulative rank as Wakeby for all sitescollectively. The 3PLOGN distribution was thebest fit at four sites but did not perform well atmany others, while finishing last at six sites.The GEV fit best at four sites but thisdistribution reacted very strongly to outliers atsome sites causing the 50year and 100yearestimates to be far too large in our bestestimation. No geographic pattern was evidentin regard to where particular distributions fitbest.
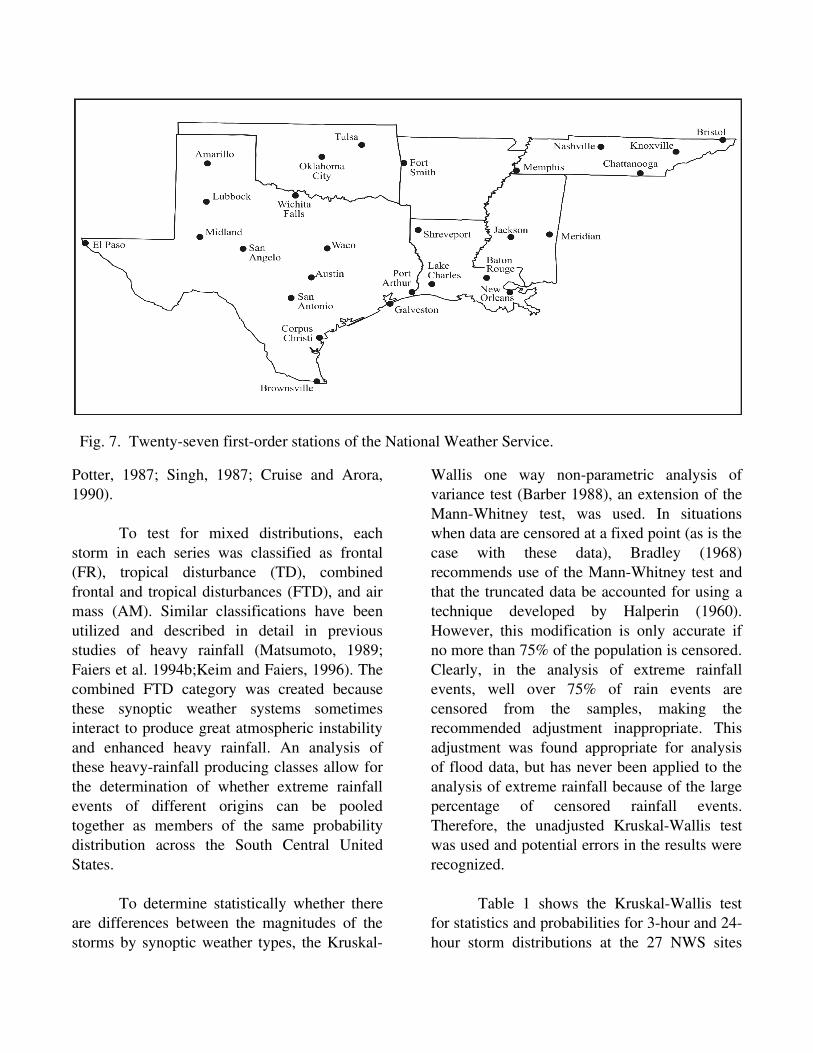
Given that no single probabilitydistribution clearly fit the extreme rainfall datafrom this region, the alternative methoddeveloped by Huff and Angel (1992) wasinvestigated. The HuffAngel method was foundto adequately estimate the 1, 2, 5, and 10yearstorms in the Trans Pecos, but at sites withextreme outliers this method produced 50 and100year quantile estimates which appearexcessively large. For example, locations suchas Crane and Red Bluff Dam in the northeasternpart of the TransPecos have 24hour 100yearHuffAngel estimates in excess of 10 inches(Figs. 9 and 10). In TP40, for example, the 10inch, 100year storm isohyet is located east ofAustin and San Antonio.
Using the semilog method developed atthe SRCC, the excessively large estimates of theHuffAngel method at the longer recurrenceintervals are reduced in this arid environment.For example, in Figures 9 and 10 the 100yearevents at Crane and Red Bluff Dam by HuffAngel are slightly greater than 10 inches, but the
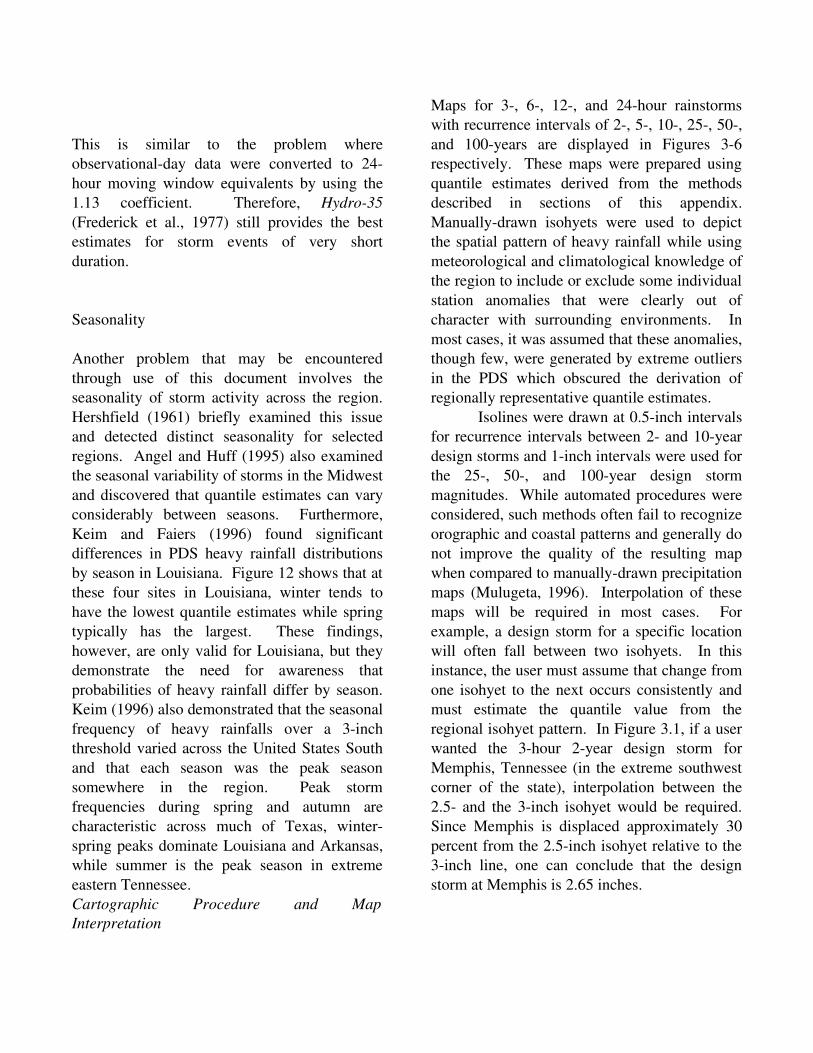
SRCC method lowers the 100year recurrenceinterval magnitude to slightly less than 8 inchesat both sites. Similar excessively large resultsfor the 50 and 100year estimates were alsofound using the HuffAngel method is coastalLouisiana. The SRCC method again decreasedthese extremes to more climatically appropriatevalues. For these reasons, the SRCC methodwas selected to produce the quantile estimatesacross the SouthCentral United States, usingdaily data from 654 NWS cooperative stationsacross the region (Figure 11).
Table 2. Ranks of Probability Distributions for Trans PecosStations, Texas.
LOCATION GEV 3PLOGN LOGP III WAKEBYAlpine 3 4 2 1Balmorhea 4 3 2 1Boquillas 4 2 3 1Candelaria 2 1 4 3Chisos Basin 4 2 1 3Cornudas SS 3 1 2 4Crane 4 3 2 1El Paso 2 1 3 4Fort Davis 4 3 2 1Fort Stockton 4 3 2 1Grandfalls 1 4 3 2Imperial 4 3 1 2Kent 3 1 4 2La Tuna 4 3 1 2Marathon 1 4 2 3Mount Locke 4 3 2 1Pecos 3 4 2 1Presidio 1 4 2 3Red Bluff Dam 4 3 2 1Sanderson 4 3 2 1Sheffield 3 4 1 2Valentine 4 3 1 2Van Horn 1 3 2 4Wink 4 3 1 2SUM 75 68 49 48
GEV= Generalized Extreme Value3PLOGN = 3 Parameter Log NormalLOGP III = Log Pearson Type IIIWAKEBY
Three, Six, and TwelveHour
It would be ideal to extract and analyze 3, 6,and 12hour storms derived from continuoushourly observations. However, because of thelimited number of hourly data sets, andfrequently missing data during very heavyrainstorms, relationships between shortdurationand adjusted daily durations were derived. Thisderivation of short duration storms from dailystorms has proven expeditious in previousstudies (Hershfield, 1961; Huff and Angel,1992). To derive the shorter duration storms, thefrequencymagnitude relationships of 3,6, and12hour storms to 24hour storms at the NWSfirstorder station sites in Figure 7 werecalculated, and ratios of the 3,6, and 12hourstorms relative to the 24hour storm magnitudesfor each recurrence interval were determined foreach location.
While some regional variation in ratioswas found, average regionwide ratios weredetermined and applied for each duration (Table3). The most significant geographic anomaly tothese ratios was detected across western Texaswhere short duration storms (especially 3hour)are often close to the 24hour values. Hence,these regionwide average ratios willunderestimate the shorter duration quantileestimates in this region. This because of the propensity for short, intensebursts of heavy rainfall, but with relatively fewlongerduration rainstorms associated withmidlatitude cyclones and fronts. As a result,there is an atypically large number of shortduration storms included in the longer durationPDS. The ratios of the 3to 24hour storms tendto decrease eastward across Texas with thelowest 3hour ratios for the region found insoutheastern Texas. There, the three hourstorms were found to be just under 50% of thecorresponding 24hour storm magnitudes.Elsewhere, no consistent regional patternsemerged.
Table 3. Average Ratio of 3612Hour/24Hour Rainfall.
DURATION
(IN HOURS)
RATIO
(3612HOUR/24HOUR)12 .886 .743 .62
Storms Shorter Than Three Hours
One primary difference between this new atlasand TP40 is that storms of durations shorter than3hours were not examined. Precipitation datafor durations less than one hour are severelylimited in availability and mapping such data atthis scale was impractical. Without regionwideavailability of minutebyminute precipitationdata, relationships between discrete hourly dataand 60minute movingwindow data wereunattainable for the region.
Fig. 9. Quantile estimates of storm rainfall forCrane, Texas, by the HuffAngel and SRCCmethods.
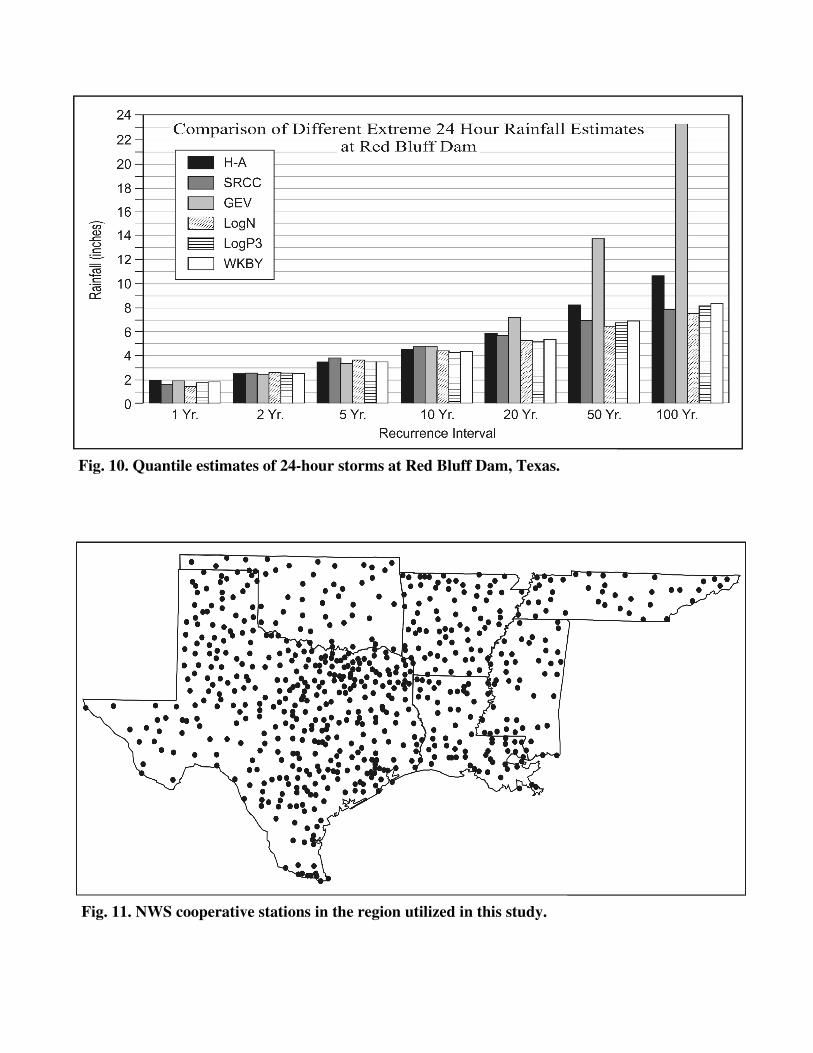
Fig. 10. Quantile estimates of 24hour storms at Red Bluff Dam, Texas.
Fig. 11. NWS cooperative stations in the region utilized in this study.
This is similar to the problem whereobservationalday data were converted to 24hour moving window equivalents by using the1.13 coefficient. Therefore, Hydro35(Frederick et al., 1977) still provides the bestestimates for storm events of very shortduration.
Seasonality
Another problem that may be encounteredthrough use of this document involves theseasonality of storm activity across the region.Hershfield (1961) briefly examined this issueand detected distinct seasonality for selectedregions. Angel and Huff (1995) also examinedthe seasonal variability of storms in the Midwestand discovered that quantile estimates can varyconsiderably between seasons. Furthermore,Keim and Faiers (1996) found significantdifferences in PDS heavy rainfall distributionsby season in Louisiana. Figure 12 shows that atthese four sites in Louisiana, winter tends tohave the lowest quantile estimates while springtypically has the largest. These findings,however, are only valid for Louisiana, but theydemonstrate the need for awareness thatprobabilities of heavy rainfall differ by season.Keim (1996) also demonstrated that the seasonalfrequency of heavy rainfalls over a 3inchthreshold varied across the United States Southand that each season was the peak seasonsomewhere in the region. Peak stormfrequencies during spring and autumn arecharacteristic across much of Texas, winterspring peaks dominate Louisiana and Arkansas,while summer is the peak season in extremeeastern Tennessee. Cartographic Procedure and MapInterpretation
Maps for 3, 6, 12, and 24hour rainstormswith recurrence intervals of 2, 5, 10, 25, 50,and 100years are displayed in Figures 36respectively. These maps were prepared usingquantile estimates derived from the methodsdescribed in sections of this appendix.Manuallydrawn isohyets were used to depictthe spatial pattern of heavy rainfall while usingmeteorological and climatological knowledge ofthe region to include or exclude some individualstation anomalies that were clearly out ofcharacter with surrounding environments. Inmost cases, it was assumed that these anomalies,though few, were generated by extreme outliersin the PDS which obscured the derivation ofregionally representative quantile estimates.
Isolines were drawn at 0.5inch intervalsfor recurrence intervals between 2 and 10yeardesign storms and 1inch intervals were used forthe 25, 50, and 100year design stormmagnitudes. While automated procedures wereconsidered, such methods often fail to recognizeorographic and coastal patterns and generally donot improve the quality of the resulting mapwhen compared to manuallydrawn precipitationmaps (Mulugeta, 1996). Interpolation of thesemaps will be required in most cases. Forexample, a design storm for a specific locationwill often fall between two isohyets. In thisinstance, the user must assume that change fromone isohyet to the next occurs consistently andmust estimate the quantile value from theregional isohyet pattern. In Figure 3.1, if a userwanted the 3hour 2year design storm forMemphis, Tennessee (in the extreme southwestcorner of the state), interpolation between the2.5 and the 3inch isohyet would be required.Since Memphis is displaced approximately 30percent from the 2.5inch isohyet relative to the3inch line, one can conclude that the designstorm at Memphis is 2.65 inches.

Summary
• PDS of observationalday (daily) storms havebeen extracted for 27 NWS firstorder andcooperative stations in the region;
• For each site, Weibull plotting positions havebeen assigned to each storm in the PDS;
• Semilog regression relationships have beendetermined between logged recurrenceintervals and storm magnitudes;
• Quantile estimates have been increased by13% to make daily storm magnitudesequivalent to 24hour movingwindow stormmagnitudes;
Fig. 12. Quantile estimates by seasons at 4 firstorder stations of the NWS in Louisiana. Source: Keimand Faiers 1996. (Printed with permission from the American Water Resources Association.)

• Three, six and twelvehour storm• magnitudes have been calculated from
average regional ratios at firstorder stationsto adjusted daily magnitudes for eachrecurrence interval;
The authors wish to thank the following peoplefor their contributions towards the developmentand production of this document:
• John M. Grymes III and Chi Nguyen fordeveloping computer programs for extractionof extreme hourly and daily rainfall data;
• Youngeun Choi and Liyun Ye for data entryand quality control;
• Dr. Robert V. Rohli and Dr. James R. Angelfor contributing to the derivation of the
• Regional maps have been developed fromindividual station plots of the 3, 6, 12, and24hour storms for recurrence intervals of 2,5, 10, 25, 50, and 100 years.
• methods used for determination of quantileestimates;
• Dr. James Cruise and Dr. Katherine K.Hirschboeck for their insights about datahomogeneity and synoptic climatic aspects ofthe events;
• Peter Hanlon for plotting data on draft maps;• Special thanks to Mary Lee Eggart for the
maps, diagrams, and layout, and to EstherShaffer for the production of this document.
ACKNOWLEDGEMENTS
BIBLIOGRAPHYAngel, J.R. and F.A. Huff. 1991. Development of New Rainfall Frequency Relations for NineMidwestern States. Preprints, 7th Conference on Applied Climatology, Salt Lake City, AmericanMeteorological Society, Boston, MA, 131135.
Angel, J.R., and F.A. Huff. 1995. Seasonal Distribution of Heavy Rainfall Events in Midwest.Journal of Water Resources Planning and Management 121 (1): 110115.
Barber, G.M. 1988. Elementary Statistics for Geographers. New York: The Guilford Press.
Belville, J.D. and N.O. Stewart. 1983. Extreme Rainfall Events in Louisiana: the New Orleans Type.Preprints, Conference on Hydrometeorology, American Meteorological Society, Tulsa, Oklahoma.
Bobee, B. and R. Robitaille. 1976. The Use of Pearson Type 3 and Log Pearson Type 3 DistributionsRevisited. Water Resources Research 13(2):427443.
Bradley, J.V. 1968. DistributionFree Statistical Tests. Englewood Cliffs, NJ: PrenticeHall.
Changnon, D, C. Lawson,, J. Jacobson, and D.J. Smith, 1992. Initial Results From Analyses of LargePrecipitation Events. Southeast Climate Review 3:311.
Cruise, J.F. and K. Arora. 1990. A Hydroclimatic Application Strategy for the Poisson PartialDuration Model. Water Resources Bulletin. 26:43142.
Diehl, T. and K.W. Potter. 1987. Mixed Flood Distributions in Wisconsin. In V. Singh (ed.),Hydrologic Frequency Modeling. Boston: D. Reidel Publishing Company, 21326.
Dunne, T. and L.B. Leopold. 1978. Water in Environmental Planning. San Franciscon: W.H. Freemanand Company.
Ekanayake, S.T. and J.F. Cruise. 1994. Comparative Evaluation of Poisson Partial Duration Models forMixed Flood Populations. Stochastic Hydrology and Hydraulics 8:20718.
Faiers, G.E., J.M. Grymes, III, B.D. Keim, and R.A. Muller. 1994a. A Reexamination of Extreme 24Hour Rainfall in Louisiana, U.S.A. Climate Research 4:2531.
Faiers, G.E., B.D. Keim, and K.K. Hirschboeck. 1994b. A Synoptic Evaluation of the Frequenciesand Intensities of Extreme Three and TwentyFourHour Rainfall in Louisiana. ProfessionalGeographer 46(2):156163.
Frederick, R.H., V.A. Myers and E.P. Auciello. 1977. Five to 60Minute Precipitation Frequency forthe Eastern and Central United States. NOAA Technical Memorandum, NWS Hydro35. Silver Spring,MD: National Weather Service.
Haiden, T., M. Kerschbaum, P. Kalig, and F. Noblis. 1992. A Refined Model of the Influence ofOrography on the Mesoscale Distribution of Extreme Precipitation. Hydrological Sciences Journal 37(5): 417427.
Halperin, M. 1960. The Extension of the WilcoxonMannWhitney Test to Samples censored at theSame Fixed Point. Journal of the American Statistical Association 55:12538.
Hershfield, D.M. 1961. Rainfall Frequencies Atlas of the United States for Durations from 30 Minutesto 24 Hours and Return Periods from 1 to 100 Years. Technical Paper No. 40. Washington, D.C., U.S.Weather Bureau.
Hershfield, D.M. and W.T. Wilson 1960. A Comparison of Extreme Rainfall Depths from Tropicaland Nontropical Storms. Journal of Geophysical Research 65(3):959982.
Hirschboeck. K.K. 1987a. Catastrophic Flooding and Atmospheric Circulation Anomalies. In L.Mayer and D. Nash (eds.), Catastrophic Flooding. Boston: Allen and Unwin, 2356.
Hirschboeck. K.K. 1987b. HydroclimaticallyDefined Mixed Distributions in Partial Duration FloodSeries. In V. Singh (ed.), Hydrologic Frequency Modeling. Boston: D. Reidel Publishing Company,199212.
Hirschboeck. K.K. and M.F. Coxe. 1991. Identification of HighRisk Atmospheric and SurfaceConditions for Urban Flash Flooding in Louisiana. Baton Rouge, Louisiana: Louisiana WaterResources Institute.
Hosking, J.R.M. 1990. LMoments: Analysis and Estimation of Distributions Using LinearCombinations of Order Statistics. Journal of the Royal Statistical Society 52(1): 105124.
Huff, F.A. 1990. The Method of Rainfall Frequency Analysis Used for Illinois and the Midwest.Illinois State Water Survey 1990 Publication. Champaign, IL: Illinois Water Survey.
Huff, F.A. and J. Angel. 1992. Rainfall Frequency Atlas of the Midwest. Champaign, IL: IllinoisWater Survey.
Jensen, R. 1990. Finding Answers to Flood Woes. Texas Water Resources 16(3):16.
Keim, B.D. 1996. Spatial, Synoptic, and Seasonal Patterns of Heavy Rainfall in the SoutheasternUnited States. Physical Geography 17:313328.
Keim, B.D. 1997. Preliminary Analysis of the Temporal Patterns of Heavy Rainfall Across theSoutheastern United States. Professional Geographer, 49(1):94104.
Keim, B.D. and G.E. Faiers. 1996. Heavy Rainfall Distributions by Season in Louisiana: SynopticInterpretations and Quantile Estimates. Water Resources Bulletin 32(1):117124.
Keim, B.D. and R.A. Muller. 1992. Temporal Fluctuations of Heavy Rainfall Magnitudes in NewOrleans, Louisiana: 18711991. Water Resources Bulletin. 28:721730.
Keim, B.D. and R.A. Muller. 1993. Frequency of Heavy Rainfall Events in New Orleans, Louisianafrom 1900 to 1991. Southeastern Geographer 33(2)159171.
Knappenberger, C. and P. Michaels 1993. Return Intervals for 2, 3, 5, 7, and 10Day PrecipitationAmounts for Virginia. Technical Paper No. 050193. Columbia, South Carolina: Southeast RegionalClimate Center.
Matsumoto, J. 1989. Heavy Rainfalls Over East Asia. International Journal of Climatology 9:407423.
Muller, R.A. and G.E. Faiers, eds. 1984. A Climatic Interpretation of Louisiana Floods 19821983.Baton Rouge: Department of Geography and Anthropology, Louisiana State University.
Muller, R.A. and G.E. Faiers. 1995. Southeastern Texas Rainstorm: October 1519, 1994. SouthernRegional Climate Center Miscellaneous Report No. 952. Louisiana State University, Baton Rouge,Louisiana.
Muller, R.A., J.M. Grymes, III, and R.V. Rohli. 1995. Fort WorthDallas and New Orleans SevereWeather Events: May 59, 1995. Southern Regional Climate Center Miscellaneous Report No. 953.Louisiana State University, Baton Rouge, Louisiana.
Mulugeta, G. 1996. Manual and Automated Interpolation of Climatic and Geomorphic StatisticalSurfaces: An Evaluation. Annals of the Association of American Geographers 86(2):324342.
Naghavi, B, V.P. Singh and F.X. Yu. 1991. LADOTD 24Hour Rainfall Frequency Maps and IDFCurves. Louisiana Transportation Research Center, Baton Rouge, Louisiana.
National Oceanic and Atmospheric Administration. 1989. Heavy Rain and Flash Flooding inSoutheast Louisiana on November 7, 1989. Storm Data 31(11):18.
Sevruk, B. and H. Geiger. 1981. Selection of Distribution types for Extremes of Precipitation.Geneva, Switzerland: World Meteorological Organization, Operationa; Hydrology Report No. 15.

Singh, K.P. 1987. Development of a Versatile Flood Frequency Methodology and its Application toFlood Series from Different Countries. In V. Singh (ed.), Hydrologic Frequency Modeling. Boston:D. Reidel Publishing Company, 18398.
Sorrell, R.C. and D.A. Hamilton. 1990. Rainfall Frequency for Michigan, 24Hour Duration WithReturn Periods From 2 to 100 Years. Draft, Lansing, Michigan: Michigan Department of NaturalResources.
Vogel, J.L. 1992. NWS Office of Hydrology, Personal Communication.
Weather Bureau. 1947. Maximum Recorded United States Point Rainfall for 5 Minutes to 24 Hours at207 First Order Stations. Technical Paper No. 2. Washington D.C.: U.S. Department of Commerce.
Weather Bureau. 1954. Rainfall Intensities for Local Drainage Design in the United States forDurations of 5 to 240 Minutes and 2, 5, and 10Year Return Periods. Technical Paper No. 24.Washington D.C.: U.S. Department of Commerce.
Weather Bureau. 1958. Rainfall IntensityFrequency Regime. Technical Paper No. 29. WashingtonD.C.: U.S. Department of Commerce.
Weather Bureau. 1964. Two to TenDay Precipitation for Return Periods of 2 to 100 Years in theContiguous United States. Technical Paper No. 49. Washington D.C.: U.S. Department ofCommerce.
Wilks, D.S. 1992. Comparisons of Parametric Distributions to Describe Precipitation Extremes,Preprints from the 12th Conference on Probability and Statistics. Boston: American MeteorologicalSociety.
Wilks, D.S. and R.P. Cember. 1993. Atlas of Precipitation Extremes for the Northeastern UnitedStates and Southeastern Canada. Northeast Regional Climate Center Publication No. RR 935.Ithaca, NY: Northeast Regional Climate Center.
Zurndorfer, E.A. 1990. Assessing the Effects of Additional Data on Precipitation Frequency Analysesin the United States. Preprint, AMS 6th Conference on Applied Climatology.
Zwiers, F.W. and W.H. Ross. 1992. An Alternative Approach to the Extreme Value Analysis ofRainfall Data. AtmosphereOcean 29(3):437461.


![[Slideshare] tafsir-ayat-mushtabihat-hereafter-jannah-naar](https://img.pdfslide.tips/doc/110x75/58ef47941a28abbe728b45ad/slideshare-tafsir-ayat-mushtabihat-hereafter-jannah-naar.jpg)