Embed Size (px)
Citation preview

Spectroscopy LAB Spectroscopy LAB
Raman Spectroscopy
KAIST 중앙분석센터
Seo, Hee Won
2014. 2학기 화학과 학부 수업
Spectroscopy LAB
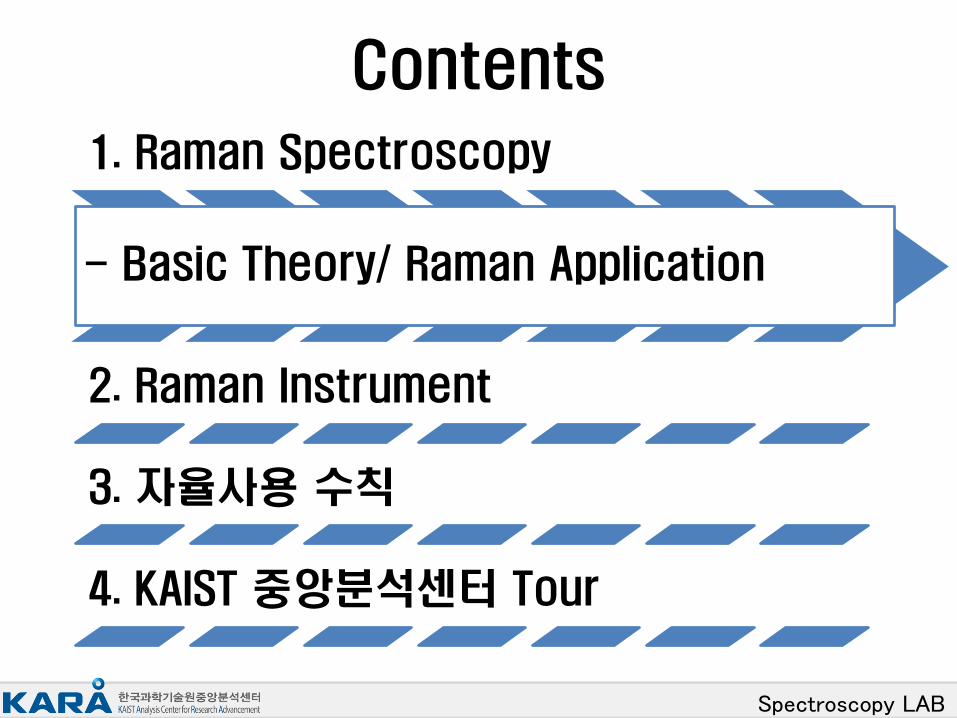
Contents
1. Raman Spectroscopy
- Basic Theory/ Raman Application
2. Raman Instrument
3. 자율사용 수칙
4. KAIST 중앙분석센터 Tour
Spectroscopy LAB
Raman Spectroscopy
Spectroscopy LAB
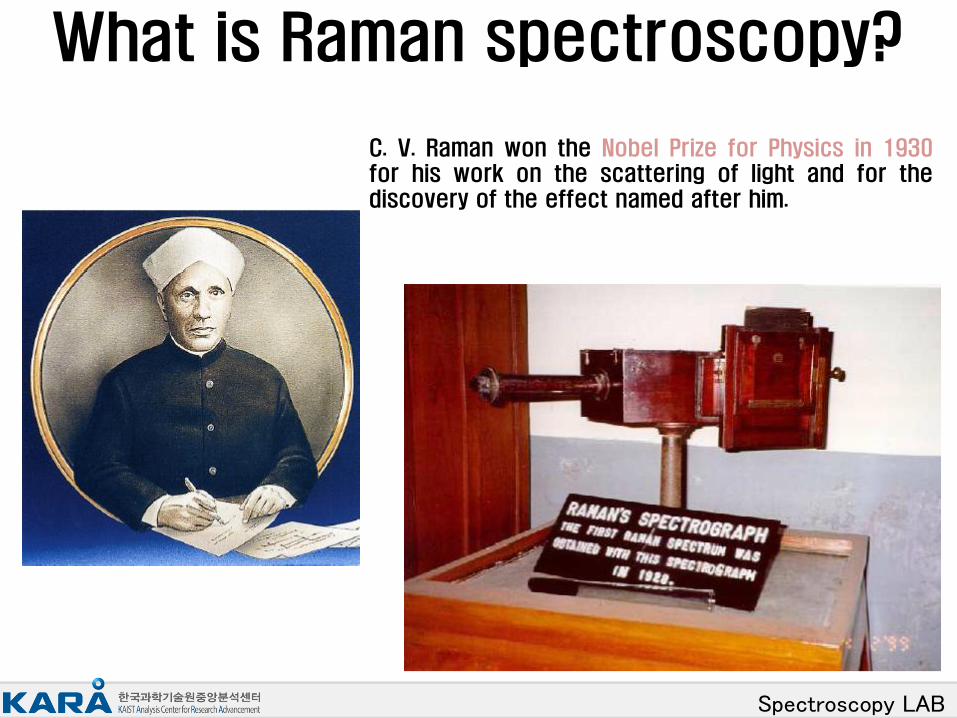
What is Raman spectroscopy?
C. V. Raman won the Nobel Prize for Physics in 1930 for his work on the scattering of light and for the discovery of the effect named after him.
Spectroscopy LAB
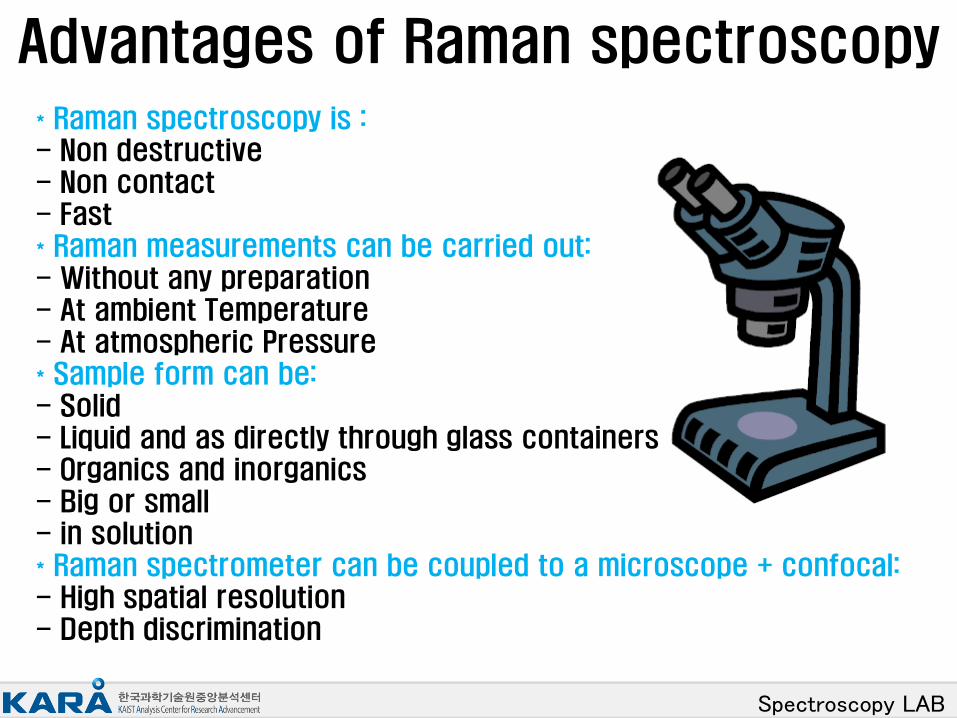
Advantages of Raman spectroscopy
* Raman spectroscopy is : - Non destructive - Non contact - Fast * Raman measurements can be carried out: - Without any preparation - At ambient Temperature - At atmospheric Pressure * Sample form can be: - Solid - Liquid and as directly through glass containers - Organics and inorganics - Big or small - in solution * Raman spectrometer can be coupled to a microscope + confocal: - High spatial resolution - Depth discrimination
Spectroscopy LAB
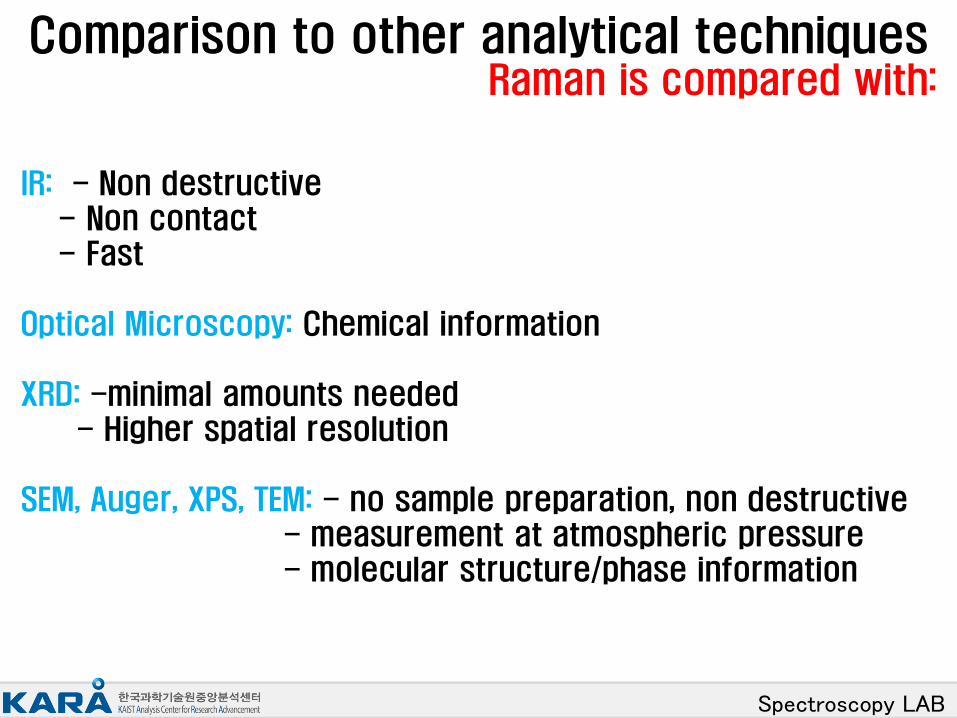
Comparison to other analytical techniques
IR: - Non destructive - Non contact - Fast
Optical Microscopy: Chemical information XRD: -minimal amounts needed
- Higher spatial resolution
SEM, Auger, XPS, TEM: - no sample preparation, non destructive - measurement at atmospheric pressure - molecular structure/phase information
Raman is compared with:

Spectroscopy LAB
Basic Theory
Spectroscopy LAB
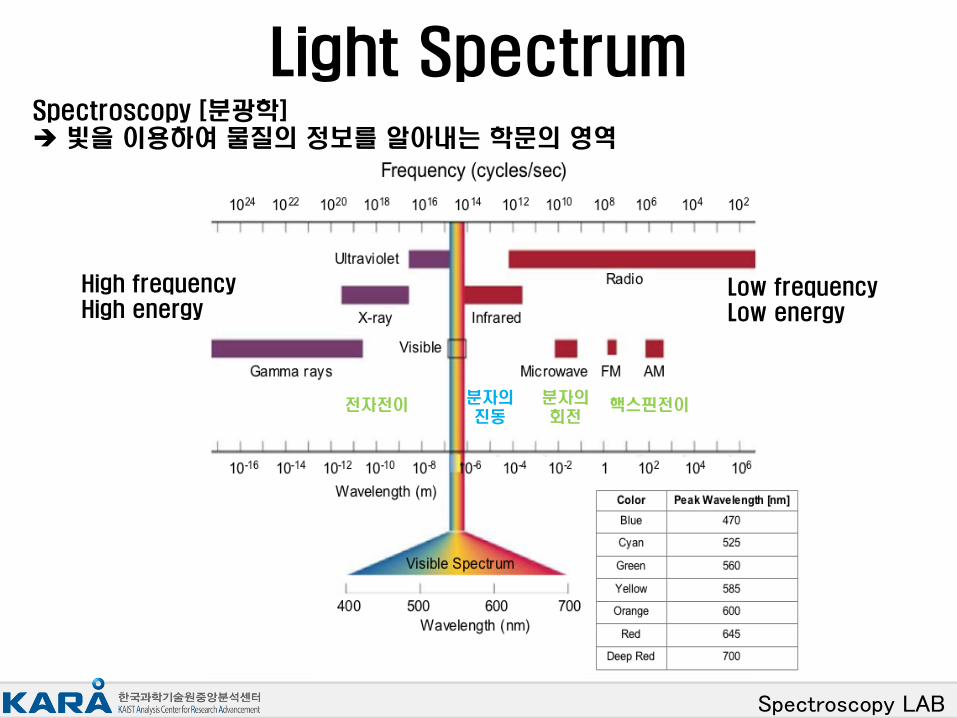
Light Spectrum
High frequency High energy
Low frequency Low energy
Spectroscopy [분광학] 빛을 이용하여 물질의 정보를 알아내는 학문의 영역
핵스핀전이 분자의 회전
분자의 진동
전자전이
Spectroscopy LAB
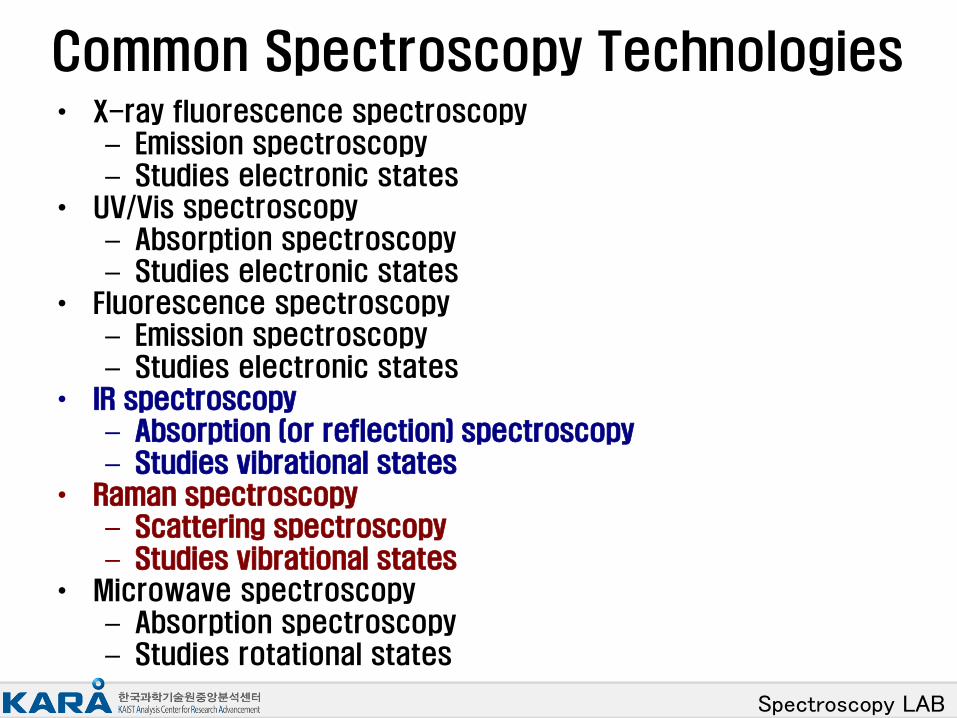
Common Spectroscopy Technologies • X-ray fluorescence spectroscopy
– Emission spectroscopy – Studies electronic states
• UV/Vis spectroscopy – Absorption spectroscopy – Studies electronic states
• Fluorescence spectroscopy – Emission spectroscopy – Studies electronic states
• IR spectroscopy – Absorption (or reflection) spectroscopy – Studies vibrational states
• Raman spectroscopy – Scattering spectroscopy – Studies vibrational states
• Microwave spectroscopy – Absorption spectroscopy – Studies rotational states
Spectroscopy LAB
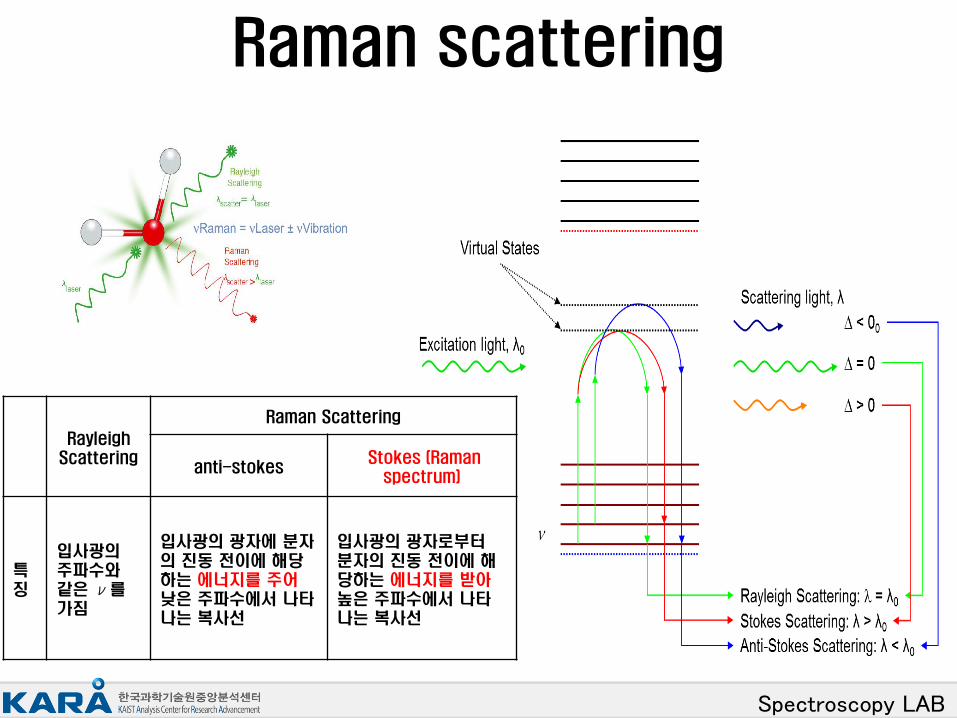
Raman scattering
Rayleigh Scattering
Raman Scattering
anti-stokes Stokes (Raman
spectrum)
특징
입사광의 주파수와 같은 ν를 가짐
입사광의 광자에 분자의 진동 전이에 해당하는 에너지를 주어 낮은 주파수에서 나타나는 복사선
입사광의 광자로부터 분자의 진동 전이에 해당하는 에너지를 받아 높은 주파수에서 나타나는 복사선
Spectroscopy LAB
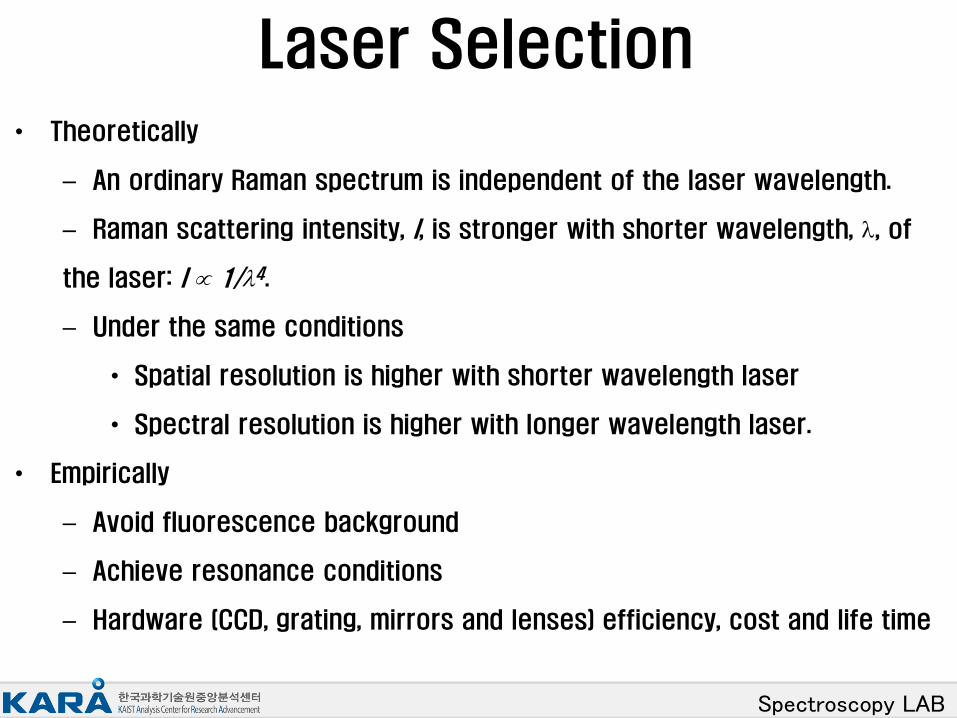
Laser Selection
• Theoretically
– An ordinary Raman spectrum is independent of the laser wavelength.
– Raman scattering intensity, I, is stronger with shorter wavelength, , of
the laser: I 1/4.
– Under the same conditions
• Spatial resolution is higher with shorter wavelength laser
• Spectral resolution is higher with longer wavelength laser.
• Empirically
– Avoid fluorescence background
– Achieve resonance conditions
– Hardware (CCD, grating, mirrors and lenses) efficiency, cost and life time
Spectroscopy LAB
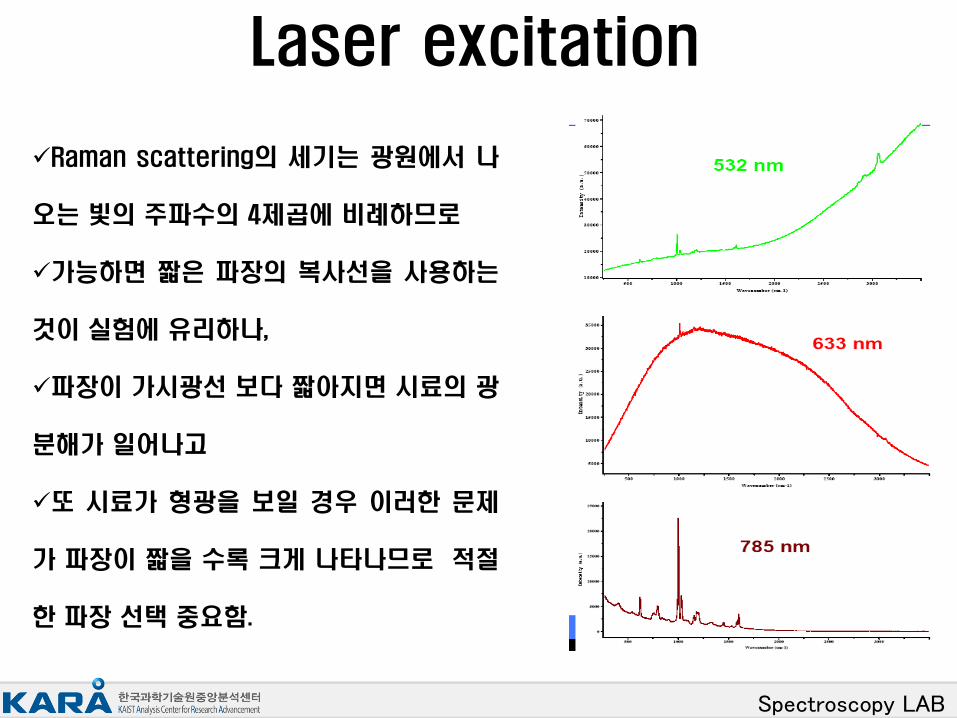
Laser excitation
Raman scattering의 세기는 광원에서 나
오는 빛의 주파수의 4제곱에 비례하므로
가능하면 짧은 파장의 복사선을 사용하는
것이 실험에 유리하나,
파장이 가시광선 보다 짧아지면 시료의 광
분해가 일어나고
또 시료가 형광을 보일 경우 이러한 문제
가 파장이 짧을 수록 크게 나타나므로 적절
한 파장 선택 중요함.
Spectroscopy LAB
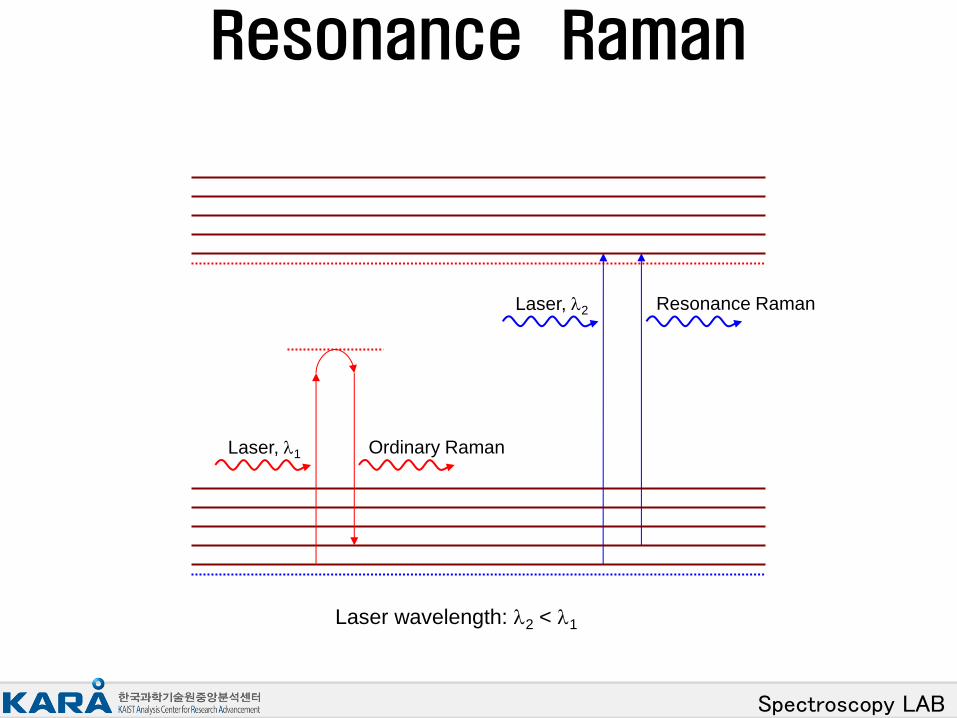
Resonance Raman
Raman shift,
Laser, 1 Ordinary Raman
Laser, 2 Resonance Raman
Laser wavelength: 2 < 1
Spectroscopy LAB
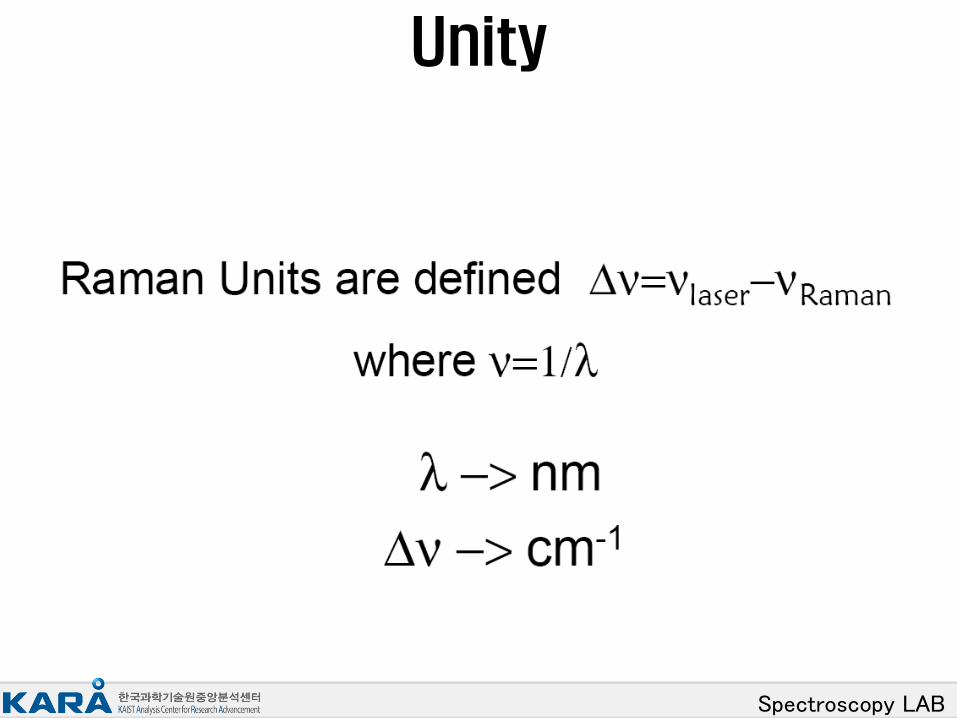
Unity
Spectroscopy LAB
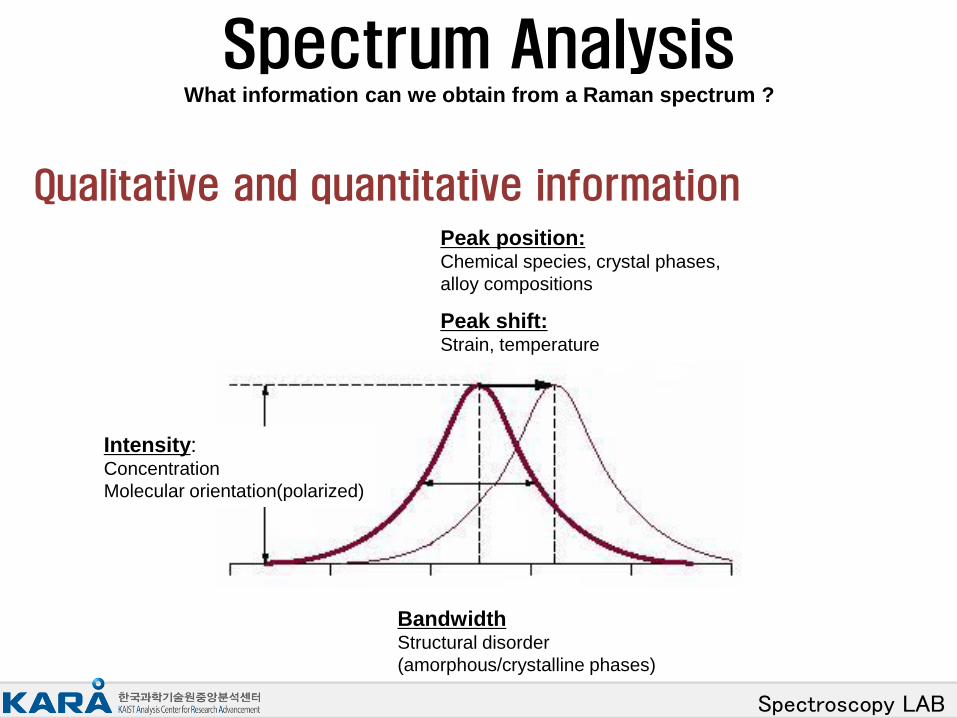
Spectrum Analysis What information can we obtain from a Raman spectrum ?
Peak position: Chemical species, crystal phases,
alloy compositions
Peak shift: Strain, temperature
Intensity: Concentration
Molecular orientation(polarized)
Bandwidth Structural disorder
(amorphous/crystalline phases)
Qualitative and quantitative information
Spectroscopy LAB
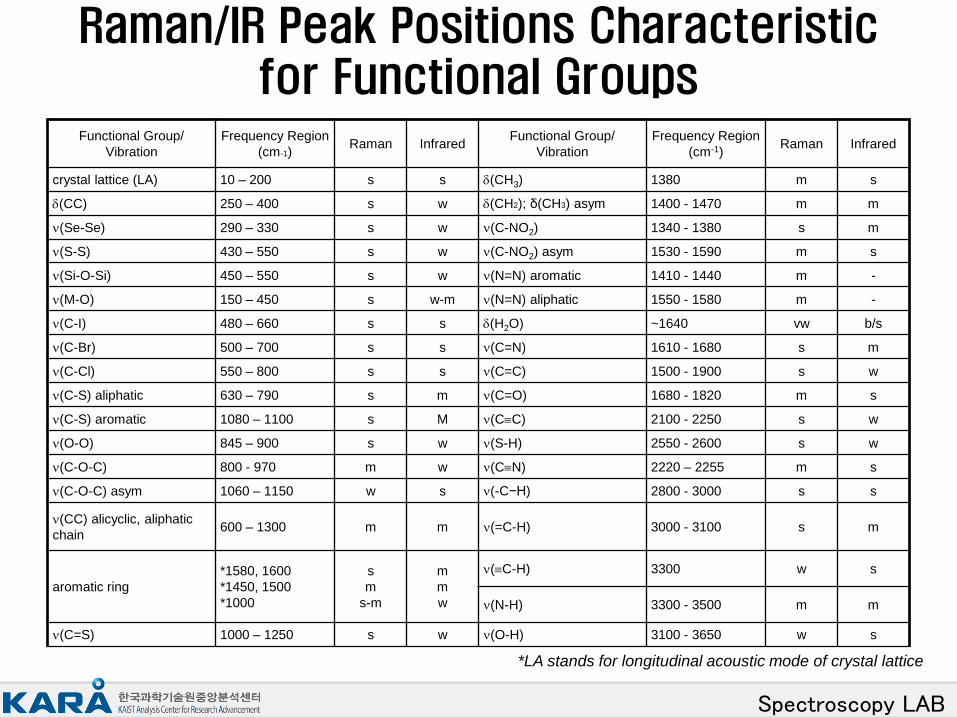
Raman/IR Peak Positions Characteristic for Functional Groups
Functional Group/
Vibration
Frequency Region
(cm-1) Raman Infrared
Functional Group/
Vibration
Frequency Region
(cm-1) Raman Infrared
crystal lattice (LA) 10 – 200 s s (CH3) 1380 m s
(CC) 250 – 400 s w (CH2); δ(CH3) asym 1400 - 1470 m m
(Se-Se) 290 – 330 s w (C-NO2) 1340 - 1380 s m
(S-S) 430 – 550 s w (C-NO2) asym 1530 - 1590 m s
(Si-O-Si) 450 – 550 s w (N=N) aromatic 1410 - 1440 m -
(M-O) 150 – 450 s w-m (N=N) aliphatic 1550 - 1580 m -
(C-I) 480 – 660 s s (H2O) ~1640 vw b/s
(C-Br) 500 – 700 s s (C=N) 1610 - 1680 s m
(C-Cl) 550 – 800 s s (C=C) 1500 - 1900 s w
(C-S) aliphatic 630 – 790 s m (C=O) 1680 - 1820 m s
(C-S) aromatic 1080 – 1100 s M (CC) 2100 - 2250 s w
(O-O) 845 – 900 s w (S-H) 2550 - 2600 s w
(C-O-C) 800 - 970 m w (CN) 2220 – 2255 m s
(C-O-C) asym 1060 – 1150 w s (-C−Η) 2800 - 3000 s s
(CC) alicyclic, aliphatic
chain 600 – 1300 m m (=C-H) 3000 - 3100 s m
aromatic ring
*1580, 1600
*1450, 1500
*1000
s
m
s-m
m
m
w
(C-H) 3300 w s
(N-H) 3300 - 3500 m m
(C=S) 1000 – 1250 s w (O-H) 3100 - 3650 w s
*LA stands for longitudinal acoustic mode of crystal lattice
Spectroscopy LAB
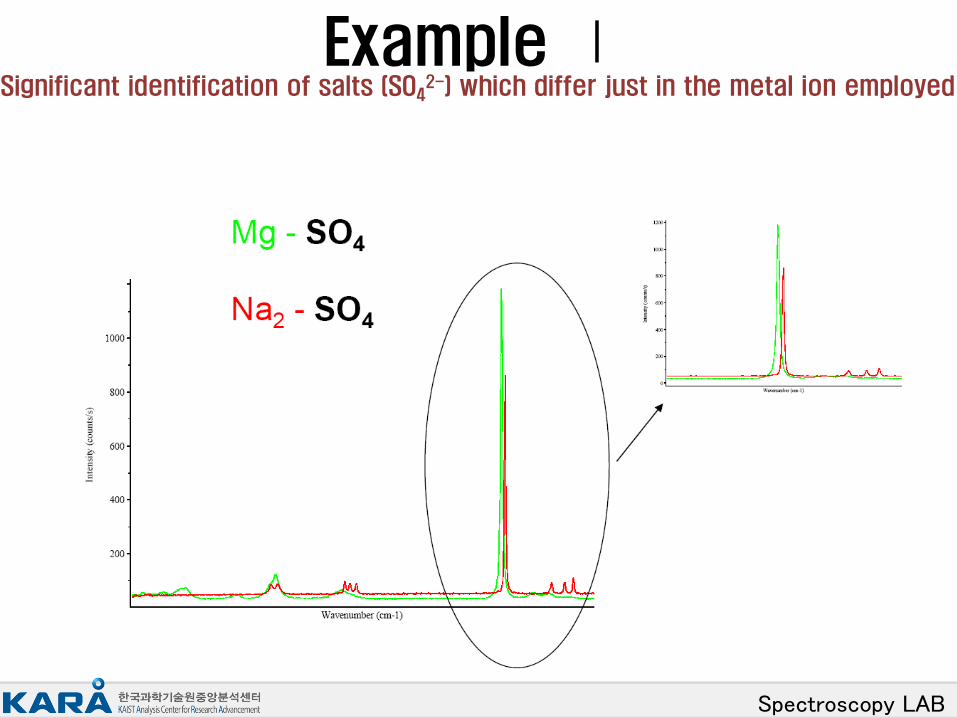
Example Ⅰ Significant identification of salts (SO4
2-) which differ just in the metal ion employed
Spectroscopy LAB
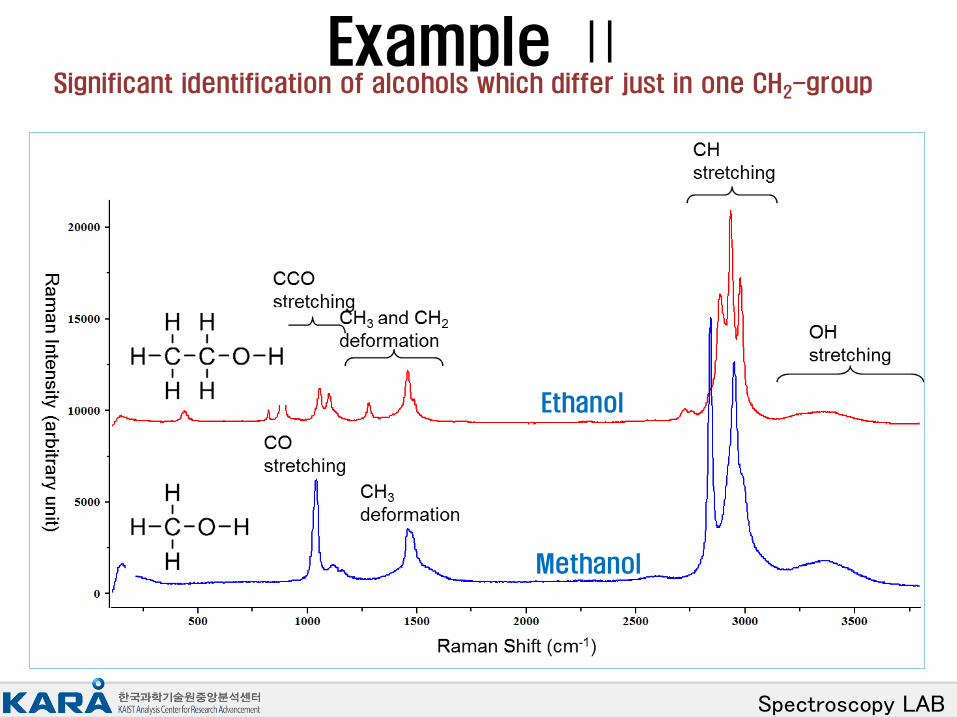
Example Ⅱ Significant identification of alcohols which differ just in one CH2-group
Methanol
Ethanol
Spectroscopy LAB
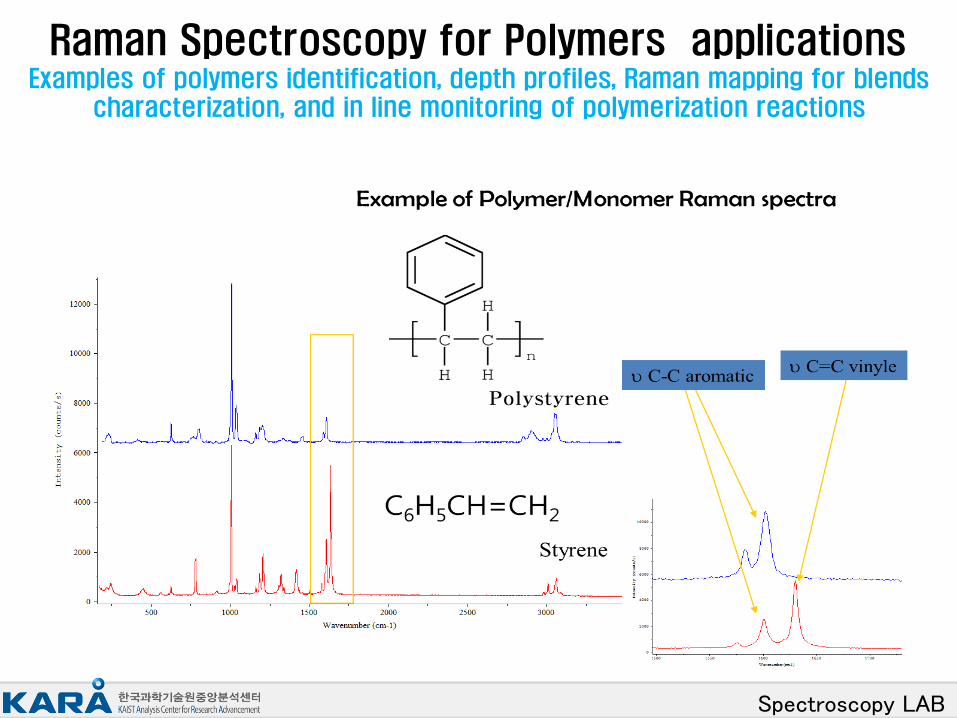
Raman Spectroscopy for Polymers applications Examples of polymers identification, depth profiles, Raman mapping for blends
characterization, and in line monitoring of polymerization reactions
Polystyrene
Spectroscopy LAB
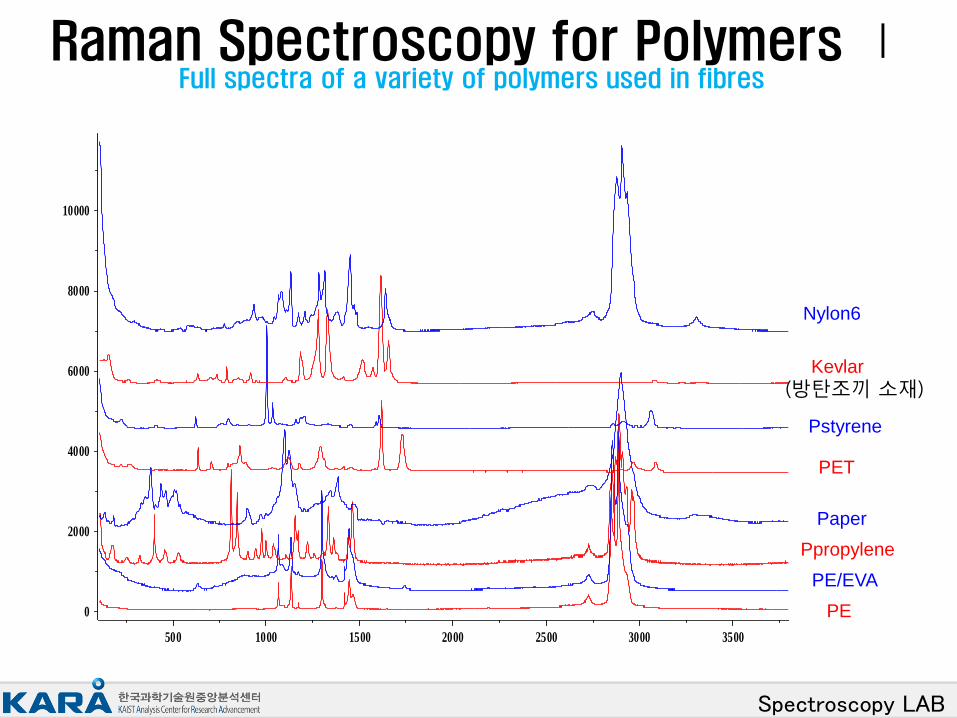
Raman Spectroscopy for Polymers Ⅰ Full spectra of a variety of polymers used in fibres
10000
8000
6000
4000
2000
0
500 1000 1500 2000 2500 3000 3500
Nylon6
Kevlar
Pstyrene
PET
Paper
Ppropylene
PE/EVA
PE
(방탄조끼 소재)
Spectroscopy LAB
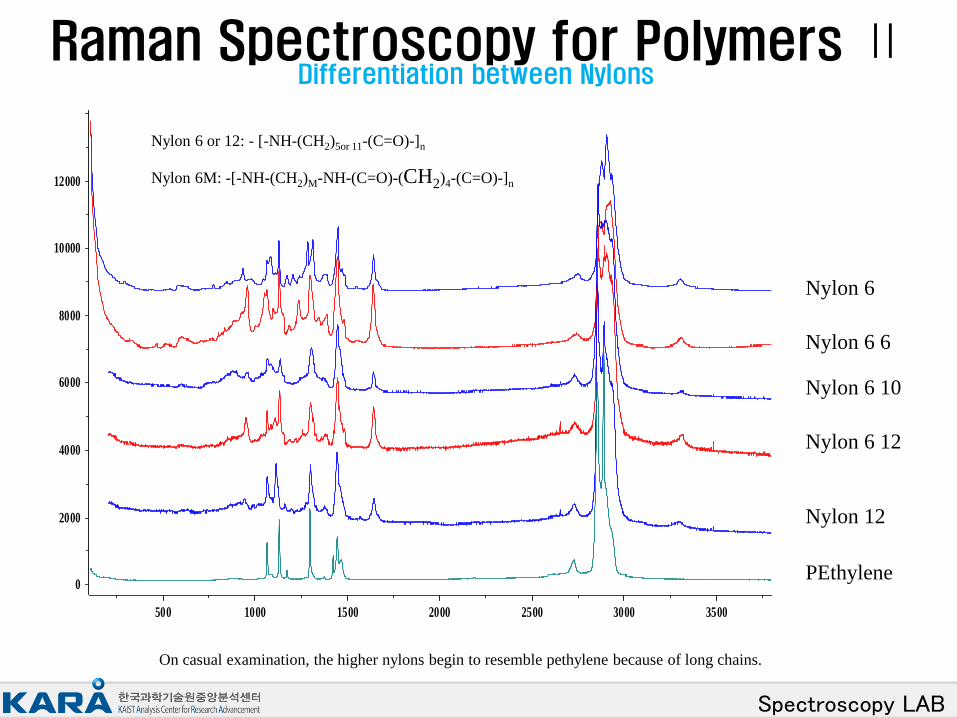
Raman Spectroscopy for Polymers Ⅱ
Nylon 6
Nylon 6 6
Nylon 6 10
Nylon 6 12
Nylon 12
PEthylene
12000
10000
8000
6000
4000
2000
0
500 1000 1500 2000 2500 3000 3500
On casual examination, the higher nylons begin to resemble pethylene because of long chains.
Nylon 6 or 12: - [-NH-(CH2)5or 11-(C=O)-]n
Nylon 6M: -[-NH-(CH2)M-NH-(C=O)-(CH2)4-(C=O)-]n
Differentiation between Nylons
Spectroscopy LAB
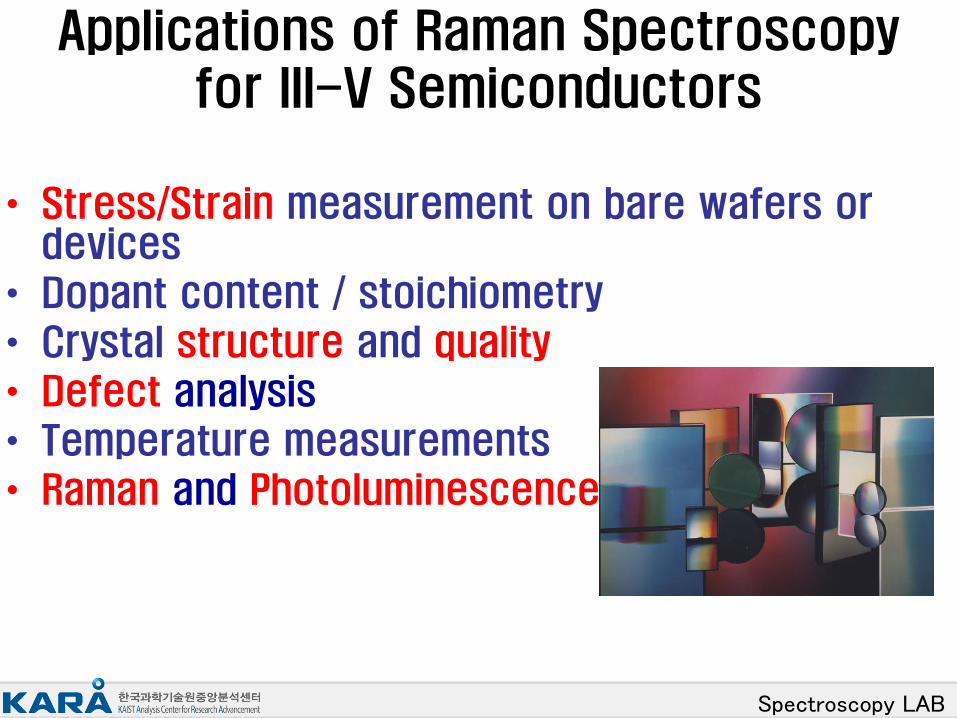
Applications of Raman Spectroscopy for III-V Semiconductors
• Stress/Strain measurement on bare wafers or devices
• Dopant content / stoichiometry
• Crystal structure and quality
• Defect analysis
• Temperature measurements
• Raman and Photoluminescence
Spectroscopy LAB
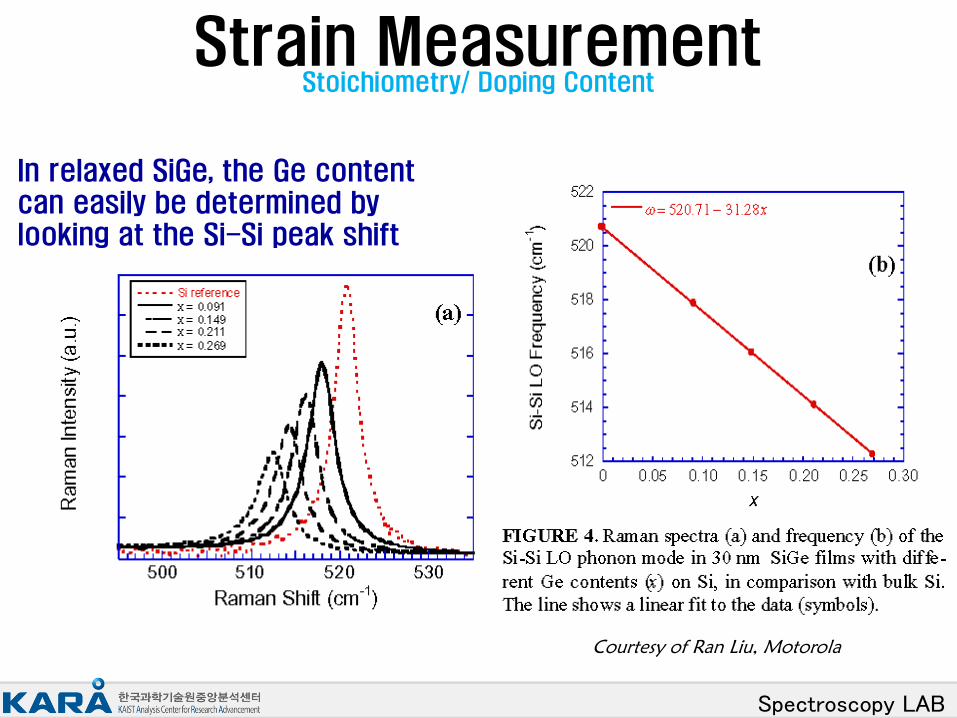
Strain Measurement
Courtesy of Ran Liu, Motorola
Stoichiometry/ Doping Content
In relaxed SiGe, the Ge content can easily be determined by looking at the Si-Si peak shift
Spectroscopy LAB
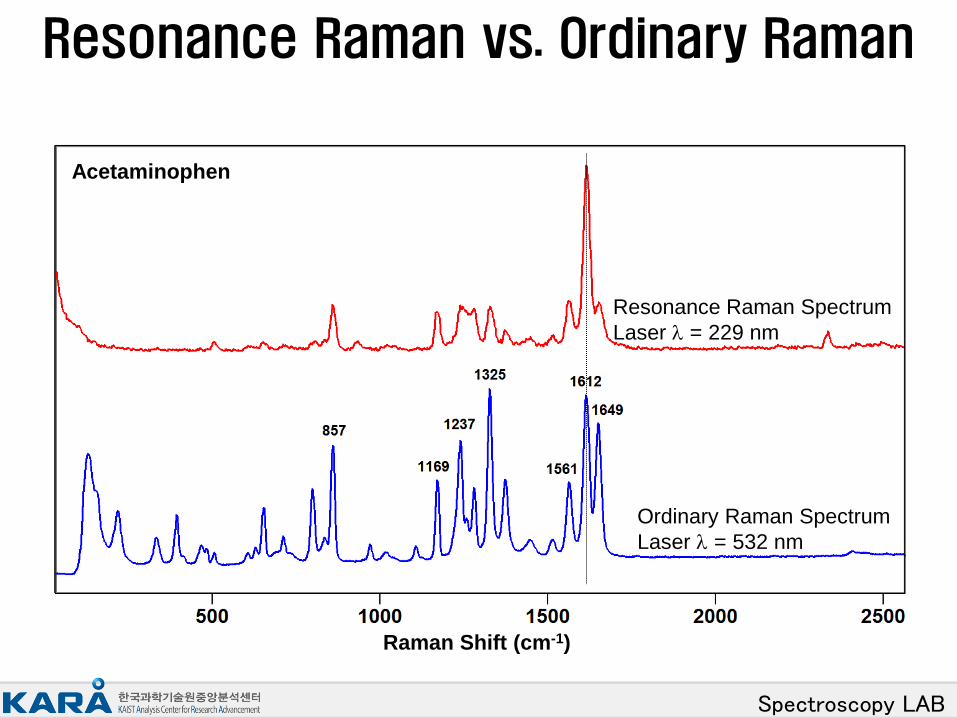
Resonance Raman vs. Ordinary Raman
Raman Shift (cm-1)
Acetaminophen
Resonance Raman Spectrum
Laser = 229 nm
Ordinary Raman Spectrum
Laser = 532 nm
Spectroscopy LAB
Raman Application
Spectroscopy LAB
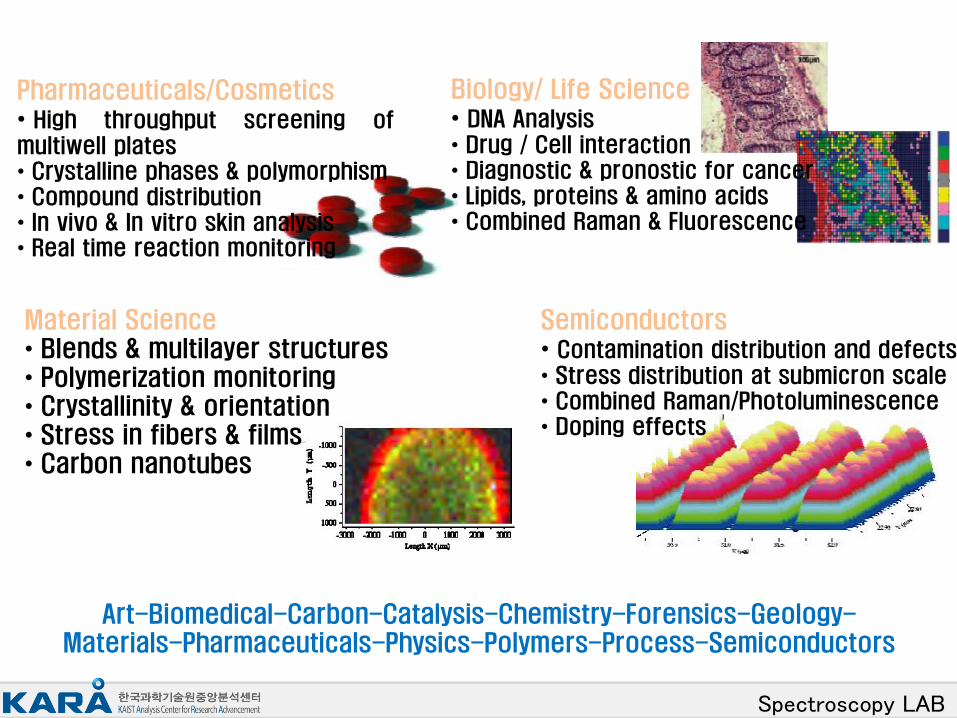
Pharmaceuticals/Cosmetics • High throughput screening of multiwell plates • Crystalline phases & polymorphism • Compound distribution • In vivo & In vitro skin analysis • Real time reaction monitoring
Material Science • Blends & multilayer structures • Polymerization monitoring • Crystallinity & orientation • Stress in fibers & films • Carbon nanotubes
Biology/ Life Science • DNA Analysis • Drug / Cell interaction • Diagnostic & pronostic for cancer • Lipids, proteins & amino acids • Combined Raman & Fluorescence
Semiconductors • Contamination distribution and defects • Stress distribution at submicron scale • Combined Raman/Photoluminescence • Doping effects
Art-Biomedical-Carbon-Catalysis-Chemistry-Forensics-Geology- Materials-Pharmaceuticals-Physics-Polymers-Process-Semiconductors
Spectroscopy LAB
Dispersive vs. FT-Raman vs. FT-IR spectroscopy
Spectroscopy LAB
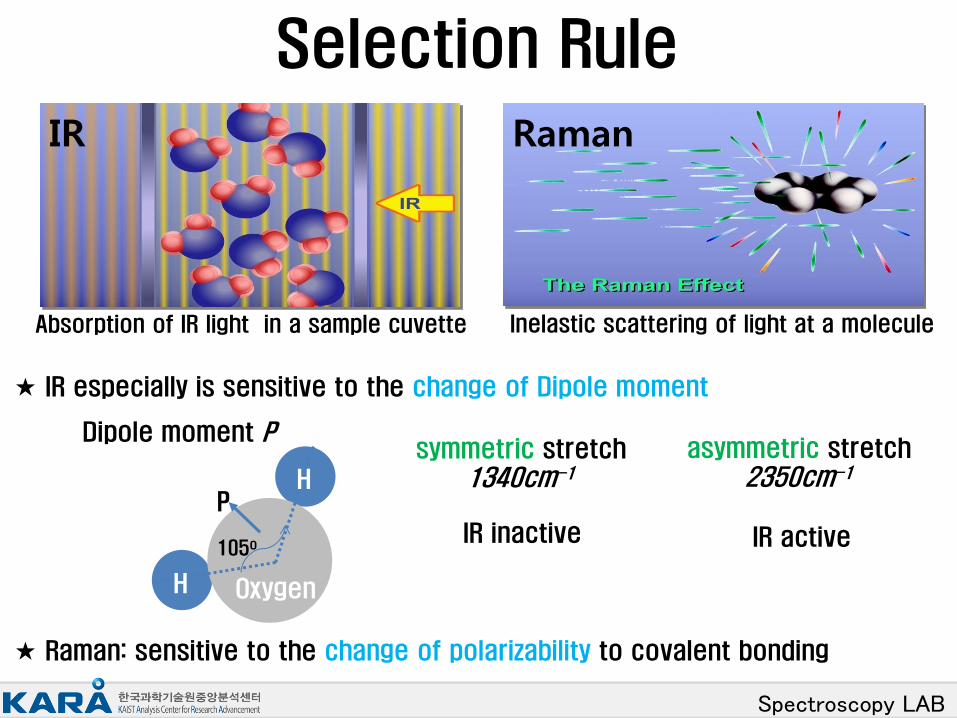
Selection Rule
★ IR especially is sensitive to the change of Dipole moment
105o
Dipole moment P
P H
H Oxygen
symmetric stretch 1340cm-1
asymmetric stretch 2350cm-1
IR inactive IR active
★ Raman: sensitive to the change of polarizability to covalent bonding
Inelastic scattering of light at a molecule Absorption of IR light in a sample cuvette
IR Raman
Spectroscopy LAB
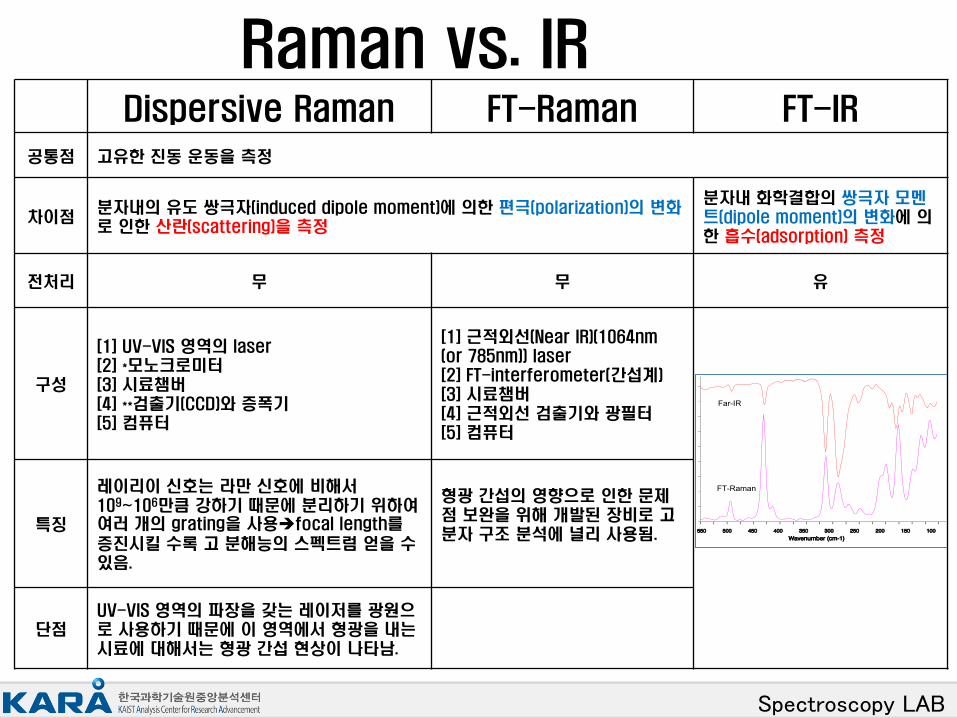
Dispersive Raman FT-Raman FT-IR
공통점 고유한 진동 운동을 측정
차이점 분자내의 유도 쌍극자(induced dipole moment)에 의한 편극(polarization)의 변화로 인한 산란(scattering)을 측정
분자내 화학결합의 쌍극자 모멘트(dipole moment)의 변화에 의한 흡수(adsorption) 측정
전처리 무 무 유
구성
[1] UV-VIS 영역의 laser [2] *모노크로미터 [3] 시료챔버 [4] **검출기(CCD)와 증폭기 [5] 컴퓨터
[1] 근적외선(Near IR)(1064nm (or 785nm)) laser [2] FT-interferometer(간섭계) [3] 시료챔버 [4] 근적외선 검출기와 광필터 [5] 컴퓨터
특징
레이리이 신호는 라만 신호에 비해서 109~106만큼 강하기 때문에 분리하기 위하여 여러 개의 grating을 사용focal length를 증진시킬 수록 고 분해능의 스펙트럼 얻을 수 있음.
형광 간섭의 영향으로 인한 문제점 보완을 위해 개발된 장비로 고분자 구조 분석에 널리 사용됨.
단점 UV-VIS 영역의 파장을 갖는 레이저를 광원으로 사용하기 때문에 이 영역에서 형광을 내는 시료에 대해서는 형광 간섭 현상이 나타남.
Raman vs. IR
Spectroscopy LAB
Raman Instrument
Spectroscopy LAB
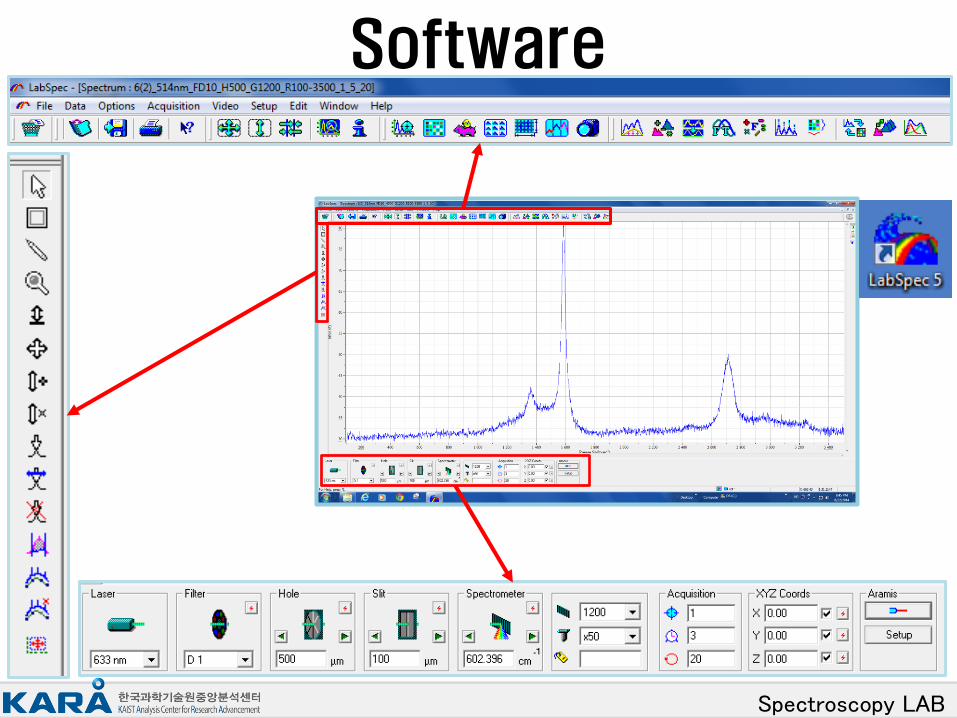
Software

Spectroscopy LAB
LabRam HR 800
Spectroscopy LAB
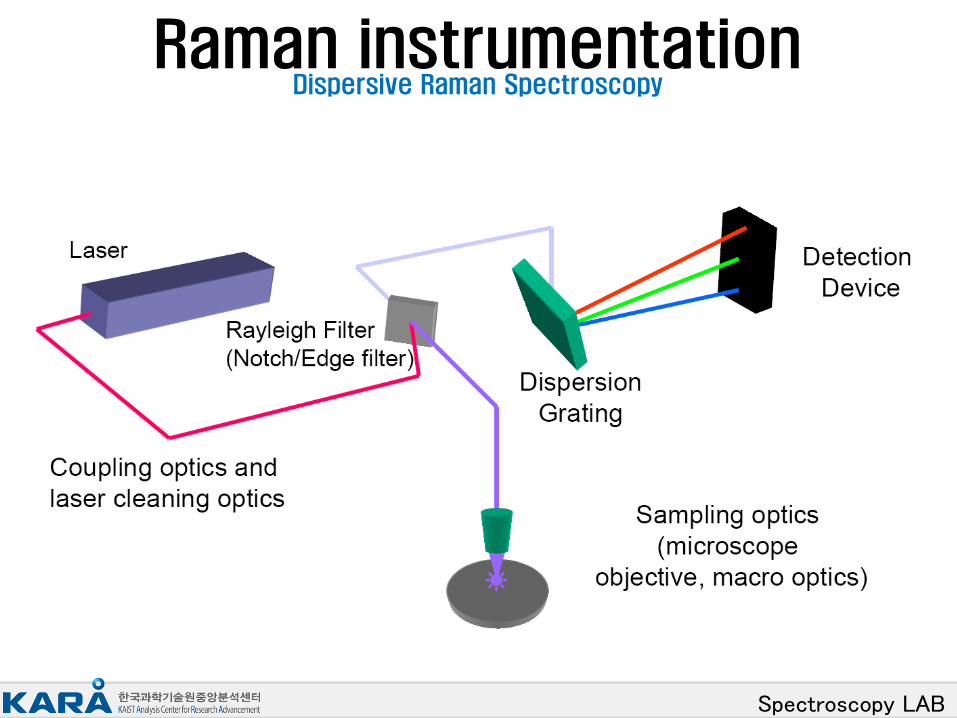
Raman instrumentation Dispersive Raman Spectroscopy
Spectroscopy LAB
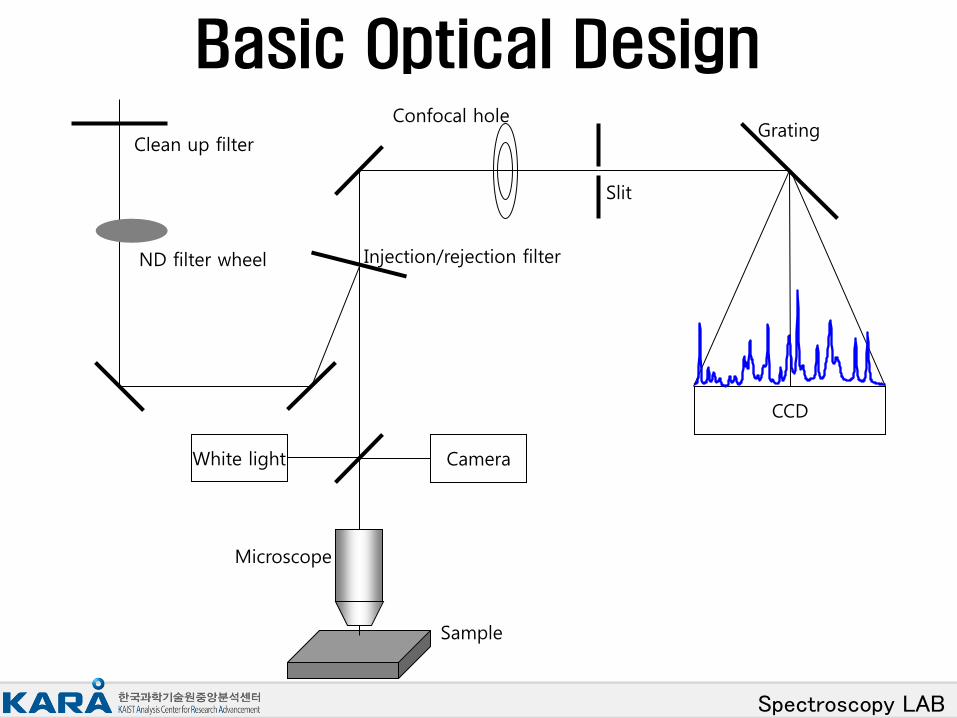
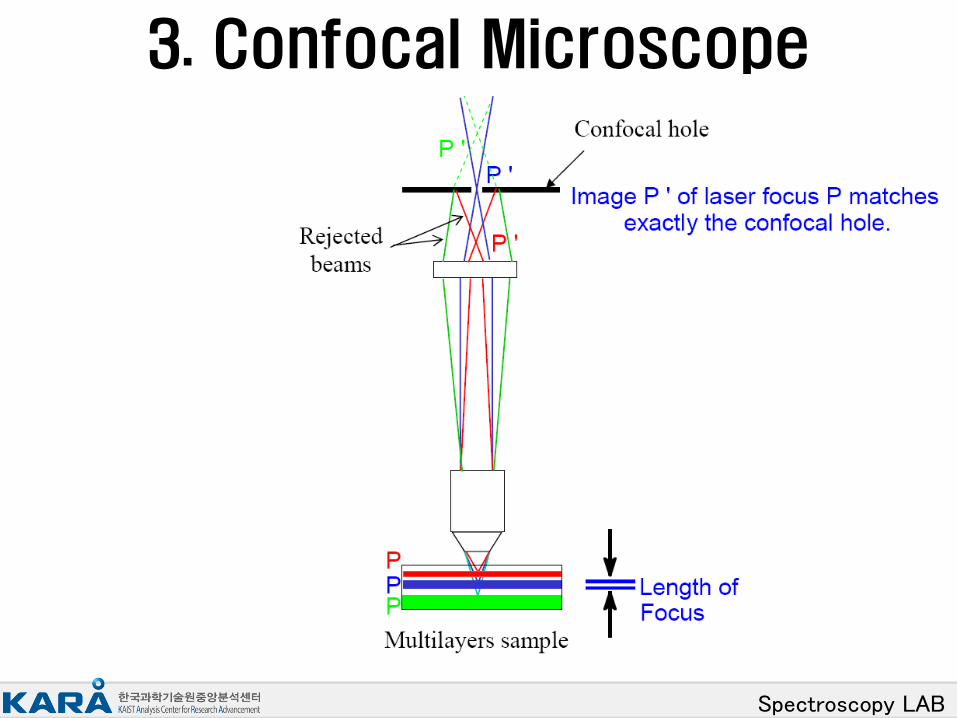
ND filter wheel Injection/rejection filter
Sample
Microscope
Confocal hole Grating
Camera
CCD
Clean up filter
Slit
White light
Basic Optical Design
Spectroscopy LAB
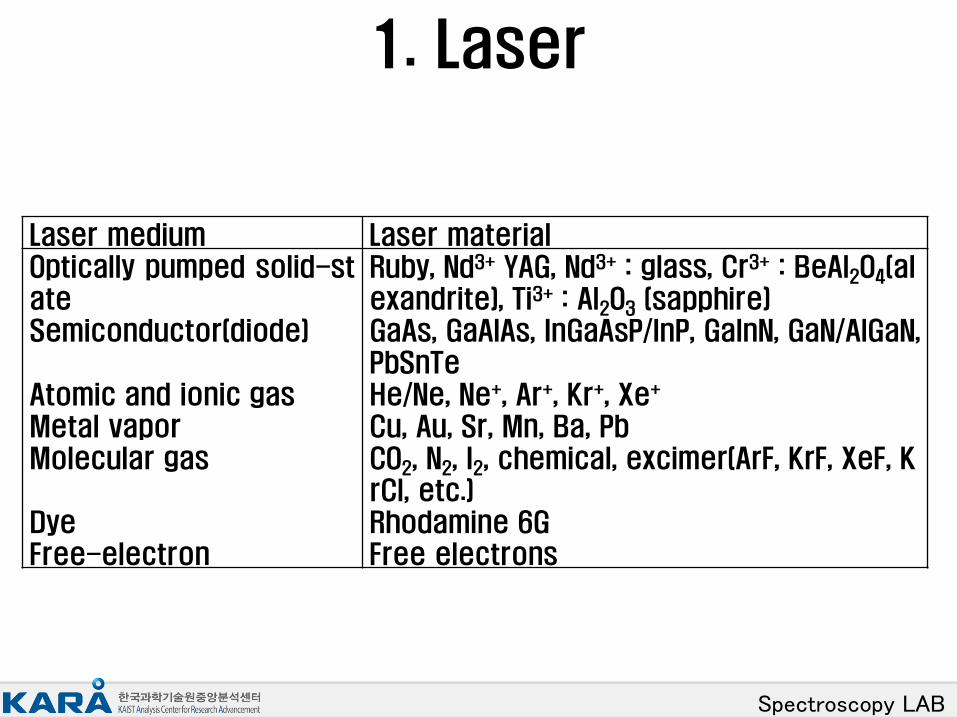
1. Laser
Laser medium Laser material Optically pumped solid-state Semiconductor(diode) Atomic and ionic gas Metal vapor Molecular gas Dye Free-electron
Ruby, Nd3+ YAG, Nd3+ : glass, Cr3+ : BeAl2O4(alexandrite), Ti3+ : Al2O3 (sapphire) GaAs, GaAlAs, InGaAsP/InP, GaInN, GaN/AlGaN, PbSnTe He/Ne, Ne+, Ar+, Kr+, Xe+ Cu, Au, Sr, Mn, Ba, Pb CO2, N2, I2, chemical, excimer(ArF, KrF, XeF, KrCl, etc.) Rhodamine 6G Free electrons
Spectroscopy LAB
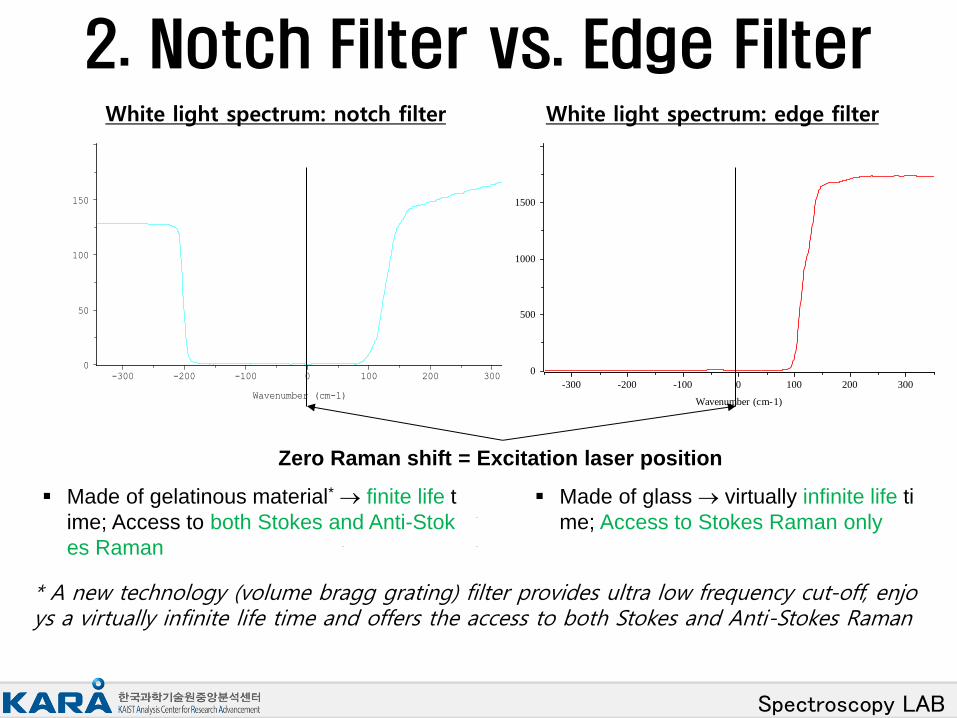
Zero Raman shift = Excitation laser position
2. Notch Filter vs. Edge Filter White light spectrum: notch filter
150
100
50
0
Intensity (a.u.)
-300 -200 -100 0 100 200 300
Wavenumber (cm-1)
1500
1000
500
0
-300 -200 -100 0 100 200 300
Wavenumber (cm-1)
White light spectrum: edge filter
Made of gelatinous material* finite life t
ime; Access to both Stokes and Anti-Stok
es Raman
* A new technology (volume bragg grating) filter provides ultra low frequency cut-off, enjoys a virtually infinite life time and offers the access to both Stokes and Anti-Stokes Raman
Made of glass virtually infinite life ti
me; Access to Stokes Raman only
Spectroscopy LAB
3. Confocal Microscope

Spectroscopy LAB
4. Grating
High density groove grating Same wavelength
Same focal length
Low density groove grating Same wavelength
Same focal length
Dis
pers
ion
Dis
pers
ion
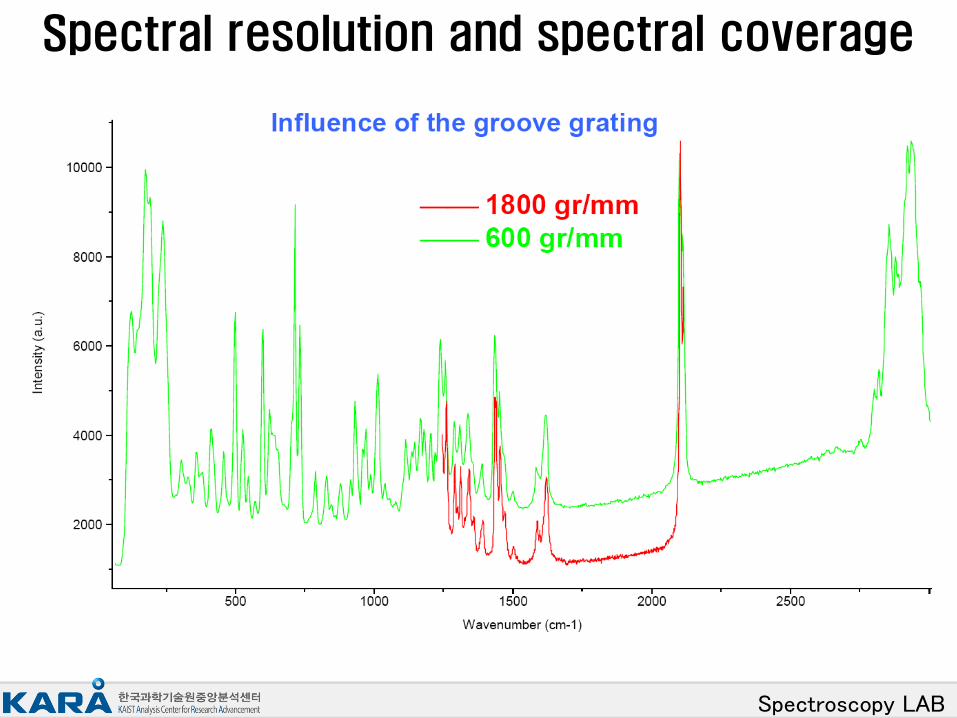
Spectral resolution is a function of the grating groove density. Given the same focal length and wavelength range,
High groove density grating High spectral resolution,
Low groove density grating Low spectral resolution
Very high groove density gratings (e.g. 2400 gr/mm) cannot be used with long wavelength lasers (e.g. red and NIR).
Spectroscopy LAB
Spectral resolution and spectral coverage
Spectroscopy LAB
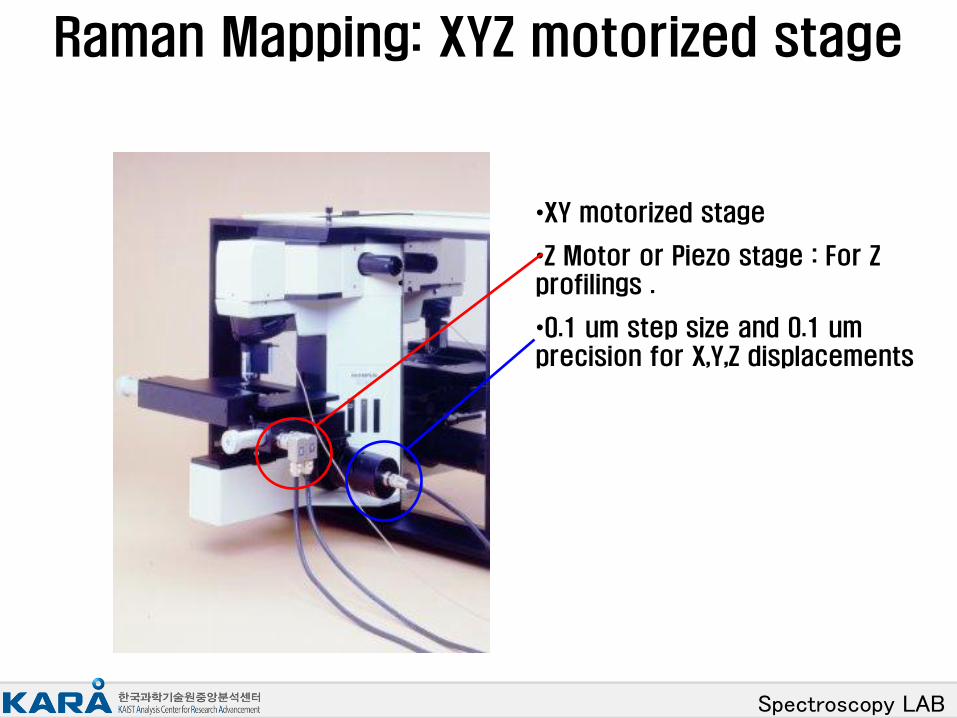
Raman Mapping: XYZ motorized stage
•XY motorized stage
•Z Motor or Piezo stage : For Z profilings .
•0.1 um step size and 0.1 um precision for X,Y,Z displacements
Spectroscopy LAB
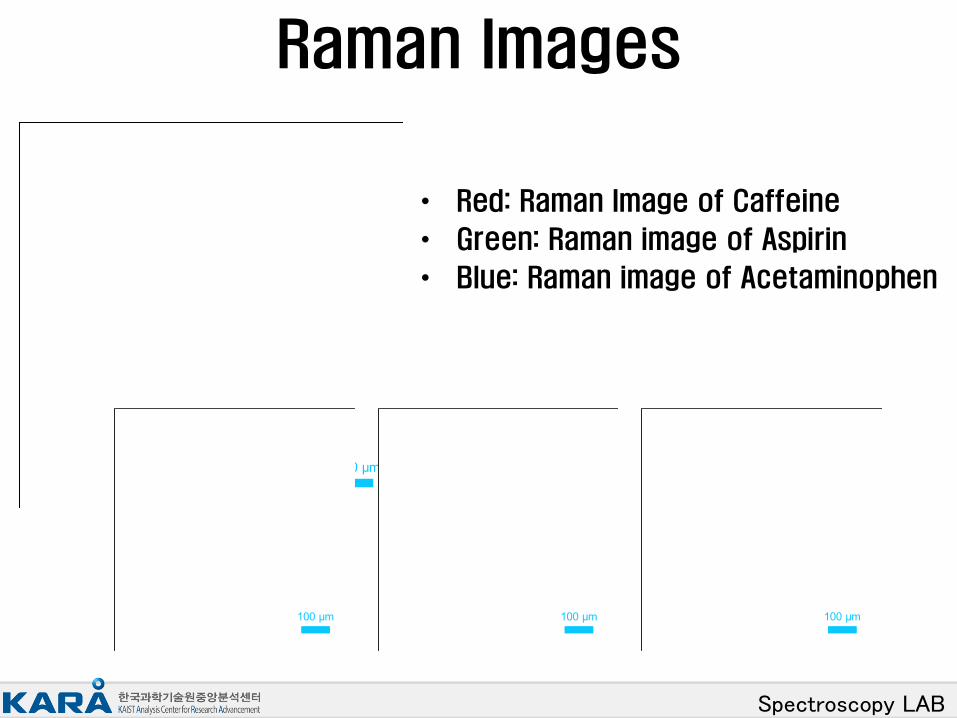
Raman Images
• Red: Raman Image of Caffeine
• Green: Raman image of Aspirin
• Blue: Raman image of Acetaminophen
50 µm
100 µm100 µm100 µm
Spectroscopy LAB
자율 사용자 수칙
Spectroscopy LAB
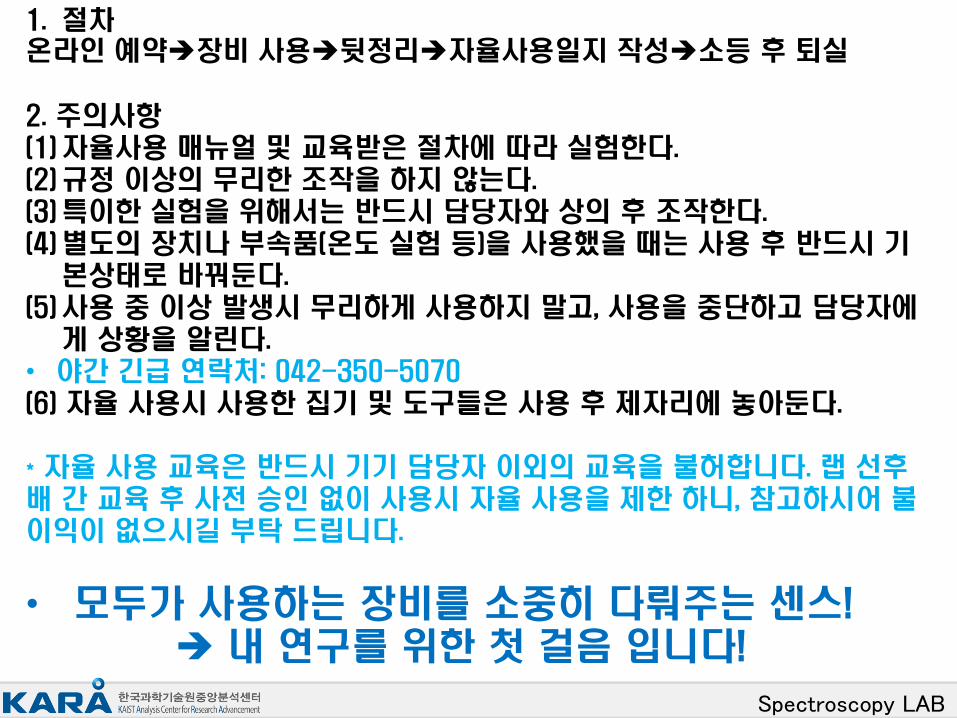
1. 절차 온라인 예약장비 사용뒷정리자율사용일지 작성소등 후 퇴실 2. 주의사항 (1) 자율사용 매뉴얼 및 교육받은 절차에 따라 실험한다. (2) 규정 이상의 무리한 조작을 하지 않는다. (3) 특이한 실험을 위해서는 반드시 담당자와 상의 후 조작한다. (4) 별도의 장치나 부속품(온도 실험 등)을 사용했을 때는 사용 후 반드시 기
본상태로 바꿔둔다. (5) 사용 중 이상 발생시 무리하게 사용하지 말고, 사용을 중단하고 담당자에
게 상황을 알린다. • 야간 긴급 연락처: 042-350-5070 (6) 자율 사용시 사용한 집기 및 도구들은 사용 후 제자리에 놓아둔다. * 자율 사용 교육은 반드시 기기 담당자 이외의 교육을 불허합니다. 랩 선후배 간 교육 후 사전 승인 없이 사용시 자율 사용을 제한 하니, 참고하시어 불이익이 없으시길 부탁 드립니다.
• 모두가 사용하는 장비를 소중히 다뤄주는 센스! 내 연구를 위한 첫 걸음 입니다!
Spectroscopy LAB
KAIST 중앙분석센터 Center Tour
(KAIST Analysis Center for Research Advancement)
Spectroscopy LAB
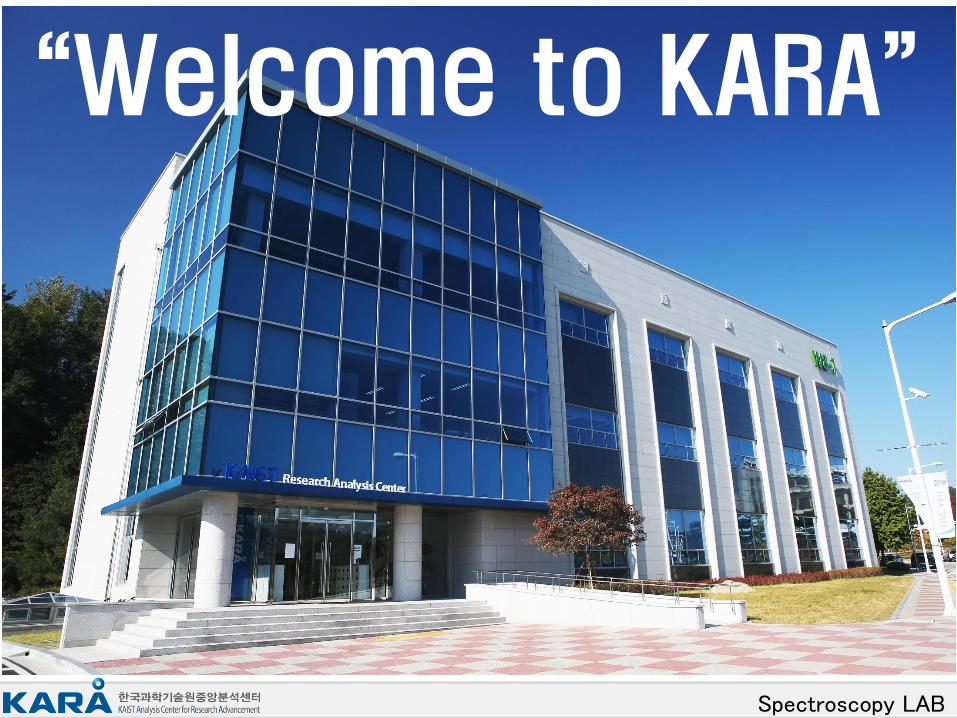
“Welcome to KARA”