Embed Size (px)
Citation preview

Rapid, Field-Based Hydrogeochemical-Survey Analysis and Assessment of SeasonalVariation Using a Field-Portable Photometer and Voltammeter, Marmot Lake NTS
Area, South-Central British Columbia (NTS 093B/13)
R. Yehia, MYAR Consulting, Vancouver, BC, [email protected]
D.R. Heberlein, Heberlein Geoconsulting, North Vancouver, BC
R.E. Lett, Consultant, Victoria, BC
Yehia, R., Heberlein, D.R., and Lett, R.E. (2017): Rapid, field-based hydrogeochemical-survey analysis and assessment of seasonal varia-tion using a field-portable photometer and voltammeter, Marmot Lake NTS area, south-central British Columbia (NTS 093B/13); inGeoscience BC Summary of Activities 2016, Geoscience BC, Report 2017-1, p. 133–140.
Introduction
Water geochemistry can provide useful information in sup-
port of many resource sectors, such as mineral (Taufen
1997; Leybourne and Cameron, 2010), geothermal (Yehia
et al., 2013), petroleum and environmental (Saha and Sahu,
2015). Building on the successful outcome of the 2014 pro-
ject (Yehia and Heberlein, 2015) and on the wealth of data
available in the TREK project area (Angen et al., 2015;
Jackaman et al., 2015; Lett and Jackaman, 2015; Bordet
and Hart, 2016), this project aims to extend the real-time
hydrogeochemical-survey methodology to a regional set-
ting and, at the same time, investigate the effects of sea-
sonal variations and the potential for rapid, field-based de-
tection of anomalous hydrogeochemistry indicative of
mineral occurrences. As well, this project assesses the ap-
plication of another technology for the rapid, field-based
analysis of water-sample chemistry, the Modern Water
PDV6000ultra voltammeter (PDV; Braungardt et al.,
2010; Lewtas et al., 2010), an electrochemical method
based on anodic stripping voltammetry (ASV).
Photometer technology and field-data-collection method-
ology are discussed in detail in Yehia and Heberlein (2015).
This project aims to expand upon the results of that study by
achieving the following objectives:
• Provide a regional-scale hydrogeochemistry dataset to
supplement the QUEST and TREK SE stream-sedi-
ment, lake-sediment and till geochemical surveys in the
Marmot Lake NTS area (NTS 093B/13), using field-
based portable photometer and voltammeter instrumen-
tation
• Investigate seasonal variability of water chemistry by
repeating the sampling campaign in spring, summer and
fall
• Investigate known mineral occurrences to determine
their associated hydrogeochemical responses
• Produce accurate, precise and cost-effective analytical
results for selected cations and anions that are relevant
to the mineral-exploration community
• Investigate the capabilities of the PDV for rapid
hydrogeochemical surveys
Orientation Survey
One of the recommendations in Yehia and Heberlein (2015)
was to carry out a small orientation survey prior to the field
surveys. This orientation survey was designed to optimize
sampling, sample preservation (Hall, 1998; Khanna et al.,
2009) and analytical methods for the Palintest® Photometer
8000 and the PDV. It was carried out at three locations:
1) Furry Creek and Britannia Creek, which drain the Bri-
tannia mine area; 2) Lynn Creek in the Lynn Headwaters
Regional Park; and 3) a creek flowing southwest of Fraser-
view Golf Course in Vancouver. The sites were chosen for
1) ease of access during the spring runoff, 2) detecting po-
tential mineralization in the water with the chosen methods,
and 3) potential for mineralization comparison between
laboratory and field-based water analyses. The survey in-
cluded the collection of four samples at each of these locali-
ties: two filtered samples, one with acidification and a sec-
ond without acidification; and two unfiltered samples, also
acidified and non-acidified. Following the procedures out-
lined in Yehia and Heberlein (2015), duplicate unfiltered
and acidified samples were sent to the ALS Environmental
laboratory (Burnaby, BC) for comparative analysis.
Results from photometer tests were inconclusive in defin-
ing a single preferred sampling type for routine collection.
This was due mainly to a small sample set and lower-than-
expected mineral concentrations for most sites. Unfortu-
nately, the PDV was unavailable for the orientation survey.
Geoscience BC Report 2017-1 133
Keywords: British Columbia, hydrogeochemistry, photometer,voltammeter, rapid, field analysis, regional geochemistry, sea-sonal variation
This publication is also available, free of charge, as colour digitalfiles in Adobe Acrobat® PDF format from the Geoscience BCwebsite: http://www.geosciencebc.com/s/DataReleases.asp.

The survey was successful, however, in identifying pho-
tometer reagents (Table 1) that seemed to have reacted ade-
quately with the nitric-acid preservation. Further testing
could be continued for Al and Fe. Previous photometer and
laboratory analysis of samples by Yehia and Heberlein
(2015) revealed that the photometer Al and Fe values were
much lower than the laboratory analyses due to lack of wa-
ter-sample preservation.
Project Area
Location and Access
The project area is located south of Nazko (Figure 1), ap-
proximately 75 km west of Quesnel in the Marmot Lake
NTS area (NTS 093B/13). As well, two mineral prospects
occur in the study area, and recently collected water, soil
and gas investigation data are available (Lett and Jacka-
man, 2015) for comparison. The aim of sampling in the area
was to determine if rapid hydrogeochemistry surveys will
work in an environment that is hydrologically complex and
challenging. In addition, the Nazko Economic Develop-
ment Corporation was interested in assessing potential for
resource-based economic development.
134 Geoscience BC Summary of Activities 2016
Table 1. Tests performed by the portable devices chosen for thisproject. Abbreviation: PDV, Modern Water PDV6000ultra
voltammeter.
Figure 1. Locations of samples in the Marmot Lake NTS area (NTS 093B/13). Base map from GeoBase®
(2016).
Access to the study area is via the paved Nazko Road (HW 59)
and an extensive system of forestry roads throughout the
project area. Elevations in the study area range from 850 to
1250 m above mean sea level. The north-flowing Nazko
River traverses the eastern part of the study area. Another
large river, the Baezaeko, flows from southwest to north-
east in the northwestern part of the study area. The area has
an abundance of water and the various types (creeks, lakes,
wetlands) of water bodies, including bogs at higher eleva-
tions. Drainage patterns are predominantly dendritic. Some
creeks flow in and out of wetland. Afew of the wetlands are
the result of beaver activity. The forest is dominated by
lodgepole pine, which has been severely affected by the
mountain pine beetle infestation; the resulting increase in
logging activity has opened up road access to much of the
area. Accommodation and logistical staging were provided
partly as in-kind support from the Nazko Economic Devel-
opment Corporation, and residence and laboratory space
for the project crew were provided at the Blackwater log-
ging camp.
Geology and Surface Environment
The youngest rocks exposed in the survey area are volcanic
rocks of the Miocene to Holocene Anahim volcanic belt,
the easternmost limit of which is represented by the Nazko
volcanic cone that erupted approximately 7200 years ago
(Cassidy et al., 2011). Older volcanic and sedimentary
rocks are the Miocene to Pliocene Chilcotin Group basalts
along the east side of the Nazko River. Underlying the Chil-
cotin sedimentary rocks are volcanic rocks of the Eocene
Ootsa Lake Group, which are the most extensive in the
study area, while sandstone and conglomerate of the Creta-
ceous Skeena Group are widespread in the northeastern
part of the area, around the Bob Au-Ag prospect (MINFILE
093B 054; BC Geological Survey, 2016). Volcanic rocks of
the Lower to Middle Jurassic Hazelton Group occur in the
northeast corner of the study area (Massey et al., 2005). Re-
cent mapping and an interpretation of airborne geophysi-
cal-survey data by Angen et al. (2015) revised the geology
of the project area and identified several new faults,
including an inferred dextral fault along the Nazko River
valley.
The area has an abundance of glacial deposits of various
thicknesses, till being the dominant surficial material that
overlies much of the bedrock. The most recent ice-flow di-
rection in the area is generally from south-southwest to
north-northeast (Jackaman et al., 2015).
In the northwestern part of the study area, Cu-As-Au min-
eralization at the Fishpot showing (MINFILE 093B 066) is
hosted in an Eocene pyritic quartz rhyolite porphyry plug
that intrudes Late Jurassic Hazelton Group pebble con-
glomerate, shale and tuffaceous sandstone. The Hazelton
volcanic sequence consists mainly of andesitic and basaltic
flows, and lesser amounts of pyroclastic rocks. Two major
alteration zones identified on the prospect consist of car-
bonate-limonite staining and local quartz veining (Ken-
nedy, 2012).
The Bob prospect, which has been more thoroughly ex-
plored, lies just south of Nazko and east of the Nazko volca-
nic cone. It is underlain by Lower Cretaceous to Lower
Geoscience BC Report 2017-1 135
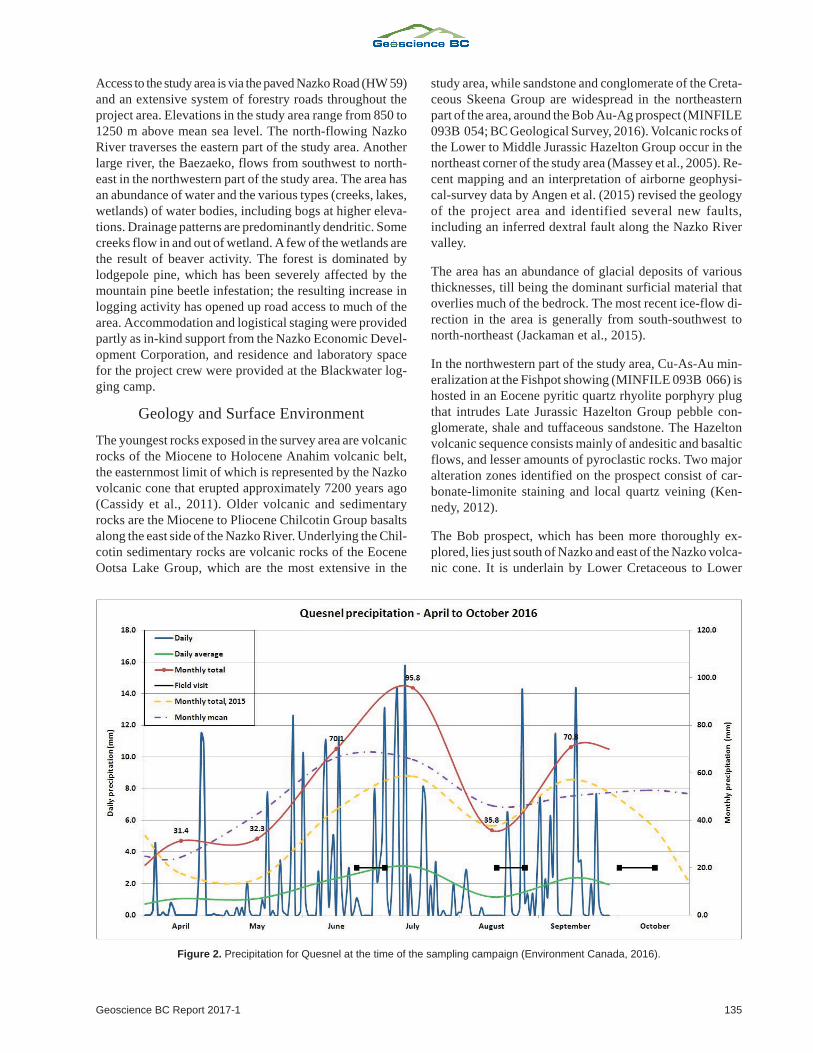
Figure 2. Precipitation for Quesnel at the time of the sampling campaign (Environment Canada, 2016).
Paleogene Skeena Group conglomerate, sandstone and
argillite that are unconformably overlain by Paleocene to
Eocene andesite, basalt, basalt breccia and rhyolite breccia.
Tertiary quartz-feldspar porphyry dikes intrude the Skeena
Group sedimentary rocks. Anomalous Au, As, Ag, Sb and
Hg levels have been reported from Skeena Group sedimen-
tary rocks that have undergone silicification and argillic al-
teration, and contain carbonate minerals and pyrite (MIN-
FILE 093B 054).
Field Conditions
Although precipitation in the month of June for the last cou-
ple of years had been below the mean of 66 mm, the June
sampling campaign was carried out under wet conditions.
Precipitation recorded for Quesnel in April and May had
been 25 mm, but totals for June and July were 56 and
82 mm, respectively (Figure 2), with potentially more pre-
cipitation noted in the Nazko area (Nazko is 600 m higher
than Quesnel). June’s precipitation turned creek water tur-
bid with high or overflowing banks, a noticeable change
from the previous two months.
Vehicle access to some parts of the area was complicated by
widespread mud on the secondary logging roads, and foot
access was complicated by high water levels in creeks and
wetlands. This made sampling at some sites and subsequent
follow-up challenging. Conditions were drier in August
compared to July, but water levels were still above average
because of July precipitation. Regardless, road and foot ac-
cess was markedly improved from the June campaign.
Sample Collection and Analysis
Water samples were collected directly from mid-stream
sites; where streams were too wide or the banks unsafe,
samples were collected using a water-sampling pole. Sam-
ples were stored in two sizes of #2 high-density polyethyl-
ene (HDPE) bottles: non-acidified samples in 1 L bottles
and acidified samples (with 3 mL ultrapure nitric acid) in
250 mL bottles. Both samples were unfiltered. Sample bot-
tles were reused and rinsed thoroughly three times with the
water to be sampled, with the cap on before sample collec-
tion. Collected water was transported in a cooler after col-
lection and stored in a refrigerator at the camp until analysis
(except for some samples that were analyzed the same af-
ternoon). Analysis was carried out within 24 hours of col-
lection for both photometer and PDV (within 48 hours in
the orientation survey). Sample locations were tested for
temperature, pH, conductivity, total dissolved solids (TDS)
and salinity using an Oakton PCStestr 35 meter. The sam-
ples were retested as a quality-control procedure with a sec-
ond PCStestr for the same parameters prior to analysis to
prevent sample mix-up and record any changes after collec-
tion. Both meters were calibrated weekly. No unusual dif-
ferences were observed between the two sets of results, ex-
cept for the expected slight pH variations and normal
analytical variations caused by using a different instru-
ment.
Identical procedures were used for samples sent to the ALS
Environmental laboratory, except for filtering on site for
dissolved-metals analysis. Dissolved tests involved filter-
ing the sample through a 0.45 μm filter and preserving the
metals in the solution with 3 mL nitric acid. Water in the
250 mL bottles was used for cation analysis, whereas the
1 L sample was required by the laboratory for TDS determi-
nation, conductivity, turbidity, anion analysis, quality-con-
trol monitoring and reanalysis (if required). Water samples
for laboratory analysis were transported in coolers to the
ALS Environmental laboratory in Burnaby by the lead au-
thor the day after returning from the field trips. Laboratory
determinations were for dissolved constituents, since both
photometer and PDV measure the dissolved component of
the sample (except for the photometer Cu test, which
analyzes for ionic Cu as well as total dissolved Cu—after
reaction with a decomplexing agent).
The number of sites sampled around mineral occurrences
turned out to be lower than initially estimated. This was due
to the lack of suitable sample sites draining directly from
the Bob prospect and inactive (dry glacial outwash) chan-
nels around the Fishpot showing. A second stage of sam-
pling involved follow-up around both mineral occurrences,
as well as more regional sampling over the broader NTS
area. Sample sites for the latter were chosen for their safe
access from the primary logging roads in spring, due to the
high water levels.
Quality Control
Quality-control measures used for the project included
• use of the manufacturer’s standard solutions and gov-
ernment-certified reference solutions for calibration
and drift monitoring;
• triplicate readings for each photometer test, which helps
to monitor analytical precision as well as identify any
reagent problem; and
• for every batch of 20 samples, the following:
- 15 field samples
- 1 field duplicate
- 1 analytical duplicate (second test from same sample
bottle)
- 1 government-certified standard
- 1 blank using ultrapure deionized water (18 MΩ)
- 1 laboratory duplicate for every tenth sample.
Analysis
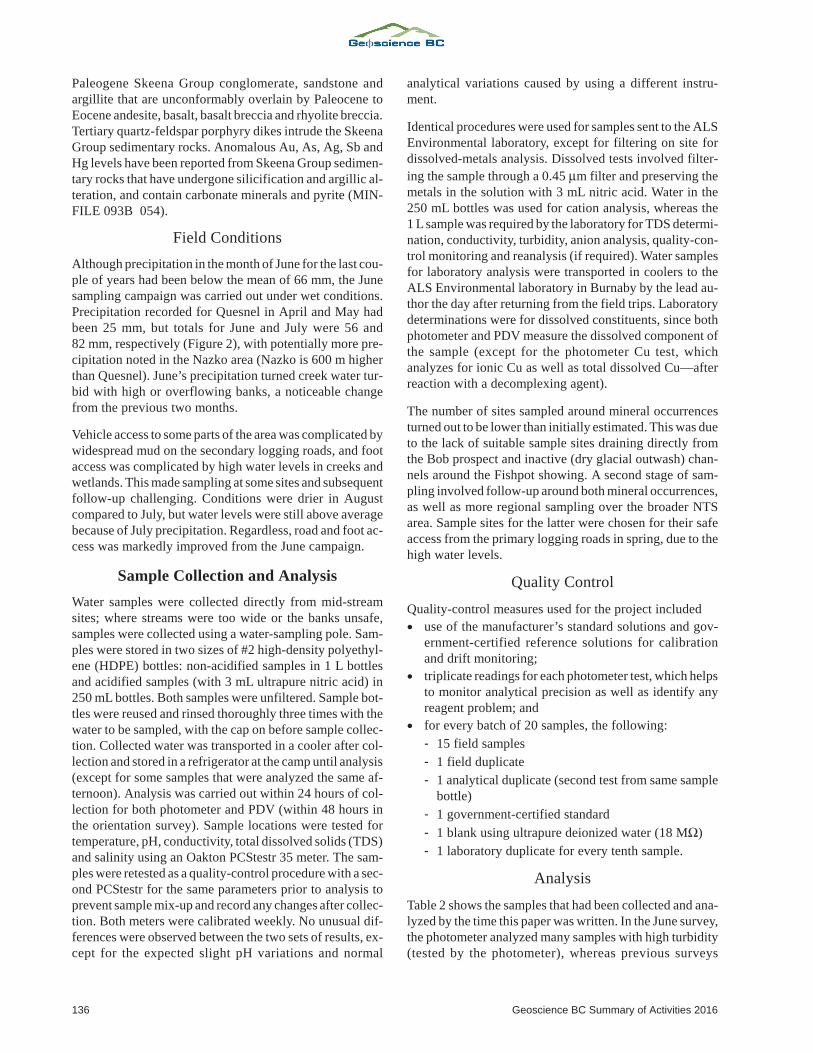
Table 2 shows the samples that had been collected and ana-
lyzed by the time this paper was written. In the June survey,
the photometer analyzed many samples with high turbidity
(tested by the photometer), whereas previous surveys
136 Geoscience BC Summary of Activities 2016
(Yehia et al., 2013; Yehia and Heberlein, 2015) included
only a very few turbid samples. Reagents that did not in-
volve a high-wavelength colour test (Figure 3), such as Cu
and MoO4, appeared to be affected by the higher turbidity
levels. As the photometer uses light to analyze the samples,
higher turbidity levels appear to produce a high bias in the
measured concentrations.
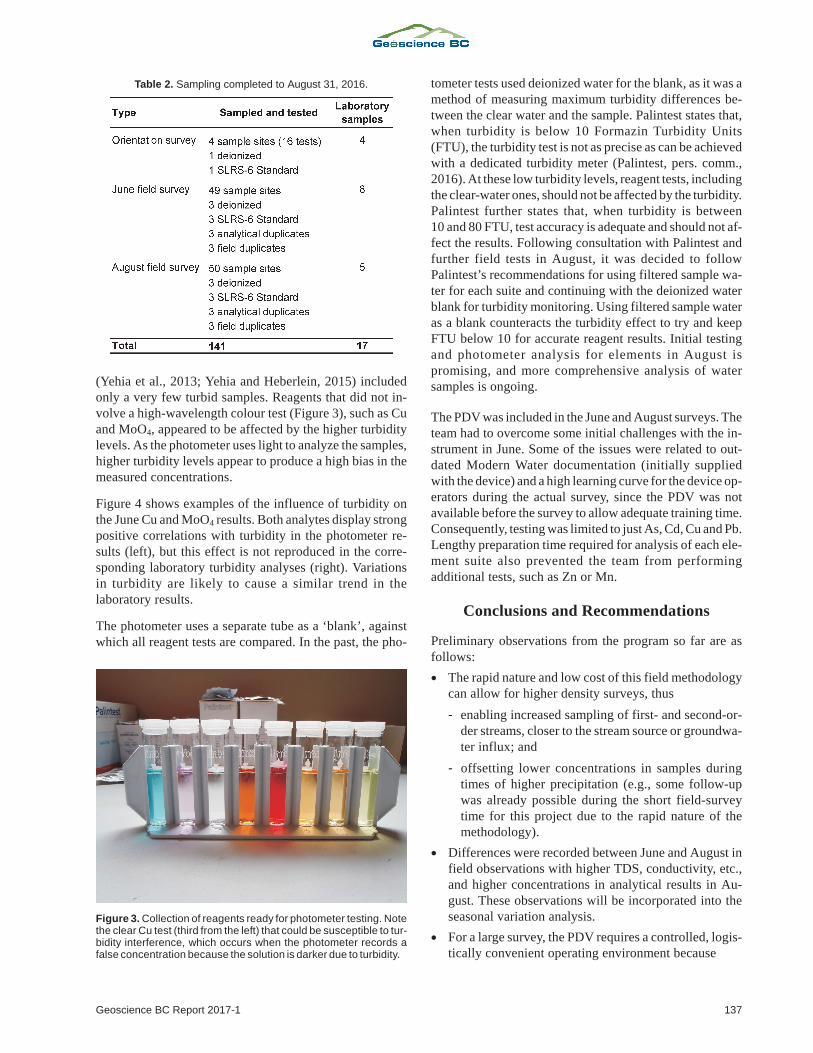
Figure 4 shows examples of the influence of turbidity on
the June Cu and MoO4 results. Both analytes display strong
positive correlations with turbidity in the photometer re-
sults (left), but this effect is not reproduced in the corre-
sponding laboratory turbidity analyses (right). Variations
in turbidity are likely to cause a similar trend in the
laboratory results.
The photometer uses a separate tube as a ‘blank’, against
which all reagent tests are compared. In the past, the pho-
tometer tests used deionized water for the blank, as it was a
method of measuring maximum turbidity differences be-
tween the clear water and the sample. Palintest states that,
when turbidity is below 10 Formazin Turbidity Units
(FTU), the turbidity test is not as precise as can be achieved
with a dedicated turbidity meter (Palintest, pers. comm.,
2016). At these low turbidity levels, reagent tests, including
the clear-water ones, should not be affected by the turbidity.
Palintest further states that, when turbidity is between
10 and 80 FTU, test accuracy is adequate and should not af-
fect the results. Following consultation with Palintest and
further field tests in August, it was decided to follow
Palintest’s recommendations for using filtered sample wa-
ter for each suite and continuing with the deionized water
blank for turbidity monitoring. Using filtered sample water
as a blank counteracts the turbidity effect to try and keep
FTU below 10 for accurate reagent results. Initial testing
and photometer analysis for elements in August is
promising, and more comprehensive analysis of water
samples is ongoing.
The PDV was included in the June and August surveys. The
team had to overcome some initial challenges with the in-
strument in June. Some of the issues were related to out-
dated Modern Water documentation (initially supplied
with the device) and a high learning curve for the device op-
erators during the actual survey, since the PDV was not
available before the survey to allow adequate training time.
Consequently, testing was limited to just As, Cd, Cu and Pb.
Lengthy preparation time required for analysis of each ele-
ment suite also prevented the team from performing
additional tests, such as Zn or Mn.
Conclusions and Recommendations
Preliminary observations from the program so far are as
follows:
• The rapid nature and low cost of this field methodology
can allow for higher density surveys, thus
- enabling increased sampling of first- and second-or-
der streams, closer to the stream source or groundwa-
ter influx; and
- offsetting lower concentrations in samples during
times of higher precipitation (e.g., some follow-up
was already possible during the short field-survey
time for this project due to the rapid nature of the
methodology).
• Differences were recorded between June and August in
field observations with higher TDS, conductivity, etc.,
and higher concentrations in analytical results in Au-
gust. These observations will be incorporated into the
seasonal variation analysis.
• For a large survey, the PDV requires a controlled, logis-
tically convenient operating environment because
Geoscience BC Report 2017-1 137
Table 2. Sampling completed to August 31, 2016.
Figure 3. Collection of reagents ready for photometer testing. Notethe clear Cu test (third from the left) that could be susceptible to tur-bidity interference, which occurs when the photometer records afalse concentration because the solution is darker due to turbidity.
138 Geoscience BC Summary of Activities 2016
Fig
ure
4.S
ca
tte
rplo
tssh
ow
ing
the
po
ten
tia
lfo
rtu
rbid
ity
eff
ecto
ne
lem
en
tco
nce
ntr
atio
ns
de
term
ine
db
yp
ho
tom
ete
ra
na
lysis
(le
ft)a
nd
lab
ora
tory
an
aly
sis
(rig
ht)
.N
ote
the
ne
ga
tive
turb
idity
ve
rsu
sco
nce
ntr
atio
nco
rre
latio
nin
the
plo
to
fM
ola
bo
rato
ryco
nce
ntr
atio
ns
(bo
tto
mri
gh
t).
- each analyte suite requires a certain amount of prepa-
ration time. For large sample sets, any technical diffi-
culties encountered during that time cause significant
delays and analytical backlog.
- lack of a Canadian distributor and technical support
caused delays and supply difficulties, and is an issue
to consider for surveys under a strict timetable.
- unlike the photometer, a higher technical skill level
and additional training time are required.
• The PDV has the ability to detect concentrations at
much lower levels than the photometer, and offers addi-
tional cation tests that the Palintest photometer does not
include (Table 1).
Continuing Fieldwork
The lead author returned to the project site in October for
repeat sampling at the time this paper was written. Once all
of the data has been analyzed, the following reporting is
planned:
• final report documenting methodologies used
• discussion of data quality and description of results
• set of digital maps showing concentrations of the mea-
sured analytes
• digital database of the analytical and quality-control
results
The project is expected to be complete in early 2017, at
which time a final report will be submitted to Geo-
science BC.
Acknowledgments
The authors thank Geoscience BC for project funding and
the Nazko Economic Development Corporation for their
in-kind and logistical support; L. Schlechtleitner and
C. Craig for their dedicated and valuable work on the de-
vices and in the field; J. Chapman and N. Vigouroux for re-
viewing a draft of this paper; and the University of Victoria
School of Earth and Ocean Sciences for their support in
loaning a micropipette.
References
Angen, J.J., Wesberg, E., Hart, C.J.R., Kim, R. and Rahami M.(2015): Preliminary geological map of the TREK projectarea, central British Columbia (parts of NTS 093B, C, Fand G); Geoscience BC, Report 2015-10, URL <http://www.geosciencebc.com/s/Report2015-10.asp> [November2016].
BC Geological Survey (2016): MINFILE BC mineral deposits da-tabase; BC Ministry of Energy and Mines, URL <http://minfile.ca> [November 2016].
Braungardt, C., Butterfield, M. and Wajrak M. (2010): On-sitemine water analysis: application note for the PDV6000plus;International Mine Water Association Conference, SydneyNova Scotia, Proceedings, p. 331–334.
Bordet, E, and Hart, J.R. (2016): Distribution and nature of theEocene Ootsa Lake Group in the Chilcotin Plateau, parts ofQuesnel and Anahim Lake map areas (NTS 093B and093C), central British Columbia; Geoscience BC, Report2016-12, URL <http:/ /www.geosciencebc.com/s/Report2016-12.asp> [November 2016].
Cassidy, J.F., Balfour, N., Hickson, C., Kao, H., White, R., Caplan-Auerbach, J., Mazzotti, S., Rogers, G.C., Al-Khoubbi, I.,Bird, A.L., Esteban, L., Kelman, M., Hutchinson, J. andMcCormack, D. (2011): The 2007 Nazko, British Columbia,earthquake sequence: injection of magma deep in the crustbeneath the Anahim volcanic belt; Bulletin of the Seismo-logical Society of America, v. 101, no. 4, p. 732–1741.
Environment Canada 2016: Historical data; Environment Canada,URL <http://climate.weather.gc.ca/historical_data/search_historic_data_e.html> [November 2016].
GeoBase®
(2016): Canadian digital elevation model; Natural Re-sources Canada, Geospatial Data Extraction, URL <http://www.geogratis.gc.ca/site/eng/extraction> [November2016].
Hall, G.E.M. (1998): Relative contamination levels observed indifferent types of bottles used to collect water samples; Ex-plore, no. 101, p. 1–7.
Jackaman, W., Sacco, D.A. and Lett, R.E. (2015): Regional geo-chemical and mineralogical data – TREK project year 2, In-terior Plateau, British Columbia (NTS 093B, C, F, G);Geoscience BC, Report 2015-12, 13 p. and appendices,URL <http://www.geosciencebc.com/s/Report2015-12.asp> [November 2016].
Kennedy, S. (2012): Rock geochemistry report, Hottie mineralclaims, NTS 93B 091; BC Ministry of Energy and Mines,Assessment Report 33 447, URL <http: / /ar is .empr.gov.bc.ca/search.asp?mode=repsum&rep_no=33447>[November 2016].
Khanna, P.P., Ahmad, T. and Islam R. (2009): Effect of acidifica-tion in water samples before and after filtration: a caution forhydro-geochemical studies; Current Science, v. 96, no. 7,p. 896–897.
Lett, R.E and Jackaman, W. (2015): Tracing the source of anoma-lous geochemical patterns in soil, water and seepage gasnear the Nazko volcanic cone, BC (NTS 93B/13);Geoscience BC, Report 2015-16, 75 p., URL <http://www.geosciencebc.com/s/Report2015-16.asp> [November2016].
Lewtas, P., Fujikawa Y., Hamasaki, T., Sugahara, M. and Yoneda,D. (2010): Field analysis of arsenic by voltammetry – practi-cal techniques for reduction of interferences; Arsenic inGeosphere and Human Diseases, Taylor & Francis Group,London, United Kingdom.
Leybourne, M.I. and Cameron, E.M. (2010): Groundwater in geo-chemical exploration; Geochemistry: Exploration, Environ-ment, Analysis, v. 10, p. 99–118.
Massey, N.W.D., MacIntyre, D.G., Desjardins, P.J. and Cooney,R.T. (2005): Digital geology map of British Columbia:whole province; BC Ministry of Energy and Mines, GeoFile2005-1, scale 1:250 000, URL <http://www.empr.gov.bc.ca/Mining/Geoscience/PublicationsCatalogue/GeoFiles/Pages/2005-1.aspx> November 2016].
Saha, D and Sahu, S. (2015): A decade of investigations ongroundwater arsenic contamination in Middle Ganga Plain,India; Environmental Geochemistry and Health, v. 38, no. 2,p. 315–337. doi:10.1007/s10653-015-9730-z
Geoscience BC Report 2017-1 139

Taufen, P.M. (1997): Ground waters and surface waters in explora-tion geochemical surveys; in Proceedings of Exploration 97:Fourth Decennial International Conference on Mineral Ex-ploration, p. 271–284.
Yehia, R., Vigouroux, N. and Hickson, C. (2013): Use of a portablephotometer for accelerated exploration: testing for geother-mal indicators in surface waters; GRC Transactions, v. 37,p. 375–381.
Yehia, R. and Heberlein, D.R. (2015): Use of a field portable pho-tometer for rapid geochemical analysis of stream and springwaters: a case history from Poison Mountain, British Co-lumbia (NTS 092O/02); Geoscience BC, Report 2015-17,URL <http://www.geosciencebc.com/s/2014-009.asp>[November 2016].
140 Geoscience BC Summary of Activities 2016