Embed Size (px)
Citation preview
Rapidity of the Change of the Kohlrausch Exponent of ther-Relaxation of Glass-FormingLiquids at TB or Tâ and Consequences
C. Leon and K. L. Ngai*NaVal Research Laboratory, Washington, D.C. 20375-5320
ReceiVed: September 17, 1998; In Final Form: December 2, 1998
Stickel, Fischer, and Richert [J. Chem. Phys.1996, 104, 2043] found the temperature dependence of theR-relaxation time,τR(T), of many small-molecule glass-forming liquids undergoes a change at a characteristictemperature,TB. On the lowering of temperature,τR(T) changes from one Vogel-Fulcher-Tammann (VFT)dependence, VFTh, that holds forT > TB to another VFT dependence, VFTl, or a non-VFT dependence,nVFTl, for T < TB. In glass-formers, which exhibit aâ-relaxation of the Johari-Goldstein type, extrapolationof the Arrhenius temperature dependence of its relaxation time,τâ(T), indicates that it tends to merge into theR-relaxation at a temperature,Tâ. Stickel et al. found also thatTB coincides withTâ. This work augmentsthese important findings by showing that, for fragile glass-formers, on decreasing temperature there is atTB
≈ Tâ a rapid steplike change of the Kohlrausch-Williams-Watts exponent, (1- n), of the primaryR-relaxationcorrelation function, exp[-(t/τR)1-n]. The size of the steplike change of different glass-formers decreasesproportionately with decreases in the value ofn(Tg) at the glass transition temperatureTg and in the differencebetween VFTh and VFTl or nVFTl, after these functions are extended to a common temperature range aboveand belowTB. These correlations are interpreted as due to the onset of significant increase of cooperativityat and belowTB ≈ Tâ as indicated by the rapidity of the increase ofn(T) in the framework of the couplingmodel. If one compares different glass-formers at the same value of the ratio,TB/T, the interpretationcorroborates the experimental fact that a larger steplike increase of (1- n) acrossTB gives rise to largerseparation between the logarithm of theR andâ relaxation times. The fact thatTâ nearly coincides withTB
is also explained. For (TB/T) > 1, the difference, log[τR(TB/T)] - log[τâ(TB/T)], remains small for strongglass-formers with smalln(Tg) and small step increase of (1- n) acrossTB. As a result, aâ-relaxation peakor shoulder cannot be resolved from theR-relaxation peak and observed as a wing on the high-frequencyside of theR-relaxation peak. This interpretation can further explain the origin of the success of the Dixon-Nagel scaling of the dielectric loss data of glass-formers.
1. Introduction
The glass transition phenomenon is widespread in materialsof diverse chemical compositions and physical structures andhas been a subject of research for many years.1,2 The ultimategoal of most researchers is to understand the molecular dynamicsand their changes over a broad temperature range in which thestructural relaxation time changes from the microscopic regimeof the order of picoseconds to macroscopic times of the orderof days. This lofty goal is hard to achieve because several factorshave a bearing on the glass transition phenomenon. Possiblefactors include the specific volume, configuration entropy,intermolecular constraints, and many-body interactions (coop-erativity). Moreover, these factors change with temperature andmake the treatment of the problem even more difficult. Mosttreatments cannot consider all the factors all at one time, and itis not difficult to understand that none of them can capture allthe features of the glass transition phenomenon. While acomplete theory of glass transition will not be available for sometime, a modest but worthwhile undertaking is to isolate onefactor such as cooperativity and use a viable theoretical approachthat can account for its effect to bring some predictions tocompare with experimental data. This approach cannot be acomplete theory of glass transition but, if successful, is the basison which to build one by incorporating other factors. Thecoupling model3,4 when applied to the molecular dynamics of
glass-forming materials is an example of such an approach thattries to account for the effects coming only from the many-body cooperative dynamics.
In this work the coupling model is brought to address theinteresting findings in a series of papers by Stickel et al.,5,6
Hansen et al.,7,8 and Richert and Angell9 that the temperaturedependence of theR-relaxation time,τR(T), of many smallmolecule glass-forming liquids undergoes a change at acharacteristic temperature,TB. On the lowering of temperature,τR(T) changes from one Vogel-Fulcher-Tammann (VFT)dependence, VFTh,
for T > TB to another VFT dependence, VFTl,
or a non-VFT dependence, nVFTl, that holds forT < TB. Inglass-formers, which exhibit aâ-relaxation of the Johari-Goldstein kind, extrapolation of the Arrhenius temperaturedependence of its relaxation time,τâ(T), indicates that it tendsto merge into theR-relaxation at a temperature,Tâ. Stickel etal. found also thatTB is nearly the same asTâ.5-9 In our presentwork we point out from dielectric data of fragile glass-formersthat on decreasing temperature atTB ≈ Tâ there is a rapid
log τR(T) ≡ VFTh(T) ) Ah + Bh/(T - T0h) (1)
log τR(T) ≡ VFTl(T) ) Al + Bl/(T - T0l) (2)
4045J. Phys. Chem. B1999,103,4045-4051
10.1021/jp983756h CCC: $18.00 © 1999 American Chemical SocietyPublished on Web 01/22/1999
steplike change of the stretch exponent, (1- n), of the primaryR-relaxation Kohlrausch-Williams-Watts (KWW)10,11 cor-relation function, exp[-(t/τR)1-n]. The size of the steplikeincrease ofn, proportional to the value ofn(Tg) at the glasstransition temperatureTg, turns out to correlate with thedifference between VFTh and VFTl or nVFTl, after thesefunctions are extended to a common temperature range aboveand belowTB. Strong glass-formers with smalln(Tg) show weakincrease ofn acrossTB and minor difference between VFTh
and VFTl. These experimental facts and the correlations betweenthem are interpreted to originate from onset of significantincrease of cooperativity atTB in the framework of the couplingmodel,3,4 where it is measured by the rapidity of the increaseof the coupling parametern.
Furthermore, on comparison of different glass-formers at thesame value of the ratio,TB/T, the interpretation corroboratesthe experimental fact that a larger steplike increase of (1- n)acrossTB gives rise to larger separation between the logarithmof the R andâ relaxation times. The difference, log[τR(TB/T)]- log[τâ(TB/T)], is small for strong glass-formers with smalln(Tg) and small step increase in (1- n) acrossTB. As a result,neither aâ-relaxation peak nor a shoulder can be resolved fromthe R-relaxation peak, and theâ-relaxation can at best beobserved as a wing on the high-frequency side of theR-relax-ation peak. This interpretation of the dielectric spectra isreinforced by a comparison with that of cyclooctanol. Thedielectric spectrum of cyclooctanol has a similar shape, butspecial circumstance enabled theâ-relaxation peak to beresolved and support our interpretation.
Finally, this interpretation of the dielectric relaxation spectraof glass-forming liquids which do not clearly exhibit aârelaxation peak or shoulder is further used to explain the originof the success of the Dixon-Nagel scaling12,13of the dielectricloss data of small molecules glass-formers, particularly thosehaving smallern(Tg) such as glycerol, propylene glycol, andcyclooctanol.
2. Rapidity of the Increase ofn acrossTB
Experimental data on the dielectric dispersion of the primaryR-relaxation are available and were presented in refs 5 and 6.There,w, the full widths at half-maximum of the dielectric losspeak normalized to that of an ideal Debye loss peak, were givenas a function of temperature for many glass-formers. Thedielectric dispersion of theR-relaxation of most glass formersare adequately fitted by the Fourier transform of the timederivative of the KWW correlation functions, exp[-(t/τR)1-n].An approximate relation betweenw andn in the KWW exponentgiven by Dixon13 has the form
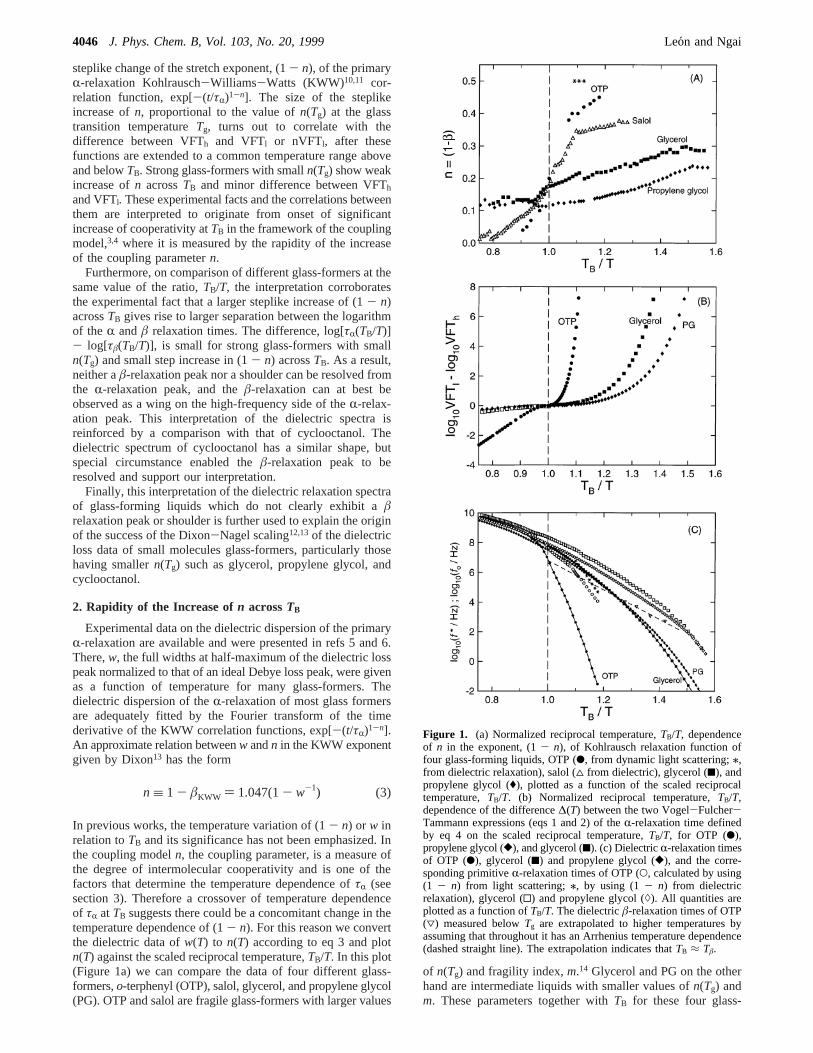
In previous works, the temperature variation of (1- n) or w inrelation toTB and its significance has not been emphasized. Inthe coupling modeln, the coupling parameter, is a measure ofthe degree of intermolecular cooperativity and is one of thefactors that determine the temperature dependence ofτR (seesection 3). Therefore a crossover of temperature dependenceof τR at TB suggests there could be a concomitant change in thetemperature dependence of (1- n). For this reason we convertthe dielectric data ofw(T) to n(T) according to eq 3 and plotn(T) against the scaled reciprocal temperature,TB/T. In this plot(Figure 1a) we can compare the data of four different glass-formers,o-terphenyl (OTP), salol, glycerol, and propylene glycol(PG). OTP and salol are fragile glass-formers with larger values
of n(Tg) and fragility index,m.14 Glycerol and PG on the otherhand are intermediate liquids with smaller values ofn(Tg) andm. These parameters together withTB for these four glass-
n ≡ 1 - âKWW ) 1.047(1- w-1) (3)
Figure 1. (a) Normalized reciprocal temperature,TB/T, dependenceof n in the exponent, (1- n), of Kohlrausch relaxation function offour glass-forming liquids, OTP (b, from dynamic light scattering;/,from dielectric relaxation), salol (4 from dielectric), glycerol (9), andpropylene glycol ((), plotted as a function of the scaled reciprocaltemperature,TB/T. (b) Normalized reciprocal temperature,TB/T,dependence of the difference∆(T) between the two Vogel-Fulcher-Tammann expressions (eqs 1 and 2) of theR-relaxation time definedby eq 4 on the scaled reciprocal temperature,TB/T, for OTP (b),propylene glycol ([), and glycerol (9). (c) DielectricR-relaxation timesof OTP (b), glycerol (9) and propylene glycol ([), and the corre-sponding primitiveR-relaxation times of OTP (O, calculated by using(1 - n) from light scattering;/, by using (1- n) from dielectricrelaxation), glycerol (0) and propylene glycol ()). All quantities areplotted as a function ofTB/T. The dielectricâ-relaxation times of OTP(3) measured belowTg are extrapolated to higher temperatures byassuming that throughout it has an Arrhenius temperature dependence(dashed straight line). The extrapolation indicates thatTB ≈ Tâ.
4046 J. Phys. Chem. B, Vol. 103, No. 20, 1999 Leon and Ngai
formers are shown in Table 1. OTP has low dielectric relaxationstrength, and its dispersion is more difficult to obtain. The widthsw of OTP obtained from some very recent dielectric relaxationdata15a at temperatures of 266, 262, and 258 K given ≈ 0.5.Higher temperature dielectric data of OTP are not available,and we use photon correlation spectroscopy and depolarizedlight scattering data15b to obtainn(T) of OTP. There are slightdifferences betweenn(T) from dielectric relaxation and lightscattering data. However, this difference does not alter the trend,which will be discussed next.
It can be seen by inspection of Figure 1a that, among thefour glass-formers, the most fragile OTP having the largestn(Tg)exhibits the most rapid rise ofn(T) acrossTB/T ) 1. A lesssteep rise ofn(T) acrossTB/T ) 1 is still visible in salol, whichranks second according ton(Tg) andm. The rise ofn(T) acrossTB/T ) 1 is weak for glycerol, and the rise disappears for PG.This systematic dependence of the variation ofn(T) acrossTB/T) 1 on n(Tg), on first sight, may not be too much a surprisebecausen(T) has to rise from nearly zero value at hightemperatures ton(Tg) in crossingTB. However this may not beso trivial because when plottingn(T) againstTB/T there is noguarantee that the rapidity of the rise ofn(T) acrossTB/T ) 1is still proportional ton(Tg). Next we show that the variationof n(T) acrossTB/T ) 1 is correlated with the difference∆(T)between the two Vogel-Fulcher-Tammann expressions (eqs1 and 2) defined by
after the two functions are extended to a common temperaturerange above and belowTB. ∆(T) quantifies the change fromVFTh(T) to VFTl(T) of the temperature dependence ofτR(T)acrossTB. Earlier Richert and Angell9 considered instead thescalar quantityκ ) Bl/Bh. In Figure 1b∆(T) is plotted againstTB/T for OTP, glycerol, and PG. Salol is not included becausebelowTB the temperature dependence of itsτR(T) does not obeythe VFT form. The scaled reciprocal temperature plot showsthat the variation of∆(T) is most rapid for OTP and decreaseswhen going to glycerol and PG. In a comparison of Figure 1awith Figure 1b, the variation of∆(T) with TB/T is clearlycorrelated with the variation ofn(T) with TB/T. The glass-formerhaving a largern(Tg) has a more rapid variation of bothquantities withTB/T. This correlation suggests that the changein slope ofτR(T) at TB may originate from the onset of a rapidchange inn(T). If n(T) is a measure of cooperativity, then therapidity of its change acrossTB is an indication of howsignificant is the increase of cooperativity at temperatures below
TB. Glass-formers such as OTP in which aâ-relaxation peakhas been resolved,TB is nearly the same as theR-â bifurcationtemperature, Tâ. Naturally, this coincidence ofTB with Tâ raisesthe possibility that the location as well as the dynamics of theâ-relaxation is controlled also by the variations ofn(T) or τR-(T) acrossTB. It was recently pointed out16 on both empiricaland theoretical grounds that strong glass-formers with smallvalues ofn(Tg) do not show aâ-relaxation peak or shoulder inthe dielectric relaxation spectrum.16 A specific question onâ-relaxation dynamics is whether the fact that aâ-relaxationpeak or shoulder has not been resolved in glycerol, PG, andother strong liquids16 has anything to do with the slow variationsof n(T) or τR(T) acrossTB and the small values ofn(Tg) foundin these nonfragile glass-formers? To meaningfully discuss theseissues and answer the questions, a theoretical framework isneeded. In the sections to follow the coupling model is employedfor this purpose.
3. Location of the Johari-Goldstein â-Relaxation
Before proceeding to give a theoretical interpretation of theexperimental facts summarized in Figures 1a-c and to answerthe questions they raise, it is necessary to give a brief summaryof the coupling model. In the coupling model (CM),3,4,16 thereexists a temperature-insensitive crossover timetc with amagnitude determined by the strength of the intermolecularinteraction. At times shorter thantc, the basic molecular unitsrelax independently of each other and exponentially (i.e., viathe primitiveR-relaxation mode) according to the normalizedcorrelation function
whereτ0 is the primitiveR-relaxation time. At times longer thantc, the intermolecular interactions (i.e. cooperativity) slow therelaxation and the averaged correlation function assumes theKohlrausch stretched exponential form
Continuity of φ(t) at tc leads to the relation
that relates the two times. Existence of a rather sharp crossovertime has been shown by simple Hamiltonian models that exhibitchaos.3,4 Experimental evidences for the existence of such acrossover at a timetc ≈ 2 ps come from quasi-elastic neutronscattering measurements in poly(vinyl chloride) (PVC),18 poly-(isoprene) (PI), and polybutadiene (PB)19 performed at temper-atures high aboveTg whereτR becomes short and of the orderof 10 ps or less. Under this condition, the primitiveR-relaxationdecaying linear exponentially dominates the time dependenceof φ(t) and is clearly evident from the relaxational part of theexperimental data. There are also evidences for the crossoverat tc ≈ 2 ps from analysis of molecular dynamics data of OTP,20
polyethylene,21,22and polystyrene23 and high-frequency dielec-tric measurement of a molten salt, CKN.24 When applied to theglass transition problem, the dependence of the primitiveR-relaxation time on temperatureτ0(T) is relegated to the otherfactors mentioned in the Introduction and not given. Althougheq 7 takes us fromτ0(T) to τR(T), taking care of the effect ofslowing down by cooperative many-body dynamics, yet thecoupling model at this stage is not a complete theory of glasstransition because the temperature dependence ofτ0(T) is notobtained in the model.
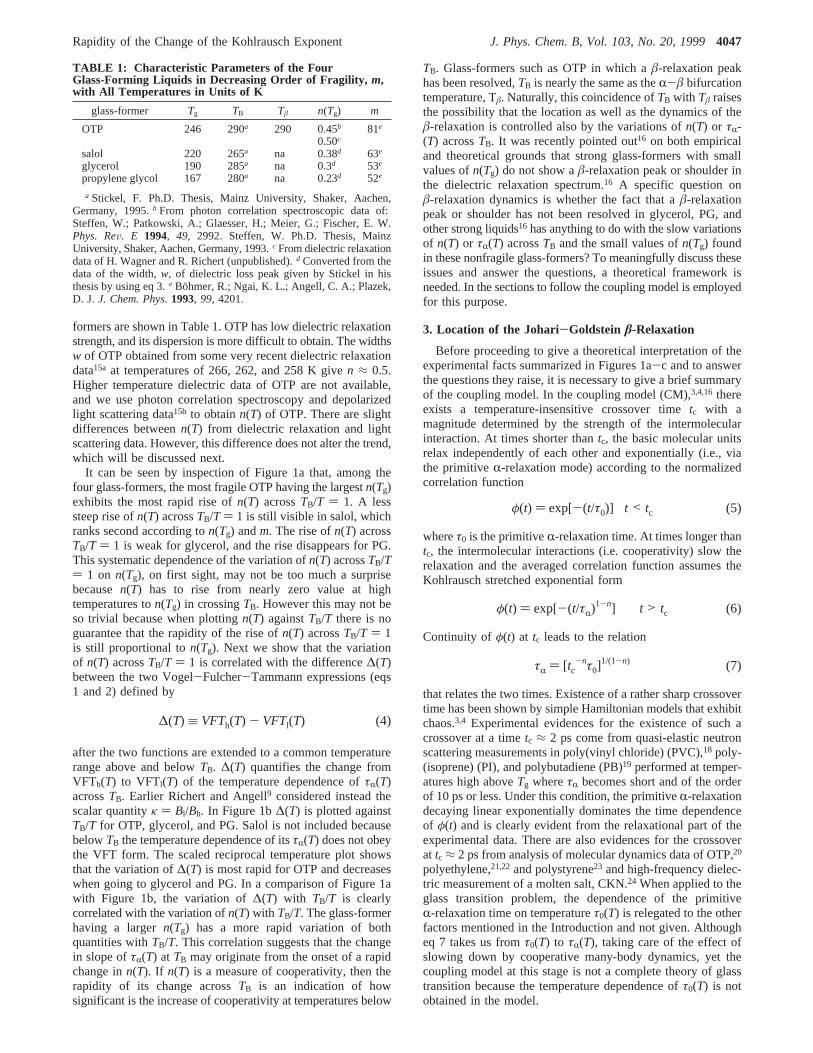
TABLE 1: Characteristic Parameters of the FourGlass-Forming Liquids in Decreasing Order of Fragility, m,with All Temperatures in Units of K
glass-former Tg TB Tâ n(Tg) m
OTP 246 290a 290 0.45b 81e
0.50c
salol 220 265a na 0.38d 63e
glycerol 190 285a na 0.3d 53e
propylene glycol 167 280a na 0.23d 52e
a Stickel, F. Ph.D. Thesis, Mainz University, Shaker, Aachen,Germany, 1995.b From photon correlation spectroscopic data of:Steffen, W.; Patkowski, A.; Glaesser, H.; Meier, G.; Fischer, E. W.Phys. ReV. E 1994, 49, 2992. Steffen, W. Ph.D. Thesis, MainzUniversity, Shaker, Aachen, Germany, 1993.c From dielectric relaxationdata of H. Wagner and R. Richert (unpublished).d Converted from thedata of the width,w, of dielectric loss peak given by Stickel in histhesis by using eq 3.e Bohmer, R.; Ngai, K. L.; Angell, C. A.; Plazek,D. J. J. Chem. Phys.1993, 99, 4201.
∆(T) ≡ VFTh(T) - VFTl(T) (4)
φ(t) ) exp[-(t/τ0)] t < tc (5)
φ(t) ) exp[-(t/τR)1-n] t > tc (6)
τR ) [tc-nτ0]
1/(1-n) (7)
Rapidity of the Change of the Kohlrausch Exponent J. Phys. Chem. B, Vol. 103, No. 20, 19994047
The â-relaxation having characteristics such as Arrheniustemperature dependence of its relaxation time has been con-sidered to be simple molecular motions that is not cooperativein nature.17,25-28 Thus, in this respect theâ-relaxation bears someresemblance to the primitiveR-relaxation. However, they cannotbe exactly the same otherwise the former like the latter will beslowed by intermolecular interactions to become the cooperativeR-relaxation observed at longer times. From this similarity it isexpected thatτâ(T) and τ0(T) may be comparable in order ofmagnitude. This expectation was also made by Angell in oneof his recent review of the dynamics of glass transition29 andhas recently been shown to be true for many glass-formers.16
To compare the experimental values ofτâ(T) in materials wherethe â-relaxation is found withτ0(T), the latter is calculated asa function of temperature from the experimental values ofτR-(T) and (1- n(T)) by solving the equation
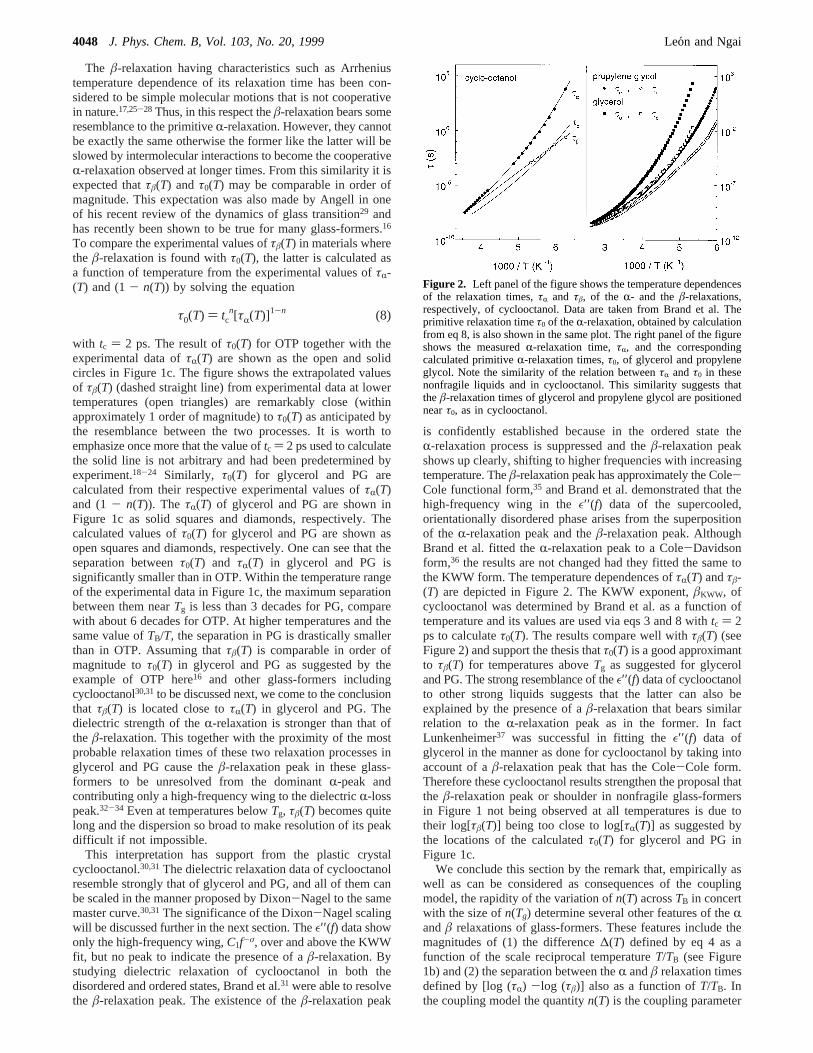
with tc ) 2 ps. The result ofτ0(T) for OTP together with theexperimental data ofτR(T) are shown as the open and solidcircles in Figure 1c. The figure shows the extrapolated valuesof τâ(T) (dashed straight line) from experimental data at lowertemperatures (open triangles) are remarkably close (withinapproximately 1 order of magnitude) toτ0(T) as anticipated bythe resemblance between the two processes. It is worth toemphasize once more that the value oftc ) 2 ps used to calculatethe solid line is not arbitrary and had been predetermined byexperiment.18-24 Similarly, τ0(T) for glycerol and PG arecalculated from their respective experimental values ofτR(T)and (1- n(T)). The τR(T) of glycerol and PG are shown inFigure 1c as solid squares and diamonds, respectively. Thecalculated values ofτ0(T) for glycerol and PG are shown asopen squares and diamonds, respectively. One can see that theseparation betweenτ0(T) and τR(T) in glycerol and PG issignificantly smaller than in OTP. Within the temperature rangeof the experimental data in Figure 1c, the maximum separationbetween them nearTg is less than 3 decades for PG, comparewith about 6 decades for OTP. At higher temperatures and thesame value ofTB/T, the separation in PG is drastically smallerthan in OTP. Assuming thatτâ(T) is comparable in order ofmagnitude toτ0(T) in glycerol and PG as suggested by theexample of OTP here16 and other glass-formers includingcyclooctanol30,31to be discussed next, we come to the conclusionthat τâ(T) is located close toτR(T) in glycerol and PG. Thedielectric strength of theR-relaxation is stronger than that ofthe â-relaxation. This together with the proximity of the mostprobable relaxation times of these two relaxation processes inglycerol and PG cause theâ-relaxation peak in these glass-formers to be unresolved from the dominantR-peak andcontributing only a high-frequency wing to the dielectricR-losspeak.32-34 Even at temperatures belowTg, τâ(T) becomes quitelong and the dispersion so broad to make resolution of its peakdifficult if not impossible.
This interpretation has support from the plastic crystalcyclooctanol.30,31The dielectric relaxation data of cyclooctanolresemble strongly that of glycerol and PG, and all of them canbe scaled in the manner proposed by Dixon-Nagel to the samemaster curve.30,31The significance of the Dixon-Nagel scalingwill be discussed further in the next section. Theε′′(f) data showonly the high-frequency wing,C1f-σ, over and above the KWWfit, but no peak to indicate the presence of aâ-relaxation. Bystudying dielectric relaxation of cyclooctanol in both thedisordered and ordered states, Brand et al.31 were able to resolvethe â-relaxation peak. The existence of theâ-relaxation peak
is confidently established because in the ordered state theR-relaxation process is suppressed and theâ-relaxation peakshows up clearly, shifting to higher frequencies with increasingtemperature. Theâ-relaxation peak has approximately the Cole-Cole functional form,35 and Brand et al. demonstrated that thehigh-frequency wing in theε′′(f) data of the supercooled,orientationally disordered phase arises from the superpositionof the R-relaxation peak and theâ-relaxation peak. AlthoughBrand et al. fitted theR-relaxation peak to a Cole-Davidsonform,36 the results are not changed had they fitted the same tothe KWW form. The temperature dependences ofτR(T) andτâ-(T) are depicted in Figure 2. The KWW exponent,âKWW, ofcyclooctanol was determined by Brand et al. as a function oftemperature and its values are used via eqs 3 and 8 withtc ) 2ps to calculateτ0(T). The results compare well withτâ(T) (seeFigure 2) and support the thesis thatτ0(T) is a good approximantto τâ(T) for temperatures aboveTg as suggested for glyceroland PG. The strong resemblance of theε′′(f) data of cyclooctanolto other strong liquids suggests that the latter can also beexplained by the presence of aâ-relaxation that bears similarrelation to theR-relaxation peak as in the former. In factLunkenheimer37 was successful in fitting theε′′(f) data ofglycerol in the manner as done for cyclooctanol by taking intoaccount of aâ-relaxation peak that has the Cole-Cole form.Therefore these cyclooctanol results strengthen the proposal thatthe â-relaxation peak or shoulder in nonfragile glass-formersin Figure 1 not being observed at all temperatures is due totheir log[τâ(T)] being too close to log[τR(T)] as suggested bythe locations of the calculatedτ0(T) for glycerol and PG inFigure 1c.
We conclude this section by the remark that, empirically aswell as can be considered as consequences of the couplingmodel, the rapidity of the variation ofn(T) acrossTB in concertwith the size ofn(Tg) determine several other features of theRandâ relaxations of glass-formers. These features include themagnitudes of (1) the difference∆(T) defined by eq 4 as afunction of the scale reciprocal temperatureT/TB (see Figure1b) and (2) the separation between theR andâ relaxation timesdefined by [log (τR) -log (τâ)] also as a function ofT/TB. Inthe coupling model the quantityn(T) is the coupling parameter
τ0(T) ) tcn[τR(T)]1-n (8)
Figure 2. Left panel of the figure shows the temperature dependencesof the relaxation times,τR and τâ, of the R- and theâ-relaxations,respectively, of cyclooctanol. Data are taken from Brand et al. Theprimitive relaxation timeτ0 of theR-relaxation, obtained by calculationfrom eq 8, is also shown in the same plot. The right panel of the figureshows the measuredR-relaxation time,τR, and the correspondingcalculated primitiveR-relaxation times,τ0, of glycerol and propyleneglycol. Note the similarity of the relation betweenτR andτ0 in thesenonfragile liquids and in cyclooctanol. This similarity suggests thattheâ-relaxation times of glycerol and propylene glycol are positionednearτ0, as in cyclooctanol.
4048 J. Phys. Chem. B, Vol. 103, No. 20, 1999 Leon and Ngai
which is a measure of the effects of intermolecular constraintsor the degree of cooperativity. Therefore in the framework ofthe coupling model the observed changes of properties ofrelaxation acrossTB are interpreted to be consequences of theonset of any significant increase of cooperativity atTB.
For all the glass-formers discussed in this work, there isinsignificant cooperativity (i.e., smalln(TB)) at TB, and hence,there are little differences between the cooperativeR-relaxationtime, the primitiveR-relaxation time, and the noncooperativeâ-relaxation time all atTB (see Figures 1c and 2). In other words,at T ) TB, [log[τR(TB)] - log[τâ(TB)] ≈ [log[τR(TB)] - log[τo-(TB)] ≈ 0, and thus the interpretation readily explains also whytheR-â bifurcation temperature,Tâ, coincides withTB, as foundexperimentally.5-9
4. Possible Origin of the Dixon-Nagel Scaling
Dielectric loss data of glass-forming liquids,ε′′(f), whenplotted as a function of frequency,f, are characterized by thepeak frequency,fp, the normalized widthw, and the relaxationstrength,∆ε ) ε0 - ε∞. Dixon et al.12,13 showed that a plot ofw-1 log(ε′′fp/∆εf) vsw-1(1 + w-1) log (f/fp) collapses dielectricrelaxation data from six different glass-formers includingglycerol and PG onto a single scaling plot valid over 13 decadesof frequency. The same scaling form has since been shown tohold for cyclooctanol30 and the electric loss modulus of ionicconductors.38 Up to now the success of the Dixon-Nagel scalinghas not been explained although it has been subjected to severalinterpretations and criticisms.39-41 In view of our currentproposed interpretation of the structure of the dielectric relax-ation spectrum and the relations between theR-relaxation, theprimitive R-relaxation, and theâ-relaxation in glass-formers, itis natural to test whether this picture can explain the Dixon-Nagel scaling or not.
The test is carried out by approximatingτâ(T) by τ0(T), whichwe have shown above to be valid, and simulating dielectricspectra using different values ofn andτR over a broad frequencyrange.τ0 can be calculated fromτR by eq 8 becausen has beenspecified. Later we shall investigate how sensitive the Dixon-Nagel scaling is to different choices of the ratioτâ(T)/τ0(T). Aswe have already mentioned in the above, the dielectric relaxationspectrum of some of these glass formers can be fitted by usingtwo superimposed relaxation functions. A KWW function or aCole-Davidson function is used to describe theR-relaxation,and an additional Cole-Cole function to account for theâ-relaxation, which is assumed to be always present althoughits peak cannot be resolved and only gives rise to the observedhigh-frequency wing. Therefore, the dielectric relaxation datacan be described by
and this is the expression we have used to simulate differentdielectric relaxation spectra. Equation 9 excludes the possiblepresence of a constant loss contribution to the dielectricresponse.42 If this additional term is considered in the fits toexperimental data, the parameters obtained for the Cole-Colefunction may vary, making theâ-relaxation contribution nar-rower. We shall not consider this term here because its presencedoes not modify the conclusions of this work, and it will besubject of a future publication. It has been also shown in someglass-formers that, instead of a Cole-Davidson function, aHavriliak-Negami function43 is needed to describe theR-re-laxation of some glass-forming liquids and polymers. In these
cases,ε′′ does not increase linearly with frequency at the low-frequency side of theR-relaxation peak and therefore theDixon-Nagel scaling fails.44,45 It has been proposed that theexistence of a dc conductivity or other relaxation processes canbe responsible of this apparent sublinear dependence ofε′′ atthe lower frequencies, and the Dixon-Nagel scaling of theR-relaxation is obeyed when these additional processes aresubtracted.46,47 We do not consider this possible aberration ofthe R-relaxation spectrum in this work.
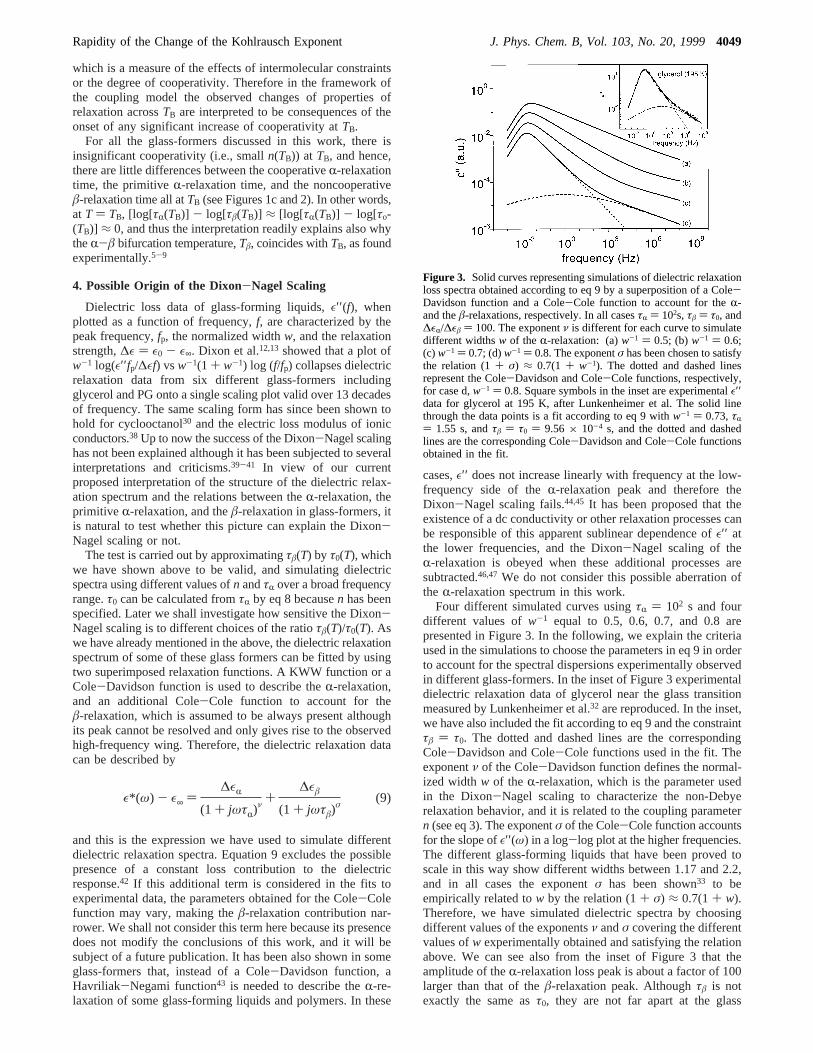
Four different simulated curves usingτR ) 102 s and fourdifferent values ofw-1 equal to 0.5, 0.6, 0.7, and 0.8 arepresented in Figure 3. In the following, we explain the criteriaused in the simulations to choose the parameters in eq 9 in orderto account for the spectral dispersions experimentally observedin different glass-formers. In the inset of Figure 3 experimentaldielectric relaxation data of glycerol near the glass transitionmeasured by Lunkenheimer et al.32 are reproduced. In the inset,we have also included the fit according to eq 9 and the constraintτâ ) τ0. The dotted and dashed lines are the correspondingCole-Davidson and Cole-Cole functions used in the fit. Theexponentν of the Cole-Davidson function defines the normal-ized widthw of the R-relaxation, which is the parameter usedin the Dixon-Nagel scaling to characterize the non-Debyerelaxation behavior, and it is related to the coupling parametern (see eq 3). The exponentσ of the Cole-Cole function accountsfor the slope ofε′′(ω) in a log-log plot at the higher frequencies.The different glass-forming liquids that have been proved toscale in this way show different widths between 1.17 and 2.2,and in all cases the exponentσ has been shown33 to beempirically related tow by the relation (1+ σ) ≈ 0.7(1+ w).Therefore, we have simulated dielectric spectra by choosingdifferent values of the exponentsν andσ covering the differentvalues ofw experimentally obtained and satisfying the relationabove. We can see also from the inset of Figure 3 that theamplitude of theR-relaxation loss peak is about a factor of 100larger than that of theâ-relaxation peak. Althoughτâ is notexactly the same asτ0, they are not far apart at the glass
ε*(ω) - ε∞ )∆εR
(1 + jωτR)ν+
∆εâ
(1 + jωτâ)σ
(9)
Figure 3. Solid curves representing simulations of dielectric relaxationloss spectra obtained according to eq 9 by a superposition of a Cole-Davidson function and a Cole-Cole function to account for theR-and theâ-relaxations, respectively. In all casesτR ) 102s,τâ ) τ0, and∆εR/∆εâ ) 100. The exponentν is different for each curve to simulatedifferent widthsw of the R-relaxation: (a)w-1 ) 0.5; (b)w-1 ) 0.6;(c) w-1 ) 0.7; (d)w-1 ) 0.8. The exponentσ has been chosen to satisfythe relation (1+ σ) ≈ 0.7(1 + w-1). The dotted and dashed linesrepresent the Cole-Davidson and Cole-Cole functions, respectively,for case d,w-1 ) 0.8. Square symbols in the inset are experimentalε′′data for glycerol at 195 K, after Lunkenheimer et al. The solid linethrough the data points is a fit according to eq 9 withw-1 ) 0.73,τR) 1.55 s, andτâ ) τ0 ) 9.56 × 10⁻⁴ s, and the dotted and dashedlines are the corresponding Cole-Davidson and Cole-Cole functionsobtained in the fit.
Rapidity of the Change of the Kohlrausch Exponent J. Phys. Chem. B, Vol. 103, No. 20, 19994049
transition temperature as it has been shown in all cases wherethe â-relaxation has been resolved. As we have seen from theexample of OTP in Figure 1c and cyclooctanol in Figure 3a,τâ(T) ≈ τ0(T) at temperatures higher thanTg, particularly in thevicinity of TB. Therefore the constraint [τâ(T)/τ0(T)] ) 1 togetherwith the choice∆εR/∆εâ ) 100 seems to be a reasonable insimulating the dielectric relaxation spectra of glass-formingliquids by using eq 9. Other choices of the two ratios have beenexamined and similar results have been obtained.
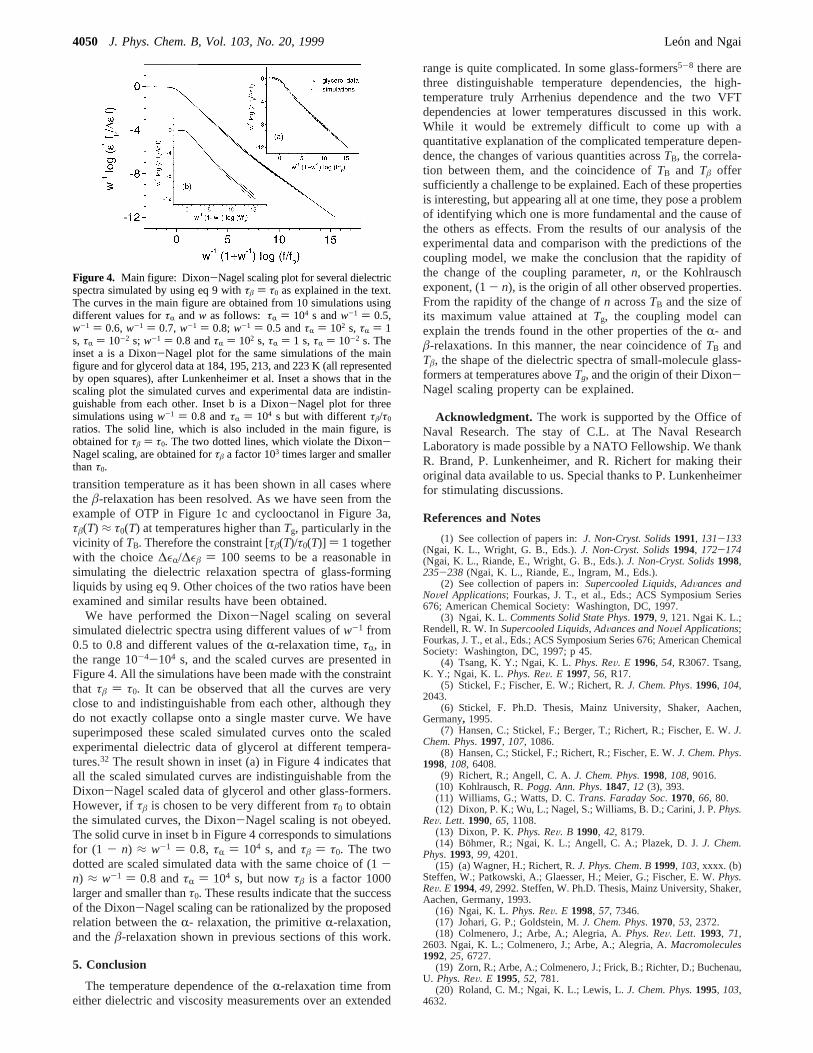
We have performed the Dixon-Nagel scaling on severalsimulated dielectric spectra using different values ofw-1 from0.5 to 0.8 and different values of theR-relaxation time,τR, inthe range 10-4-104 s, and the scaled curves are presented inFigure 4. All the simulations have been made with the constraintthat τâ ) τ0. It can be observed that all the curves are veryclose to and indistinguishable from each other, although theydo not exactly collapse onto a single master curve. We havesuperimposed these scaled simulated curves onto the scaledexperimental dielectric data of glycerol at different tempera-tures.32 The result shown in inset (a) in Figure 4 indicates thatall the scaled simulated curves are indistinguishable from theDixon-Nagel scaled data of glycerol and other glass-formers.However, ifτâ is chosen to be very different fromτ0 to obtainthe simulated curves, the Dixon-Nagel scaling is not obeyed.The solid curve in inset b in Figure 4 corresponds to simulationsfor (1 - n) ≈ w-1 ) 0.8, τR ) 104 s, andτâ ) τ0. The twodotted are scaled simulated data with the same choice of (1-n) ≈ w-1 ) 0.8 andτR ) 104 s, but nowτâ is a factor 1000larger and smaller thanτ0. These results indicate that the successof the Dixon-Nagel scaling can be rationalized by the proposedrelation between theR- relaxation, the primitiveR-relaxation,and theâ-relaxation shown in previous sections of this work.
5. Conclusion
The temperature dependence of theR-relaxation time fromeither dielectric and viscosity measurements over an extended
range is quite complicated. In some glass-formers5-8 there arethree distinguishable temperature dependencies, the high-temperature truly Arrhenius dependence and the two VFTdependencies at lower temperatures discussed in this work.While it would be extremely difficult to come up with aquantitative explanation of the complicated temperature depen-dence, the changes of various quantities acrossTB, the correla-tion between them, and the coincidence ofTB and Tâ offersufficiently a challenge to be explained. Each of these propertiesis interesting, but appearing all at one time, they pose a problemof identifying which one is more fundamental and the cause ofthe others as effects. From the results of our analysis of theexperimental data and comparison with the predictions of thecoupling model, we make the conclusion that the rapidity ofthe change of the coupling parameter,n, or the Kohlrauschexponent, (1- n), is the origin of all other observed properties.From the rapidity of the change ofn acrossTB and the size ofits maximum value attained atTg, the coupling model canexplain the trends found in the other properties of theR- andâ-relaxations. In this manner, the near coincidence ofTB andTâ, the shape of the dielectric spectra of small-molecule glass-formers at temperatures aboveTg, and the origin of their Dixon-Nagel scaling property can be explained.
Acknowledgment. The work is supported by the Office ofNaval Research. The stay of C.L. at The Naval ResearchLaboratory is made possible by a NATO Fellowship. We thankR. Brand, P. Lunkenheimer, and R. Richert for making theiroriginal data available to us. Special thanks to P. Lunkenheimerfor stimulating discussions.
References and Notes
(1) See collection of papers in:J. Non-Cryst. Solids1991, 131-133(Ngai, K. L., Wright, G. B., Eds.).J. Non-Cryst. Solids1994, 172-174(Ngai, K. L., Riande, E., Wright, G. B., Eds.).J. Non-Cryst. Solids1998,235-238 (Ngai, K. L., Riande, E., Ingram, M., Eds.).
(2) See collection of papers in:Supercooled Liquids, AdVances andNoVel Applications; Fourkas, J. T., et al., Eds.; ACS Symposium Series676; American Chemical Society: Washington, DC, 1997.
(3) Ngai, K. L.Comments Solid State Phys. 1979, 9, 121. Ngai K. L.;Rendell, R. W. InSupercooled Liquids, AdVances and NoVel Applications;Fourkas, J. T., et al., Eds.; ACS Symposium Series 676; American ChemicalSociety: Washington, DC, 1997; p 45.
(4) Tsang, K. Y.; Ngai, K. L.Phys. ReV. E 1996, 54, R3067. Tsang,K. Y.; Ngai, K. L. Phys. ReV. E 1997, 56, R17.
(5) Stickel, F.; Fischer, E. W.; Richert, R.J. Chem. Phys. 1996, 104,2043.
(6) Stickel, F. Ph.D. Thesis, Mainz University, Shaker, Aachen,Germany, 1995.
(7) Hansen, C.; Stickel, F.; Berger, T.; Richert, R.; Fischer, E. W.J.Chem. Phys. 1997, 107, 1086.
(8) Hansen, C.; Stickel, F.; Richert, R.; Fischer, E. W.J. Chem. Phys.1998, 108, 6408.
(9) Richert, R.; Angell, C. A.J. Chem. Phys. 1998, 108, 9016.(10) Kohlrausch, R.Pogg. Ann. Phys. 1847, 12 (3), 393.(11) Williams, G.; Watts, D. C.Trans. Faraday Soc. 1970, 66, 80.(12) Dixon, P. K.; Wu, L.; Nagel, S.; Williams, B. D.; Carini, J. P.Phys.
ReV. Lett. 1990, 65, 1108.(13) Dixon, P. K.Phys. ReV. B 1990, 42, 8179.(14) Bohmer, R.; Ngai, K. L.; Angell, C. A.; Plazek, D. J.J. Chem.
Phys. 1993, 99, 4201.(15) (a) Wagner, H.; Richert, R.J. Phys. Chem. B 1999, 103, xxxx. (b)
Steffen, W.; Patkowski, A.; Glaesser, H.; Meier, G.; Fischer, E. W.Phys.ReV. E 1994, 49, 2992. Steffen, W. Ph.D. Thesis, Mainz University, Shaker,Aachen, Germany, 1993.
(16) Ngai, K. L.Phys. ReV. E 1998, 57, 7346.(17) Johari, G. P.; Goldstein, M.J. Chem. Phys. 1970, 53, 2372.(18) Colmenero, J.; Arbe, A.; Alegria, A.Phys. ReV. Lett. 1993, 71,
2603. Ngai, K. L.; Colmenero, J.; Arbe, A.; Alegria, A.Macromolecules1992, 25, 6727.
(19) Zorn, R.; Arbe, A.; Colmenero, J.; Frick, B.; Richter, D.; Buchenau,U. Phys. ReV. E 1995, 52, 781.
(20) Roland, C. M.; Ngai, K. L.; Lewis, L.J. Chem. Phys.1995, 103,4632.
Figure 4. Main figure: Dixon-Nagel scaling plot for several dielectricspectra simulated by using eq 9 withτâ ) τ0 as explained in the text.The curves in the main figure are obtained from 10 simulations usingdifferent values forτR andw as follows: τR ) 104 s andw-1 ) 0.5,w-1 ) 0.6, w-1 ) 0.7, w-1 ) 0.8; w-1 ) 0.5 andτR ) 102 s, τR ) 1s, τR ) 10-2 s; w-1 ) 0.8 andτR ) 102 s, τR ) 1 s,τR ) 10-2 s. Theinset a is a Dixon-Nagel plot for the same simulations of the mainfigure and for glycerol data at 184, 195, 213, and 223 K (all representedby open squares), after Lunkenheimer et al. Inset a shows that in thescaling plot the simulated curves and experimental data are indistin-guishable from each other. Inset b is a Dixon-Nagel plot for threesimulations usingw-1 ) 0.8 andτR ) 104 s but with differentτâ/τ0
ratios. The solid line, which is also included in the main figure, isobtained forτâ ) τ0. The two dotted lines, which violate the Dixon-Nagel scaling, are obtained forτâ a factor 103 times larger and smallerthanτ0.
4050 J. Phys. Chem. B, Vol. 103, No. 20, 1999 Leon and Ngai
(21) Roe, R.-J.J. Chem. Phys. 1994, 100, 1610. Ngai, K. L.J. Chem.Phys. 1993, 98, 7588.
(22) Smith, G. D.; Paul, W.; Yoon, D. Y.; Zirkel, A.; Hendricks, J.;Richter, D.J. Chem. Phys., in press.
(23) Roe, R.-J.J. Non-Cryst. Solids1998, 235-238, in press.(24) Ngai, K. L.; Cramer, C.; Saatkamp, T.; Funke, K. InNon-
Equilibrium Phenomena in Supercooled Fluids, Glasses and AmorphousMaterials; Giordano, M., Leporini, D., Tosi, M. P., Eds.; World Scientific:Singapore, 1996; p 3.
(25) Garwe, F.; Beiner, M.; Hempel, E.; Schawe, J.; Schro¨ter, K.;Schonhals, A.; Donth, E.J. Non-Cryst. Solids1994, 172-174, 191.
(26) Perez, J.; Cavaille, J. Y.; Etienne, S.; Fouquet, F.; Guyot, F.Ann.Phys., Fr. 1983,8, 417.
(27) Fujimori, H.; Oguni, M.Solid State Commun. 1995, 94, 157.(28) Kudlik, A.; Tschirwitz, S.; Benkhof, S.; Blochhowicz, T.; Roessler,
E. Europhys. Lett. 1997, 40, 649.(29) Angell, C. A. In ref 2, p 14.(30) Leslie-Pelecky, D. L.; Birge, N. O.Phys. ReV. Lett. 1994, 72, 1232.(31) Brand, R.; Lunkenheimer, P.; Loidl, A.Phys. ReV. B 1997, 56,
R5713.(32) Lunkenheimer, P.; Pimenov, A.; Dressel, M.; Goncharov, Yu G.;
Bohmer, R.; Loidl, A.Phys. ReV. Lett. 1996, 77, 318.(33) Leheny, R. L.; Nagel, S. R.Europhys. Lett.1997, 39, 447.
(34) Leheny, R. L.; Nagel, S. R.J. Non-Cryst. Solids1998, 235-238,in press.
(35) Cole, K. S.; Cole, R. H.J. Chem. Phys. 1941, 9, 341.(36) Davidson, D. W.; Cole, R. H.J. Chem. Phys. 1951, 19, 1485.(37) Lunkenheimer, P.; Ngai, K. L., Unpublished data.(38) Leon, C.; Lucia, M. L.; Santamaria, J.; Sanchez-Quesada, F.Phys.
ReV. B 1998, 57, 41.(39) Kudlik, A.; Benkhof, S.; Lenk, R.; Rossler, E.Europhys. Lett.1995,
32, 511.(40) Dendzik, Z.; Paluch, M.; Gburski, Z.; Ziolo, J.J. Phys. Condens.
Mater. 1997, 9, L339.(41) Chamberlin, R. V.J. Non-Cryst. Solids1997, 215, 293.(42) Ngai, K. L.; Moynihan, C. T.Bull. Mater. Res. Soc. 1998, 23, No.
11, 51.(43) Havriliak, S.; Negami, S.Polymer1967, 8, 161.(44) Scho¨nhals, A.; Kremer, F.; Schlosser, E.Phys. ReV. Lett. 1991, 61
(8), 999.(45) Kudlik, A.; Benkhof, S.; Lenk, R.; Rossler, E.Europhys. Lett. 1995,
32, 511.(46) Menon, N.; Nagel, S. R.Phys. ReV. Lett. 1993, 71 (24), 4095.(47) Scho¨nhals, A.; Kremer, F.; Stickel, F.Phys. ReV. Lett. 1993, 71,
4096.
Rapidity of the Change of the Kohlrausch Exponent J. Phys. Chem. B, Vol. 103, No. 20, 19994051