Embed Size (px)
DESCRIPTION
test
Citation preview
Bifactor and Item Response Theory Analyses of InterviewerReport Scales of Cognitive Impairment in Schizophrenia
Steven P. Reise1, Joseph Ventura, Ph.D.2, Richard S. E. Keefe, Ph.D.3, Lyle E. Baade, Ph.D.4, James M. Gold, Ph.D.5, Michael F. Green, Ph.D.2,6, Robert S. Kern, Ph.D.2,6, RaquelleMesholam-Gately, Ph.D.7, Keith H. Nuechterlein, Ph.D.2,1, Larry J. Seidman, Ph.D.7, andRobert Bilder, Ph.D.2,1
1UCLA Department of Psychology 2Semel Institute for Neuroscience & Human Behavior, GeffenSchool of Medicine at UCLA 3Department of Psychiatry and Behavioral Sciences, DukeUniversity, Durham, North Carolina 4University of Kansas School of Medicine at Wichita, Kansas5Maryland Psychiatric Research Center, University of Maryland School of Medicine, Baltimore,Maryland 6VA Greater Los Angeles Healthcare System, Los Angeles, California 7MassachusettsMental Health Center, Public Psychiatry Division of the Beth Israel Deaconess Medical CenterDepartment of Psychiatry, Harvard Medical School, Boston, Massachusetts
AbstractWe conducted psychometric analyses of two interview-based measures of cognitive deficits: the21-item Clinical Global Impression of Cognition in Schizophrenia (CGI-CogS; Ventura et al.,2008), and the 20-item Schizophrenia Cognition Rating Scale (SCoRS; Keefe et al., 2006), whichwere administered on two occasions to a sample of people with schizophrenia. Traditionalpsychometrics, bifactor analysis, and item response theory (IRT) methods were used to exploreitem functioning, dimensionality, and to compare instruments. Despite containing similar itemcontent, responses to the CGI-CogS demonstrated superior psychometric properties (e.g., higheritem-intercorrelations, better spread of ratings across response categories), relative to the SCoRS.We argue that these differences arise mainly from the differential use of prompts and how theitems are phrased and scored. Bifactor analysis demonstrated that although both measures capturea broad range of cognitive functioning (e.g., working memory, social cognition), the commonvariance on each is overwhelmingly explained by a single general factor. IRT analyses of thecombined pool of 41 items showed that measurement precision is peaked in the mild to moderaterange of cognitive impairment. Finally, simulated adaptive testing revealed that only about 10 to12 items are necessary to achieve latent trait level estimates with reasonably small standard errorsfor most individuals. This suggests that these interview-based measures of cognitive deficits couldbe shortened without loss of measurement precision.
Keywordsitem response theory; CGI-CogS; SCoRS; schizophrenia and cognitive deficits; computerizedadaptive testing
Correspondence concerning this article should be addressed to Steven P. Reise, Department of Psychology, UCLA, Los Angeles, CA90095, [email protected]'s Disclaimer: The following manuscript is the final accepted manuscript. It has not been subjected to the final copyediting,fact-checking, and proofreading required for formal publication. It is not the definitive, publisher-authenticated version. The AmericanPsychological Association and its Council of Editors disclaim any responsibility or liabilities for errors or omissions of this manuscriptversion, any version derived from this manuscript by NIH, or other third parties. The published version is available atwww.apa.org/pubs/journals/PAS
NIH Public AccessAuthor ManuscriptPsychol Assess. Author manuscript; available in PMC 2012 March 1.
Published in final edited form as:Psychol Assess. 2011 March ; 23(1): 245–261. doi:10.1037/a0021501.
NIH
-PA Author Manuscript
NIH
-PA Author Manuscript
NIH
-PA Author Manuscript
Cognitive deficits associated with schizophrenia are seen by academia and industry as apotential indication for new drug treatment development (Green, 2007; Green andNuechterlein, 2004; Hyman and Fenton, 2003). New instrumentation is needed to evaluatepossible efficacy of new treatments, particularly to obtain “co-primary” endpoint data thatcan complement objective cognitive test results. Moreover, patient reported outcomes(PROs) are increasingly important in clinical trials research, and the Food and DrugAdministration (FDA) has identified a development cycle for such instruments thatencourages the adoption of strong psychometric methods (U.S. Department of Health andHuman Services, FDA, February, 2006). In this study, we conduct psychometric analyses oftwo semi-structured interview-based measures of cognitive deficits in schizophrenia.Specifically, we analyze the 21-item CGI-CogS (Ventura et al., 2008), and the 20-itemSCoRS (Keefe et al., 2006). These measures were selected for analyses and possiblecombining because: a) they were the only two interview-based measures specificallydesigned as co-primary measures to assess cognitive deficits in schizophrenia, b) containsimilar item content, and c) each ostensibly attempts to measure the same construct.
The overarching goals of the present analyses are as follows. Our first objective is tocompare the two instruments on a number of criteria, such as average inter-item correlation,dimensionality, coherence of factor structure, degree of saturation by a general factor, andfloor or ceiling effects at the item level. As described below, the item content of bothmeasures covers a broad range of cognitive domains (e.g., working memory, visual learning,problem solving) thought to be important in properly assessing cognition. We will use bothbifactor (see, Schmid & Leiman, 1957; Chen, West, & Sousa, 2006; Reise, Morizot, &Hays, 2007; Immekus & Imbrie, 2008) and more commonly used exploratory factor analytictechniques (e.g., principal axis extraction, oblimin rotation) to investigate the extent towhich item responses on each instrument are saturated by a general factor, and to whatdegree meaningful multidimensionality can be identified. The dimensionality issue iscritical, given recent initiatives to assess and track change on separate dimensions ofcognitive functioning.
If the item responses to each measure are dominated by a single general factor, we will thenfit a unidimensional item response theory (IRT; Embretson & Reise, 2000) model to theresponses from the combined measures. The objectives of fitting the IRT model are twofold.First, we want to systematically explore how category ratings are related to a common latentvariable and where on the latent trait continuum each item provides the most discriminationamong individuals. A second objective is to use IRT modeling to explore how many itemsare needed for precise measurement of cognitive deficits. This latter issue is also criticalgiven the enormous time and expense of clinical interviewer-based measures and the needfor short measures that yield reasonably precise scores in clinical trial, intervention, anddevelopmental research.
MethodsThe MATRICS Project
The data for the present study are drawn from the MATRICS (measurement and treatmentresearch to improve cognition in schizophrenia) Psychometric and Standardization Study(PASS) led by Co-Chairs of the Neurocognition Committee (Drs. Nuechterlein and Green).The multi-site MATRICS project was funded by the National Institute of Mental Health(NIMH) and involved extensive interactions among academic, NIMH, FDA, andpharmaceutical industry representatives (Nuechterlein et al., 2008; Green and Nuechterlein,2004; Green et al., 2008). The overarching goal of MATRICS – PASS was to develop andevaluate a battery of cognitive tests that could serve to stimulate the development and
Reise et al. Page 2
Psychol Assess. Author manuscript; available in PMC 2012 March 1.
NIH
-PA Author Manuscript
NIH
-PA Author Manuscript
NIH
-PA Author Manuscript
evaluation of new drugs to improve cognition in schizophrenia. To accomplish thisobjective, MATRICS PASS researchers sought to identify a set of measures with goodpsychometric properties and would be repeatable in clinical trial contexts (i.e., a set of"consensus cognitive performance measures").
One of the chief goals underlying the MATRICS – PASS project was the FDArecommendation that for any new pharmaceutical agents seeking approval as cognitiveenhancers, improvements on objective cognitive batteries would be necessary, but notsufficient. According to FDA officials, additional evidence also is needed to corroborate thatobjectively measured change is, in fact, clinically meaningful and relevant to “real world”social, educational, and occupational functioning (Green et al., 2008). As a result, additional“co-primary” measures (e.g., SCoRS, CGI-CogS) would need to be included along withobjective test results in clinical trials of cognition enhancing medications that were seekingFDA approval.
ParticipantsThe sample of participants for the MATRICS – PASS project was selected to berepresentative of stable patients with schizophrenia or schizoaffective disorder and whowould be typical of patients who participate in clinical trial research. The participants can bedescribed as a sample of chronic outpatients with reasonable levels of adult daily livingskills. Although the sample is limited in terms of individuals with severe levels of cognitiveimpairment (see results below), many individuals are included who are quite limited interms of educational and occupational functioning.
Specifically, participants were selected according to the following criteria: diagnosis ofschizophrenia or schizoaffective disorder, depressed type, based on diagnostic interview; nomedication changes in previous month and none expected for the following month; stableoutpatient or rehabilitation center status; age 18–65 years; no substance dependence in past 6months; no substance abuse in past month; no clinically significant neurological disease orhead injury as determined by medical history; ability to understand spoken Englishsufficiently to complete testing procedures; and ability to comprehend the consent formappropriately. We also excluded individuals who did not meet the substance use ordependence exclusion criteria but who had a clearly excessive amount of lifetime alcohol ordrug consumption over a 10-year period or had been using alcohol or drugs heavily in the 3days prior to testing (Nuechterlein et al., 2008).
In MATRICS – PASS, data were collected on two occasions four weeks apart betweenJanuary 2004 and August 2005. At baseline, the number of participants was 176. At one-month follow-up, nine individuals were lost. Combining baseline and follow-up data, thetotal number of possible data points for analyses was 343.1 However, not all individualswere able to complete both the CGI-CogS and SCoRS at follow-up. Analyses in this paperthus are based on sample sizes that vary somewhat across analyses. Specifically, the numberof data points for within scale descriptive statistics and factor analyses are 319 for CGI-Cogsand 323 for SCoRS. The subsequent item response theory and simulated computerizedadaptive testing analyses are based on 315 data points that had no missing data on eitherinstrument. The raw aggregated scores derived from the CGI-CogS and SCoRS had 4-weektest-retest reliability estimates of 0.80 and 0.82, respectively.
1Our data consists of the same people measured twice and thus the present item response data are obviously not independent acrosstime. Although problems with conducting null hypotheses tests in the presence of violation of independence are well recognized (i.e.,standard errors are too low), violating independence has zero biasing effect on the parameter estimates. Thus, factor loadings and itemresponse theory model discrimination parameters are valid estimates.
Reise et al. Page 3
Psychol Assess. Author manuscript; available in PMC 2012 March 1.
NIH
-PA Author Manuscript
NIH
-PA Author Manuscript
NIH
-PA Author Manuscript
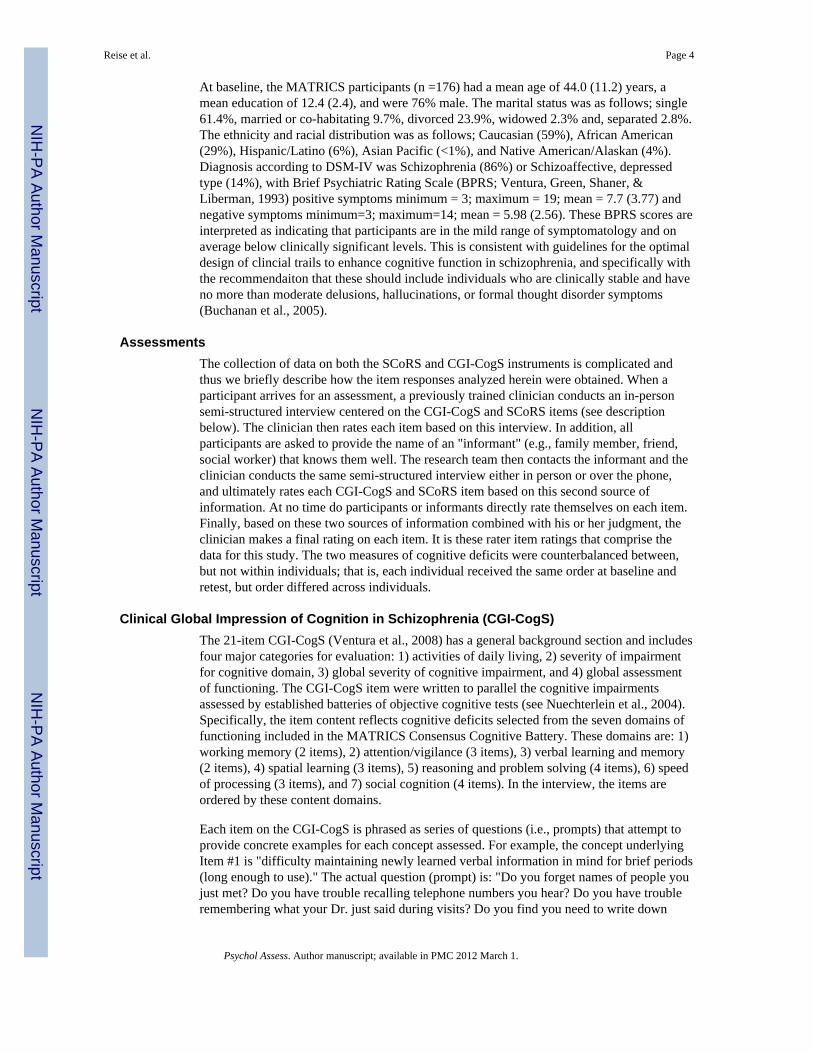
At baseline, the MATRICS participants (n =176) had a mean age of 44.0 (11.2) years, amean education of 12.4 (2.4), and were 76% male. The marital status was as follows; single61.4%, married or co-habitating 9.7%, divorced 23.9%, widowed 2.3% and, separated 2.8%.The ethnicity and racial distribution was as follows; Caucasian (59%), African American(29%), Hispanic/Latino (6%), Asian Pacific (<1%), and Native American/Alaskan (4%).Diagnosis according to DSM-IV was Schizophrenia (86%) or Schizoaffective, depressedtype (14%), with Brief Psychiatric Rating Scale (BPRS; Ventura, Green, Shaner, &Liberman, 1993) positive symptoms minimum = 3; maximum = 19; mean = 7.7 (3.77) andnegative symptoms minimum=3; maximum=14; mean = 5.98 (2.56). These BPRS scores areinterpreted as indicating that participants are in the mild range of symptomatology and onaverage below clinically significant levels. This is consistent with guidelines for the optimaldesign of clincial trails to enhance cognitive function in schizophrenia, and specifically withthe recommendaiton that these should include individuals who are clinically stable and haveno more than moderate delusions, hallucinations, or formal thought disorder symptoms(Buchanan et al., 2005).
AssessmentsThe collection of data on both the SCoRS and CGI-CogS instruments is complicated andthus we briefly describe how the item responses analyzed herein were obtained. When aparticipant arrives for an assessment, a previously trained clinician conducts an in-personsemi-structured interview centered on the CGI-CogS and SCoRS items (see descriptionbelow). The clinician then rates each item based on this interview. In addition, allparticipants are asked to provide the name of an "informant" (e.g., family member, friend,social worker) that knows them well. The research team then contacts the informant and theclinician conducts the same semi-structured interview either in person or over the phone,and ultimately rates each CGI-CogS and SCoRS item based on this second source ofinformation. At no time do participants or informants directly rate themselves on each item.Finally, based on these two sources of information combined with his or her judgment, theclinician makes a final rating on each item. It is these rater item ratings that comprise thedata for this study. The two measures of cognitive deficits were counterbalanced between,but not within individuals; that is, each individual received the same order at baseline andretest, but order differed across individuals.
Clinical Global Impression of Cognition in Schizophrenia (CGI-CogS)The 21-item CGI-CogS (Ventura et al., 2008) has a general background section and includesfour major categories for evaluation: 1) activities of daily living, 2) severity of impairmentfor cognitive domain, 3) global severity of cognitive impairment, and 4) global assessmentof functioning. The CGI-CogS item were written to parallel the cognitive impairmentsassessed by established batteries of objective cognitive tests (see Nuechterlein et al., 2004).Specifically, the item content reflects cognitive deficits selected from the seven domains offunctioning included in the MATRICS Consensus Cognitive Battery. These domains are: 1)working memory (2 items), 2) attention/vigilance (3 items), 3) verbal learning and memory(2 items), 4) spatial learning (3 items), 5) reasoning and problem solving (4 items), 6) speedof processing (3 items), and 7) social cognition (4 items). In the interview, the items areordered by these content domains.
Each item on the CGI-CogS is phrased as series of questions (i.e., prompts) that attempt toprovide concrete examples for each concept assessed. For example, the concept underlyingItem #1 is "difficulty maintaining newly learned verbal information in mind for brief periods(long enough to use)." The actual question (prompt) is: "Do you forget names of people youjust met? Do you have trouble recalling telephone numbers you hear? Do you have troubleremembering what your Dr. just said during visits? Do you find you need to write down
Reise et al. Page 4
Psychol Assess. Author manuscript; available in PMC 2012 March 1.
NIH
-PA Author Manuscript
NIH
-PA Author Manuscript
NIH
-PA Author Manuscript

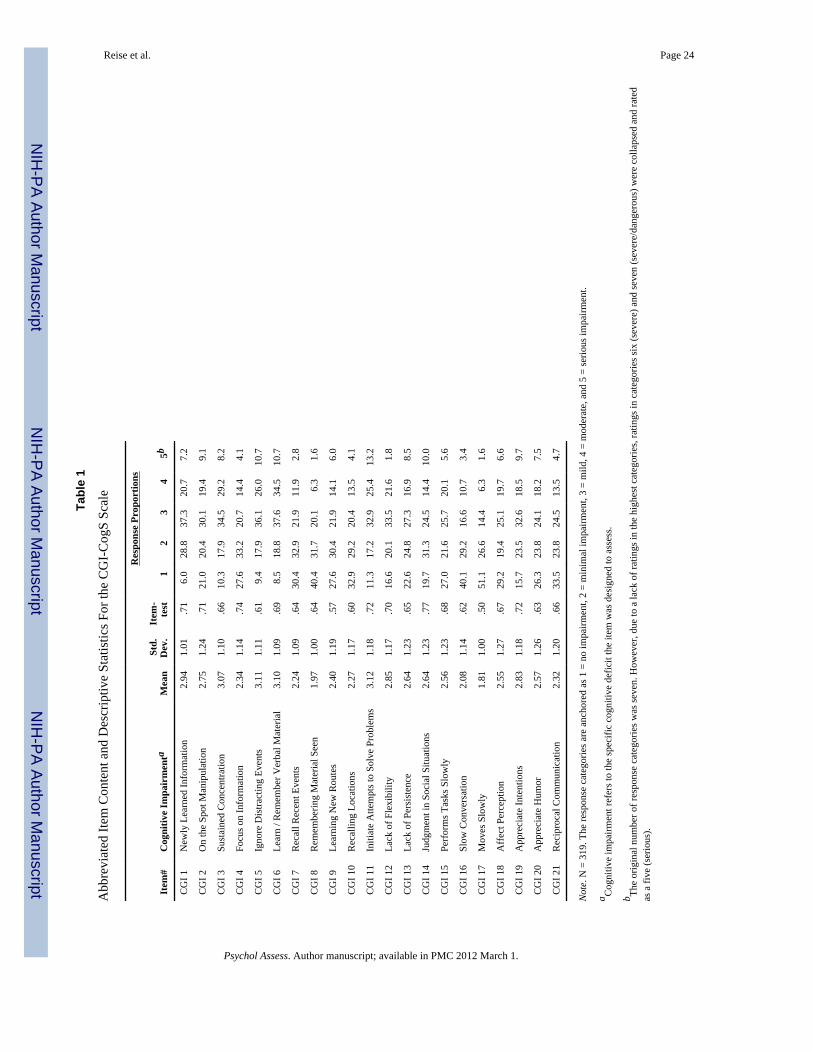
information to remember?" As the participant or informant responds and describes theirfunctioning in these areas in the last month, the rater both makes a numeric rating, andwrites down specific concrete examples. The CGI-CogS uses a 7-point Likert scale for itsratings: 1) not at all impaired, 2) minimal, cognitive deficits but functioning is generallyeffective, 3) mild, cognitive deficits with some consistent effect on functioning, 4) moderate,cognitive deficits with clear effects on functioning, 5) serious, cognitive deficits whichinterfere with day-today functioning, 6) severe, cognitive deficits that jeopardizeindependent living, and 7) cognitive deficits are so severe as to present a danger to self andothers. Items can also be scored N/A for not applicable or insufficient information. Thecognitive deficit assessed by each is displayed in Table 1 and the content domain for eachitem is shown in Table 3.
Schizophrenia Cognition Rating Scale (SCoRS)—The SCoRS (Keefe et al., 2006) isa 20-item interview-based measure of cognitive deficits and the degree to which they affectday-to-day functioning. The items were developed by a team of content experts to assess avariety of cognitive domains (i.e., memory, attention, problem solving, working memory,learning, speed of processing, and social cognition) that were chosen because of theirseverity of impairment in many patients with schizophrenia and the empirically establishedrelationship of these cognitive deficits to impairments in aspects of functional outcome.Although these deficits were not originally developed to exactly match the seven cognitivedomains included in the MATRICS Consensus Cognitive Battery, the item content onSCoRS is very similar to CGI-CogS (see Keefe et al. 2006, Ventura et al. 2008, as well asVentura et al., under review). The original purpose of the SCoRS was to “serve as a co-primary measure in clinical trials of cognitive enhancing drugs for schizophrenia” (Keefe, etal., 2006, p. 426).
The format for each SCoRS item differs from CGI-CogS in several ways. First, SCoRSitems begin with "do you have difficulty…." and then target a more specific cognitive/behavioral phenomenon. For example, SCoRS Item #1 is "Remembering names of peopleyou know or meet? Example: roommate, nurse, doctor, family & friends" and Item #2 is"remembering how to get places? Example: friend's house, store, restroom, own room."Second, in contrast to CGI-CogS’s 7-point scale, SCoRS items are rated on a 4-point scale:none, mild, moderate, and severe impairment. However, each item has a unique anchor foreach of the 1 to 4 ratings. For example, on Item #1, anchors are: 1) no impairment, 2) mild =sometimes forgets names, 3) moderate = frequently forgets names, and 4) severe = almostalways forgets names. For Item #2, anchors are: 1) no impairment, 2) mild = sometimesforgets how to get places, 3) moderate = only able to get to very familiar places, and 4)severe = unable to get any place without assistance because of difficulty with memory. Inother words, the anchor points for each SCoRS item describe the frequency ("sometimes","almost always") to which a deficit impairs a specific aspect of day-to-day functioning. Theunderlying concept ostensibly assessed by the SCoRS items is displayed in Table 2 and thecontent domain is listed in Table 4.
Traditional Item StatisticsTables 1 and 2 display traditional item psychometrics for both measures separately. Indicesinclude the item mean, standard deviation, corrected item-total correlations, and theresponse proportions in each category. These indices point to major differences between thetwo instruments. Most notably, the item-test correlations are strikingly higher on CGI-CogSrelative to SCoRS. Moreover, coefficient alpha for CGI-CogS item responses is .95 with anaverage inter-item correlation of .47 (range from .15 to .65). The coefficient alpha forSCoRS item responses is .89 with an average inter-item correlation of .29 (range from .09to .53). The difference in the average inter-item correlation is striking and could be taken to
Reise et al. Page 5
Psychol Assess. Author manuscript; available in PMC 2012 March 1.
NIH
-PA Author Manuscript
NIH
-PA Author Manuscript
NIH
-PA Author Manuscript
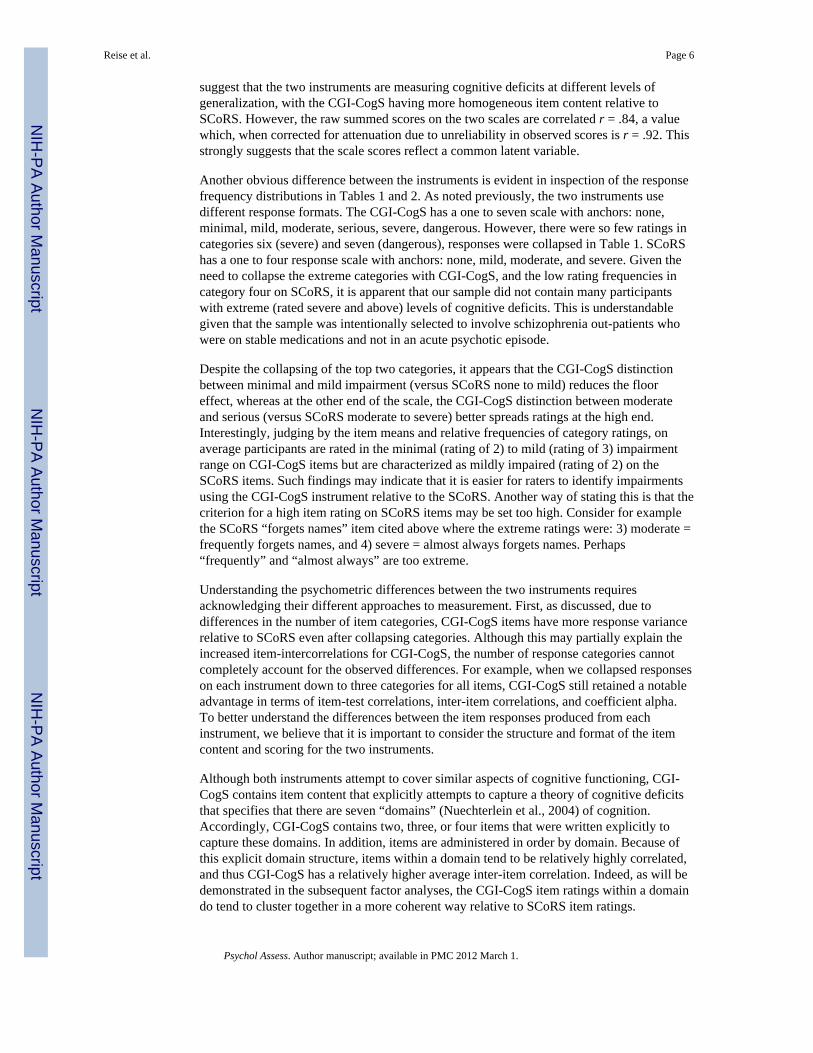
suggest that the two instruments are measuring cognitive deficits at different levels ofgeneralization, with the CGI-CogS having more homogeneous item content relative toSCoRS. However, the raw summed scores on the two scales are correlated r = .84, a valuewhich, when corrected for attenuation due to unreliability in observed scores is r = .92. Thisstrongly suggests that the scale scores reflect a common latent variable.
Another obvious difference between the instruments is evident in inspection of the responsefrequency distributions in Tables 1 and 2. As noted previously, the two instruments usedifferent response formats. The CGI-CogS has a one to seven scale with anchors: none,minimal, mild, moderate, serious, severe, dangerous. However, there were so few ratings incategories six (severe) and seven (dangerous), responses were collapsed in Table 1. SCoRShas a one to four response scale with anchors: none, mild, moderate, and severe. Given theneed to collapse the extreme categories with CGI-CogS, and the low rating frequencies incategory four on SCoRS, it is apparent that our sample did not contain many participantswith extreme (rated severe and above) levels of cognitive deficits. This is understandablegiven that the sample was intentionally selected to involve schizophrenia out-patients whowere on stable medications and not in an acute psychotic episode.
Despite the collapsing of the top two categories, it appears that the CGI-CogS distinctionbetween minimal and mild impairment (versus SCoRS none to mild) reduces the flooreffect, whereas at the other end of the scale, the CGI-CogS distinction between moderateand serious (versus SCoRS moderate to severe) better spreads ratings at the high end.Interestingly, judging by the item means and relative frequencies of category ratings, onaverage participants are rated in the minimal (rating of 2) to mild (rating of 3) impairmentrange on CGI-CogS items but are characterized as mildly impaired (rating of 2) on theSCoRS items. Such findings may indicate that it is easier for raters to identify impairmentsusing the CGI-CogS instrument relative to the SCoRS. Another way of stating this is that thecriterion for a high item rating on SCoRS items may be set too high. Consider for examplethe SCoRS “forgets names” item cited above where the extreme ratings were: 3) moderate =frequently forgets names, and 4) severe = almost always forgets names. Perhaps“frequently” and “almost always” are too extreme.
Understanding the psychometric differences between the two instruments requiresacknowledging their different approaches to measurement. First, as discussed, due todifferences in the number of item categories, CGI-CogS items have more response variancerelative to SCoRS even after collapsing categories. Although this may partially explain theincreased item-intercorrelations for CGI-CogS, the number of response categories cannotcompletely account for the observed differences. For example, when we collapsed responseson each instrument down to three categories for all items, CGI-CogS still retained a notableadvantage in terms of item-test correlations, inter-item correlations, and coefficient alpha.To better understand the differences between the item responses produced from eachinstrument, we believe that it is important to consider the structure and format of the itemcontent and scoring for the two instruments.
Although both instruments attempt to cover similar aspects of cognitive functioning, CGI-CogS contains item content that explicitly attempts to capture a theory of cognitive deficitsthat specifies that there are seven “domains” (Nuechterlein et al., 2004) of cognition.Accordingly, CGI-CogS contains two, three, or four items that were written explicitly tocapture these domains. In addition, items are administered in order by domain. Because ofthis explicit domain structure, items within a domain tend to be relatively highly correlated,and thus CGI-CogS has a relatively higher average inter-item correlation. Indeed, as will bedemonstrated in the subsequent factor analyses, the CGI-CogS item ratings within a domaindo tend to cluster together in a more coherent way relative to SCoRS item ratings.
Reise et al. Page 6
Psychol Assess. Author manuscript; available in PMC 2012 March 1.
NIH
-PA Author Manuscript
NIH
-PA Author Manuscript
NIH
-PA Author Manuscript
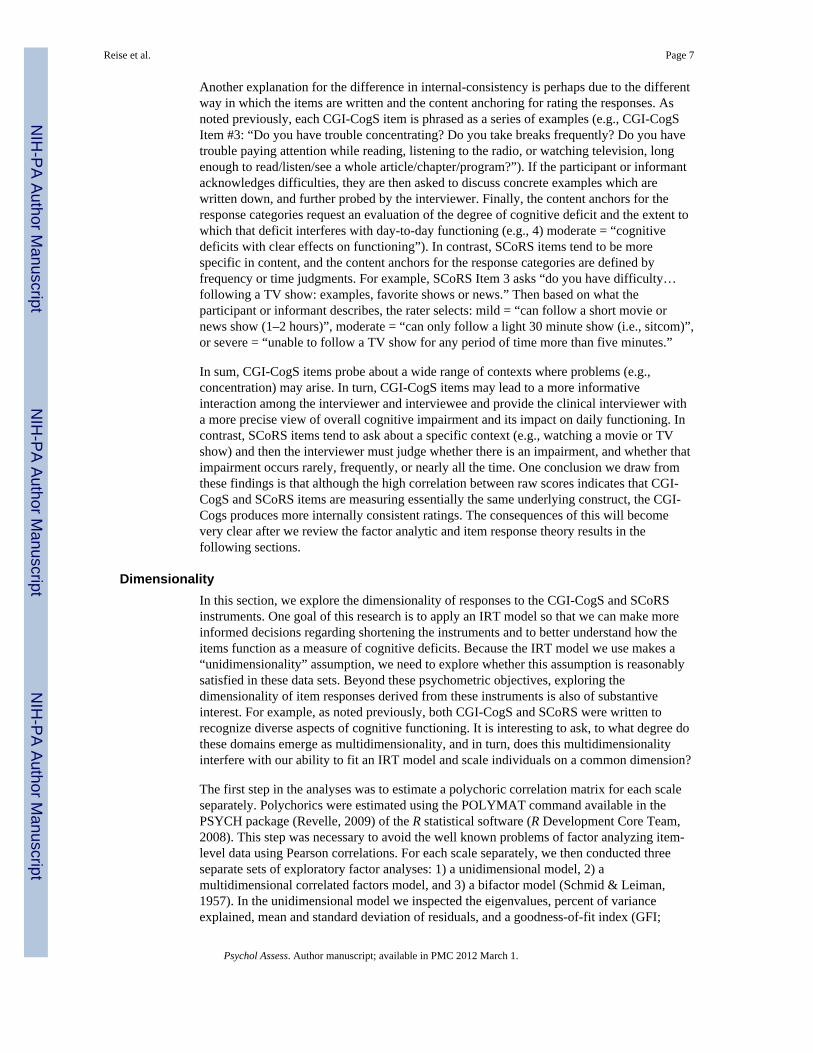
Another explanation for the difference in internal-consistency is perhaps due to the differentway in which the items are written and the content anchoring for rating the responses. Asnoted previously, each CGI-CogS item is phrased as a series of examples (e.g., CGI-CogSItem #3: “Do you have trouble concentrating? Do you take breaks frequently? Do you havetrouble paying attention while reading, listening to the radio, or watching television, longenough to read/listen/see a whole article/chapter/program?”). If the participant or informantacknowledges difficulties, they are then asked to discuss concrete examples which arewritten down, and further probed by the interviewer. Finally, the content anchors for theresponse categories request an evaluation of the degree of cognitive deficit and the extent towhich that deficit interferes with day-to-day functioning (e.g., 4) moderate = “cognitivedeficits with clear effects on functioning”). In contrast, SCoRS items tend to be morespecific in content, and the content anchors for the response categories are defined byfrequency or time judgments. For example, SCoRS Item 3 asks “do you have difficulty…following a TV show: examples, favorite shows or news.” Then based on what theparticipant or informant describes, the rater selects: mild = “can follow a short movie ornews show (1–2 hours)”, moderate = “can only follow a light 30 minute show (i.e., sitcom)”,or severe = “unable to follow a TV show for any period of time more than five minutes.”
In sum, CGI-CogS items probe about a wide range of contexts where problems (e.g.,concentration) may arise. In turn, CGI-CogS items may lead to a more informativeinteraction among the interviewer and interviewee and provide the clinical interviewer witha more precise view of overall cognitive impairment and its impact on daily functioning. Incontrast, SCoRS items tend to ask about a specific context (e.g., watching a movie or TVshow) and then the interviewer must judge whether there is an impairment, and whether thatimpairment occurs rarely, frequently, or nearly all the time. One conclusion we draw fromthese findings is that although the high correlation between raw scores indicates that CGI-CogS and SCoRS items are measuring essentially the same underlying construct, the CGI-Cogs produces more internally consistent ratings. The consequences of this will becomevery clear after we review the factor analytic and item response theory results in thefollowing sections.
DimensionalityIn this section, we explore the dimensionality of responses to the CGI-CogS and SCoRSinstruments. One goal of this research is to apply an IRT model so that we can make moreinformed decisions regarding shortening the instruments and to better understand how theitems function as a measure of cognitive deficits. Because the IRT model we use makes a“unidimensionality” assumption, we need to explore whether this assumption is reasonablysatisfied in these data sets. Beyond these psychometric objectives, exploring thedimensionality of item responses derived from these instruments is also of substantiveinterest. For example, as noted previously, both CGI-CogS and SCoRS were written torecognize diverse aspects of cognitive functioning. It is interesting to ask, to what degree dothese domains emerge as multidimensionality, and in turn, does this multidimensionalityinterfere with our ability to fit an IRT model and scale individuals on a common dimension?
The first step in the analyses was to estimate a polychoric correlation matrix for each scaleseparately. Polychorics were estimated using the POLYMAT command available in thePSYCH package (Revelle, 2009) of the R statistical software (R Development Core Team,2008). This step was necessary to avoid the well known problems of factor analyzing item-level data using Pearson correlations. For each scale separately, we then conducted threeseparate sets of exploratory factor analyses: 1) a unidimensional model, 2) amultidimensional correlated factors model, and 3) a bifactor model (Schmid & Leiman,1957). In the unidimensional model we inspected the eigenvalues, percent of varianceexplained, mean and standard deviation of residuals, and a goodness-of-fit index (GFI;
Reise et al. Page 7
Psychol Assess. Author manuscript; available in PMC 2012 March 1.
NIH
-PA Author Manuscript
NIH
-PA Author Manuscript
NIH
-PA Author Manuscript
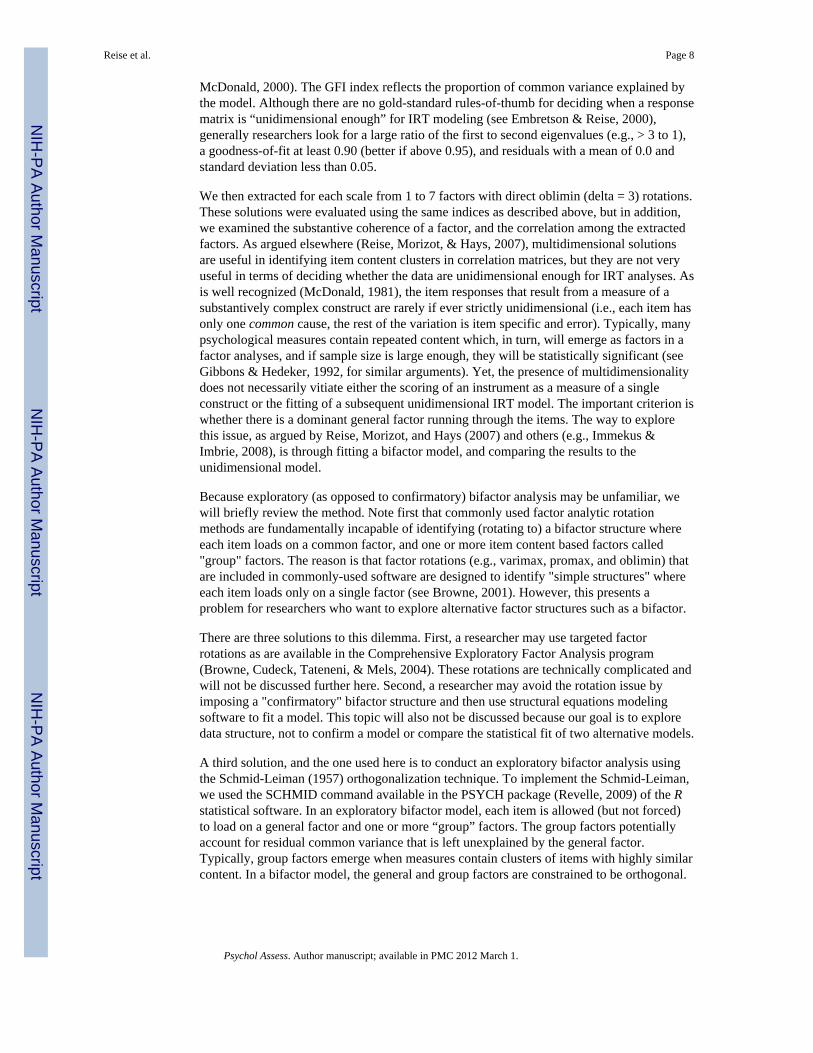
McDonald, 2000). The GFI index reflects the proportion of common variance explained bythe model. Although there are no gold-standard rules-of-thumb for deciding when a responsematrix is “unidimensional enough” for IRT modeling (see Embretson & Reise, 2000),generally researchers look for a large ratio of the first to second eigenvalues (e.g., > 3 to 1),a goodness-of-fit at least 0.90 (better if above 0.95), and residuals with a mean of 0.0 andstandard deviation less than 0.05.
We then extracted for each scale from 1 to 7 factors with direct oblimin (delta = 3) rotations.These solutions were evaluated using the same indices as described above, but in addition,we examined the substantive coherence of a factor, and the correlation among the extractedfactors. As argued elsewhere (Reise, Morizot, & Hays, 2007), multidimensional solutionsare useful in identifying item content clusters in correlation matrices, but they are not veryuseful in terms of deciding whether the data are unidimensional enough for IRT analyses. Asis well recognized (McDonald, 1981), the item responses that result from a measure of asubstantively complex construct are rarely if ever strictly unidimensional (i.e., each item hasonly one common cause, the rest of the variation is item specific and error). Typically, manypsychological measures contain repeated content which, in turn, will emerge as factors in afactor analyses, and if sample size is large enough, they will be statistically significant (seeGibbons & Hedeker, 1992, for similar arguments). Yet, the presence of multidimensionalitydoes not necessarily vitiate either the scoring of an instrument as a measure of a singleconstruct or the fitting of a subsequent unidimensional IRT model. The important criterion iswhether there is a dominant general factor running through the items. The way to explorethis issue, as argued by Reise, Morizot, and Hays (2007) and others (e.g., Immekus &Imbrie, 2008), is through fitting a bifactor model, and comparing the results to theunidimensional model.
Because exploratory (as opposed to confirmatory) bifactor analysis may be unfamiliar, wewill briefly review the method. Note first that commonly used factor analytic rotationmethods are fundamentally incapable of identifying (rotating to) a bifactor structure whereeach item loads on a common factor, and one or more item content based factors called"group" factors. The reason is that factor rotations (e.g., varimax, promax, and oblimin) thatare included in commonly-used software are designed to identify "simple structures" whereeach item loads only on a single factor (see Browne, 2001). However, this presents aproblem for researchers who want to explore alternative factor structures such as a bifactor.
There are three solutions to this dilemma. First, a researcher may use targeted factorrotations as are available in the Comprehensive Exploratory Factor Analysis program(Browne, Cudeck, Tateneni, & Mels, 2004). These rotations are technically complicated andwill not be discussed further here. Second, a researcher may avoid the rotation issue byimposing a "confirmatory" bifactor structure and then use structural equations modelingsoftware to fit a model. This topic will also not be discussed because our goal is to exploredata structure, not to confirm a model or compare the statistical fit of two alternative models.
A third solution, and the one used here is to conduct an exploratory bifactor analysis usingthe Schmid-Leiman (1957) orthogonalization technique. To implement the Schmid-Leiman,we used the SCHMID command available in the PSYCH package (Revelle, 2009) of the Rstatistical software. In an exploratory bifactor model, each item is allowed (but not forced)to load on a general factor and one or more “group” factors. The group factors potentiallyaccount for residual common variance that is left unexplained by the general factor.Typically, group factors emerge when measures contain clusters of items with highly similarcontent. In a bifactor model, the general and group factors are constrained to be orthogonal.
Reise et al. Page 8
Psychol Assess. Author manuscript; available in PMC 2012 March 1.
NIH
-PA Author Manuscript
NIH
-PA Author Manuscript
NIH
-PA Author Manuscript
Essentially, an exploratory bifactor model (as opposed to confirmatory) is an"orthogonalization" of a second-order factor model. That is, first a set of correlated factorsare extracted and rotated (e.g., using principal axis extraction with oblimin rotation). Thesecorrelated factors are called "primary" or “first-order” factors. Then, the correlations amongthose primary factors are factored, and the resulting factor loadings reflect the correlationsbetween the primary and "higher-order" dimension. The Schmid-Leiman techniquetransforms this higher-order solution into a bifactor structure where each item can load on acommon dimension and one or more group factors. Generally speaking, if the originaloblique factor extraction contains three correlated factors, then the Schmid-Leiman willcontain one general and three group factors. Factor identification and interpretability isjudged by looking for an independent cluster basis (i.e., each factor has three or more itemsthat load only on that factor) as explained in McDonald (1999; 2000).
In sum, in an exploratory analysis (but not confirmatory), an oblique rotation, a higher-orderfactor model, and a Schmid-Leiman orthogonalization are all equivalent ways of examiningdata and are highly interrelated (see Chen, West, & Sousa, K. H., 2006, and the citationstherein for further discussion). Indeed, after specifying the number of primary dimensions(or group factors) the SCHMID command in the PSYCH package produces all threesolutions. Finally, we note that the Schmid-Leiman can be easily implemented in SPSS andSAS as well (e.g., Wolff & Preising, 2005).
To evaluate the bifactor model, and ultimately the viability of a unidimensional IRT model,we first evaluate the relative percent of variance explained by the general factor with thepercent explained by the group factors. To the degree that the observed variance is explainedby a general factor relative to the group factors, a unidimensional IRT model is viable. Asecond method of evaluation is to compare the factor loadings in the general factor of thebifactor model with the factor loadings in the unidimensional model. If the factor loadingsare similar in the unidimensional model (i.e., a model with loadings potentially biased bymultidimensionality), and the general factor in the bifactor model (i.e., a model that takesinto account multidimensionality), this is further evidence that multidimensionality cansafely be ignored and treated as nuisance.
CGI-CogSThe first seven eigenvalues from the CGI-CogS item responses are: 11.56, 1.44, 1.11, 0.93,0.68, 0.62, and, 0.59, respectively. This dramatic 8 to 1 ratio of the 1st to 2nd eigenvaluesuggests a large general factor. Under the Uni column of Table 3 are the loadings for theunidimensional model, and it is clear that each item loads strongly on this first dimensionwith loadings ranging from .57 to .81. The GFI index, which reflects the degree to whichcommon variance is accounted for is .98, strongly supporting the adequacy of a singlefactor. The mean residual is zero and the standard deviation of the residuals is .07. Thislatter value is a little above our preferred benchmark, but still it is in an acceptable range.
Despite this strong evidence for a unidimensional solution, for the sake of thoroughness, wealso explored multidimensional solutions. Although solutions of five, six, and sevencorrelated dimensions were evaluated, these results are difficult to interpret due to Heywoodcases, factors defined by single items, or no item having its highest loading on a factor.Thus, we argue that the only viable multidimensional solution is the four factor, and it is thismodel that is reported in the middle set of columns in Table 3. In this model, GFI is .99 themean residual is .03 and the standard deviation of the residuals is .03. The factors are clearlycontent domain factors where Factor 1 is merged attention and reasoning domain items,Factor 2 is the four social cognition domain items, Factor 3 is spatial and verbal learningdomain items, and Factor 4 consists of items from the speed of processing domain. The
Reise et al. Page 9
Psychol Assess. Author manuscript; available in PMC 2012 March 1.
NIH
-PA Author Manuscript
NIH
-PA Author Manuscript
NIH
-PA Author Manuscript
factors are strongly inter-related with correlations ranging from .52 (3 and 4) to .69 (1 and2).
The four factor model is an “improvement” on the unidimensional model in terms of GFIand standard deviation of residuals. However, it is not surprising that a model with morefactors explains the item response data better. To explore the extent to which this is ameaningful improvement, we turn to the bifactor results, which are reported in the third setof columns in Table 3. Given the exploratory factor analysis results, we report on only thefindings of the one general factor and four group factor solutions. In the exploratory bifactormodel (GFI = .99), all items continue to load highly on the general factor but the loadingsare around .03 to .05 smaller in the general factor than in the unidimensional model. Thissuggests that the multidimensionality “biases” the loadings in the unidimensional solution,but only slightly. The group factors replicate the four factor model above, with the exceptionthat now the loadings are much smaller due to the fact that the general factor has beencontrolled for in the bifactor solution. Finally, we note that in the bifactor solution, thegeneral factor accounts for 47% of the variance (73% of the common variance), whereas thegroup factors explain, 4%, 4%, 4%, and 5%, respectively, or 17% combined.
SCoRSThe first seven eigenvalues from the SCoRS were: 7.86, 1.45, 1.36, 1.15, 0.99, 0.85, and,0.74, respectively, a pattern suggesting the presence of only a single meaningful dimension.The ratio of the 1st to 2nd eigenvalue is 5.42, which is less than CGI-CogS, but still wellabove the standard 3 to 1 ratio used to judge unidimensionality. In the first set of factorloadings in Table 4 are the loadings for the unidimensional model, and again, each itemloads strongly on this single dimension with loadings ranging from .49 to .79. The GFIindex is .97, strongly supporting the adequacy of a single factor. The mean residual is 0.0and the standard deviation of the residuals is .08. As before with CGI-CogS, this latter valueis above our preferred benchmark, but still it is by no means a large value.
We also explored multidimensional solutions with SCoRS ranging from 1 to 7 correlateddimensions extracted. However, the interpretation of the dimensions was more challengingin SCoRS relative to the CGI-CogS. In addition, we again had concerns with factor solutionsabove four dimensions, namely, single item factors, factors having no item with the highestloading, or factors that were impossible to meaningfully interpret. For these reasons, wereport the results of the four correlated factor solution in the middle columns of Table 4. Inthis model, GFI is .99, the mean residual is 0.0 and the standard deviation of the residualsis .04. We interpret the factors as follows. Factor 1 appears composed of attention and focusitems. Factor 2 is a memory factor containing four items with the word "remember" in it and“learns new things.” Factor 3 has item content reflecting understanding of meaning and issimilar to CGI-CogS social cognition. Factor 4 is marked by two items, “familiar tasks”, and“remembers chores,” which is perhaps a demands of daily living factor. The SCoRS factorsare not as highly inter-related with correlations ranging from 0.34 (4 and 2) to 0.54 (1 and2).
In the last set of factor loadings in Table 4, we report on the findings of the one generalfactor and four group factor solutions. In this exploratory bifactor model (GFI = .99), allitems continue to load highly on the general factor but the loadings are around .03 to .06smaller in the general factor than in the unidimensional model. As expected, the factorloadings on the group factors are now smaller due to the fact that the general factor has beencontrolled for in the bifactor solution. The general factor accounts for 30% of the itemresponse variance (60% of common variance), whereas the group factors explain, 6%, 5%,4%, and 5%, respectively, or 20% combined. Clearly, the general factor is not as strong in
Reise et al. Page 10
Psychol Assess. Author manuscript; available in PMC 2012 March 1.
NIH
-PA Author Manuscript
NIH
-PA Author Manuscript
NIH
-PA Author Manuscript
SCoRS relative to CGI-CogS, and the factors do not cohere as one would expect based onthe a priori content groupings.
CombinedAlthough the above analyses were important for us to learn how each instrument functionsas a stand alone measure, it is these combined analyses that are most decisive in terms ofevaluating the tenability of whether to fit an IRT model to both scales simultaneously. Thefirst seven eigenvalues of the combined matrix are: 18.22, 2.17, 1.75, 1.52, 1.51, 1.40, and1.28, respectively, again suggesting a strong general factor. To save space, and because themultidimensional solutions were so challenging to interpret, we will not provide a table offactor loadings (available from authors) or provide a detailed description of themultidimensional solutions in this section. Rather, we note first that in the unidimesnionalsolution, all items continued to load substantially. Second, although solutions containingfrom four to seven group factors were considered in the bifactor analysis, we decided toextract seven group factors. The GFI index for this model as 0.99 with a mean residual of0.00 and standard deviation of 0.03.
As with the previous results, in bifactor solutions, the loadings on the general factor wereonly slightly lower in the bifactor relative to their values in the unidimensional solution.This suggests that the multidimensionality does not interfere with our ability to use the itemsto scale individuals on a common dimension. Third, we note that unsurprisingly given theabove results, with the exception of SCoRS item #14 (“learns new things”) and #20(“follows group conversations”), the CGI-CogS items dominate the general factor in termsof loadings. Finally, it is clear that when the two instruments are combined, the generalfactor continues to dominate the group factors. Specifically, the general factor accounts for38% of the variance while the group factors combined account for 23%. However, thedominance of the general factor is reduced in this joint analysis compared to when the CGI-CogS was analyzed alone. Nevertheless, we argue that these findings support our applicationof IRT to the combined measures, a topic we now address.
Item Response Theory AnalysisItem response theory (IRT; Embretson & Reise, 2000) is the dominant measurement theoryin aptitude, achievement, and licensure testing and is quickly becoming the defaultpsychometric method in patient reported health outcomes measurement as well (see Reise &Waller, 2009). IRT measurement models are a device to study the relation betweenindividual differences on a latent variable (e.g., cognitive deficits) assumed to underlie itemresponses and the probability of responding in a particular response category. IRTmeasurement models require that certain assumptions be met in order for the results to beinterpretable. First and foremost, unidimensional IRT models (i.e., models with only a singlelatent variable) require that the data be reasonably unidimensional; that is, one common traitshould account for the item responses. Another way of stating this is that IRT modelsassume that the estimated item parameters reflect the relation between item responses andthe common trait they are assessing and are not overly distorted by multidimensionality inthe data. The above factor analyses establish that although both instruments contain somemultidimensionality due to content clusters, the overwhelming majority of common varianceis explained by a strong general factor. For this reason, we feel comfortable moving forwardwith fitting an IRT model.
The Graded Response ModelThe graded response model (GRM; Samejima, 1969) is appropriate when items containordered categorical responses (Embretson & Reise, 2000; Ostini & Nering, 2006). In theGRM, each scale item (i) is described by one item slope parameter (αi) and j = 1… mi
Reise et al. Page 11
Psychol Assess. Author manuscript; available in PMC 2012 March 1.
NIH
-PA Author Manuscript
NIH
-PA Author Manuscript
NIH
-PA Author Manuscript
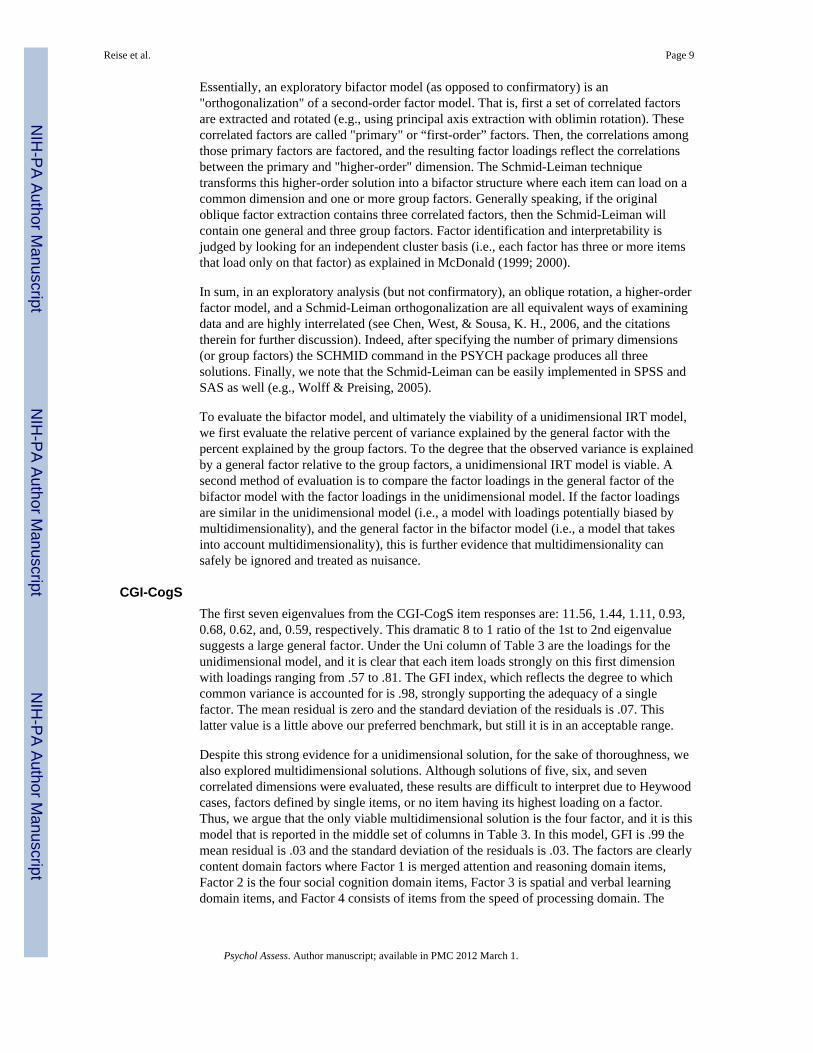
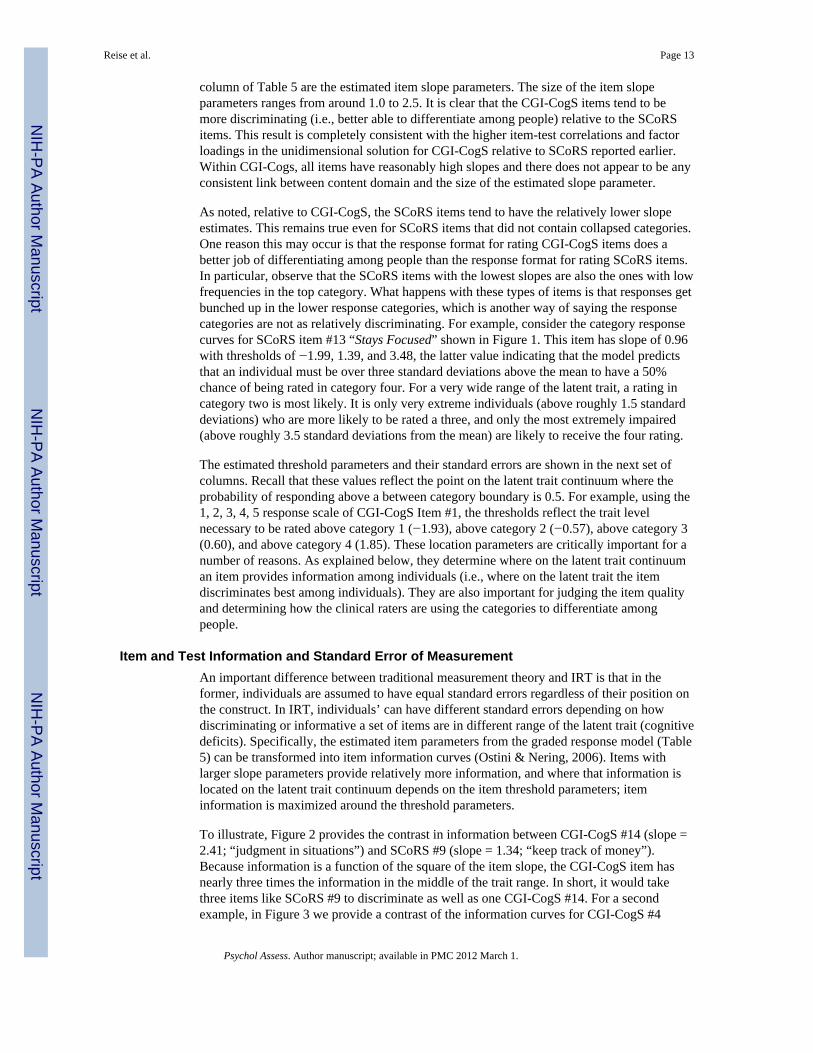
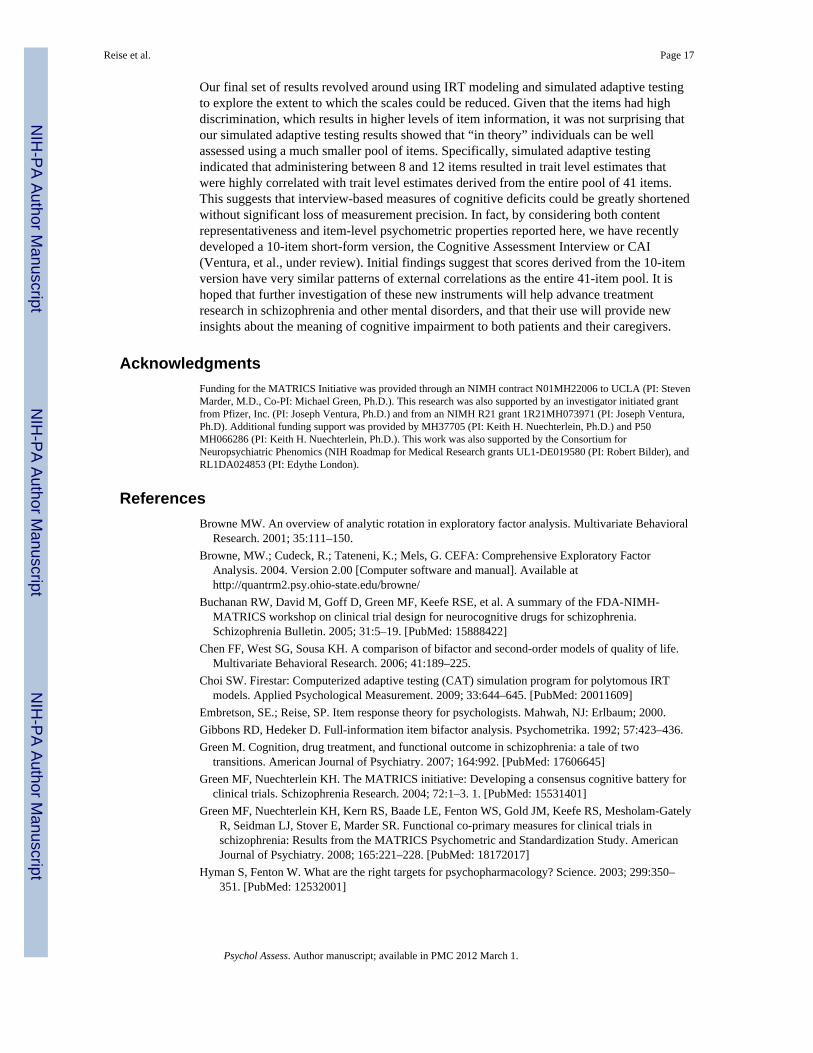
“threshold” parameters (βij), where m is the number of response categories minus one. Theseparameter estimates allow researchers to compute category response curves (CRCs) thatdisplay the relation between a latent variable (cognitive deficits) and the probability ofresponding in each category. For example, Figure 1 displays the CRCs for SCoRS item #13“Stays Focused”. This item will be discussed in more detail shortly.
As for interpreting the parameters, the βij parameters in the GRM represent the trait levelnecessary to respond above a between category boundary j with .50 probability. In otherwords, for a four-category item scored as 1 through 4, there are three boundaries betweenthe categories (e.g., 1 versus 2, 3, 4; 1, 2 versus 3, 4; and 1, 2, 3, versus 4). Thus, the firstthreshold parameter represents the point on the latent trait continuum where the probabilityof responding above category 1 is 50%; the second threshold parameter represents the pointon the latent trait continuum where the probability of responding above category 2 is 50%;and the third threshold parameter represents the point on the latent trait continuum where theprobability of responding above category 3 is 50%. The slope parameters (αi) in the GRMare analogous to factor loadings, and are related to the discriminating power of an item.Items with relatively high slope parameters are better able to differentiate among people atdifferent ranges of the latent trait.
In this research, we estimated the GRM parameters for the combined pool of 41 items (21CGI-CogS and 20 SCoRS items) using MULTILOG (Thissen, 1991). Mostly programdefaults were used with two important exceptions. First, the number of estimation cyclesallowed was set to 500. This proved to be more than enough iterations to achieve aconverged solution. Second, the quadrature points used to define the distribution of thelatent trait in the population were specified to range from −4.5 to 4.5 in increments of 0.1.This was implemented in order to better estimate extreme threshold parameters (e.g., greaterthan 4.0 or less than −4.0) that may result from low response rates in the extreme categories.
Note that in IRT modeling, for identification purposes, it is customary to define the latentvariable (cognitive deficits) such that the mean is zero and the standard deviation is 1.0.Thus, the item parameter estimates in this study should be interpreted in regard to thismetric. Specifically, the mean of the latent trait distribution in this study refers to the meanlevel of cognitive deficits in a stabilized out-patient population characterized by mild tomoderate levels of cognitive impairment.
Finally, due to the fact that for many items, especially SCoRS items, there are few responsesin the extreme impaired category, we were concerned with our ability to estimate somethreshold parameters. To address this concern, we ran MULTILOG in an iterative fashion.First, we ran the program specifying that all the CGI-CogS items had five categories, and allthe SCoRS items had four categories. We then inspected the threshold parameters and theirstandard errors to check whether the values and standard errors were reasonable. If anyestimated threshold parameter was above 4.0 or below −4.0, we collapsed categories and re-estimated the model. In the first run, we found that the fourth threshold parameter for CGI-CogS #17 was above 4.0 and had a relatively large standard error. In addition, this alsooccurred for the third threshold parameter for nine of the twenty SCoRS items. We thuscollapsed responses in category five into category four for CGI-CogS #17, and collapsedresponses in category four into category three for nine SCoRS items. The need to collapsecategories reflects both the lack of severely impaired participants, as well as the extremity ofthe anchor for the extreme category (e.g., forgets names “all the time”).
After collapsing categories, the second MULTILOG run produced more reasonable andinterpretable estimates (i.e., threshold estimates between −4 and 4) for all parameters. Theseparameter estimates along with their standard errors are reported in Table 5. In the first
Reise et al. Page 12
Psychol Assess. Author manuscript; available in PMC 2012 March 1.
NIH
-PA Author Manuscript
NIH
-PA Author Manuscript
NIH
-PA Author Manuscript
column of Table 5 are the estimated item slope parameters. The size of the item slopeparameters ranges from around 1.0 to 2.5. It is clear that the CGI-CogS items tend to bemore discriminating (i.e., better able to differentiate among people) relative to the SCoRSitems. This result is completely consistent with the higher item-test correlations and factorloadings in the unidimensional solution for CGI-CogS relative to SCoRS reported earlier.Within CGI-Cogs, all items have reasonably high slopes and there does not appear to be anyconsistent link between content domain and the size of the estimated slope parameter.
As noted, relative to CGI-CogS, the SCoRS items tend to have the relatively lower slopeestimates. This remains true even for SCoRS items that did not contain collapsed categories.One reason this may occur is that the response format for rating CGI-CogS items does abetter job of differentiating among people than the response format for rating SCoRS items.In particular, observe that the SCoRS items with the lowest slopes are also the ones with lowfrequencies in the top category. What happens with these types of items is that responses getbunched up in the lower response categories, which is another way of saying the responsecategories are not as relatively discriminating. For example, consider the category responsecurves for SCoRS item #13 “Stays Focused” shown in Figure 1. This item has slope of 0.96with thresholds of −1.99, 1.39, and 3.48, the latter value indicating that the model predictsthat an individual must be over three standard deviations above the mean to have a 50%chance of being rated in category four. For a very wide range of the latent trait, a rating incategory two is most likely. It is only very extreme individuals (above roughly 1.5 standarddeviations) who are more likely to be rated a three, and only the most extremely impaired(above roughly 3.5 standard deviations from the mean) are likely to receive the four rating.
The estimated threshold parameters and their standard errors are shown in the next set ofcolumns. Recall that these values reflect the point on the latent trait continuum where theprobability of responding above a between category boundary is 0.5. For example, using the1, 2, 3, 4, 5 response scale of CGI-CogS Item #1, the thresholds reflect the trait levelnecessary to be rated above category 1 (−1.93), above category 2 (−0.57), above category 3(0.60), and above category 4 (1.85). These location parameters are critically important for anumber of reasons. As explained below, they determine where on the latent trait continuuman item provides information among individuals (i.e., where on the latent trait the itemdiscriminates best among individuals). They are also important for judging the item qualityand determining how the clinical raters are using the categories to differentiate amongpeople.
Item and Test Information and Standard Error of MeasurementAn important difference between traditional measurement theory and IRT is that in theformer, individuals are assumed to have equal standard errors regardless of their position onthe construct. In IRT, individuals’ can have different standard errors depending on howdiscriminating or informative a set of items are in different range of the latent trait (cognitivedeficits). Specifically, the estimated item parameters from the graded response model (Table5) can be transformed into item information curves (Ostini & Nering, 2006). Items withlarger slope parameters provide relatively more information, and where that information islocated on the latent trait continuum depends on the item threshold parameters; iteminformation is maximized around the threshold parameters.
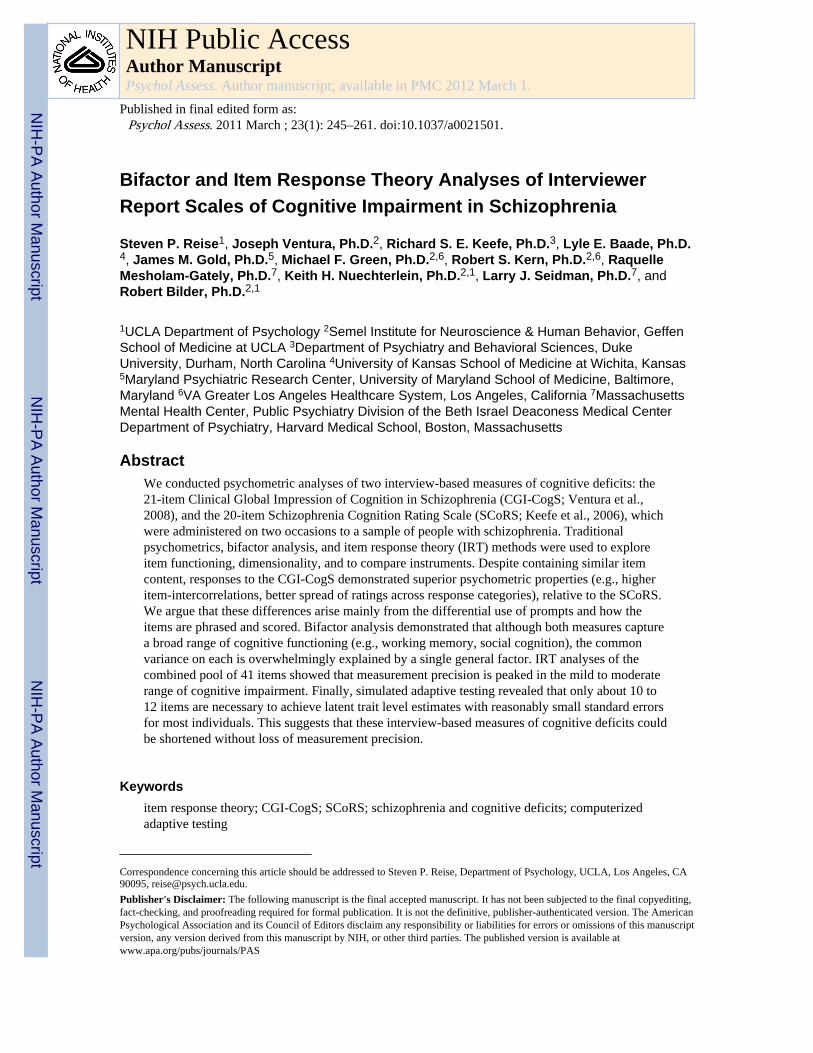
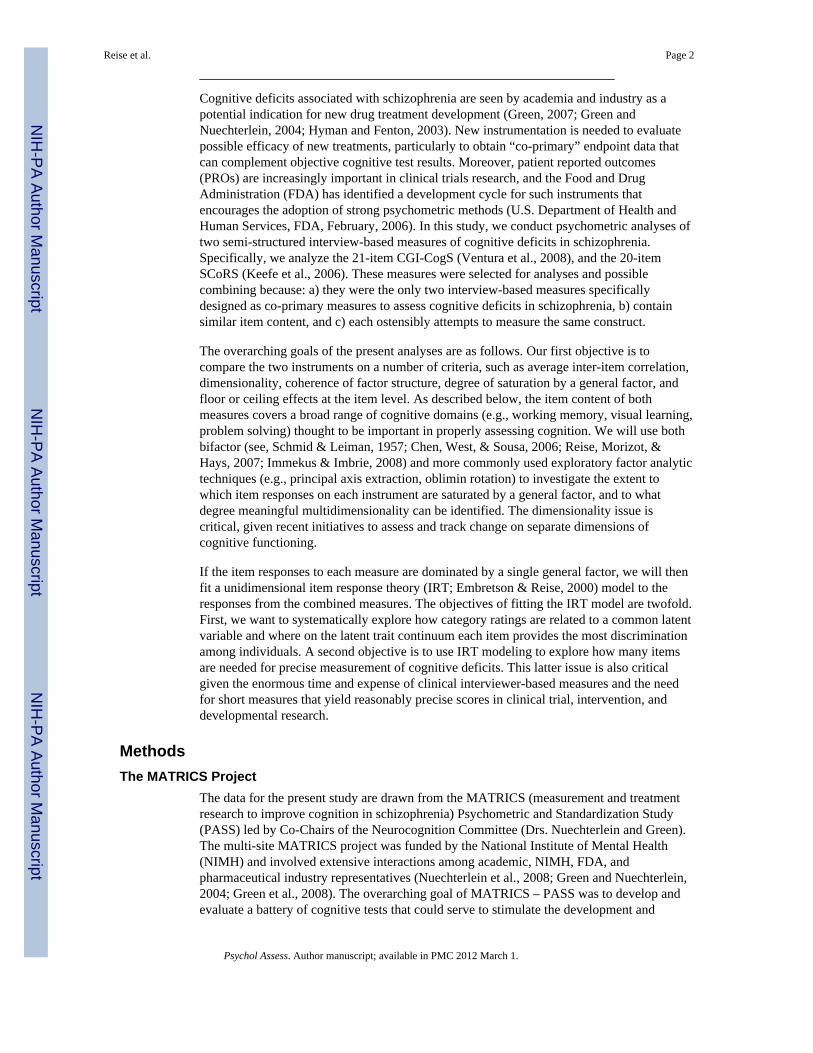
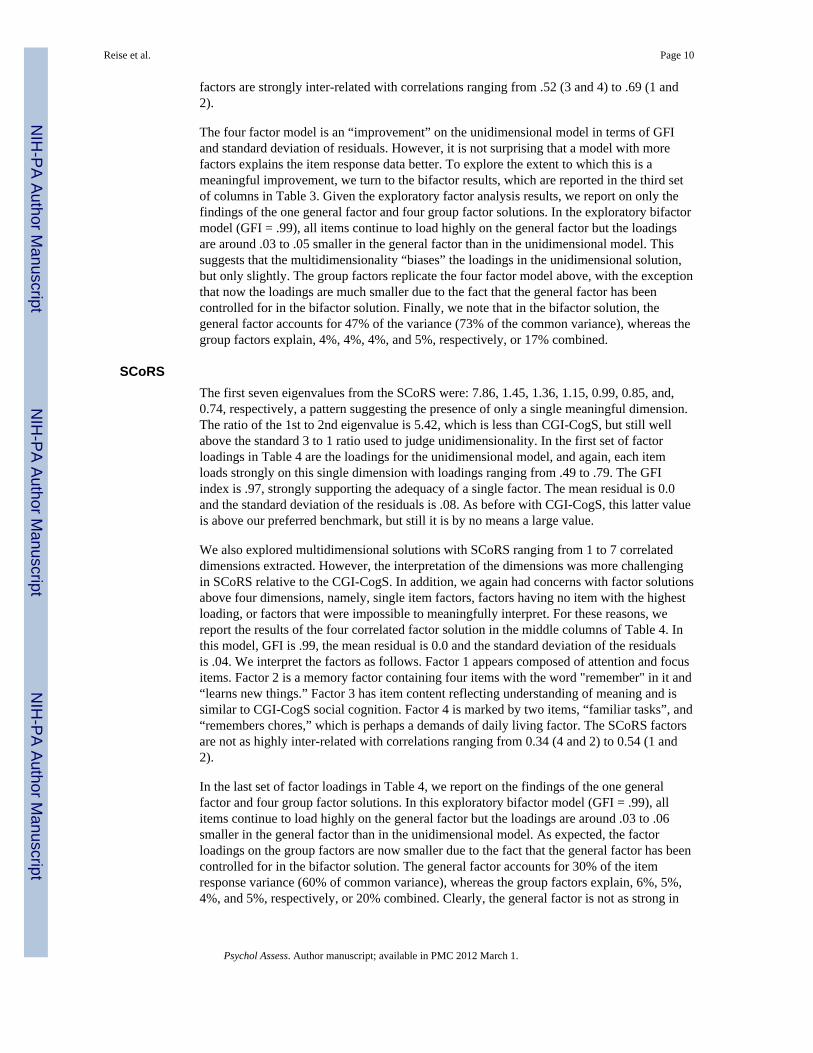
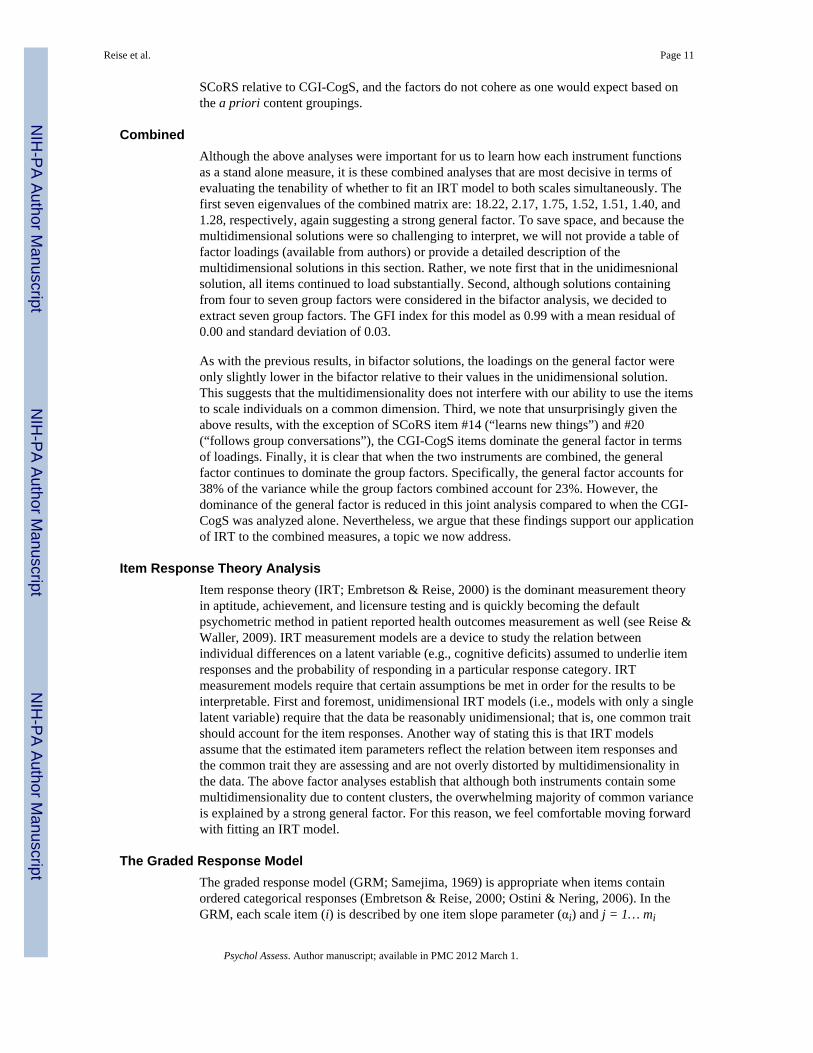
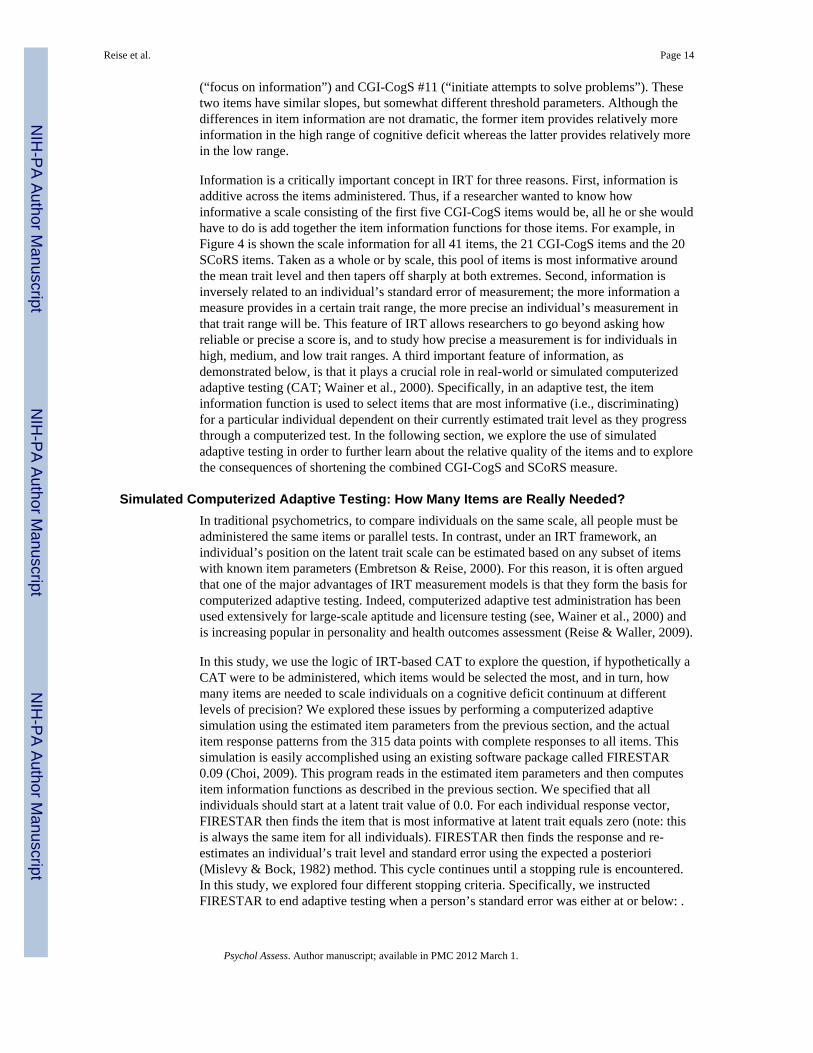
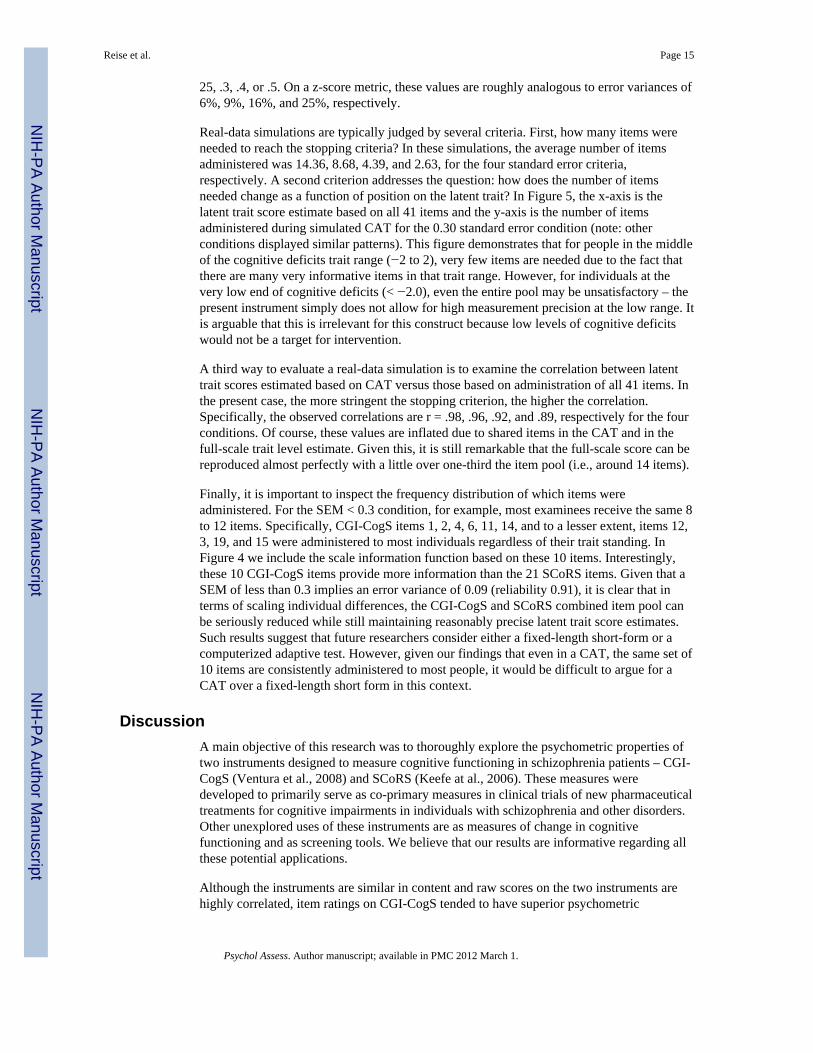
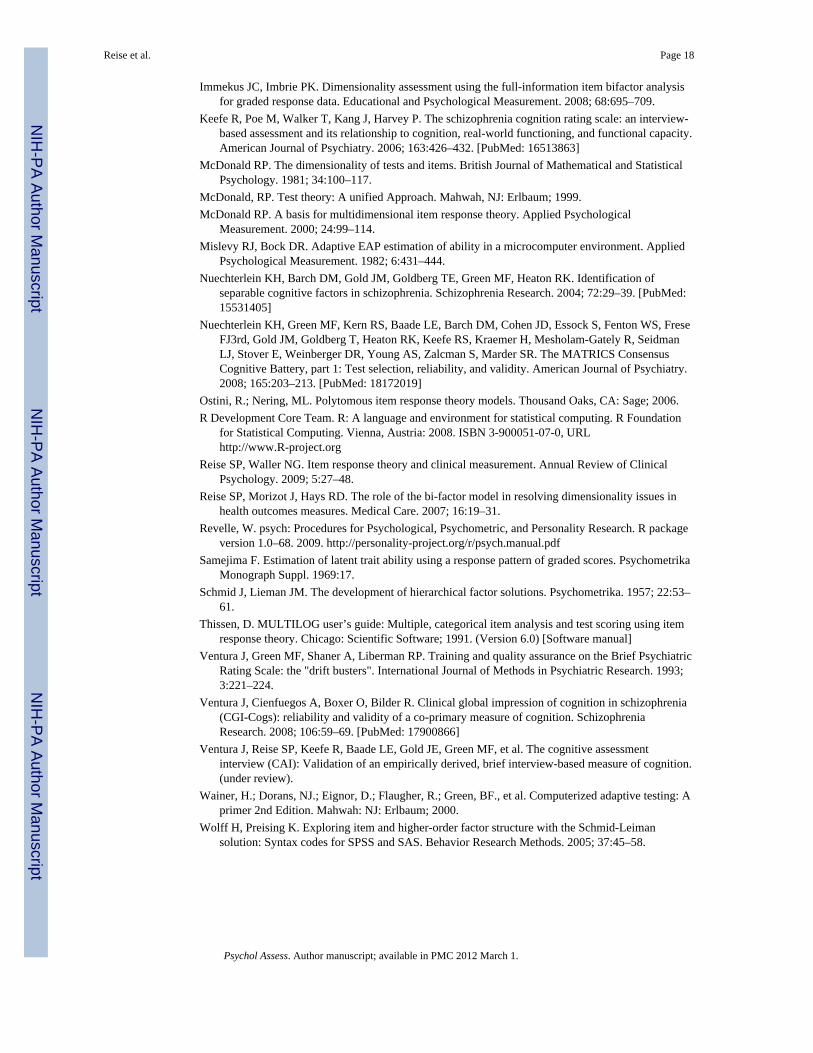
To illustrate, Figure 2 provides the contrast in information between CGI-CogS #14 (slope =2.41; “judgment in situations”) and SCoRS #9 (slope = 1.34; “keep track of money”).Because information is a function of the square of the item slope, the CGI-CogS item hasnearly three times the information in the middle of the trait range. In short, it would takethree items like SCoRS #9 to discriminate as well as one CGI-CogS #14. For a secondexample, in Figure 3 we provide a contrast of the information curves for CGI-CogS #4
Reise et al. Page 13
Psychol Assess. Author manuscript; available in PMC 2012 March 1.
NIH
-PA Author Manuscript
NIH
-PA Author Manuscript
NIH
-PA Author Manuscript
(“focus on information”) and CGI-CogS #11 (“initiate attempts to solve problems”). Thesetwo items have similar slopes, but somewhat different threshold parameters. Although thedifferences in item information are not dramatic, the former item provides relatively moreinformation in the high range of cognitive deficit whereas the latter provides relatively morein the low range.
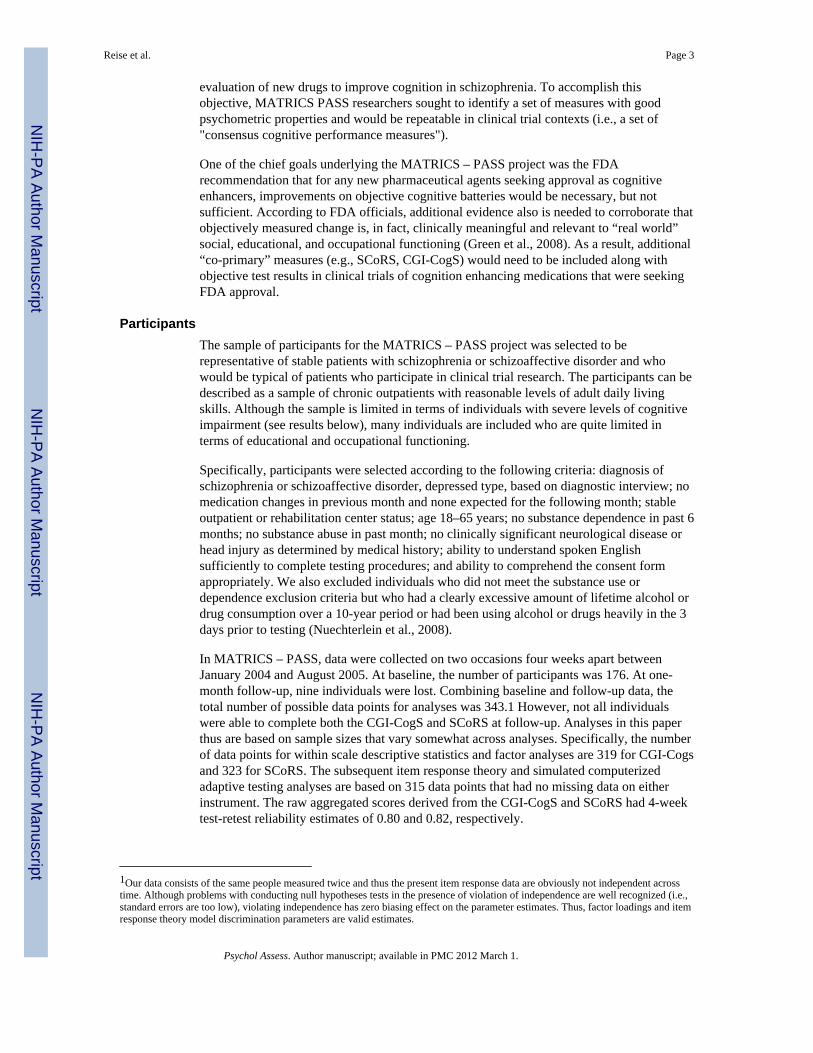
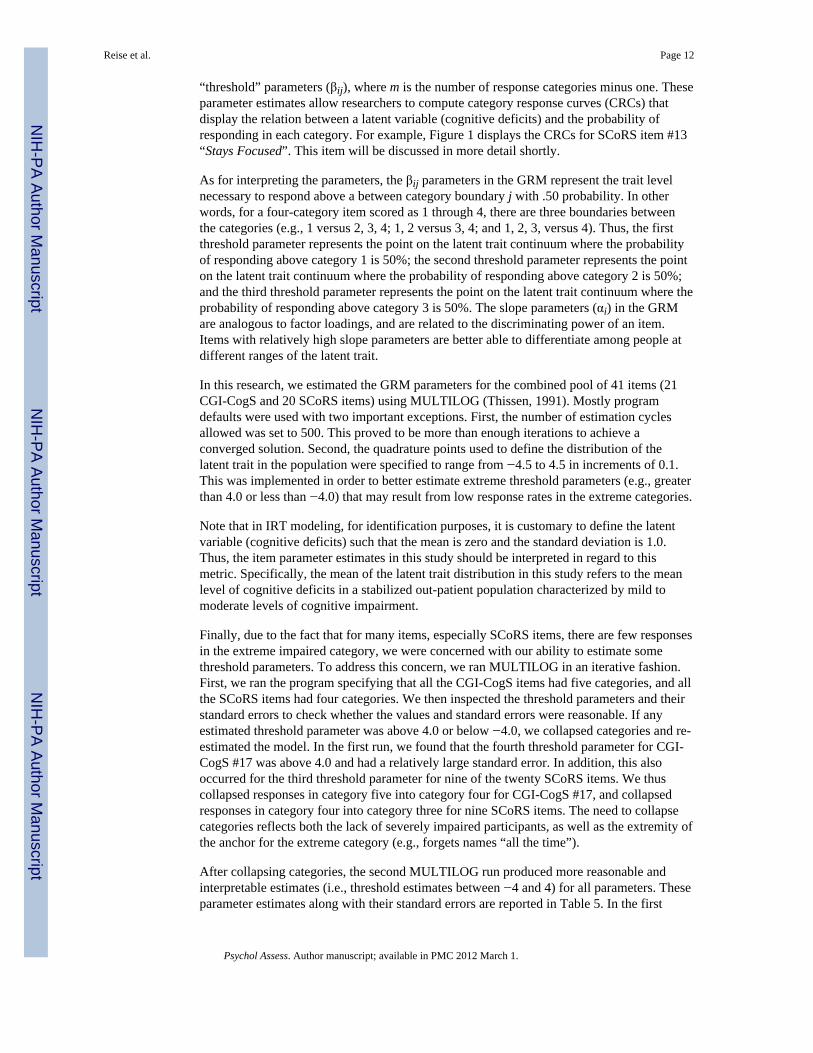
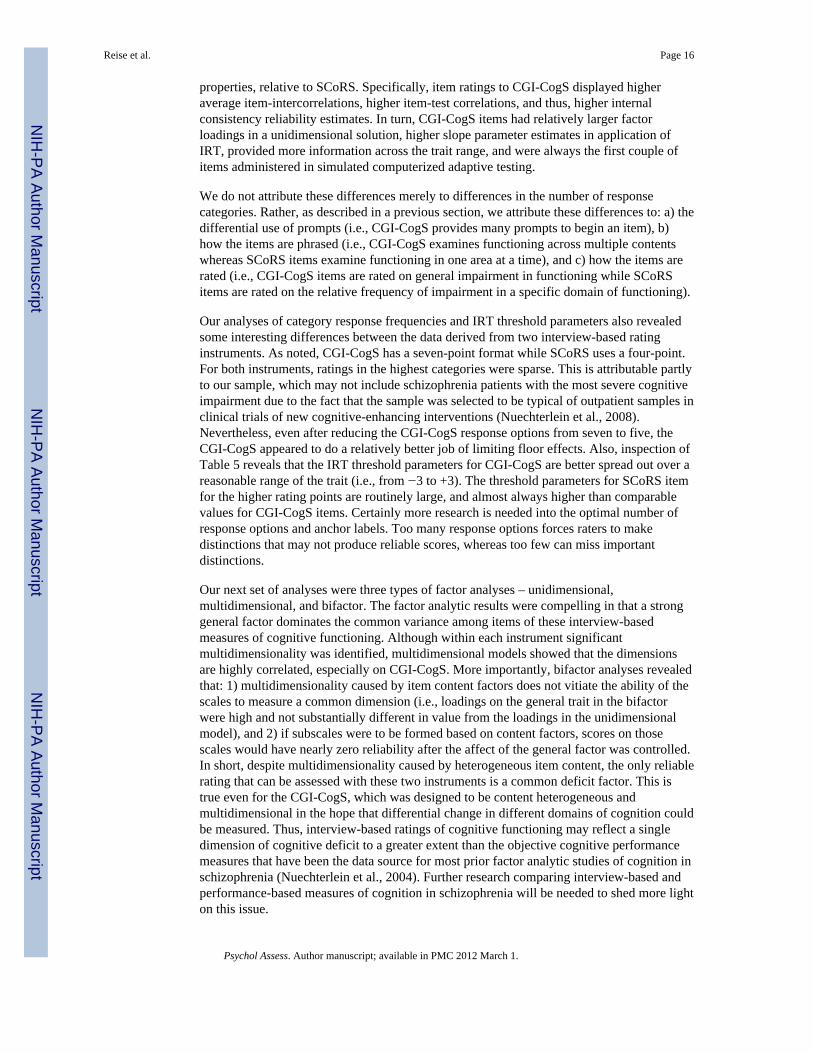
Information is a critically important concept in IRT for three reasons. First, information isadditive across the items administered. Thus, if a researcher wanted to know howinformative a scale consisting of the first five CGI-CogS items would be, all he or she wouldhave to do is add together the item information functions for those items. For example, inFigure 4 is shown the scale information for all 41 items, the 21 CGI-CogS items and the 20SCoRS items. Taken as a whole or by scale, this pool of items is most informative aroundthe mean trait level and then tapers off sharply at both extremes. Second, information isinversely related to an individual’s standard error of measurement; the more information ameasure provides in a certain trait range, the more precise an individual’s measurement inthat trait range will be. This feature of IRT allows researchers to go beyond asking howreliable or precise a score is, and to study how precise a measurement is for individuals inhigh, medium, and low trait ranges. A third important feature of information, asdemonstrated below, is that it plays a crucial role in real-world or simulated computerizedadaptive testing (CAT; Wainer et al., 2000). Specifically, in an adaptive test, the iteminformation function is used to select items that are most informative (i.e., discriminating)for a particular individual dependent on their currently estimated trait level as they progressthrough a computerized test. In the following section, we explore the use of simulatedadaptive testing in order to further learn about the relative quality of the items and to explorethe consequences of shortening the combined CGI-CogS and SCoRS measure.
Simulated Computerized Adaptive Testing: How Many Items are Really Needed?In traditional psychometrics, to compare individuals on the same scale, all people must beadministered the same items or parallel tests. In contrast, under an IRT framework, anindividual’s position on the latent trait scale can be estimated based on any subset of itemswith known item parameters (Embretson & Reise, 2000). For this reason, it is often arguedthat one of the major advantages of IRT measurement models is that they form the basis forcomputerized adaptive testing. Indeed, computerized adaptive test administration has beenused extensively for large-scale aptitude and licensure testing (see, Wainer et al., 2000) andis increasing popular in personality and health outcomes assessment (Reise & Waller, 2009).
In this study, we use the logic of IRT-based CAT to explore the question, if hypothetically aCAT were to be administered, which items would be selected the most, and in turn, howmany items are needed to scale individuals on a cognitive deficit continuum at differentlevels of precision? We explored these issues by performing a computerized adaptivesimulation using the estimated item parameters from the previous section, and the actualitem response patterns from the 315 data points with complete responses to all items. Thissimulation is easily accomplished using an existing software package called FIRESTAR0.09 (Choi, 2009). This program reads in the estimated item parameters and then computesitem information functions as described in the previous section. We specified that allindividuals should start at a latent trait value of 0.0. For each individual response vector,FIRESTAR then finds the item that is most informative at latent trait equals zero (note: thisis always the same item for all individuals). FIRESTAR then finds the response and re-estimates an individual’s trait level and standard error using the expected a posteriori(Mislevy & Bock, 1982) method. This cycle continues until a stopping rule is encountered.In this study, we explored four different stopping criteria. Specifically, we instructedFIRESTAR to end adaptive testing when a person’s standard error was either at or below: .
Reise et al. Page 14
Psychol Assess. Author manuscript; available in PMC 2012 March 1.
NIH
-PA Author Manuscript
NIH
-PA Author Manuscript
NIH
-PA Author Manuscript
25, .3, .4, or .5. On a z-score metric, these values are roughly analogous to error variances of6%, 9%, 16%, and 25%, respectively.
Real-data simulations are typically judged by several criteria. First, how many items wereneeded to reach the stopping criteria? In these simulations, the average number of itemsadministered was 14.36, 8.68, 4.39, and 2.63, for the four standard error criteria,respectively. A second criterion addresses the question: how does the number of itemsneeded change as a function of position on the latent trait? In Figure 5, the x-axis is thelatent trait score estimate based on all 41 items and the y-axis is the number of itemsadministered during simulated CAT for the 0.30 standard error condition (note: otherconditions displayed similar patterns). This figure demonstrates that for people in the middleof the cognitive deficits trait range (−2 to 2), very few items are needed due to the fact thatthere are many very informative items in that trait range. However, for individuals at thevery low end of cognitive deficits (< −2.0), even the entire pool may be unsatisfactory – thepresent instrument simply does not allow for high measurement precision at the low range. Itis arguable that this is irrelevant for this construct because low levels of cognitive deficitswould not be a target for intervention.
A third way to evaluate a real-data simulation is to examine the correlation between latenttrait scores estimated based on CAT versus those based on administration of all 41 items. Inthe present case, the more stringent the stopping criterion, the higher the correlation.Specifically, the observed correlations are r = .98, .96, .92, and .89, respectively for the fourconditions. Of course, these values are inflated due to shared items in the CAT and in thefull-scale trait level estimate. Given this, it is still remarkable that the full-scale score can bereproduced almost perfectly with a little over one-third the item pool (i.e., around 14 items).
Finally, it is important to inspect the frequency distribution of which items wereadministered. For the SEM < 0.3 condition, for example, most examinees receive the same 8to 12 items. Specifically, CGI-CogS items 1, 2, 4, 6, 11, 14, and to a lesser extent, items 12,3, 19, and 15 were administered to most individuals regardless of their trait standing. InFigure 4 we include the scale information function based on these 10 items. Interestingly,these 10 CGI-CogS items provide more information than the 21 SCoRS items. Given that aSEM of less than 0.3 implies an error variance of 0.09 (reliability 0.91), it is clear that interms of scaling individual differences, the CGI-CogS and SCoRS combined item pool canbe seriously reduced while still maintaining reasonably precise latent trait score estimates.Such results suggest that future researchers consider either a fixed-length short-form or acomputerized adaptive test. However, given our findings that even in a CAT, the same set of10 items are consistently administered to most people, it would be difficult to argue for aCAT over a fixed-length short form in this context.
DiscussionA main objective of this research was to thoroughly explore the psychometric properties oftwo instruments designed to measure cognitive functioning in schizophrenia patients – CGI-CogS (Ventura et al., 2008) and SCoRS (Keefe at al., 2006). These measures weredeveloped to primarily serve as co-primary measures in clinical trials of new pharmaceuticaltreatments for cognitive impairments in individuals with schizophrenia and other disorders.Other unexplored uses of these instruments are as measures of change in cognitivefunctioning and as screening tools. We believe that our results are informative regarding allthese potential applications.
Although the instruments are similar in content and raw scores on the two instruments arehighly correlated, item ratings on CGI-CogS tended to have superior psychometric
Reise et al. Page 15
Psychol Assess. Author manuscript; available in PMC 2012 March 1.
NIH
-PA Author Manuscript
NIH
-PA Author Manuscript
NIH
-PA Author Manuscript
properties, relative to SCoRS. Specifically, item ratings to CGI-CogS displayed higheraverage item-intercorrelations, higher item-test correlations, and thus, higher internalconsistency reliability estimates. In turn, CGI-CogS items had relatively larger factorloadings in a unidimensional solution, higher slope parameter estimates in application ofIRT, provided more information across the trait range, and were always the first couple ofitems administered in simulated computerized adaptive testing.
We do not attribute these differences merely to differences in the number of responsecategories. Rather, as described in a previous section, we attribute these differences to: a) thedifferential use of prompts (i.e., CGI-CogS provides many prompts to begin an item), b)how the items are phrased (i.e., CGI-CogS examines functioning across multiple contentswhereas SCoRS items examine functioning in one area at a time), and c) how the items arerated (i.e., CGI-CogS items are rated on general impairment in functioning while SCoRSitems are rated on the relative frequency of impairment in a specific domain of functioning).
Our analyses of category response frequencies and IRT threshold parameters also revealedsome interesting differences between the data derived from two interview-based ratinginstruments. As noted, CGI-CogS has a seven-point format while SCoRS uses a four-point.For both instruments, ratings in the highest categories were sparse. This is attributable partlyto our sample, which may not include schizophrenia patients with the most severe cognitiveimpairment due to the fact that the sample was selected to be typical of outpatient samples inclinical trials of new cognitive-enhancing interventions (Nuechterlein et al., 2008).Nevertheless, even after reducing the CGI-CogS response options from seven to five, theCGI-CogS appeared to do a relatively better job of limiting floor effects. Also, inspection ofTable 5 reveals that the IRT threshold parameters for CGI-CogS are better spread out over areasonable range of the trait (i.e., from −3 to +3). The threshold parameters for SCoRS itemfor the higher rating points are routinely large, and almost always higher than comparablevalues for CGI-CogS items. Certainly more research is needed into the optimal number ofresponse options and anchor labels. Too many response options forces raters to makedistinctions that may not produce reliable scores, whereas too few can miss importantdistinctions.
Our next set of analyses were three types of factor analyses – unidimensional,multidimensional, and bifactor. The factor analytic results were compelling in that a stronggeneral factor dominates the common variance among items of these interview-basedmeasures of cognitive functioning. Although within each instrument significantmultidimensionality was identified, multidimensional models showed that the dimensionsare highly correlated, especially on CGI-CogS. More importantly, bifactor analyses revealedthat: 1) multidimensionality caused by item content factors does not vitiate the ability of thescales to measure a common dimension (i.e., loadings on the general trait in the bifactorwere high and not substantially different in value from the loadings in the unidimensionalmodel), and 2) if subscales were to be formed based on content factors, scores on thosescales would have nearly zero reliability after the affect of the general factor was controlled.In short, despite multidimensionality caused by heterogeneous item content, the only reliablerating that can be assessed with these two instruments is a common deficit factor. This istrue even for the CGI-CogS, which was designed to be content heterogeneous andmultidimensional in the hope that differential change in different domains of cognition couldbe measured. Thus, interview-based ratings of cognitive functioning may reflect a singledimension of cognitive deficit to a greater extent than the objective cognitive performancemeasures that have been the data source for most prior factor analytic studies of cognition inschizophrenia (Nuechterlein et al., 2004). Further research comparing interview-based andperformance-based measures of cognition in schizophrenia will be needed to shed more lighton this issue.
Reise et al. Page 16
Psychol Assess. Author manuscript; available in PMC 2012 March 1.
NIH
-PA Author Manuscript
NIH
-PA Author Manuscript
NIH
-PA Author Manuscript
Our final set of results revolved around using IRT modeling and simulated adaptive testingto explore the extent to which the scales could be reduced. Given that the items had highdiscrimination, which results in higher levels of item information, it was not surprising thatour simulated adaptive testing results showed that “in theory” individuals can be wellassessed using a much smaller pool of items. Specifically, simulated adaptive testingindicated that administering between 8 and 12 items resulted in trait level estimates thatwere highly correlated with trait level estimates derived from the entire pool of 41 items.This suggests that interview-based measures of cognitive deficits could be greatly shortenedwithout significant loss of measurement precision. In fact, by considering both contentrepresentativeness and item-level psychometric properties reported here, we have recentlydeveloped a 10-item short-form version, the Cognitive Assessment Interview or CAI(Ventura, et al., under review). Initial findings suggest that scores derived from the 10-itemversion have very similar patterns of external correlations as the entire 41-item pool. It ishoped that further investigation of these new instruments will help advance treatmentresearch in schizophrenia and other mental disorders, and that their use will provide newinsights about the meaning of cognitive impairment to both patients and their caregivers.
AcknowledgmentsFunding for the MATRICS Initiative was provided through an NIMH contract N01MH22006 to UCLA (PI: StevenMarder, M.D., Co-PI: Michael Green, Ph.D.). This research was also supported by an investigator initiated grantfrom Pfizer, Inc. (PI: Joseph Ventura, Ph.D.) and from an NIMH R21 grant 1R21MH073971 (PI: Joseph Ventura,Ph.D). Additional funding support was provided by MH37705 (PI: Keith H. Nuechterlein, Ph.D.) and P50MH066286 (PI: Keith H. Nuechterlein, Ph.D.). This work was also supported by the Consortium forNeuropsychiatric Phenomics (NIH Roadmap for Medical Research grants UL1-DE019580 (PI: Robert Bilder), andRL1DA024853 (PI: Edythe London).
ReferencesBrowne MW. An overview of analytic rotation in exploratory factor analysis. Multivariate Behavioral
Research. 2001; 35:111–150.Browne, MW.; Cudeck, R.; Tateneni, K.; Mels, G. CEFA: Comprehensive Exploratory Factor
Analysis. 2004. Version 2.00 [Computer software and manual]. Available athttp://quantrm2.psy.ohio-state.edu/browne/
Buchanan RW, David M, Goff D, Green MF, Keefe RSE, et al. A summary of the FDA-NIMH-MATRICS workshop on clinical trial design for neurocognitive drugs for schizophrenia.Schizophrenia Bulletin. 2005; 31:5–19. [PubMed: 15888422]
Chen FF, West SG, Sousa KH. A comparison of bifactor and second-order models of quality of life.Multivariate Behavioral Research. 2006; 41:189–225.
Choi SW. Firestar: Computerized adaptive testing (CAT) simulation program for polytomous IRTmodels. Applied Psychological Measurement. 2009; 33:644–645. [PubMed: 20011609]
Embretson, SE.; Reise, SP. Item response theory for psychologists. Mahwah, NJ: Erlbaum; 2000.Gibbons RD, Hedeker D. Full-information item bifactor analysis. Psychometrika. 1992; 57:423–436.Green M. Cognition, drug treatment, and functional outcome in schizophrenia: a tale of two
transitions. American Journal of Psychiatry. 2007; 164:992. [PubMed: 17606645]Green MF, Nuechterlein KH. The MATRICS initiative: Developing a consensus cognitive battery for
clinical trials. Schizophrenia Research. 2004; 72:1–3. 1. [PubMed: 15531401]Green MF, Nuechterlein KH, Kern RS, Baade LE, Fenton WS, Gold JM, Keefe RS, Mesholam-Gately
R, Seidman LJ, Stover E, Marder SR. Functional co-primary measures for clinical trials inschizophrenia: Results from the MATRICS Psychometric and Standardization Study. AmericanJournal of Psychiatry. 2008; 165:221–228. [PubMed: 18172017]
Hyman S, Fenton W. What are the right targets for psychopharmacology? Science. 2003; 299:350–351. [PubMed: 12532001]
Reise et al. Page 17
Psychol Assess. Author manuscript; available in PMC 2012 March 1.
NIH
-PA Author Manuscript
NIH
-PA Author Manuscript
NIH
-PA Author Manuscript
Immekus JC, Imbrie PK. Dimensionality assessment using the full-information item bifactor analysisfor graded response data. Educational and Psychological Measurement. 2008; 68:695–709.
Keefe R, Poe M, Walker T, Kang J, Harvey P. The schizophrenia cognition rating scale: an interview-based assessment and its relationship to cognition, real-world functioning, and functional capacity.American Journal of Psychiatry. 2006; 163:426–432. [PubMed: 16513863]
McDonald RP. The dimensionality of tests and items. British Journal of Mathematical and StatisticalPsychology. 1981; 34:100–117.
McDonald, RP. Test theory: A unified Approach. Mahwah, NJ: Erlbaum; 1999.McDonald RP. A basis for multidimensional item response theory. Applied Psychological
Measurement. 2000; 24:99–114.Mislevy RJ, Bock DR. Adaptive EAP estimation of ability in a microcomputer environment. Applied
Psychological Measurement. 1982; 6:431–444.Nuechterlein KH, Barch DM, Gold JM, Goldberg TE, Green MF, Heaton RK. Identification of
separable cognitive factors in schizophrenia. Schizophrenia Research. 2004; 72:29–39. [PubMed:15531405]
Nuechterlein KH, Green MF, Kern RS, Baade LE, Barch DM, Cohen JD, Essock S, Fenton WS, FreseFJ3rd, Gold JM, Goldberg T, Heaton RK, Keefe RS, Kraemer H, Mesholam-Gately R, SeidmanLJ, Stover E, Weinberger DR, Young AS, Zalcman S, Marder SR. The MATRICS ConsensusCognitive Battery, part 1: Test selection, reliability, and validity. American Journal of Psychiatry.2008; 165:203–213. [PubMed: 18172019]
Ostini, R.; Nering, ML. Polytomous item response theory models. Thousand Oaks, CA: Sage; 2006.R Development Core Team. R: A language and environment for statistical computing. R Foundation
for Statistical Computing. Vienna, Austria: 2008. ISBN 3-900051-07-0, URLhttp://www.R-project.org
Reise SP, Waller NG. Item response theory and clinical measurement. Annual Review of ClinicalPsychology. 2009; 5:27–48.
Reise SP, Morizot J, Hays RD. The role of the bi-factor model in resolving dimensionality issues inhealth outcomes measures. Medical Care. 2007; 16:19–31.
Revelle, W. psych: Procedures for Psychological, Psychometric, and Personality Research. R packageversion 1.0–68. 2009. http://personality-project.org/r/psych.manual.pdf
Samejima F. Estimation of latent trait ability using a response pattern of graded scores. PsychometrikaMonograph Suppl. 1969:17.
Schmid J, Lieman JM. The development of hierarchical factor solutions. Psychometrika. 1957; 22:53–61.
Thissen, D. MULTILOG user’s guide: Multiple, categorical item analysis and test scoring using itemresponse theory. Chicago: Scientific Software; 1991. (Version 6.0) [Software manual]
Ventura J, Green MF, Shaner A, Liberman RP. Training and quality assurance on the Brief PsychiatricRating Scale: the "drift busters". International Journal of Methods in Psychiatric Research. 1993;3:221–224.
Ventura J, Cienfuegos A, Boxer O, Bilder R. Clinical global impression of cognition in schizophrenia(CGI-Cogs): reliability and validity of a co-primary measure of cognition. SchizophreniaResearch. 2008; 106:59–69. [PubMed: 17900866]
Ventura J, Reise SP, Keefe R, Baade LE, Gold JE, Green MF, et al. The cognitive assessmentinterview (CAI): Validation of an empirically derived, brief interview-based measure of cognition.(under review).
Wainer, H.; Dorans, NJ.; Eignor, D.; Flaugher, R.; Green, BF., et al. Computerized adaptive testing: Aprimer 2nd Edition. Mahwah: NJ: Erlbaum; 2000.
Wolff H, Preising K. Exploring item and higher-order factor structure with the Schmid-Leimansolution: Syntax codes for SPSS and SAS. Behavior Research Methods. 2005; 37:45–58.
Reise et al. Page 18
Psychol Assess. Author manuscript; available in PMC 2012 March 1.
NIH
-PA Author Manuscript
NIH
-PA Author Manuscript
NIH
-PA Author Manuscript
Figure 1.Category Response Curves: SCoRS #13 Stay Focused.
Reise et al. Page 19
Psychol Assess. Author manuscript; available in PMC 2012 March 1.
NIH
-PA Author Manuscript
NIH
-PA Author Manuscript
NIH
-PA Author Manuscript
Figure 2.Item Information Functions CGI-CogS #14 Versus SCoRS #9.
Reise et al. Page 20
Psychol Assess. Author manuscript; available in PMC 2012 March 1.
NIH
-PA Author Manuscript
NIH
-PA Author Manuscript
NIH
-PA Author Manuscript

Figure 3.Item Information Functions CGI-CogS #11 Versus CGI-CogS #4.
Reise et al. Page 21
Psychol Assess. Author manuscript; available in PMC 2012 March 1.
NIH
-PA Author Manuscript
NIH
-PA Author Manuscript
NIH
-PA Author Manuscript
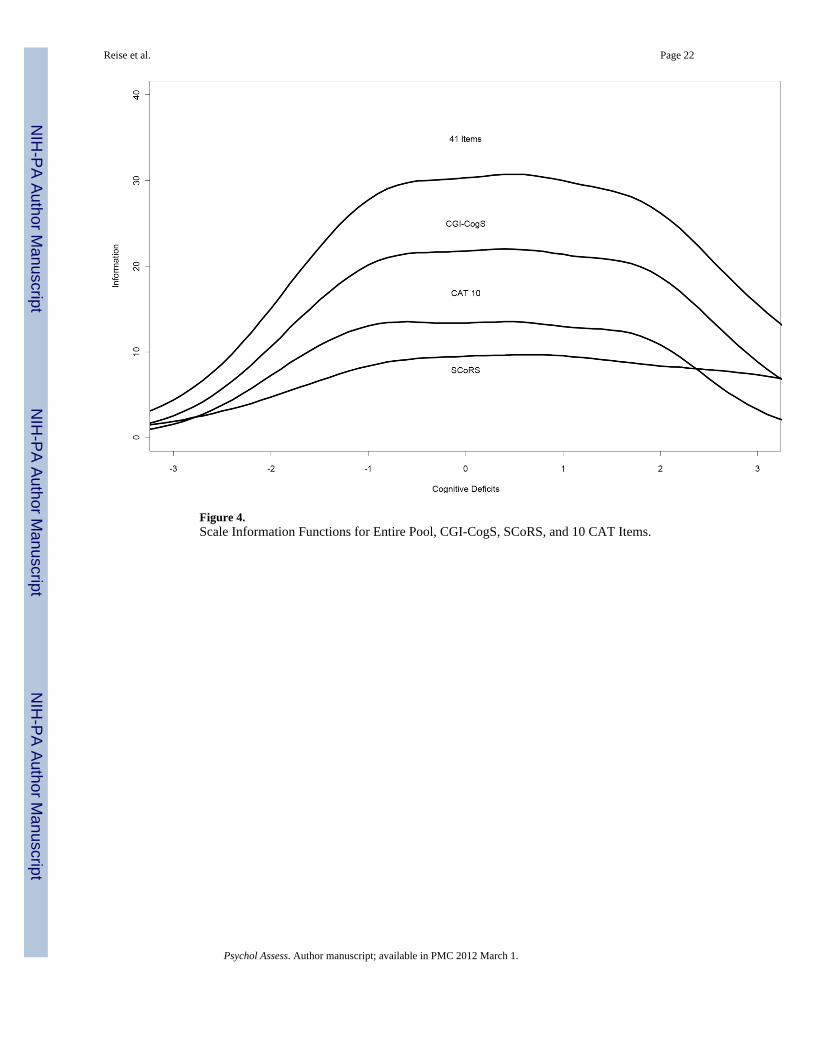
Figure 4.Scale Information Functions for Entire Pool, CGI-CogS, SCoRS, and 10 CAT Items.
Reise et al. Page 22
Psychol Assess. Author manuscript; available in PMC 2012 March 1.
NIH
-PA Author Manuscript
NIH
-PA Author Manuscript
NIH
-PA Author Manuscript
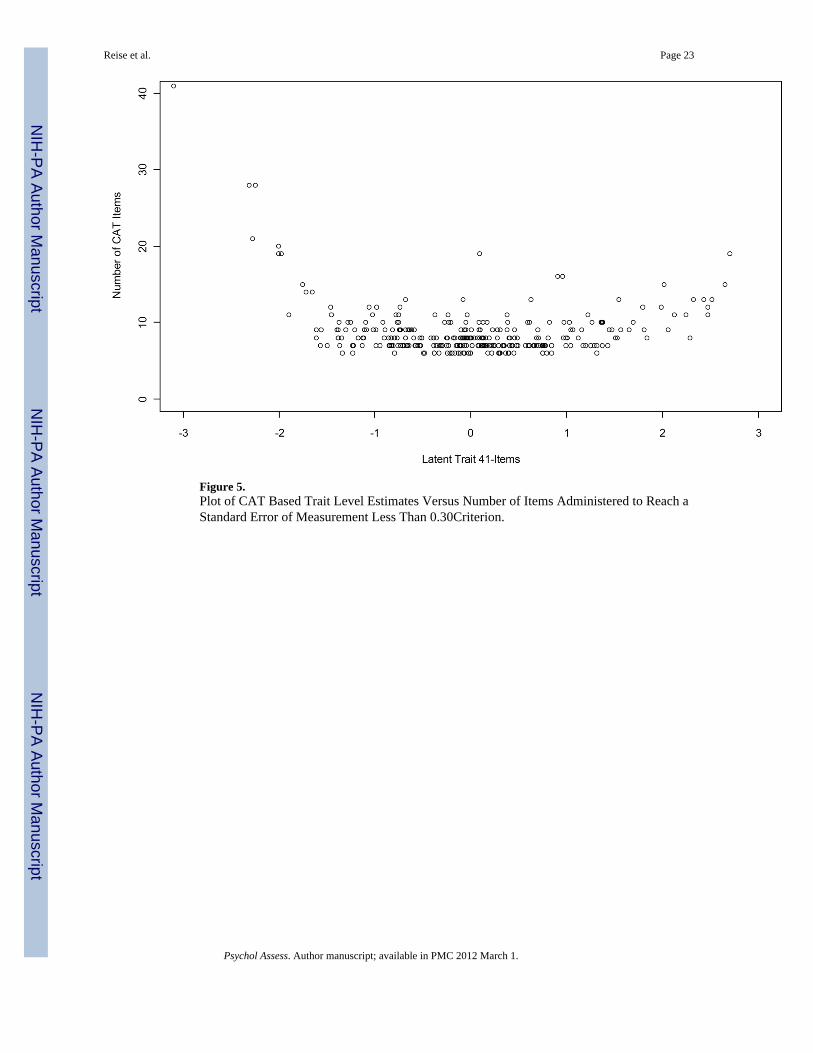
Figure 5.Plot of CAT Based Trait Level Estimates Versus Number of Items Administered to Reach aStandard Error of Measurement Less Than 0.30Criterion.
Reise et al. Page 23
Psychol Assess. Author manuscript; available in PMC 2012 March 1.
NIH
-PA Author Manuscript
NIH
-PA Author Manuscript
NIH
-PA Author Manuscript
NIH
-PA Author Manuscript
NIH
-PA Author Manuscript
NIH
-PA Author Manuscript
Reise et al. Page 24
Tabl
e 1
Abb
revi
ated
Item
Con
tent
and
Des
crip
tive
Stat
istic
s For
the
CG
I-C
ogS
Scal
e
Res
pons
e Pr
opor
tions
Item
#C
ogni
tive
Impa
irm
enta
Mea
nSt
d.D
ev.
Item
-te
st1
23
45b
CG
I 1N
ewly
Lea
rned
Info
rmat
ion
2.94
1.01
.71
6.0
28.8
37.3
20.7
7.2
CG
I 2O
n th
e Sp
ot M
anip
ulat
ion
2.75
1.24
.71
21.0
20.4
30.1
19.4
9.1
CG
I 3Su
stai
ned
Con
cent
ratio
n3.
071.
10.6
610
.317
.934
.529
.28.
2
CG
I 4Fo
cus o
n In
form
atio
n2.
341.
14.7
427
.633
.220
.714
.44.
1
CG
I 5Ig
nore
Dis
tract
ing
Even
ts3.
111.
11.6
19.
417
.936
.126
.010
.7
CG
I 6Le
arn
/ Rem
embe
r Ver
bal M
ater
ial
3.10
1.09
.69
8.5
18.8
37.6
34.5
10.7
CG
I 7R
ecal
l Rec
ent E
vent
s2.
241.
09.6
430
.432
.921
.911
.92.
8
CG
I 8R
emem
berin
g M
ater
ial S
een
1.97
1.00
.64
40.4
31.7
20.1
6.3
1.6
CG
I 9Le
arni
ng N
ew R
oute
s2.
401.
19.5
727
.630
.421
.914
.16.
0
CG
I 10
Rec
allin
g Lo
catio
ns2.
271.
17.6
032
.929
.220
.413
.54.
1
CG
I 11
Initi
ate
Atte
mpt
s to
Solv
e Pr
oble
ms
3.12
1.18
.72
11.3
17.2
32.9
25.4
13.2
CG
I 12
Lack
of F
lexi
bilit
y2.
851.
17.7
016
.620
.133
.521
.61.
8
CG
I 13
Lack
of P
ersi
sten
ce2.
641.
23.6
522
.624
.827
.316
.98.
5
CG
I 14
Judg
men
t in
Soci
al S
ituat
ions
2.64
1.23
.77
19.7
31.3
24.5
14.4
10.0
CG
I 15
Perf
orm
s Tas
ks S
low
ly2.
561.
23.6
827
.021
.625
.720
.15.
6
CG
I 16
Slow
Con
vers
atio
n2.
081.
14.6
240
.129
.216
.610
.73.
4
CG
I 17
Mov
es S
low
ly1.
811.
00.5
051
.126
.614
.46.
31.
6
CG
I 18
Aff
ect P
erce
ptio
n2.
551.
27.6
729
.219
.425
.119
.76.
6
CG
I 19
App
reci
ate
Inte
ntio
ns2.
831.
18.7
215
.723
.532
.618
.59.
7
CG
I 20
App
reci
ate
Hum
or2.
571.
26.6
326
.323
.824
.118
.27.
5
CG
I 21
Rec
ipro
cal C
omm
unic
atio
n2.
321.
20.6
633
.523
.824
.513
.54.
7
Not
e. N
= 3
19. T
he re
spon
se c
ateg
orie
s are
anc
hore
d as
1 =
no
impa
irmen
t, 2
= m
inim
al im
pairm
ent,
3 =
mild
, 4 =
mod
erat
e, a
nd 5
= se
rious
impa
irmen
t.
a Cog
nitiv
e im
pairm
ent r
efer
s to
the
spec
ific
cogn
itive
def
icit
the
item
was
des
igne
d to
ass
ess.
b The
orig
inal
num
ber o
f res
pons
e ca
tego
ries w
as se
ven.
How
ever
, due
to a
lack
of r
atin
gs in
the
high
est c
ateg
orie
s, ra
tings
in c
ateg
orie
s six
(sev
ere)
and
seve
n (s
ever
e/da
nger
ous)
wer
e co
llaps
ed a
nd ra
ted
as a
five
(ser
ious
).
Psychol Assess. Author manuscript; available in PMC 2012 March 1.
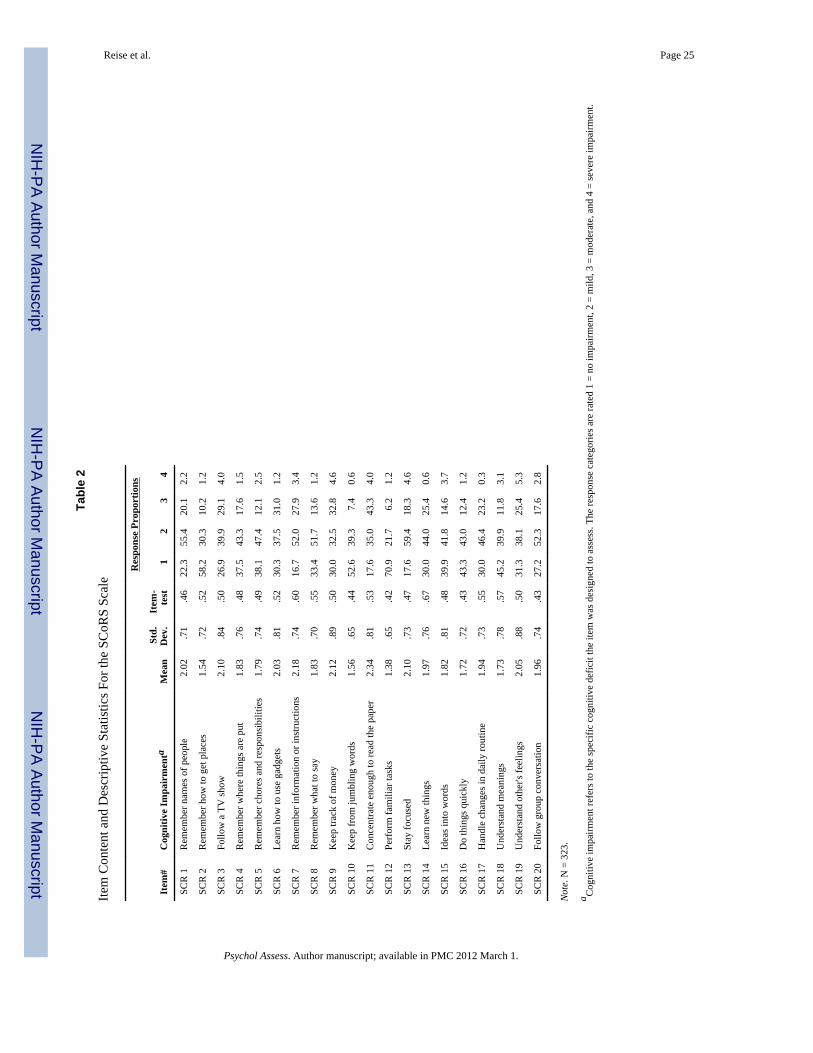
NIH
-PA Author Manuscript
NIH
-PA Author Manuscript
NIH
-PA Author Manuscript
Reise et al. Page 25
Tabl
e 2
Item
Con
tent
and
Des
crip
tive
Stat
istic
s For
the
SCoR
S Sc
ale
Res
pons
e Pr
opor
tions
Item
#C
ogni
tive
Impa
irm
enta
Mea
nSt
d.D
ev.
Item
-te
st1
23
4
SCR
1R
emem
ber n
ames
of p
eopl
e2.
02.7
1.4
622
.355
.420
.12.
2
SCR
2R
emem
ber h
ow to
get
pla
ces
1.54
.72
.52
58.2
30.3
10.2
1.2
SCR
3Fo
llow
a T
V sh
ow2.
10.8
4.5
026
.939
.929
.14.
0
SCR
4R
emem
ber w
here
thin
gs a
re p
ut1.
83.7
6.4
837
.543
.317
.61.
5
SCR
5R
emem
ber c
hore
s and
resp
onsi
bilit
ies
1.79
.74
.49
38.1
47.4
12.1
2.5
SCR
6Le
arn
how
to u
se g
adge
ts2.
03.8
1.5
230
.337
.531
.01.
2
SCR
7R
emem
ber i
nfor
mat
ion
or in
stru
ctio
ns2.
18.7
4.6
016
.752
.027
.93.
4
SCR
8R
emem
ber w
hat t
o sa
y1.
83.7
0.5
533
.451
.713
.61.
2
SCR
9K
eep
track
of m
oney
2.12
.89
.50
30.0
32.5
32.8
4.6
SCR
10
Kee
p fr
om ju
mbl
ing
wor
ds1.
56.6
5.4
452
.639
.37.
40.
6
SCR
11
Con
cent
rate
eno
ugh
to re
ad th
e pa
per
2.34
.81
.53
17.6
35.0
43.3
4.0
SCR
12
Perf
orm
fam
iliar
task
s1.
38.6
5.4
270
.921
.76.
21.
2
SCR
13
Stay
focu
sed
2.10
.73
.47
17.6
59.4
18.3
4.6
SCR
14
Lear
n ne
w th
ings
1.97
.76
.67
30.0
44.0
25.4
0.6
SCR
15
Idea
s int
o w
ords
1.82
.81
.48
39.9
41.8
14.6
3.7
SCR
16
Do
thin
gs q
uick
ly1.
72.7
2.4
343
.343
.012
.41.
2
SCR
17
Han
dle
chan
ges i
n da
ily ro
utin
e1.
94.7
3.5
530
.046
.423
.20.
3
SCR
18
Und
erst
and
mea
ning
s1.
73.7
8.5
745
.239
.911
.83.
1
SCR
19
Und
erst
and
othe
r's fe
elin
gs2.
05.8
8.5
031
.338
.125
.45.
3
SCR
20
Follo
w g
roup
con
vers
atio
n1.
96.7
4.4
327
.252
.317
.62.
8
Not
e. N
= 3
23.
a Cog
nitiv
e im
pairm
ent r
efer
s to
the
spec
ific
cogn
itive
def
icit
the
item
was
des
igne
d to
ass
ess.
The
resp
onse
cat
egor
ies a
re ra
ted
1 =
no im
pairm
ent,
2 =
mild
, 3 =
mod
erat
e, a
nd 4
= se
vere
impa
irmen
t.
Psychol Assess. Author manuscript; available in PMC 2012 March 1.
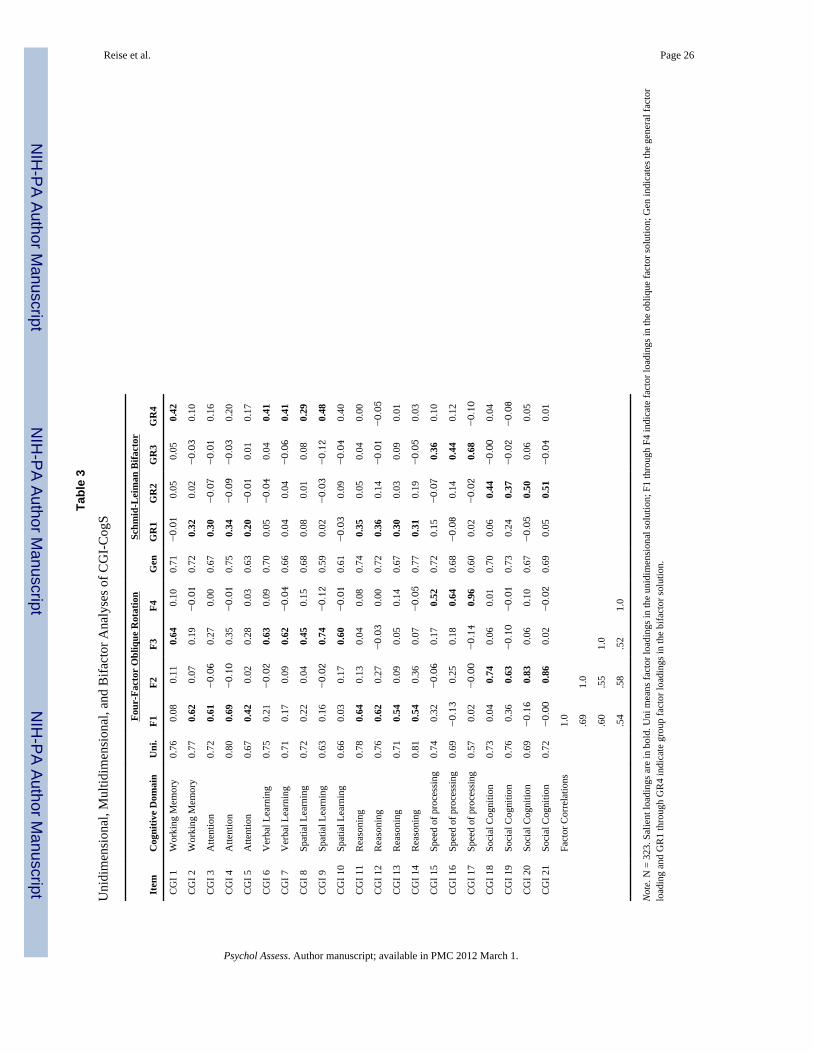
NIH
-PA Author Manuscript
NIH
-PA Author Manuscript
NIH
-PA Author Manuscript
Reise et al. Page 26
Tabl
e 3
Uni
dim
ensi
onal
, Mul
tidim
ensi
onal
, and
Bifa
ctor
Ana
lyse
s of C
GI-
Cog
S
Four
-Fac
tor
Obl
ique
Rot
atio
nSc
hmid
-Lei
man
Bifa
ctor
Item
Cog
nitiv
e D
omai
nU
ni.
F1F2
F3F4
Gen
GR
1G
R2
GR
3G
R4
CG
I 1W
orki
ng M
emor
y0.
76 0
.08
0.1
1 0
.64
0.1
00.
71−0.
01 0
.05
0.0
5 0
.42
CG
I 2W
orki
ng M
emor
y0.
77 0
.62
0.0
7 0
.19
−0.
010.
72 0
.32
0.0
2−0.
03 0
.10
CG
I 3A
ttent
ion
0.72
0.6
1−0.
06 0
.27
0.0
00.
67 0
.30
−0.
07−0.
01 0
.16
CG
I 4A
ttent
ion
0.80
0.6
9−0.
10 0
.35
−0.
010.
75 0
.34
−0.
09−0.
03 0
.20
CG
I 5A
ttent
ion
0.67
0.4
2 0
.02
0.2
8 0
.03
0.63
0.2
0−0.
01 0
.01
0.1
7
CG
I 6V
erba
l Lea
rnin
g0.
75 0
.21
−0.
02 0
.63
0.0
90.
70 0
.05
−0.
04 0
.04
0.4
1
CG
I 7V
erba
l Lea
rnin
g0.
71 0
.17
0.0
9 0
.62
−0.
040.
66 0
.04
0.0
4−0.
06 0
.41
CG
I 8Sp
atia
l Lea
rnin
g0.
72 0
.22
0.0
4 0
.45
0.1
50.
68 0
.08
0.0
1 0
.08
0.2
9
CG
I 9Sp
atia
l Lea
rnin
g0.
63 0
.16
−0.
02 0
.74
−0.
120.
59 0
.02
−0.
03−0.
12 0
.48
CG
I 10
Spat
ial L
earn
ing
0.66
0.0
3 0
.17
0.6
0−0.
010.
61−0.
03 0
.09
−0.
04 0
.40
CG
I 11
Rea
soni
ng0.
78 0
.64
0.1
3 0
.04
0.0
80.
74 0
.35
0.0
5 0
.04
0.0
0
CG
I 12
Rea
soni
ng0.
76 0
.62
0.2
7−0.
03 0
.00
0.72
0.3
6 0
.14
−0.
01−0.
05
CG
I 13
Rea
soni
ng0.
71 0
.54
0.0
9 0
.05
0.1
40.
67 0
.30
0.0
3 0
.09
0.0
1
CG
I 14
Rea
soni
ng0.
81 0
.54
0.3
6 0
.07
−0.
050.
77 0
.31
0.1
9−0.
05 0
.03
CG
I 15
Spee
d of
pro
cess
ing
0.74
0.3
2−0.
06 0
.17
0.5
20.
72 0
.15
−0.
07 0
.36
0.1
0
CG
I 16
Spee
d of
pro
cess
ing
0.69
−0.
13 0
.25
0.1
8 0
.64
0.68
−0.
08 0
.14
0.4
4 0
.12
CG
I 17
Spee
d of
pro
cess
ing
0.57
0.0
2−0.
00−0.
14 0
.96
0.60
0.0
2−0.
02 0
.68
−0.
10
CG
I 18
Soci
al C
ogni
tion
0.73
0.0
4 0
.74
0.0
6 0
.01
0.70
0.0
6 0
.44
−0.
00 0
.04
CG
I 19
Soci
al C
ogni
tion
0.76
0.3
6 0
.63
−0.
10−0.
010.
73 0
.24
0.3
7−0.
02−0.
08
CG
I 20
Soci
al C
ogni
tion
0.69
−0.
16 0
.83
0.0
6 0
.10
0.67
−0.
05 0
.50
0.0
6 0
.05
CG
I 21
Soci
al C
ogni
tion
0.72
−0.
00 0
.86
0.0
2−0.
020.
69 0
.05
0.5
1−0.
04 0
.01
Fact
or C
orre
latio
ns1.
0
.69
1.0
.60
.55
1.0
.54
.58
.52
1.0
Not
e. N
= 3
23. S
alie
nt lo
adin
gs a
re in
bol
d. U
ni m
eans
fact
or lo
adin
gs in
the
unid
imen
sion
al so
lutio
n; F
1 th
roug
h F4
indi
cate
fact
or lo
adin
gs in
the
obliq
ue fa
ctor
solu
tion;
Gen
indi
cate
s the
gen
eral
fact
orlo
adin
g an
d G
R1
thro
ugh
GR
4 in
dica
te g
roup
fact
or lo
adin
gs in
the
bifa
ctor
solu
tion.
Psychol Assess. Author manuscript; available in PMC 2012 March 1.

NIH
-PA Author Manuscript
NIH
-PA Author Manuscript
NIH
-PA Author Manuscript
Reise et al. Page 27
Tabl
e 4
Uni
dim
ensi
onal
, Mul
tidim
ensi
onal
, and
Bifa
ctor
Ana
lyse
s of S
CoR
S
Uni
.Fo
ur-F
acto
r O
bliq
ue R
otat
ion
Schm
id-L
eim
an B
ifact
or
Item
Cog
nitiv
e D
omai
nF1
F2F3
F4G
enG
R1
GR
2G
R3
GR
4
SCR
1M
emor
y0.
55−0.
23 0
.68
0.2
3 0
.08
0.50
−0.
47 0
.16
−0.
13−0.
06
SCR
2M
emor
y0.
65 0
.27
0.4
6−0.
06 0
.14
0.57
−0.
35−0.
17 0
.07
−0.
10
SCR
3A
ttent
ion
0.57
0.5
1 0
.06
−0.
00 0
.12
0.52
−0.
05−0.
33 0
.01
−0.
07
SCR
4M
emor
y0.
57 0
.06
0.4
7 0
.06
0.1
40.
51−0.
34−0.
04−0.
02−0.
10
SCR
5M
emor
y0.
59−0.
01 0
.27
−0.
06 0
.66
0.56
−0.
17 0
.02
0.0
9−0.
50
SCR
6Le
arni
ng0.
61 0
.45
0.2
8 0
.15
−0.
170.
54−0.
22−0.
29−0.
11 0
.15
SCR
7Pr
oble
m S
olvi
ng0.
70 0
.27
0.7
4−0.
09−0.
030.
62−0.
57−0.
17 0
.09
0.0
4
SCR
8W
. Mem
0.65
−0.
14 0
.47
0.5
9−0.
040.
61−0.
29 0
.11
−0.
39 0
.05
SCR
9Pr
oble
m S
olvi
ng0.
58 0
.45
0.0
4−0.
07 0
.33
0.54
−0.
03−0.
29 0
.07
−0.
23
SCR
10
Spee
d0.
53 0
.24
0.2
2 0
.20
−0.
000.
48−0.
16−0.
15−0.
13 0
.02
SCR
11
Atte
ntio
n0.
61 0
.58
0.0
8 0
.09
−0.
030.
55−0.
07−0.
38−0.
06 0
.05
SCR
12
Prob
lem
Sol
ving
0.54
0.0
3−0.
03 0
.10
0.7
10.
54 0
.08
−0.
01−0.
03−0.
53
SCR
13
Atte
ntio
n0.
53 0
.51
0.0
5 0
.06
0.0
10.
48−0.
04−0.
33−0.
04 0
.01
SCR
14
Lear
ning
0.79
0.2
5 0
.42
0.2
3 0
.09
0.71
−0.
30−0.
15−0.
14−0.
05
SCR
15
W. M
em0.
55−0.
04 0
.09
0.6
0 0
.10
0.54
−0.
01 0
.04
−0.
40−0.
07
SCR
16
Spee
d0.
50−0.
03 0
.03
0.3
5 0
.37
0.50
0.0
3 0
.03
−0.
21−0.
27
SCR
17
Prob
. Sol
ving
0.63
0.4
0−0.
09 0
.17
0.3
50.
61 0
.09
−0.
25−0.
10−0.
24
SCR
18
Soci
al C
og.
0.65
0.2
2 0
.11
0.6
2−0.
130.
62−0.
04−0.
14−0.
43 0
.13
SCR
19
Soci
al C
og.
0.58
0.2
1−0.
15 0
.57
0.1
40.
57 0
.17
−0.
12−0.
39−0.
08
SCR
20
Soci
al C
og.
0.49
0.7
6−0.
13−0.
05 0
.00
0.45
0.0
8−0.
49 0
.03
0.0
2
Fact
or C
orre
latio
ns1.
0
.54
1.0
.51
.44
1.0
.49
.35
.44
1.0
Not
e. N
= 3
19. S
alie
nt lo
adin
gs a
re in
bol
d. U
ni m
eans
fact
or lo
adin
gs in
the
unid
imen
sion
al so
lutio
n; F
1 th
roug
h F4
indi
cate
fact
or lo
adin
gs in
the
obliq
ue fa
ctor
solu
tion;
Gen
indi
cate
s the
gen
eral
fact
orlo
adin
g an
d G
R1
thro
ugh
GR
4 in
dica
te g
roup
fact
or lo
adin
gs in
the
bifa
ctor
solu
tion.
Psychol Assess. Author manuscript; available in PMC 2012 March 1.
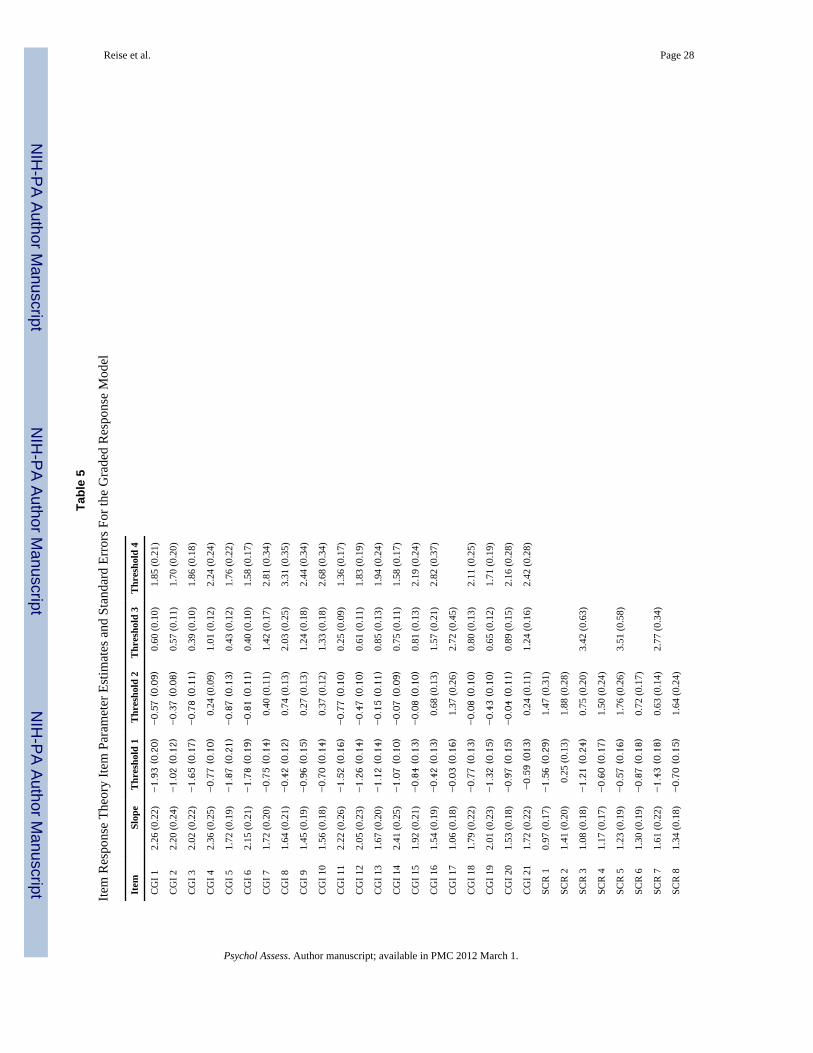
NIH
-PA Author Manuscript
NIH
-PA Author Manuscript
NIH
-PA Author Manuscript
Reise et al. Page 28
Tabl
e 5
Item
Res
pons
e Th
eory
Item
Par
amet
er E
stim
ates
and
Sta
ndar
d Er
rors
For
the
Gra
ded
Res
pons
e M
odel
Item
Slop
eT
hres
hold
1T
hres
hold
2T
hres
hold
3T
hres
hold
4
CG
I 12.
26 (0
.22)
−1.
93 (0.
20)
−0.
57 (0.
09)
0.60
(0.1
0)1.
85 (0
.21)
CG
I 22.
20 (0
.24)
−1.
02 (0.
12)
−0.
37 (0.
08)
0.57
(0.1
1)1.
70 (0
.20)
CG
I 32.
02 (0
.22)
−1.
65 (0.
17)
−0.
78 (0.
11)
0.39
(0.1
0)1.
86 (0
.18)
CG
I 42.
36 (0
.25)
−0.
77 (0.
10)
0.24
(0.0
9)1.
01 (0
.12)
2.24
(0.2
4)
CG
I 51.
72 (0
.19)
−1.
87 (0.
21)
−0.
87 (0.
13)
0.43
(0.1
2)1.
76 (0
.22)
CG
I 62.
15 (0
.21)
−1.
78 (0.
19)
−0.
81 (0.
11)
0.40
(0.1
0)1.
58 (0
.17)
CG
I 71.
72 (0
.20)
−0.
75 (0.
14)
0.40
(0.1
1)1.
42 (0
.17)
2.81
(0.3
4)
CG
I 81.
64 (0
.21)
−0.
42 (0.
12)
0.74
(0.1
3)2.
03 (0
.25)
3.31
(0.3
5)
CG
I 91.
45 (0
.19)
−0.
96 (0.
15)
0.27
(0.1
3)1.
24 (0
.18)
2.44
(0.3
4)
CG
I 10
1.56
(0.1
8)−0.
70 (0.
14)
0.37
(0.1
2)1.
33 (0
.18)
2.68
(0.3
4)
CG
I 11
2.22
(0.2
6)−1.
52 (0.
16)
−0.
77 (0.
10)
0.25
(0.0
9)1.
36 (0
.17)
CG
I 12
2.05
(0.2
3)−1.
26 (0.
14)
−0.
47 (0.
10)
0.61
(0.1
1)1.
83 (0
.19)
CG
I 13
1.67
(0.2
0)−1.
12 (0.
14)
−0.
15 (0.
11)
0.85
(0.1
3)1.
94 (0
.24)
CG
I 14
2.41
(0.2
5)−1.
07 (0.
10)
−0.
07 (0.
09)
0.75
(0.1
1)1.
58 (0
.17)
CG
I 15
1.92
(0.2
1)−0.
84 (0.
13)
−0.
08 (0.
10)
0.81
(0.1
3)2.
19 (0
.24)
CG
I 16
1.54
(0.1
9)−0.
42 (0.
13)
0.68
(0.1
3)1.
57 (0
.21)
2.82
(0.3
7)
CG
I 17
1.06
(0.1
8)−0.
03 (0.
16)
1.37
(0.2
6)2.
72 (0
.45)
CG
I 18
1.79
(0.2
2)−0.
77 (0.
13)
−0.
08 (0.
10)
0.80
(0.1
3)2.
11 (0
.25)
CG
I 19
2.01
(0.2
3)−1.
32 (0.
15)
−0.
43 (0.
10)
0.65
(0.1
2)1.
71 (0
.19)
CG
I 20
1.53
(0.1
8)−0.
97 (0.
15)
−0.
04 (0.
11)
0.89
(0.1
5)2.
16 (0
.28)
CG
I 21
1.72
(0.2
2)−0.
59 (01
3)0.
24 (0
.11)
1.24
(0.1
6)2.
42 (0
.28)
SCR
10.
97 (0
.17)
−1.
56 (0.
29)
1.47
(0.3
1)
SCR
21.
41 (0
.20)
0.25
(0.1
3)1.
88 (0
.28)
SCR
31.
08 (0
.18)
−1.
21 (0.
24)
0.75
(0.2
0)3.
42 (0
.63)
SCR
41.
17 (0
.17)
−0.
60 (0.
17)
1.50
(0.2
4)
SCR
51.
23 (0
.19)
−0.
57 (0.
16)
1.76
(0.2
6)3.
51 (0
.58)
SCR
61.
30 (0
.19)
−0.
87 (0.
18)
0.72
(0.1
7)
SCR
71.
61 (0
.22)
−1.
43 (0.
18)
0.63
(0.1
4)2.
77 (0
.34)
SCR
81.
34 (0
.18)
−0.
70 (0.
15)
1.64
(0.2
4)
Psychol Assess. Author manuscript; available in PMC 2012 March 1.
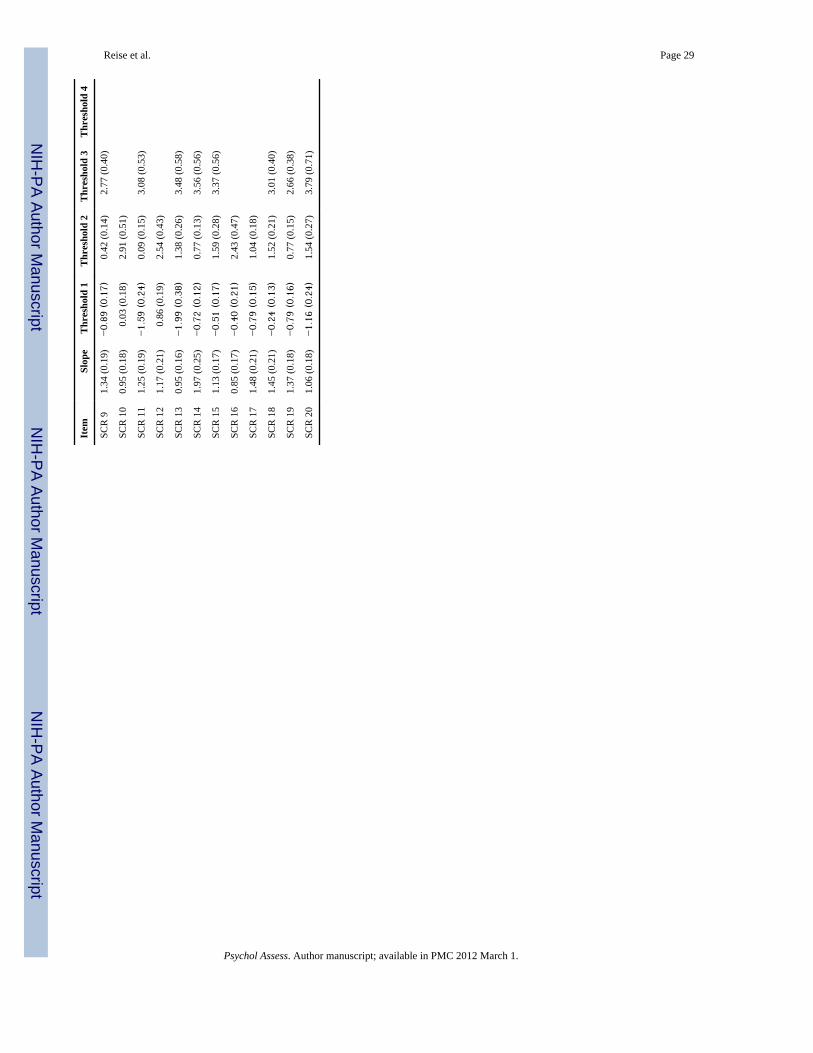
NIH
-PA Author Manuscript
NIH
-PA Author Manuscript
NIH
-PA Author Manuscript
Reise et al. Page 29
Item
Slop
eT
hres
hold
1T
hres
hold
2T
hres
hold
3T
hres
hold
4
SCR
91.
34 (0
.19)
−0.
89 (0.
17)
0.42
(0.1
4)2.
77 (0
.40)
SCR
10
0.95
(0.1
8)0.
03 (0
.18)
2.91
(0.5
1)
SCR
11
1.25
(0.1
9)−1.
59 (0.
24)
0.09
(0.1
5)3.
08 (0
.53)
SCR
12
1.17
(0.2
1)0.
86 (0
.19)
2.54
(0.4
3)
SCR
13
0.95
(0.1
6)−1.
99 (0.
38)
1.38
(0.2
6)3.
48 (0
.58)
SCR
14
1.97
(0.2
5)−0.
72 (0.
12)
0.77
(0.1
3)3.
56 (0
.56)
SCR
15
1.13
(0.1
7)−0.
51 (0.
17)
1.59
(0.2
8)3.
37 (0
.56)
SCR
16
0.85
(0.1
7)−0.
40 (0.
21)
2.43
(0.4
7)
SCR
17
1.48
(0.2
1)−0.
79 (0.
15)
1.04
(0.1
8)
SCR
18
1.45
(0.2
1)−0.
24 (0.
13)
1.52
(0.2
1)3.
01 (0
.40)
SCR
19
1.37
(0.1
8)−0.
79 (0.
16)
0.77
(0.1
5)2.
66 (0
.38)
SCR
20
1.06
(0.1
8)−1.
16 (0.
24)
1.54
(0.2
7)3.
79 (0
.71)
Psychol Assess. Author manuscript; available in PMC 2012 March 1.