Embed Size (px)
Citation preview
Molecular Cell
Article
RBM5, 6, and 10 Differentially RegulateNUMB Alternative Splicing to ControlCancer Cell ProliferationElias G. Bechara,1,2 Endre Sebestyen,2 Isabella Bernardis,2 Eduardo Eyras,2,3 and Juan Valcarcel1,2,3,*1Centre de Regulacio Genomica2Universitat Pompeu Fabra3Institucio Catalana de Recerca i Estudis Avancats (ICREA)Dr. Aiguader, 88, 08003 Barcelona, Spain
*Correspondence: [email protected]
http://dx.doi.org/10.1016/j.molcel.2013.11.010
SUMMARY
RBM5, a regulator of alternative splicing of apoptoticgenes, and its highly homologous RBM6 and RBM10are RNA-binding proteins frequently deleted ormutated in lung cancer. We report that RBM5/6 andRBM10 antagonistically regulate the proliferative ca-pacity of cancer cells and display distinct positionaleffects in alternative splicing regulation. We identifythe Notch pathway regulator NUMB as a key targetof these factors in the control of cell proliferation.NUMB alternative splicing, which is frequentlyaltered in lung cancer, can regulate colony and xeno-graft tumor formation, and its modulation recapitu-lates or antagonizes the effects of RBM5, 6, and 10in cell colony formation. RBM10 mutations identifiedin lung cancer cells disrupt NUMB splicing regulationto promote cell growth. Our results reveal a key ge-netic circuit in the control of cancer cell proliferation.
INTRODUCTION
Lung cancer is the leading cause of cancer-related deaths
worldwide, 40% of which correspond to nonsmall cell lung ade-
nocarcinomas. RBM5 (also known as LUCA-15/H37), RBM6,
and RBM10 are highly similar RNA-binding motif proteins
sharing 30%–50% of amino acid sequence identity. RBM5 and
RBM6 genes map to chromosomal region 3p21.3, which is
frequently deleted in heavy smokers, lung cancer, and other
tissue carcinomas (Angeloni, 2007). RBM5 protein levels are
indeed downregulated in �75% of primary lung cancers (Oh
et al., 2002) as well as in prostate (Zhao et al., 2012) and in
some breast cancer samples (Edamatsu et al., 2000).Overex-
pression of RBM5 in breast cancer samples was also reported
(Oh et al., 1999; Rintala-Maki et al., 2007), suggesting that both
up- and downregulation of RBM5 could play a role in tumor pro-
gression. RBM6 and 10 also show altered expression in breast
cancer (Rintala-Maki et al., 2007). Downregulation of RBM5 is
considered one molecular signature associated with metastasis
720 Molecular Cell 52, 720–733, December 12, 2013 ª2013 Elsevier
in various solid tumors (Edamatsu et al., 2000; Ramaswamy
et al., 2003; Welling et al., 2002). More recently, RBM10 was
found to be among the most frequently mutated genes in lung
adenocarcinoma samples (Imielinski et al., 2012). The frequency
of genetic lesions affecting RBM5, 6, and 10 in lung and other
cancers suggests that disruption of the function of these proteins
can contribute to tumor progression.
Overexpression of RBM5 in various cell lines leads to growth
arrest, induction of apoptosis, and retarded tumor growth
when cells were injected in nude mice (Mourtada-Maarabouni
et al., 2002, 2003; Oh et al., 2002, 2006). RBM5-mediated
apoptosis is associated with upregulation of the proapoptotic
protein BAX and downregulation of the antiapoptotic proteins
BCL-2 and BCL-XL (Mourtada-Maarabouni et al., 2002; Oh
et al., 2006; Sutherland et al., 2001). Downregulation of RBM5
affects the transcript levels of 35 genes involved in the control
of cell proliferation and apoptosis (Mourtada-Maarabouni et al.,
2006), but the key targets of RBM5, 6, and 10 and the regulatory
mechanisms behind these properties remain poorly understood.
RBM 5, 6, and 10 contain domains characteristic of proteins
with functions in RNA metabolism and pre-mRNA splicing,
including two RNA recognition motifs (RRM), two Zinc fingers,
bipartite nuclear localization signals, a glycine(G)-patch, one
arginine/serine-rich domain, and an OCRE domain (which con-
sists of a repeated sequence of eight residues, organized around
a triplet of conserved aromatic amino acids) (Figure 1A). Consis-
tent with the presence of diverse RNA-binding domains, a variety
of sequences have been identified as bound by these proteins.
Thus, in vitro studies showed that RBM5 and 10 specifically
bind poly(G) RNA tracts in vitro (Edamatsu et al., 2000) and that
the RanBP-ZnF domain of these proteins binds with high affinity
to ANGUAA sequences (Nguyen et al., 2011). On the other hand,
the solution structure of the second RRM of RBM5 revealed spe-
cific recognition of both CU-rich and GA-rich sequences (Song
et al., 2012). Ex vivo and in vitro data revealed that RBM5 binds
to a U/C-rich sequence in the caspase-2 pre-mRNA (Fushimi
et al., 2008) and regulates alternative splicing of apoptosis-
related genes (Bonnal et al., 2008; Fushimi et al., 2008), modu-
lating the production of isoforms with antagonistic functions in
programmed cell death. It was also shown that RBM5 targets
late events in spliceosome assembly, acting as a switch for splice
site pairing in the Fas receptor (CD95/APO-1) pre-mRNA (Bonnal
Inc.
Contro
lRBM5 S
h
α-RBM10
α-RBM5
α-RBM6
α-Tubulin
Contro
lRBM6 S
h
Contro
lRBM10
Sh
Rel
ativ
e le
vels
of p
rote
ins
Contro
l
RBM5 Sh
RBM6 Sh
RBM10 S
h
Control
Num
ber
of c
olon
ies
95
110
130
A
B C
D E
F
0
400
800
600
200
RBM5 Sh RBM6 Sh RBM10 Sh
NLS
RS
RRM
RGG
ZnF
OCRE
G-Patch
RBM5
RBM6
RBM10
G
0
40
80
120
RBM5 Sh RBM6 Sh RBM10 Sh
RBM5 RBM6 RBM10
*****
***
0
1
2
3
4
RBM5 RBM6 RBM10
Exon
Intron
Promoter
Tail
IgG
KD
IgG
KD
+ UV - UV
RNASE1 RNASE1
- + ++ - + ++
95
110
130
95
110
130
RBM5
RBM6
RBM10
Fold
enr
iche
men
t
rela
tive
to s
eque
nce
leng
th
Low
er
expo
sure
Specific AB Specific AB
1 2 3 4 5 6 7 8 9 10 11
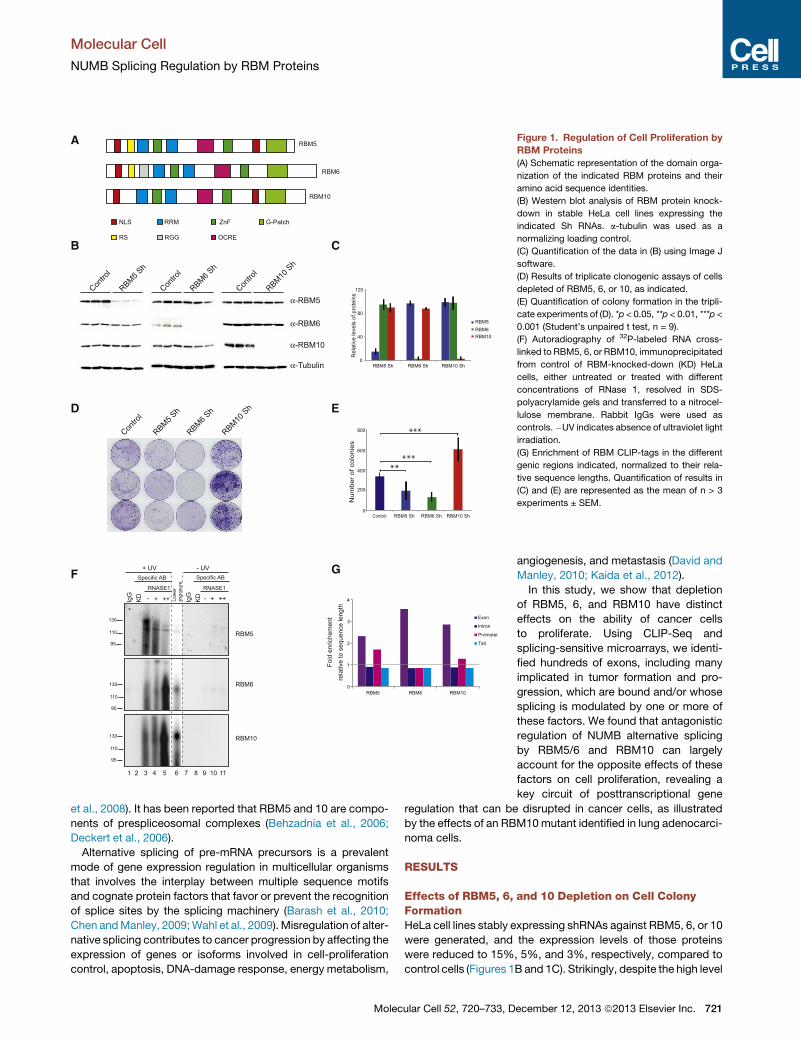
Figure 1. Regulation of Cell Proliferation by
RBM Proteins
(A) Schematic representation of the domain orga-
nization of the indicated RBM proteins and their
amino acid sequence identities.
(B) Western blot analysis of RBM protein knock-
down in stable HeLa cell lines expressing the
indicated Sh RNAs. a-tubulin was used as a
normalizing loading control.
(C) Quantification of the data in (B) using Image J
software.
(D) Results of triplicate clonogenic assays of cells
depleted of RBM5, 6, or 10, as indicated.
(E) Quantification of colony formation in the tripli-
cate experiments of (D). *p < 0.05, **p < 0.01, ***p <
0.001 (Student’s unpaired t test, n = 9).
(F) Autoradiography of 32P-labeled RNA cross-
linked to RBM5, 6, or RBM10, immunoprecipitated
from control of RBM-knocked-down (KD) HeLa
cells, either untreated or treated with different
concentrations of RNase 1, resolved in SDS-
polyacrylamide gels and transferred to a nitrocel-
lulose membrane. Rabbit IgGs were used as
controls.�UV indicates absence of ultraviolet light
irradiation.
(G) Enrichment of RBM CLIP-tags in the different
genic regions indicated, normalized to their rela-
tive sequence lengths. Quantification of results in
(C) and (E) are represented as the mean of n > 3
experiments ± SEM.
Molecular Cell
NUMB Splicing Regulation by RBM Proteins
et al., 2008). It has been reported that RBM5 and 10 are compo-
nents of prespliceosomal complexes (Behzadnia et al., 2006;
Deckert et al., 2006).
Alternative splicing of pre-mRNA precursors is a prevalent
mode of gene expression regulation in multicellular organisms
that involves the interplay between multiple sequence motifs
and cognate protein factors that favor or prevent the recognition
of splice sites by the splicing machinery (Barash et al., 2010;
Chen andManley, 2009;Wahl et al., 2009).Misregulation of alter-
native splicing contributes to cancer progression by affecting the
expression of genes or isoforms involved in cell-proliferation
control, apoptosis, DNA-damage response, energy metabolism,
Molecular Cell 52, 720–733, D
angiogenesis, and metastasis (David and
Manley, 2010; Kaida et al., 2012).
In this study, we show that depletion
of RBM5, 6, and RBM10 have distinct
effects on the ability of cancer cells
to proliferate. Using CLIP-Seq and
splicing-sensitive microarrays, we identi-
fied hundreds of exons, including many
implicated in tumor formation and pro-
gression, which are bound and/or whose
splicing is modulated by one or more of
these factors. We found that antagonistic
regulation of NUMB alternative splicing
by RBM5/6 and RBM10 can largely
account for the opposite effects of these
factors on cell proliferation, revealing a
key circuit of posttranscriptional gene
regulation that can be disrupted in cancer cells, as illustrated
by the effects of an RBM10mutant identified in lung adenocarci-
noma cells.
RESULTS
Effects of RBM5, 6, and 10 Depletion on Cell ColonyFormationHeLa cell lines stably expressing shRNAs against RBM5, 6, or 10
were generated, and the expression levels of those proteins
were reduced to 15%, 5%, and 3%, respectively, compared to
control cells (Figures 1B and 1C). Strikingly, despite the high level
ecember 12, 2013 ª2013 Elsevier Inc. 721
Molecular Cell
NUMB Splicing Regulation by RBM Proteins
of sequence similarity between these proteins, depletion of
RBM5 and 6 caused a pronounced decrease in the clonogenic
capacity of the cells, whereas depletion of RBM10 resulted in
enhanced cell colony formation and noticeably denser colonies
(Figures 1D and 1E). Equivalent results were obtained with a sec-
ond set of shRNAs (Figures S1A and S1B). We conclude that
RBM5/6 and RBM10 have opposite effects on the capacity of
cancer cells to form colonies and proliferate.
Transcriptome-wide Identification of RBM ProteinBinding SitesTo identify direct RNA-binding sites and potential target RNAs
regulated by RBM proteins, CLIP-Seq experiments were carried
out for each of the proteins in replicates as described (Konig
et al., 2010). After irradiation of the cells with ultraviolet light,
RBM/RNAs complexes were immunoprecipitated with specific
antibodies—and complexes between 125–145 KDa, 130–150
KDa, and 140–160 KDa corresponding respectively to RBM5/
RNA, RBM6/RNA, and RBM10/RNA crosslinked species were
isolated after fractionation by SDS-polyacrylamide gel electro-
phoresis (Figure 1F). No complexes were detected using a
control antibody nor in cells in which the factors were knocked
down (Figures 1F, lanes 1 and 2). After purification, RNAs were
reverse-transcribed, PCR amplified with barcoded primers,
and sequenced using Solexa (Illumina) technology. This yielded,
respectively, 133.079, 1.614.330, and 1.307.119 clusters of
reads uniquely mapped to the genome, excluding repeat ele-
ments and excluding clusters overlapping with equivalent posi-
tions in the IgG control. Results from biological replicates
showed Spearman correlation coefficients of R2 = 0.54, 0.85,
and 0.82 for RBM5, 6, and 10, thus providing a robust set of spe-
cific RNA/RBM interactions (Figure S1C).
Cluster mapping to genic regions showed that RBM binding
sites were mainly associated with intronic regions (81%, 76%,
and 79% of total clusters for RBM5, 6, and 10, respectively).
When normalized to the general distribution of intron/exon
lengths in the genome, however, binding sites were significantly
enriched in exonic regions (Figure 1G). Clusters mapped to a to-
tal number of 20,387 protein-coding genes (Figure S1D). Gene
ontology analysis of the extensive overlap of 9,402 genes using
the software GORILLA (Eden et al., 2009) showed enrichment
in pathways involved in apoptosis, cell adhesion, actin/cytoskel-
eton reorganization, and signal transduction (Figure S1E). This
enrichment is consistent with and expands a previous study
identifying 35 genes involved in the control of cell proliferation
and apoptosis as targets of RBM5 regulation (Mourtada-Maara-
bouni et al., 2006).
To investigate the distribution of RBMs binding sites relative
to exon-intron junctions, CLIP clusters were mapped to those
boundaries after normalizing by the length of exons and introns.
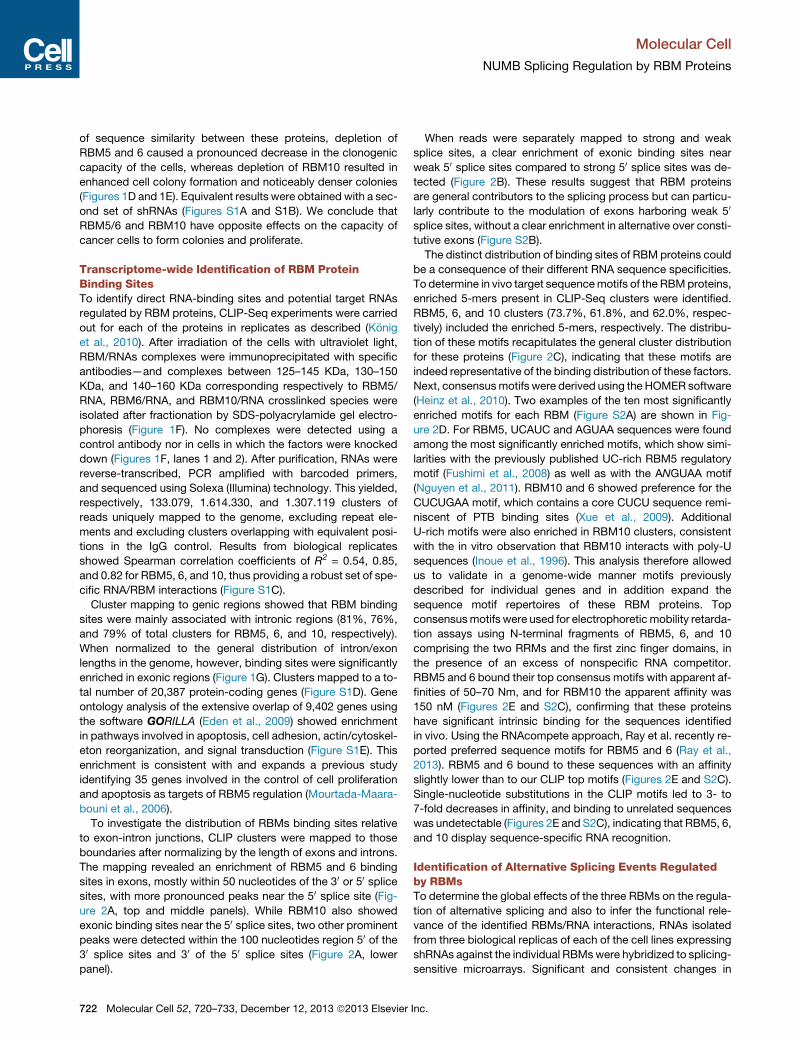
The mapping revealed an enrichment of RBM5 and 6 binding
sites in exons, mostly within 50 nucleotides of the 30 or 50 splicesites, with more pronounced peaks near the 50 splice site (Fig-
ure 2A, top and middle panels). While RBM10 also showed
exonic binding sites near the 50 splice sites, two other prominent
peaks were detected within the 100 nucleotides region 50 of the30 splice sites and 30 of the 50 splice sites (Figure 2A, lower
panel).
722 Molecular Cell 52, 720–733, December 12, 2013 ª2013 Elsevier
When reads were separately mapped to strong and weak
splice sites, a clear enrichment of exonic binding sites near
weak 50 splice sites compared to strong 50 splice sites was de-
tected (Figure 2B). These results suggest that RBM proteins
are general contributors to the splicing process but can particu-
larly contribute to the modulation of exons harboring weak 50
splice sites, without a clear enrichment in alternative over consti-
tutive exons (Figure S2B).
The distinct distribution of binding sites of RBM proteins could
be a consequence of their different RNA sequence specificities.
To determine in vivo target sequencemotifs of the RBMproteins,
enriched 5-mers present in CLIP-Seq clusters were identified.
RBM5, 6, and 10 clusters (73.7%, 61.8%, and 62.0%, respec-
tively) included the enriched 5-mers, respectively. The distribu-
tion of these motifs recapitulates the general cluster distribution
for these proteins (Figure 2C), indicating that these motifs are
indeed representative of the binding distribution of these factors.
Next, consensusmotifs were derived using the HOMER software
(Heinz et al., 2010). Two examples of the ten most significantly
enriched motifs for each RBM (Figure S2A) are shown in Fig-
ure 2D. For RBM5, UCAUC and AGUAA sequences were found
among the most significantly enriched motifs, which show simi-
larities with the previously published UC-rich RBM5 regulatory
motif (Fushimi et al., 2008) as well as with the ANGUAA motif
(Nguyen et al., 2011). RBM10 and 6 showed preference for the
CUCUGAA motif, which contains a core CUCU sequence remi-
niscent of PTB binding sites (Xue et al., 2009). Additional
U-rich motifs were also enriched in RBM10 clusters, consistent
with the in vitro observation that RBM10 interacts with poly-U
sequences (Inoue et al., 1996). This analysis therefore allowed
us to validate in a genome-wide manner motifs previously
described for individual genes and in addition expand the
sequence motif repertoires of these RBM proteins. Top
consensusmotifs were used for electrophoretic mobility retarda-
tion assays using N-terminal fragments of RBM5, 6, and 10
comprising the two RRMs and the first zinc finger domains, in
the presence of an excess of nonspecific RNA competitor.
RBM5 and 6 bound their top consensus motifs with apparent af-
finities of 50–70 Nm, and for RBM10 the apparent affinity was
150 nM (Figures 2E and S2C), confirming that these proteins
have significant intrinsic binding for the sequences identified
in vivo. Using the RNAcompete approach, Ray et al. recently re-
ported preferred sequence motifs for RBM5 and 6 (Ray et al.,
2013). RBM5 and 6 bound to these sequences with an affinity
slightly lower than to our CLIP top motifs (Figures 2E and S2C).
Single-nucleotide substitutions in the CLIP motifs led to 3- to
7-fold decreases in affinity, and binding to unrelated sequences
was undetectable (Figures 2E and S2C), indicating that RBM5, 6,
and 10 display sequence-specific RNA recognition.
Identification of Alternative Splicing Events Regulatedby RBMsTo determine the global effects of the three RBMs on the regula-
tion of alternative splicing and also to infer the functional rele-
vance of the identified RBMs/RNA interactions, RNAs isolated
from three biological replicas of each of the cell lines expressing
shRNAs against the individual RBMswere hybridized to splicing-
sensitive microarrays. Significant and consistent changes in
Inc.
cluster density at the 3’SS
RB
M5
clus
ters
den
sity
−400 −300 −200 −100 0
0.00
00.
0075
0.01
5
cluster density at the 5’SS
−50 100 200 300 400
0.00
00.
015
−400 −300 −200 −100 0
0.00
0.02
0.04
−50 100 200 300 400
0.00
0.02
0.04
−400 −300 −200 −100 0
0.00
0.03
−50 100 200 300 400
0.00
0.01
50.
03
RB
M6
clus
ters
den
sity
RB
M10
clu
ster
s de
nsity
RBM Control Random
intron intron
Strong splice site
−400 −300 −200 −100
0.00
0.05
0.1
−50 100 200 300 400
0.00
0.05
0.1
cluster density at the 3’SS cluster density at the 5’SS
intron intron
intron intron
0
intron
RB
M5
clus
ters
den
sity
intron intron
−400 −300 −200 −100 0
0.00
0.15
−50 100 200 300 400
0.00
0.15
RB
M6
clus
ters
den
sity
−50 100 200 300 400
0.00
0.10
RB
M10
clu
ster
s de
nsity
intron
−400 −300 −200 −100 0
0.00
0.05
0.10
intron
0.050.01
5
0.00
75
0.07
5
0.07
5
Weak splice site
intron
−400 −300 −200 −100 0
0.00
00.
015
−50 100 200 300 400
0.00
00.
0075
0.01
5
−400 −300 −200 −100 0
0.00
0.02
0.04
−50 100 200 300 400
0.00
0.02
0.04
−400 −300 −200 −100 0
0.00
0.03
−50 100 200 300 400
0.00
0.01
50.
03
0.01
50.
0075
intronintron
intronintron
intronintron
RBM Control Random
RB
M5
clus
ters
den
sity
RB
M6
clus
ters
den
sity
RB
M10
clu
ster
s de
nsity
clusters with motif at the 3’SS cluster with motif at the 5’SS
0E+00
2E+02
4E+02
6E+02
8E+02
-log2 P-value
RB
M5
RB
M6
RB
M10
Free RNA
RBM5/RNA
A B
C D
E
UCAUCGA AGUAACG GAAGGAA UCGUCGA AGCAACG CGCUGAA
CUCUGAA GAUCAGU AAUCCAG CGCUGAA UCGUCGA
CGAUCCC CUGUGGA CUAUCCC CCGUGGA
Free RNA
RBM6/RNA
Free RNA
RBM10/RNA
UCGUCGA
HOMER Motifs
RNACOMPETE Motifs
Mutant HOMER Motifs
- - - - - -
- - - - -
- - - - -
50 n
M Mn 001Mn 051
Negative ControlMotifs
Figure 2. Global Distribution of RBM-Bind-
ing Sites
(A) Relative enrichment of crosslinked RBM clus-
ters in exon/intron boundaries. Normalized cluster
densities for the different RBM proteins (y axis) are
represented relative to exons/introns positions (x
axis), with boundaries indicated by dashed vertical
lines. Red lines indicate RBM clusters, blue and
gray lines represent control and random clusters,
respectively.
(B) Relative enrichment of RBM clusters near
strong (dark) and weak (light) 30 and 50 splice sites
of exons.
(C) Distribution at exon/intron boundaries of clus-
ters containing significantly enriched 5-mers,
represented as in (A).
(D) Top consensus motifs identified by HOMER
among the CLIP tags for each of the RBMs. The
significance is represented as – Ln P value.
(E) Electrophoreticmobility shift assays to evaluate
binding of RBM proteins (amino-terminal regions
including the two RRMs and one zing finger, used
at concentrations of 50, 100, and 150 nM, to RNAs
that either contain one of the two top-sequence
motifs, a point mutation in the motif, a binding
sequence selected by the RNAcompete approach
(Ray et al., 2013) or an unrelated sequence as
control. The positions of protein/RNA complexes
and unbound RNA are indicated.
Molecular Cell
NUMB Splicing Regulation by RBM Proteins
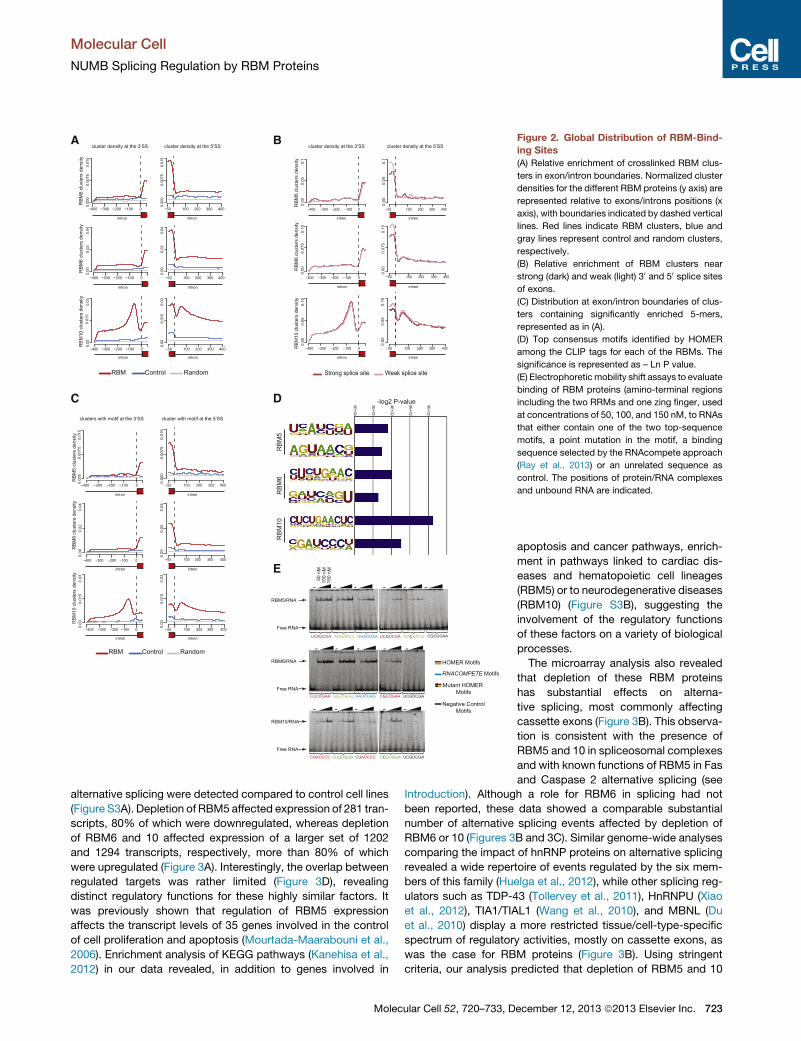
alternative splicing were detected compared to control cell lines
(Figure S3A). Depletion of RBM5 affected expression of 281 tran-
scripts, 80% of which were downregulated, whereas depletion
of RBM6 and 10 affected expression of a larger set of 1202
and 1294 transcripts, respectively, more than 80% of which
were upregulated (Figure 3A). Interestingly, the overlap between
regulated targets was rather limited (Figure 3D), revealing
distinct regulatory functions for these highly similar factors. It
was previously shown that regulation of RBM5 expression
affects the transcript levels of 35 genes involved in the control
of cell proliferation and apoptosis (Mourtada-Maarabouni et al.,
2006). Enrichment analysis of KEGG pathways (Kanehisa et al.,
2012) in our data revealed, in addition to genes involved in
Molecular Cell 52, 720–733, D
apoptosis and cancer pathways, enrich-
ment in pathways linked to cardiac dis-
eases and hematopoietic cell lineages
(RBM5) or to neurodegenerative diseases
(RBM10) (Figure S3B), suggesting the
involvement of the regulatory functions
of these factors on a variety of biological
processes.
The microarray analysis also revealed
that depletion of these RBM proteins
has substantial effects on alterna-
tive splicing, most commonly affecting
cassette exons (Figure 3B). This observa-
tion is consistent with the presence of
RBM5 and 10 in spliceosomal complexes
and with known functions of RBM5 in Fas
and Caspase 2 alternative splicing (see
Introduction). Although a role for RBM6 in splicing had not
been reported, these data showed a comparable substantial
number of alternative splicing events affected by depletion of
RBM6 or 10 (Figures 3B and 3C). Similar genome-wide analyses
comparing the impact of hnRNP proteins on alternative splicing
revealed a wide repertoire of events regulated by the six mem-
bers of this family (Huelga et al., 2012), while other splicing reg-
ulators such as TDP-43 (Tollervey et al., 2011), HnRNPU (Xiao
et al., 2012), TIA1/TIAL1 (Wang et al., 2010), and MBNL (Du
et al., 2010) display a more restricted tissue/cell-type-specific
spectrum of regulatory activities, mostly on cassette exons, as
was the case for RBM proteins (Figure 3B). Using stringent
criteria, our analysis predicted that depletion of RBM5 and 10
ecember 12, 2013 ª2013 Elsevier Inc. 723
55
988 1143
226
214 151
0%
50%
100%
RBM5 RBM6 RBM10
down
up
Alternative Donor/Acceptor
Mutually Exclusive
Cassette Exon
158
837
904
29149
2450
RBM6
RBM10
RBM5 19
192
244
534
61
RBM6
RBM10
RBM5
Gene Expression events Alternative Splicing events
31 269 317
7 42 40
3 44 37
0%
50%
100%
RBM5 RBM6 RBM10 HJAY
1315
0 65
06
%A
S e
vent
s
% d
ereg
ulat
ed tr
ansc
ripts
14
27
102
8
65
71
0%
50%
100%
RBM5 RBM6 RBM10
skipping
Inclusion
A B
C D
E
BC
A3
Ex5
CC
NJL
Ex4
A
DA
D1
Ex2
HR
AS
IDX
GA
DD
45A
Ex2
TBC
1D3
Ex4
BID
Ex3
A
EIF
4E2
Ex2
A
LAS
S5
Ex1
F
NO
TCH
3 E
x16
APA
F1 E
x18
STA
T3 E
x23A
CLK
1 E
x6
MA
P4K
4 E
x21A
SR
P14
Ex3
A
EIF
4A2
Ex2
MA
DD
Ex1
6
Log2
fold
cha
nge
exon
ski
ppin
g %
Cas
sette
exo
ns
-5
-4
-3
-2
-1
0
1
2
3
4
5
RBM5
RBM6
RBM10
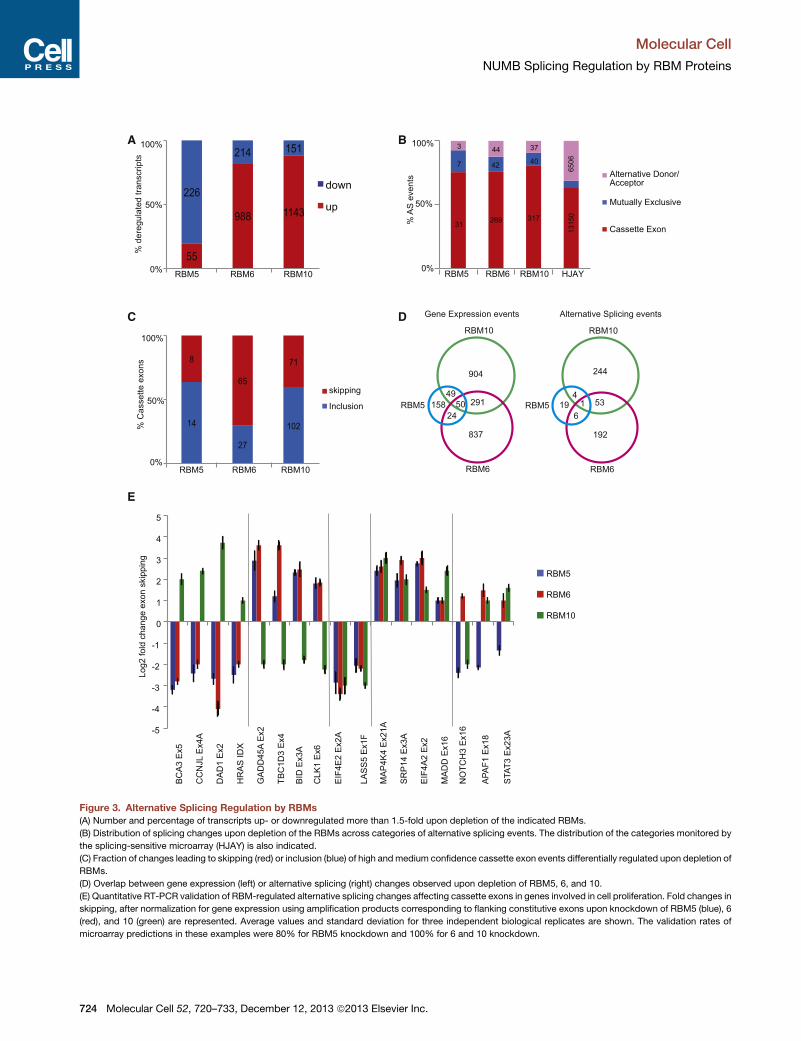
Figure 3. Alternative Splicing Regulation by RBMs
(A) Number and percentage of transcripts up- or downregulated more than 1.5-fold upon depletion of the indicated RBMs.
(B) Distribution of splicing changes upon depletion of the RBMs across categories of alternative splicing events. The distribution of the categories monitored by
the splicing-sensitive microarray (HJAY) is also indicated.
(C) Fraction of changes leading to skipping (red) or inclusion (blue) of high andmedium confidence cassette exon events differentially regulated upon depletion of
RBMs.
(D) Overlap between gene expression (left) or alternative splicing (right) changes observed upon depletion of RBM5, 6, and 10.
(E) Quantitative RT-PCR validation of RBM-regulated alternative splicing changes affecting cassette exons in genes involved in cell proliferation. Fold changes in
skipping, after normalization for gene expression using amplification products corresponding to flanking constitutive exons upon knockdown of RBM5 (blue), 6
(red), and 10 (green) are represented. Average values and standard deviation for three independent biological replicates are shown. The validation rates of
microarray predictions in these examples were 80% for RBM5 knockdown and 100% for 6 and 10 knockdown.
Molecular Cell
NUMB Splicing Regulation by RBM Proteins
724 Molecular Cell 52, 720–733, December 12, 2013 ª2013 Elsevier Inc.
Molecular Cell
NUMB Splicing Regulation by RBM Proteins
induce exon inclusion in 63% and 59% of their target exons,
respectively, whereas RBM6 depletion promoted inclusion of
only 29% of its target cassette exons (Figure 3C). This is again
consistent with distinct mechanisms of splicing regulation by
these factors and indicates that RBM5 and 10 display mainly
repressive activities, consistent with findings for RBM5 in the
Fas and Caspase 2 systems (Bonnal et al., 2008; Fushimi
et al., 2008) and with a very recent report on RBM10 (Wang
et al., 2013), while RBM6 may act mainly as a splicing activator.
Consistent with this concept, mapping of CLIP clusters to
exons showing high or low inclusion levels in HeLa cells (quanti-
fied using ENCODE RNA-Seq data) showed an enrichment in
RBM6 cluster densities in highly included exons, while RBM5
and 10 showed no significant difference between these cate-
gories (Figure S2B).
As observed for transcriptional targets, the overlap between
alternatively spliced exons regulated by these factors was very
limited (Figure 3D). However, about 20% of the regulated events
are under the control of more than one RBM, suggesting
possible synergistic or antagonistic effects of RBM5, 6, and 10
on a subset of their targets. Validation by quantitative RT-PCR
of high- or medium-confidence microarray predictions for the
three factors was 80%–90%. Figure 3E shows the validation of
alternative splicing predictions—after normalizing by gene
expression changes—in genes previously shown to be involved
in cell proliferation, including oncogenes, apoptotic regulators,
MAP kinases, and members of the STAT and NOTCH signal
transduction pathways. A regulatory network depicting the
effects of RBM proteins on the expression and/or alternative
splicing of cancer-related and RNA processing-related genes
is shown in Figure S4A.
RNA Maps for RBM5, 6, and 10Overlap between CLIP and microarray data showed evidence of
RBM5 binding in the alternatively spliced genomic region
comprising the upstream and downstream introns as well as in
the flanking constitutive exons for 50% of the RBM5-regulated
exons. The figures reached 93% and 97% for RBM6 and 10,
respectively, a statistically highly significant enrichment
compared to the occurrence of RBM proteins binding in a
random subset of nonregulated exons. While the limited number
of RBM5-regulated events prevented us from drawing an RNA
map for this factor, RBM6 and 10 displayed distinct patterns of
binding relative to their regulated exons and the regulatory
outcome of their depletion (Figure 4A).
For RBM6, peaks of binding associated with exon skipping
were observed close to the constitutive upstream and down-
stream exons, suggesting that RBM6 promotes exon skipping
by enhancing the function of the distal splice sites. Other peaks
of binding associated with exon skipping or inclusion are
located about 200 nucleotides downstream of the 50 exon,
perhaps due to repression of regulatory sequences. Peaks
more specifically associated with alternative exon inclusion
are located within the 100 nucleotide intronic regions flanking
the regulated exon.
For RBM10, peaks of binding associated with exon skipping
were observed throughout the 50 intron and the 30 end of the
exon, while multiple peaks associated with exon inclusion were
Molec
observed in the 30 intron. The effects of RBM10 binding near
the 30 end of the exon resembles those of hnRNPA1 and could
act by similar mechanisms of 50 splice-site repression (Huelga
et al., 2012; Martinez-Contreras et al., 2006). The distribution
of repressing and activating RBM10 peaks in the upstream and
downstream introns, respectively, has resemblances with the
RNAmaps observed for other splicing regulatory factors (Licata-
losi and Darnell, 2010; Llorian et al., 2010; Yeo et al., 2009).
We conclude that, despite similarities in their binding specific-
ities (Figure 2D), RBM6 and 10 display distinct positional effects
in splicing regulation (Figure 4A). Synergistic/antagonistic effects
of RBM6 and 10 depending on the location of their binding sites
could however be detected (Figure S4B).
To evaluate the validity of these insights, we decided to focus
on an alternative event in the gene NUMB, which we found to be
regulated by RBM5, 6, and 10 (see below) and that is known to
be altered in lung cancer (Misquitta-Ali et al., 2011). A CLIP clus-
ter for RBM10 was found in the 30 splice-site region preceding
NUMB alternative exon 9. A modified version of the splicing
reporter RG6 minigene (Orengo et al., 2006) was generated re-
placing a model cassette exon by NUMB exon 9 and 100/50 nu-
cleotides of flanking intronic sequences (Figure 4B). This allowed
us to minimize the alternatively spliced region of NUMB and thus
focus on key potential regulatory elements (see below). Consis-
tent with the results of the RNA Map (Figure 4A), overexpression
of RBM10 in HeLa cells led to enhanced NUMB exon 9 exon
skipping in a cotransfection assay using the RG6-NUMB
minigene reporter (Figure 4C, lanes 1–4). Consistent with the
relevance of RBM10 binding 50 of the alternative exon, replace-
ment of the RBM10 binding site by another pyrimidine-rich re-
gion lacking consensus RBM10 motifs abolished the effects of
RBM10 overexpression (Figure 4C, lanes 5–8). These results
confirm the repressive function of RBM10 when bound 50 of analternative exon. Consistent with the effects of RBM6 depletion,
overexpression of this protein led to increased NUMB exon 9 in-
clusion (Figure 4C, lanes 9–12). In contrast, RBM5 overexpres-
sion did not change the NUMB exon 9 skipping/inclusion ratio,
presumably because of the lack of RBM5-responsive elements
in the minigene (Figure 4C, lanes 13–15).
Effects of RBM Proteins on Regulation of the NotchPathway in Breast and Lung Cancer Cell LinesTo investigate the regulation of alternative splicing by RBM5, 6,
and 10 in controlled cellular systems, cell lines derived from
normal breast and a breast tumor (MCF10A and MCF7) and
from normal fetal lung fibroblasts and a lung adenocarcinoma
(IMR9 and A549) were used to evaluate the relative expression
levels of RBM proteins and alternative splicing of their target
genes. Western blot analyses revealed significantly lower levels
of RBM5 and 6 in the cancer cell lines from the two tissues, while
the levelsofRBM10werehigher in thecancercell lines (Figure5A).
The changes in RBM protein expression were accompanied
by changes in alternative splicing of several genes involved in
cell proliferation, which were consistent in the two-cell-lines
comparisons (Figure 5B and 5C). These alternative splicing
events were found to be targets of RBM5, 6, and/or 10 in our
microarray analyses (Figure 3E) andwere also identified as direct
targets of at least one of them in our CLIP experiments.
ular Cell 52, 720–733, December 12, 2013 ª2013 Elsevier Inc. 725
0.00
0.05
0.100.15
0.00
0.050.10
0.15
0.00
0.05
0.100.15
0.00
0.050.10
0.15
n = 65
n = 27
n = 71
n = 102
RB
M6
Clu
ster
den
sitie
sR
BM
10 C
lust
er d
ensi
ties
A
200 b200 b200 b200 b
B
C
0
0.5
1
1.5
2
2.5
3
3.5
RBM10 WT
Rat
io S
kipp
ing/
Incl
usio
n
50bp100bpCMV p(A)
RG6-NUMB WT
RG6-NUMB minigene
RBM10 WT
RG6-NUMB WT RG6-NUMB mut
1 2 3 4 5 6 7 8
ATTGATGTTGTCTGCTCCCGTTGTAGCTAA
ATTGATTCTTTTGTCTCTCATCTTGTTGGTTCCAGCTAARG6-NUMB mut
RG6-NUMB WT
RBM6 WT RBM5 WT
9 10 11 12 13 14 15
NUMB ex9Isoforms
***
****
****
(legend on next page)
Molecular Cell
NUMB Splicing Regulation by RBM Proteins
726 Molecular Cell 52, 720–733, December 12, 2013 ª2013 Elsevier Inc.
Molecular Cell
NUMB Splicing Regulation by RBM Proteins
The differences in RBM5 and/or 6 expression between cancer
and noncancer cell lines shown in Figure 5A can contribute to
explain only three out of seven of the observed differences in
alternative splicing between the cancer cells, and the increase
in RBM10 expression cannot explain any of the observed
splicing changes (Table S1). In sharp contrast, the majority of
the changes in alternative splicing observed upon knockdown
of the RBMs that were validated in Figure 3E could help to
explain the effects of depletion of these factors on cell prolifera-
tion (Table S1). Given the recent report of frequent mutations of
RBM10 in lung adenocarcinomas (Imielinski et al., 2012), we
considered the possibility that RBM10 was mutated in the
A549 cell line. Indeed, sequencing of the RBM10 gene in A549
cells revealed a T-to-A substitution at position 1062 that leads
to replacement of valine 354 by glutamic acid, a mutation pre-
dicted to be located in alpha-helix 2 of the RRM2 domain
(Figure 5D).
Next, the effect of this mutation on the activity of RBM10 as a
regulator of NUMB exon 9 splicing was tested using the assay
described in Figure 4C. While overexpression of wild-type
RBM10 increased exon skipping (Figure 5E, lanes 1–6), titration
of the V354E mutant found in A549 cells compromised the
effects of the protein despite its higher level of expression and,
in fact, resulted in even higher exon inclusion at high levels
of RBM10 expression (Figure 5E, lanes 7–11). Similar effects
were observed in alternative splicing of the endogenous gene
and in accumulation of NUMB protein isoforms (Figure S5F).
These observations indicate that this mutation dramatically dis-
rupts RBM10 function. The reduced activity of the V354E mutant
could therefore explain (1) why the patterns of alternative splicing
observed in the A549 cell line compared to IMR9 cells are oppo-
site to what was inferred based upon the results of RBM10
knockdown (Figure 5C) and (2) why there are significantly lower
levels of the NUMB PRRS isoform in A549 cells (Figure 5C, lower
panel). Consistent with this interpretation, overexpression of
wild-type RBM10 in A549 cells was sufficient to increase skip-
ping of NUMB exon 9 from endogenous transcripts and induce
accumulation of the NUMB PRRS protein isoform (Figure 5F).
Furthermore, overexpression of wild-type RBM10 reduced the
clonogenic capacity of A549 cells (Figure 5G), consistent with
the idea that RBM10 mutation contributes to A549 cancer cell
proliferation.
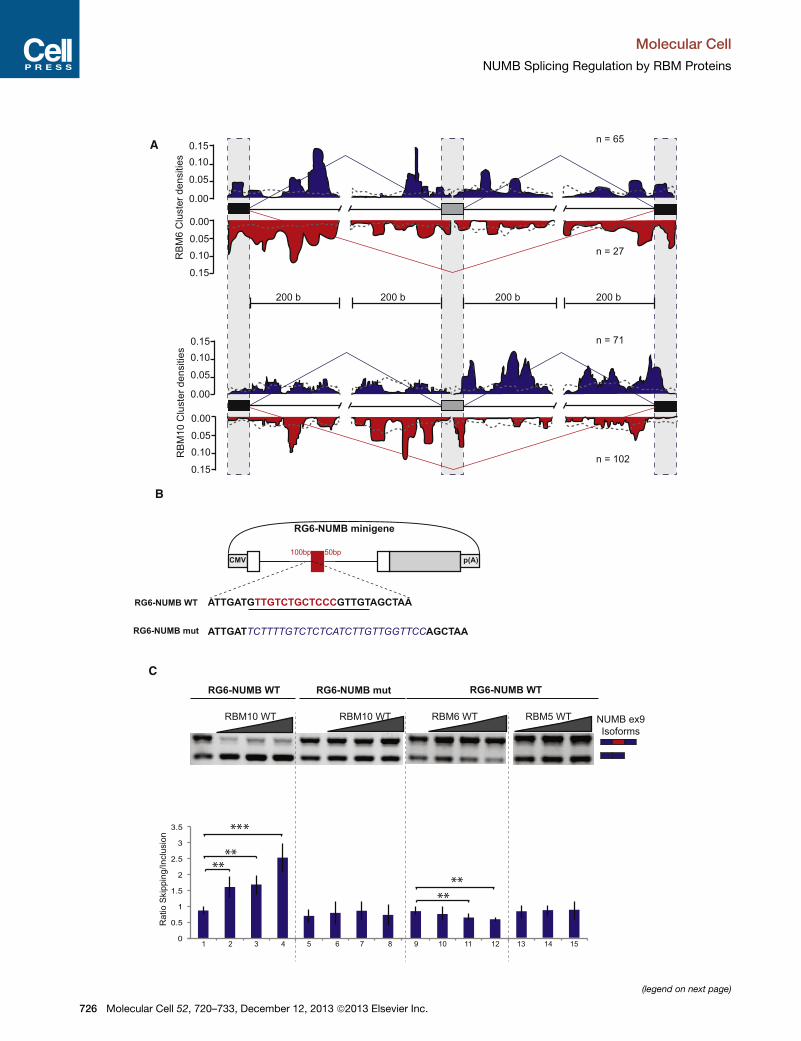
Figure 4. Functional RNA Maps for RBMs and Regulation of NUMB Ex
A) RBM6 and 10 functional RNA Maps were generated adopting the method de
Experimental Procedures). The density of normalized cluster reads for each prot
(gray boxes) and flanking exonic (black boxes) and intronic (thin line) sequences
indicated by the blue and red lines, respectively. The profile of cluster densities a
The gray dashed line represents the distribution of clusters in a random subse
surrounding the alternative regulated exon (gray box).
(B) Schematic representation of the RG6-NUMBWT and mutant minigenes. Red
intronic regions, respectively. White boxes indicate constitutive exons of the mi
underlined, and two core consensus motifs are highlighted in red. This sequence
which is shown in blue italics.
(C) RBM10 overexpression induces skipping of NUMB exon 9 in transcripts of t
minigene. RNA was isolated from cells transfected with the RG6-NUMB minig
expression vector. Upper panel: semiquantitative analysis of exon inclusion/sk
between exon inclusion and skipping estimated using quantitative RT-PCR. *p <
experiments is represented as the mean of n > 3 experiments ± SEM.
Molec
NUMB Alternative Splicing and RBM-MediatedRegulation of Cell ProliferationWe decided to focus our efforts on NUMB exon 9 alternative
splicing regulation for several reasons. First, this event generates
mRNAs with opposite effects in the activation of the NOTCH
pathway: while exon 9 skipping generates a repressor of the
pathway and of cell proliferation, exon 9 inclusion correlates
with reduced NUMB protein levels and activation of the NOTCH
pathway (Misquitta-Ali et al., 2011; Westhoff et al., 2009).
Second, the NOTCH pathway is an important regulator of cell
proliferation, particularly in lung adenocarcinomas (Maraver
et al., 2012), and changes in NUMB exon 9 inclusion are among
themost frequent tumor-associated alternative splicing changes
observed in lung cancer (Misquitta-Ali et al., 2011). Third, the
event was regulated in opposite directions by RBM5/6 and
RBM10 (Figure 5C) and the direction of the changes is consistent
with the distinct effects that knockdown of these factors have in
cell proliferation assays (Figures 1D and 1E). Fourth, direct bind-
ing of RBM10 to this alternatively spliced region of NUMB was
detected in our CLIP experiments and plays a role in regulation
of NUMB exon 9 alternative splicing (Figure 4C). Fifth, differ-
ences in NUMB alternative splicing and accumulation of
NUMB alternatively spliced protein isoforms between the A549
cancer and noncancerous cell lines correlated with expression
of a RBM10 mutant that has reduced capacity to regulate
NUMB exon 9 skipping (Figures 5C and 5E). Sixth, overexpres-
sion of wild-type RBM10 in A549 cells was sufficient to increase
skipping of endogenous NUMB exon 9, induce accumulation of
the NUMB PRRS protein isoform, and decrease the clonogenic
capacity of these cells (Figures 5F and 5G). Given these prece-
dents, we decided to explore whether regulation of the NOTCH
pathway via NUMB alternative splicing can indeed explain the
effects of RBM5, 6, and 10 on cell proliferation.
We first tested whether knockdown of RBM5, 6, and 10 influ-
enced the activity of the NOTCH pathway. Figure S5A shows
that expression of the NOTCH target genes HEY1 and HEY2
(but not HES1) was affected by depletion of the RBM proteins.
To further confirm the involvement of the Notch pathway in the
activation of cell proliferation mediated by RBM10 depletion,
cells were treated with the small molecule peptidomimetic pre-
senilin inhibitor DFP-AA, which blocks Notch signaling and effec-
tively suppresses the growth of Notch1-transformed lymphoid
on 9 Alternative Splicing
scribed by Licatalosi et al. (2008) with minor modifications (see Supplemental
ein (y axis) is represented relative to the position of alternative cassette exons
(x axis). n indicates the number of exon inclusion/skipping events analyzed, as
ssociated with exon inclusion or skipping events follows the same color code.
t of 1000 nonregulated events. Black boxes represent the constitutive exons
box and lines represent NUMB exon 9 and 50/100 nucleotides of flanking 50/30
nigene, and gray boxes are vector sequences. The RBM10 binding cluster is
is replaced by a sequence from the 30 splice-site region of the following intron,
he RG6-NUMB WT minigene but not in transcripts of the RG6-NUMB mutant
enes and increasing concentrations (500 ng, 1 mg, and 2 mg) of an RBM10
ipping using primers corresponding to vector sequences. Lower panel: ratio
0.05, **p < 0.01, ***p < 0.001 (Student’s unpaired t test, n = 3). Quantification of
ular Cell 52, 720–733, December 12, 2013 ª2013 Elsevier Inc. 727
A B
C
E
A549
untreated
-5
-4
-3
-2
-1
0
1
2
3
4
NO
TCH
3 E
x16
BID
Ex3
a
HR
AS
IDX
MA
DD
Ex1
6
AP A
F E
x18
Breast
Lung
Log2
Fol
d ch
ange
exo
n sk
ippi
ngNUMB Ex9
MCF7
RBM10 S
h
Contro
l Sh
treated
D
F
α-RBM10
α-RBM5
α-RBM6
α-Tubulin
MCF7MCF10
A
IMR90
A549
Log2
Fol
d ch
ange
exo
n sk
ippi
ng
RBM5 Sh
RBM6 Sh
RBM10 Sh
Breast
Lung
-3
-2
-1
0
1
2
3
α-RBM10
α-Tubulin
RBM10 WT RBM10 V354E
α1 α2 β1 β2 β3 β3’ β4
RNP2 RNP1V E
RBM10-RRM2
0
0.5
1
1.5
2
2.5
3
3.5
Rat
io S
kipp
ing/
Incl
usio
n
1 2 3 4 5 6 7 8 9 10 11
(Can
cer V
s N
orm
al c
ell l
ine)
-
(DFP-AA)
0
200
400
600
800
Num
ber o
f col
onie
s
untreated
treated(DFP-AA)
*** ***
***
****
**
***
***
A549
MCF7
IMR90
MCF10A
RBM5 Sh
RBM10 S
h
Contro
l
RBM6 Sh
Numb-PRRL
Numb-PRRS
α-Tubulin
Numb-PRRL
Numb-PRRS
α-Tubulin
A549RBM10 WT - 100 500 1000
(ng)
H
-2.5
-2
-1.5
-1
-0.5
0
Log2
Rat
io N
UM
B E
x9 s
kipp
ing
A549RBM10 WT - 100 500 1000
(ng)
0
200
400
600
800
Num
ber o
f col
onie
s ***
HeLa
HeLa
A54
9
A54
9+
empt
y ve
ctor
A54
9+
RB
M10
WT
G
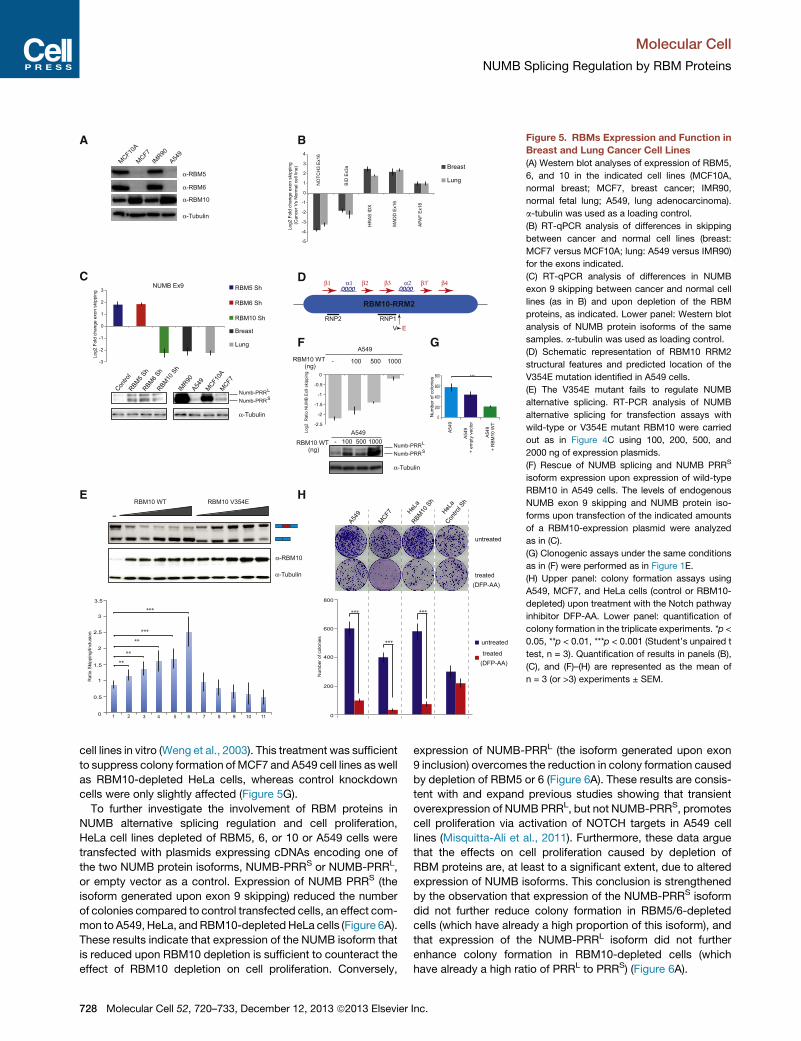
Figure 5. RBMs Expression and Function in
Breast and Lung Cancer Cell Lines
(A) Western blot analyses of expression of RBM5,
6, and 10 in the indicated cell lines (MCF10A,
normal breast; MCF7, breast cancer; IMR90,
normal fetal lung; A549, lung adenocarcinoma).
a-tubulin was used as a loading control.
(B) RT-qPCR analysis of differences in skipping
between cancer and normal cell lines (breast:
MCF7 versus MCF10A; lung: A549 versus IMR90)
for the exons indicated.
(C) RT-qPCR analysis of differences in NUMB
exon 9 skipping between cancer and normal cell
lines (as in B) and upon depletion of the RBM
proteins, as indicated. Lower panel: Western blot
analysis of NUMB protein isoforms of the same
samples. a-tubulin was used as loading control.
(D) Schematic representation of RBM10 RRM2
structural features and predicted location of the
V354E mutation identified in A549 cells.
(E) The V354E mutant fails to regulate NUMB
alternative splicing. RT-PCR analysis of NUMB
alternative splicing for transfection assays with
wild-type or V354E mutant RBM10 were carried
out as in Figure 4C using 100, 200, 500, and
2000 ng of expression plasmids.
(F) Rescue of NUMB splicing and NUMB PRRS
isoform expression upon expression of wild-type
RBM10 in A549 cells. The levels of endogenous
NUMB exon 9 skipping and NUMB protein iso-
forms upon transfection of the indicated amounts
of a RBM10-expression plasmid were analyzed
as in (C).
(G) Clonogenic assays under the same conditions
as in (F) were performed as in Figure 1E.
(H) Upper panel: colony formation assays using
A549, MCF7, and HeLa cells (control or RBM10-
depleted) upon treatment with the Notch pathway
inhibitor DFP-AA. Lower panel: quantification of
colony formation in the triplicate experiments. *p <
0.05, **p < 0.01, ***p < 0.001 (Student’s unpaired t
test, n = 3). Quantification of results in panels (B),
(C), and (F)–(H) are represented as the mean of
n = 3 (or >3) experiments ± SEM.
Molecular Cell
NUMB Splicing Regulation by RBM Proteins
cell lines in vitro (Weng et al., 2003). This treatment was sufficient
to suppress colony formation of MCF7 and A549 cell lines as well
as RBM10-depleted HeLa cells, whereas control knockdown
cells were only slightly affected (Figure 5G).
To further investigate the involvement of RBM proteins in
NUMB alternative splicing regulation and cell proliferation,
HeLa cell lines depleted of RBM5, 6, or 10 or A549 cells were
transfected with plasmids expressing cDNAs encoding one of
the two NUMB protein isoforms, NUMB-PRRS or NUMB-PRRL,
or empty vector as a control. Expression of NUMB PRRS (the
isoform generated upon exon 9 skipping) reduced the number
of colonies compared to control transfected cells, an effect com-
mon to A549, HeLa, andRBM10-depleted HeLa cells (Figure 6A).
These results indicate that expression of the NUMB isoform that
is reduced upon RBM10 depletion is sufficient to counteract the
effect of RBM10 depletion on cell proliferation. Conversely,
728 Molecular Cell 52, 720–733, December 12, 2013 ª2013 Elsevier
expression of NUMB-PRRL (the isoform generated upon exon
9 inclusion) overcomes the reduction in colony formation caused
by depletion of RBM5 or 6 (Figure 6A). These results are consis-
tent with and expand previous studies showing that transient
overexpression of NUMB PRRL, but not NUMB-PRRS, promotes
cell proliferation via activation of NOTCH targets in A549 cell
lines (Misquitta-Ali et al., 2011). Furthermore, these data argue
that the effects on cell proliferation caused by depletion of
RBM proteins are, at least to a significant extent, due to altered
expression of NUMB isoforms. This conclusion is strengthened
by the observation that expression of the NUMB-PRRS isoform
did not further reduce colony formation in RBM5/6-depleted
cells (which have already a high proportion of this isoform), and
that expression of the NUMB-PRRL isoform did not further
enhance colony formation in RBM10-depleted cells (which
have already a high ratio of PRRL to PRRS) (Figure 6A).
Inc.
5’S
S-A
ON
3’S
S-A
ON
ISS
1-A
ON
ISS
2-A
ON
Exon 9 Exon 10 Exon 8
cagacgcgagggcaacaucGAUU 3’- -5’ (3’SS-AON)
(5’SS-AON)
(ISS1-AON)
(ISS2-AON)
UCGGguaagguggccacaga-5’3’-
uacuuaauugagguaacuacaa-5’3’-
uguaaguggacugacuguguc-5’3’-
3’SS-AON 5’SS-AON
ISS1-AON ISS2-AON
A549
MCF7
Control-AON
++
++
+
----
-
---
--
--
--
-
-
++---
+
+
-
--
+--
-+
++--
-+
+-
-
-
++-
--
++
++
-
----
----- no
n tu
mor
cel
ls
(M
CF1
0, IM
R90
)
A549 RBM10 sh RBM6 sh RBM5 sh 5’SS-AON ISS2-AON +
- +--
---
+-
--
-- +
---
Ctl
Numb-PRRL
Numb-PRRS
A B
C D
E
0
150
300
450
600
Control RBM5 Sh RBM6 Sh RBM10 Sh A549
Untransfected
Control AON
5'SS-AON
ISS2-AON
0
200
400
600
800
Control RBM5 Sh RBM6 Sh RBM10 Sh A549 Untransfected
pcDNA3.1 Empty
Numb-PRRS
Numb-PRRL
Num
ber o
f col
onie
s
Num
ber o
f col
onie
s
1 2 3 4 5 6 7 8 9 10 1112 13 141516 171819 20
0
0.5
1
1.5
Week 1 Week 2 Week 3 Week 4 Week 5
5’SS-AON ISS2-AON Control AON
Tum
or V
olum
e (c
m3)
1 2 3 4 5 6 7 8 9 10 1112 13 141516 171819 20
α-Tubulin
M
***
*** ***
*****
***
*** ***
***
***
**
******
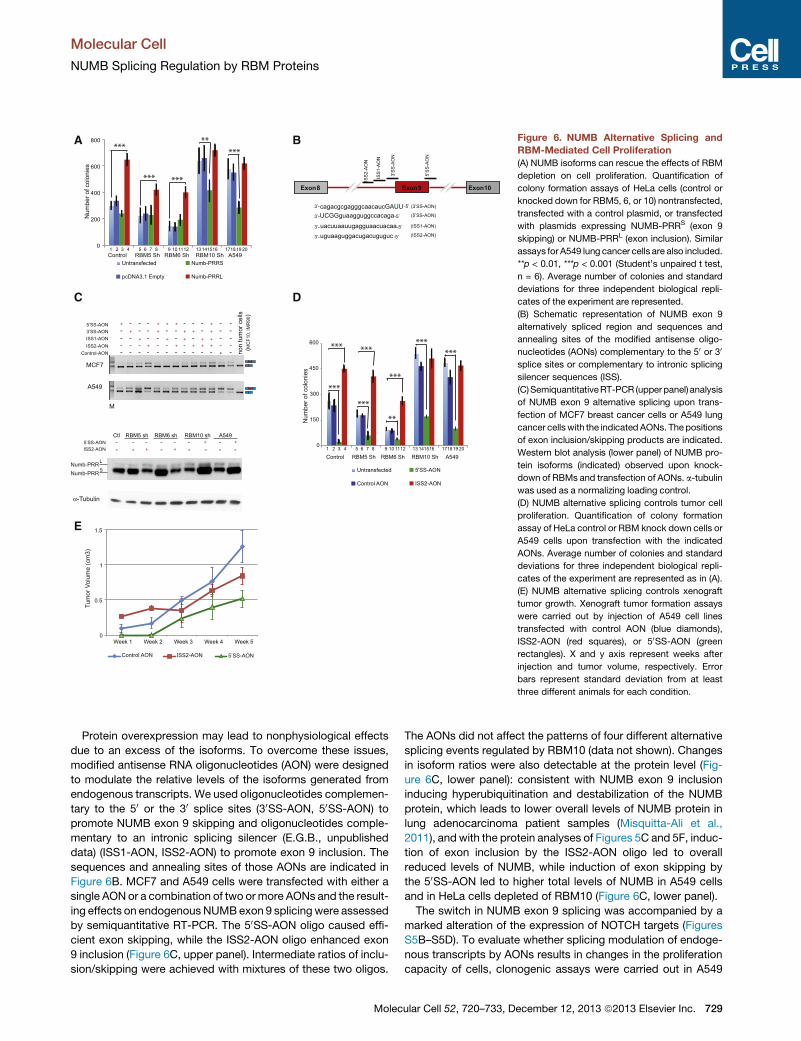
Figure 6. NUMB Alternative Splicing and
RBM-Mediated Cell Proliferation
(A) NUMB isoforms can rescue the effects of RBM
depletion on cell proliferation. Quantification of
colony formation assays of HeLa cells (control or
knocked down for RBM5, 6, or 10) nontransfected,
transfected with a control plasmid, or transfected
with plasmids expressing NUMB-PRRS (exon 9
skipping) or NUMB-PRRL (exon inclusion). Similar
assays for A549 lung cancer cells are also included.
**p < 0.01, ***p < 0.001 (Student’s unpaired t test,
n = 6). Average number of colonies and standard
deviations for three independent biological repli-
cates of the experiment are represented.
(B) Schematic representation of NUMB exon 9
alternatively spliced region and sequences and
annealing sites of the modified antisense oligo-
nucleotides (AONs) complementary to the 50 or 30
splice sites or complementary to intronic splicing
silencer sequences (ISS).
(C)SemiquantitativeRT-PCR (upperpanel) analysis
of NUMB exon 9 alternative splicing upon trans-
fection of MCF7 breast cancer cells or A549 lung
cancer cells with the indicated AONs. Thepositions
of exon inclusion/skipping products are indicated.
Western blot analysis (lower panel) of NUMB pro-
tein isoforms (indicated) observed upon knock-
down of RBMs and transfection of AONs. a-tubulin
was used as a normalizing loading control.
(D) NUMB alternative splicing controls tumor cell
proliferation. Quantification of colony formation
assay of HeLa control or RBM knock down cells or
A549 cells upon transfection with the indicated
AONs. Average number of colonies and standard
deviations for three independent biological repli-
cates of the experiment are represented as in (A).
(E) NUMB alternative splicing controls xenograft
tumor growth. Xenograft tumor formation assays
were carried out by injection of A549 cell lines
transfected with control AON (blue diamonds),
ISS2-AON (red squares), or 50SS-AON (green
rectangles). X and y axis represent weeks after
injection and tumor volume, respectively. Error
bars represent standard deviation from at least
three different animals for each condition.
Molecular Cell
NUMB Splicing Regulation by RBM Proteins
Protein overexpression may lead to nonphysiological effects
due to an excess of the isoforms. To overcome these issues,
modified antisense RNA oligonucleotides (AON) were designed
to modulate the relative levels of the isoforms generated from
endogenous transcripts. We used oligonucleotides complemen-
tary to the 50 or the 30 splice sites (30SS-AON, 50SS-AON) to
promote NUMB exon 9 skipping and oligonucleotides comple-
mentary to an intronic splicing silencer (E.G.B., unpublished
data) (ISS1-AON, ISS2-AON) to promote exon 9 inclusion. The
sequences and annealing sites of those AONs are indicated in
Figure 6B. MCF7 and A549 cells were transfected with either a
single AONor a combination of two ormore AONs and the result-
ing effects on endogenous NUMBexon 9 splicing were assessed
by semiquantitative RT-PCR. The 50SS-AON oligo caused effi-
cient exon skipping, while the ISS2-AON oligo enhanced exon
9 inclusion (Figure 6C, upper panel). Intermediate ratios of inclu-
sion/skipping were achieved with mixtures of these two oligos.
Molec
The AONs did not affect the patterns of four different alternative
splicing events regulated by RBM10 (data not shown). Changes
in isoform ratios were also detectable at the protein level (Fig-
ure 6C, lower panel): consistent with NUMB exon 9 inclusion
inducing hyperubiquitination and destabilization of the NUMB
protein, which leads to lower overall levels of NUMB protein in
lung adenocarcinoma patient samples (Misquitta-Ali et al.,
2011), and with the protein analyses of Figures 5C and 5F, induc-
tion of exon inclusion by the ISS2-AON oligo led to overall
reduced levels of NUMB, while induction of exon skipping by
the 50SS-AON led to higher total levels of NUMB in A549 cells
and in HeLa cells depleted of RBM10 (Figure 6C, lower panel).
The switch in NUMB exon 9 splicing was accompanied by a
marked alteration of the expression of NOTCH targets (Figures
S5B–S5D). To evaluate whether splicing modulation of endoge-
nous transcripts by AONs results in changes in the proliferation
capacity of cells, clonogenic assays were carried out in A549
ular Cell 52, 720–733, December 12, 2013 ª2013 Elsevier Inc. 729
Molecular Cell
NUMB Splicing Regulation by RBM Proteins
and HeLa cells combining the use of these reagents with knock-
down of each of the RBM proteins. Induction of exon 9 skipping
by the 50SS-AON oligo caused a strong reduction in the number
of colonies compared to a control scrambled AON, counteract-
ing the increase in colonies induced by knockdown of RBM10
(Figure 6D; lanes 3, 7, 11, 15, and 19). Therefore, the proliferative
effects of RBM10 depletion, which causes increased exon inclu-
sion, can be antagonized by increasing the ratio of inclusion/
skipping in transcripts from the endogenous NUMB gene.
Conversely, induction of exon 9 inclusion by the ISS2-AON oligo
caused a very significant increase in colony formation, counter-
acting the decrease in colonies induced by knockdown of either
RBM5 or 6 (Figure 6D; lanes 4, 8, and 12). Thus, the antiprolifer-
ative effects of RBM5/6 depletion, which causes exon skipping,
can be antagonized by increasing the ratio of inclusion/skipping
in transcripts from the endogenous NUMB gene. It is worth
pointing out that the ISS2-AON oligo did not further induce
colony formation in RBM10 knockdown cells because RBM10
depletion already led to high ratios of exon 9 inclusion (compare
lanes 13, 14, and 16 with 17, 18, and 20).
To further investigate the effects of the 50SS-AON and ISS2-
AON on cell proliferation in vivo, A549 cells were transfected
with either of the AONs and injected subcutaneously to
CB17SC-M nude mice. Simultaneous left and right injections
were performed and four nude mice/group were used. During
the first 2 weeks after injection, cells transfected with ISS2-
AON formed tumors of bigger volume compared with cells trans-
fected with the control AON (Figure 6E). This difference in size
was attenuated after 2 weeks of injection, most likely because
of titration and/or decay of the AON. In contrast, cells transfected
with 50SS-AON formed tumors only after 3 weeks of injection,
and these tumors remained smaller compared to the control,
even after 5 weeks of injection.
DISCUSSION
Our results show that three highly related RBM proteins have
overlapping, but also clearly distinguishable sets of RNA targets
and even display antagonistic properties in the regulation of cell
proliferation. Collectively, our results indicate that the ratio be-
tween isoforms of the Notch regulator NUMB is rate limiting for
the proliferation of cancer cells and that the regulatory effects
of RBM5, 6, and 10 on cell division can be recapitulated, in large
part by their effects on the regulation of NUMB alternative
splicing.
RNA Binding by RBM ProteinsThe CLIP-Seq experiments revealed that each of the RBMs
shows affinity for several sequence motifs, possibly due to the
presence of different RNA-binding domains (two RRMs, two
zinc fingers) in these proteins. For example, the prevalent
AGUAA motif identified for RBM5 resembles the ANGUAA motif
found to interact with one of its zinc finger domains in vitro
(Nguyen et al., 2011), while UC-rich motifs identified with high
confidence in our analyses are similar to a motif found important
for RBM5-mediated alternative splicing regulation of Caspase 2
(Fushimi et al., 2008) and to sequences used for structure deter-
mination of RBM5 RRM2 bound to RNA (Song et al., 2012). The
730 Molecular Cell 52, 720–733, December 12, 2013 ª2013 Elsevier
latter study also documented interaction of RBM5 RRM2 with
GA-rich sequences, which are also present in several of the
top motifs identified by our analyses.
The identity of the enriched motifs and the degree of enrich-
ment are most similar between RBM6 and 10 (Figure S2). These
factors, however, often have different effects on alternative
splicing of common targets (e.g., Figure 3E) and distinct regula-
tory maps (Figure 4A). These observations argue that the binding
and activity of these factors is likely to be influenced by other
proteins as well as by their relative positions in the pre-mRNA
(Figure S4B).
The distribution of RBM5/6 and RBM10 binding sites relative
to exon/intron boundaries is also different (Figure 2). The enrich-
ment of RBM5/6 in exonic regions resembles that of other
splicing factors like SRSF3, SRSF4, and FOX2, opening the pos-
sibility that, like SR proteins, RBM5 and RBM6 binding in exonic
regions near splice sites helps to recruit splicing components
(Anko et al., 2012; Yeo et al., 2009). Indeed, previous work has
documented that RBM5 OCRE domain interacts with compo-
nents of spliceosomal snRNPs and other splicing factors (Bonnal
et al., 2008), although in this case the interaction was associated
with exon repression. In contrast, RBM10 binding to intronic re-
gions near splice sites (Figure 2) may regulate alternative splicing
by interfering with splice-site recognition, similar to the positional
effects that have been proposed for FET family proteins (Hoell
et al., 2011) and hnRNP C (Konig et al., 2010). Direct blockage
of the splicing factor U2AF, which recognizes the polypyrimidine
tracts associated to 30 splice sites, is a likely mechanism by
which RBM10 promotes skipping of NUMB exon 9 (Figure 4C),
which has been reported for other regulators, as well (Singh
et al., 1995; Valcarcel et al., 1993). It is interesting to consider,
however, that the mutation identified in RBM10 RRM2 in A549
cells, which abolishes RBM10-mediated NUMB regulation, is
unlikelyto affect RNA recognition and may block RBM10 activity
by failing to synergize with a corepressor. More generally, the
RNA Map of RBM10 resembles that of other splicing factors
(Licatalosi and Darnell, 2010; Llorian et al., 2010; Yeo et al.,
2009), with skipping/inclusion correlating with binding 50/30 ofthe alternative exon, respectively.
RBMs and Cell ProliferationMisregulation of alternative splicing contributes to cancer pro-
gression (David and Manley, 2010; Kaida et al., 2012; Pal et al.,
2012), and classical splicing regulators like SRSF1 display strong
oncogenic activity (Karni et al., 2007).Many of the key events and
regulatory factors involved in splicing-based decisions impact-
ing on cell growth and cancer progression, however, remain to
be discovered. A number of alternative splicing changes regu-
lated by RBM5/6 and RBM10 have the potential to contribute
to the antagonistic effects of these factors on cell proliferation
(Table S1), which is also consistent with the identification of mul-
tiple genes involved in apoptosis and cell proliferation as targets
of RBM5 (Mourtada-Maarabouni et al., 2006). This is reminiscent
of the effects of other splicing regulators like NOVA or ESRP pro-
teins, which orchestrate multiple splice site switches that can
contribute to complex cellular functions, like shaping synaptic
connections (Ule et al., 2005) or guiding epithelial-mesenchymal
transitions (Warzecha et al., 2010). Our results, however, also
Inc.
Molecular Cell
NUMB Splicing Regulation by RBM Proteins
reveal that particular alternative splicing events—in our case, in
exon 9 of the NUMB gene—can make a predominant contribu-
tion to the cell proliferation phenotype controlled by RBM5, 6,
and 10.
The gene NUMB encodes a natural inhibitor of the NOTCH
pathway (Pece et al., 2010), a pathway that is hyperactivated
in �40% of all human lung adenocarcinomas and correlates
with poor prognosis (Dang et al., 2000; Maraver et al., 2012;
Westhoff et al., 2009). NUMB promotes NOTCH ubiquitination
and proteosomal degradation of NOTCH intracellular domain
(NICD) and may also control NOTCH levels by modulating its
endocytic recycling (McGill et al., 2009; McGill and McGlade,
2003). Inclusion/skipping of exon 9 leads to protein variants
that differ in a proline-rich domain involved in protein-protein
interactions, and these isoforms display distinct activities, one
promoting cell proliferation while the other promotes cell differ-
entiation (Toriya et al., 2006; Verdi et al., 1999). Our own results
using modified oligonucleotides able to modulate the ratio
between NUMB isoforms reveal a key role for NUMB alternative
splicing regulation in cancer cell proliferation (Figure 6). Of rele-
vance, increased levels of NUMB exon 9 inclusion are frequent
in nonsmall lung cancer tumors, correlating with higher NOTCH
activity (Misquitta-Ali et al., 2011). Inhibition of the NOTCH
pathway is emerging as a promising new approach for cancer
therapy (Purow, 2012). In particular, pharmacological inhibition
of the g-secretase complex, which prevents proteolytic cleavage
of the NOTCH receptor and activation of the pathway, blocks
cancer growth in a mouse model of lung adenocarcinomas
(Maraver et al., 2012). It is therefore conceivable that modulation
of NUMB alternative splicing (e.g., using modified oligonucleo-
tides like those of Figure 6) can have therapeutic effects.
Approaches for the modulation of alternative splicing with thera-
peutic potential based upon detailed knowledge of regulatory
mechanisms are indeed emerging, including the use of modified
antisense oligonucleotides that promote inclusion of exon 7 in
the SMN2 gene, thus restoring SMN function in cells and mouse
models of spinal muscular atrophy (Hua et al., 2010, 2011; Hua
et al., 2011; Hua et al., 2008).
Our observations become particularly relevant after a recent
report of massively parallel genome sequencing of lung adeno-
carcinomas revealed that RBM10 is statistically recurrently
mutated in these tumors (12/183, 7%) (Imielinski et al., 2012).
Together with our results implicating RBM10 in lung cancer cell
proliferation and in NUMB alternative splicing regulation, these
data suggest that mutations in RBM10 contribute to lung adeno-
carcinoma progression by causing deregulation of NUMB alter-
native splicing, as we found to be the case for amutant version of
RBM10 found in the lung cancer cell line A549 and for the rescue
of NUMB splicing and decrease in cell proliferation upon expres-
sion of wild-type RBM10 in these cells (Figure 5).
Of interest, mutations in RBM10 have been also implicated in
cleft palate and TARP syndrome (Gripp et al., 2011; Johnston
et al., 2010). These developmental defects in cell proliferation/
differentiation may be influenced by alterations in the regulation
of alternative splicing targets of RBM10, as argued by very
recent results showing that an in-frame deletion in RBM10 iden-
tified in a TARP syndrome patient reduces the accumulation of
the protein in the nucleus, affecting its activity as splicing regu-
Molec
lator (Wang et al., 2013). Conceivably, NUMB and regulation of
the NOTCH pathway, which plays key roles in cell-fate determi-
nation during the development of multiple tissues, could be
among the targets affected by altered RBM10 function in these
syndromes.
EXPERIMENTAL PROCEDURES
Cell Culture Experiments
Conditions for cell culture, Sh-mediated knockdown antisense 20-O-methyl
phosphorothioate oligonucletide, and plasmid transfections are described in
the Supplemental Experimental Procedures.
Clonogenic assays were performed in triplicate using 2000 cells that were
plated in 10 cm cell culture dishes with fresh culture medium, replaced every
3 days. After 15 days, cells were washed with PBS and fixed with 5 ml of meth-
anol for 10 min at room temperature. Cells were stained with 5% Giemsa
(Sigma, Aldrich) overnight, washed, dried, and counted. Experiments were
performed in triplicates.
In Vivo and In Vitro Protein/RNA Interactions
CLIP experiments were performed following the protocol of Licatalosi et al.,
(2008) with slight modifications, which, together with the detailed computa-
tional analyses, can be found in the Supplemental Experimental Procedures.
Electrophoretic mobility shift assays were carried out using 10 fmol of radiola-
beled probes incubated on ice for 15 min with His-RBMNter in presence of
200 ng/ml yeast tRNA. Mixtures were then loaded on native 5%polyacrylamide
gels, and migration was carried out in 0.5%TBE at 150V for 2 hr, followed by
gel drying and Phosphorimager analyses.
RNA and Protein Analyses
RNA from three biological replicates of sh-RBM-infected HeLa cells was puri-
fied and analyzed using Affymetrix Human Exon Junction Arrays and validated
by RT-qPCR as described in the Supplemental Experimental Procedures.
Protein extraction and immunoblot analysis were performed as previously
described (Paronetto et al., 2011).
Xenograft Tumor Formation
A549 cells were transfected with AONs. After 48 hr, 106 cells were resus-
pended in 1 ml of Basement Membrane Matrix, Growth Factor Reduced
(GFR) (BD, Biosciences). Cells were inoculated subcutaneously in 6-week-
old CB17SC-M nude mice. Tumor formation was followed and weekly
measured until 5 weeks after injection. Animal work procedures were
approved by an institutional review board.
ACCESSION NUMBERS
Microarray data have been submitted in MIAME-compliant form to GEO data-
base (GSE47431) and can be accessed at http://regulatorygenomics.upf.edu/
Data/RBMs/.
SUPPLEMENTAL INFORMATION
Supplemental Information includes six figures, three tables, Supplemental
Experimental Procedures, and Supplemental References and can be found
with this article online at http://dx.doi.org/10.1016/j.molcel.2013.11.010.
ACKNOWLEDGMENTS
We thank Professor Benjamin Blencowe for NUMB isoform constructs and
Professor Francisco Real and all the members of Valcarcel’s lab, especially
Dr. Maria Paola Paronetto, for discussions and critical reading of the manu-
script. We are grateful to Dr. Francesca Rapino for her help with lentivirus gen-
eration, Dr. Camilla Iannone for her graphical expertise, and Anna Ribo for her
technical assistance. E.B. was supported by a Marie Curie postdoctoral
fellowship (FP7-PEOPLE-2009-IEF). Work in E.E.’s group is supported by
ular Cell 52, 720–733, December 12, 2013 ª2013 Elsevier Inc. 731
Molecular Cell
NUMB Splicing Regulation by RBM Proteins
Consolider RNAREG, BIO2011-23920, and FSI2011-035 from Sandra Ibarra
Foundation. Work in J.V.’s lab is supported by Fundacion Botın, AICR, Funda-
cion Alicia Koplowitz, Consolider RNAREG, and Ministerio de Economıa y
Competitividad.
Received: June 5, 2013
Revised: September 18, 2013
Accepted: October 22, 2013
Published: December 12, 2013
REFERENCES
Angeloni, D. (2007). Molecular analysis of deletions in human chromosome
3p21 and the role of resident cancer genes in disease. Brief. Funct.
Genomics Proteomics 6, 19–39.
Anko, M.L., Muller-McNicoll, M., Brandl, H., Curk, T., Gorup, C., Henry, I., Ule,
J., and Neugebauer, K.M. (2012). The RNA-binding landscapes of two SR pro-
teins reveal unique functions and binding to diverse RNA classes. Genome
Biol. 13, R17.
Barash, Y., Calarco, J.A., Gao,W., Pan, Q.,Wang, X., Shai, O., Blencowe, B.J.,
and Frey, B.J. (2010). Deciphering the splicing code. Nature 465, 53–59.
Behzadnia, N., Hartmuth, K., Will, C.L., and Luhrmann, R. (2006). Functional
spliceosomal A complexes can be assembled in vitro in the absence of a
penta-snRNP. RNA 12, 1738–1746.
Bonnal, S., Martınez, C., Forch, P., Bachi, A., Wilm, M., and Valcarcel, J.
(2008). RBM5/Luca-15/H37 regulates Fas alternative splice site pairing after
exon definition. Mol. Cell 32, 81–95.
Chen, M., and Manley, J.L. (2009). Mechanisms of alternative splicing regula-
tion: insights from molecular and genomics approaches. Nat. Rev. Mol. Cell
Biol. 10, 741–754.
Dang, T.P., Gazdar, A.F., Virmani, A.K., Sepetavec, T., Hande, K.R., Minna,
J.D., Roberts, J.R., and Carbone, D.P. (2000). Chromosome 19 translocation,
overexpression of Notch3, and human lung cancer. J. Natl. Cancer Inst. 92,
1355–1357.
David, C.J., and Manley, J.L. (2010). Alternative pre-mRNA splicing regulation
in cancer: pathways and programs unhinged. Genes Dev. 24, 2343–2364.
Deckert, J., Hartmuth, K., Boehringer, D., Behzadnia, N.,Will, C.L., Kastner, B.,
Stark, H., Urlaub, H., and Luhrmann, R. (2006). Protein composition and elec-
tron microscopy structure of affinity-purified human spliceosomal B com-
plexes isolated under physiological conditions. Mol. Cell. Biol. 26, 5528–5543.
Du, H., Cline, M.S., Osborne, R.J., Tuttle, D.L., Clark, T.A., Donohue, J.P., Hall,
M.P., Shiue, L., Swanson, M.S., Thornton, C.A., and Ares, M., Jr. (2010).
Aberrant alternative splicing and extracellular matrix gene expression in
mouse models of myotonic dystrophy. Nat. Struct. Mol. Biol. 17, 187–193.
Edamatsu, H., Kaziro, Y., and Itoh, H. (2000). LUCA15, a putative tumour sup-
pressor gene encoding an RNA-binding nuclear protein, is down-regulated in
ras-transformed Rat-1 cells. Genes Cells 5, 849–858.
Eden, E., Navon, R., Steinfeld, I., Lipson, D., and Yakhini, Z. (2009). GOrilla: a
tool for discovery and visualization of enriched GO terms in ranked gene lists.
BMC Bioinformatics 10, 48.
Fushimi, K., Ray, P., Kar, A., Wang, L., Sutherland, L.C., and Wu, J.Y. (2008).
Up-regulation of the proapoptotic caspase 2 splicing isoform by a candidate
tumor suppressor, RBM5. Proc. Natl. Acad. Sci. USA 105, 15708–15713.
Gripp, K.W., Hopkins, E., Johnston, J.J., Krause, C., Dobyns, W.B., and
Biesecker, L.G. (2011). Long-term survival in TARP syndrome and confirma-
tion of RBM10 as the disease-causing gene. Am. J. Med. Genet. A. 155A,
2516–2520.
Heinz, S., Benner, C., Spann, N., Bertolino, E., Lin, Y.C., Laslo, P., Cheng, J.X.,
Murre, C., Singh, H., and Glass, C.K. (2010). Simple combinations of lineage-
determining transcription factors prime cis-regulatory elements required for
macrophage and B cell identities. Mol. Cell 38, 576–589.
Hoell, J.I., Larsson, E., Runge, S., Nusbaum, J.D., Duggimpudi, S., Farazi, T.A.,
Hafner, M., Borkhardt, A., Sander, C., and Tuschl, T. (2011). RNA targets of
732 Molecular Cell 52, 720–733, December 12, 2013 ª2013 Elsevier
wild-type and mutant FET family proteins. Nat. Struct. Mol. Biol. 18, 1428–
1431.
Hua, Y., Sahashi, K., Hung, G., Rigo, F., Passini, M.A., Bennett, C.F., and
Krainer, A.R. (2010). Antisense correction of SMN2 splicing in the CNS rescues
necrosis in a type III SMA mouse model. Genes Dev. 24, 1634–1644.
Hua, Y., Vickers, T.A., Okunola, H.L., Bennett, C.F., and Krainer, A.R. (2008).
Antisense masking of an hnRNP A1/A2 intronic splicing silencer corrects
SMN2 splicing in transgenic mice. Am. J. Hum. Genet. 82, 834–848.
Hua, Y., Sahashi, K., Rigo, F., Hung, G., Horev, G., Bennett, C.F., and Krainer,
A.R. (2011). Peripheral SMN restoration is essential for long-term rescue of a
severe spinal muscular atrophy mouse model. Nature 478, 123–126.
Huelga, S.C., Vu, A.Q., Arnold, J.D., Liang, T.Y., Liu, P.P., Yan, B.Y., Donohue,
J.P., Shiue, L., Hoon, S., Brenner, S., et al. (2012). Integrative genome-wide
analysis reveals cooperative regulation of alternative splicing by hnRNP pro-
teins. Cell Rep. 1, 167–178.
Imielinski, M., Berger, A.H., Hammerman, P.S., Hernandez, B., Pugh, T.J.,
Hodis, E., Cho, J., Suh, J., Capelletti, M., Sivachenko, A., et al. (2012).
Mapping the hallmarks of lung adenocarcinoma with massively parallel
sequencing. Cell 150, 1107–1120.
Inoue, A., Takahashi, K.P., Kimura, M., Watanabe, T., andMorisawa, S. (1996).
Molecular cloning of a RNA binding protein, S1-1. Nucleic Acids Res. 24,
2990–2997.
Johnston, J.J., Teer, J.K., Cherukuri, P.F., Hansen, N.F., Loftus, S.K., Chong,
K., Mullikin, J.C., and Biesecker, L.G.; NIH Intramural Sequencing Center
(NISC) (2010). Massively parallel sequencing of exons on the X chromosome
identifies RBM10 as the gene that causes a syndromic form of cleft palate.
Am. J. Hum. Genet. 86, 743–748.
Kaida, D., Schneider-Poetsch, T., and Yoshida, M. (2012). Splicing in onco-
genesis and tumor suppression. Cancer Sci. 103, 1611–1616.
Kanehisa, M., Goto, S., Sato, Y., Furumichi, M., and Tanabe, M. (2012). KEGG
for integration and interpretation of large-scale molecular data sets. Nucleic
Acids Res. 40 (Database issue), D109–D114.
Karni, R., de Stanchina, E., Lowe, S.W., Sinha, R., Mu, D., and Krainer, A.R.
(2007). The gene encoding the splicing factor SF2/ASF is a proto-oncogene.
Nat. Struct. Mol. Biol. 14, 185–193.
Konig, J., Zarnack, K., Rot, G., Curk, T., Kayikci, M., Zupan, B., Turner, D.J.,
Luscombe, N.M., and Ule, J. (2010). iCLIP reveals the function of hnRNP par-
ticles in splicing at individual nucleotide resolution. Nat. Struct. Mol. Biol. 17,
909–915.
Licatalosi, D.D., and Darnell, R.B. (2010). RNA processing and its regulation:
global insights into biological networks. Nat. Rev. Genet. 11, 75–87.
Licatalosi, D.D., Mele, A., Fak, J.J., Ule, J., Kayikci, M., Chi, S.W., Clark, T.A.,
Schweitzer, A.C., Blume, J.E., Wang, X., et al. (2008). HITS-CLIP yields
genome-wide insights into brain alternative RNA processing. Nature 456,
464–469.
Llorian, M., Schwartz, S., Clark, T.A., Hollander, D., Tan, L.Y., Spellman, R.,
Gordon, A., Schweitzer, A.C., de la Grange, P., Ast, G., and Smith, C.W.
(2010). Position-dependent alternative splicing activity revealed by global
profiling of alternative splicing events regulated by PTB. Nat. Struct. Mol.
Biol. 17, 1114–1123.
Maraver, A., Fernandez-Marcos, P.J., Herranz, D., Canamero, M., Munoz-
Martin, M., Gomez-Lopez, G., Mulero, F., Megıas, D., Sanchez-Carbayo, M.,
Shen, J., et al. (2012). Therapeutic effect of g-secretase inhibition in
KrasG12V-driven non-small cell lung carcinoma by derepression of DUSP1
and inhibition of ERK. Cancer Cell 22, 222–234.
Martinez-Contreras, R., Fisette, J.F., Nasim, F.U., Madden, R., Cordeau, M.,
and Chabot, B. (2006). Intronic binding sites for hnRNP A/B and hnRNP F/H
proteins stimulate pre-mRNA splicing. PLoS Biol. 4, e21.
McGill, M.A., Dho, S.E., Weinmaster, G., and McGlade, C.J. (2009). Numb
regulates post-endocytic trafficking and degradation of Notch1. J. Biol.
Chem. 284, 26427–26438.
Inc.
Molecular Cell
NUMB Splicing Regulation by RBM Proteins
McGill, M.A., and McGlade, C.J. (2003). Mammalian numb proteins promote
Notch1 receptor ubiquitination and degradation of the Notch1 intracellular
domain. J. Biol. Chem. 278, 23196–23203.
Misquitta-Ali, C.M., Cheng, E., O’Hanlon, D., Liu, N., McGlade, C.J., Tsao,
M.S., and Blencowe, B.J. (2011). Global profiling and molecular characteriza-
tion of alternative splicing events misregulated in lung cancer. Mol. Cell. Biol.
31, 138–150.
Mourtada-Maarabouni, M., Keen, J., Clark, J., Cooper, C.S., and Williams,
G.T. (2006). Candidate tumor suppressor LUCA-15/RBM5/H37 modulates
expression of apoptosis and cell cycle genes. Exp. Cell Res. 312, 1745–1752.
Mourtada-Maarabouni, M., Sutherland, L.C., Meredith, J.M., and Williams,
G.T. (2003). Simultaneous acceleration of the cell cycle and suppression of
apoptosis by splice variant delta-6 of the candidate tumour suppressor
LUCA-15/RBM5. Genes Cells 8, 109–119.
Mourtada-Maarabouni, M., Sutherland, L.C., and Williams, G.T. (2002).
Candidate tumour suppressor LUCA-15 can regulate multiple apoptotic path-
ways. Apoptosis 7, 421–432.
Nguyen, C.D., Mansfield, R.E., Leung, W., Vaz, P.M., Loughlin, F.E., Grant,
R.P., and Mackay, J.P. (2011). Characterization of a family of RanBP2-type
zinc fingers that can recognize single-stranded RNA. J. Mol. Biol. 407,
273–283.
Oh, J.J., Grosshans, D.R., Wong, S.G., and Slamon, D.J. (1999). Identification
of differentially expressed genes associated with HER-2/neu overexpression
in human breast cancer cells. Nucleic Acids Res. 27, 4008–4017.
Oh, J.J., Razfar, A., Delgado, I., Reed, R.A., Malkina, A., Boctor, B., and
Slamon, D.J. (2006). 3p21.3 tumor suppressor gene H37/Luca15/RBM5
inhibits growth of human lung cancer cells through cell cycle arrest and
apoptosis. Cancer Res. 66, 3419–3427.
Oh, J.J., West, A.R., Fishbein, M.C., and Slamon, D.J. (2002). A candidate
tumor suppressor gene, H37, from the human lung cancer tumor suppressor
locus 3p21.3. Cancer Res. 62, 3207–3213.
Orengo, J.P., Bundman, D., and Cooper, T.A. (2006). A bichromatic fluores-
cent reporter for cell-based screens of alternative splicing. Nucleic Acids
Res. 34, e148.
Pal, S., Gupta, R., and Davuluri, R.V. (2012). Alternative transcription and
splicing in cancer. Pharmacol. Ther. 136, 283–294.
Paronetto, M.P., Minana, B., and Valcarcel, J. (2011). The Ewing sarcoma
protein regulates DNA damage-induced alternative splicing. Mol. Cell 43,
353–368.
Pece, S., Confalonieri, S., Romano, P.R., and Di Fiore, P.P. (2010). NUMB-ing
down cancer by more than just a NOTCH. Biochim. Biophys. Acta. 1815,
26–43.
Purow, B. (2012). Notch inhibition as a promising new approach to cancer
therapy. Adv. Exp. Med. Biol. 727, 305–319.
Ramaswamy, S., Ross, K.N., Lander, E.S., and Golub, T.R. (2003). Amolecular
signature of metastasis in primary solid tumors. Nat. Genet. 33, 49–54.
Ray, D., Kazan, H., Cook, K.B., Weirauch, M.T., Najafabadi, H.S., Li, X.,
Gueroussov, S., Albu, M., Zheng, H., Yang, A., et al. (2013). A compendium
of RNA-binding motifs for decoding gene regulation. Nature 499, 172–177.
Rintala-Maki, N.D., Goard, C.A., Langdon, C.E., Wall, V.E., Traulsen, K.E.,
Morin, C.D., Bonin, M., and Sutherland, L.C. (2007). Expression of RBM5-
related factors in primary breast tissue. J. Cell. Biochem. 100, 1440–1458.
Singh, R., Valcarcel, J., and Green, M.R. (1995). Distinct binding specificities
and functions of higher eukaryotic polypyrimidine tract-binding proteins.
Science 268, 1173–1176.
Song, Z., Wu, P., Ji, P., Zhang, J., Gong, Q., Wu, J., and Shi, Y. (2012). Solution
structure of the second RRM domain of RBM5 and its unusual binding charac-
ters for different RNA targets. Biochemistry 51, 6667–6678.
Molec
Sutherland, L.C., Lerman, M., Williams, G.T., and Miller, B.A. (2001). LUCA-15
suppresses CD95-mediated apoptosis in Jurkat T cells. Oncogene 20, 2713–
2719.
Tollervey, J.R., Curk, T., Rogelj, B., Briese, M., Cereda, M., Kayikci, M., Konig,
J., Hortobagyi, T., Nishimura, A.L., Zupunski, V., et al. (2011). Characterizing
the RNA targets and position-dependent splicing regulation by TDP-43. Nat.
Neurosci. 14, 452–458.
Toriya, M., Tokunaga, A., Sawamoto, K., Nakao, K., and Okano, H. (2006).
Distinct functions of human numb isoforms revealed by misexpression in the
neural stem cell lineage in the Drosophila larval brain. Dev. Neurosci. 28,
142–155.
Ule, J., Ule, A., Spencer, J., Williams, A., Hu, J.S., Cline, M., Wang, H., Clark,
T., Fraser, C., Ruggiu, M., et al. (2005). Nova regulates brain-specific splicing
to shape the synapse. Nat. Genet. 37, 844–852.
Valcarcel, J., Singh, R., Zamore, P.D., and Green, M.R. (1993). The protein
Sex-lethal antagonizes the splicing factor U2AF to regulate alternative splicing
of transformer pre-mRNA. Nature 362, 171–175.
Verdi, J.M., Bashirullah, A., Goldhawk, D.E., Kubu, C.J., Jamali, M., Meakin,
S.O., and Lipshitz, H.D. (1999). Distinct human NUMB isoforms regulate differ-
entiation vs. proliferation in the neuronal lineage. Proc. Natl. Acad. Sci. USA 96,
10472–10476.
Wahl, M.C., Will, C.L., and Luhrmann, R. (2009). The spliceosome: design
principles of a dynamic RNP machine. Cell 136, 701–718.
Wang, Y., Gogol-Doring, A., Hu, H., Frohler, S., Ma, Y., Jens, M., Maaskola, J.,
Murakawa, Y., Quedenau, C., Landthaler, M., et al. (2013). Integrative analysis
revealed the molecular mechanism underlying RBM10-mediated splicing
regulation. EMBO Mol. Med. 5, 1431–1442.
Wang, Z., Kayikci, M., Briese, M., Zarnack, K., Luscombe, N.M., Rot, G.,
Zupan, B., Curk, T., and Ule, J. (2010). iCLIP predicts the dual splicing effects
of TIA-RNA interactions. PLoS Biol. 8, e1000530.
Warzecha, C.C., Jiang, P., Amirikian, K., Dittmar, K.A., Lu, H., Shen, S., Guo,
W., Xing, Y., and Carstens, R.P. (2010). An ESRP-regulated splicing pro-
gramme is abrogated during the epithelial-mesenchymal transition. EMBO J.
29, 3286–3300.
Welling, D.B., Lasak, J.M., Akhmametyeva, E., Ghaheri, B., and Chang, L.S.
(2002). cDNA microarray analysis of vestibular schwannomas. Otol.
Neurotol. 23, 736–748.
Weng, A.P., Nam, Y., Wolfe, M.S., Pear, W.S., Griffin, J.D., Blacklow, S.C., and
Aster, J.C. (2003). Growth suppression of pre-T acute lymphoblastic leukemia
cells by inhibition of notch signaling. Mol. Cell. Biol. 23, 655–664.
Westhoff, B., Colaluca, I.N., D’Ario, G., Donzelli, M., Tosoni, D., Volorio, S.,
Pelosi, G., Spaggiari, L., Mazzarol, G., Viale, G., et al. (2009). Alterations of
the Notch pathway in lung cancer. Proc. Natl. Acad. Sci. USA 106, 22293–
22298.
Xiao, R., Tang, P., Yang, B., Huang, J., Zhou, Y., Shao, C., Li, H., Sun, H.,
Zhang, Y., and Fu, X.D. (2012). Nuclear matrix factor hnRNP U/SAF-A exerts
a global control of alternative splicing by regulating U2 snRNP maturation.
Mol. Cell 45, 656–668.
Xue, Y., Zhou, Y., Wu, T., Zhu, T., Ji, X., Kwon, Y.S., Zhang, C., Yeo, G., Black,
D.L., Sun, H., et al. (2009). Genome-wide analysis of PTB-RNA interactions
reveals a strategy used by the general splicing repressor to modulate exon
inclusion or skipping. Mol. Cell 36, 996–1006.
Yeo, G.W., Coufal, N.G., Liang, T.Y., Peng, G.E., Fu, X.D., and Gage, F.H.
(2009). An RNA code for the FOX2 splicing regulator revealed by mapping
RNA-protein interactions in stem cells. Nat. Struct. Mol. Biol. 16, 130–137.
Zhao, L., Li, R., Shao, C., Li, P., Liu, J., andWang, K. (2012). 3p21.3 tumor sup-
pressor gene RBM5 inhibits growth of human prostate cancer PC-3 cells
through apoptosis. World J. Surg. Oncol. 10, 247.
ular Cell 52, 720–733, December 12, 2013 ª2013 Elsevier Inc. 733


![Finale 2002 - [Comfortably Numb - 0 Score.mus]](https://img.pdfslide.tips/doc/110x75/577cc79b1a28aba711a173f1/finale-2002-comfortably-numb-0-scoremus.jpg)