Embed Size (px)
Citation preview
RCSS ディスカッションペーパーシリーズ ISSN-1347-636X
第 71 号 2008 年 10 月
Discussion Paper Series
No.71 October, 2008
Herd Behavior by Japanese Banks
in Local Financial Markets
Ryuichi Nakagawa
RCSS
文部科学大臣認定 共同利用・共同研究拠点
関西大学ソシオネットワーク戦略研究機構
関西大学ソシオネットワーク戦略研究センター
(文部科学省私立大学学術フロンティア推進拠点)
Research Center of Socionetwork Strategies,
“Academic Frontier” Project for Private Universities, 2003-2009
Supported by Ministry of Education, Culture, Sports, Science and Technology
The Research Institute for Socionetwork Strategies,
Joint Usage / Research Center, MEXT, Japan
Kansai University
Suita, Osaka, 564-8680 Japan
URL: http://www.rcss.kansai-u.ac.jp
http://www.socionetwork.jp
e-mail: [email protected]
tel: 06-6368-1228
fax. 06-6330-3304
Herd Behavior by Japanese Banks
in Local Financial Markets
Ryuichi Nakagawa 1
Faculty of Economics
Kansai University
October 18, 2008
1Address: Faculty of Economics, Kansai University, 3-3-35 Yamate Suita, Osaka 564-
0063, Japan. Phone: +81-6-6368-0590. Fax: +81-6-6339-7704. E-mail: ryu-naka@kansai-
u.ac.jp. URL: http://www2.ipcku.kansai-u.ac.jp/∼ryu-naka/.
Herd Behavior by Japanese Banks
in Local Financial Markets
Ryuichi Nakagawa *
Faculty of Economics, Kansai University
3-3-35 Yamate Suita, Osaka 564-0063, Japan.
Phone: +81-6-6368-0590. Fax: +81-6-6339-7704.
E-mail: [email protected].
Abstract
This paper investigates whether Japanese banks followed herd behavior in lend-
ing in local financial markets during 1980—1999. By using loan data from Japanese
banks, arranged by geographical area, we find leader-follower relationships between
lending behavior of different types of banks. Specifically, herding is mostly caused
by local banks. Local banks follow major banks in urban cities, while local banks
follow each other in regional cities. In addition, herding is more frequent in regional
cities than in urban cities. On the other hand, massive herding by major banks was
observed in urban cities in the late 1980s–the period of the asset-price bubble in
Japan.
Keywords: herd behavior; Japanese banks; local financial market
JEL classification number: G21; E44; R51
*Collaborator for research, RCSS, Kansai University
1
1 Introduction
It has been argued that herd behavior (yokonarabi in Japanese) is a typical action
of Japanese banks, and their behavior has often been criticized as evidence for the
inefficiency of the Japanese financial market. 1 One of the reasons for such behavior
was the existence of a financial regulation system until the late 1970s that forced
banks to operate uniformly in all business areas. Hence, after a series of financial
deregulation measures initiated in the 1980s, bank herding seemed to disappear
because banks were allowed to make their decisions more independently. 2 In
reality, the collective behavior of Japanese banks that appears similar to herding
has been observed and discussed as a factor in macroeconomic fluctuations, such as
the asset-price bubble in the late 1980s and the financial crisis in the late 1990s. 3
In spite of the economical implications mentioned above, very few papers empir-
ically investigate herding by Japanese banks and discuss its effects on the Japanese
economy. Uchida and Nakagawa [34] is the first study that uses data from outstand-
ing loans of Japanese banks, categorized by borrower industry, and identifies the
expansion of the herding of banks of a major type in lending to individual industries
in the late 1980s, by using the techniques of Lakonishok, Shleifer, and Vishny [26].
In addition, Nakagawa and Uchida [29] follow the techniques of Jain and Gupta [23]
and find leader-follower relationships between different types of Japanese banks in
loans to real estate and finance industries in the early to mid-1980s. They imply
that Japanese banks followed herd behavior when choosing borrower industries.
However, existing studies neither investigate whether Japanese banks herd in
lending in individual local cities, nor clarify the differences in the characteristics of
bank herding in urban cities and regional cities. On the other hand, it is reasonable
to predict that herding takes place between banks that are located in the same
1Herding is commonly defined as the action that an agent behaves similarly as other agents by
observing the behavior of others. Theoretical reasons for herding are introduced in Section 2.2For overviews of the Japanese financial system in terms of financial deregulation, see Hoshi and
Kashyap [22], Teranishi [33], and Kitagawa and Kurosawa [25]. Note that some of the deregulation
measures started in the late 1970s. Hoshi and Kashyap [21][22, chapter 7] argue that the financing
deregulation with respect to bond markets was implemented with the huge issuance of government
bonds in the late 1970s.3For example, Ueda [35] discusses the interaction between the asset-price bubble in the late
1980s and the loans that banks simultaneously extended to finance or real estate industries in the
same period. Further, in the early 1990s, most banks adversely contracted those loans. Ogawa
and Kitasaka [31] take the collective contraction of bank loans as the credit crunch that might
have generated the long stagnation of the 1990s.
2
geographical area. Banerjee [3] and Bikhchandani, Hirshleifer, and Welch [5], for
example, define herding as the rational behavior by agents that try to infer unob-
servable information by observing the behavior of other agents. Thus, it is possible
that the existence of bank herding depends upon features of a local financial market,
such as the degree of the informational imperfection of the market and the bank ’
s ability to gather information. 4
The purpose of this paper is to investigate herding by Japanese banks in do-
mestic local financial markets from the 1980s to the 1990s, by using bank loan data
categorized by geographical area. In particular, we examine the difference in char-
acteristics of bank herding in urban cities and in regional cities. Then we identify
the type of banks that tend to follow other banks. Further, we try to detect time
variations in bank herding, by using the technique of Nakagawa and Uchida [29],
and clarify times when bank herding was crucial in local financial markets in Japan.
The results of our analysis show evidence that Japanese banks have been fre-
quently herding in local financial markets. In particular, herding is mostly caused
by banks of local types (regional, second-tier regional, and shinkin banks). Local
banks follow banks of a major type (city banks) in urban cities, while local banks
follow each other in regional cities. In addition, herding is observed more frequently
in regional cities than in urban cities. On the other hand, massive herding by major
banks was observed in urban cities in the late 1980s, the period of the asset-price
bubble in Japan. These results suggest that the inefficiency of bank herding has
been crucial in the Japanese financial market, and the possibility that herding by
major banks might have amplified the asset-price bubble in the late 1980s.
Internationally, many empirical papers focus on bank herding in local financial
markets by using the data that are categorized by geographical area. Jain and
Gupta [23] and Barron and Valev [4] find evidence for herding by US banks in the
1980s by examining their lending behavior to Latin American countries. Chang,
Chaudhuri, and Jayaratne [10] find herding by US banks when opening branches
in new cities, and de Juan [12] detects a similar behavior by Spanish banks. Buch
and Lipponer [7] investigate foreign direct investments of German banks and find
that investments tend to concentrate in OECD countries.
The contributions of our analysis are very fruitful, and are not limited to just
4Kano and Tsutsui [24] find that the bank loan markets in Japan are geographically segmented,
by investigating whether the banks located in adjacent cities set similar interest rates. Their
finding may serve as evidence for herding by neighboring banks in setting their loan interest rates.
3
empirically finding leader-follower relationships in the behavior of Japanese banks.
First, we control for collective behavior of banks that looks like herding and iden-
tify only inefficient bank herding that is inconsistent with economic conditions.
The collective actions of agents can be caused not only by the tendency to follow
other agents, but also by the tendency to follow economic factors that affect their
decisions in the same manner; such as profitability of borrowers, monetary policy,
and financial crisis. Bikhchandani and Sharma [6] call the latter type of collective
behavior spurious herding, which is socially efficient in the sense that the behav-
ior is consistent with economic conditions when agents make investment decisions.5 Previous studies rarely control for spurious herding (e.g., Jain and Gupta [23],
Barron and Valev [4]). Then we identify inefficient bank herding, by controlling for
collective actions of banks that are uniformly caused by macroeconomic factors. 6
Second, we investigate time variations in bank herding by using the technique of
Nakagawa and Uchida [29]. Most studies mainly focus on a specific sample period,
and hence do not clarify whether detected herding is persistent or temporal (e.g.,
Barron and Valev [4]). We confirm the persistence of bank herding by examining
different sample periods.
Our analysis is organized as follows. In the next section, we survey the exist-
ing literature and indicate characteristics of herding that we should focus on in
the empirical analysis. In Section 3, we introduce the characteristics of Japanese
banks in local financial markets and define our methodology to detect bank herd-
ing. Section 4 provides empirical results about herding in urban and regional cities.
Section 5 checks the robustness of previous results by using a different definition of
loan data. Section 6 additionally examines bank herding in adjacent cities. Finally,
we conclude our analysis.
2 Literature
One of theoretical explanations of herd behavior by rational agents is offered by
the informational cascade model of Banerjee [3] and Bikhchandani, Hirshleifer, and
5For example, Ueda [35] gives two reasons why Japanese banks uniformly expanded loans to
real estate-related industries in the period of the asset-price bubble in the late 1980s: herding by
Japanese banks and the expectation of sustained high land values. Collective behavior caused by
the latter reason is taken as spurious herding.6Chang, Chaudhuri, and Jayaratne [10] call spurious herding clustering. Their analysis and
that of Buch and Lipponer [7] control clustering in a similar manner.
4
Welch [5]. The model is that, given imperfect information of the real values of
assets, if an agent not only has his own private information of those values but also
observes the past record of investment decisions made by his predecessors, he may
ignore his own private information and herd on the past decisions. This is because
the agent can learn unobservable values from the behavior of the predecessors. That
herd behavior can cause an inefficient market equilibrium in the sense of ex ante
welfare, as the equilibrium stops accumulating the information of the real values of
the assets. 7
There can be the same situation with bank loans in a local financial market,
where there is information asymmetry between banks and borrowers. If any eco-
nomic conditions are observable, a bank decides its loans based on those conditions
that affect loan demands by borrowers and the bank ’s profit maximization. In
reality, some information is private or unobservable, so this bank tends to learn
from the lending behavior of other banks to realize its optimal lending decisions.
As a result, bank herding can cause an inefficient outcome in which some banks
happen to follow other banks that have given loans to unprofitable borrowers, offer-
ing similar unprofitable loans, while profitable borrowers cannot raise money and
go bankrupt.
If a bank makes lending decisions based on not only economic conditions, but
also on the lending decisions made by other banks, the loan of the banks is deter-
mined as follows: 8
Lst = αs + βs0Zt + γs0L−st . (1)
Lst is the loan variable of bank s in period t. Zt is the vector of economic variables
(e.g., profitability of borrowers, collateral value of land, household expenditure),
and βs is the coefficient vector. L−st represents the vector of the loan variables of
other banks, and γs is the coefficient vector. If bank s has perfect information about
the economy, Lst is explained merely by Zt. If bank s has only imperfect information
and learns from the lending behavior of other banks −s, Lst is also affected by L−st .7Other theories of rational herding are based on sanctions on deviants (e.g., Akerlof [1] and
Hirsleifer and Rasmusen [19]), payoff externalities (Diamond and Dybvig [14] and Devenow and
Welch [13]), receipt of correlated private information (Froot, Scharfstein, and Stein [16] and Hir-
shleifer, Subrahmanyam, and Titman [18]), reputation concerns (Scharfstein and Stein [32]), and
similarity of comparative advantage (Falkenstein [15]). For surveys of herd behavior, see Bikhchan-
dani and Sharma [6], Chamley [9], Devenow and Welch [13], Hirshleifer and Teoh [20], and Welch
[36].8See Chang, Chaudhuri, and Jayaratne [10] and Buch and Lipponer [7] for similar specifications
on bank loan equations.
5
Recent studies extend the informational cascade model. 9 For example, Gul and
Lundholm [17] and Chari and Kehoe [11] clarify that the timing of herd behavior
is endogenized by the cost of gathering information. Calvo and Mendoza [8] indi-
cate that the possibility of herding depends upon the quality of information about
investment opportunities, and suggest that herding tends to happen when agents
invest in assets about which the agents have little information. Barron and Valev
[4] show that agents with less wealth tend to avoid information gathering and follow
agents with more wealth who can easily get information. In addition, Nelson [30]
shows that herd behavior is long-lived as long as economic conditions are stable
across time. This is because the past decisions of predecessors that reflect past
economic conditions remain informative to successors to infer current conditions.
According to these theoretical predictions, bank herding seems to be common
in regional loan markets where the quality of information about the borrowers is
relatively low. In addition, herding may be caused by small banks that cannot
afford information-gathering costs. Furthermore, bank herding in Japan may have
been more observed in the stable period in the 1980s than in the fluctuating period
in the 1990s. Thus, we focus on bank loan data that are categorized by bank type
and by geographical area to not only detect the existence of bank herding, but
also to confirm whether our empirical results are consistent with these theoretical
predictions.
3 Loan Data and Methodology
In the following section, we introduce our data and the methodology of our analysis.
Sources of our data are shown in the data appendix.
3.1 Descriptive Statistics of Bank Loans
The types of Japanese banks we focus on in this paper are city banks, regional
banks, second-tier regional banks (hereafter, Reg-2), and shinkin banks. 10
9Chamley [9, chapter 4] surveys the disadvantages of the informational cascade model and
other recent studies.10Other financial institutions in Japan include long-term credit banks, trust banks, credit co-
operatives, labor banks, agricultural cooperatives, and so on. We exclude them from our analysis
because some of their loan shares are negligible, and because some of the above institutions operate
in a small number of cities so that it is difficult to analyze from our viewpoint.
6
Table 1 shows the number of banks of different types and their average outstand-
ing domestic loans. City banks are the biggest banks that have a main branch office
in an urban city and operate nationwide. Their lines of operation include not only
commercial banking but also investment and international banking. They domi-
nate about 40 percent of total domestic loans outstanding of all Japanese financial
institutions. On the other hand, regional, Reg-2, and shinkin banks are local types
of banks that have a main branch office in a local city and operate mainly inside
the city in which they are located. These local banks all have a comparable size
of loans outstanding, and their businesses are closely connected to local economies
and governments.
Figure 1 shows the Lorenz curves of loan allocations by bank type to capture how
different types of banks allocate their loans in local financial markets, in addition
to the curve of the nominal GDP. There are 47 prefectures in Japan: Tokyo is the
largest in terms of nominal GDP, and Tottori is the smallest. Comparing the curves
of loans of each type with that of the GDP, we can figure out to what extent banks
of each type allocate their loans disproportionately to the size of the GDP of each
prefecture. The line for city banks is considerably lower than that of the GDP,
implying that the loans of city banks concentrate on urban prefectures. On the
other hand, the lines of local banks are almost parallel with the line of the GDP,
implying that their loans are allocated proportionately in each prefecture.
Figure 2 shows loan shares of bank types in individual prefectures. Here pre-
fectures are divided into three categories in terms of the size of the nominal GDP
by prefecture. Panel A indicates that city banks dominate urban prefectures. On
the other hand, Panels B and C show that the shares of city banks are negligible as
less than 10 percent in other categories. City banks, then, seem to have a marginal
role in regional financial markets.
By omitting city banks, Figure 3 shows only the loan shares of local banks.
Regional banks have the largest share in each category, but the structure of the
shares of local banks is almost similar across all categories. Each bank of local
types, therefore, seems to have a similar contribution to the local city in which the
bank is located.
In summary, city banks have a large weight in lending in urban financial markets
and have the largest share of all types, while other local types have an equal weight in
lending in individual markets. It is therefore likely that the characteristics of bank
herding may be different between urban and regional cities, possibly depending
7
upon the performance of city banks in loan financial markets.
3.2 Methodology
By using loan data of different types of Japanese banks by prefecture, we examine
herd behavior by one type of banks on the other types. According to Eq. (1), we
estimate a dynamic panel fixed-effect model of the loan function of a bank type:
Lsi,t = αsi + βs0Zi,t−1 + γs0L−si,t−1 + δsLsi,t−1 + ²si,t. (2)
Lsi,t is the loan variable of bank type s in prefecture i in period t. Zi,t is the vector
that includes economic variables of prefecture i that may affect the equilibrium
bank loans in that prefecture, and βs is the coefficient vector. L−si,t is the vector of
the loan variables of bank types other than type s, and γs is the coefficient vector.
If γs is significantly different from zero, we obtain evidence that type s herds on
the lending behavior of other types −s. Here we also introduce a predetermineddependent variable Lsi,t−1 as an additional explanatory variable, which seems to
be determined by past macroeconomic conditions, in order to control for those
conditions as much as possible, and δs is the coefficient parameter. We introduce
lagged variables as explanatory variables to avoid the endogeneity bias problem of
estimation. ²si,t is an error term.
Our sample period is 1977 to 1999. Bank herding in the late 1970s is not our
concern because of the existence of financial regulation measures that might have
forced banks to herd. We include the late 1970s sample period into our analy-
sis to capture time variations in bank herding from the regulation period to the
deregulation period in the 1980s.
As the loan variable Lsi,t, we utilize the ratio of loans by bank type s in prefecture
i in period t to the total loans of the same type in Japan. Thus we examine herding
by type s in their loan portfolio decisions across prefectures. 11
11We do not use the level of loans outstanding. Those data tend to generate spurious relation-
ships between the loan variables of different bank types more than the ratio data do, because the
level data seem to be simultaneously affected by macroeconomic variables. One might argue that
the ratio data have more difficulties in capturing bank-lending behavior. This is because there can
be the case that an increase in loans outstanding of a bank type in a prefecture not only raises
loan ratios of this prefecture, but also reduces the ratios of the type in other prefectures through
an increase in domestic total loans of the type (denominator of the ratio). This is so even though
there are no changes in loans outstanding in the latter prefectures. However, this effect would
be negligible, because the number of prefectures, 47, is large and a change in loans outstanding
8
As the economic variables vector Zi,t, we use seven variables: (1)—(4) the ratio of
the prefectural GDP by industry–primary, secondary, and tertiary industries, and
government services–to the nationwide GDP by industry; (5) the ratio of the land
value by prefecture to the nationwide value; (6) the ratio of total debt of bankrupt
firms by prefecture to the nationwide value, and (7) the ratio of dwelling units of
new housing construction by prefecture to the nationwide value. 12 A reason for
using ratios of economic variables is to control for economic factors that similarly
affect loan allocations across prefectures of different types. 13
To estimate Eq. (2), we follow the two-step GMM estimation developed by
Arellano and Bond [2]. In order to examine time variations in the herding parameter
(γs), we utilize the technique of the sequential causality test introduced by Nakagawa
and Uchida [29]. 14
4 Empirical Results
First, we investigate common characteristics of bank herding behavior by using the
loan ratios of all prefectures. Next, we categorize the data into urban prefectures
and regional prefectures, and clarify differences in bank herding in the two areas.
4.1 Herding in All Prefectures
Figure 4 shows the results by using data from all prefectures. Each panel shows
leader-follower relationships from one bank type (row) to the other type (column).
We find evidence for frequent herding between local banks; in particular, shinkin
banks followed regional and Reg-2 banks, and Reg-2 banks followed shinkin banks.
On the other hand, relationships between city banks and local banks are rarely
in one prefecture would hardly affect the total loans of the type. In reality, we do not find such
evidence in our empirical results, so the ratio data are valid.12For a robustness check, we did the same tests by using a different set of macroeconomic
variables; for example, total GDP by prefecture, GDP of the finance and insurance industry, GDP
of the real estate industry, land value by prefecture, total debt of bankrupt firms by prefecture,
and dwelling units of new housing construction by prefecture. The results are similar.13Note that variables that may uniformly affect all prefectures (e.g., call rates, total real GDP,
domestic nonperforming loans) are not included in Zi,t, because those variables are thought not
to change loan allocations across prefectures.14The sequential causality test is: (1) we estimate γs focusing on a 5-year span of the whole
sample period; (2) we sequentially change the period by one year and estimate γs.
9
observed. This result suggests that herding by Japanese banks in local financial
markets tends to occur only between local banks.
4.2 Herding in Urban Prefectures
Next, according to the categorization in Figure 2, we separately investigate bank
herding in (A) urban prefectures (1st—15th) and (C) regional prefectures (31st—
47th). 15
Figure 5 shows herding in urban prefectures. A new finding is that local banks
herded frequently on the behavior of city banks. City banks have weight in lending
in urban prefectures, and have their largest share of loans outstanding there. The
results imply that local banks try to get additional information by observing the
lending behavior of city banks, possibly because city banks are thought to have
valuable information. On the other hand, herding between local banks is not so
persistent as the results in Figure 4. In urban prefectures, local banks might not
have to follow each other, possibly because of the existence of city banks.
For the Japanese economy, one more interesting finding is herding by city banks
on the behavior of regional banks in the late 1980s, the period of the asset-price
bubble. This implies that herding by city banks in urban prefectures might have
amplified the macroeconomic fluctuation. 16
4.3 Herding in Regional Prefectures
Figure 6 displays results of bank herding in regional prefectures. These results are
in contrast those of urban prefectures. Local banks herded on the behavior of each
other, while city banks had no persistent relationships with local banks. In addition,
their herding is observed more frequently than in urban prefectures.
This may be the result of city banks having a negligible loan share in regional
prefectures. Commonly, city banks seem to have a greatest ability to gather in-
formation and lead other banks. By looking at the negligible loan share, however,
local banks might think that city banks have little information about regional bor-
rowers. Instead, local banks herded on the behavior of each other, as they had a
large share in regional prefectures. This feature suggests that the size of loans can
15We could not find clear evidence when using the data of (B) medium-sized prefectures, possibly
because the results of urban and regional prefectures are mixed. We therefore omit the results.16This result is consistent with Uchida and Nakagawa [34].
10
be taken as a better signal of the degree of an agent ’s information gathering and
becomes the more important factor to determine the direction of bank herding than
can the size of the bank itself. In addition, this result emphasizes that, in Japan,
local banks have important roles in local economies even though their nationwide
shares of loans are marginal.
In this section, we find that herding by Japanese banks has been frequent and
has caused inefficiency in the Japanese financial markets. In particular, local banks
frequently followed herd behavior in that they followed those that had a large share
in a local financial market, such as city banks in urban prefectures and other local
banks in regional prefectures. In addition, herding is frequent in regional prefec-
tures. On the other hand, massive herding by city banks was observed in urban
prefectures in the late 1980s, the period of the asset-price bubble in Japan.
5 Robustness Check
In previous sections, we examined bank herding in lending in a local financial market
by using the loan ratio by prefecture as a loan variable in the estimation. Next, we
check the robustness of our results by using the data of the growth rate of loans
outstanding in the prefecture.
Figure 7 shows the results of herding in urban prefectures. Because loan data are
differenced, significant evidence for herding tends to be less observed. However, we
confirm herding by local banks on the behavior of city banks, as shown in Figure 5.
Herding by city banks in the late 1980s in urban prefectures is also found.
Figure 8 reports the results of herding in regional prefectures. We confirm the
same results as those in Figure 6. City banks had no relationships with local banks.
Local banks herded on the behavior of each other consistently.
These results confirm the robustness of the previous results.
6 Herding in Adjacent Prefectures
Previously we categorized loan data in terms of the economic size of the prefecture
and found characteristics of bank herding in similar-sized local financial markets.
The purpose was to capture differences in bank herding in urban and regional cities.
At that time, we were not concerned about whether or not those prefectures were
adjacent to each other.
11
Finally, we take data from geographically adjacent prefectures and examine the
features of bank herding in adjacent cities, including urban and regional prefectures
together. City banks are different from local banks in that they often make loans
not only inside an urban prefecture that they dominate, but also in surrounding
regional prefectures. Naturally, it is possible that their lending behavior affect local
banks not only in the urban prefecture, but also in the regional prefectures in the
same manner. For example, if city banks lead local banks in an urban prefecture,
they may lead local banks in surrounding regional prefectures as well, irrespective
of whether or not city banks have a large loan share there. If so, there can be bank
herding that we failed to capture in the previous categorization of the data. Here
we focus on the Tokyo region—the largest economic area of Japan—and try the same
tests by using the loan data of the region. 17
Figure 9 shows the results of the analysis. It is interesting that leader-follower
relationships are found not only between local banks, but also between city banks
and local banks. The evidence for herding by local banks is similar to that in
the analysis of urban prefectures. This result indicates the possibility that local
banks tend to follow city banks even in regional prefectures, if they are near urban
prefectures where city banks lead local banks. This also provides a theoretical
suggestion that the geographical distance between two agents is an important factor
to characterize their herding behavior.
7 Conclusion
We have investigated herd behavior by Japanese banks in local financial markets.
Herding is rational behavior to discover unobservable information by referring to
other agents. In Japan, it has been often discussed that Japanese banks have
engaged in herding behavior, while very few papers empirically investigated the
existence of herding. We have tested the existence of leader-follower relationships
between the behavior of different types of Japanese banks in local financial markets,
by estimating a loan equation in which the loan variable of a bank type is regressed
not only on macroeconomic variables, but also on the loan variables of other types.
Our results indicated that Japanese banks have been frequently following herd
behavior in local financial markets. In particular, local banks (regional, second-
tier regional, and shinkin banks) herd in that they follow those that have a large
17The Tokyo region includes Tokyo, Ibaraki, Tochigi, Gunma, Saitama, Chiba, and Kanagawa.
12
share in a local financial market, in other words, major banks (city banks) in urban
cities and other local banks in regional cities. In addition, herding is observed
more frequently in regional cities than in urban cities. On the other hand, massive
herding by major banks was observed in urban cities in the late 1980s, the period
of the asset-price bubble in Japan. Our results are robust if we focus on the growth
rate of loans outstanding by city.
These results implied that inefficiency in the Japanese loan market has been
partly caused by bank herding, and that herding had a potential to amplify macroe-
conomic fluctuations in Japan.
Several potential studies remain, depending upon data availability. First, our
loan data are aggregated by bank type. If we examine whether empirical findings
are consistent with a certain theory of rational herding, we should analyze panel
data of individual Japanese banks and clarify the lending behavior of each bank.
Second, we focus on the loans outstanding by prefecture and examine the lending
behavior of banks in the prefecture. Herding seems to appear when banks make
loans to a specific firm. If so, we should focus on loans outstanding of each bank to
individual borrowers.
Data Appendix
The original sources of our data that are categorized by prefecture are shown below.
1. Bank Loan:
Data of loans outstanding from Japanese banks of different types are gathered
from the Financial Journal Monthly (Gekkan Kin-yu Journal in Japanese)
published by the Japan Financial News Co., Ltd. Some of data have structural
shifts because of bank mergers in 1984 and bankruptcy in 1998. They are
controlled for with dummy variables of both years.
2. Nominal GDP:
Data of nominal GDPs by industry are available from the Annual Report on
National Accounts published by the Cabinet Office of Japan. Necessary data
are scattered in different versions, and then data during 1970 — 1974, 1975 —
1988, 1989, and 1990 — 2003 are gathered from Report 1981, 1991, 1996, and
2007, respectively.
13
3. Land Value:
Data of land values are available from“ Average Value of Publicly Assessed
Land” prepared by the Ministry of Land, Infrastructure, Transport, and
Tourism of Japan. These data only show average land prices by prefecture.
So, the total land value of a prefecture is calculated by multiplying the average
land price of the prefecture by the area of the prefecture. The domestic total
land value is calculated by summing all total land values of the prefectures.
4. Debt of Bankrupt Firms:
Data of total debts of bankrupt firms are provided by Tokyo Shoko Research,
Ltd.
5. New Housing Construction:
Data about new housing construction are available from“ Dwelling Units of
New Housing Construction”prepared by the Ministry of Land, Infrastructure,
Transport, and Tourism of Japan.
In the analysis, we also utilize Nikkei NEEDS Financial Quest and Toyo Keizai
Data Bank in Local Economies to gather data effectively.
Acknowledgements
This paper was presented at the 3rd International Symposium on Economic The-
ory, Policy, and Applications, Athens, and several seminars in Osaka, Japan. The
authors are grateful to Akira Furukawa, Toru Iwane, Masaaki Kitagawa, Hirofumi
Nanba, Hideo Okamura, and Atsushi Tanaka for helpful comments. However, the
authors are solely responsible for any remaining errors. For access to data, he thanks
Daisuke Ishikawa and Yoshiro Tsutsui. For financial support, he thanks Japan ’s
Ministry of Education, Culture, Sports, Science and Technology for Grant-in-Aid
for Young Scientists (B) (No.20730139), the Research Institute for Socionetwork
Strategies of Kansai University, Nomura Foundation for Academic Promotion, and
Osaka Bankers Association for Special Award & Grant for Studies in Economics
and Finance.
14

References
[1] G.A. Akerlof. A Theory of Social Custom, of Which Unemployment May be
One Consequence. Quarterly Journal of Economics, vol.94, no.4, 1980, pp.749—
775.
[2] M. Arellano and S. Bond. Some Tests of Specification for Panel Data: Monte
Carlo Evidence and an Application to Employment Equations. Review of Eco-
nomic Studies, vol.58, no.2, 1991, pp.277—297.
[3] A. Banerjee. A Simple Model of Herd Behavior. Quarterly Journal of Eco-
nomics, vol.107, no.3, 1992, pp.797—817.
[4] J.M. Barron and N.T. Valev. International Lending by U.S. Banks. Journal of
Money, Credit, and Banking, vol.32, no.3, 2000, pp.357—381.
[5] S. Bikhchandani, D. Hirshleifer, and I. Welch. A Theory of Fads, Fashion,
Custom, and Cultural Change as Informational Cascades. Journal of Political
Economy, vol.100, no.5, 1992, pp.992—1026.
[6] S. Bikhchandani and S. Sharma. Herd Behavior in Financial Markets. IMF
Staff Papers, vol.47, no.3, 2001, pp.279—310.
[7] C.M. Buch and A. Lipponer. Clustering or Competition? The Foreign Invest-
ment Behaviour of German Banks International Journal of Central Banking,
Vol.2, No.2, 2006, pp.135—168.
[8] G.A. Calvo and E.G. Mendoza. Rational Herd Behavior and the Globalization
of Securities Markets. Federal Reserve Bank of Minneapolis Discussion Paper,
no.120, 1997.
[9] C.P. Chamley. Rational Herds: Economic Models of Social Learning, Cam-
bridge University Press, 2004.
[10] A. Chang, S. Chaudhuri, and J. Jayaratne. Rational Herding and the Spatial
Clustering of Bank Branches: An Empirical Analysis. Federal Reserve Bank
of New York Research Paper, no.9724, 1997.
[11] V.V. Chari and P.J. Kehoe. Financial Crises as Herds: Overturning the Cri-
tiques. Journal of Economic Theory, vol.119, no.1, 2004, pp.128—150.
15
[12] R. de Juan. The Independent Submarkets Model: An Application to the Span-
ish Retail Banking Market. International Journal of Industrial Organization,
vol.21, no.10, 2003, pp.1461—1487.
[13] A. Devenow and I. Welch. Rational Herding in Financial Economics. European
Economic Review, vol.40, no.3-5, 1996, pp.603—615.
[14] D.W. Diamond and P. Dybvig. Bank Runs, Deposit Insurance, and Liquidity.
Journal of Political Economy, vol.91, no.3, 1983, pp.401—419.
[15] E.G. Falkenstein. Preferences for Stock Characteristics as Revealed by Mutual
Fund Portfolio Holdings. Journal of Finance, vol.51, no.1, 1996, pp.111—135.
[16] K. Froot, D.S. Scharfstein, and J.C. Stein. Herd on the Street: Informational
Inefficiencies in a Market with Short-term Speculation. Journal of Finance,
vol.47, no.4, 1992, pp.1461—1484.
[17] F. Gul and R. Lundholm. Endogenous Timing and the Clustering of Agents’
Decisions. Journal of Political Economy, vol.103, no.5, 1995, pp.1039—1066.
[18] D. Hirshleifer, A. Subrahmanyam, and S. Titman. Security Analysis and Trad-
ing Patterns when Some Investors Receive Information before Others. Journal
of Finance, vol.49, no.5, 1994, pp.1665—1698.
[19] D. Hirsleifer and E. Rasmusen. Cooperation in a Repeated Prisoners’Dilemma
with Ostracism. Journal of Economic Behavior and Organization, vol.12, no.1,
1989, pp.87—106.
[20] D. Hirshleifer and S.H. Teoh. Herd Behavior and Cascading in Capital Markets:
A Review and Synthesis. European Financial Management, vol.9, no.1, 2003,
pp.23—66.
[21] T. Hoshi and A. Kashyap. The Japanese Banking Crisis: Where Did it Come
From and How Will it End? NBER Macroeconomic Annual 1999, 2000.
[22] T. Hoshi and A. Kashyap. Corporate Financing and Governance in Japan,
MIT Press, 2001.
[23] A.K. Jain and S. Gupta. Some Evidence on ‘Herding’ Behavior of U.S. Banks.
Journal of Money, Credit and Banking, vol.19, no.1, 1987, pp.78—89.
16
[24] M. Kano and Y. Tsutsui. Geographical Segmentation in Japanese Bank Loan
Markets. Regional Science & Urban Economics, vol.33, no.2, 2003, pp.157—174.
[25] H. Kitagawa and Y. Kurosawa. Japan: Development and Structural Change
of the Banking System. In H.T. Patrick and Y.C. Park eds, The Financial
Development of Japan, Korea, and Taiwan, Oxford University Press, 1994,
pp.81—128.
[26] J. Lakonishok, A. Shleifer, and R.V. Vishny. The Impact of Institutional Trad-
ing on Stock Prices. Journal of Financial Economics, vol.32, no.1, 1992, pp.23—
43.
[27] R. Larsson, J. Lyhagen, and M. Lothgren. Likelihood-based Cointegration
Tests in Heterogeneous Panels. Econometrics Journal, vol.4, no.1, 2001,
pp.109—142.
[28] L. Menkhoff, U. Schmidt, and T. Brozynski. The Impact of Experience on
Risk Taking, Overconfidence, and Herding of Fund Managers: Complementary
Survey Evidence. European Economic Review, vol.50, no.7, 2006, pp.1753—
1766.
[29] R. Nakagawa and H. Uchida. Herd Behavior by Japanese Banks after Financial
Deregulation in the 1980s. Center on Japanese Economy Business Working
Paper (Columbia University), no.257, 2007.
[30] L. Nelson, Persistence and Reversal in Herd Behavior: Theory and Application
to the Decision to Go Public. Review of Financial Studies, vol.15, no.1, 2002,
pp.65—95.
[31] K. Ogawa and S-I. Kitasaka. Bank Lending in Japan: Its Determinants and
Macroeconomic Implications. In T. Hoshi and H. Patrick eds, Crisis and
Change in the Japanese Financial System, Kluwer Academic Publishers, 2000,
pp.159—199.
[32] D.S. Scharfstein and J.C. Stein. Herd Behavior and Investment. American
Economic Review, vol.80, no.3, 1990, pp.465—479.
[33] J. Teranishi. Japan: Development and Structural Change of the Financial
System. In H.T. Patrick and Y.C. Park eds, The Financial Development of
Japan, Korea, and Taiwan, Oxford University Press, 1994, pp.27—80.
17
[34] H. Uchida and R. Nakagawa. Herd Behavior in the Japanese Loan Market:
Evidence from Bank Panel Data. Journal of Financial Intermediation, vol.16,
no.4, 2007, pp.555—583.
[35] K. Ueda. Causes of Japan’s Banking Problems in the 1990s. In T. Hoshi and
H. Patrick eds, Crisis and Change in the Japanese Financial System, Kluwer
Academic Publishers, 2000, pp.59—81.
[36] I. Welch. Herding among Security Analysts Herding. Journal of Financial
Economics, vol.58, no.3, 2000, pp.369—396.
18
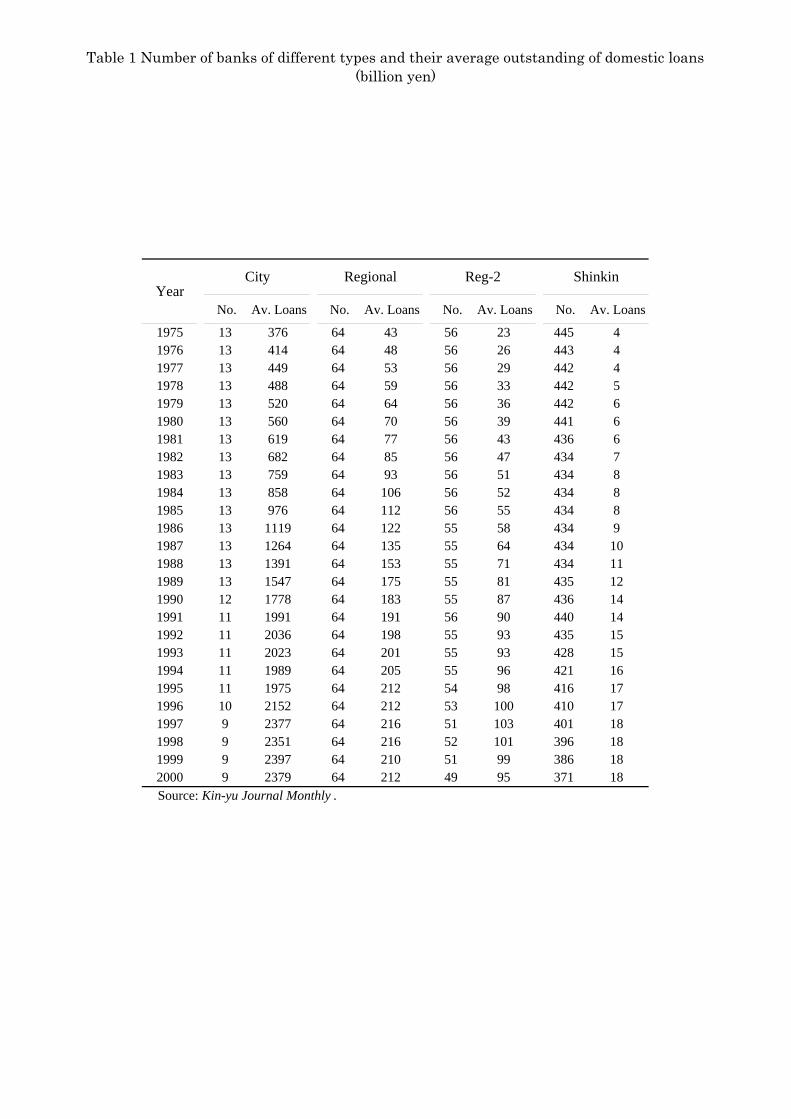
Table 1 Number of banks of different types and their average outstanding of domestic loans(billion yen)
No. Av. Loans No. Av. Loans No. Av. Loans No. Av. Loans
1975 13 376 64 43 56 23 445 41976 13 414 64 48 56 26 443 41977 13 449 64 53 56 29 442 41978 13 488 64 59 56 33 442 51979 13 520 64 64 56 36 442 61980 13 560 64 70 56 39 441 61981 13 619 64 77 56 43 436 61982 13 682 64 85 56 47 434 71983 13 759 64 93 56 51 434 81984 13 858 64 106 56 52 434 81985 13 976 64 112 56 55 434 81986 13 1119 64 122 55 58 434 91987 13 1264 64 135 55 64 434 101988 13 1391 64 153 55 71 434 111989 13 1547 64 175 55 81 435 121990 12 1778 64 183 55 87 436 141991 11 1991 64 191 56 90 440 141992 11 2036 64 198 55 93 435 151993 11 2023 64 201 55 93 428 151994 11 1989 64 205 55 96 421 161995 11 1975 64 212 54 98 416 171996 10 2152 64 212 53 100 410 171997 9 2377 64 216 51 103 401 181998 9 2351 64 216 52 101 396 181999 9 2397 64 210 51 99 386 182000 9 2379 64 212 49 95 371 18Source: Kin-yu Journal Monthly .
City Regional ShinkinReg-2Year
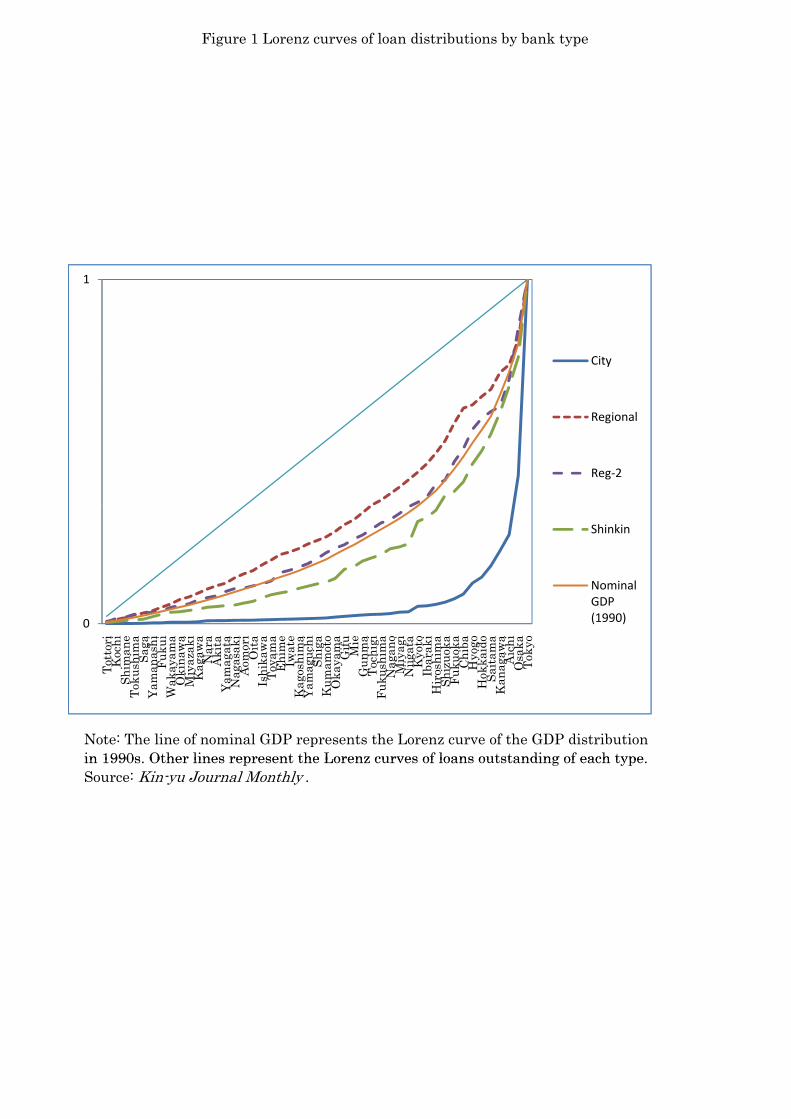
Figure 1 Lorenz curves of loan distributions by bank type
1
City
Regional
Reg‐2
0
Shinkin
NominalGDP(1990)
Note: The line of nominal GDP represents the Lorenz curve of the GDP distributionin 1990s Other lines represent the Lorenz curves of loans outstanding of each type
Tott
ori
Koc
hiSh
iman
eTo
kush
ima
Saga
Yam
anas
hiFu
kui
Wak
ayam
aO
kina
wa
Miy
azak
iK
agaw
aN
ara
Aki
taYa
mag
ata
Nag
asak
iA
omor
iO
itaIs
hika
wa
Toya
ma
Ehi
me
Iwat
eK
agos
him
aYa
mag
uchi
Shig
aK
umam
oto
Oka
yam
aG
ifu Mie
Gun
ma
Toch
igi
Fuku
shim
aN
agan
oM
iyag
iN
iigat
aK
yoto
Ibar
aki
Hir
oshi
ma
Shiz
uoka
Fuku
oka
Chi
baH
yogo
Hok
kaid
oSa
itam
aK
anag
awa
Aic
hiO
saka
Toky
o
in 1990s. Other lines represent the Lorenz curves of loans outstanding of each type.Source: Kin-yu Journal Monthly .
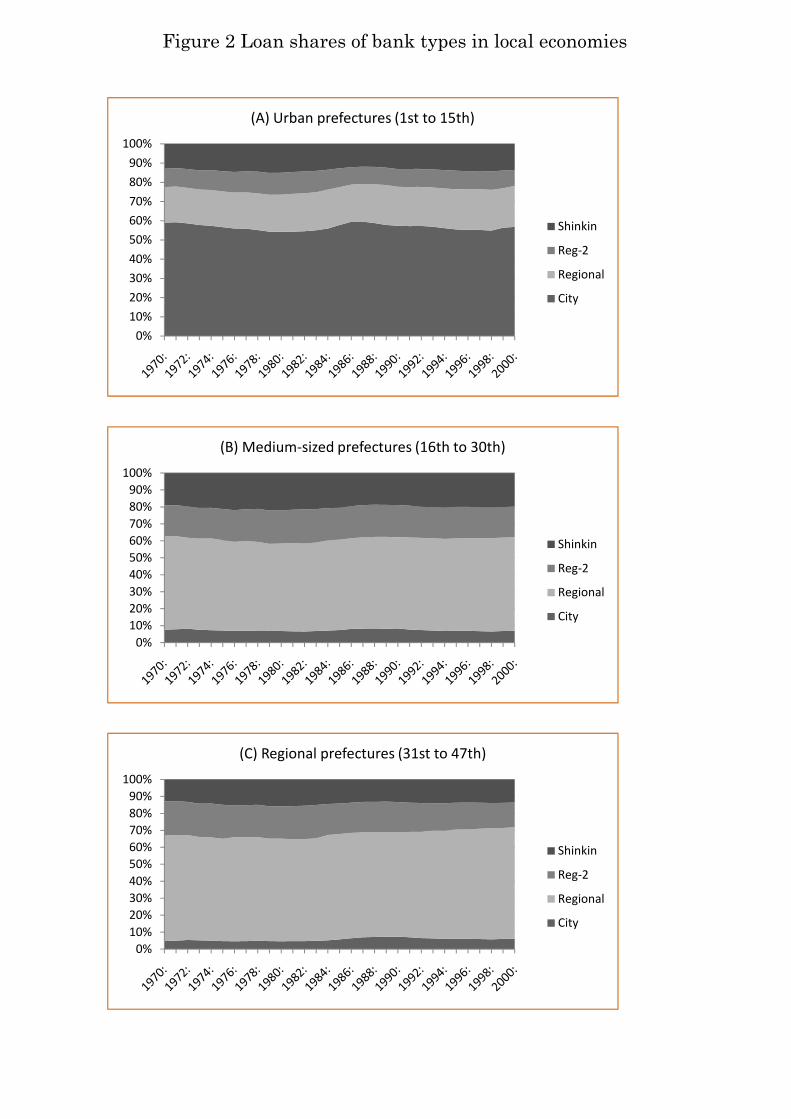
Figure 2 Loan shares of bank types in local economies
0%
10%
20%
30%
40%
50%
60%
70%
80%
90%
100%
(A) Urban prefectures (1st to 15th)
Shinkin
Reg‐2
Regional
City
80%
90%
100%
(B) Medium‐sized prefectures (16th to 30th)
0%
10%
20%
30%
40%
50%
60%
70%
80%
Shinkin
Reg‐2
Regional
City
0%
10%
20%
30%
40%
50%
60%
70%
80%
90%
100%
(C) Regional prefectures (31st to 47th)
Shinkin
Reg‐2
Regional
City
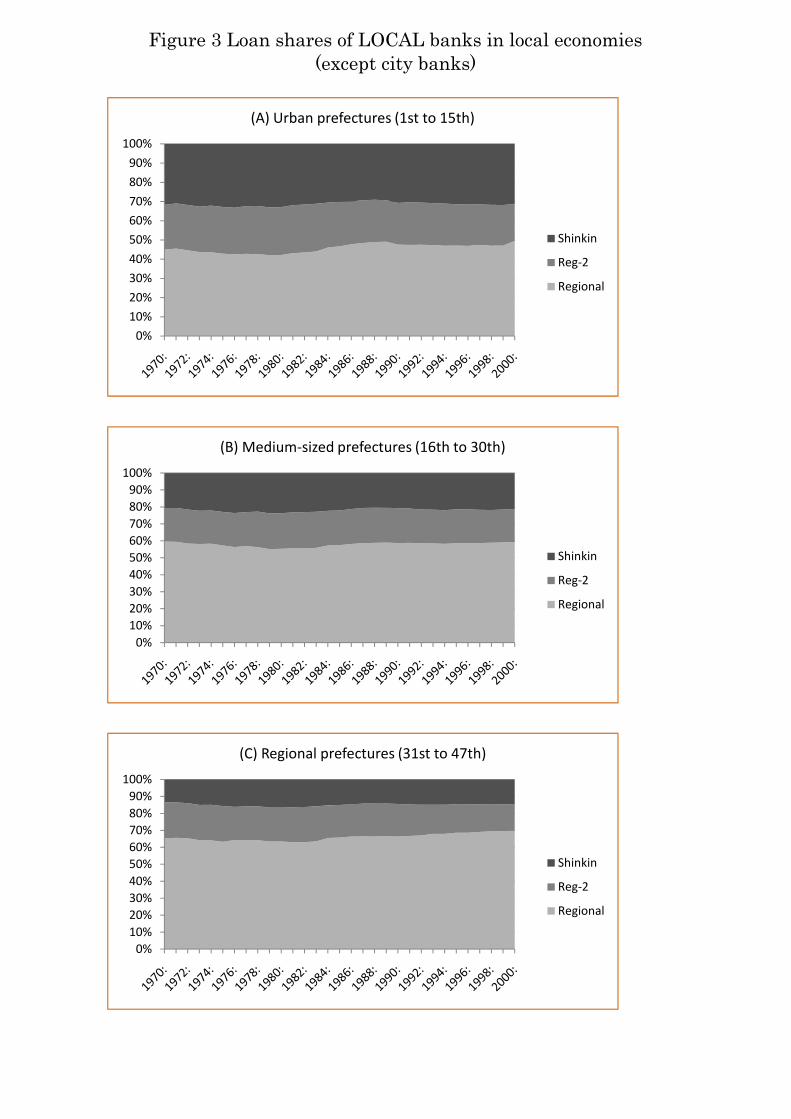
Figure 3 Loan shares of LOCAL banks in local economies(except city banks)
0%
10%
20%
30%
40%
50%
60%
70%
80%
90%
100%
(A) Urban prefectures (1st to 15th)
Shinkin
Reg‐2
Regional
80%
90%
100%
(B) Medium‐sized prefectures (16th to 30th)
0%
10%
20%
30%
40%
50%
60%
70%
80%
Shinkin
Reg‐2
Regional
0%
10%
20%
30%
40%
50%
60%
70%
80%
90%
100%
(C) Regional prefectures (31st to 47th)
Shinkin
Reg‐2
Regional
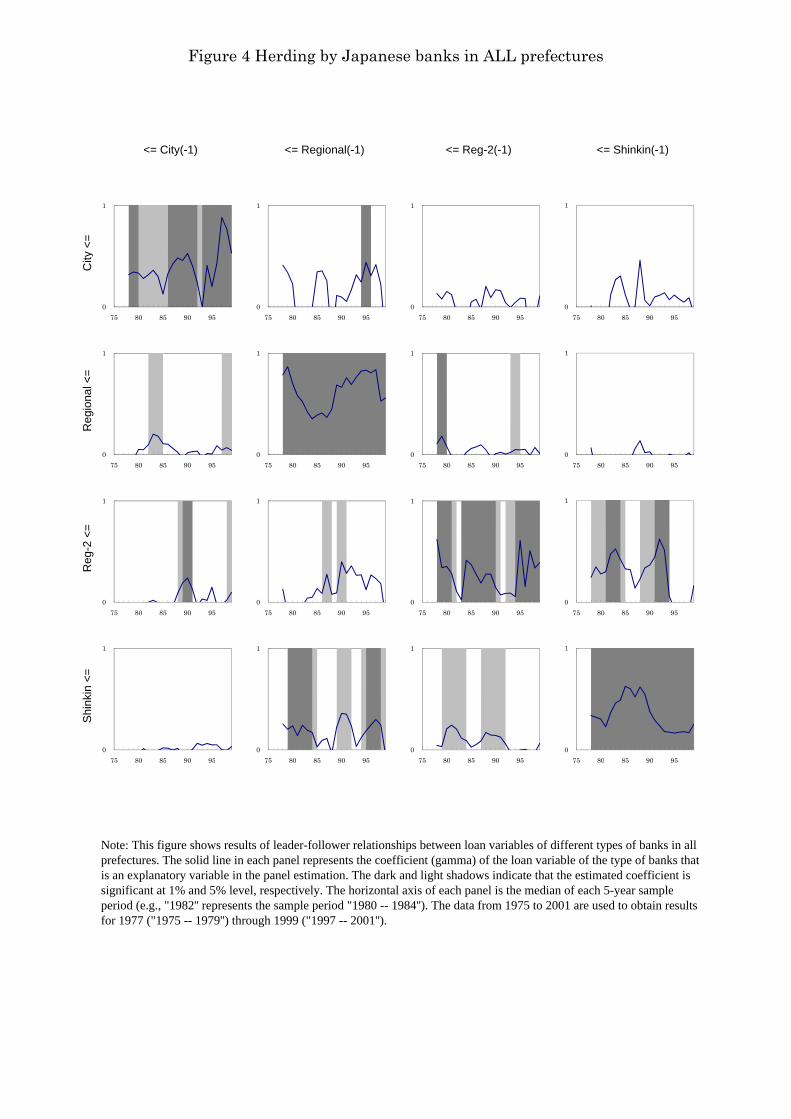
Figure 4 Herding by Japanese banks in ALL prefectures
<= City(-1) <= Regional(-1) <= Reg-2(-1) <= Shinkin(-1)
y <
=
1 1 1 1
City
<=
0 75 80 85 90 95
0 75 80 85 90 95
0 75 80 85 90 95
0 75 80 85 90 95
1 1 1 1
Reg
iona
l <
0 75 80 85 90 95
0 75 80 85 90 95
0 75 80 85 90 95
0 75 80 85 90 95
1 1 1 1
Reg
-2 <
=
0 75 80 85 90 95
0 75 80 85 90 95
0 75 80 85 90 95
0 75 80 85 90 95
Shi
nkin
<=
0
1
75 80 85 90 950
1
75 80 85 90 950
1
75 80 85 90 950
1
75 80 85 90 95
Note: This figure shows results of leader-follower relationships between loan variables of different types of banks in allprefectures. The solid line in each panel represents the coefficient (gamma) of the loan variable of the type of banks thatis an explanatory variable in the panel estimation. The dark and light shadows indicate that the estimated coefficient is
75 80 85 90 9575 80 85 90 95 75 80 85 90 9575 80 85 90 95
significant at 1% and 5% level, respectively. The horizontal axis of each panel is the median of each 5-year sampleperiod (e.g., "1982'' represents the sample period "1980 -- 1984''). The data from 1975 to 2001 are used to obtain resultsfor 1977 ("1975 -- 1979'') through 1999 ("1997 -- 2001'').
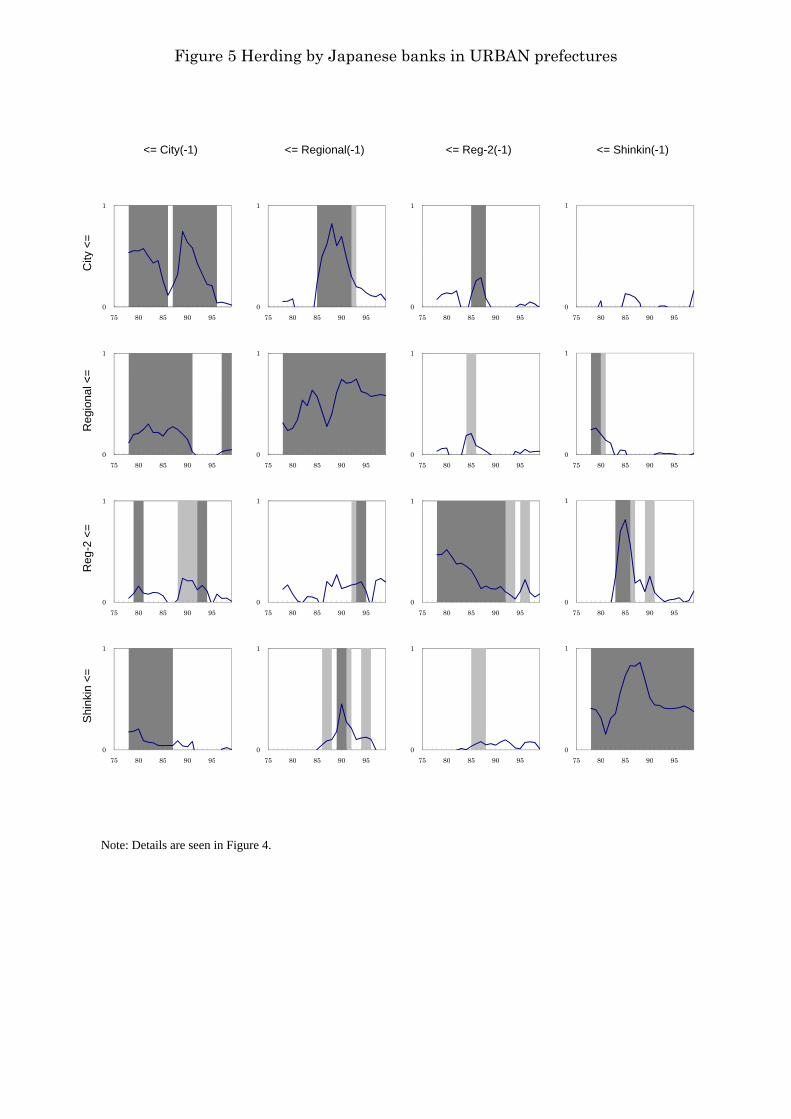
Figure 5 Herding by Japanese banks in URBAN prefectures
<= City(-1) <= Regional(-1) <= Reg-2(-1) <= Shinkin(-1)
y <
=
1 1 1 1
City
<=
0 75 80 85 90 95
0 75 80 85 90 95
0 75 80 85 90 95
0 75 80 85 90 95
1 1 1 1
Reg
iona
l <
0 75 80 85 90 95
0 75 80 85 90 95
0 75 80 85 90 95
0 75 80 85 90 95
1 1 1 1
Reg
-2 <
=
0 75 80 85 90 95
0 75 80 85 90 95
0 75 80 85 90 95
0 75 80 85 90 95
Shi
nkin
<=
0
1
75 80 85 90 950
1
75 80 85 90 950
1
75 80 85 90 950
1
75 80 85 90 95
Note: Details are seen in Figure 4.
75 80 85 90 9575 80 85 90 95 75 80 85 90 9575 80 85 90 95
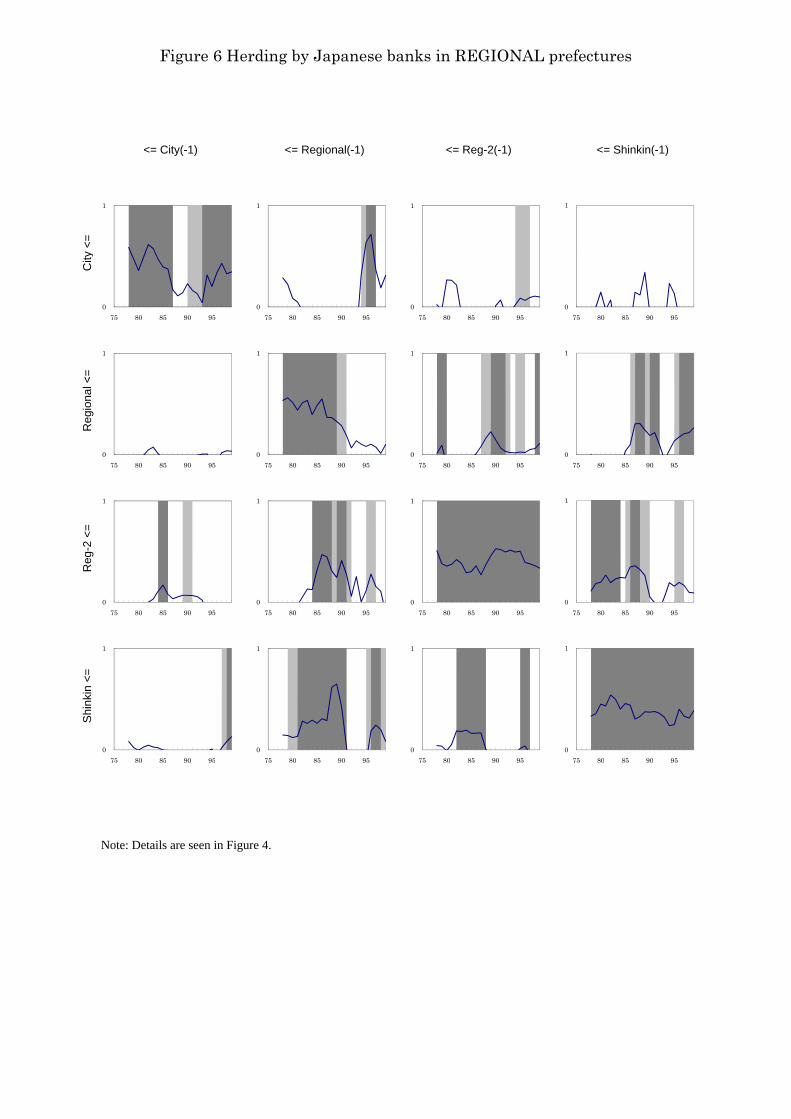
Figure 6 Herding by Japanese banks in REGIONAL prefectures
<= City(-1) <= Regional(-1) <= Reg-2(-1) <= Shinkin(-1)
y <
=
1 1 1 1
City
<=
1 1 1 1
0 75 80 85 90 95
0 75 80 85 90 95
0 75 80 85 90 95
0 75 80 85 90 95
Reg
iona
l <
0 75 80 85 90 95
0 75 80 85 90 95
0 75 80 85 90 95
0 75 80 85 90 95
1 1 1 1
Reg
-2 <
=
0 75 80 85 90 95
0 75 80 85 90 95
0 75 80 85 90 95
0 75 80 85 90 95
Shi
nkin
<=
0
1
75 80 85 90 950
1
75 80 85 90 950
1
75 80 85 90 950
1
75 80 85 90 95
Note: Details are seen in Figure 4.
75 80 85 90 9575 80 85 90 95 75 80 85 90 9575 80 85 90 95

Figure 7 Herding by Japanese banks in URBAN prefectures(Data: Loan growth)
<= City(-1) <= Regional(-1) <= Reg-2(-1) <= Shinkin(-1)
y <
=
1 1 1 1
City
<=
0 75 80 85 90 95
0 75 80 85 90 95
0 75 80 85 90 95
0 75 80 85 90 95
1 1 1 1
Reg
iona
l <
0 75 80 85 90 95
0 75 80 85 90 95
0 75 80 85 90 95
0 75 80 85 90 95
1 1 1 1
Reg
-2 <
=
0 75 80 85 90 95
0 75 80 85 90 95
0 75 80 85 90 95
0 75 80 85 90 95
Shi
nkin
<=
0
1
75 80 85 90 950
1
75 80 85 90 950
1
75 80 85 90 950
1
75 80 85 90 95
Note: Details are seen in Figure 4.
75 80 85 90 9575 80 85 90 95 75 80 85 90 9575 80 85 90 95
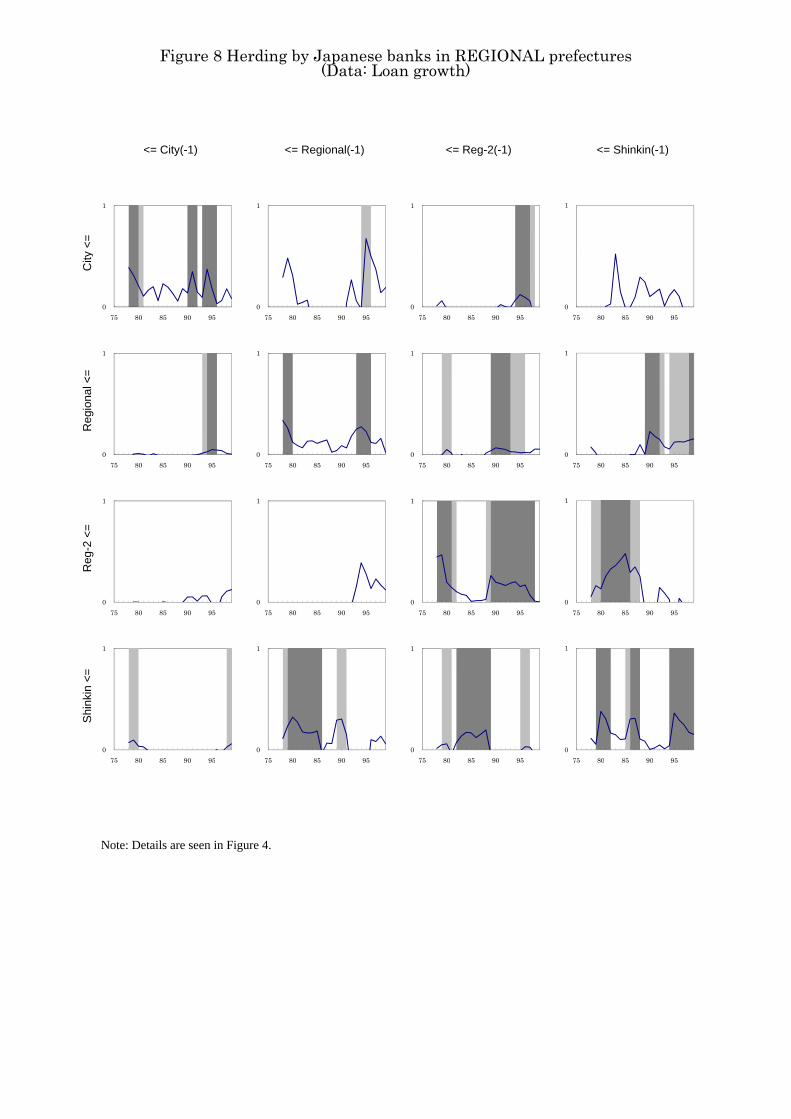
Figure 8 Herding by Japanese banks in REGIONAL prefectures(Data: Loan growth)
<= City(-1) <= Regional(-1) <= Reg-2(-1) <= Shinkin(-1)
y <
=
1 1 1 1
City
<=
1 1 1 1
0 75 80 85 90 95
0 75 80 85 90 95
0 75 80 85 90 95
0 75 80 85 90 95
Reg
iona
l <
0 75 80 85 90 95
0 75 80 85 90 95
0 75 80 85 90 95
0 75 80 85 90 95
1 1 1 1
Reg
-2 <
=
0 75 80 85 90 95
0 75 80 85 90 95
0 75 80 85 90 95
0 75 80 85 90 95
Shi
nkin
<=
0
1
75 80 85 90 950
1
75 80 85 90 950
1
75 80 85 90 950
1
75 80 85 90 95
Note: Details are seen in Figure 4.
75 80 85 90 9575 80 85 90 95 75 80 85 90 9575 80 85 90 95
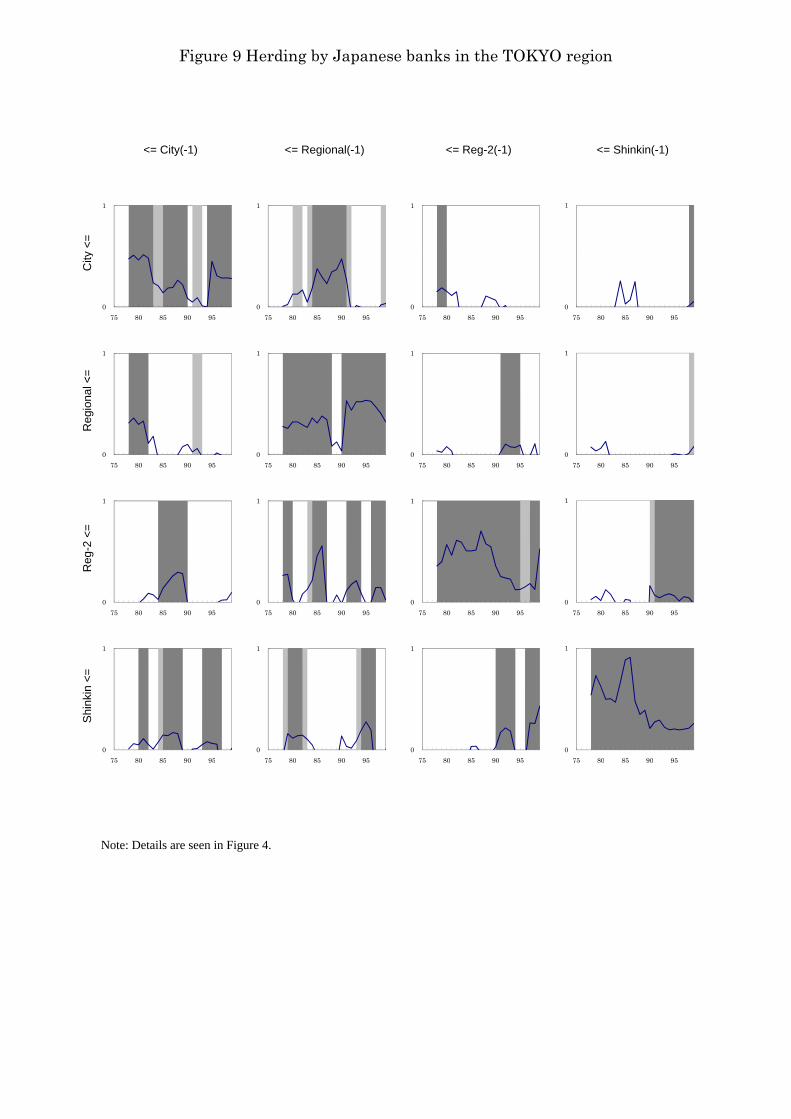
Figure 9 Herding by Japanese banks in the TOKYO region
<= City(-1) <= Regional(-1) <= Reg-2(-1) <= Shinkin(-1)
y <
=
1 1 1 1
City
<=
0 75 80 85 90 95
0 75 80 85 90 95
0 75 80 85 90 95
0 75 80 85 90 95
1 1 1 1
Reg
iona
l <
0 75 80 85 90 95
0 75 80 85 90 95
0 75 80 85 90 95
0 75 80 85 90 95
1 1 1 1
Reg
-2 <
=
0 75 80 85 90 95
0 75 80 85 90 95
0 75 80 85 90 95
0 75 80 85 90 95
Shi
nkin
<=
0
1
75 80 85 90 950
1
75 80 85 90 950
1
75 80 85 90 950
1
75 80 85 90 95
Note: Details are seen in Figure 4.
75 80 85 90 9575 80 85 90 95 75 80 85 90 9575 80 85 90 95