Embed Size (px)
Citation preview
1
2000L2.1.1
R&D on Fouling Prevention/ Removal System for Oil Refining Facilities
(Fouling Prevention/Removal System Group) Negishi No. 401 Laboratory Hideyuki Horii, Ryuji Mori, Daisuke Aoki, Hirofumi Mizukami, Yoshihiko Maki, Tadashi Fukuchi, Hiroki Kanai, Akira Sakamoto, Kiyoshi Sasada, Hiroyuki Miyata, Toshirou Kawaguchi, Shinichi Fujimaki, Kazuyuki Sato, Akira Miura, Atsushi Kuwahara, Satoru Sonoda, Shigeki Matsune, Shinsuke Terada, Kenichirou Morioka, Hiroshi Terano, Akira Ichikawa
Ichihara No. 401 Laboratory Tadashi Tamagawa, Hiromi Kawaguchi, Satoshi Ito, Ryoji Maeda, Tetsuya Murakami, Masahiro Kubo, Tadayoshi Yoshikawa, Yoji Kawahira, Kazuhide Koike, Yoshihiro Akiyama, Yoshio Ikawa, Ichiro Sasaki, Toshio Hishiyama
1. Contents of Empirical Research Each company in the oil refining industry is in the process of conducting careful investigations for improvement of safety and reduction of costs. Amid this effort, while energy conservation measures are being taken at oil refining facilities, attention is also being focused on extension of
continuous run length.
At present, the greatest factors obstructing long-term extension of continuous operations are blockages of equipment and piping, and drops in heat exchange rates, due to scale, sludge and other fouling generated in the refining process. In the present study, as a countermeasure against such fouling, R&D is being conducted on fouling analysis, monitoring, prevention and removal, and by combining these technologies, a fouling prevention/removal system for oil
refining facilities will be established.
1.1 Analysis of fouling generation factors and detailed analysis of ingredients Taking advantage of the phenomenon of fouling generation when NaOH is added to crude oil, attention was focused on asphaltene, one of the fouling ingredients found in crude oil, and the objective was to investigate the behavior of fouling when HCI or NaOH has been added. Accordingly, using the potentiometric titration method, which is used to examine the behavior of minute particles in water, an investigation will be made to determine the impacts of acids and bases on asphaltene.
In addition, actual scale will be taken from oil refining facilities, where fouling generation is conspicuous, and its ingredient characteristics will be analyzed in detail; adhesion and
distribution characteristics will also be clarified.
1.2 Development of the fouling generation trend surveillance system (1) Tank sludge measurement
Respecting the accumulation of sludge inside large oil storage tanks, ultrasonic measuring equipment will be fabricated and applications of it to practical tanks will be investigated for the
purpose of measuring volumes and distributions of such fouling, using ultrasonic waves.
2
(2) Heat exchanger monitoring system
It was decided that overall heat transfer coefficient and pressure drop will be used as values in quantitative evaluation of heat exchanger fouling, that practical heat exchanger with conspicuous fouling will be selected, that the correct overall heat transfer coefficients of such components will be calculated and that changes will be determined. As for surveillance technology, comparative studies will be done on a simplified instrument system that uses wireless transmission or field bus, a new transmission technology which can be applied more flexibly than the conventional 1 to 1 cable instrument. The system will be applied and
evaluated at oil refining facilities.
1.3 Development of fouling prevention technology (1) Antifoulant for residual oil desulfurization unit product oil/rundown section
In contrast to fouling of crude oil preheating section, which has been investigated and researched hitherto, attention will focus on fouling of residual oil desulfurization unit product/rundown section (hereinafter, “RDS R/D”), which takes place at high temperature and high pressure, and in the cooling process. With respect to such fouling, test equipment will be fabricated which makes it possible to reproduce practical equipment operating conditions; and each company's antifoulant will be evaluated and applied to practical equipment.
(2) Fouling deposition prevention unit (water system)
Fouling deposition prevention units (electrostatic model, electromagnetic model) will be installed to heat exchangers cooled with circulating water, and the performance of each fouling deposition prevention unit will be evaluated by such means an investigation of the status of fouling in the heat exchanger tubing and analysis of the ingredients in deposits.
(3) Fouling prevention unit (mechanical turbulator in oil system)
Practical equipment heat exchangers in which fouling is conspicuous and continuous operation is obstructed will be selected, and a fouling prevention unit (spring type mechanical turbulator) will be installed in the heat exchanger tubing. Temporal changes in the status of fouling (thermal transmission performance) will be monitored and the performance of each fouling
prevention unit will be evaluated.
(4) Fouling prevention unit (oil system electromagnetic model)
An electromagnetic fouling prevention unit will be installed onto test equipment for evaluation of crude oil fouling in crude oil preheating section; changes in crude oil fouling will be analyzed, and the possibilities for application of the fouling prevention unit will be investigated.
(5) Simulation of coking in heating furnace tube
Using a specific heating furnace, furnace internal combustion, heat flow and radiant heat transmission will be analyzed; heat volume flows within heating tubes will also be analyzed, and from heating furnace heat spots and tube internal flow, the possibilities of coke generation will be analyzed and investigated.
3
(6) Reinforcement of desalting unit capacity
Crude oils contain salts, metals and other impurities, although the amounts may vary slightly, and these impurities precipitate in the heating components of heat exchangers and heating furnaces, causing drops in thermal transmission efficiency and corrosion. Consequently, they must undergo desalting, employing desalters. For desalters installed in crude oil preheating sections, the electrical desalting method is widely used, in which water is added to crude oil and
mixed, and then re-separated under a high-voltage electrical field.
Accordingly, in contrast to two crude oil preheating sections in parallel, the desalter of one section only will be reinforced (3-stage electrode, 2-stage distributor) and compared with the conventional model (2-stage electrode, 1-stage distributor). The surveillance items are salt and SS content in crude oil around the desalter and U value and pressure differential in final heat exchange in the crude oil preheating section.
1.4 Development of fouling removal technology (1) Plant chemical cleaning technology
With present-day decontamination technology, it is not possible to remove inorganic fouling.
Consequently, sludge and other fouling remains after applications.
(a) Sludge removal by aqueous chemical cleaning
Life Guard System (hereinafter, “LG System”), one of present-day decontamination technologies by water-soluble chemical agent, will be improved and strengthened so as to have a sludge removal property; improvements in this sludge removal property will be checked with test equipment, and the effectiveness of improvements will be evaluated, using practical equipment. Cleaning by other agents will also be evaluated.
(b) Sludge removal by oil system chemical cleaning
The chemical agents used in the previous section (a) are water soluble, and thus a large volume of drain water is produced after they have been used. Accordingly,
evaluation will also be done on oil soluble cleaning agents.
(c) Degassing by chemical agent
In scheduled shutdown maintenances for equipment in which the concentrations of hydrocarbons, H2S and NH3 gas are high even after steam purging, and which takes time to be placed in the tank, decontamination technology will be applied in combination with deodorant processing, and removal performance will be evaluated. Degassing by other chemical agents will also be evaluated.
(d) Cleaning in which bubbles are used
In oil refining facilities, when vessels or tanks are cleaned with chemical agents, large volumes of fluid are required due to structural reasons. Accordingly, a cleaning
method in which bubbles were used was investigated.
4
(2) Tank chemical cleaning
At present, sludge accumulates at the bottom of crude oil tanks and heavy oil tanks, and when such tanks are emptied to be cleaned, a long-term cleaning process is required for removal of such sludge. What is more, there is concern about the increase of sludge in crude oil due to a decline in quality crude oil under future crude oil conditions, and there are other problems including treatment of valuable oily wastes and emission of toxic substances into the atmosphere. Accordingly, an investigation will be made of technology for cleaning sludge from inside tanks without human assistance, using tank-cleaning devices, and this technology will be
applied to practical equipment.
In addition, studies were done on accumulated sludge being washed over a short time period and introduction of the tank-cleaning unit with sludge separation unit recovering oily ingredients simultaneously.
2. Results of Empirical Research and Analysis Thereof 2.1 Analysis of fouling generation factors and detailed analysis of ingredients In laboratory tests, when HCl and NaOH are added to oil, they separate into two layers, so a surface active agent was added and glass electrode was replaced by electrode for nonaqueous solvent, but useful information on such things as inflection point, apparently stemming from
asphaltene, could not be obtained.
Accordingly, as a means of replacing the potentiometric titration method, an investigation was made of the status of asphaltene dispersion and agglomeration by measuring potential. Asphaltene, which undergoes colloidal scattering in crude oil, becomes unstable when HCl or NaOH has been added, and through agglomeration and coagulation, it is believed to precipitate as a fouling ingredient. Consequently, it is believed that the status of dispersion and agglomeration can be known by measuring the potential of asphaltene colloid and its particle
size distribution.
5
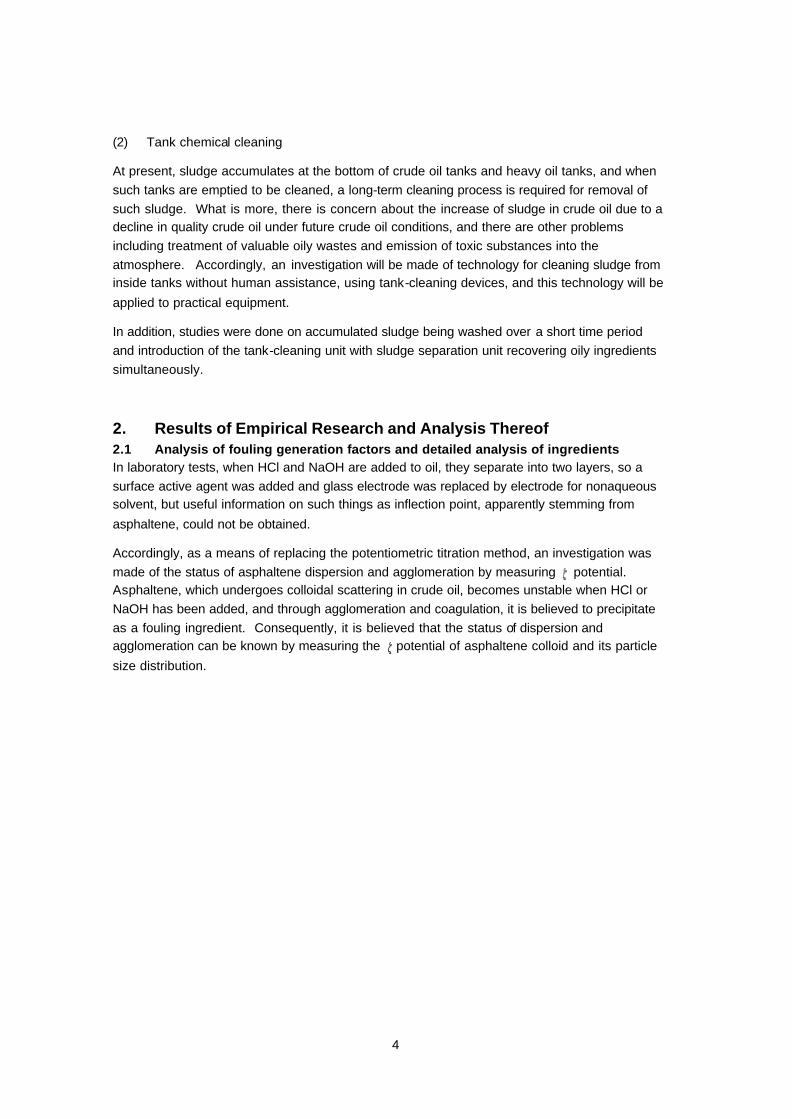
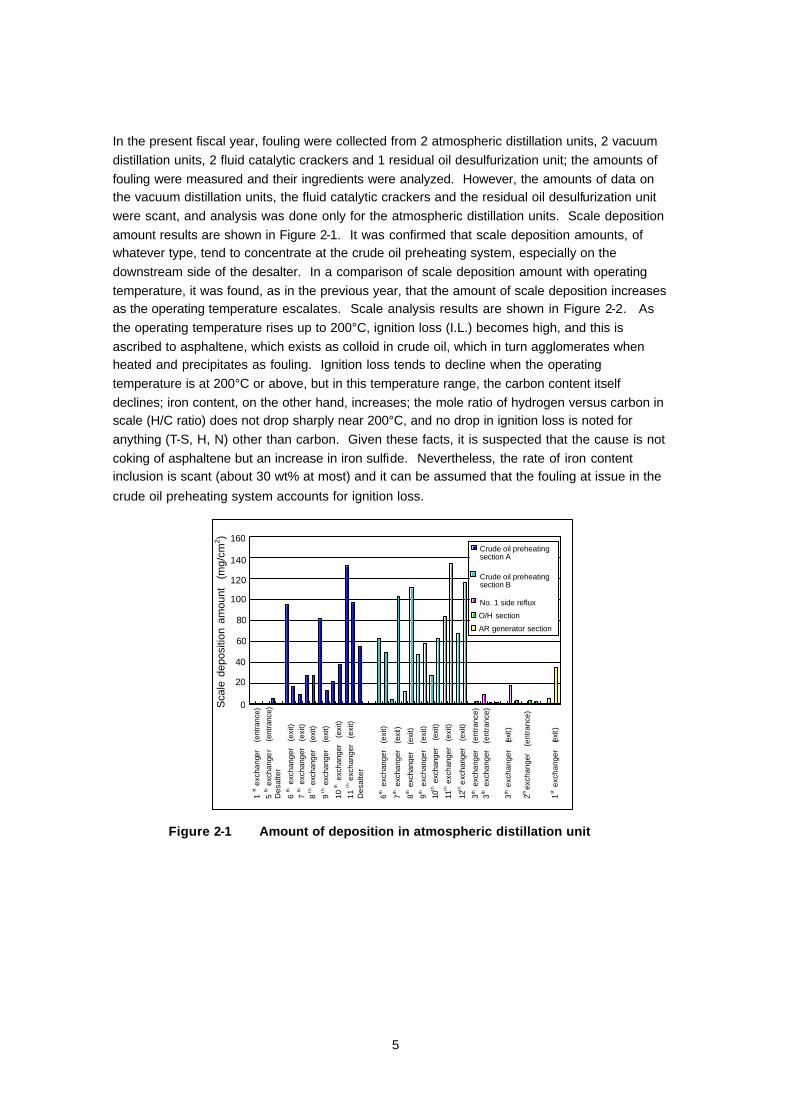
In the present fiscal year, fouling were collected from 2 atmospheric distillation units, 2 vacuum distillation units, 2 fluid catalytic crackers and 1 residual oil desulfurization unit; the amounts of fouling were measured and their ingredients were analyzed. However, the amounts of data on the vacuum distillation units, the fluid catalytic crackers and the residual oil desulfurization unit were scant, and analysis was done only for the atmospheric distillation units. Scale deposition amount results are shown in Figure 2-1. It was confirmed that scale deposition amounts, of whatever type, tend to concentrate at the crude oil preheating system, especially on the downstream side of the desalter. In a comparison of scale deposition amount with operating temperature, it was found, as in the previous year, that the amount of scale deposition increases as the operating temperature escalates. Scale analysis results are shown in Figure 2-2. As the operating temperature rises up to 200°C, ignition loss (I.L.) becomes high, and this is ascribed to asphaltene, which exists as colloid in crude oil, which in turn agglomerates when heated and precipitates as fouling. Ignition loss tends to decline when the operating temperature is at 200°C or above, but in this temperature range, the carbon content itself declines; iron content, on the other hand, increases; the mole ratio of hydrogen versus carbon in scale (H/C ratio) does not drop sharply near 200°C, and no drop in ignition loss is noted for anything (T-S, H, N) other than carbon. Given these facts, it is suspected that the cause is not coking of asphaltene but an increase in iron sulfide. Nevertheless, the rate of iron content inclusion is scant (about 30 wt% at most) and it can be assumed that the fouling at issue in the
crude oil preheating system accounts for ignition loss.
0
20
40
60
80
100
120
140
160
3th e
xcha
nger
(e
ntra
nce)
3
th e
xcha
nger
(e
ntra
nce)
Crude oil preheating section A
Sca
le d
epos
ition
am
ount
(m
g/cm
2 )
5 th
exc
hang
er
(en
tranc
e)
Des
alte
r
6 th e
xcha
nger
(e
xit)
7 th e
xcha
nger
(e
xit)
8 th e
xcha
nger
(e
xit)
9 th e
xcha
nger
(e
xit)
10 th
exc
hang
er
(exi
t)
11 th
exc
hang
er
(exi
t)
Des
alte
r
6th e
xcha
nger
(e
xit)
7th e
xcha
nger
(e
xit)
8th e
xcha
nger
(e
xit)
9th e
xcha
nger
(e
xit)
10th e
xcha
nger
(e
xit)
11th e
xcha
nger
(e
xit)
12th e
xcha
nger
(e
xit)
3th e
xcha
nger
(ex
it)
2th ex
chan
ger
(en
tran
ce)
1st e
xcha
nger
(ex
it)
1 st e
xcha
nger
(e
ntra
nce)
Crude oil preheating section B
No. 1 side reflux
O/H section
AR generator section
Figure 2-1 Amount of deposition in atmospheric distillation unit
6
Operating temperature versus scale ingredients (atmospheric distillation unit)
0 10 20 30 40 50 60 70 80 90
0 50 100 150 200 250 300 350 400 Operating temperature (°C)
Con
tent
per
cent
age
(wt%
)
Fe2O3 (A unit)
I.L (A unit) Fe2O3 (B unit) I.L (B unit)
Fe2O3 (C unit) I.L (C unit) Fe2O3 (D unit) I .L (D unit)
Figure 2-2 Operating temperature versus scale ingredients
2.2 Development of the fouling generation trend surveillance system (1) Tank sludge measurement
(a) Conventional tank sludge measurement
In the past, sludge height, distribution and remaining sludge amount have been determined by measuring the height at which sludge is reached when lowering measuring tape with plumb bob attached into the interior of the tank through many openings on the tank roof plate. For amount of remaining sludge, since comparison must be made with the ultrasonic wave method described below, a method of higher accuracy than the conventional outline calculation method was investigated, and it was decided that the amount will be determined by a method in which each measuring point is taken as an apex and the sums of the cubic volumes of triangular columns are calculated.
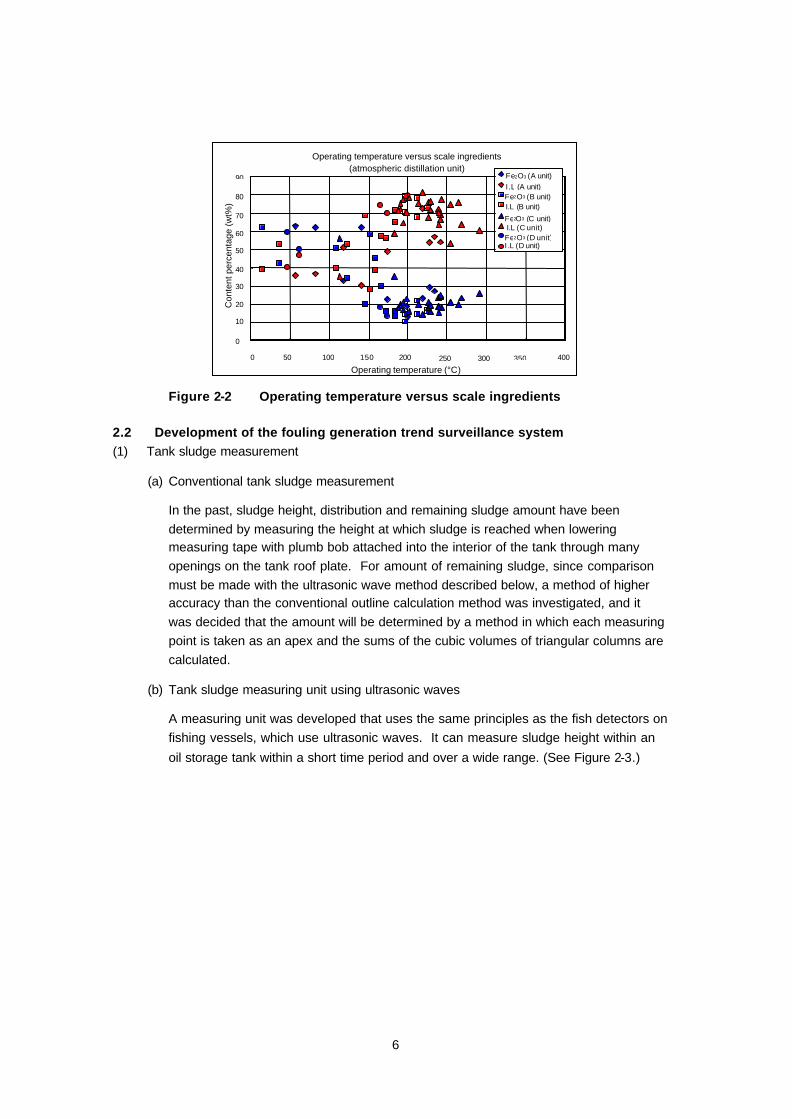
(b) Tank sludge measuring unit using ultrasonic waves
A measuring unit was developed that uses the same principles as the fish detectors on fishing vessels, which use ultrasonic waves. It can measure sludge height within an
oil storage tank within a short time period and over a wide range. (See Figure 2-3.)
7
Type 1 dangerous area
Chloroprene-coated cable Relay box (pressure resistant explosion proof structure)
Floating roof
Echo sounder transducer (special explosion-proof structure)
Measurement hole Space Fluid level
Storage tank
Chloroprene-coated cable passes through inside of metal tube
Crude oil · Heavy oil
Sludge
Non-dangerous area
Printer
Display unit
Data processor
Computer
Power supply AC 100V 50/50 1ø
Oil bank
Sludge measuring unit installation drawing
Notes 1. For the echo sound transducer, with special explosion proof structure + pressure-resistant explosion
proof structure, type approval will be obtained from the Industrial Safety Association 2. Type 3 chloroprene cab tire cable is used for the mobile power line. Pressure-resistant packing type,
retractable instruments are used in the relay box. 3. During the experiments, the measuring instruments were located in a vehicle parked outside the oil
bank (non-dangerous location). Figure 2-3 Outline illustration of tank sl udge measuring system
Before measuring within actual crude oil tank, however, water was poured into a small temporary tank; blocks, sandbags or other obstructions were placed at the bottom of the tank, and tests were conducted in order to evaluate unit performance. Water was poured into a cylindrical tank 2.5 m in diameter and 3.0 m in height; blocks, for instance, were sunk into it, and
measurements were taken.
For a target measuring 50 cm in height, measurement results could be displayed at good accuracy. Moreover, in a numerical display image, the measurement target could be displayed in broken down fashion to the smallest unit of 10 cm. This is adequate precision for
measurement of sludge in a practical crude oil tank.
(2) Heat exchanger monitoring system
As for simplified instrument system, a field bus format was adopted because investigation of the wireless instrument system revealed that such a system could not be introduced in a refining plant. The installation target was a crude oil preheating system heat exchanger for furfural unit, which monitors fouling. Although the field bus format recently constructed is comprised of a complex system, including a multi-vendor, a mixed electrical/optical field bus, and a total of 16 transmitters (8 electrical units, 8 optical units), it operates smoothly at present, and was found to be applicable in the plant. The system is scheduled to be used in the future for monitoring changes over a long time period in heat exchanger thermal transmission characteristic and
pressure.
8
2.3 Development of fouling preventionl technology (1) Antifoulant for residual oil desulfurization unit product oil/rundown system
Using a fouling generator test unit for RDS R/D system, the effects of two types of antifoulant were compared, and it was found that the superior antifoulant could be determined. Antifoulant used in the past has been injected into practical equipment and is currently being observed for temporal changes.
(2) Fouling deposition prevention unit (water treatment system)
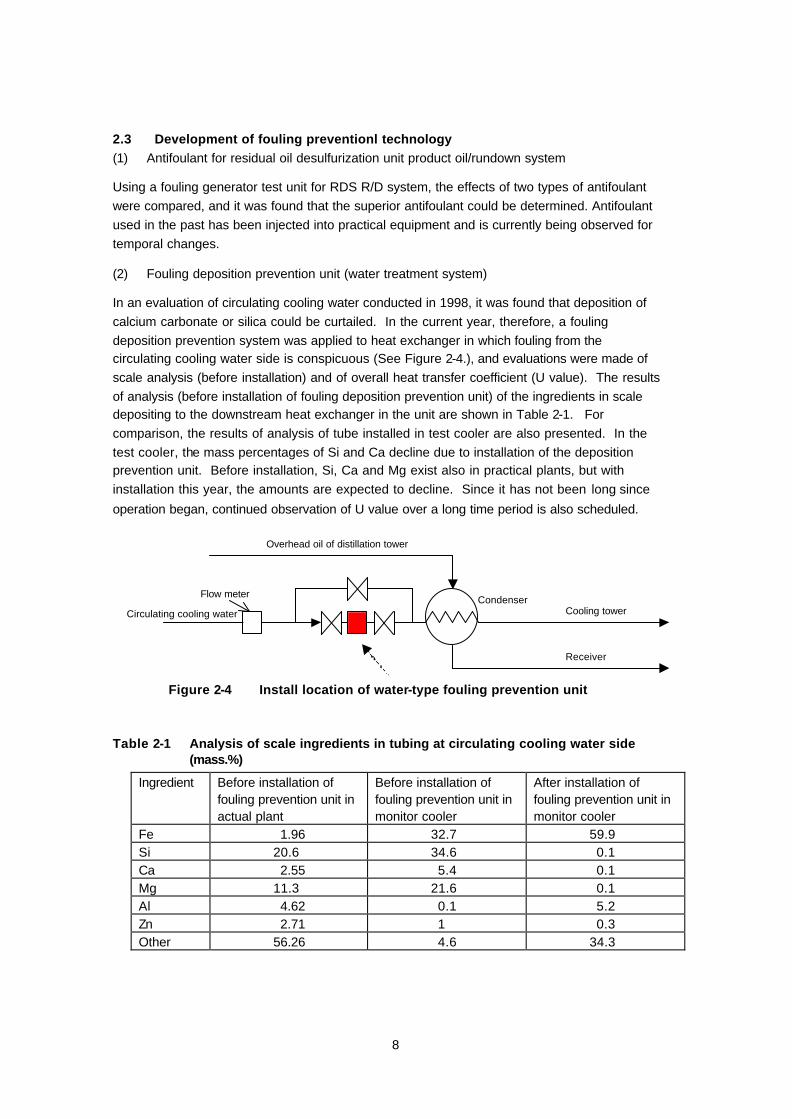
In an evaluation of circulating cooling water conducted in 1998, it was found that deposition of calcium carbonate or silica could be curtailed. In the current year, therefore, a fouling deposition prevention system was applied to heat exchanger in which fouling from the circulating cooling water side is conspicuous (See Figure 2-4.), and evaluations were made of scale analysis (before installation) and of overall heat transfer coefficient (U value). The results of analysis (before installation of fouling deposition prevention unit) of the ingredients in scale depositing to the downstream heat exchanger in the unit are shown in Table 2-1. For comparison, the results of analysis of tube installed in test cooler are also presented. In the test cooler, the mass percentages of Si and Ca decline due to installation of the deposition prevention unit. Before installation, Si, Ca and Mg exist also in practical plants, but with installation this year, the amounts are expected to decline. Since it has not been long since
operation began, continued observation of U value over a long time period is also scheduled.
Flow meter
Circulating cooling water Condenser
Cooling tower
Receiver
Overhead oil of distillation tower
Figure 2-4 Install location of water-type fouling prevention unit
Table 2-1 Analysis of scale ingredients in tubing at circulating cooling water side (mass.%)
Ingredient Before installation of fouling prevention unit in actual plant
Before installation of fouling prevention unit in monitor cooler
After installation of fouling prevention unit in monitor cooler
Fe 1.96 32.7 59.9 Si 20.6 34.6 0.1 Ca 2.55 5.4 0.1 Mg 11.3 21.6 0.1 Al 4.62 0.1 5.2 Zn 2.71 1 0.3 Other 56.26 4.6 34.3
9
(3) Fouling deposition prevention unit (mechanical turbulator in oil system)
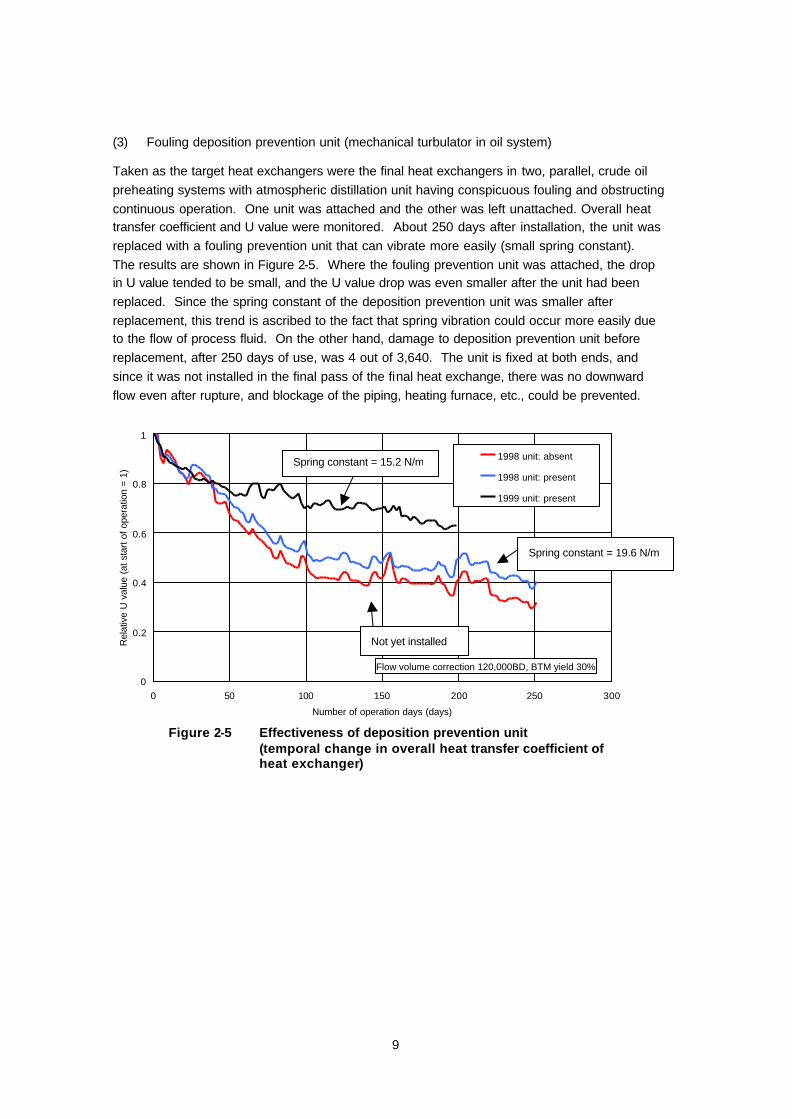
Taken as the target heat exchangers were the final heat exchangers in two, parallel, crude oil preheating systems with atmospheric distillation unit having conspicuous fouling and obstructing continuous operation. One unit was attached and the other was left unattached. Overall heat transfer coefficient and U value were monitored. About 250 days after installation, the unit was replaced with a fouling prevention unit that can vibrate more easily (small spring constant). The results are shown in Figure 2-5. Where the fouling prevention unit was attached, the drop in U value tended to be small, and the U value drop was even smaller after the unit had been replaced. Since the spring constant of the deposition prevention unit was smaller after replacement, this trend is ascribed to the fact that spring vibration could occur more easily due to the flow of process fluid. On the other hand, damage to deposition prevention unit before replacement, after 250 days of use, was 4 out of 3,640. The unit is fixed at both ends, and since it was not installed in the final pass of the final heat exchange, there was no downward flow even after rupture, and blockage of the piping, heating furnace, etc., could be prevented.
Flow volume correction 120,000BD, BTM yield 30%
0
0.2
0.4
0.6
0.8
1
0 50 100 150 200 250 300
Number of operation days (days)
Rel
ativ
e U
val
ue (
at s
tart
of o
pera
tion
= 1)
1998 unit: absent
1998 unit: present
1999 unit: present
Figure 2-5 Effectiveness of deposition prevention unit
(temporal change in overall heat transfer coefficient of heat exchanger)
Spring constant = 15.2 N/m
Spring constant = 19.6 N/m
Not yet installed
10
(4) Fouling deposition prevention unit (oil system electromagnetic model)
In evaluation of an electromagnetic fouling prevention unit, a heating type fouling generation test unit that mimics a crude oil preheating section was fabricated and used. The fouling generation test unit circulates a fixed flow volume of crude oil test sample under added pressure; heating from the outer surface is controlled automatically so that the crude oil temperature at the heater tube outlet becomes constant. Table 2-2 presents the results of a comparison between deposition amount of fouling generated in the heater tube, deposition speed and the percentage of asphaltene in oil test sample. As in 1998, electromagnetic processing of oil resulted in both curtailment and promotion of fouling, and it was determined that there is a correlation between these results and the percentage of asphaltene included. In practical operation, for processing of many types of crude oil, usually the percentage of asphaltene is not low, and a slight change in the asphaltene percentage included produces a switch from fouling curtailment to fouling promotion. In a crude oil preheating section, therefore, the deposition prevention unit (spring type) or fouling curtailment by chemicals in general use is
considered preferable to the electromagnetic method.
Table 2-2 Test results on evaluation of electromagnetic fouling prevention unit Tube fouling deposition amount
mg Tube fouling deposition speed
mg/cm 2/month
Without electromagnetic
processing
With electromagnetic
processing
Without electromagnetic
processing
With electromagnetic
processing
Antifouling rate %
Asphaltene content wt/wt%
Test sample oil A 54.2 6.2 10.0 1.1 89 1.5
Test sample oil B 45.9 37.4 8.4 6.9 18 1.6
Test sample oil C 28.3 16.8 5.2 3.1 40 1.7
Test sample oil D 13.2 10.6 2.4 1.9 21 1.6
Test sample oil E 81.8 127.6 15.0 23.4 (increase rate) 56
1.9
Note) An attempt was made to test sample oil containing 4.2% asphaltene, but fouling in the circulation
pump prior to electromagnetic processing inhibited operations and the test could not be performed.
(5) Simulation of coking in heating furnace tube
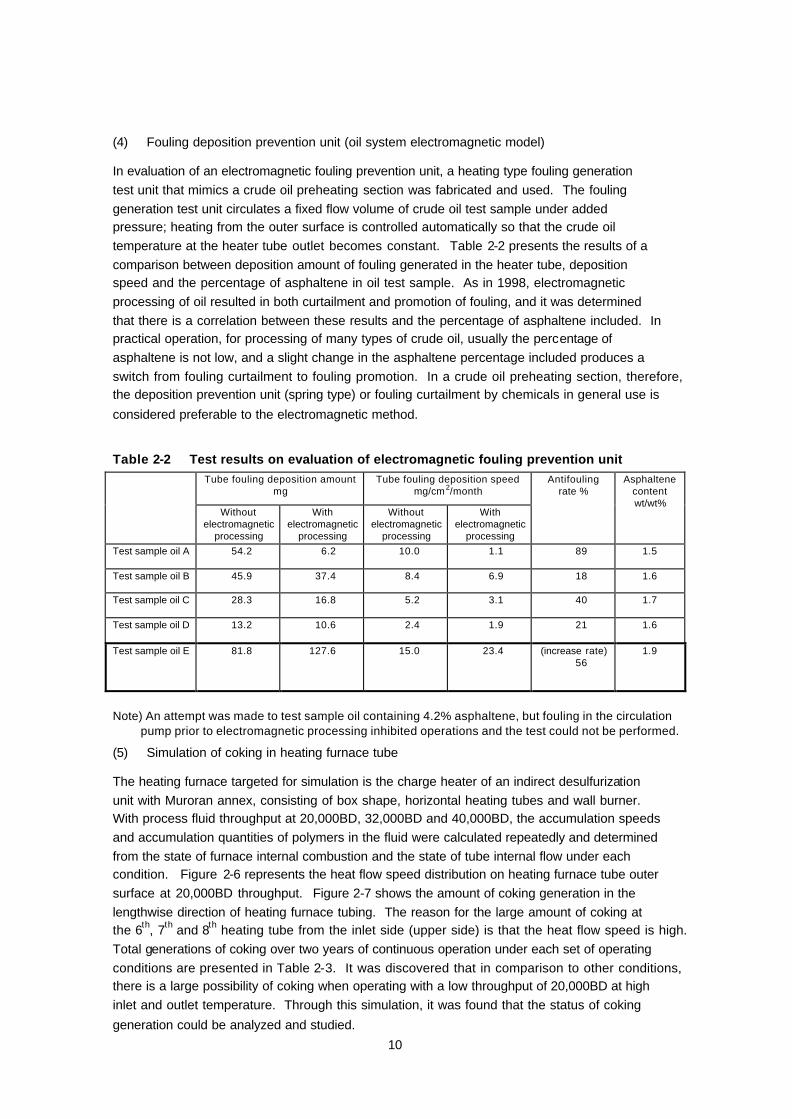
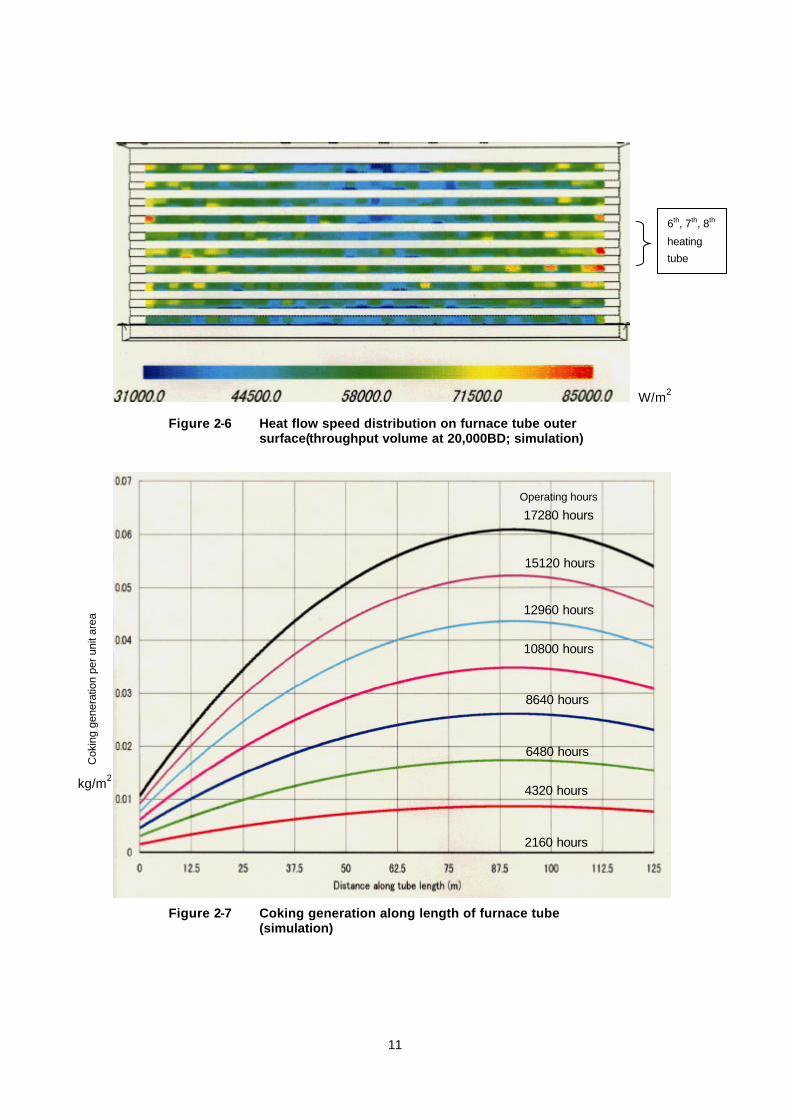
The heating furnace targeted for simulation is the charge heater of an indirect desulfurization unit with Muroran annex, consisting of box shape, horizontal heating tubes and wall burner. With process fluid throughput at 20,000BD, 32,000BD and 40,000BD, the accumulation speeds and accumulation quantities of polymers in the fluid were calculated repeatedly and determined from the state of furnace internal combustion and the state of tube internal flow under each condition. Figure 2-6 represents the heat flow speed distribution on heating furnace tube outer surface at 20,000BD throughput. Figure 2-7 shows the amount of coking generation in the lengthwise direction of heating furnace tubing. The reason for the large amount of coking at the 6th, 7th and 8th heating tube from the inlet side (upper side) is that the heat flow speed is high. Total generations of coking over two years of continuous operation under each set of operating conditions are presented in Table 2-3. It was discovered that in comparison to other conditions, there is a large possibility of coking when operating with a low throughput of 20,000BD at high inlet and outlet temperature. Through this simulation, it was found that the status of coking
generation could be analyzed and studied.
11
Figure 2-6 Heat flow speed distribution on furnace tube outer surface(throughput volume at 20,000BD; simulation)
Figure 2-7 Coking generation along length of furnace tube (simulation)
6th, 7th, 8th
heating
tube
W/m2
4320 hours
2160 hours
17280 hours
15120 hours
6480 hours
8640 hours
12960 hours
10800 hours
Operating hours
Cok
ing
gene
ratio
n pe
r uni
t are
a
kg/m2
12
Table 2-3 Total amount of coke generated over 2 years of continuous operation under each set of operating conditions (simulation)
Throughput volume
40,000 BD 32,000 BD 20,000 BD
Process fluid inlet temperature
382°C 372°C 390°C
Process fluid outlet temperature
414°C 392°C 427°C
Coking generation amount 1.477 kg 0.577 kg 4.162 kg
(6) Reinforcement of desalting unit
* Operating conditions are as follows.
Crude oil type: High pourpoint crude, PGM, ALM Throughput: 120,000 BPD (A section: 60,000BPD, B section: 60,000BPD),
Temperature: 128°C
Mixing valve differential pressure: A section = 150 kPa, B section = 100 kPa
Table 2-4 presents the results for salt content, bottom sediment and water and SS component in crude oil before and after desalting. It was found that by having the desalting unit electrode at 2 → 3 stage and the distributor at 1 → 2 stage, the amounts of bottom sediment and water and SS in desalted crude oil can be reduced. Data are scheduled to be collected continuously in the future. Because the process crude oil is a crude oil of low salt content, the salt contents in desalted crude oil are about the same for both A and B. The effect of mud washing is unclear because the SS content in drain water is low (8.7 mg/L in both A and B sections). It is believed that the effect will be manifested when processing high SS crude oil or upon final operation.
The superiority of U value in A or B section was not determined because it was only a very short time after the start of operation. Surveillance over a long time period will be necessary in the future. In the B section, there were large amounts of bottom sediment and water and SS in crude oil after desalting, and it is suspected that these become fouling that deposits and accumulates in heat exchangers, causing the U value to drop. As for change in pressure differential, there was almost no change in A section (0.09 MPa → 0.10 MPa) or B section (0.08 MPa → 0.08 MPa).
Table 2-4 Changes in salt, bottom sediment and water and SS contents of crude oil before and after desalting
(Average value of a total of 6 sessions: 4 sessions with high pourpoint crude and 1 session each with PGM and ALM. SS content is average value of 2 sessions with PGM and ALM.)
Salt content
ppm
Bottom sediment and water content
vol%
Water content
vol%
SS content
ppm
System name
Unit reinforcement
Before desalting
After desalting
Before desalting
After desalting
Before desalting
After desalting
Before desalting
After desalting
A system ¡ 6.45 2.9 0.05 0.05 0.075 0.058 81.5 32.0 B system × 6.45 2.4 0.05 0.17 0.075 0.39 81.5 43.5
13
2.4 Development of fouling removal technology (1) Plant chemical cleaning technology
(A) Sludge removal by aqueous chemical cleaning
(a) Study of improvement in solubility of heavy oil component
With respect to policy for strengthening the effect of oil removal, attention was focused on the gas oil circulation process that takes place in S/D operation. In order to dissolve heavier oil rapidly, the addition of an aromatic hydrocarbon solvent into the light oil was investigated.
Firstly, it was decided that tests would be conducted to verify effectiveness. For the test, pseudo sludge was prepared and immersed under three conditions: 1) no gas oil circulation; 2) gas oil circulation, and 3) gas oil circulation + solvent addition. Taking water as the base, LG processing was then carried out under each of these conditions,
and comparison was made with oil removal effect.
Aromatic solvents of high boiling point were added to the gas oil. Comparisons were made between two types of aromatic solvents with different distillation temperature range (aromatic solvent (1) 159 to 171°C, aromatic solvent (2) 183 to 202°C); the concentrations of the additions were varied and removal of oil component was
evaluated.
From the test results, as presented in Table 2-5, it was found that when an aromatic solvent has been added to gas oil, the oil removal effect is higher with LG as compared to other specifications. This is ascribed to the fact that the heavy oil in sludge is replaced with gas oil of lower viscosity and light specific gravity. It was also found that the higher the concentration of aromatic solvent added in light oil, the higher the oil removal effect. With practical equipment, therefore, it was decided to add 20 wt% of aromatic solvent [(1) 159 to 171°C] at low distillation temperature to gas oil in circulation.
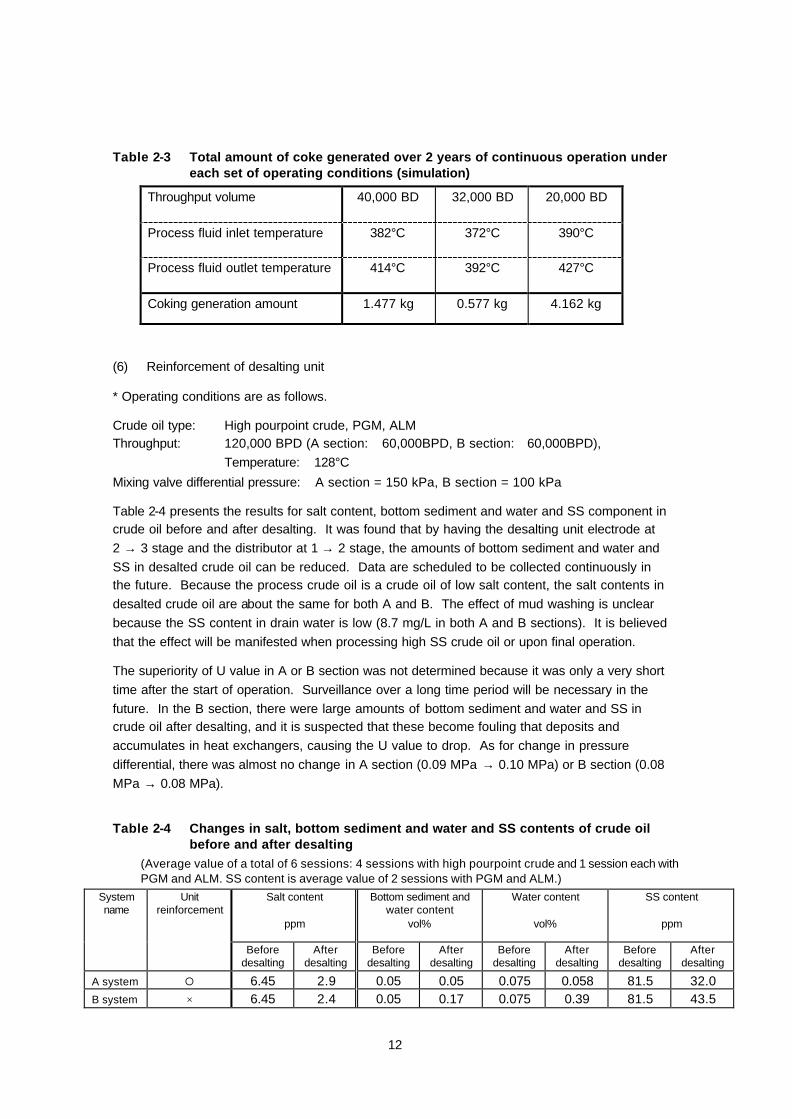
Table 2-5 Oil removal rate and concentrations of aromatic solvent added in gas oil circulation (laboratory tests)
Specifications Oil removal amount (g) Oil removal rate (%)
No gas oil processing (LG processing only) 14 46
Gas oil processing 21 70
Gas oil + aromatic solvent (1) 20 wt% 30 100
Gas oil + aromatic solvent (2) 20 wt% 29 97
14
(b) Application to practical equipment and results thereof
In the application to practical equipment, the targets were a charge system and a BT’M system with much fouling in the vacuum distillation unit. With practical equipment, the aromatic solvent decided upon in the previous section (a) was added to gas oil in circulation, and thereafter, it was decided to connect the equipment to temporary equipment and circulate both systems. At this time, the heating furnace and distillation tower were removed from the circulation system. The cleaning method is presented in Table 2-6.
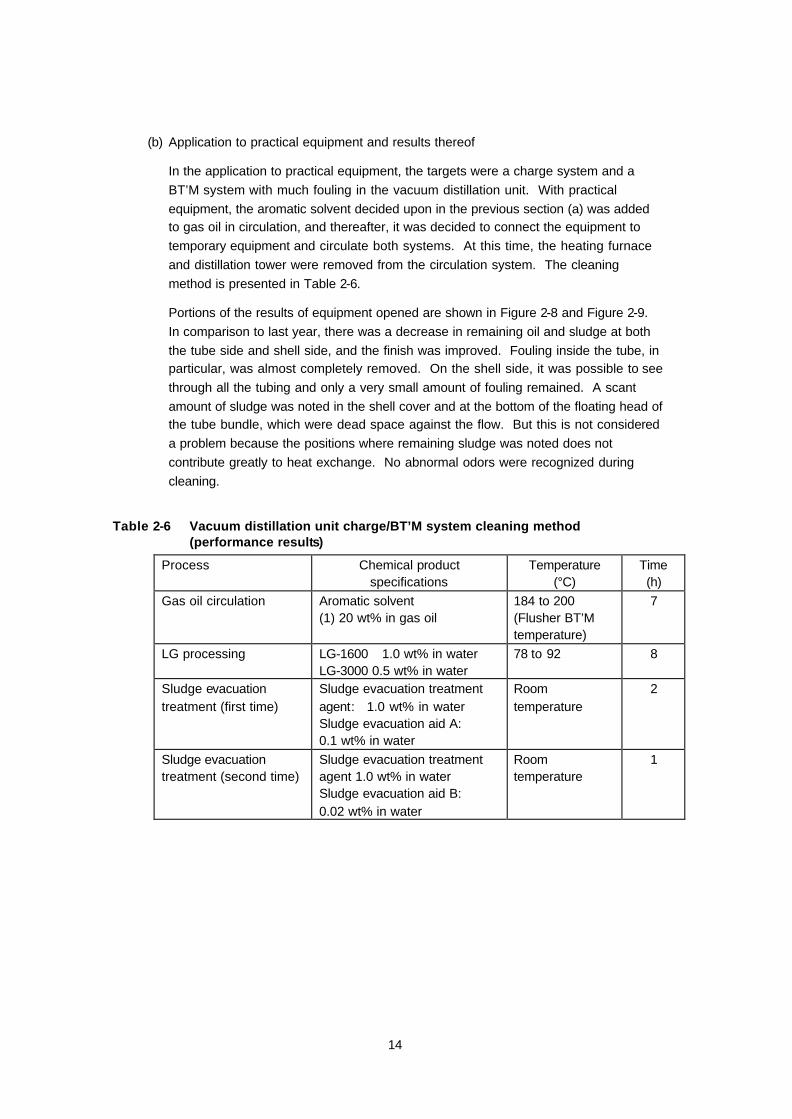
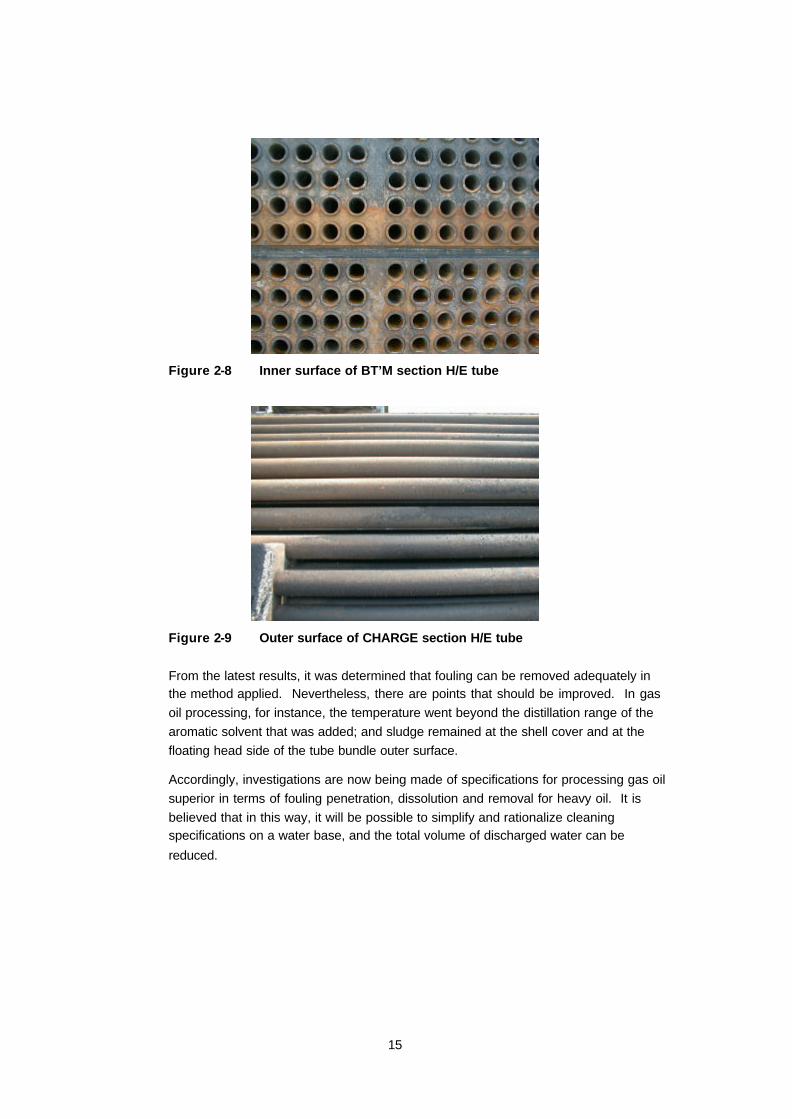
Portions of the results of equipment opened are shown in Figure 2-8 and Figure 2-9. In comparison to last year, there was a decrease in remaining oil and sludge at both the tube side and shell side, and the finish was improved. Fouling inside the tube, in particular, was almost completely removed. On the shell side, it was possible to see through all the tubing and only a very small amount of fouling remained. A scant amount of sludge was noted in the shell cover and at the bottom of the floating head of the tube bundle, which were dead space against the flow. But this is not considered a problem because the positions where remaining sludge was noted does not contribute greatly to heat exchange. No abnormal odors were recognized during cleaning.
Table 2-6 Vacuum distillation unit charge/BT’M system cleaning method (performance results)
Process Chemical product specifications
Temperature (°C)
Time (h)
Gas oil circulation Aromatic solvent (1) 20 wt% in gas oil
184 to 200 (Flusher BT’M temperature)
7
LG processing LG-1600 1.0 wt% in water LG-3000 0.5 wt% in water
78 to 92 8
Sludge evacuation treatment (first time)
Sludge evacuation treatment agent: 1.0 wt% in water Sludge evacuation aid A: 0.1 wt% in water
Room temperature
2
Sludge evacuation treatment (second time)
Sludge evacuation treatment agent 1.0 wt% in water Sludge evacuation aid B: 0.02 wt% in water
Room temperature
1
15
Figure 2-8 Inner surface of BT’M section H/E tube
Figure 2-9 Outer surface of CHARGE section H/E tube
From the latest results, it was determined that fouling can be removed adequately in the method applied. Nevertheless, there are points that should be improved. In gas oil processing, for instance, the temperature went beyond the distillation range of the aromatic solvent that was added; and sludge remained at the shell cover and at the floating head side of the tube bundle outer surface.
Accordingly, investigations are now being made of specifications for processing gas oil superior in terms of fouling penetration, dissolution and removal for heavy oil. It is believed that in this way, it will be possible to simplify and rationalize cleaning specifications on a water base, and the total volume of discharged water can be
reduced.
16
In the latest investigation, process limitations made it necessary to take the entire volume of discharged water out of the plant and treat it. An investigation is now being made to have all the discharged water treated by the temporary equipment. The discharged water produced is high in both COD and T-N, and it is difficult to lower either through processing with the addition of chemicals. Consequently, treatment using an ion exchange resin is being investigated. After laboratory tests, everything up to detailed design of a resin tower used during actual cleaning has been scheduled, but at present, respecting laboratory test results on COD, a value only in the range of 35 to 40 mg/l can be achieved as opposed to the drain water regulatory value of 50 mg/l, and uncertainty remains about application to practical situations. At present,
tests on specifications for lowering COD are being continued.
(c) Desalting unit cleaning
A circulation loop was established by combining two Muroran annex desalting units with a circulation pump and a temporarily installed sludge catcher and tank. Zyme-Flow chemical agent by the ULI Company, of low discharged water COD, was injected and circulation cleaning with cleaning fluid was performed. Approximately 33% of the sludge could be removed by the cleaning, but not all of it could be washed away. Among the possible reasons for this is that mixing by steam or nitrogen gas was insufficient and that sludge removal from the cleaning fluid was inadequate because of insufficient capacity in the sludge catcher. It was found that countermeasures must be taken in terms of hardware (for example, reinforcement of the nozzle in the desalting unit for cleaning) and that the capacity of the sludge catcher must be elevated. Degreasing was implemented adequately. Gas, which becomes a problem upon entry into the vessel, was not detected, so decontamination and
degassing were favorable.
(d) On reuse of chemicals
Because cleaning power still remains in the discharged cleaning water of desalting unit used in the Muroran annex, an investigation was made on reuse of chemicals by reverse osmosis processing. Chemicals recovered from washing waste fluid by reverse osmosis processing were assessed in the laboratory, and as a result, it was learned that regular cleaning power can be expected by making a mixture of new chemical and recovered chemical at a ratio of 1 : 3. Consequently, this ratio was applied for the desalting unit at the Kawasaki annex. It was found that new product chemical must be added to obtain the same level of finish in decontamination and degassing as obtained with the desalting unit at the Muroran annex. Ultimately, therefore, the ratio of new to recovered chemical was about 1 : 2. From analysis of the cleaning waste fluid at the Kawasaki annex it was found that the fluid adheres to residual scale with no cleaning power remaining. This means that chemical cannot always be recovered from cleaning waste fluid, and in view of the cost of reverse osmosis processing, etc., it was determined that application to practical equipment will mean higher costs.
17
(B) Sludge removal by oily chemical cleaning
Using LCO of large aromatic component in cleaning fluid base oil, cleaning agent (HKS-101 by Softard Industries, Ltd.) was injected at 2.0 wt% percentage, and circulation cleaning took place with the cleaning fluid temperature at 130°C. Since there was a very foulingy heat exchanger in the upstream of the heat exchanger (steam generator) used for heating the cleaning fluid, was took place by circulation opposite that of regular flow with the aim of improving washing
effectiveness.
Of the heat exchangers subject to cleaning, three very foulingy exchangers were removed and opened, and post-cleaning conditions were investigated.
(a) Air fin cooler
Normally, scale accumulates on both sides of the header, causing a portion of the tubing to become blocked up. In the latest case, however, there was almost no
sludge in the header or in the tube, and the view through the tube was clear.
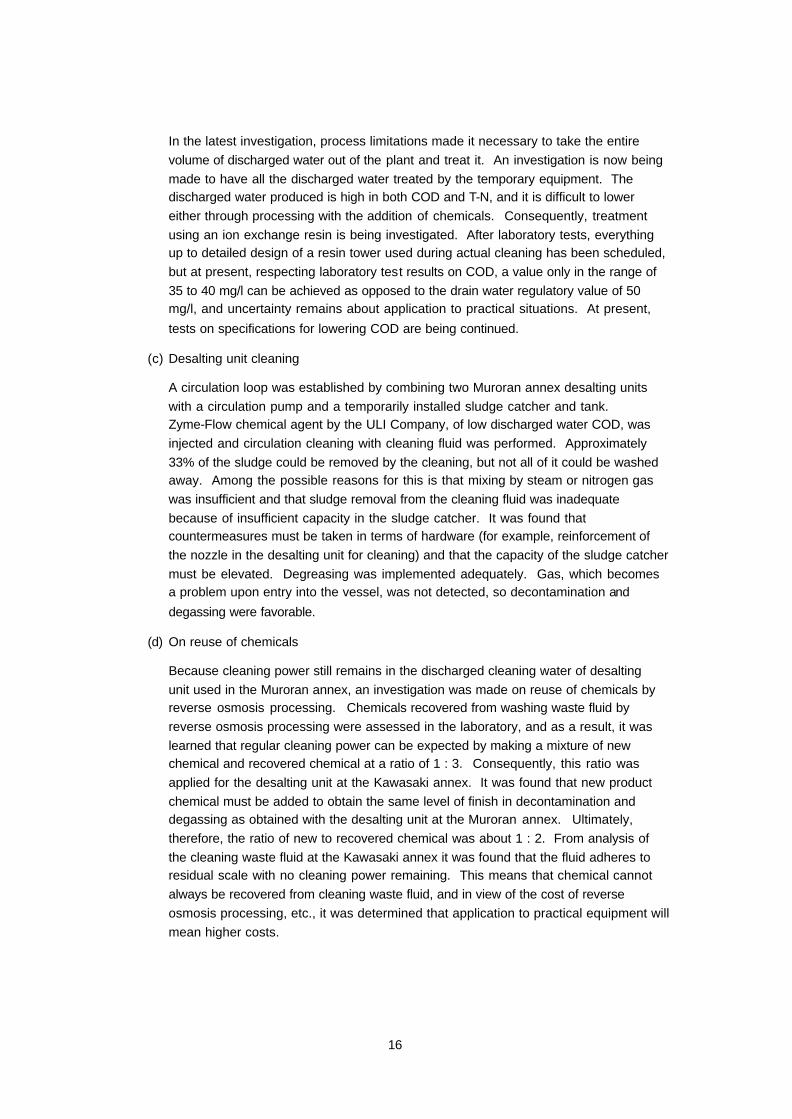
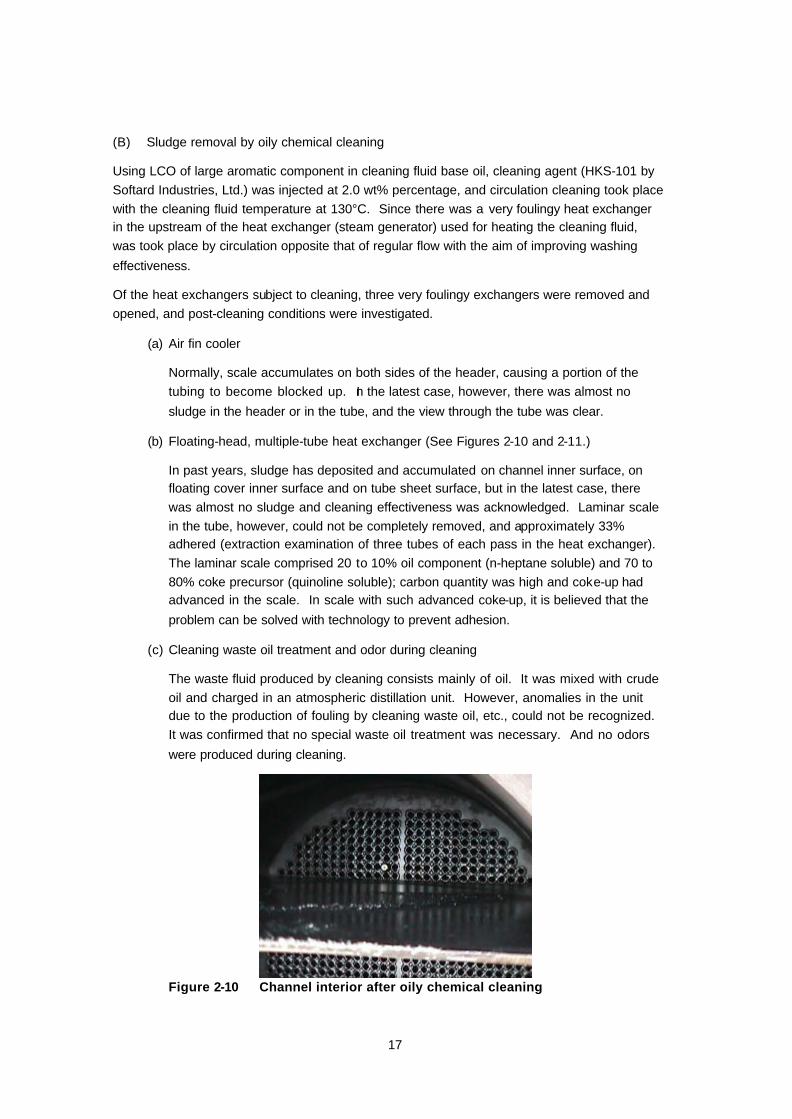
(b) Floating-head, multiple-tube heat exchanger (See Figures 2-10 and 2-11.)
In past years, sludge has deposited and accumulated on channel inner surface, on floating cover inner surface and on tube sheet surface, but in the latest case, there was almost no sludge and cleaning effectiveness was acknowledged. Laminar scale in the tube, however, could not be completely removed, and approximately 33% adhered (extraction examination of three tubes of each pass in the heat exchanger). The laminar scale comprised 20 to 10% oil component (n-heptane soluble) and 70 to 80% coke precursor (quinoline soluble); carbon quantity was high and coke-up had advanced in the scale. In scale with such advanced coke-up, it is believed that the
problem can be solved with technology to prevent adhesion.
(c) Cleaning waste oil treatment and odor during cleaning
The waste fluid produced by cleaning consists mainly of oil. It was mixed with crude oil and charged in an atmospheric distillation unit. However, anomalies in the unit due to the production of fouling by cleaning waste oil, etc., could not be recognized. It was confirmed that no special waste oil treatment was necessary. And no odors
were produced during cleaning.
Figure 2-10 Channel interior after oily chemical cleaning
18
Figure 2-11 Tube interior after oily chemical cleaning
(The ring-shaped white area at the center is laminar scale)
(C) Degassing by agent
For periodic inspections at petroleum refining facilities, equipment undergoes steam purging when it is opened, but toxic gases can remain at high concentrations, and in some cases it is difficult to enter the tank for equipment cleaning work. In particular, ammonia and hydrogen sulfide produced by the internal reactor remains at high concentration together with hydrocarbon gas from the process oil, in high-pressure and low-pressure separators of hydro-refining units. Consequently, many hours are required before entering and working in the vessel become possible.
(a) Results last year
In experiments and verification tests last year, it was possible to remove hydrogen sulfide gas from inside the separator, but ammonia that had penetrated into the concrete lining could not be removed, so it was determined that ammonia is regenerated after processing. To remove this ammonia, a deodorant must penetrate into the lining, and as a result of investigations, two methods of penetrating deodorant into the concrete lining were considered: 1) the method of establishing low surface tension and elevating permeability while jointly using LG containing surface active agent in the deodorant; and 2) the method of vaporizing the deodorant itself and
elevating dispersion and permeability.
(b) Investigation of deodorant processing method
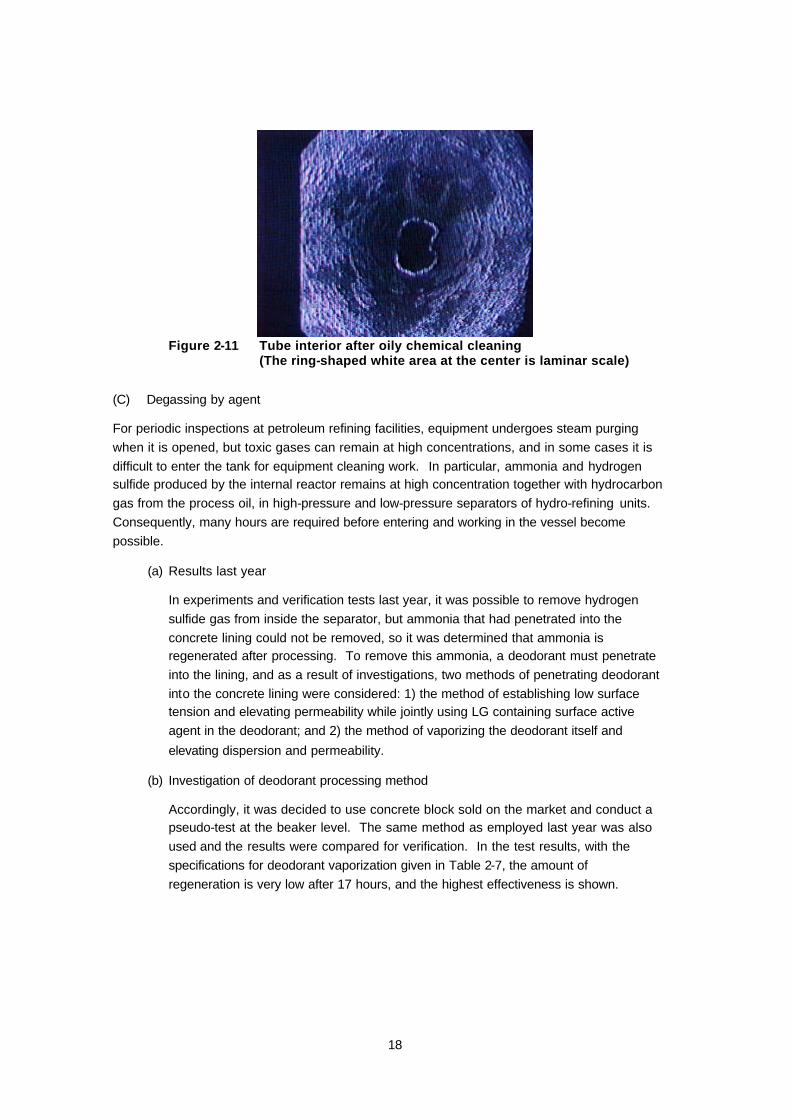
Accordingly, it was decided to use concrete block sold on the market and conduct a pseudo-test at the beaker level. The same method as employed last year was also used and the results were compared for verification. In the test results, with the specifications for deodorant vaporization given in Table 2-7, the amount of regeneration is very low after 17 hours, and the highest effectiveness is shown.
19
Table 2-7 LG and deodorant processing results for concrete test piece (laboratory tests)
Ammonia gas concentration (vol. ppm) Test name
Immersion in
deodorant solution
Immersion in deodorant + surface active solvent
solution
Deodorant
vaporization
After ammonia
immersion 7,000 7,000 7,000
After LG processing
1,800 1,800 1,800
After deodorant
processing 240 600 10
After standing 17
hours 2,000 1,900 80
(c) Application to practical equipment and results thereof
In making application to practical equipment, it was decided that the deodorant would be vaporized in the deodorant treatment process. As a result of the investigation, the method of vaporization adopted was one in which steam is injected continuously into
the unit, to which deodorant is then added.
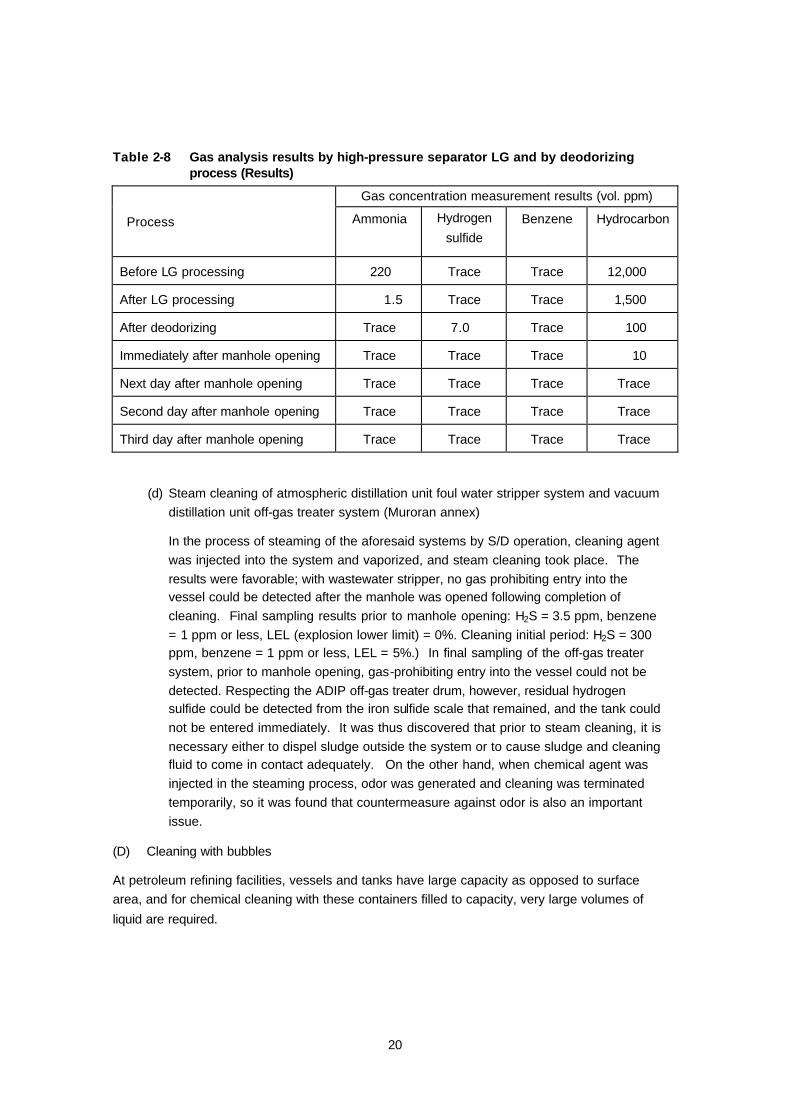
Hydrocarbons were detected at high value prior to treatment, but they dropped to about 1/10 through LG treatment. They dropped even further after deodorant treatment, and immediately after manhole opening, they became 1/1000, the value
prior to LG treatment.
On the day following manhole opening, none of the gases could be detected when internal gas was about to be measured. Thereafter, measurements were taking continuously for three days, but none of the gases exhibited a trend towards
increasing again, and the results could be regarded as favorable. (See Table 2-8.)
20
Table 2-8 Gas analysis results by high-pressure separator LG and by deodorizing process (Results)
Gas concentration measurement results (vol. ppm)
Process Ammonia Hydrogen
sulfide Benzene Hydrocarbon
Before LG processing 220 Trace Trace 12,000
After LG processing 1.5 Trace Trace 1,500
After deodorizing Trace 7.0 Trace 100
Immediately after manhole opening Trace Trace Trace 10
Next day after manhole opening Trace Trace Trace Trace
Second day after manhole opening Trace Trace Trace Trace
Third day after manhole opening Trace Trace Trace Trace
(d) Steam cleaning of atmospheric distillation unit foul water stripper system and vacuum distillation unit off-gas treater system (Muroran annex)
In the process of steaming of the aforesaid systems by S/D operation, cleaning agent was injected into the system and vaporized, and steam cleaning took place. The results were favorable; with wastewater stripper, no gas prohibiting entry into the vessel could be detected after the manhole was opened following completion of cleaning. Final sampling results prior to manhole opening: H2S = 3.5 ppm, benzene = 1 ppm or less, LEL (explosion lower limit) = 0%. Cleaning initial period: H2S = 300 ppm, benzene = 1 ppm or less, LEL = 5%.) In final sampling of the off-gas treater system, prior to manhole opening, gas-prohibiting entry into the vessel could not be detected. Respecting the ADIP off-gas treater drum, however, residual hydrogen sulfide could be detected from the iron sulfide scale that remained, and the tank could not be entered immediately. It was thus discovered that prior to steam cleaning, it is necessary either to dispel sludge outside the system or to cause sludge and cleaning fluid to come in contact adequately. On the other hand, when chemical agent was injected in the steaming process, odor was generated and cleaning was terminated temporarily, so it was found that countermeasure against odor is also an important issue.
(D) Cleaning with bubbles
At petroleum refining facilities, vessels and tanks have large capacity as opposed to surface area, and for chemical cleaning with these containers filled to capacity, very large volumes of
liquid are required.
21
Consequently, in order to clean these units with as little liquid as possible, investigation was made of cleaning with bubbles. Given the nature of bubbles, they cannot be circulated like liquids, so the first specific target to be considered was removal of ammonia gas in the high-pressure separator of the kerosene hydrogenation refinement unit discussed in the previous section. Initial laboratory tests were performed, and the conduct of tests on the pilot scale was scheduled, but favorable results have not been obtained in laboratory tests thus far, and such tests continue to be implemented.
(2) Tank chemical cleaning
(A) Circulation cleaning method
Among the methods used to churn and circulate fluids at good efficiency inside tank is the method that uses a Butterworth machine, but because such a machine has not been installed in
the tank to be cleaned, the following measures were taken. (See Figure 2-12.)
(1) An injection nozzle for cleaning was installed provisionally on the tank roof plate facing into the tank, and fluid was injected into the tank.
(2) A total of four injection nozzles were installed, each at a capacity of 160 kl/h, and fluid
was injected, one nozzle at a time.
(3) Chemical was injected from the inlet of a circulation pump installed provisionally.
(4) A heating coil already installed was used to heat the cleaning fluid.
Selected as the cleaning agent was a chemical of high cleaning action with oil or water
and with low COD, etc., whenever wastewater might be generated.
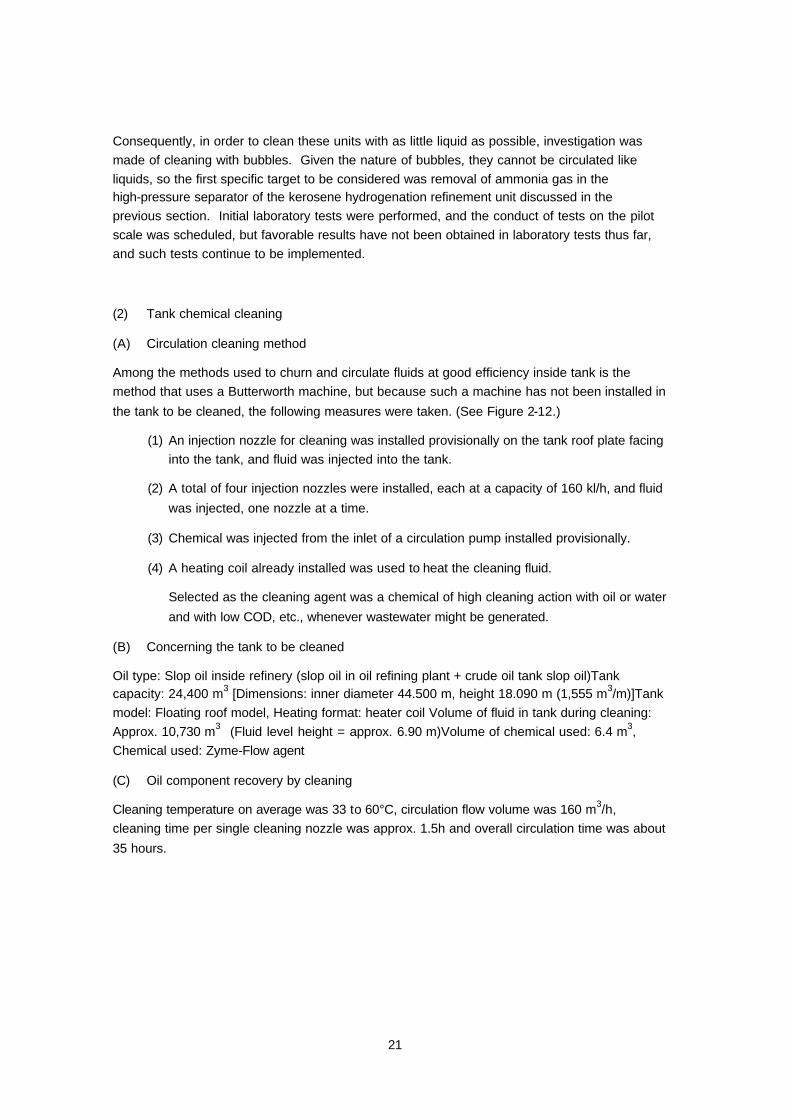
(B) Concerning the tank to be cleaned
Oil type: Slop oil inside refinery (slop oil in oil refining plant + crude oil tank slop oil)Tank capacity: 24,400 m3 [Dimensions: inner diameter 44.500 m, height 18.090 m (1,555 m3/m)]Tank model: Floating roof model, Heating format: heater coil Volume of fluid in tank during cleaning: Approx. 10,730 m3 (Fluid level height = approx. 6.90 m)Volume of chemical used: 6.4 m3, Chemical used: Zyme-Flow agent
(C) Oil component recovery by cleaning
Cleaning temperature on average was 33 to 60°C, circulation flow volume was 160 m3/h, cleaning time per single cleaning nozzle was approx. 1.5h and overall circulation time was about
35 hours.
22
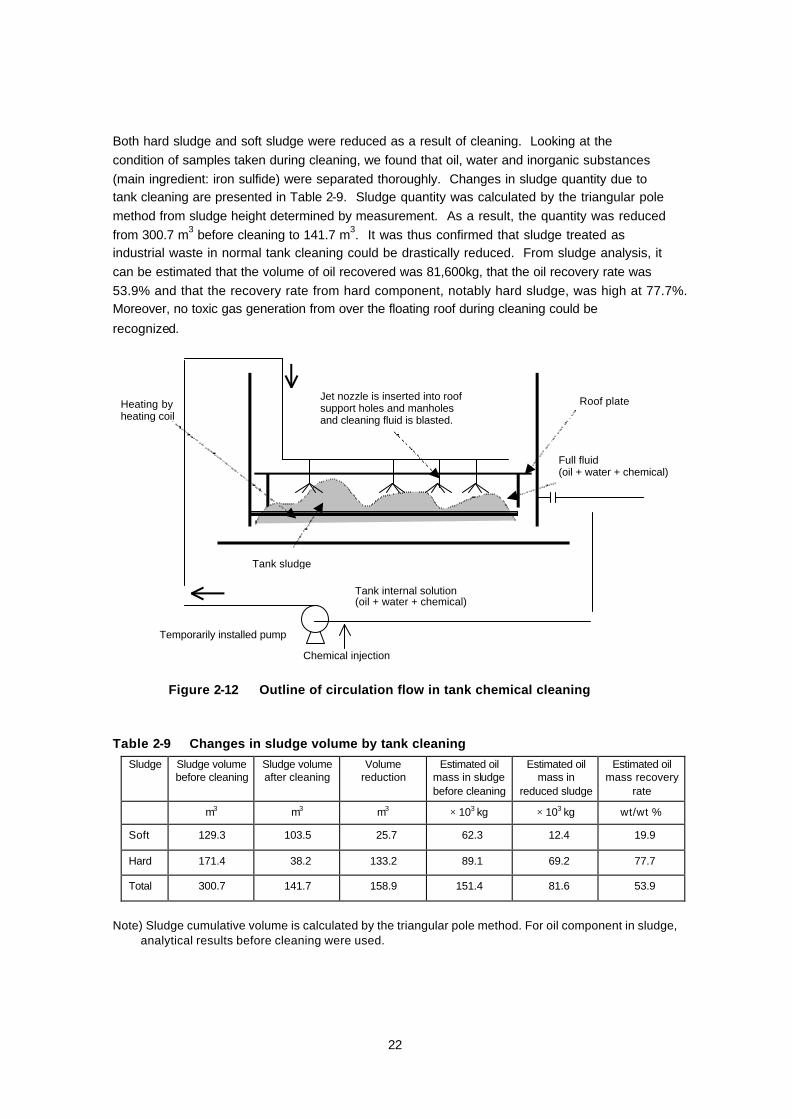
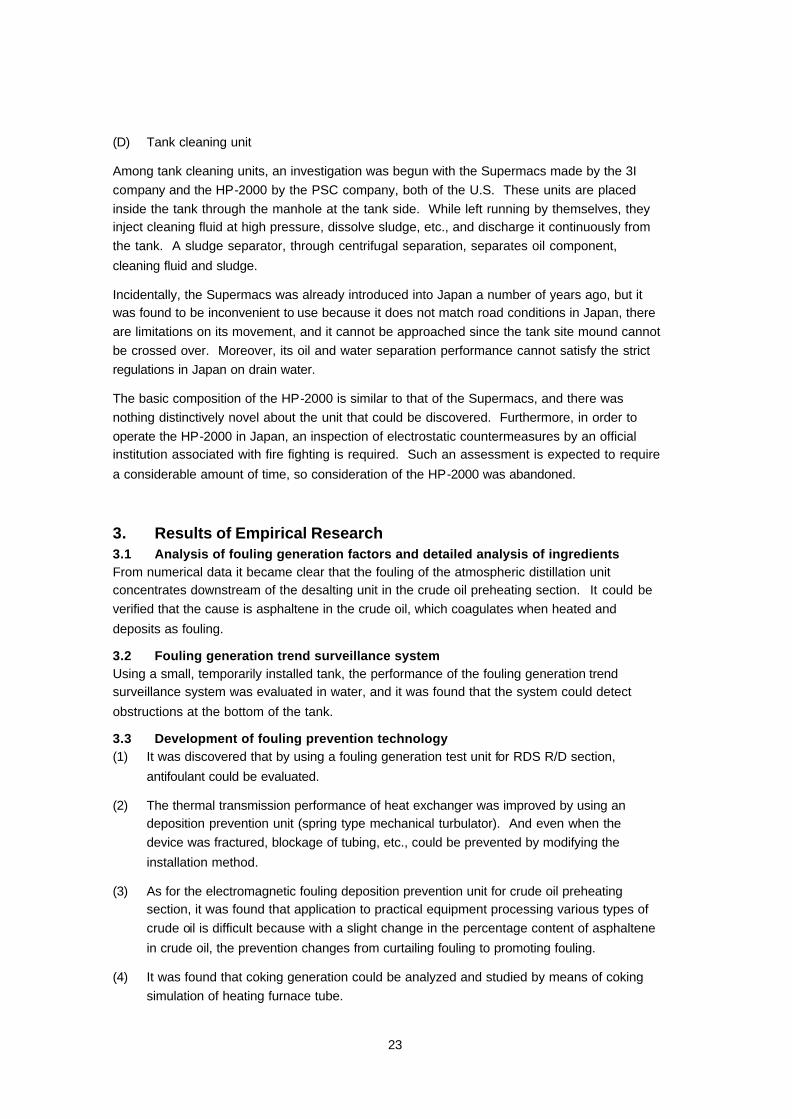
Both hard sludge and soft sludge were reduced as a result of cleaning. Looking at the condition of samples taken during cleaning, we found that oil, water and inorganic substances (main ingredient: iron sulfide) were separated thoroughly. Changes in sludge quantity due to tank cleaning are presented in Table 2-9. Sludge quantity was calculated by the triangular pole method from sludge height determined by measurement. As a result, the quantity was reduced from 300.7 m3 before cleaning to 141.7 m3. It was thus confirmed that sludge treated as industrial waste in normal tank cleaning could be drastically reduced. From sludge analysis, it can be estimated that the volume of oil recovered was 81,600kg, that the oil recovery rate was 53.9% and that the recovery rate from hard component, notably hard sludge, was high at 77.7%. Moreover, no toxic gas generation from over the floating roof during cleaning could be
recognized.
Temporarily installed pump
Tank sludge
Roof plate Heating by heating coil
Jet nozzle is inserted into roof support holes and manholes and cleaning fluid is blasted.
Tank internal solution (oil + water + chemical)
Chemical injection
Full fluid (oil + water + chemical)
Figure 2-12 Outline of circulation flow in tank chemical cleaning
Table 2-9 Changes in sludge volume by tank cleaning
Sludge Sludge volume before cleaning
Sludge volume after cleaning
Volume reduction
Estimated oil mass in sludge before cleaning
Estimated oil mass in
reduced sludge
Estimated oil mass recovery
rate
m3 m3 m3 × 103 kg × 103 kg wt/wt %
Soft 129.3 103.5 25.7 62.3 12.4 19.9
Hard 171.4 38.2 133.2 89.1 69.2 77.7
Total 300.7 141.7 158.9 151.4 81.6 53.9
Note) Sludge cumulative volume is calculated by the triangular pole method. For oil component in sludge,
analytical results before cleaning were used.
23
(D) Tank cleaning unit
Among tank cleaning units, an investigation was begun with the Supermacs made by the 3I company and the HP-2000 by the PSC company, both of the U.S. These units are placed inside the tank through the manhole at the tank side. While left running by themselves, they inject cleaning fluid at high pressure, dissolve sludge, etc., and discharge it continuously from the tank. A sludge separator, through centrifugal separation, separates oil component,
cleaning fluid and sludge.
Incidentally, the Supermacs was already introduced into Japan a number of years ago, but it was found to be inconvenient to use because it does not match road conditions in Japan, there are limitations on its movement, and it cannot be approached since the tank site mound cannot be crossed over. Moreover, its oil and water separation performance cannot satisfy the strict regulations in Japan on drain water.
The basic composition of the HP-2000 is similar to that of the Supermacs, and there was nothing distinctively novel about the unit that could be discovered. Furthermore, in order to operate the HP-2000 in Japan, an inspection of electrostatic countermeasures by an official institution associated with fire fighting is required. Such an assessment is expected to require
a considerable amount of time, so consideration of the HP-2000 was abandoned.
3. Results of Empirical Research 3.1 Analysis of fouling generation factors and detailed analysis of ingredients From numerical data it became clear that the fouling of the atmospheric distillation unit concentrates downstream of the desalting unit in the crude oil preheating section. It could be verified that the cause is asphaltene in the crude oil, which coagulates when heated and
deposits as fouling.
3.2 Fouling generation trend surveillance system Using a small, temporarily installed tank, the performance of the fouling generation trend surveillance system was evaluated in water, and it was found that the system could detect
obstructions at the bottom of the tank.
3.3 Development of fouling prevention technology (1) It was discovered that by using a fouling generation test unit for RDS R/D section,
antifoulant could be evaluated.
(2) The thermal transmission performance of heat exchanger was improved by using an deposition prevention unit (spring type mechanical turbulator). And even when the device was fractured, blockage of tubing, etc., could be prevented by modifying the
installation method.
(3) As for the electromagnetic fouling deposition prevention unit for crude oil preheating section, it was found that application to practical equipment processing various types of crude oil is difficult because with a slight change in the percentage content of asphaltene
in crude oil, the prevention changes from curtailing fouling to promoting fouling.
(4) It was found that coking generation could be analyzed and studied by means of coking simulation of heating furnace tube.
24
(5) With two parallel crude oil preheating sections, by reinforcing the desalting unit of one section, the relationship between removal of generated fouling by desalting unit and the status of fouling in the downstream heat exchanger (heat transmission characteristic) could be monitored and compared.
3.4 Development of fouling removal technology (1) It was discovered that by adding an aromatic solvent beforehand in the gas oil circulation
process, the effectiveness of heat exchanger cleaning in the subsequent water-type
chemical cleaning could be drastically improved.
(2) Chemical cleaning of desalting unit yielded favorable results in degassing but sludge removal results were unsatisfactory, and it was determined that mixing method and sludge discharge method in the desalting unit must be studied. It was also found that chemical cleaning agent can never be reused because the amount of cleaning ingredient remaining in waste fluid after cleaning varies with the cleaning target.
(3) It was found that chemical cleaning of heat exchanger without opening is difficult at the present stage because much coke precursor is contained in laminar scale in the tubing of the residual oil desulfurization unit product oil R/D section heat exchanger and the scale adheres to the tubing.
(4) Ammonia gas permeating the concrete lining of the hydro-refining unit high-pressure separator could be removed well by the method of deodorant vaporization. With respect to plant degassing, it was found that there are cases in which degassing is inadequate when sludge remains in the equipment and that countermeasures against odor are
necessary.
(5) An investigation was made of circulation cleaning by chemical agent of the slop oil tank in an oil refinery. As a result of tank cleaning, accumulated sludge could be reduced to about half its former volume.
4. Synopsis As a result of investigations, evaluations and partial applications to some practical equipment, at the laboratory level, the effectiveness and problematic points of each elemental technology associated with fouling prevention and/or removal could be clarified. There is also some technology currently being evaluated, and further improvements and renovations will have to be made through ongoing surveillance and evaluation. The issues of concern are presented below.
4.1 Analysis of fouling generation factors and detailed analysis of ingredients In measurement of asphaltene colloid particle size in crude oil, it is believed that the bulk layer in the fraction oil of gas oil, etc., must be changed because light does not permeate. Test methods will be made specific in the future. Analysis on a practical scale will also be continued.
25
4.2 Fouling generation trend surveillance system (tank sludge measurement) One of the issues involved in developing this ultrasonic wave measuring instrument is making the unit “explosion proof.” As would be expected, this instrument is an electrical unit, and in order to use it in a crude oil tank where combustible gas is continuously produced, it must be of explosion proof structure. Consequently, an ultrasonic wave echo sounder transducer that applies a high voltage for explosion proofing by oil seal and the other components of pressure-resistant, explosion-proof structure were used. Approval for explosion proofing is currently being obtained from the Industrial Safety Association. Upon receipt of approval, practical tank sludge measurements will be taken and comparisons made with conventional
methods.
4.3 Development of fouling prevention technology (1) Prevention technology by fouling deposition prevention unit/tools
More data will be collected on temporal changes in performance over long-term use and fouling curtailment effects will be checked.
(2) Study of antifoulant for RDS R/D section
Since it is difficult to remove by cleaning the coked-up scale found in heat exchanger of the aforesaid system, the antifoulant selected in laboratory experiments to prevent the adherence of
scale will be injected into practical equipment and its effectiveness will be evaluated.
4.4 Development of fouling removal technology Plant chemical cleaning technology
• Dissolving power will be strengthened by using aromatic solvent of high distillation point and by adding aid to aromatic solvent.
• Studies will be made to improve the removal of dead-space sludge and laminar scale in tubing.
• With respect to degassing, efforts will be made to simplify processing as much as possible, to continue with the same level of finish and to reduce costs. In the latest method of deodorization, for example, deodorant was added during steam injection directly into steam, but it is suspected that hydrocarbon gas could also be removed by this procedure. Hence it is conjectured that LG processing could be simplified; for example, that LG concentration could be made low.
Copyright 2000 Petroleum Energy Center all rights reserved.