Embed Size (px)
Citation preview
Re-balancing profitable growth and cash flow 1
Re-balancing profitable growth and cash flow
Investor Presentation
Updated on 23 May 2014
Re-balancing profitable growth and cash flow 2
This presentation may contain statements regarding the business of Olam International Limited and its subsidiaries (‘Group’) that are of a forward looking nature and are therefore based on management’s assumptions about future developments.
Such forward looking statements are intended to be identified by words such as ‘believe’, ‘estimate’, ‘intend’, ‘may’, ‘will’, ‘expect’, and ‘project’ and similar expressions as they relate to the Group. Forward-looking statements involve certain risks and uncertainties because they relate to future events. Actual results may vary materially from those targeted, expected or projected due to several factors.
Potential risks and uncertainties includes such factors as general economic conditions, foreign exchange fluctuations, interest rate changes, commodity price fluctuations and regulatory developments. The reader and/or listener is cautioned to not unduly rely on these forward-looking statements. We do not undertake any duty to publish any update or revision of any forward looking statements.
Cautionary note on forward-looking statements
Re-balancing profitable growth and cash flow 3
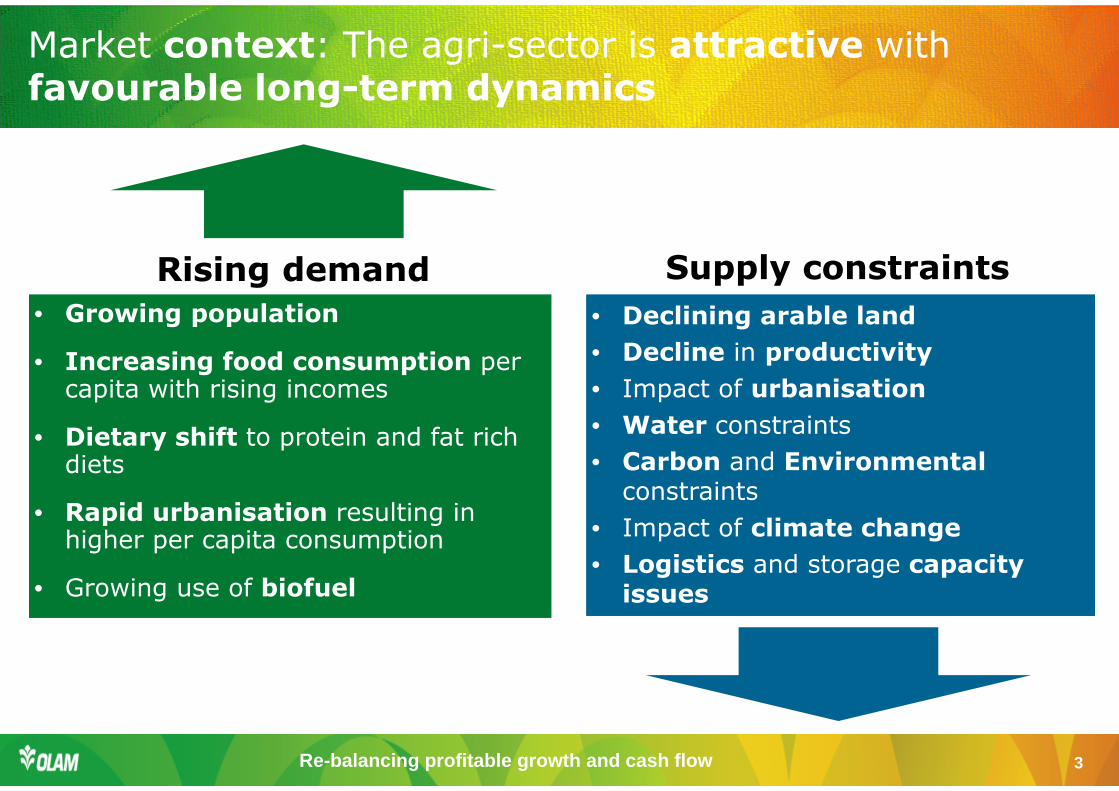
• Growing population
• Increasing food consumption per capita with rising incomes
• Dietary shift to protein and fat rich diets
• Rapid urbanisation resulting in higher per capita consumption
• Growing use of biofuel
• Growing population
• Increasing food consumption per capita with rising incomes
• Dietary shift to protein and fat rich diets
• Rapid urbanisation resulting in higher per capita consumption
• Growing use of biofuel
• Declining arable land
• Decline in productivity
• Impact of urbanisation
• Water constraints
• Carbon and Environmentalconstraints
• Impact of climate change
• Logistics and storage capacity issues
• Declining arable land
• Decline in productivity
• Impact of urbanisation
• Water constraints
• Carbon and Environmentalconstraints
• Impact of climate change
• Logistics and storage capacity issues
Rising demand Supply constraints
Market context: The agri-sector is attractive with favourable long-term dynamics
Re-balancing profitable growth and cash flow 4
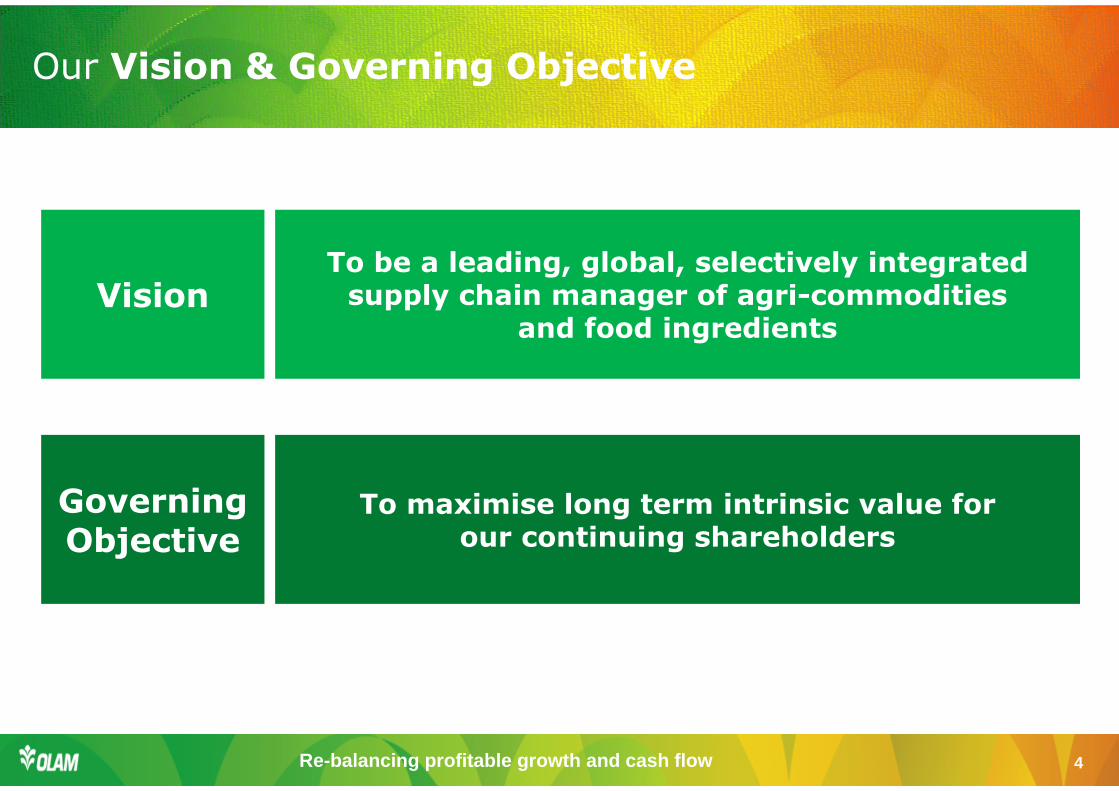
Our Vision & Governing Objective
To be a leading, global, selectively integrated supply chain manager of agri-commodities
and food ingredients
To maximise long term intrinsic value forour continuing shareholders
Vision
Governing Objective
Re-balancing profitable growth and cash flow 5
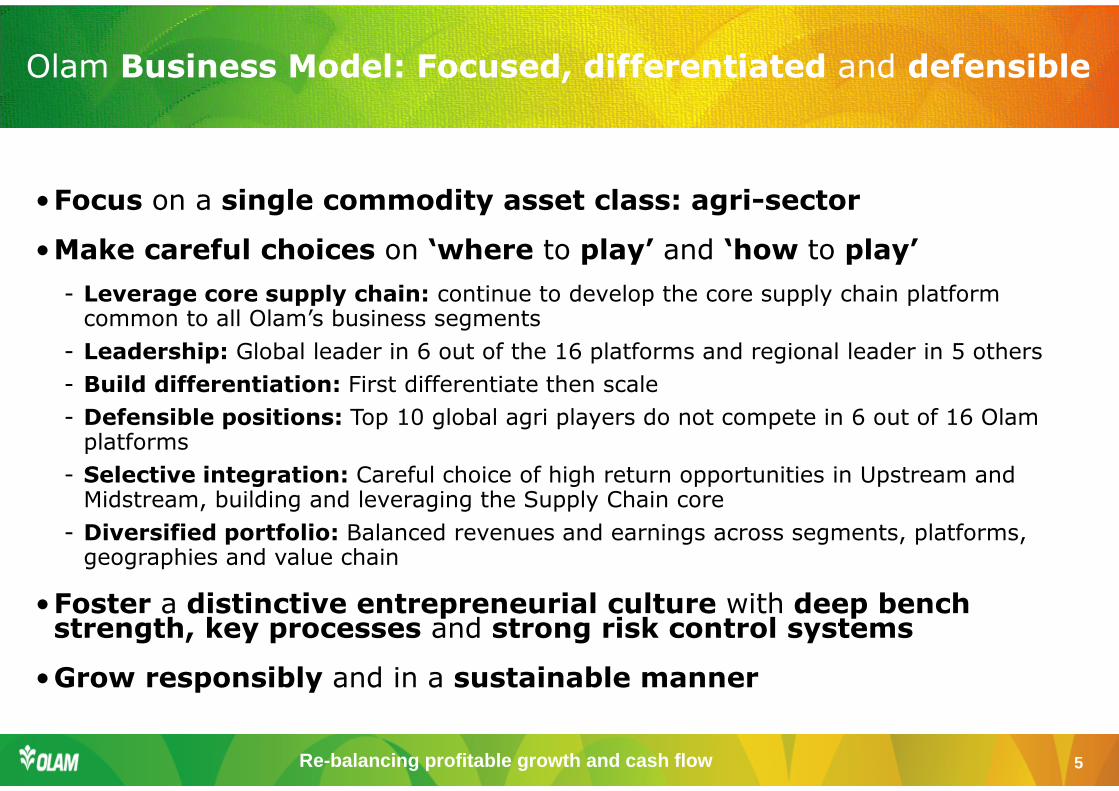
•Focus on a single commodity asset class: agri-sector
•Make careful choices on ‘where to play’ and ‘how to play’
- Leverage core supply chain: continue to develop the core supply chain platform common to all Olam’s business segments
- Leadership: Global leader in 6 out of the 16 platforms and regional leader in 5 others
- Build differentiation: First differentiate then scale
- Defensible positions: Top 10 global agri players do not compete in 6 out of 16 Olamplatforms
- Selective integration: Careful choice of high return opportunities in Upstream and Midstream, building and leveraging the Supply Chain core
- Diversified portfolio: Balanced revenues and earnings across segments, platforms, geographies and value chain
•Foster a distinctive entrepreneurial culture with deep bench strength, key processes and strong risk control systems
•Grow responsibly and in a sustainable manner
Olam Business Model: Focused, differentiated and defensible
Re-balancing profitable growth and cash flow 6
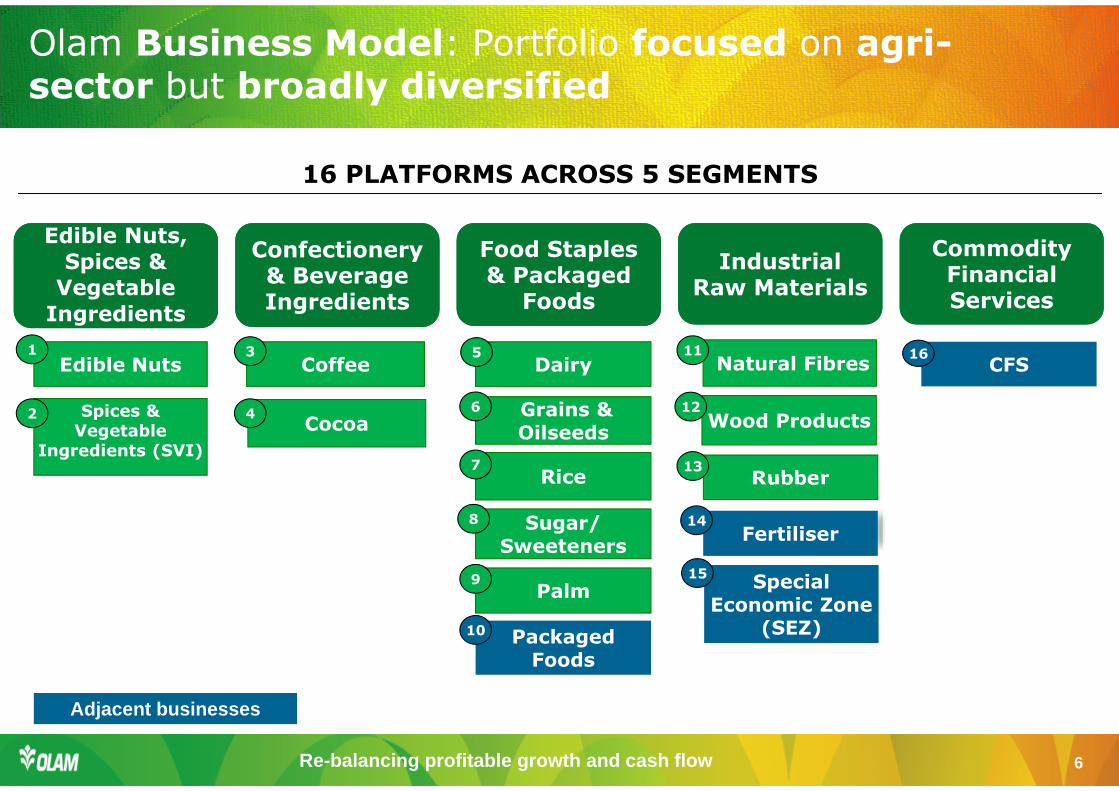
Olam Business Model: Portfolio focused on agri-sector but broadly diversified
Edible Nuts
Spices & Vegetable
Ingredients (SVI)
Coffee
Cocoa
Palm
Grains & Oilseeds
Dairy
Sugar/Sweeteners
Rubber
Natural Fibres
Wood Products
Rice
CFS
Packaged Foods
Fertiliser
Special Economic Zone
(SEZ)
Edible Nuts,
Spices &
Vegetable
Ingredients
Edible Nuts,
Spices &
Vegetable
Ingredients
Confectionery & Beverage Ingredients
Confectionery & Beverage Ingredients
Food Staples & Packaged
Foods
Food Staples & Packaged
Foods
IndustrialRaw Materials
IndustrialRaw Materials
Commodity Financial Services
Commodity Financial Services
16 PLATFORMS ACROSS 5 SEGMENTS
Adjacent businesses
1
2
3
4
5
6
7
8
9
10
11
12
13
14
15
16
Re-balancing profitable growth and cash flow 7
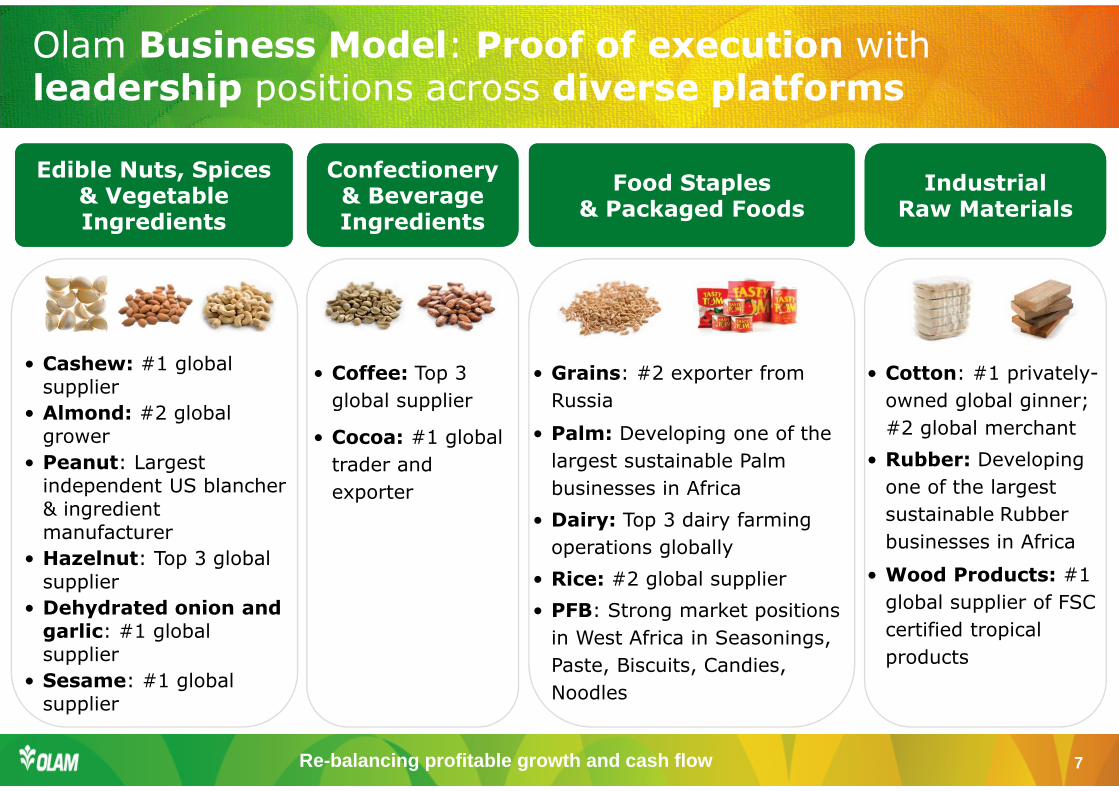
Olam Business Model: Proof of execution with leadership positions across diverse platforms
Edible Nuts, Spices & Vegetable Ingredients
Edible Nuts, Spices & Vegetable Ingredients
Confectionery & Beverage Ingredients
Confectionery & Beverage Ingredients
IndustrialRaw Materials
IndustrialRaw Materials
Food Staples & Packaged Foods
Food Staples & Packaged Foods
• Cashew: #1 global supplier
• Almond: #2 global grower
• Peanut: Largest independent US blancher & ingredient manufacturer
• Hazelnut: Top 3 global
supplier
• Dehydrated onion and garlic: #1 global supplier
• Sesame: #1 global supplier
• Coffee: Top 3
global supplier
• Cocoa: #1 global
trader and
exporter
• Grains: #2 exporter from
Russia
• Palm: Developing one of the
largest sustainable Palm
businesses in Africa
• Dairy: Top 3 dairy farming
operations globally
• Rice: #2 global supplier
• PFB: Strong market positions
in West Africa in Seasonings,
Paste, Biscuits, Candies,
Noodles
• Cotton: #1 privately-
owned global ginner;
#2 global merchant
• Rubber: Developing
one of the largest
sustainable Rubber
businesses in Africa
• Wood Products: #1
global supplier of FSC
certified tropical
products
Re-balancing profitable growth and cash flow 8
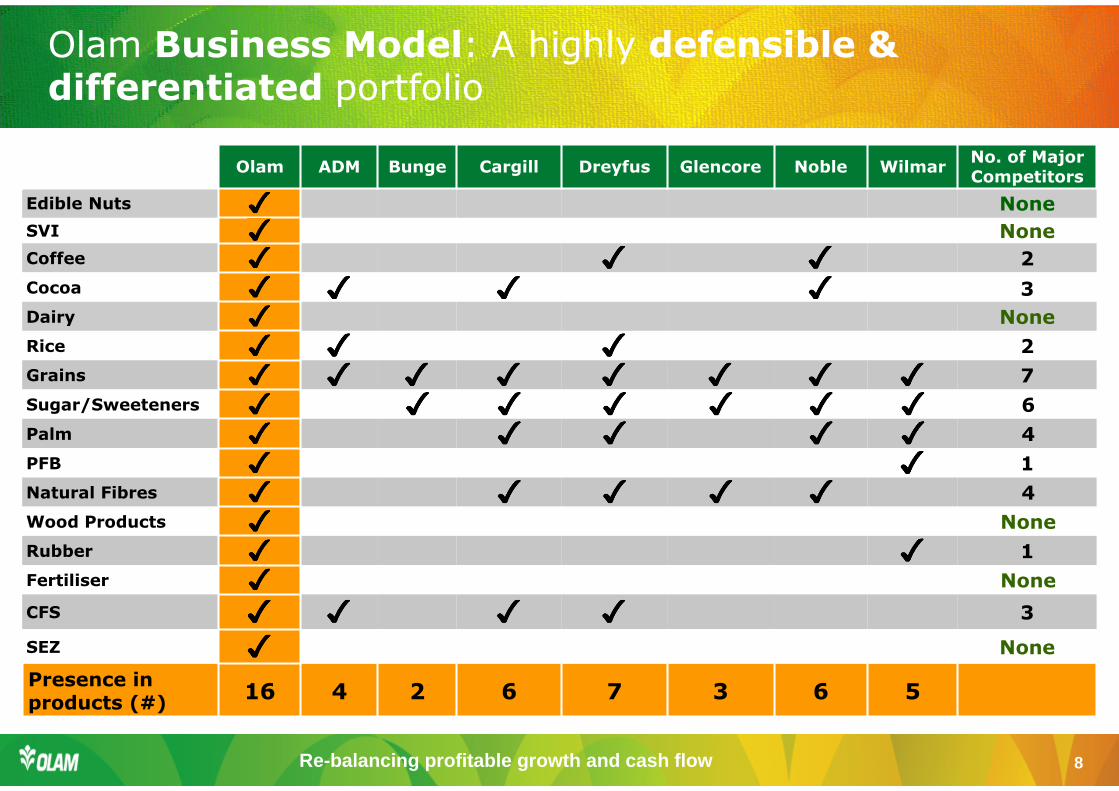
Olam ADM Bunge Cargill Dreyfus Glencore Noble WilmarNo. of Major Competitors
Edible Nuts None
SVI None
Coffee 2
Cocoa 3
Dairy None
Rice 2
Grains 7
Sugar/Sweeteners 6
Palm 4
PFB 1
Natural Fibres 4
Wood Products None
Rubber 1
Fertiliser None
CFS 3
SEZ None
Presence in products (#)
16 4 2 6 7 3 6 5
Olam Business Model: A highly defensible & differentiated portfolio
Re-balancing profitable growth and cash flow 9
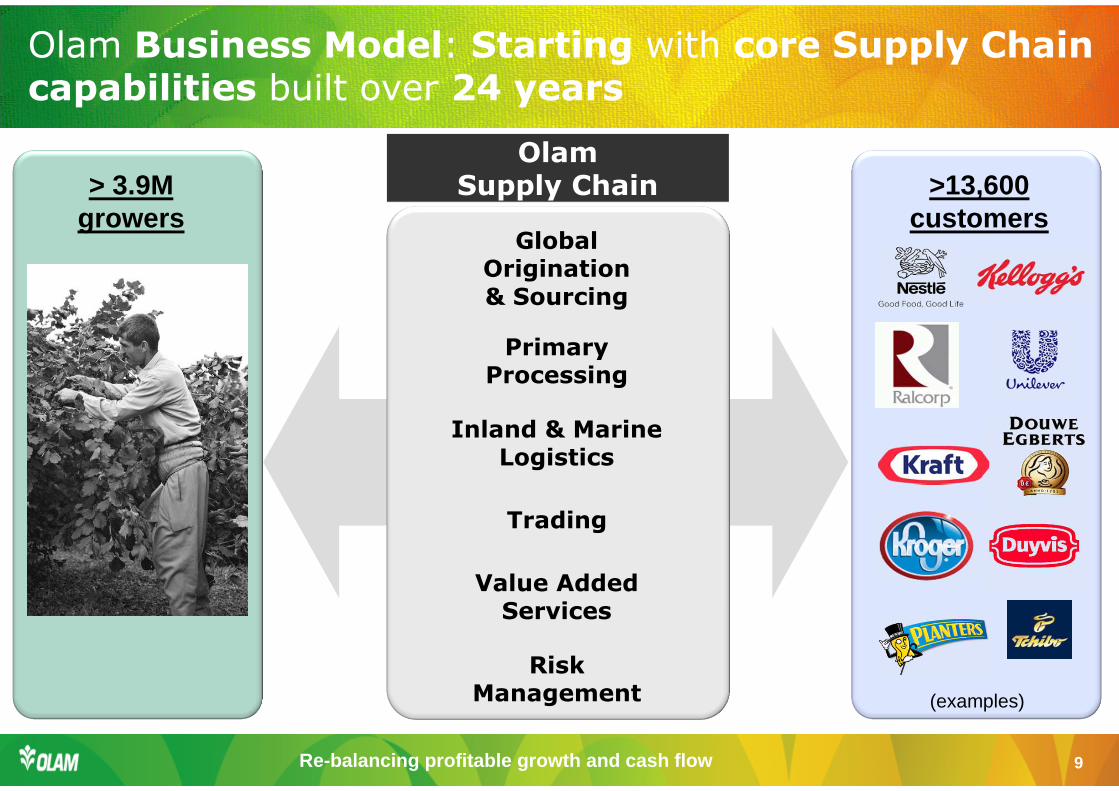
Olam Business Model: Starting with core Supply Chain capabilities built over 24 years
GlobalOrigination& Sourcing
PrimaryProcessing
Inland & Marine Logistics
Trading
Value Added Services
RiskManagement
OlamSupply Chain >13,600
customers> 3.9M
growers
(examples)
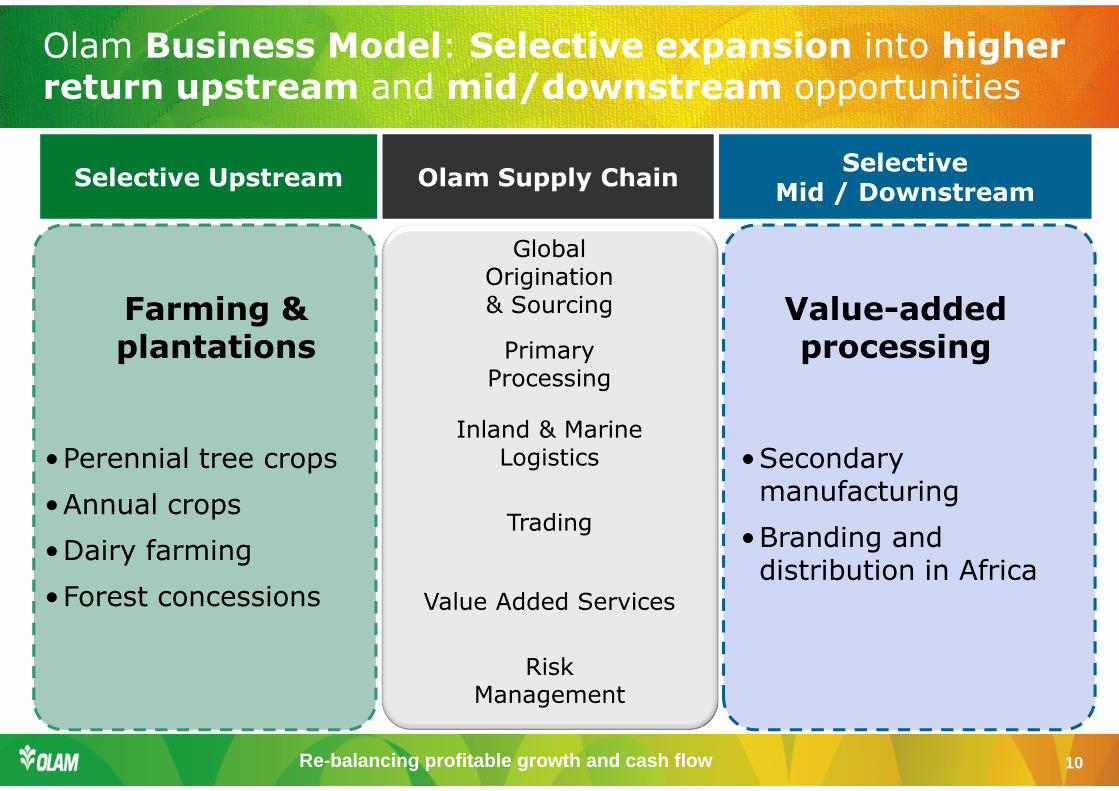
Re-balancing profitable growth and cash flow 10
Olam Business Model: Selective expansion into higher return upstream and mid/downstream opportunities
Olam Supply ChainSelective
Mid / DownstreamSelective Upstream
Farming & plantations
GlobalOrigination& Sourcing Value-added
processingPrimaryProcessing
Inland & Marine Logistics
Trading
Value Added Services
RiskManagement
•Perennial tree crops
•Annual crops
•Dairy farming
•Forest concessions
•Secondary manufacturing
•Branding and distribution in Africa
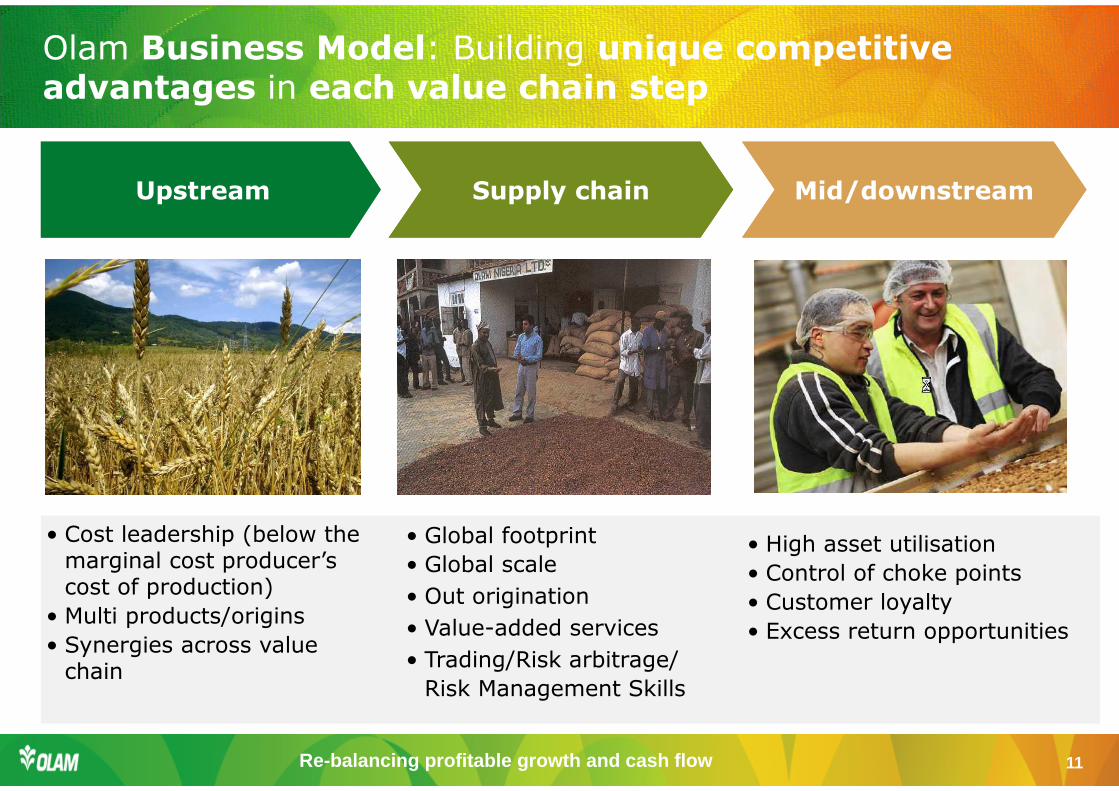
Re-balancing profitable growth and cash flow 11
Olam Business Model: Building unique competitive advantages in each value chain step
• Cost leadership (below the marginal cost producer’s cost of production)
• Multi products/origins
• Synergies across value chain
• Global footprint
• Global scale
• Out origination
• Value-added services
• Trading/Risk arbitrage/
Risk Management Skills
• High asset utilisation
• Control of choke points
• Customer loyalty
• Excess return opportunities
UpstreamUpstream Supply chainSupply chain Mid/downstreamMid/downstream
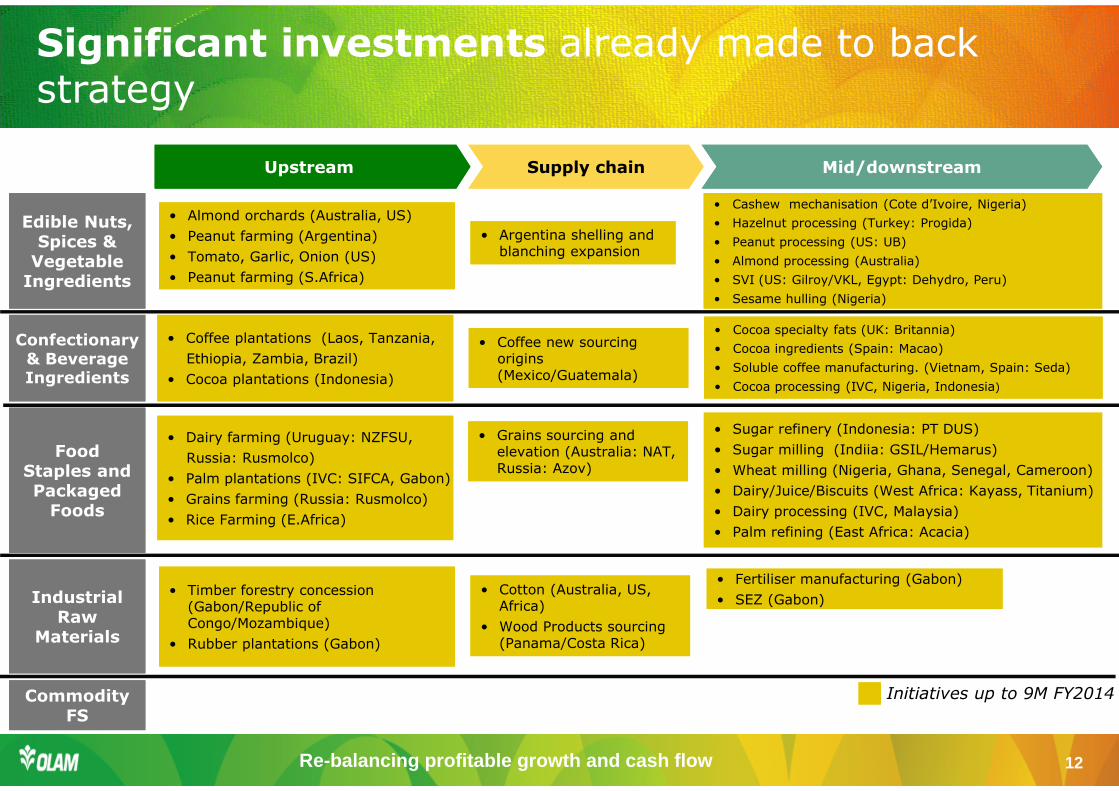
Re-balancing profitable growth and cash flow 12
Significant investments already made to back strategy
Supply chainUpstream Mid/downstreamSupply chainUpstream Mid/downstream
Confectionary & Beverage Ingredients
Confectionary & Beverage Ingredients
Food Staples and Packaged
Foods
Food Staples and Packaged
Foods
Edible Nuts, Spices &
Vegetable Ingredients
Edible Nuts, Spices &
Vegetable Ingredients
IndustrialRaw
Materials
IndustrialRaw
Materials
Commodity FS
Commodity FS
• Almond orchards (Australia, US)
• Peanut farming (Argentina)
• Tomato, Garlic, Onion (US)
• Peanut farming (S.Africa)
• Almond orchards (Australia, US)
• Peanut farming (Argentina)
• Tomato, Garlic, Onion (US)
• Peanut farming (S.Africa)
• Coffee plantations (Laos, Tanzania,
Ethiopia, Zambia, Brazil)
• Cocoa plantations (Indonesia)
• Coffee plantations (Laos, Tanzania,
Ethiopia, Zambia, Brazil)
• Cocoa plantations (Indonesia)
• Dairy farming (Uruguay: NZFSU,
Russia: Rusmolco)
• Palm plantations (IVC: SIFCA, Gabon)
• Grains farming (Russia: Rusmolco)
• Rice Farming (E.Africa)
• Dairy farming (Uruguay: NZFSU,
Russia: Rusmolco)
• Palm plantations (IVC: SIFCA, Gabon)
• Grains farming (Russia: Rusmolco)
• Rice Farming (E.Africa)
• Coffee new sourcing origins (Mexico/Guatemala)
• Coffee new sourcing origins (Mexico/Guatemala)
• Cotton (Australia, US, Africa)
• Wood Products sourcing (Panama/Costa Rica)
• Cotton (Australia, US, Africa)
• Wood Products sourcing (Panama/Costa Rica)
• Sugar refinery (Indonesia: PT DUS)
• Sugar milling (Indiia: GSIL/Hemarus)
• Wheat milling (Nigeria, Ghana, Senegal, Cameroon)
• Dairy/Juice/Biscuits (West Africa: Kayass, Titanium)
• Dairy processing (IVC, Malaysia)
• Palm refining (East Africa: Acacia)
• Sugar refinery (Indonesia: PT DUS)
• Sugar milling (Indiia: GSIL/Hemarus)
• Wheat milling (Nigeria, Ghana, Senegal, Cameroon)
• Dairy/Juice/Biscuits (West Africa: Kayass, Titanium)
• Dairy processing (IVC, Malaysia)
• Palm refining (East Africa: Acacia)
Initiatives up to 9M FY2014
• Argentina shelling and blanching expansion
• Argentina shelling and blanching expansion
• Grains sourcing and elevation (Australia: NAT, Russia: Azov)
• Grains sourcing and elevation (Australia: NAT, Russia: Azov)
• Timber forestry concession (Gabon/Republic of Congo/Mozambique)
• Rubber plantations (Gabon)
• Timber forestry concession (Gabon/Republic of Congo/Mozambique)
• Rubber plantations (Gabon)
• Cashew mechanisation (Cote d’Ivoire, Nigeria)
• Hazelnut processing (Turkey: Progida)
• Peanut processing (US: UB)
• Almond processing (Australia)
• SVI (US: Gilroy/VKL, Egypt: Dehydro, Peru)
• Sesame hulling (Nigeria)
• Cashew mechanisation (Cote d’Ivoire, Nigeria)
• Hazelnut processing (Turkey: Progida)
• Peanut processing (US: UB)
• Almond processing (Australia)
• SVI (US: Gilroy/VKL, Egypt: Dehydro, Peru)
• Sesame hulling (Nigeria)
• Fertiliser manufacturing (Gabon)
• SEZ (Gabon)
• Fertiliser manufacturing (Gabon)
• SEZ (Gabon)
• Cocoa specialty fats (UK: Britannia)
• Cocoa ingredients (Spain: Macao)
• Soluble coffee manufacturing. (Vietnam, Spain: Seda)
• Cocoa processing (IVC, Nigeria, Indonesia)
• Cocoa specialty fats (UK: Britannia)
• Cocoa ingredients (Spain: Macao)
• Soluble coffee manufacturing. (Vietnam, Spain: Seda)
• Cocoa processing (IVC, Nigeria, Indonesia)
Re-balancing profitable growth and cash flow 13
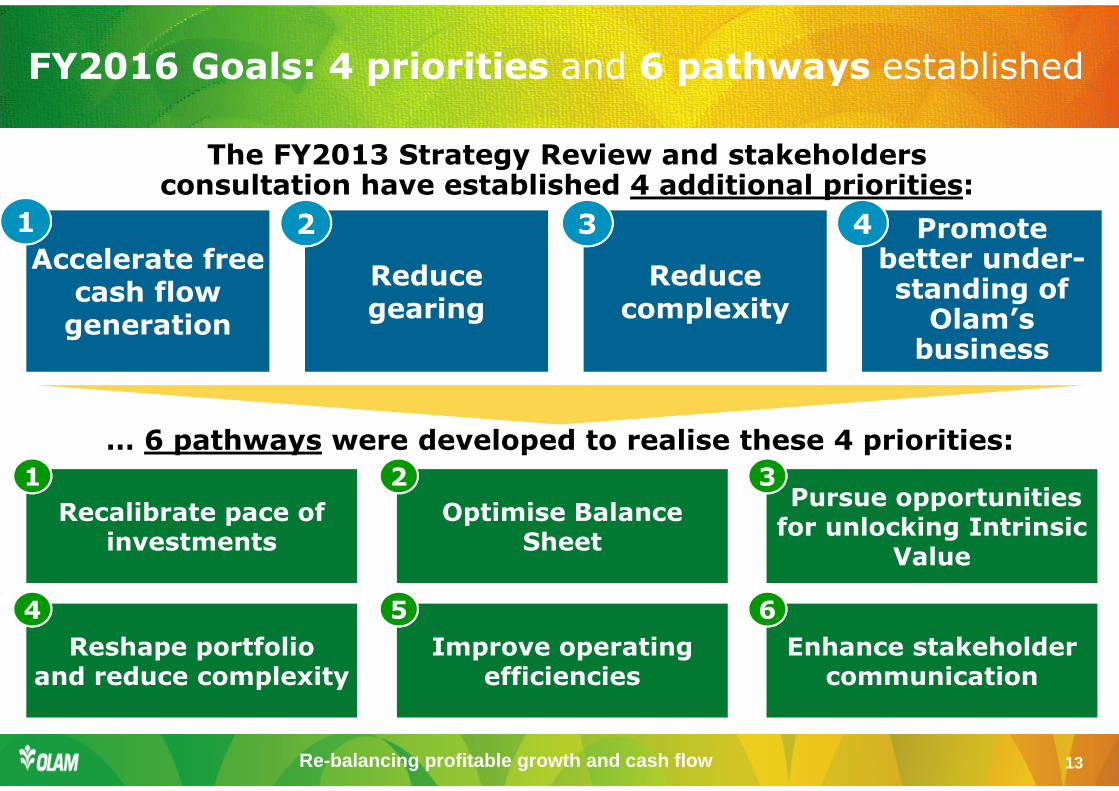
FY2016 Goals: 4 priorities and 6 pathways established
Accelerate free Accelerate free cash flow
generation
Reduce gearing
Reduce complexity
Promote better under-standing of
Olam’sbusiness
Recalibrate pace of investments
Optimise Balance Sheet
Pursue opportunities for unlocking Intrinsic
Value
Reshape portfolio and reduce complexity
Improve operating efficiencies
Enhance stakeholder communication
1 2 3 4
… 6 pathways were developed to realise these 4 priorities:
1 2 3
4 5 6
The FY2013 Strategy Review and stakeholders consultation have established 4 additional priorities:
Re-balancing profitable growth and cash flow 14
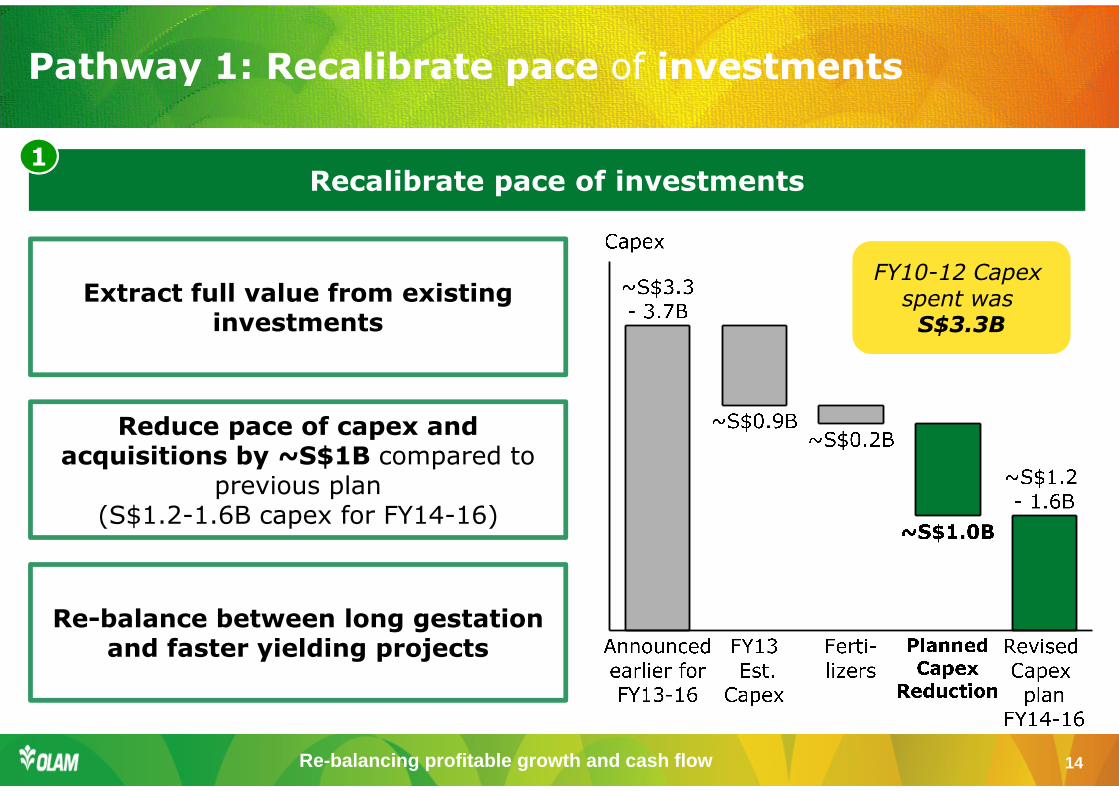
Pathway 1: Recalibrate pace of investments
Recalibrate pace of investments1
Extract full value from existing investments
Reduce pace of capex and acquisitions by ~S$1B compared to
previous plan (S$1.2-1.6B capex for FY14-16)
Re-balance between long gestation and faster yielding projects
FY10-12 Capexspent was S$3.3B
Re-balancing profitable growth and cash flow 15
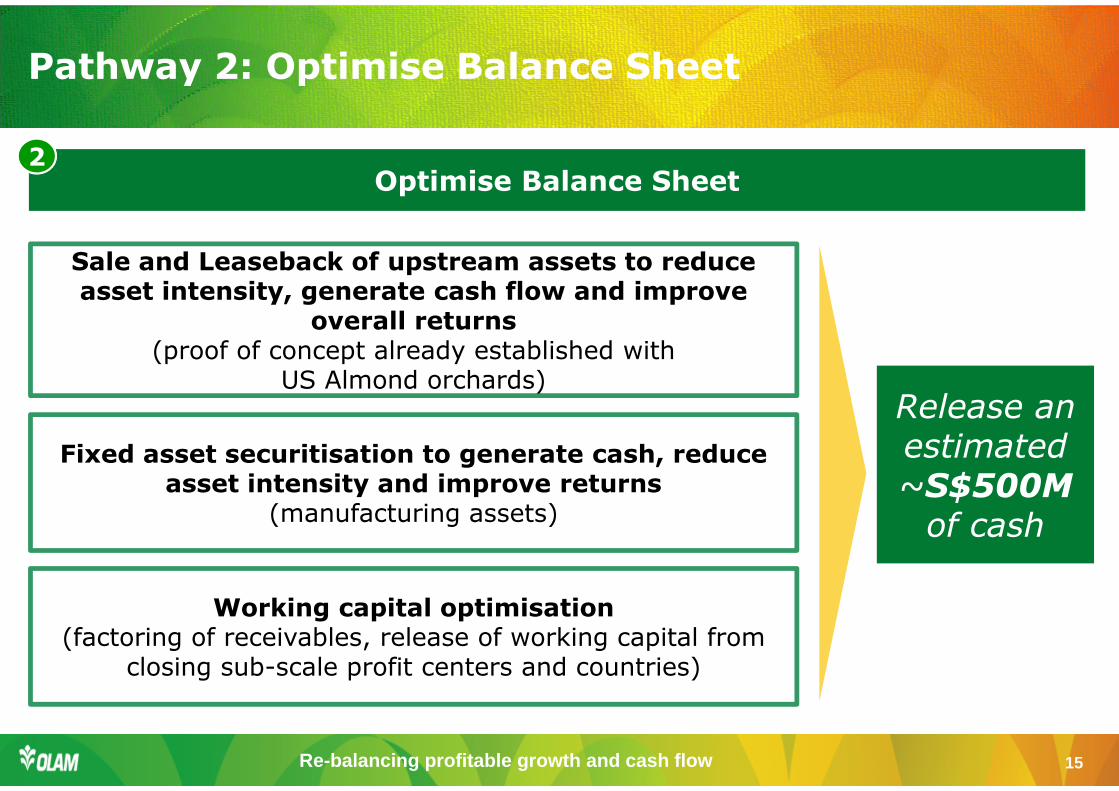
Pathway 2: Optimise Balance Sheet
Optimise Balance Sheet2
Sale and Leaseback of upstream assets to reduce asset intensity, generate cash flow and improve
overall returns(proof of concept already established with
US Almond orchards)
Fixed asset securitisation to generate cash, reduce asset intensity and improve returns
(manufacturing assets)
Working capital optimisation(factoring of receivables, release of working capital from
closing sub-scale profit centers and countries)
Release an estimated ~S$500M
of cash
Re-balancing profitable growth and cash flow 16
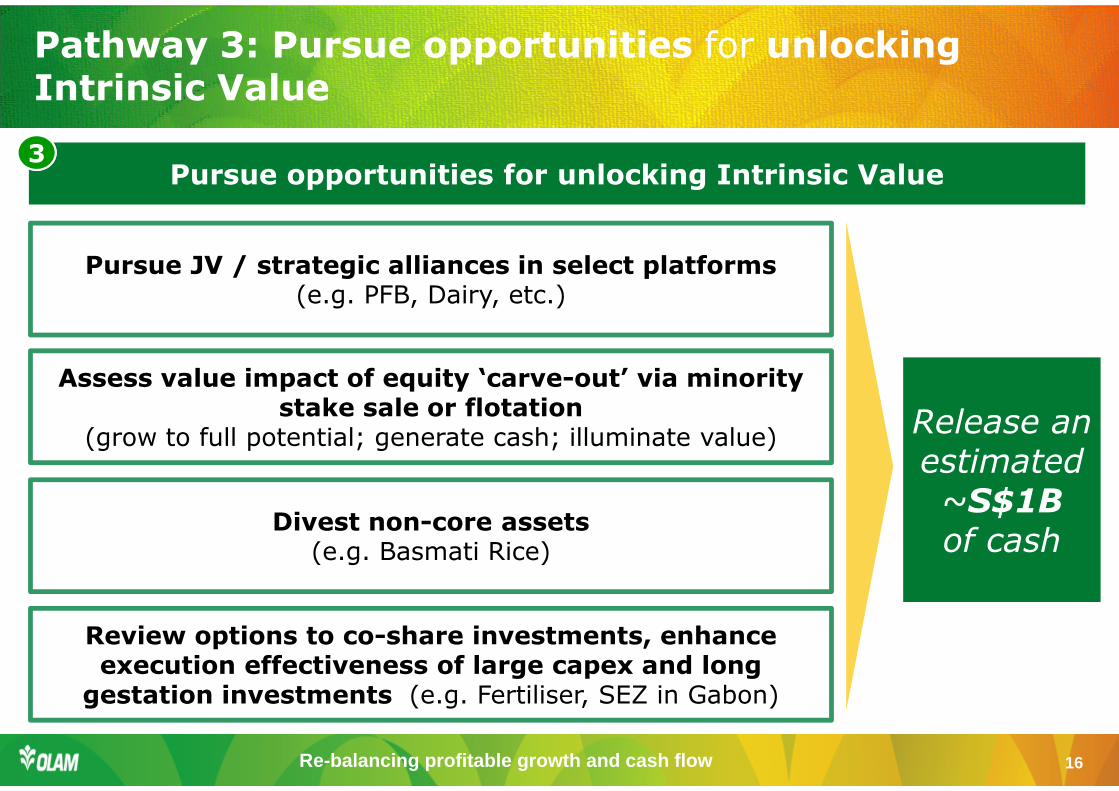
Pathway 3: Pursue opportunities for unlocking Intrinsic Value
Pursue opportunities for unlocking Intrinsic Value3
Divest non-core assets(e.g. Basmati Rice)
Assess value impact of equity ‘carve-out’ via minority stake sale or flotation
(grow to full potential; generate cash; illuminate value)
Pursue JV / strategic alliances in select platforms(e.g. PFB, Dairy, etc.)
Release an estimated ~S$1Bof cash
Review options to co-share investments, enhance execution effectiveness of large capex and long
gestation investments (e.g. Fertiliser, SEZ in Gabon)
Re-balancing profitable growth and cash flow 17
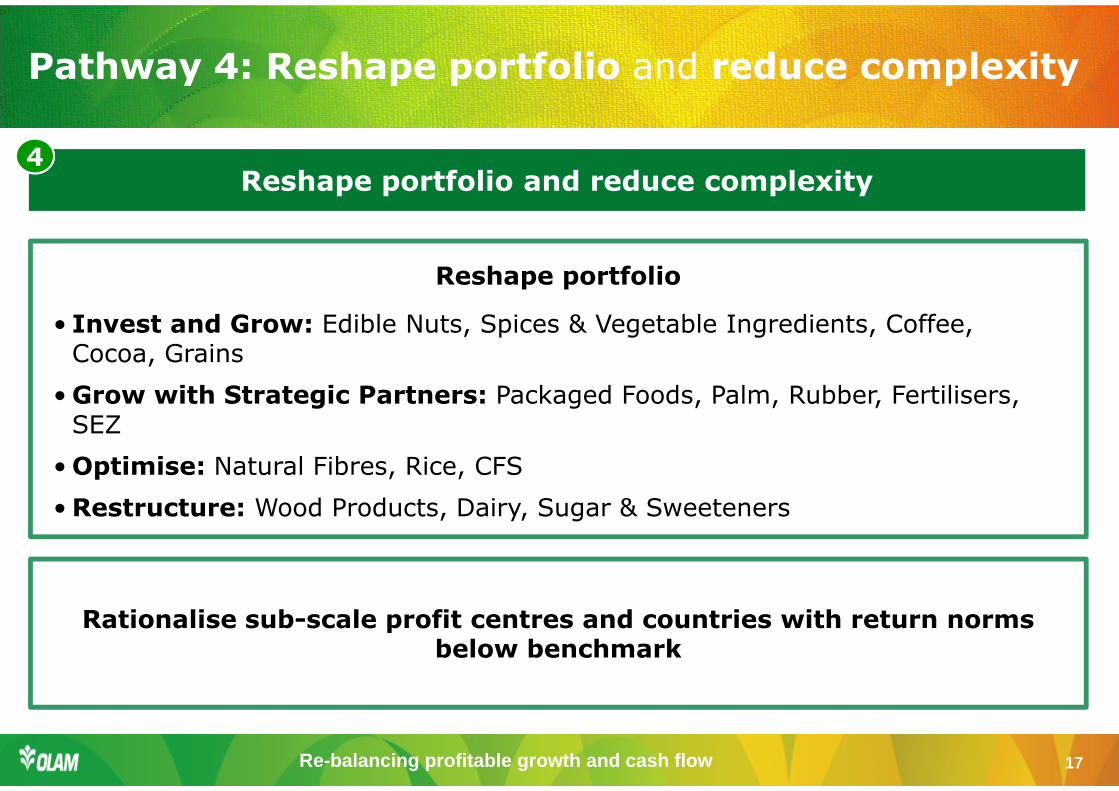
Pathway 4: Reshape portfolio and reduce complexity
Reshape portfolio and reduce complexity4
Reshape portfolio
Rationalise sub-scale profit centres and countries with return norms below benchmark
• Invest and Grow: Edible Nuts, Spices & Vegetable Ingredients, Coffee, Cocoa, Grains
• Grow with Strategic Partners: Packaged Foods, Palm, Rubber, Fertilisers, SEZ
• Optimise: Natural Fibres, Rice, CFS
• Restructure: Wood Products, Dairy, Sugar & Sweeteners
Re-balancing profitable growth and cash flow 18
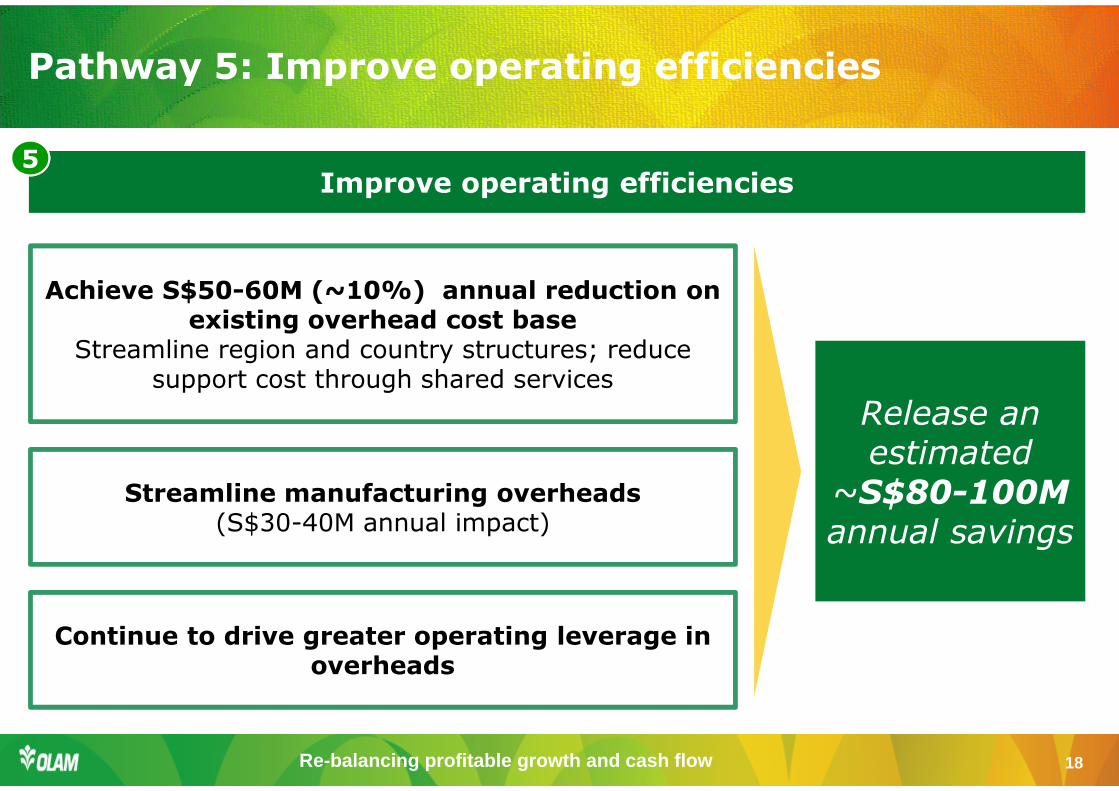
Pathway 5: Improve operating efficiencies
Improve operating efficiencies5
Achieve S$50-60M (~10%) annual reduction on existing overhead cost base
Streamline region and country structures; reduce support cost through shared services
Streamline manufacturing overheads (S$30-40M annual impact)
Continue to drive greater operating leverage in overheads
Release an estimated
~S$80-100Mannual savings
Re-balancing profitable growth and cash flow 19
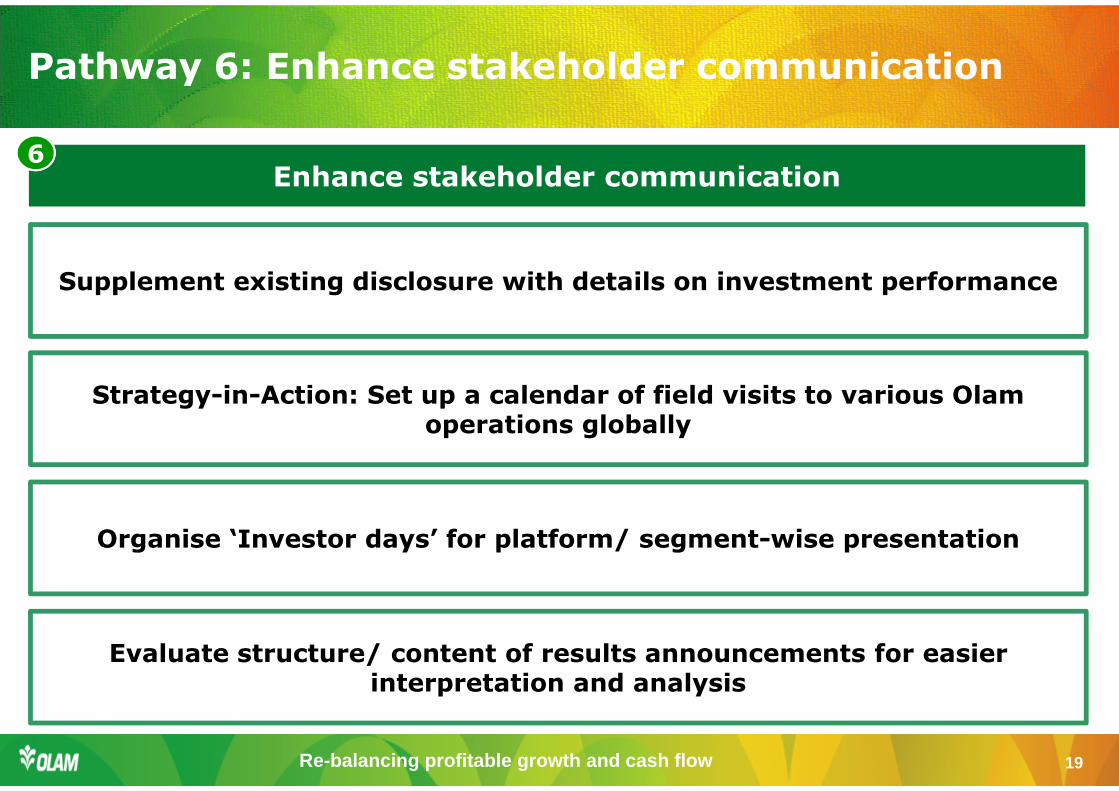
Pathway 6: Enhance stakeholder communication
Enhance stakeholder communication6
Supplement existing disclosure with details on investment performance
Strategy-in-Action: Set up a calendar of field visits to various Olamoperations globally
Organise ‘Investor days’ for platform/ segment-wise presentation
Evaluate structure/ content of results announcements for easier interpretation and analysis
Re-balancing profitable growth and cash flow 20
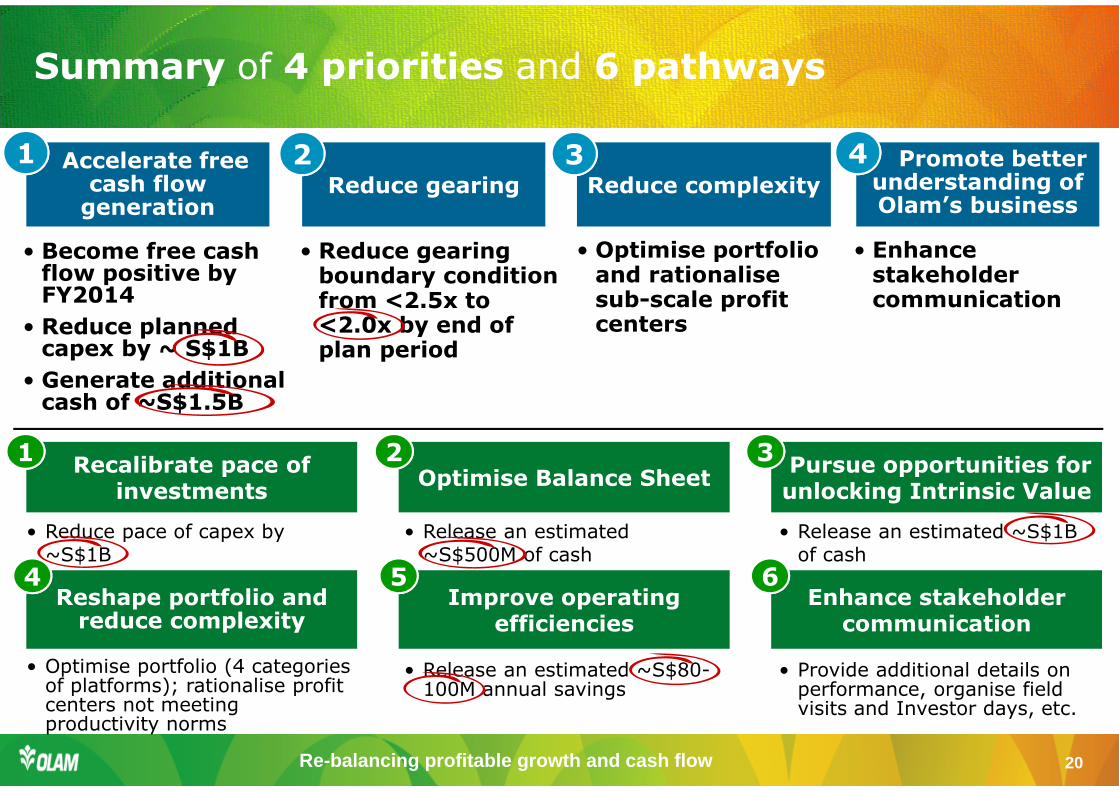
Summary of 4 priorities and 6 pathways
Accelerate free cash flow
generationReduce gearing Reduce complexity
Promote better understanding of Olam’s business
Recalibrate pace of investments
Optimise Balance SheetPursue opportunities for unlocking Intrinsic Value
Reshape portfolio and reduce complexity
Improve operating efficiencies
Enhance stakeholder communication
1 2 3 4
1 2 3
4 5 6
• Reduce gearing boundary condition from <2.5x to <2.0x by end of plan period
• Become free cash flow positive by FY2014
• Reduce planned capex by ~ S$1B
• Generate additional cash of ~S$1.5B
• Optimise portfolio and rationalisesub-scale profit centers
• Enhance stakeholder communication
• Reduce pace of capex by ~S$1B
• Release an estimated ~S$500M of cash
• Release an estimated ~S$1B of cash
• Optimise portfolio (4 categories of platforms); rationalise profit centers not meeting productivity norms
• Release an estimated ~S$80-100M annual savings
• Provide additional details on performance, organise field visits and Investor days, etc.
Re-balancing profitable growth and cash flow 21
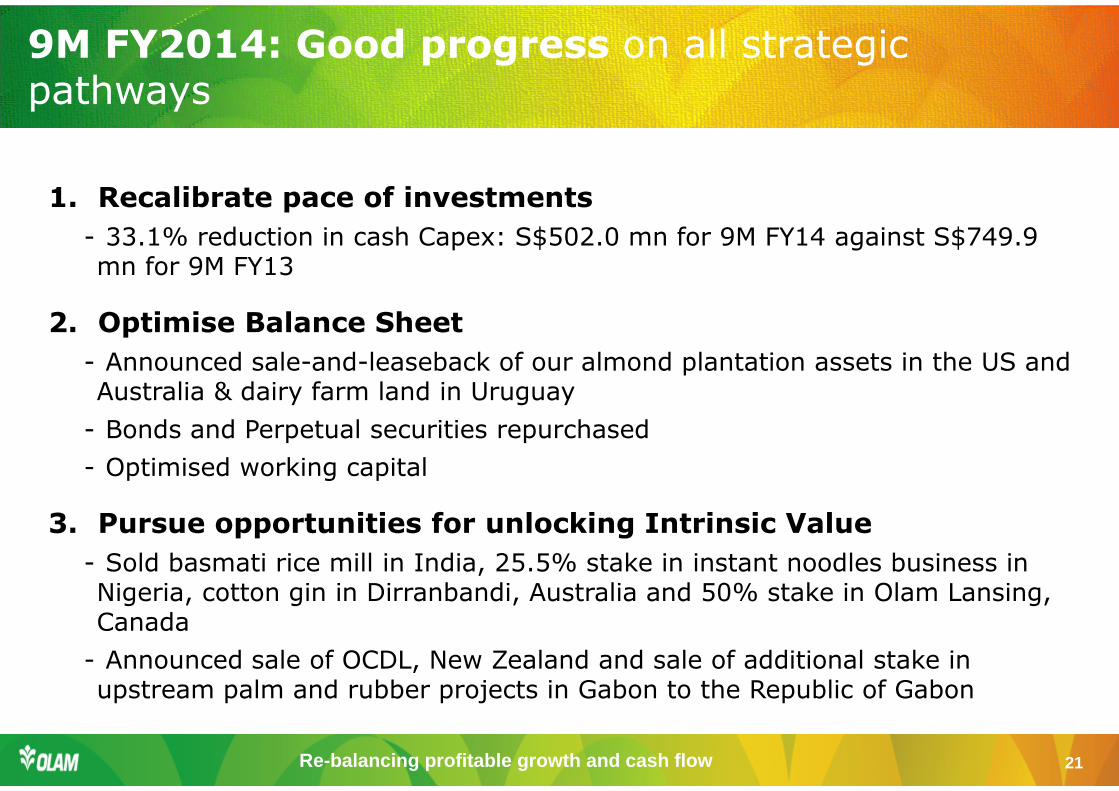
1. Recalibrate pace of investments
- 33.1% reduction in cash Capex: S$502.0 mn for 9M FY14 against S$749.9 mn for 9M FY13
2. Optimise Balance Sheet
- Announced sale-and-leaseback of our almond plantation assets in the US and Australia & dairy farm land in Uruguay
- Bonds and Perpetual securities repurchased
- Optimised working capital
3. Pursue opportunities for unlocking Intrinsic Value
- Sold basmati rice mill in India, 25.5% stake in instant noodles business in Nigeria, cotton gin in Dirranbandi, Australia and 50% stake in Olam Lansing, Canada
- Announced sale of OCDL, New Zealand and sale of additional stake in upstream palm and rubber projects in Gabon to the Republic of Gabon
9M FY2014: Good progress on all strategic pathways
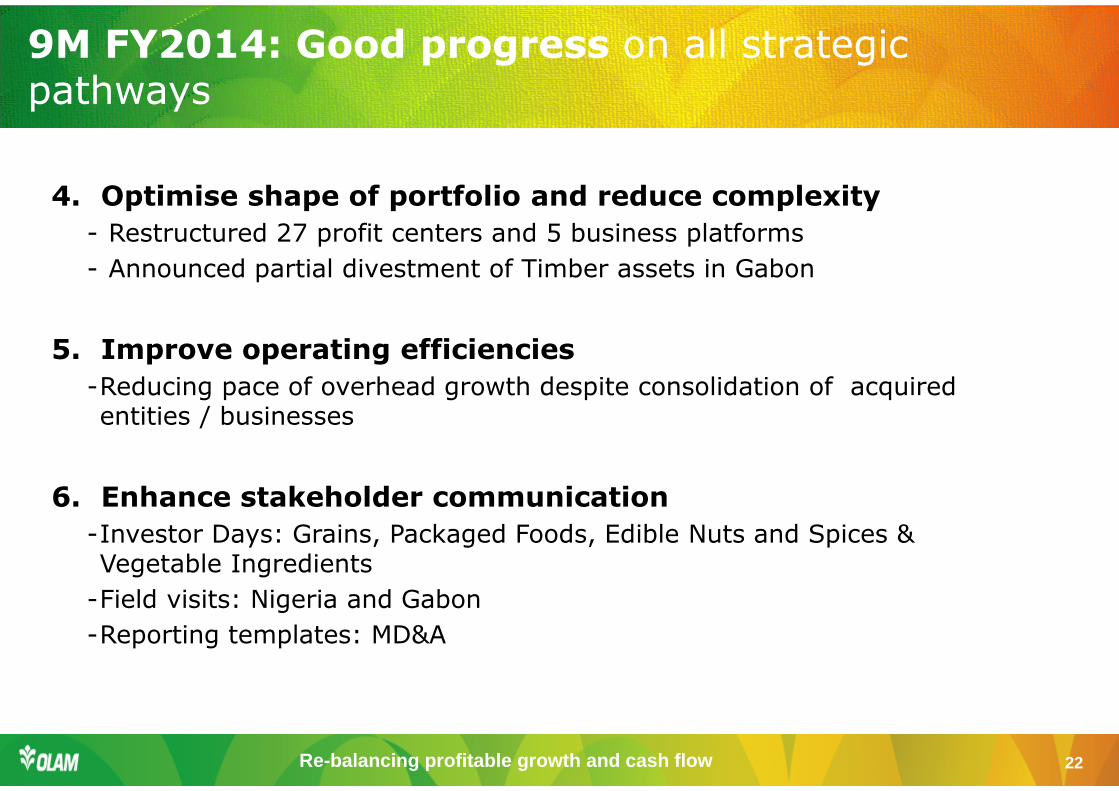
Re-balancing profitable growth and cash flow 22
4. Optimise shape of portfolio and reduce complexity
- Restructured 27 profit centers and 5 business platforms
- Announced partial divestment of Timber assets in Gabon
5. Improve operating efficiencies
-Reducing pace of overhead growth despite consolidation of acquired entities / businesses
6. Enhance stakeholder communication
-Investor Days: Grains, Packaged Foods, Edible Nuts and Spices & Vegetable Ingredients
-Field visits: Nigeria and Gabon
-Reporting templates: MD&A
9M FY2014: Good progress on all strategic pathways
Re-balancing profitable growth and cash flow 23
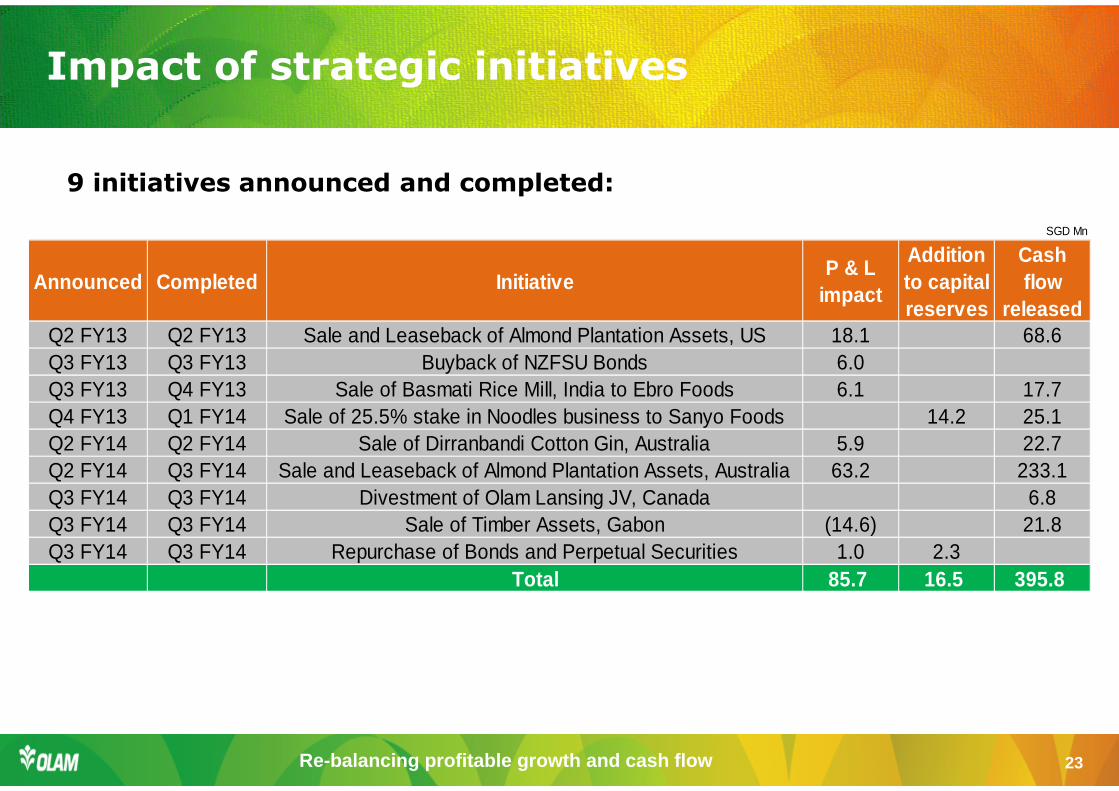
Impact of strategic initiatives
9 initiatives announced and completed:
SGD Mn
Announced Completed InitiativeP & L
impact
Addition to capital reserves
Cash flow
releasedQ2 FY13 Q2 FY13 Sale and Leaseback of Almond Plantation Assets, US 18.1 68.6 Q3 FY13 Q3 FY13 Buyback of NZFSU Bonds 6.0 Q3 FY13 Q4 FY13 Sale of Basmati Rice Mill, India to Ebro Foods 6.1 17.7 Q4 FY13 Q1 FY14 Sale of 25.5% stake in Noodles business to Sanyo Foods 14.2 25.1 Q2 FY14 Q2 FY14 Sale of Dirranbandi Cotton Gin, Australia 5.9 22.7 Q2 FY14 Q3 FY14 Sale and Leaseback of Almond Plantation Assets, Australia 63.2 233.1 Q3 FY14 Q3 FY14 Divestment of Olam Lansing JV, Canada 6.8 Q3 FY14 Q3 FY14 Sale of Timber Assets, Gabon (14.6) 21.8 Q3 FY14 Q3 FY14 Repurchase of Bonds and Perpetual Securities 1.0 2.3
Total 85.7 16.5 395.8
Re-balancing profitable growth and cash flow 24
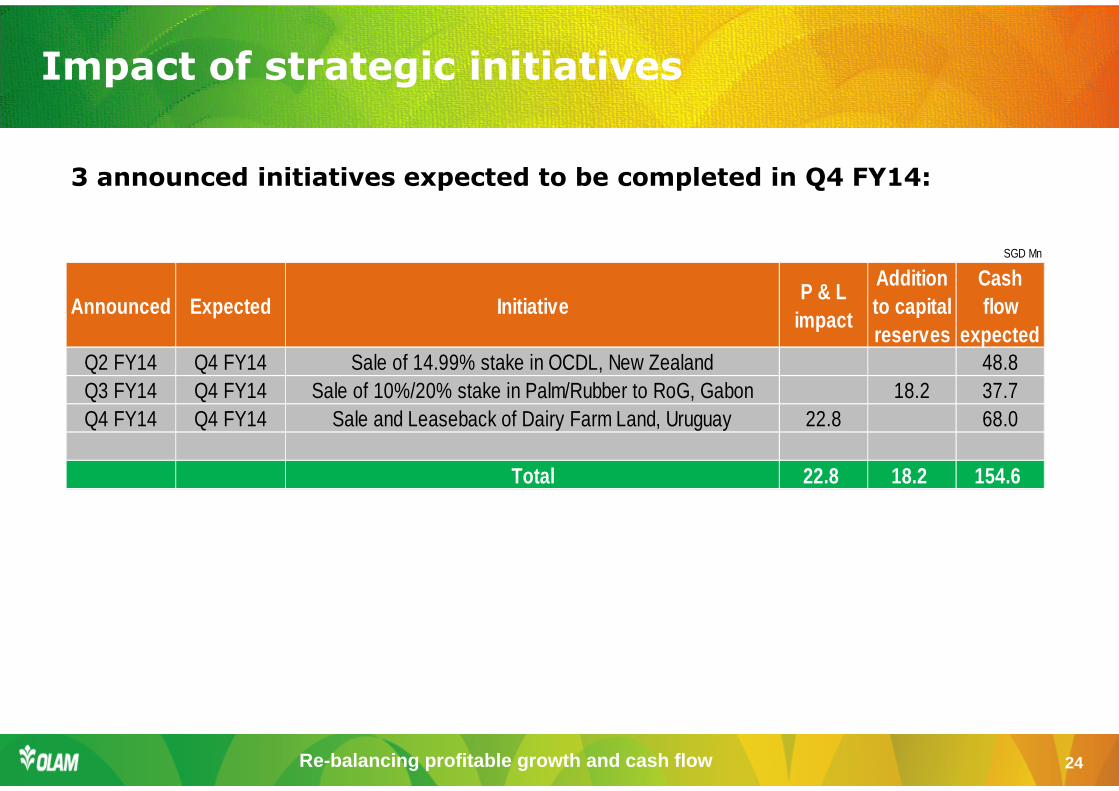
Impact of strategic initiatives
3 announced initiatives expected to be completed in Q4 FY14:
SGD Mn
Announced Expected InitiativeP & L
impact
Addition to capital reserves
Cash flow
expectedQ2 FY14 Q4 FY14 Sale of 14.99% stake in OCDL, New Zealand 48.8 Q3 FY14 Q4 FY14 Sale of 10%/20% stake in Palm/Rubber to RoG, Gabon 18.2 37.7 Q4 FY14 Q4 FY14 Sale and Leaseback of Dairy Farm Land, Uruguay 22.8 68.0
Total 22.8 18.2 154.6
Re-balancing profitable growth and cash flow 25
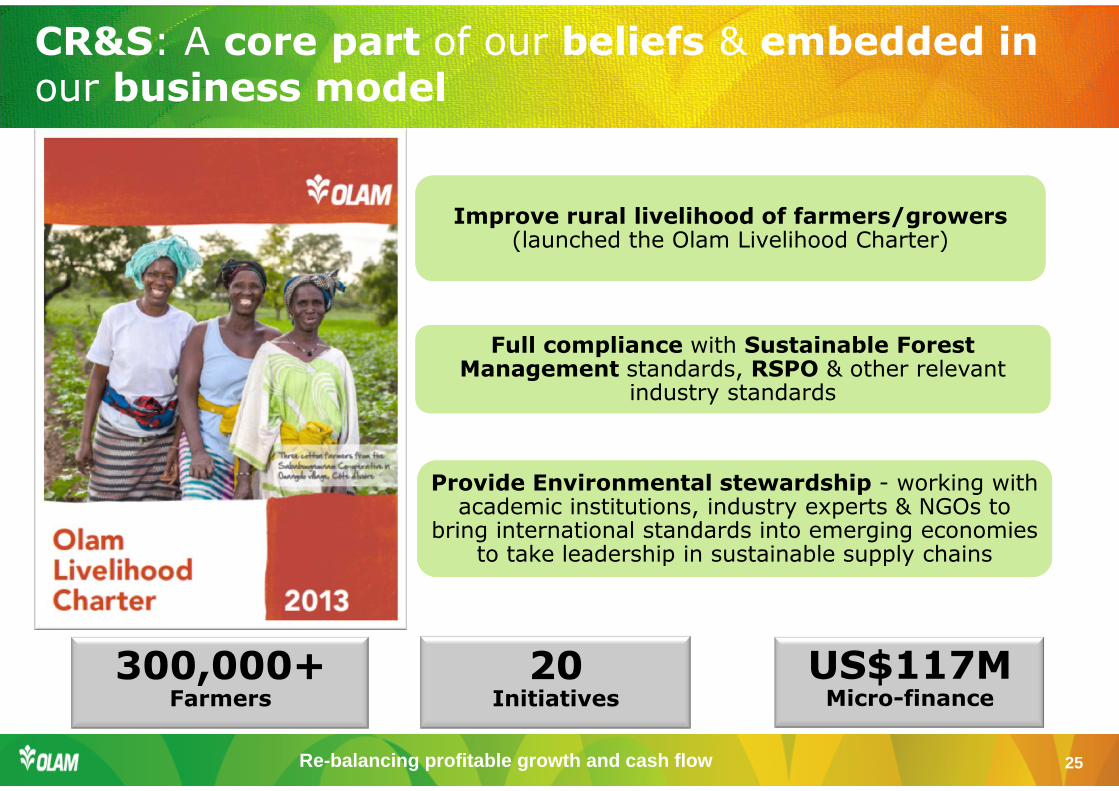
Improve rural livelihood of farmers/growers(launched the Olam Livelihood Charter)
Improve rural livelihood of farmers/growers(launched the Olam Livelihood Charter)
CR&S: A core part of our beliefs & embedded in our business model
20Initiatives
300,000+Farmers
US$117M Micro-finance
Full compliance with Sustainable Forest Management standards, RSPO & other relevant
industry standards
Full compliance with Sustainable Forest Management standards, RSPO & other relevant
industry standards
Provide Environmental stewardship - working with academic institutions, industry experts & NGOs to
bring international standards into emerging economies to take leadership in sustainable supply chains
Provide Environmental stewardship - working with academic institutions, industry experts & NGOs to
bring international standards into emerging economies to take leadership in sustainable supply chains
Re-balancing profitable growth and cash flow 26
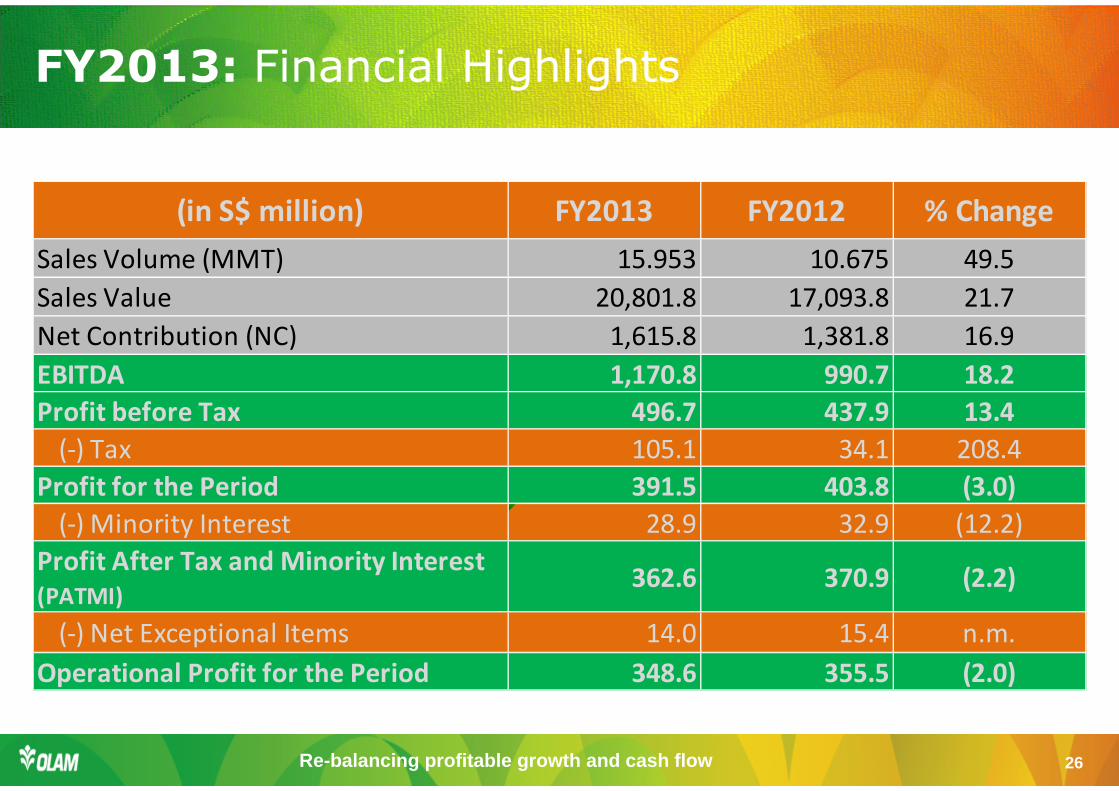
(in S$ million) FY2013 FY2012 % Change
Sales Volume (MMT) 15.953 10.675 49.5
Sales Value 20,801.8 17,093.8 21.7
Net Contribution (NC) 1,615.8 1,381.8 16.9
EBITDA 1,170.8 990.7 18.2
Profit before Tax 496.7 437.9 13.4
(-) Tax 105.1 34.1 208.4
Profit for the Period 391.5 403.8 (3.0)
(-) Minority Interest 28.9 32.9 (12.2)
Profit After Tax and Minority Interest
(PATMI) 362.6 370.9 (2.2)
(-) Net Exceptional Items 14.0 15.4 n.m.
Operational Profit for the Period 348.6 355.5 (2.0)
FY2013: Financial Highlights
Re-balancing profitable growth and cash flow 27
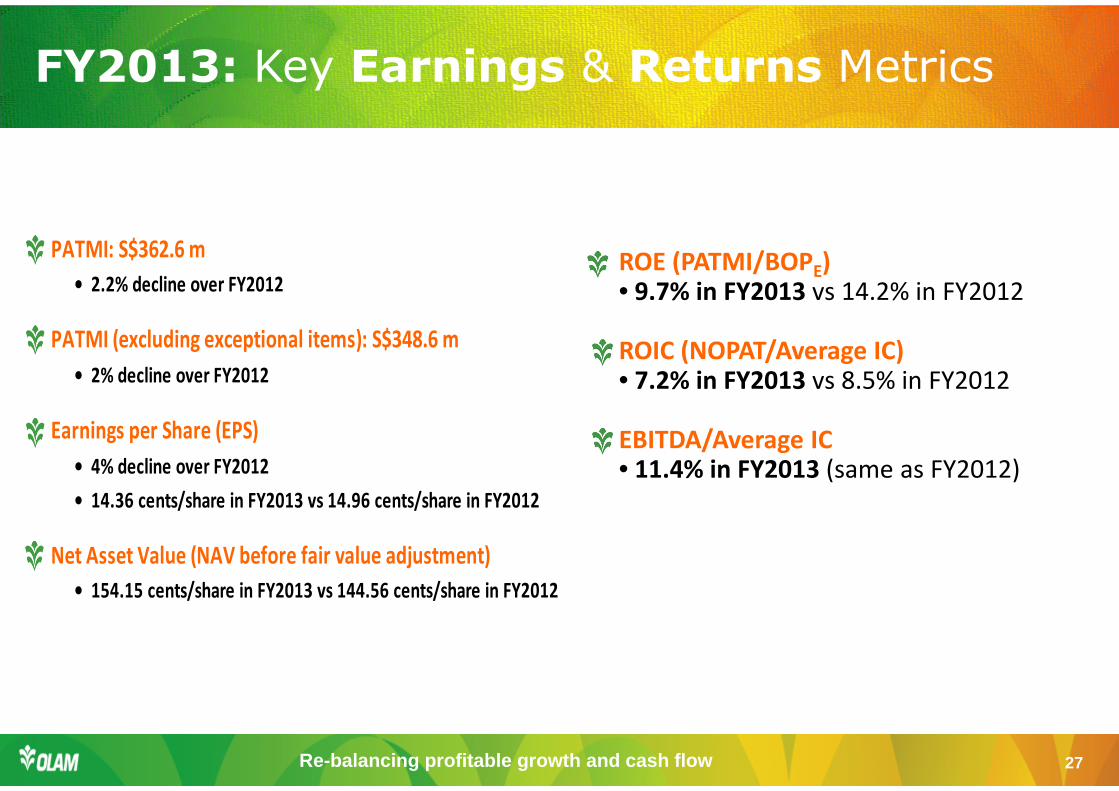
FY2013: Key Earnings & Returns Metrics
PATMI: S$362.6 m
• 2.2% decline over FY2012
PATMI (excluding exceptional items): S$348.6 m
• 2% decline over FY2012
Earnings per Share (EPS)
• 4% decline over FY2012
• 14.36 cents/share in FY2013 vs 14.96 cents/share in FY2012
Net Asset Value (NAV before fair value adjustment)
• 154.15 cents/share in FY2013 vs 144.56 cents/share in FY2012
ROE (PATMI/BOPE)• 9.7% in FY2013 vs 14.2% in FY2012
ROIC (NOPAT/Average IC)• 7.2% in FY2013 vs 8.5% in FY2012
EBITDA/Average IC• 11.4% in FY2013 (same as FY2012)
Re-balancing profitable growth and cash flow 28
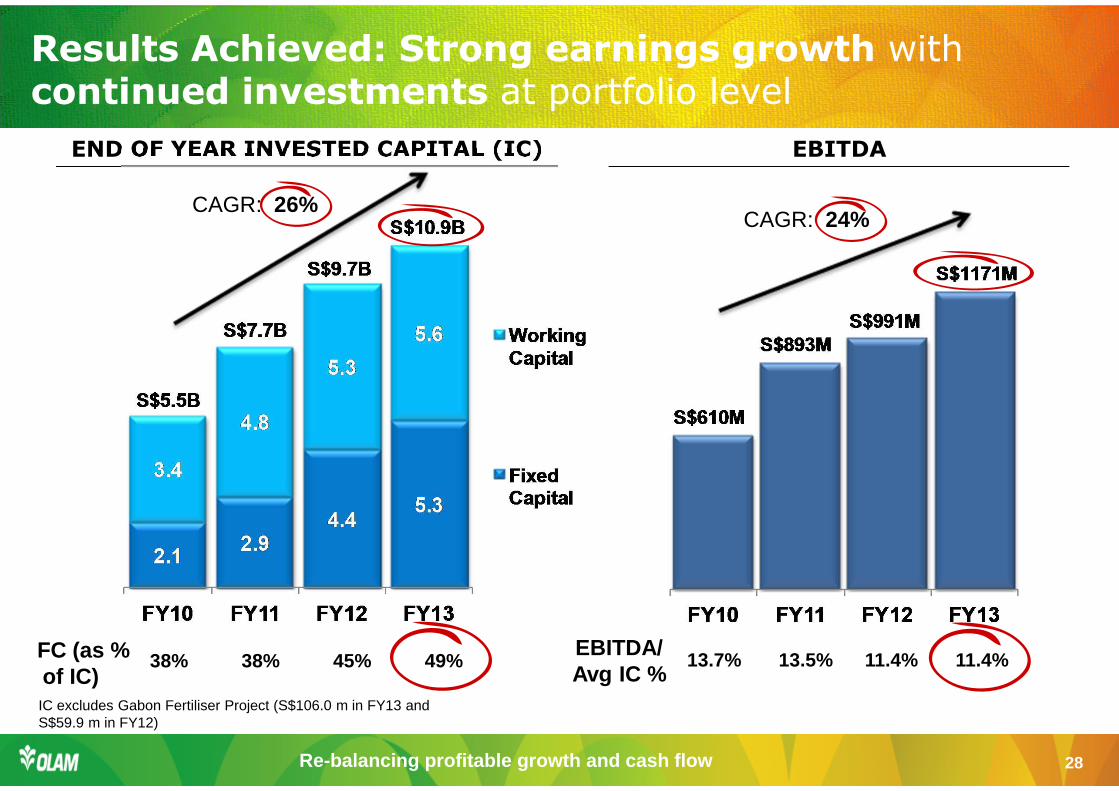
END OF YEAR INVESTED CAPITAL (IC) EBITDA
CAGR: 26%
FC (as % of IC)
38% 38% 45% 49% EBITDA/ Avg IC %
13.7% 13.5% 11.4% 11.4%
CAGR: 24%
IC excludes Gabon Fertiliser Project (S$106.0 m in FY13 and S$59.9 m in FY12)
Results Achieved: Strong earnings growth with continued investments at portfolio level
Re-balancing profitable growth and cash flow 29
Edible Nuts, Spices &
Vegetable Ingredients
Edible Nuts, Spices &
Vegetable Ingredients
Confectionery& Beverage Ingredients
Confectionery& Beverage Ingredients
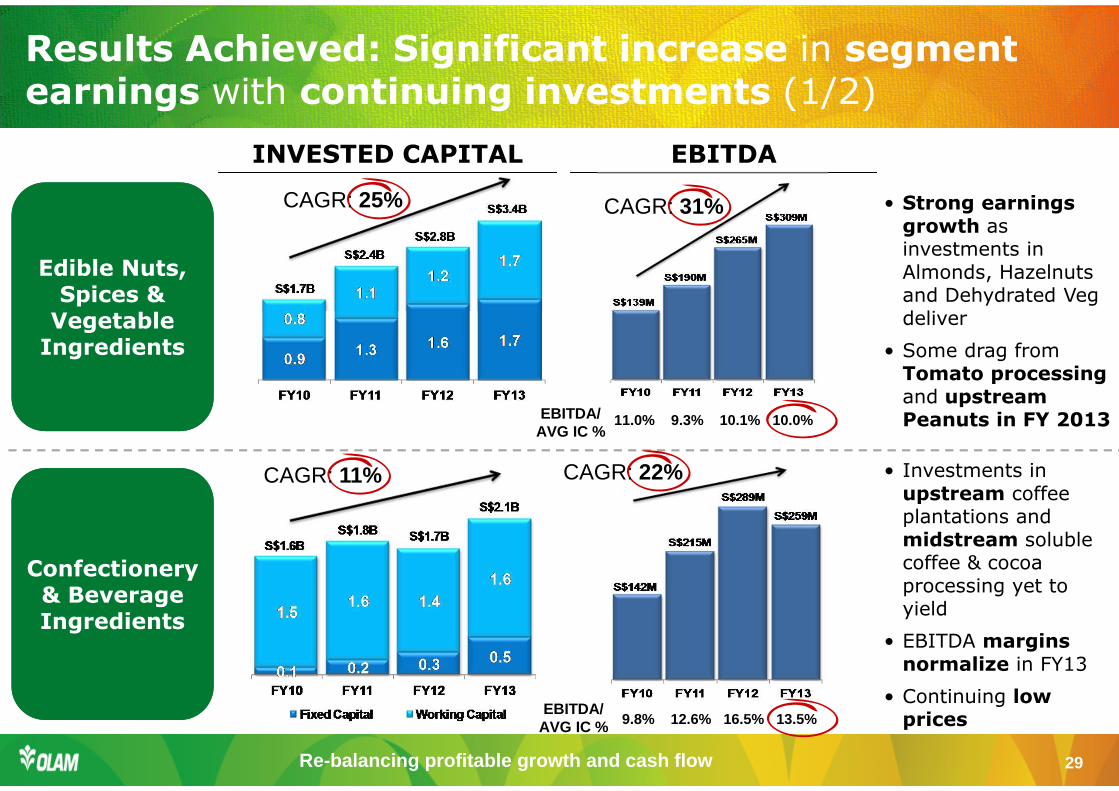
INVESTED CAPITAL EBITDA
CAGR: 25%
CAGR: 11%
CAGR: 31%
EBITDA/ AVG IC %
11.0% 9.3% 10.1% 10.0%
EBITDA/ AVG IC % 9.8% 12.6% 16.5% 13.5%
CAGR: 22%
• Strong earnings growth as investments in Almonds, Hazelnuts and Dehydrated Veg deliver
• Some drag from Tomato processing and upstream Peanuts in FY 2013
• Investments in upstream coffee plantations and midstream soluble coffee & cocoa processing yet to yield
• EBITDA margins normalize in FY13
• Continuing low prices
Results Achieved: Significant increase in segment earnings with continuing investments (1/2)
Re-balancing profitable growth and cash flow 30
Food Staples & Packaged
Foods
Food Staples & Packaged
Foods
IndustrialRaw Materials
IndustrialRaw Materials
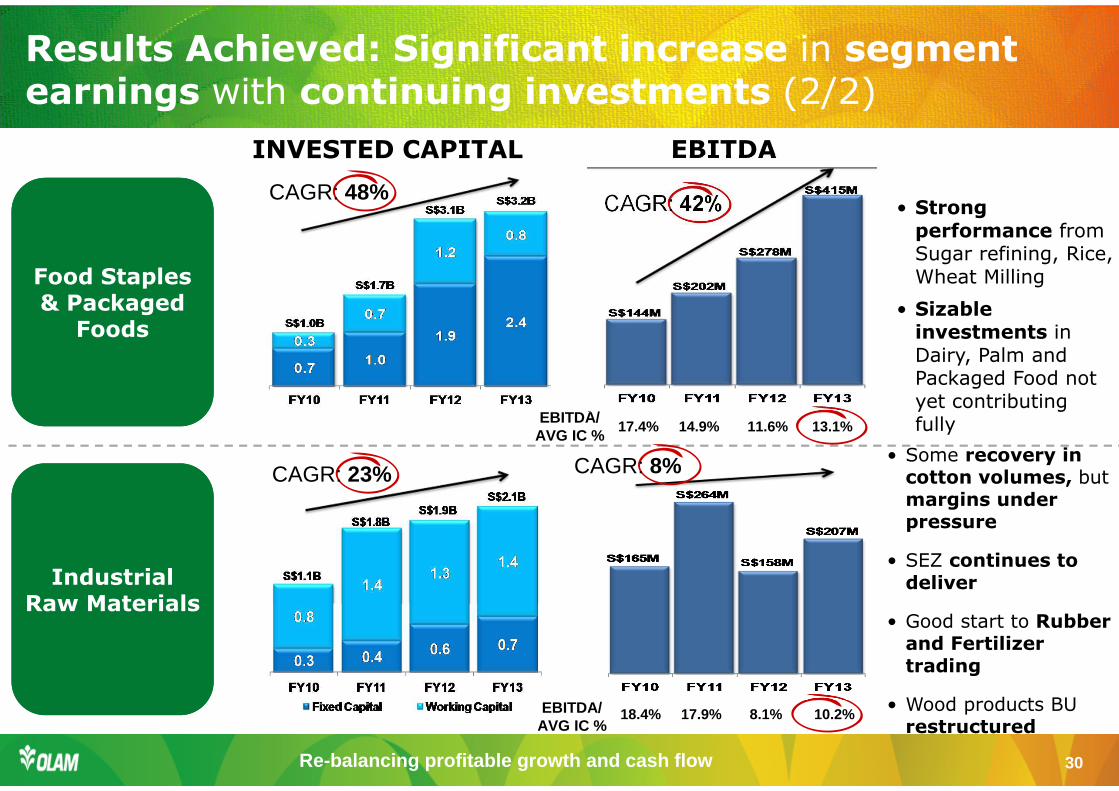
INVESTED CAPITAL EBITDA
CAGR: 48%
CAGR: 23%
CAGR: 42%
EBITDA/ AVG IC %
17.4% 14.9% 11.6% 13.1%
EBITDA/ AVG IC %
18.4% 17.9% 8.1% 10.2%
CAGR: 8%
• Strong performance from Sugar refining, Rice, Wheat Milling
• Sizable investments in Dairy, Palm and Packaged Food not yet contributing fully
• Some recovery in cotton volumes, butmargins under pressure
• SEZ continues to deliver
• Good start to Rubber and Fertilizer trading
• Wood products BU restructured
Results Achieved: Significant increase in segment earnings with continuing investments (2/2)
Re-balancing profitable growth and cash flow 31
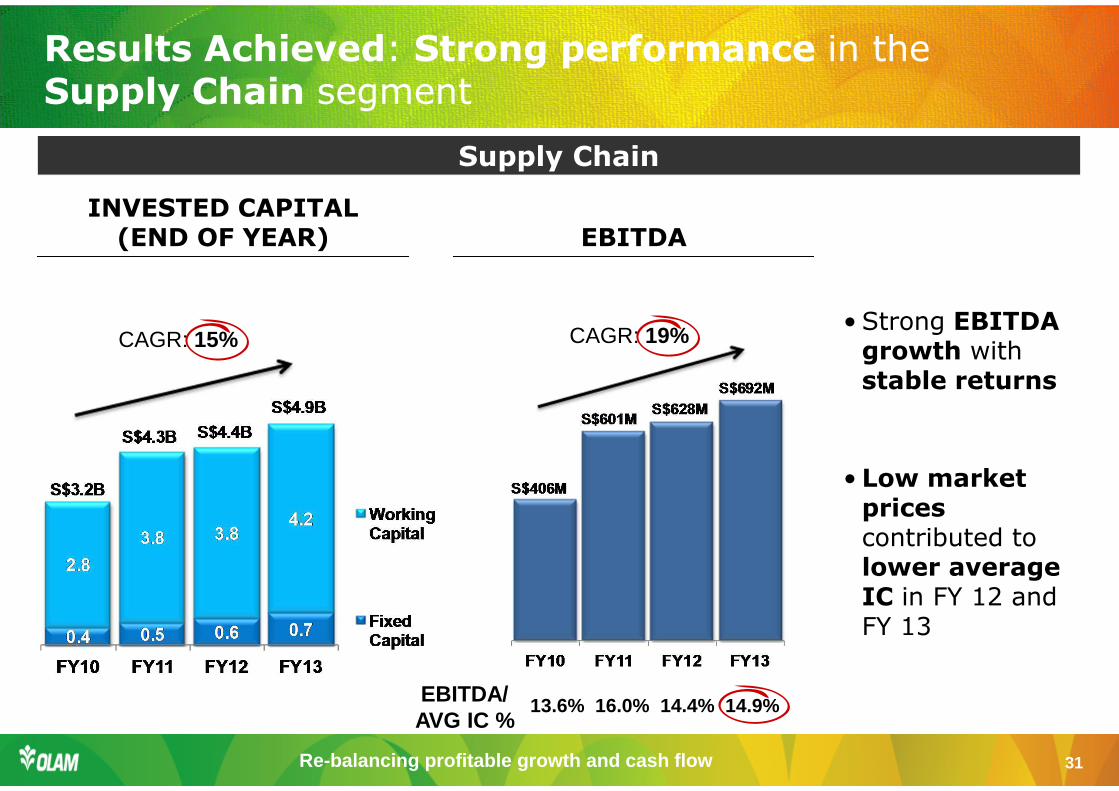
INVESTED CAPITAL(END OF YEAR) EBITDA
Supply Chain
CAGR: 15% CAGR: 19%
EBITDA/ AVG IC %
13.6% 16.0% 14.4% 14.9%
• Strong EBITDA growth withstable returns
• Low market prices contributed to lower average IC in FY 12 and FY 13
Results Achieved: Strong performance in the Supply Chain segment
Re-balancing profitable growth and cash flow 32
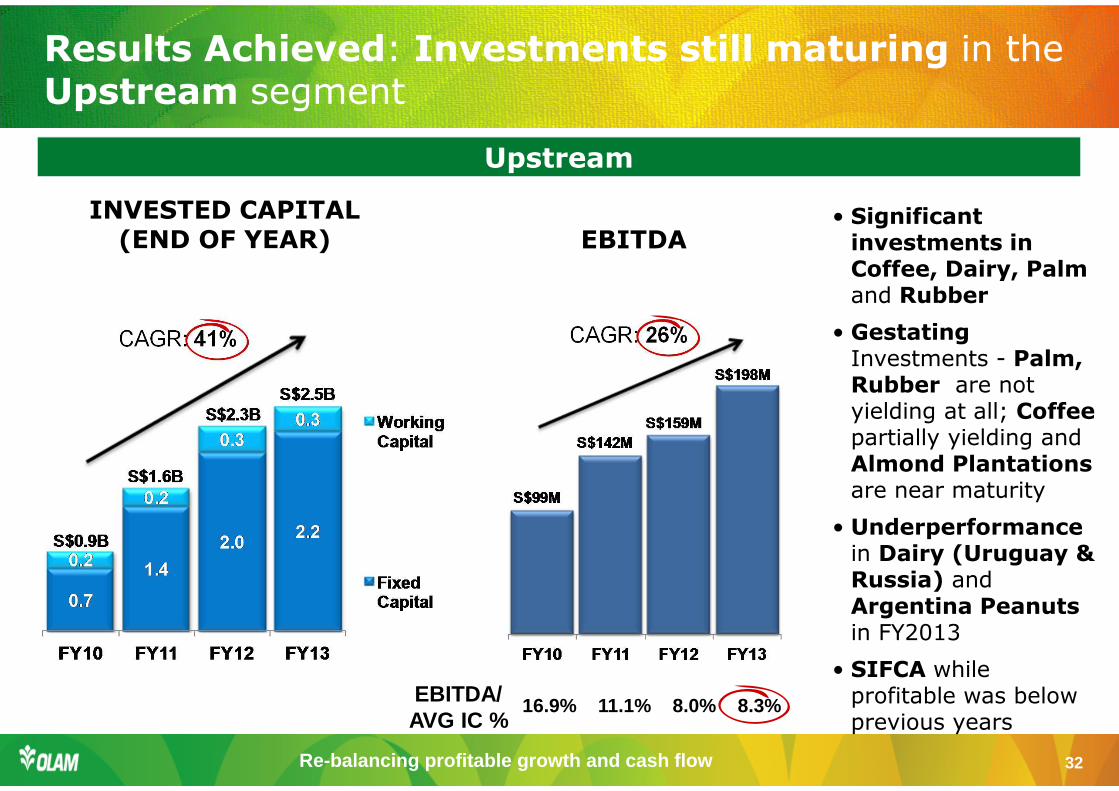
INVESTED CAPITAL (END OF YEAR) EBITDA
Upstream
CAGR: 41% CAGR: 26%
EBITDA/ AVG IC %
16.9% 11.1% 8.0% 8.3%
• Significant investments in Coffee, Dairy, Palm and Rubber
• Gestating Investments - Palm, Rubber are not yielding at all; Coffee partially yielding andAlmond Plantations are near maturity
• Underperformancein Dairy (Uruguay & Russia) and Argentina Peanuts in FY2013
• SIFCA while profitable was below previous years
Results Achieved: Investments still maturing in the Upstream segment
Re-balancing profitable growth and cash flow 33
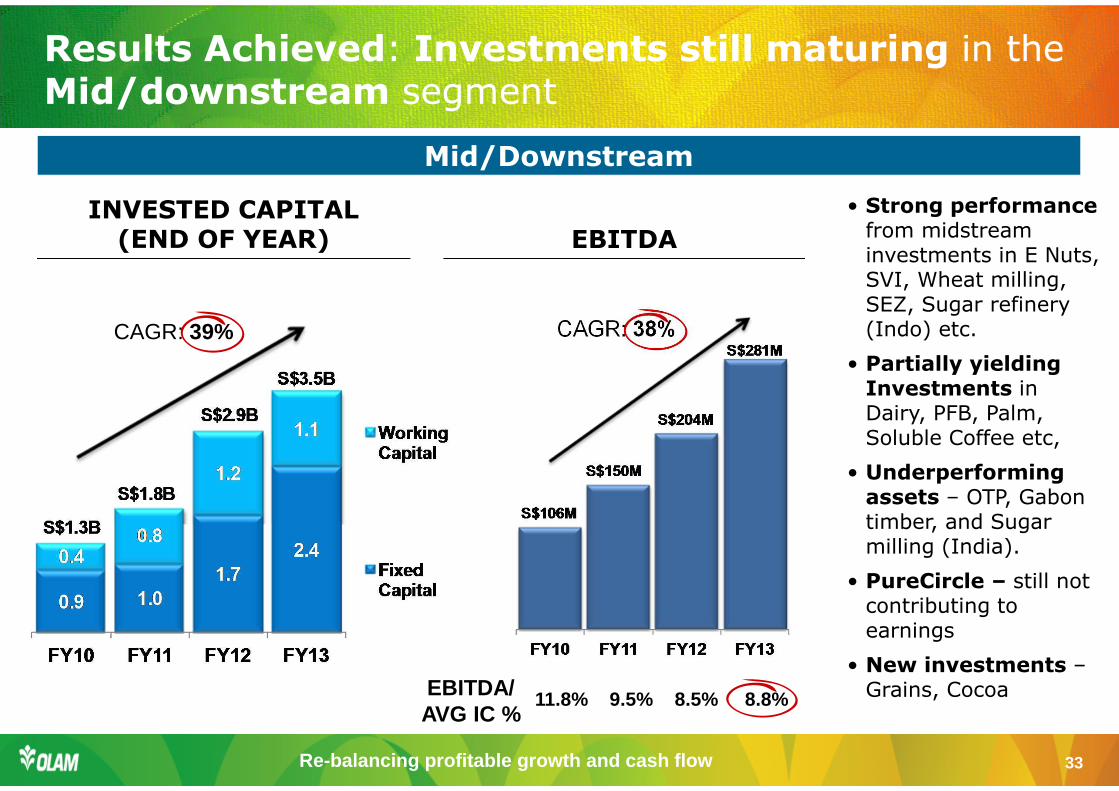
INVESTED CAPITAL (END OF YEAR) EBITDA
Mid/Downstream
CAGR: 39% CAGR: 38%
EBITDA/ AVG IC %
11.8% 9.5% 8.5% 8.8%
• Strong performance from midstream investments in E Nuts, SVI, Wheat milling, SEZ, Sugar refinery (Indo) etc.
• Partially yielding Investments in Dairy, PFB, Palm, Soluble Coffee etc,
• Underperforming assets – OTP, Gabon timber, and Sugar milling (India).
• PureCircle – still not contributing to earnings
• New investments –Grains, Cocoa
Results Achieved: Investments still maturing in the Mid/downstream segment
Re-balancing profitable growth and cash flow 34
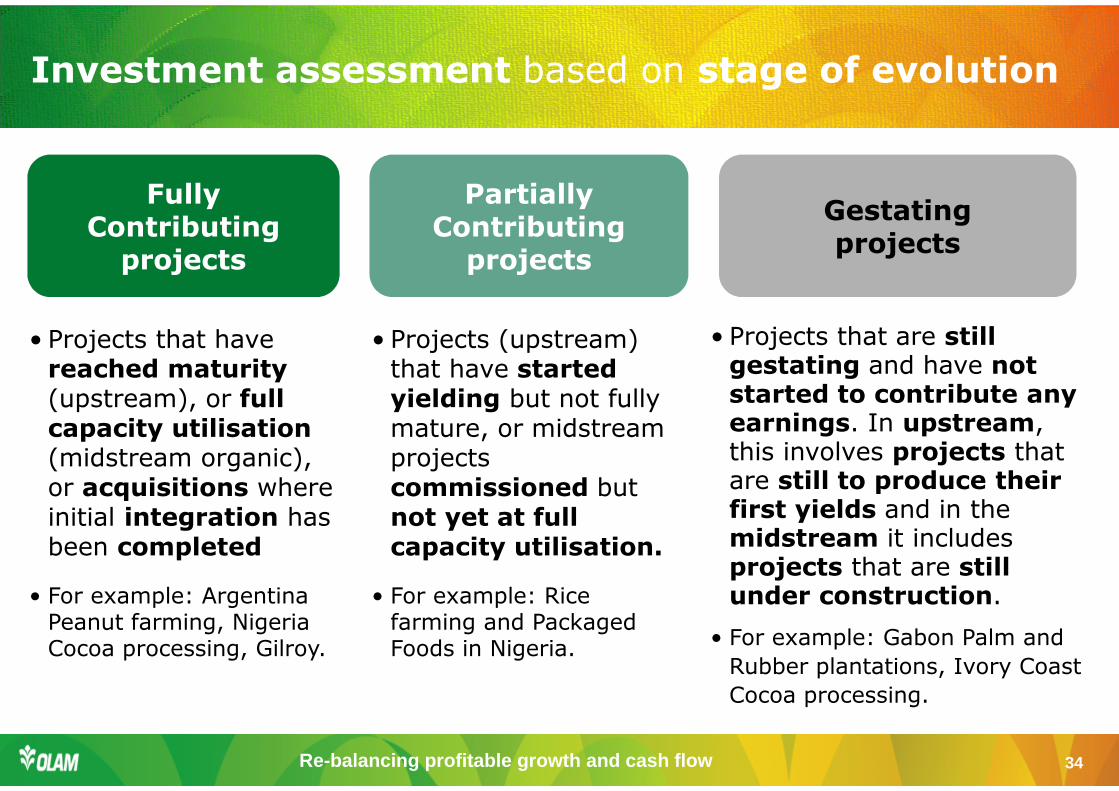
• Projects that are still gestating and have not started to contribute any earnings. In upstream, this involves projects that are still to produce their first yields and in the midstream it includes projects that are still under construction.
• Projects that have reached maturity (upstream), or full capacity utilisation (midstream organic), or acquisitions where initial integration has been completed
• Projects (upstream) that have started yielding but not fully mature, or midstream projects commissioned but not yet at full capacity utilisation.
• For example: Gabon Palm and
Rubber plantations, Ivory Coast
Cocoa processing.
• For example: Argentina Peanut farming, Nigeria Cocoa processing, Gilroy.
• For example: Rice farming and Packaged Foods in Nigeria.
Fully Contributing
projects
Partially Contributing
projects
Gestating projects
Investment assessment based on stage of evolution
Re-balancing profitable growth and cash flow 35
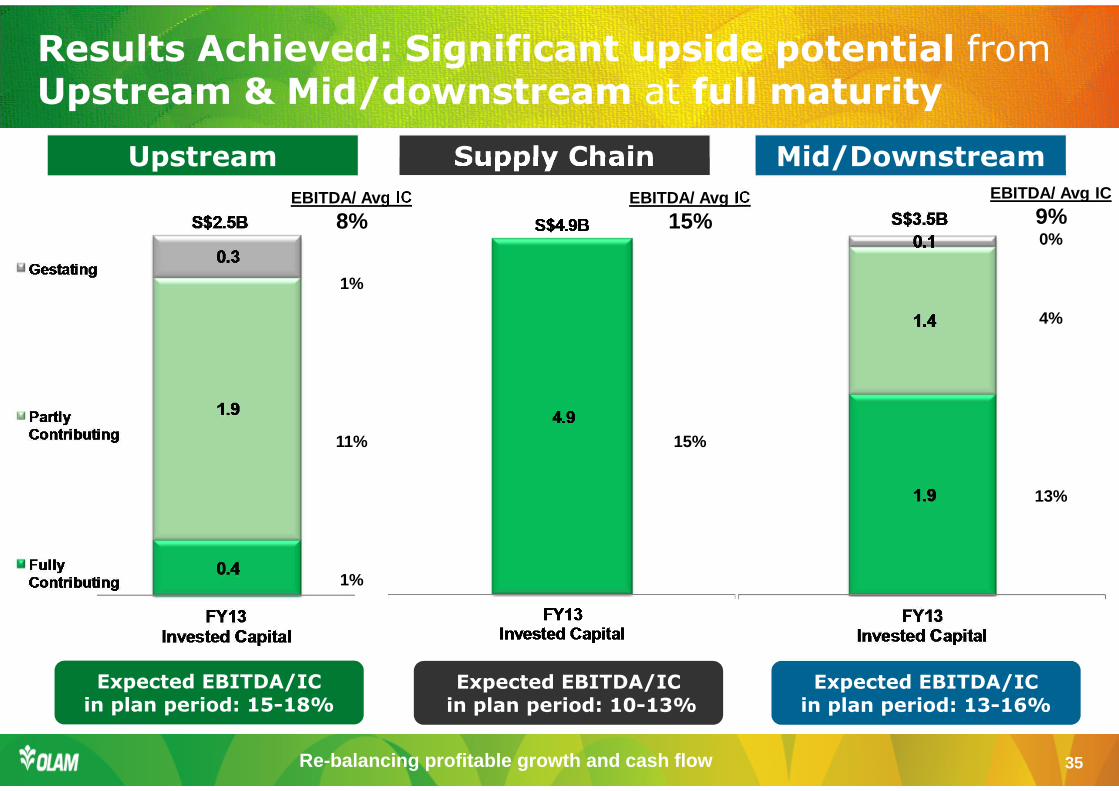
Upstream Mid/DownstreamSupply Chain
Expected EBITDA/IC in plan period: 15-18%
Expected EBITDA/IC in plan period: 13-16%
Expected EBITDA/ICin plan period: 10-13%
EBITDA/ Avg IC
8%
1%
11%
1%
EBITDA/ Avg IC
15%
15%
EBITDA/ Avg IC
9%0%
4%
13%
Results Achieved: Significant upside potential from Upstream & Mid/downstream at full maturity
Re-balancing profitable growth and cash flow 36
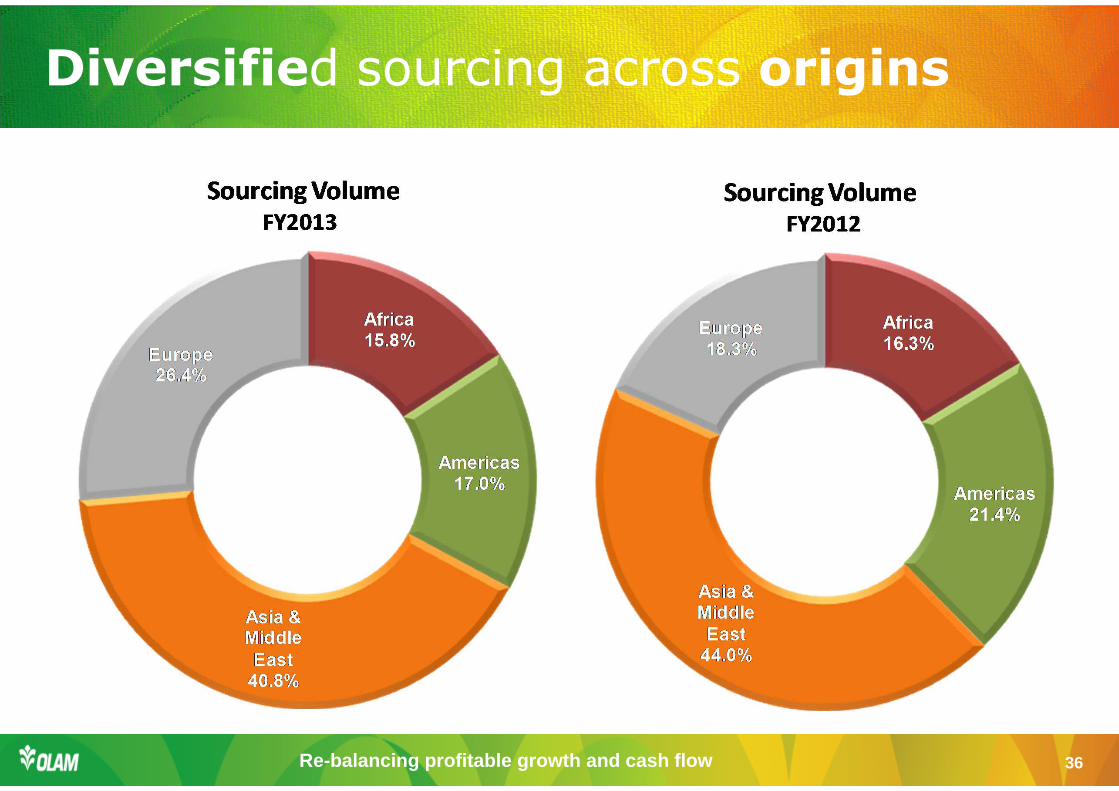
Diversified sourcing across origins
Re-balancing profitable growth and cash flow 37
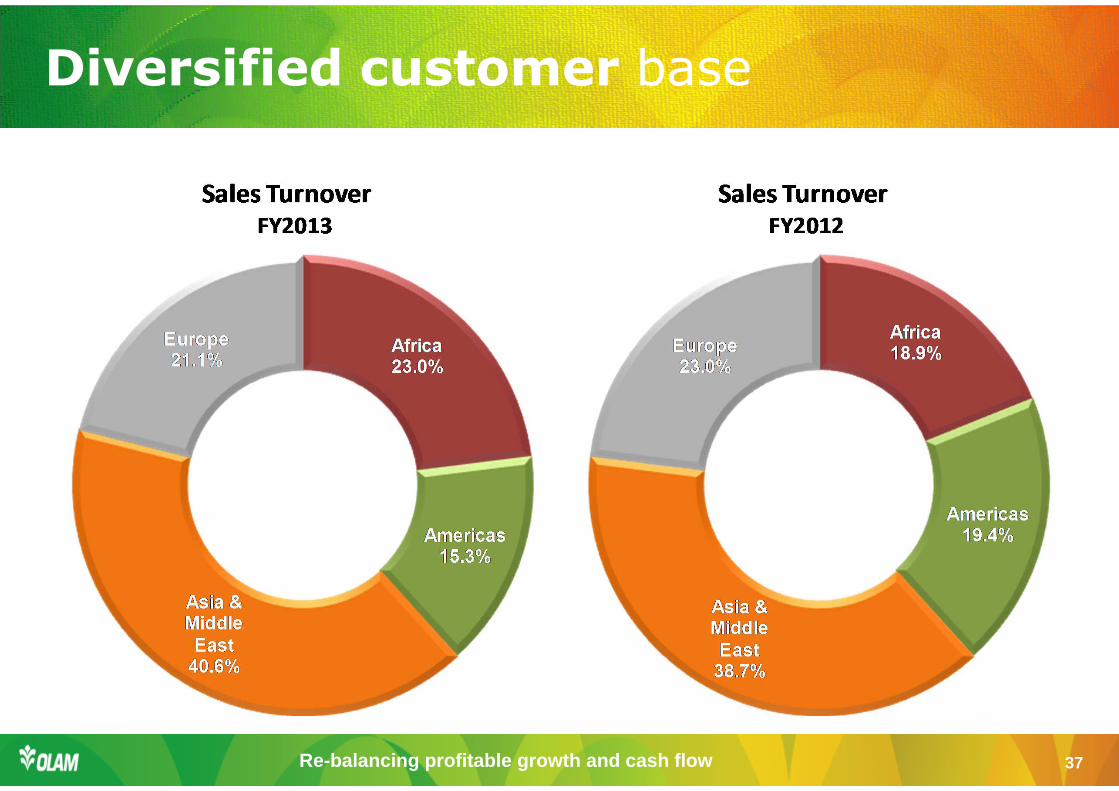
Diversified customer base
Re-balancing profitable growth and cash flow 38
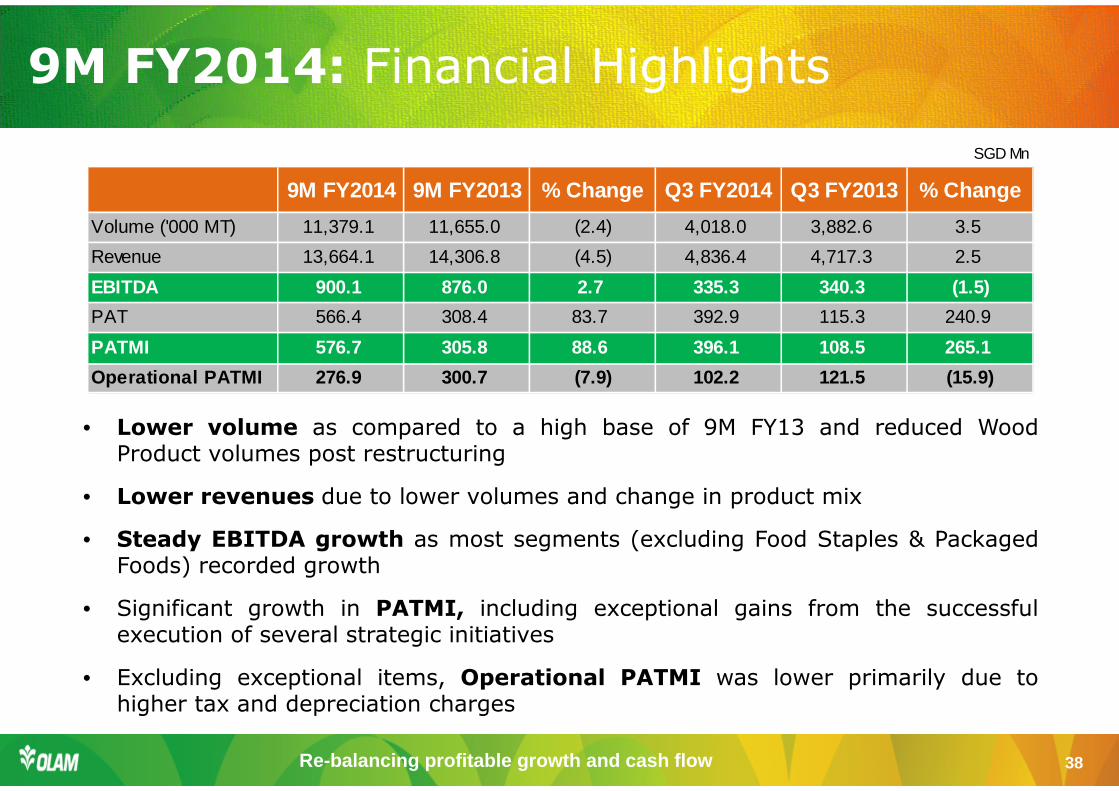
9M FY2014: Financial Highlights
• Lower volume as compared to a high base of 9M FY13 and reduced WoodProduct volumes post restructuring
• Lower revenues due to lower volumes and change in product mix
• Steady EBITDA growth as most segments (excluding Food Staples & PackagedFoods) recorded growth
• Significant growth in PATMI, including exceptional gains from the successfulexecution of several strategic initiatives
• Excluding exceptional items, Operational PATMI was lower primarily due tohigher tax and depreciation charges
SGD Mn
9M FY2014 9M FY2013 % Change Q3 FY2014 Q3 FY2013 % Chang e
Volume ('000 MT) 11,379.1 11,655.0 (2.4) 4,018.0 3,882.6 3.5
Revenue 13,664.1 14,306.8 (4.5) 4,836.4 4,717.3 2.5
EBITDA 900.1 876.0 2.7 335.3 340.3 (1.5)
PAT 566.4 308.4 83.7 392.9 115.3 240.9
PATMI 576.7 305.8 88.6 396.1 108.5 265.1
Operational PATMI 276.9 300.7 (7.9) 102.2 121.5 (15.9)
Re-balancing profitable growth and cash flow 39
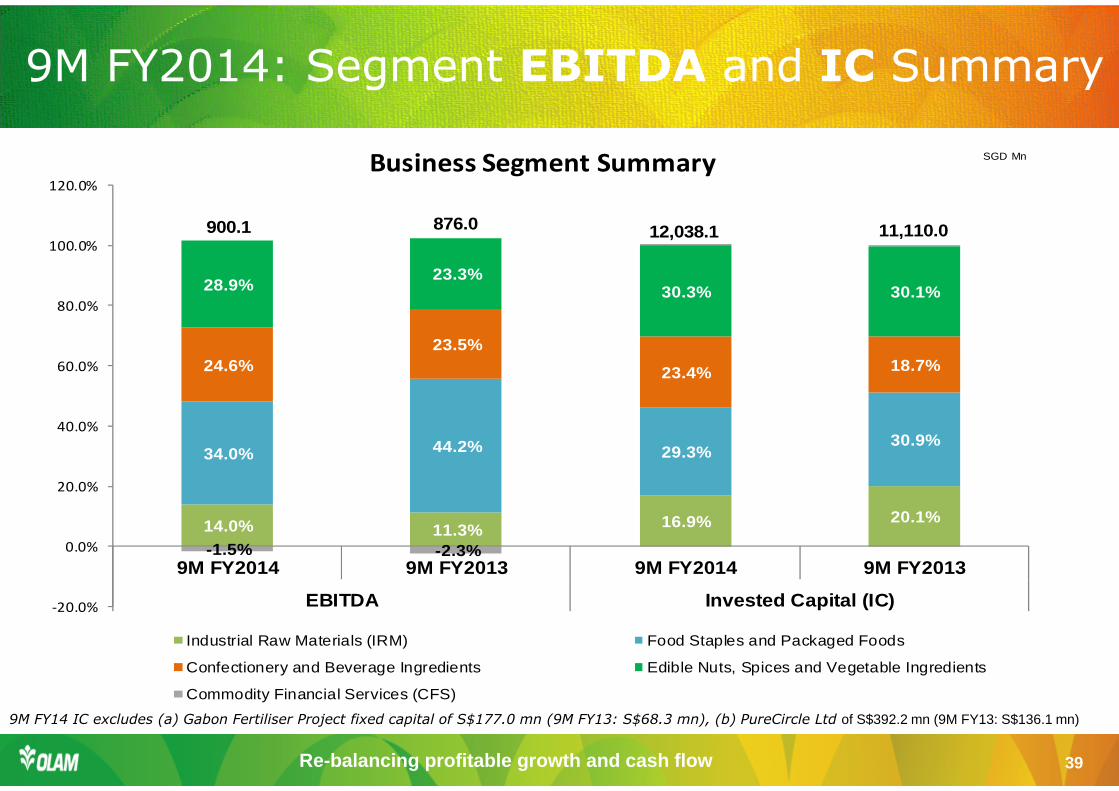
14.0% 11.3% 16.9% 20.1%
34.0% 44.2% 29.3%30.9%
24.6%23.5%
23.4% 18.7%
28.9%23.3%
30.3% 30.1%
-1.5% -2.3%
-20.0%
0.0%
20.0%
40.0%
60.0%
80.0%
100.0%
120.0%
9M FY2014 9M FY2013 9M FY2014 9M FY2013
EBITDA Invested Capital (IC)
Business Segment Summary
Industrial Raw Materials (IRM) Food Staples and Packaged Foods
Confectionery and Beverage Ingredients Edible Nuts, Spices and Vegetable Ingredients
Commodity Financial Services (CFS)
900.1 876.0 12,038.1 11,110.0
SGD Mn
9M FY2014: Segment EBITDA and IC Summary
9M FY14 IC excludes (a) Gabon Fertiliser Project fixed capital of S$177.0 mn (9M FY13: S$68.3 mn), (b) PureCircle Ltd of S$392.2 mn (9M FY13: S$136.1 mn)
Re-balancing profitable growth and cash flow 40
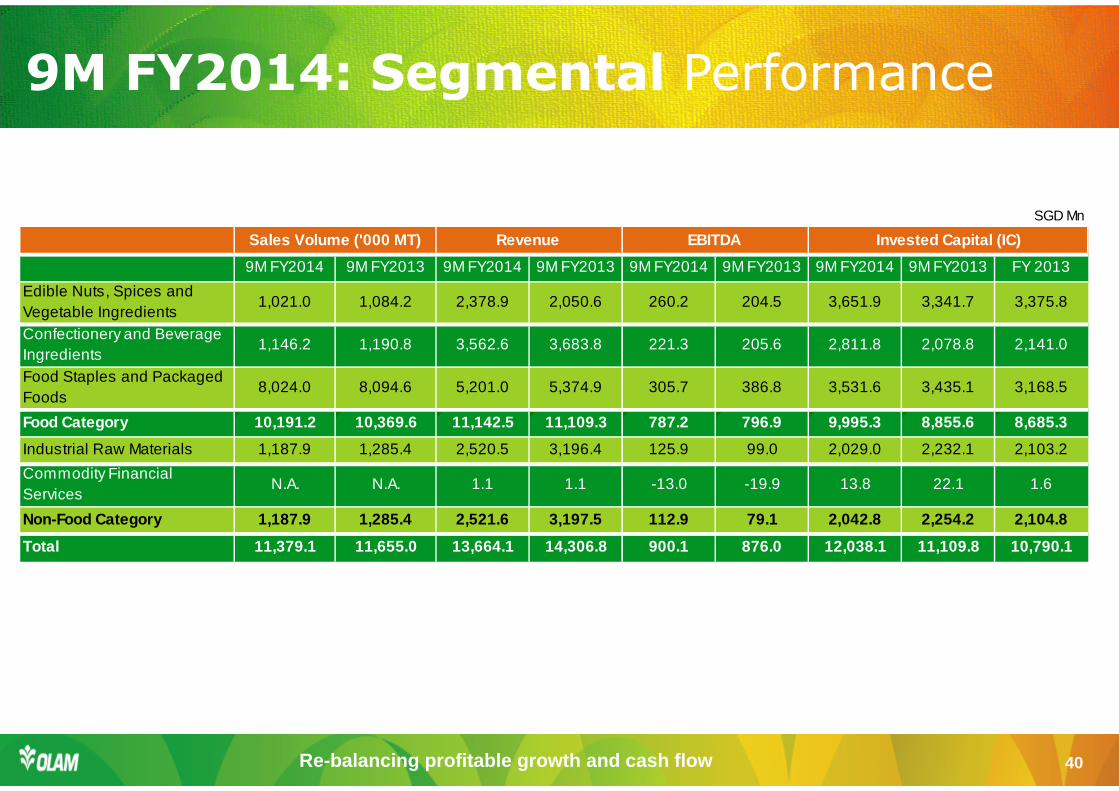
9M FY2014: Segmental Performance
SGD Mn
9M FY2014 9M FY2013 9M FY2014 9M FY2013 9M FY2014 9M FY2013 9M FY2014 9M FY2013 FY 2013
Edible Nuts, Spices and Vegetable Ingredients
1,021.0 1,084.2 2,378.9 2,050.6 260.2 204.5 3,651.9 3,341.7 3,375.8
Confectionery and Beverage Ingredients
1,146.2 1,190.8 3,562.6 3,683.8 221.3 205.6 2,811.8 2,078.8 2,141.0
Food Staples and Packaged Foods
8,024.0 8,094.6 5,201.0 5,374.9 305.7 386.8 3,531.6 3,435.1 3,168.5
Food Category 10,191.2 10,369.6 11,142.5 11,109.3 787.2 7 96.9 9,995.3 8,855.6 8,685.3
Industrial Raw Materials 1,187.9 1,285.4 2,520.5 3,196.4 125.9 99.0 2,029.0 2,232.1 2,103.2
Commodity Financial Services
N.A. N.A. 1.1 1.1 -13.0 -19.9 13.8 22.1 1.6
Non-Food Category 1,187.9 1,285.4 2,521.6 3,197.5 112.9 7 9.1 2,042.8 2,254.2 2,104.8
Total 11,379.1 11,655.0 13,664.1 14,306.8 900.1 876.0 12,0 38.1 11,109.8 10,790.1
Sales Volume ('000 MT) Revenue EBITDA Invested Capit al (IC)
Re-balancing profitable growth and cash flow 41
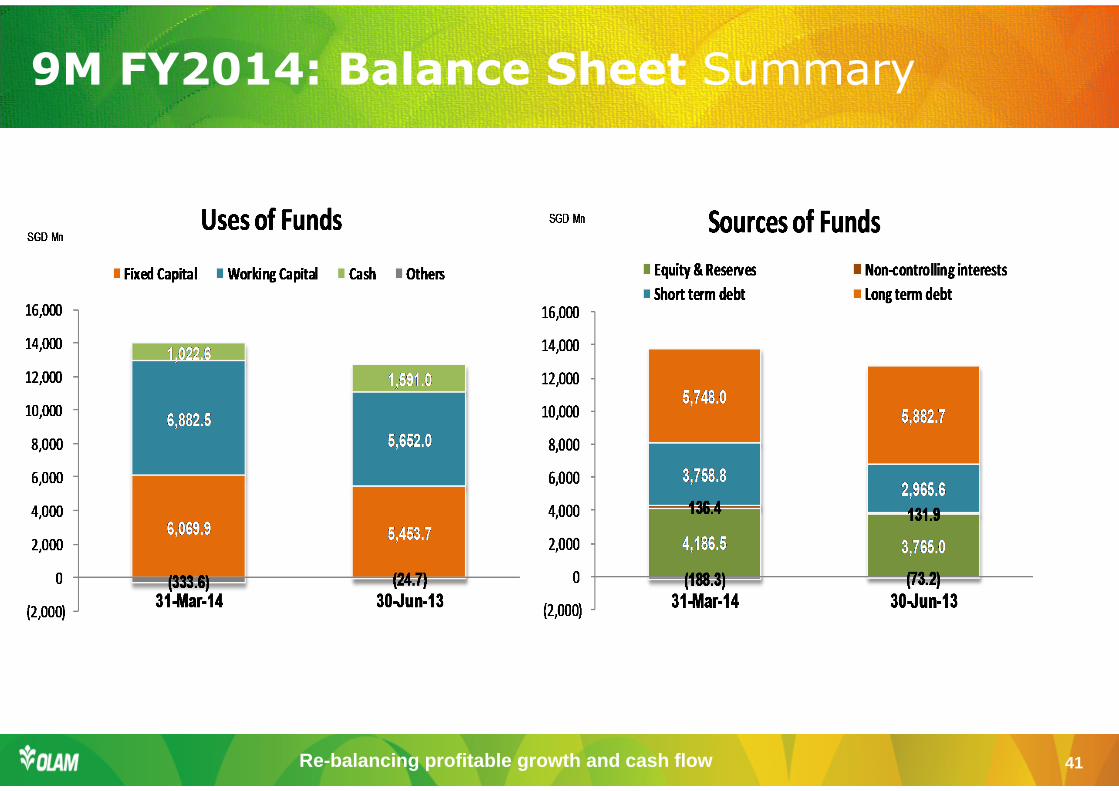
9M FY2014: Balance Sheet Summary
Re-balancing profitable growth and cash flow 42
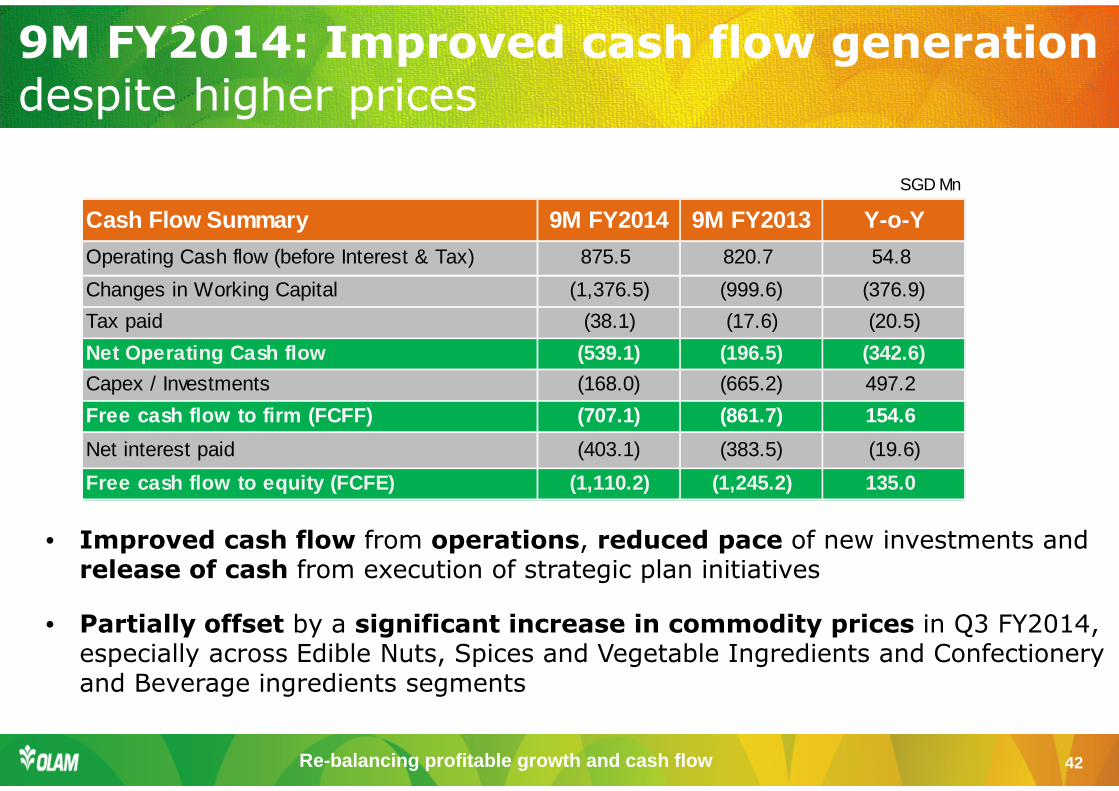
9M FY2014: Improved cash flow generation despite higher prices
• Improved cash flow from operations, reduced pace of new investments and release of cash from execution of strategic plan initiatives
• Partially offset by a significant increase in commodity prices in Q3 FY2014, especially across Edible Nuts, Spices and Vegetable Ingredients and Confectionery and Beverage ingredients segments
SGD Mn
Cash Flow Summary 9M FY2014 9M FY2013 Y-o-Y
Operating Cash flow (before Interest & Tax) 875.5 820.7 54.8
Changes in Working Capital (1,376.5) (999.6) (376.9)
Tax paid (38.1) (17.6) (20.5)
Net Operating Cash flow (539.1) (196.5) (342.6)
Capex / Investments (168.0) (665.2) 497.2
Free cash flow to firm (FCFF) (707.1) (861.7) 154.6
Net interest paid (403.1) (383.5) (19.6)
Free cash flow to equity (FCFE) (1,110.2) (1,245.2) 13 5.0
Re-balancing profitable growth and cash flow 43
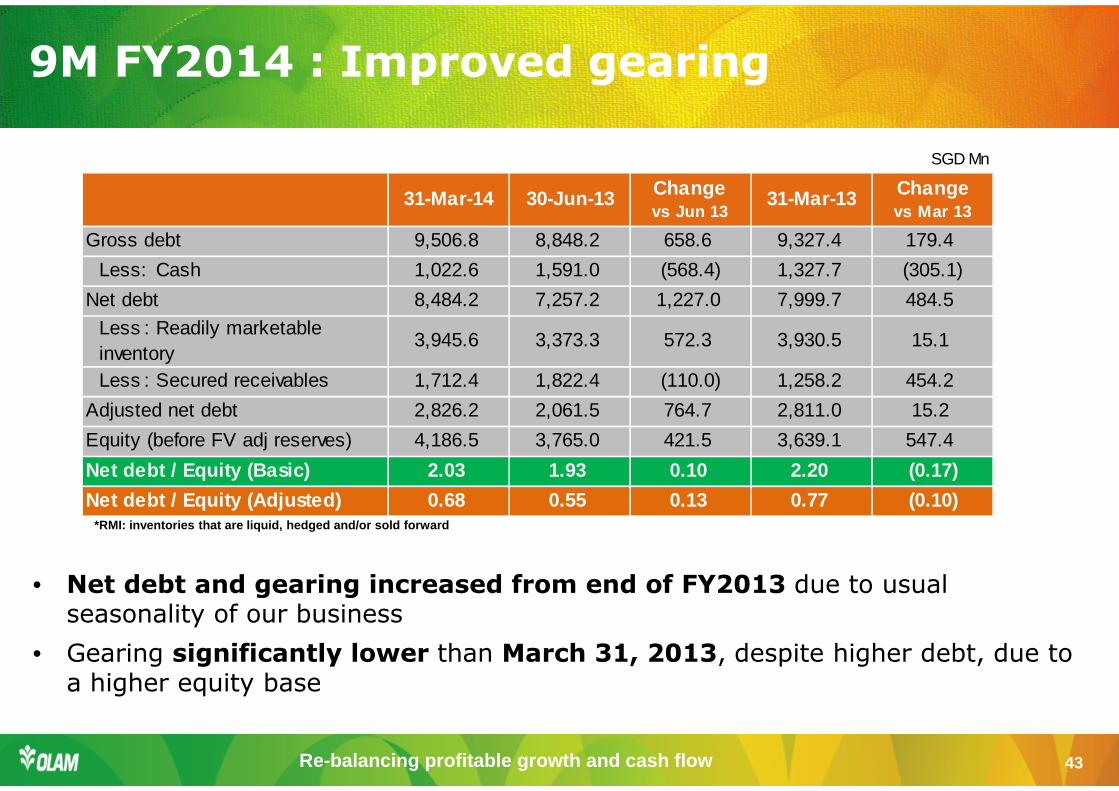
9M FY2014 : Improved gearing
*RMI: inventories that are liquid, hedged and/or so ld forward
• Net debt and gearing increased from end of FY2013 due to usual seasonality of our business
• Gearing significantly lower than March 31, 2013, despite higher debt, due to a higher equity base
SGD Mn
31-Mar-14 30-Jun-13 Changevs Jun 13
31-Mar-13 Changevs Mar 13
Gross debt 9,506.8 8,848.2 658.6 9,327.4 179.4
Less: Cash 1,022.6 1,591.0 (568.4) 1,327.7 (305.1)
Net debt 8,484.2 7,257.2 1,227.0 7,999.7 484.5
Less : Readily marketable inventory
3,945.6 3,373.3 572.3 3,930.5 15.1
Less : Secured receivables 1,712.4 1,822.4 (110.0) 1,258.2 454.2
Adjusted net debt 2,826.2 2,061.5 764.7 2,811.0 15.2
Equity (before FV adj reserves) 4,186.5 3,765.0 421.5 3,639.1 547.4
Net debt / Equity (Basic) 2.03 1.93 0.10 2.20 (0.17)
Net debt / Equity (Adjusted) 0.68 0.55 0.13 0.77 (0.10)
Re-balancing profitable growth and cash flow 44
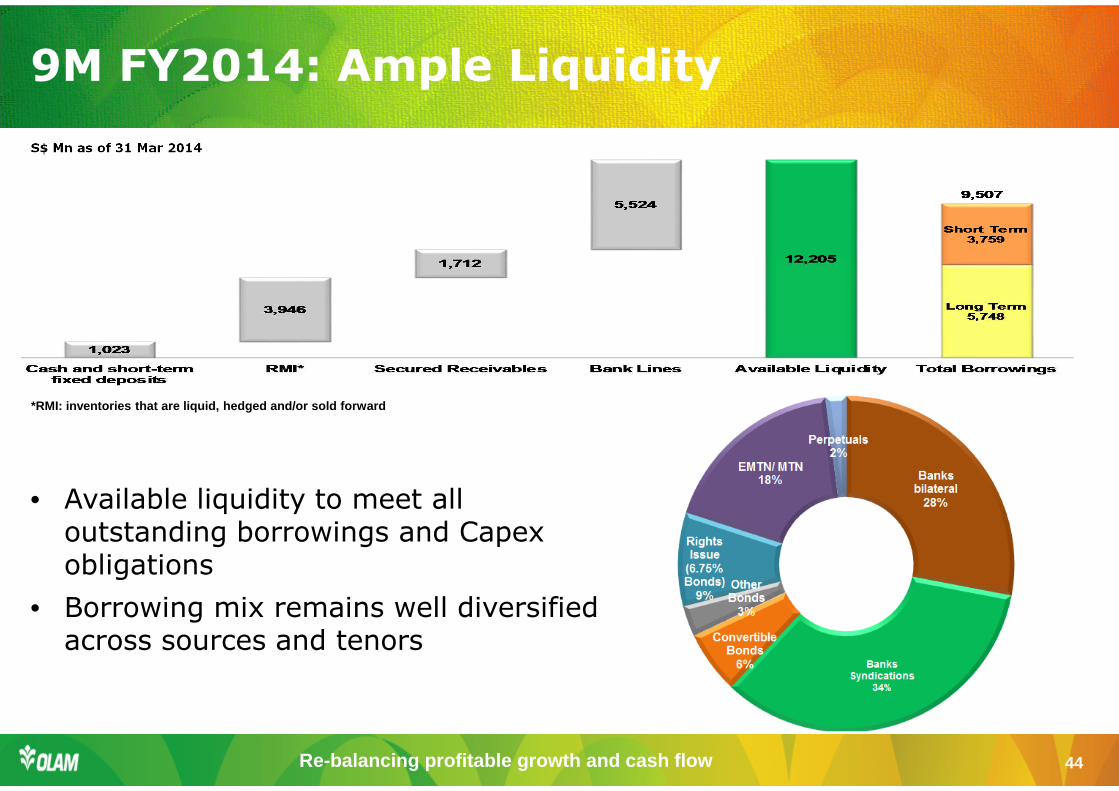
9M FY2014: Ample Liquidity
*RMI: inventories that are liquid, hedged and/or so ld forward
• Available liquidity to meet all outstanding borrowings and Capexobligations
• Borrowing mix remains well diversified across sources and tenors
S$ Mn as of 31 Mar 2014
Re-balancing profitable growth and cash flow 45
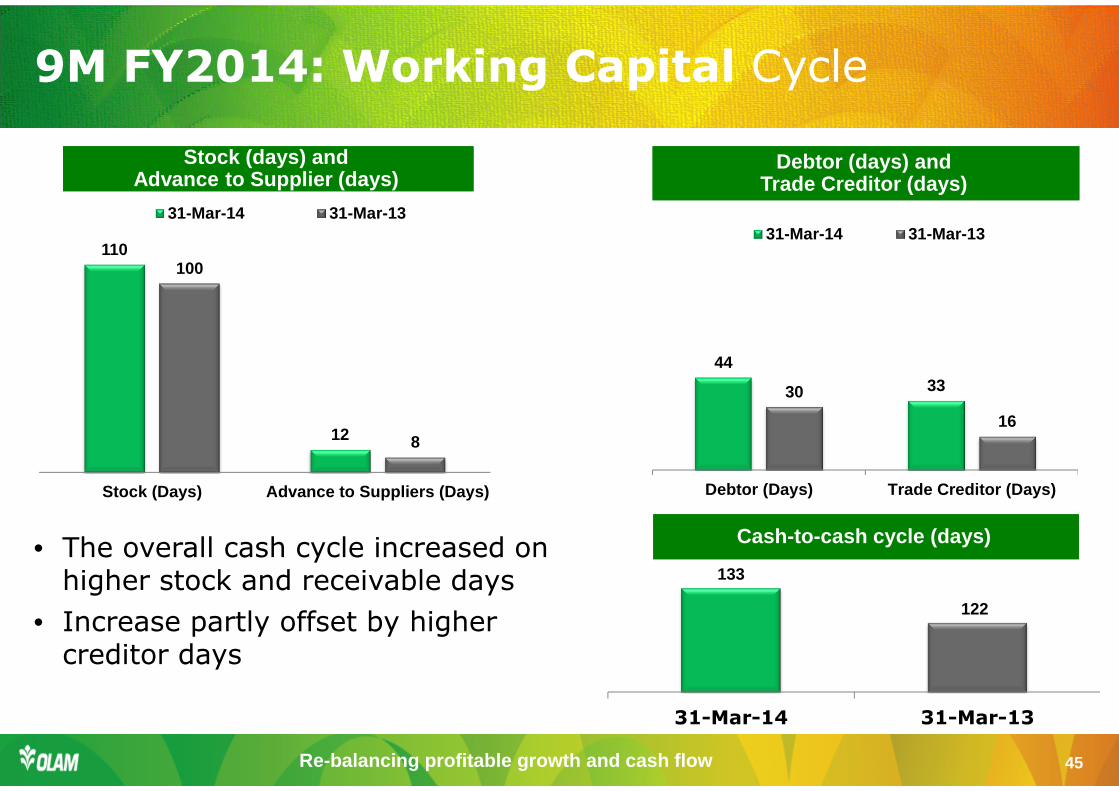
Cash-to-cash cycle (days)Cash-to-cash cycle (days)
Debtor (days) andTrade Creditor (days)
Debtor (days) andTrade Creditor (days)
Stock (days) and Advance to Supplier (days)
Stock (days) and Advance to Supplier (days)
• The overall cash cycle increased on higher stock and receivable days
• Increase partly offset by higher creditor days
9M FY2014: Working Capital Cycle
110
12
100
8
Stock (Days) Advance to Suppliers (Days)
31-Mar-14 31-Mar-13
443330
16
Debtor (Days) Trade Creditor (Days)
31-Mar-14 31-Mar-13
133
122
31-Mar-14 31-Mar-13
Re-balancing profitable growth and cash flow 46
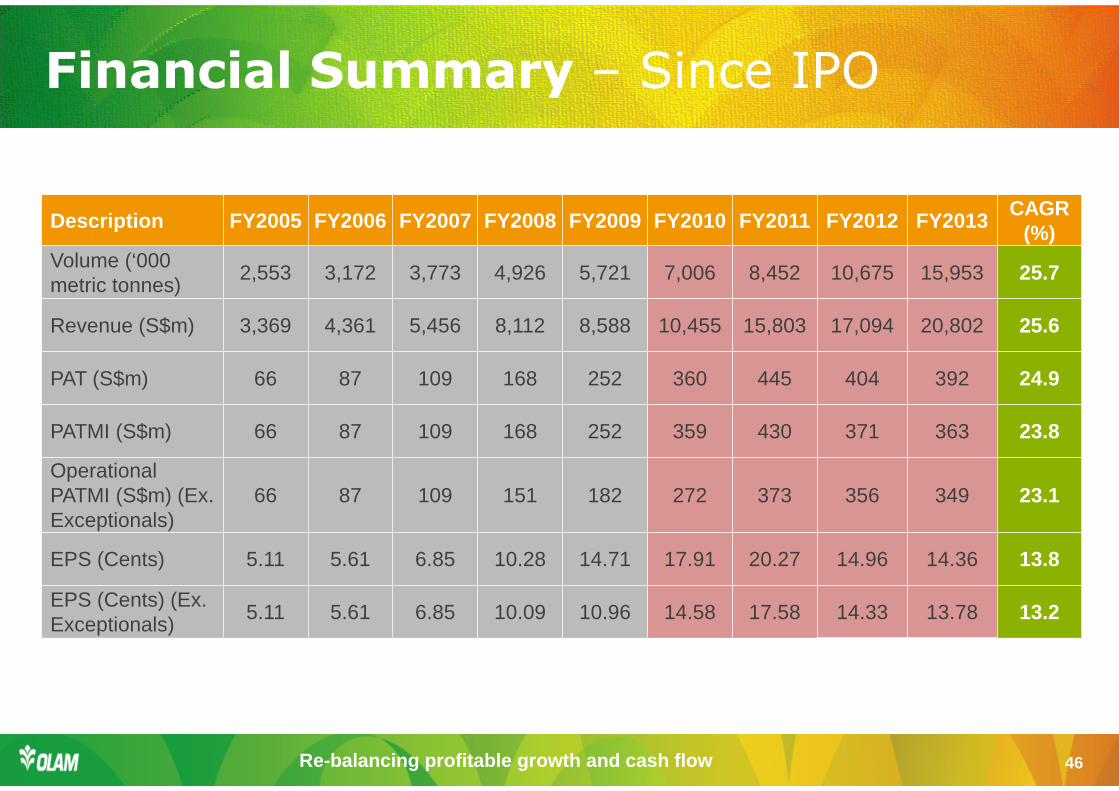
Financial Summary – Since IPO
Description FY2005 FY2006 FY2007 FY2008 FY2009 FY2010 FY20 11 FY2012 FY2013CAGR
(%)Volume (‘000 metric tonnes)
2,553 3,172 3,773 4,926 5,721 7,006 8,452 10,675 15,953 25.7
Revenue (S$m) 3,369 4,361 5,456 8,112 8,588 10,455 15,803 17,094 20,802 25.6
PAT (S$m) 66 87 109 168 252 360 445 404 392 24.9
PATMI (S$m) 66 87 109 168 252 359 430 371 363 23.8
Operational PATMI (S$m) (Ex. Exceptionals)
66 87 109 151 182 272 373 356 349 23.1
EPS (Cents) 5.11 5.61 6.85 10.28 14.71 17.91 20.27 14.96 14.36 13.8
EPS (Cents) (Ex. Exceptionals)
5.11 5.61 6.85 10.09 10.96 14.58 17.58 14.33 13.78 13.2
Re-balancing profitable growth and cash flow 47
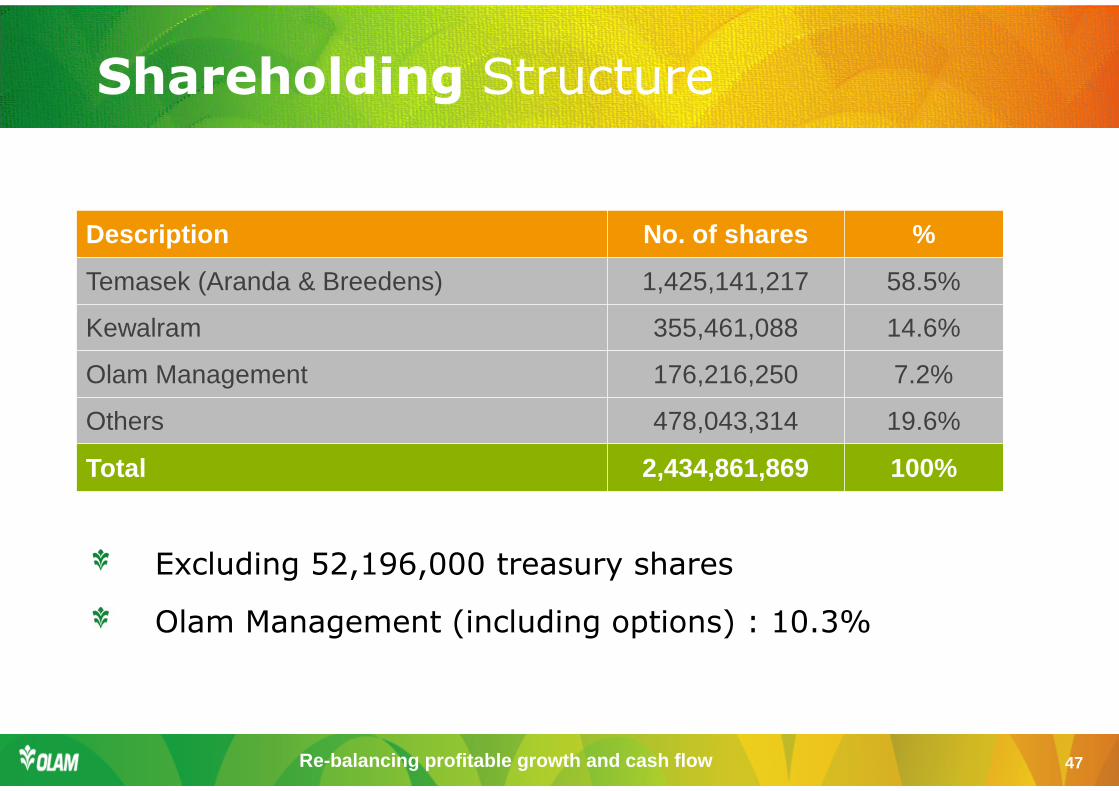
Shareholding Structure
Excluding 52,196,000 treasury shares
Olam Management (including options) : 10.3%
Description No. of shares %
Temasek (Aranda & Breedens) 1,425,141,217 58.5%
Kewalram 355,461,088 14.6%
Olam Management 176,216,250 7.2%
Others 478,043,314 19.6%
Total 2,434,861,869 100%
Re-balancing profitable growth and cash flow 48
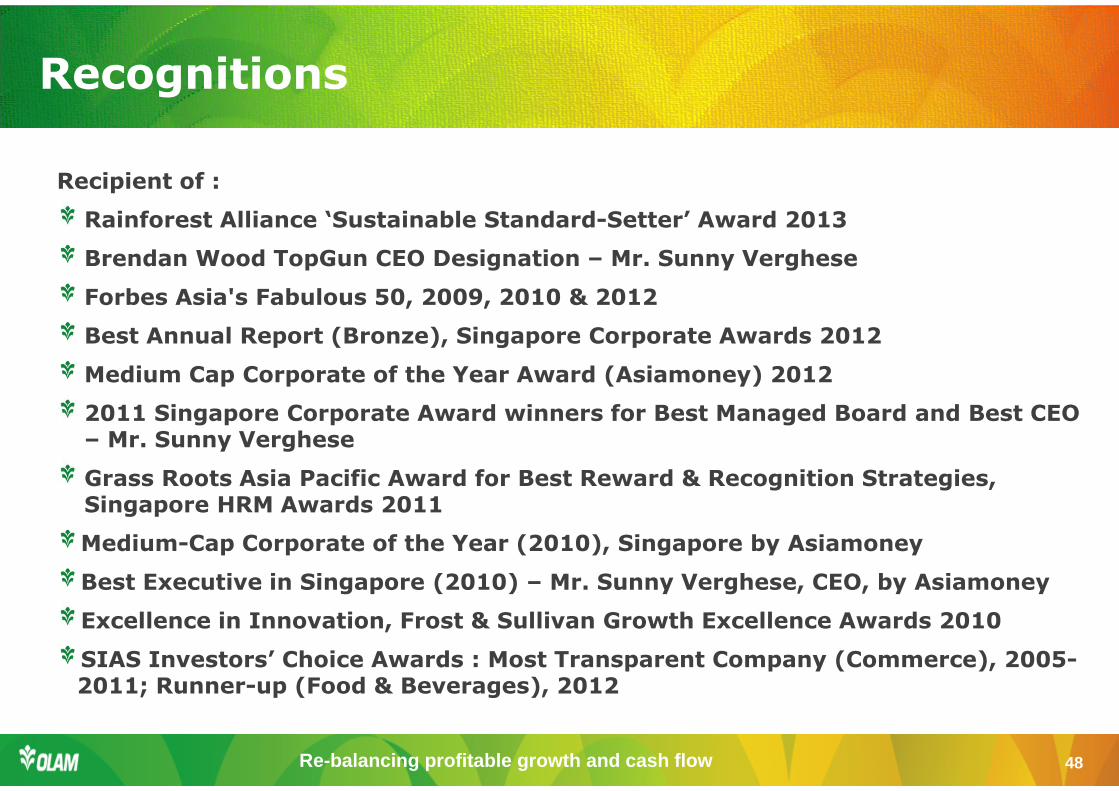
Recognitions
Recipient of :
Rainforest Alliance ‘Sustainable Standard-Setter’ Award 2013
Brendan Wood TopGun CEO Designation – Mr. Sunny Verghese
Forbes Asia's Fabulous 50, 2009, 2010 & 2012
Best Annual Report (Bronze), Singapore Corporate Awards 2012
Medium Cap Corporate of the Year Award (Asiamoney) 2012
2011 Singapore Corporate Award winners for Best Managed Board and Best CEO – Mr. Sunny Verghese
Grass Roots Asia Pacific Award for Best Reward & Recognition Strategies, Singapore HRM Awards 2011
Medium-Cap Corporate of the Year (2010), Singapore by Asiamoney
Best Executive in Singapore (2010) – Mr. Sunny Verghese, CEO, by Asiamoney
Excellence in Innovation, Frost & Sullivan Growth Excellence Awards 2010
SIAS Investors’ Choice Awards : Most Transparent Company (Commerce), 2005-2011; Runner-up (Food & Beverages), 2012

Re-balancing profitable growth and cash flow 49
Thank You