Embed Size (px)
Citation preview
STOCK CODE : 1299
ANNUAL REPORT 2015
REAL LIFEREAL IMPACT
AIA GROUP LIMITED友邦保險控股有限公司
VISION & PURPOSE
Our Vision is to be the pre-eminent life insurance provider in the Asia-Pacific region. That is our service to our customers and our shareholders.
Our Purpose is to play a leadership role in driving economic and social development across the region. That is our service to societies and their people.
ABOUT AIA
AIA Group Limited and its subsidiaries (collectively “AIA” or the “Group”) comprise the largest independent publicly listed pan-Asian life insurance group. It has a presence in 18 markets in Asia-Pacific – wholly-owned branches and subsidiaries in Hong Kong, Thailand, Singapore, Malaysia, China, Korea, the Philippines, Australia, Indonesia, Taiwan, Vietnam, New Zealand, Macau, Brunei, a 97 per cent subsidiary in Sri Lanka, a 26 per cent joint venture in India and a representative office in Myanmar and Cambodia.
The business that is now AIA was first established in Shanghai almost a century ago. It is a market leader in the Asia-Pacific region (ex-Japan) based on life insurance premiums and holds leading positions across the majority of its markets. It had total assets of US$168 billion as of 30 November 2015.
AIA meets the long-term savings and protection needs of individuals by offering a range of products and services including life insurance, accident and health insurance and savings plans. The Group also provides employee benefits, credit life and pension services to corporate clients. Through an extensive network of agents, partners and employees across Asia-Pacific, AIA serves the holders of more than 29 million individual policies and over 16 million participating members of group insurance schemes.
AIA Group Limited is listed on the Main Board of The Stock Exchange of Hong Kong Limited under the stock code “1299” with American Depositary Receipts (Level 1) traded on the over-the-counter market (ticker symbol: “AAGIY”).
Notes:(1) Explanations of certain terms and abbreviations used in this report are set
forth in the Glossary.
(2) Unless otherwise specified, 2014 and 2015 refer to the financial year of the Group, which ends on 30 November of the year indicated.

1948INTASCO changed its name to American International Assurance Company, Limited.
We entered Malaysia.
1957We registered in Brunei.
1972We formed a subsidiary in Australia.
1981Our New Zealand operations began as a branch of American Life Insurance Company (ALICO).
1982We entered Macau.
1984We entered Indonesia.
1987Korean operations began.
1990Our operations in Taiwan were established as a branch of ALICO.
1992We re-established our presence in China through a branch office in Shanghai, the first foreign-owned life business to receive a licence in the country.
1919AIA put down its corporate roots in Asia when the group founder Mr. Cornelius Vander Starr established an insurance agency in Shanghai.
1921Mr. Cornelius Vander Starr founded Asia Life Insurance Company, his first life insurance enterprise in Shanghai.
1931Mr. Cornelius Vander Starr founded International Assurance Company, Limited (INTASCO), in Shanghai.
INTASCO established branch offices in Hong Kong and Singapore.
1938INTASCO entered Siam, later renamed Thailand.
1947The Philippine American Life and General Insurance Company (Philam Life) was founded in the Philippines.
INTASCO moved its head office to Hong Kong.
KEY MILESTONES
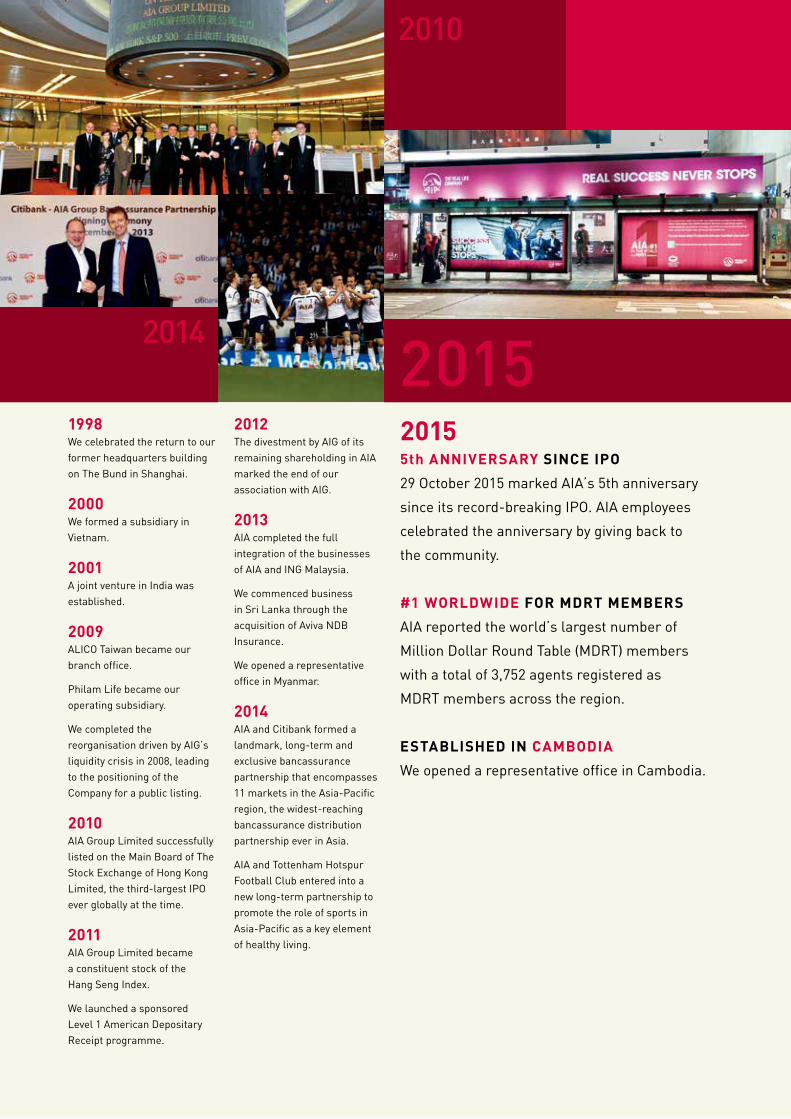
20155th ANNIVERSARY SINCE IPO
29 October 2015 marked AIA’s 5th anniversary
since its record-breaking IPO. AIA employees
celebrated the anniversary by giving back to
the community.
#1 WORLDWIDE FOR MDRT MEMBERS
AIA reported the world’s largest number of
Million Dollar Round Table (MDRT) members
with a total of 3,752 agents registered as
MDRT members across the region.
ESTABLISHED IN CAMBODIA
We opened a representative office in Cambodia.
20151998We celebrated the return to our former headquarters building on The Bund in Shanghai.
2000We formed a subsidiary in Vietnam.
2001A joint venture in India was established.
2009ALICO Taiwan became our branch office.
Philam Life became our operating subsidiary.
We completed the reorganisation driven by AIG’s liquidity crisis in 2008, leading to the positioning of the Company for a public listing.
2010AIA Group Limited successfully listed on the Main Board of The Stock Exchange of Hong Kong Limited, the third-largest IPO ever globally at the time.
2011AIA Group Limited became a constituent stock of the Hang Seng Index.
We launched a sponsored Level 1 American Depositary Receipt programme.
2012The divestment by AIG of its remaining shareholding in AIA marked the end of our association with AIG.
2013AIA completed the full integration of the businessesof AIA and ING Malaysia.
We commenced businessin Sri Lanka through the acquisition of Aviva NDB Insurance.
We opened a representative office in Myanmar.
2014AIA and Citibank formed a landmark, long-term and exclusive bancassurance partnership that encompasses 11 markets in the Asia-Pacific region, the widest-reaching bancassurance distribution partnership ever in Asia.
AIA and Tottenham Hotspur Football Club entered into a new long-term partnership to promote the role of sports in Asia-Pacific as a key element of healthy living.
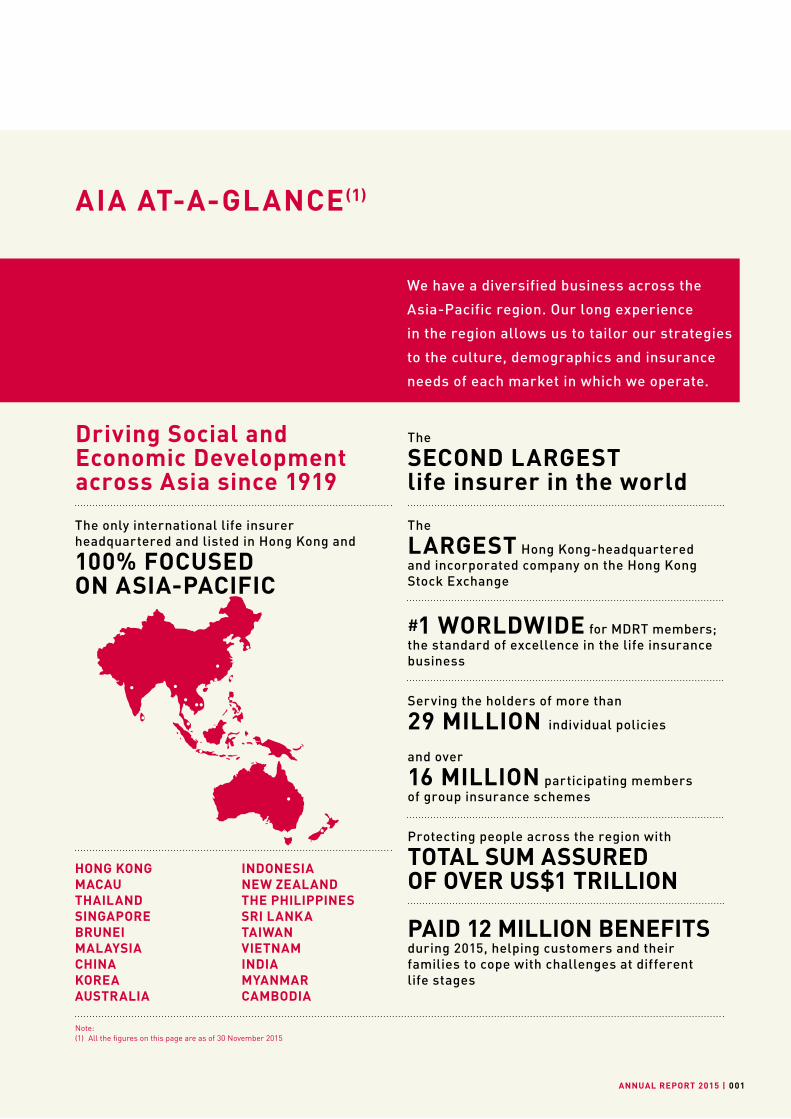
We have a diversified business across the
Asia-Pacific region. Our long experience
in the region allows us to tailor our strategies
to the culture, demographics and insurance
needs of each market in which we operate.
Note:(1) All the figures on this page are as of 30 November 2015
The
SECOND LARGEST life insurer in the world
The
LARGEST Hong Kong-headquartered and incorporated company on the Hong Kong Stock Exchange
#1 WORLDWIDE for MDRT members; the standard of excellence in the life insurance business
Serving the holders of more than
29 MILLION individual policies
and over
16 MILLION participating members of group insurance schemes
Protecting people across the region with
TOTAL SUM ASSUREDOF OVER US$1 TRILLION
PAID 12 MILLION BENEFITSduring 2015, helping customers and their families to cope with challenges at different life stages
AIA AT-A-GLANCE (1)
HONG KONG MACAUTHAILANDSINGAPOREBRUNEIMALAYSIACHINAKOREAAUSTRALIA
Driving Social and Economic Development across Asia since 1919
ANNUAL REPORT 2015 | 001
INDONESIANEW ZEALANDTHE PHILIPPINESSRI LANKATAIWANVIETNAMINDIAMYANMARCAMBODIA
The only international life insurer headquartered and listed in Hong Kong and
100% FOCUSEDON ASIA-PACIFIC
| AIA GROUP LIMITED002
OVERVIEW
FINANCIAL HIGHLIGHTS
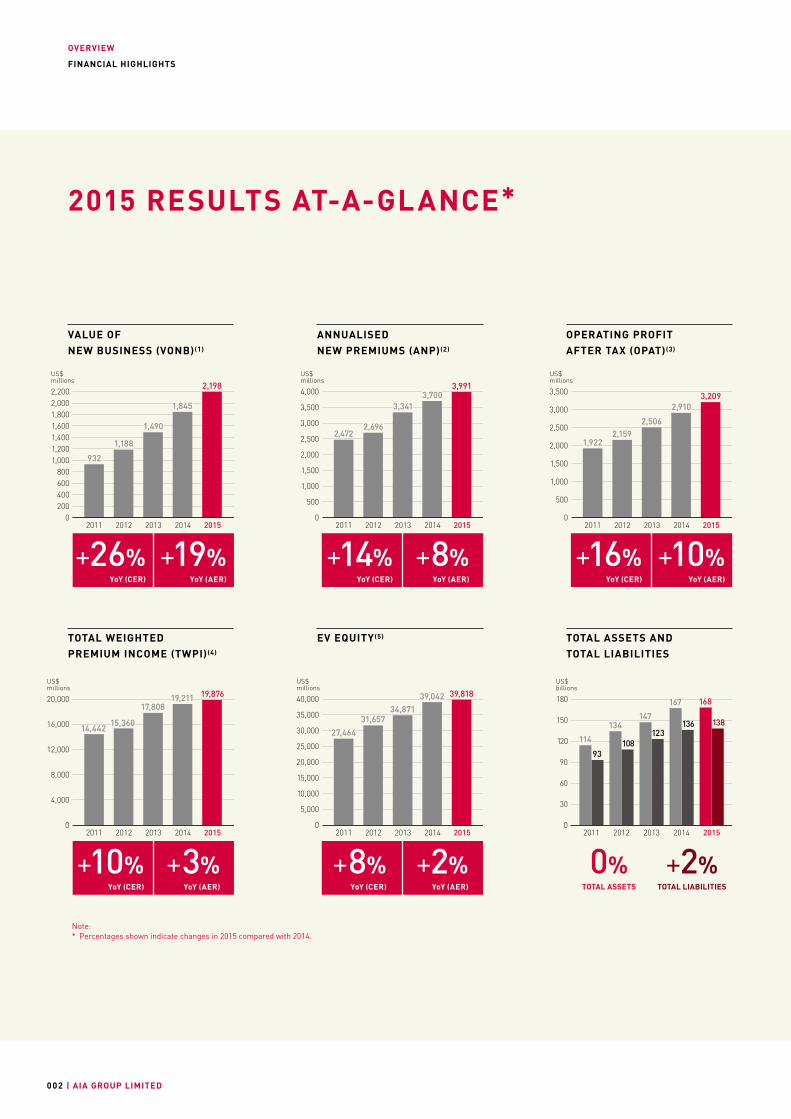
2015 RESULTS AT-A-GLANCE*
VALUE OF NEW BUSINESS (VONB)(1)
ANNUALISED NEW PREMIUMS (ANP)(2)
TOTAL WEIGHTED PREMIUM INCOME (TWPI)(4)
OPERATING PROFIT AFTER TAX (OPAT)(3)
EV EQUITY (5) TOTAL ASSETS AND TOTAL LIABILITIES
Note:* Percentages shown indicate changes in 2015 compared with 2014.
0% +2%TOTAL ASSETS TOTAL LIABILITIES
US$ millions
2,198
2012 2013 2014 20152011
932
1,845
1,188
0
400200
800600
1,2001,000
1,6001,400
2,2002,0001,800
1,490
US$ millions
2012 2013 2014 20152011
3,991
2,472
3,7003,341
2,696
500
1,000
1,500
2,000
2,500
3,500
4,000
3,000
0
US$ millions
2012 2013 2014 20152011
2,5062,159
3,2092,910
1,922
0
500
1,000
1,500
2,000
3,500
3,000
2,500
US$ millions
2012 2013 2014 20152011
17,808
14,442
19,876
15,360
19,211
4,000
8,000
12,000
16,000
20,000
0
US$ millions
34,871
39,818
2012 2013 2014 20152011
31,657
27,464
39,042
0
5,000
10,000
15,000
20,000
25,000
30,000
35,000
40,000
US$ billions
136
2012 2013 2014 20152011
93
134147
123114 108
138
167 168
0
30
60
90
120
180
150
YoY (AER)YoY (CER)
+26% +19%YoY (AER) YoY (AER)YoY (CER) YoY (CER)
+14% +16% +8% +10%
YoY (AER) YoY (AER)YoY (CER) YoY (CER)
+10% +8% +3% +2%
ANNUAL REPORT 2015 | 003
OVERVIEW
FINANCIAL HIGHLIGHTS
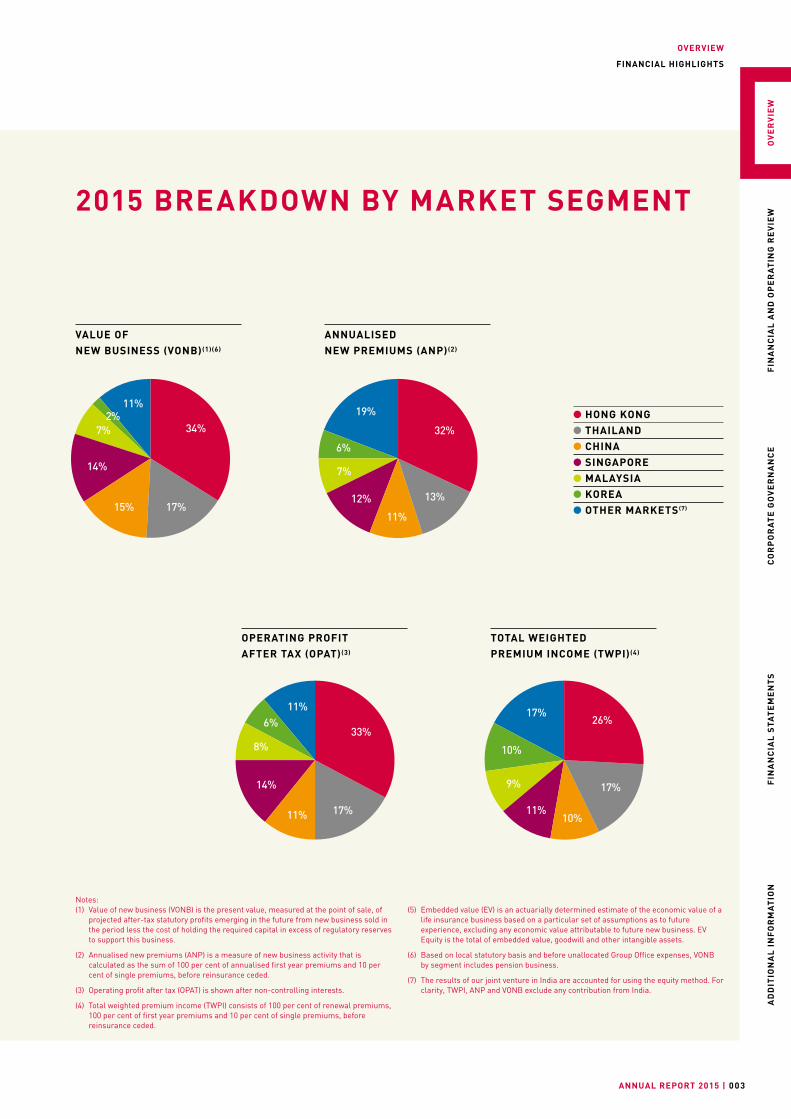
2015 BREAKDOWN BY MARKET SEGMENT
HONG KONG THAILAND CHINA SINGAPORE MALAYSIA KOREA OTHER MARKETS (7)
VALUE OF NEW BUSINESS (VONB)(1)(6)
TOTAL WEIGHTED PREMIUM INCOME (TWPI)(4)
ANNUALISED NEW PREMIUMS (ANP)(2)
OPERATING PROFIT AFTER TAX (OPAT)(3)
Notes:(1) Value of new business (VONB) is the present value, measured at the point of sale, of
projected after-tax statutory profits emerging in the future from new business sold in the period less the cost of holding the required capital in excess of regulatory reserves to support this business.
(2) Annualised new premiums (ANP) is a measure of new business activity that is calculated as the sum of 100 per cent of annualised first year premiums and 10 per cent of single premiums, before reinsurance ceded.
(3) Operating profit after tax (OPAT) is shown after non-controlling interests.
(4) Total weighted premium income (TWPI) consists of 100 per cent of renewal premiums, 100 per cent of first year premiums and 10 per cent of single premiums, before reinsurance ceded.
(5) Embedded value (EV) is an actuarially determined estimate of the economic value of a life insurance business based on a particular set of assumptions as to future experience, excluding any economic value attributable to future new business. EV Equity is the total of embedded value, goodwill and other intangible assets.
(6) Based on local statutory basis and before unallocated Group Office expenses, VONB by segment includes pension business.
(7) The results of our joint venture in India are accounted for using the equity method. For clarity, TWPI, ANP and VONB exclude any contribution from India.
34%
17%15%
14%
2%7%
11%
32%
13%
11%
12%
6%
7%
19%
33%
17%11%
14%
6%
8%
11%26%
17%
10%11%
10%
9%
17%
OV
ER
VIE
WF
INA
NC
IAL
AN
D O
PE
RA
TIN
G R
EV
IEW
CO
RP
OR
AT
E G
OV
ER
NA
NC
EF
INA
NC
IAL
STA
TE
ME
NT
SA
DD
ITIO
NA
L I
NF
OR
MA
TIO
N
| AIA GROUP LIMITED004
OVERVIEW
Financial Highlights .....................................................................002
Chairman’s Statement .................................................................016
Group Chief Executive and President’s Report ............................018
FINANCIAL AND OPERATING REVIEW
Financial Review ..........................................................................023
Business Review ..........................................................................038
Risk Management ........................................................................058
Regulatory Developments ............................................................071
Our People....................................................................................072
Corporate Social Responsibility ...................................................074
CORPORATE GOVERNANCE
Statement of Directors’ Responsibilities .....................................081
Board of Directors ........................................................................082
Executive Committee ...................................................................088
Report of the Directors ................................................................092
Corporate Governance Report .....................................................099
Remuneration Report ..................................................................107
CONTENTS
FINANCIAL STATEMENTS
Independent Auditor’s Report ......................................................117
Consolidated Income Statement ..................................................119
Consolidated Statement of Comprehensive Income ...................120
Consolidated Statement of Financial Position .............................121
Consolidated Statement of Changes in Equity.............................123
Consolidated Statement of Cash Flows .......................................125
Notes to the Consolidated Financial Statements and Significant Accounting Policies .............................................127
Supplementary Embedded Value Information .............................245
ADDITIONAL INFORMATION
Information for Shareholders ......................................................267
Corporate Information .................................................................269
Glossary .......................................................................................270
ANNUAL REPORT 2015 | 005
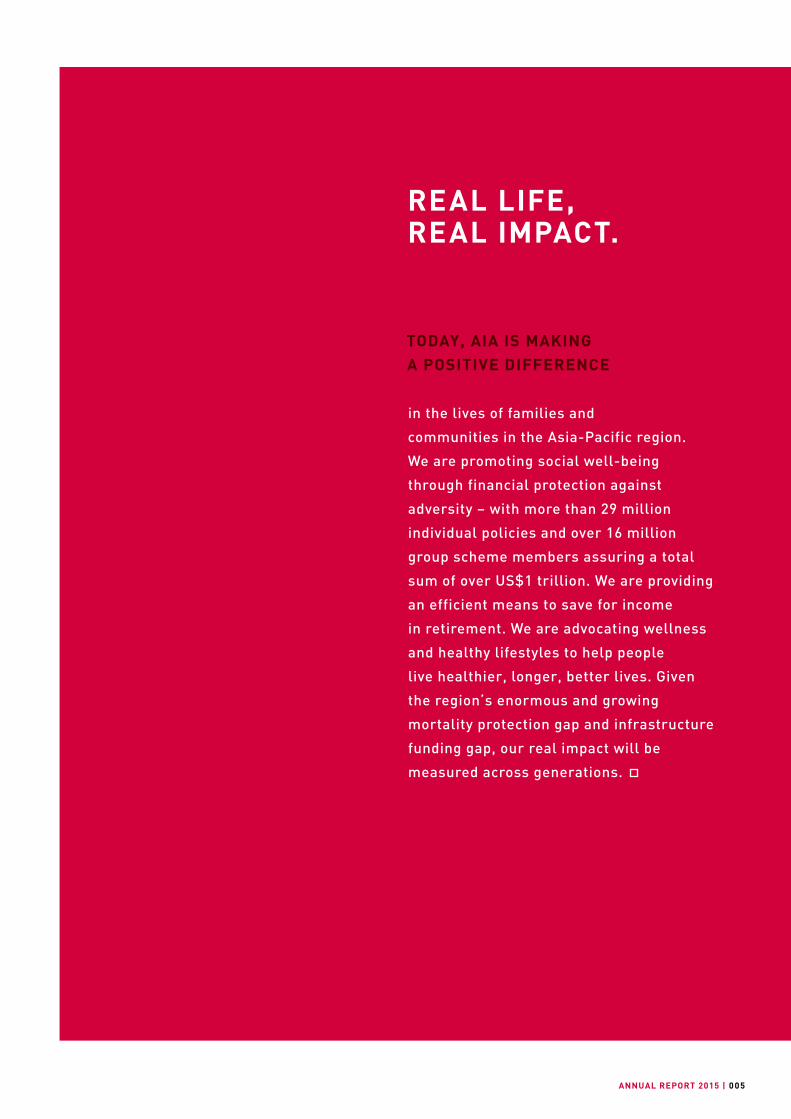
REAL LIFE,REAL IMPACT.
TODAY, AIA IS MAKING A POSITIVE DIFFERENCE
in the lives of families and
communities in the Asia-Pacific region.
We are promoting social well-being
through financial protection against
adversity – with more than 29 million
individual policies and over 16 million
group scheme members assuring a total
sum of over US$1 trillion. We are providing
an efficient means to save for income
in retirement. We are advocating wellness
and healthy lifestyles to help people
live healthier, longer, better lives. Given
the region’s enormous and growing
mortality protection gap and infrastructure
funding gap, our real impact will be
measured across generations.

REAL LIFE, REAL IMPACT.
| AIA GROUP LIMITED006
“I LEARNED FROM MY EXPERIENCE THAT NOTHING IN THIS WORLD IS TOO DIFFICULT OR TOO EASY.”
REALLY LISTENING CLOSING THE PROTECTION GAP
In Korea, Choi Jung Min, an AIA agent with a hearing-impairment and speech disorder, mastered sign language and acquired 19 types of qualifications, including that of laughter therapist, to more effectively provide his customers with life insurance products and services. Thanks to Choi’s dedication, many hearing-impaired people who previously found it difficult to learn about and obtain life and health protections are now protected.
Scan for further information

REAL LIFE, REAL IMPACT.
ANNUAL REPORT 2015 | 007
UNSCRIPTEDFINDING OUR ROLE IN LIFE
In Thailand, AIA agent Siriporn Phuttharak (Jum), a fan of renowned actress and model, Linda Khathanjarern, convinced her to purchase an insurance plan. Two years later, Linda suffered a major stroke, leaving her paralysed on one side of her body. This was followed with a diagnosis of cancer of the tongue. From the very day that Linda fell stricken to the ground, Jum looked after her insurance claims and the documentation necessitated by continual care. Over the years, Jum has continued to look in on Linda, providing her with a caring friend who does her best to keep her spirits up.
Scan for further information
“BACK THEN SHE HELPED ME BY BUYING A POLICY…. NOW I AM DETERMINED TO HELP HER IN THE TIME TO COME.”
REAL LIFE, REAL IMPACT.
| AIA GROUP LIMITED008
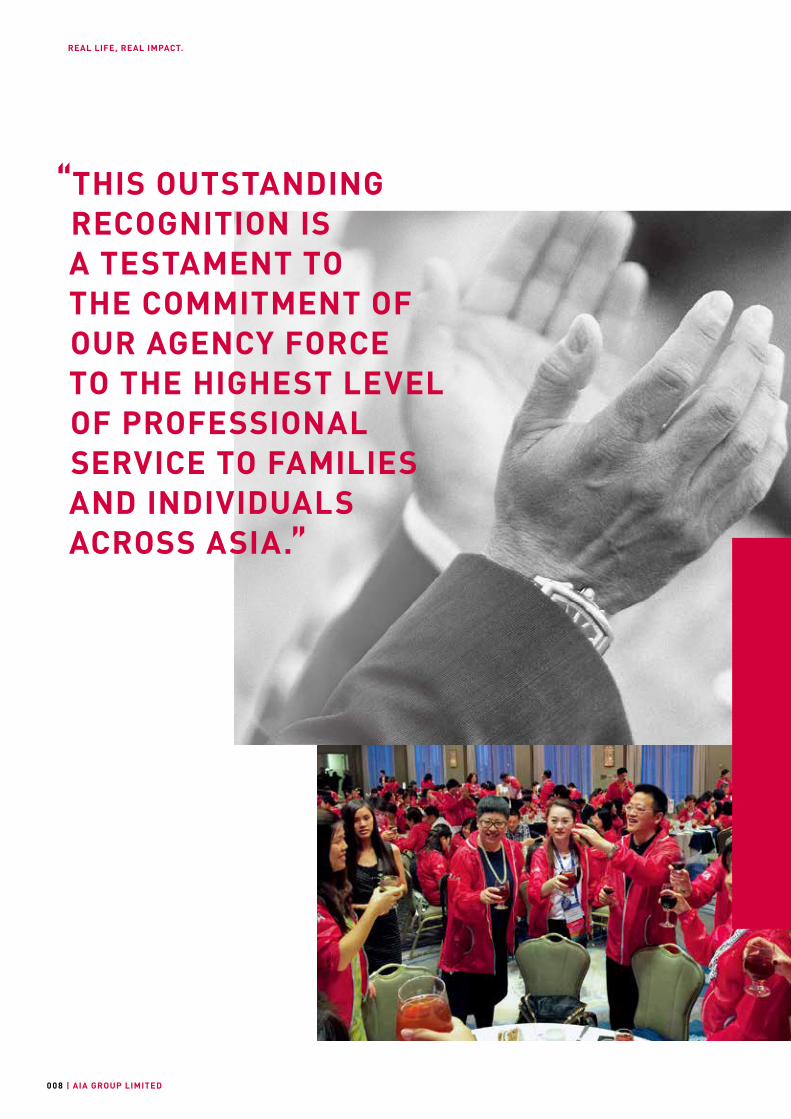
“THIS OUTSTANDING RECOGNITION IS A TESTAMENT TO THE COMMITMENT OF OUR AGENCY FORCETO THE HIGHEST LEVEL OF PROFESSIONAL SERVICE TO FAMILIES AND INDIVIDUALS ACROSS ASIA.”

REAL LIFE, REAL IMPACT.
ANNUAL REPORT 2015 | 009
AT THE TABLE AIA TOPS THE MILLION DOLLAR ROUND TABLE
In 2015, for the first time in our history, AIA was named the world’s top-ranking multinational company on the prestigious MDRT list. The MDRT is recognised as the global standard of excellence in the life insurance and financial services business, whose members are required to demonstrate exceptional professional knowledge, strict ethical conduct and exceptional client service. The achievement reflects the success of AIA’s Premier Agency strategy which was launched in 2010, leading to significant investments in agency training and development.
Scan for further information
REAL LIFE, REAL IMPACT.
| AIA GROUP LIMITED010
““
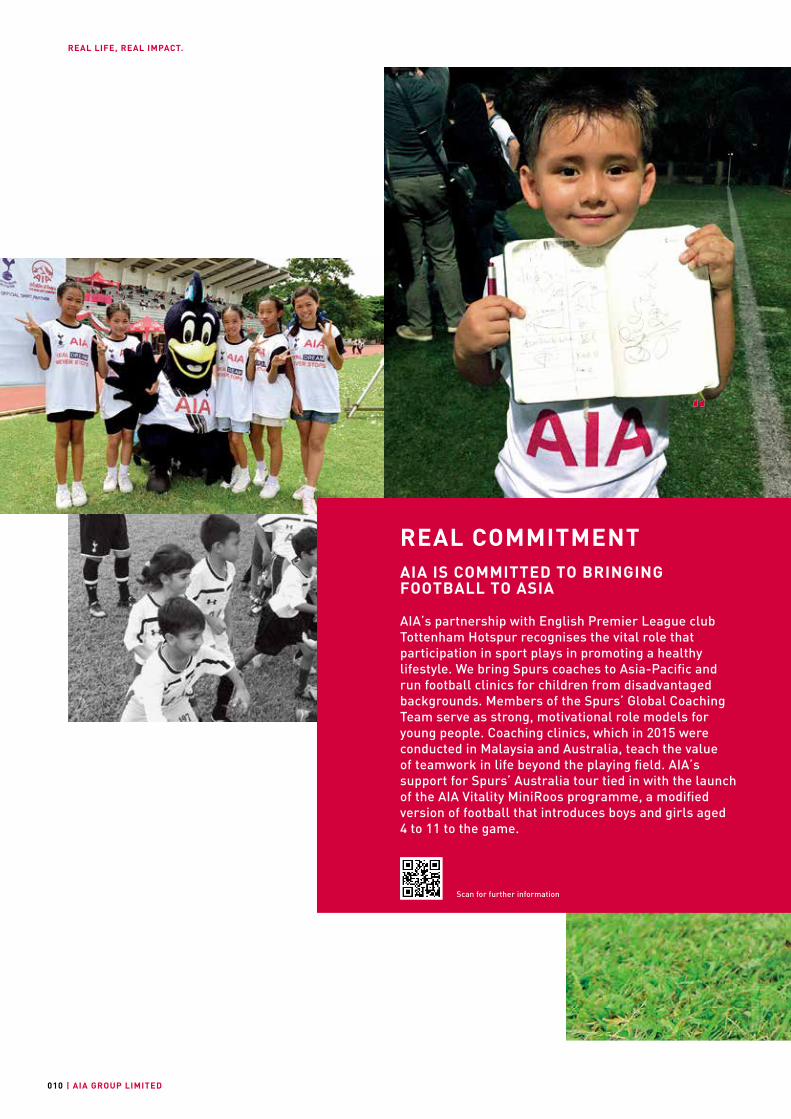
REAL COMMITMENTAIA IS COMMITTED TO BRINGING FOOTBALL TO ASIA
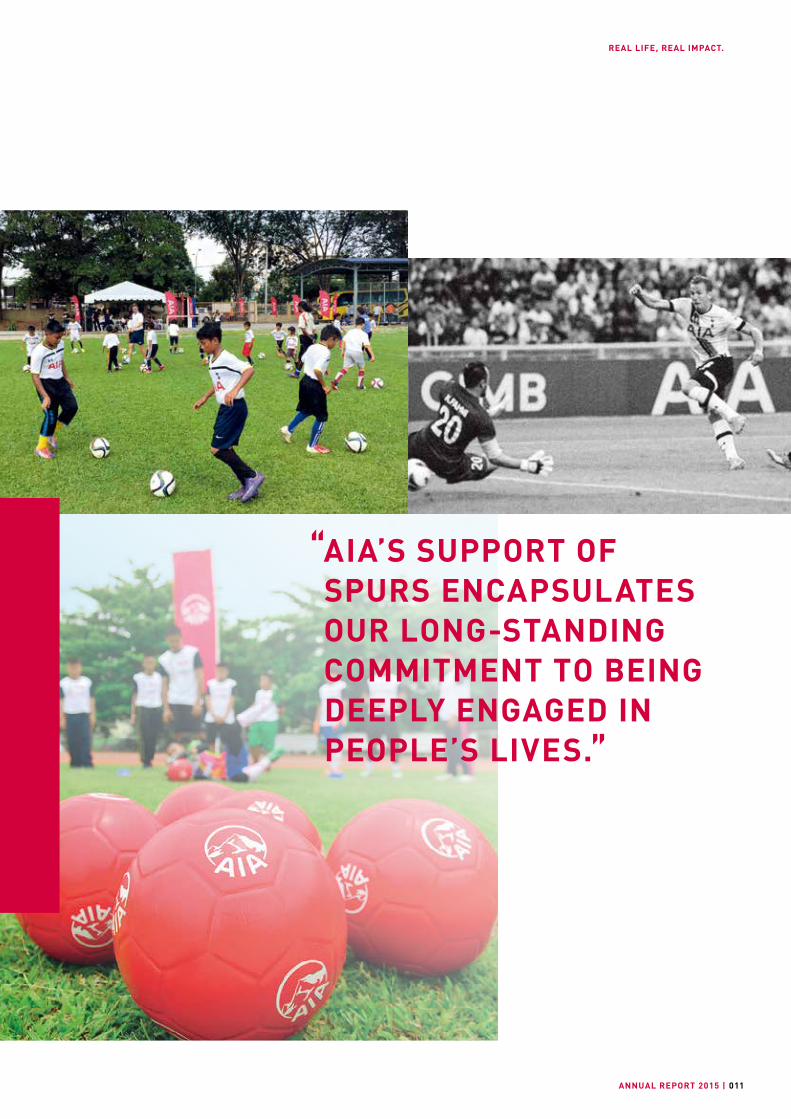
AIA’s partnership with English Premier League club Tottenham Hotspur recognises the vital role that participation in sport plays in promoting a healthy lifestyle. We bring Spurs coaches to Asia-Pacific and run football clinics for children from disadvantaged backgrounds. Members of the Spurs’ Global Coaching Team serve as strong, motivational role models for young people. Coaching clinics, which in 2015 were conducted in Malaysia and Australia, teach the value of teamwork in life beyond the playing field. AIA’s support for Spurs’ Australia tour tied in with the launch of the AIA Vitality MiniRoos programme, a modified version of football that introduces boys and girls aged 4 to 11 to the game.
Scan for further information
REAL LIFE, REAL IMPACT.
ANNUAL REPORT 2015 | 011
“AIA’S SUPPORT OF SPURS ENCAPSULATES OUR LONG-STANDING COMMITMENT TO BEING DEEPLY ENGAGED IN PEOPLE’S LIVES.”

REAL LIFE, REAL IMPACT.
| AIA GROUP LIMITED012
REAL LIFE, REAL IMPACT.
ANNUAL REPORT 2015 | 013
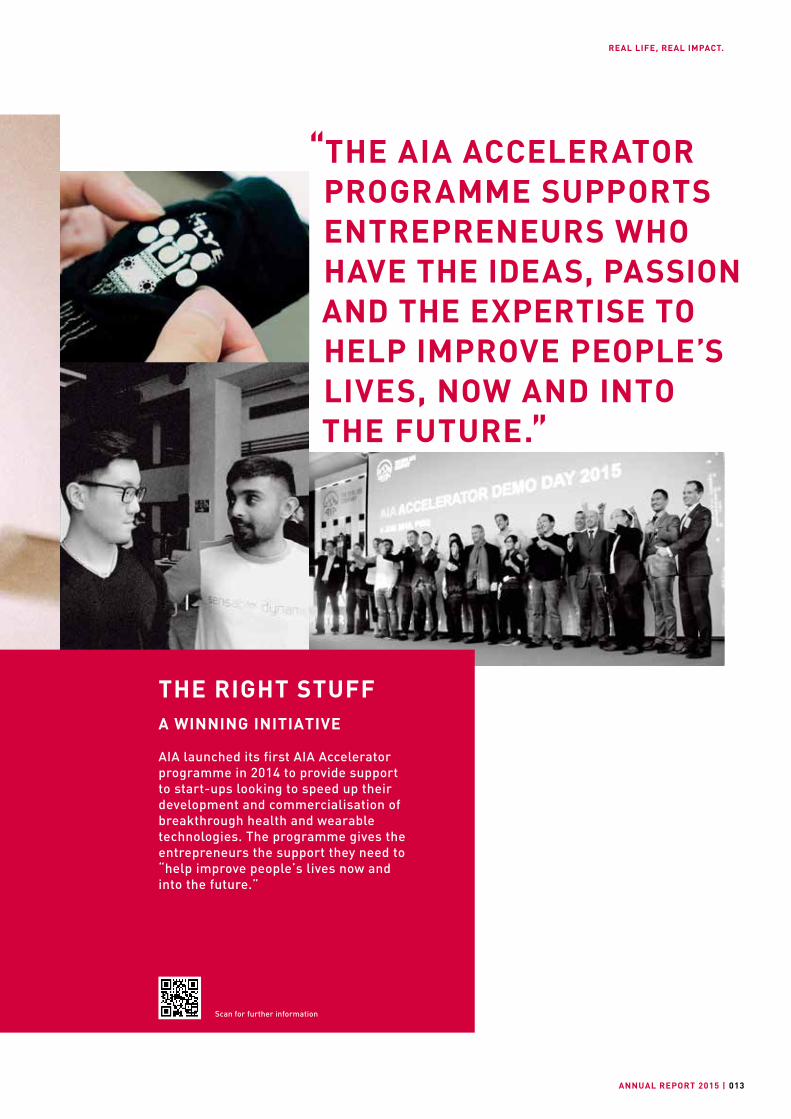
“THE AIA ACCELERATOR PROGRAMME SUPPORTS ENTREPRENEURS WHO HAVE THE IDEAS, PASSION AND THE EXPERTISE TO HELP IMPROVE PEOPLE’S LIVES, NOW AND INTO THE FUTURE.”
THE RIGHT STUFFA WINNING INITIATIVE
AIA launched its first AIA Accelerator programme in 2014 to provide support to start-ups looking to speed up their development and commercialisation of breakthrough health and wearable technologies. The programme gives the entrepreneurs the support they need to “help improve people’s lives now and into the future.”
Scan for further information

REAL LIFE, REAL IMPACT.
| AIA GROUP LIMITED014
FIVE YEARS ONGIVING BACK AND TOUCHING LIVES
Employees at AIA Group Office celebrated the Company’s 5th Anniversary since IPO with a number of CSR-related activities. On 30 October 2015, employees took part in the ‘1299 Challenge’ to raise money for one of Hong Kong’s oldest and most respected charity organisations – Tung Wah Group of Hospitals. The challenge involved climbing to the top of AIA Building as many times as possible, with AIA donating HK$1 for every step climbed. The total funds raised reached HK$1,299,000 (symbolising AIA’s stock code: 1299).
The following day, more than 100 Group Office employees volunteered their time to spend a morning with the elderly, the intellectually challenged and young children from less advantaged families. Across town, colleagues including AIA’s senior leaders helped run a football clinic for children from Operation Breakthrough, an organisation that provides sports and related activities for disadvantaged young people in Hong Kong.
Scan for further information
ANNUAL REPORT 2015 | 015
OVERVIEW
Chairman’s Statement .....................................................016
Group Chief Executive and President’s Report ................018
OVERVIEW
| AIA GROUP LIMITED016
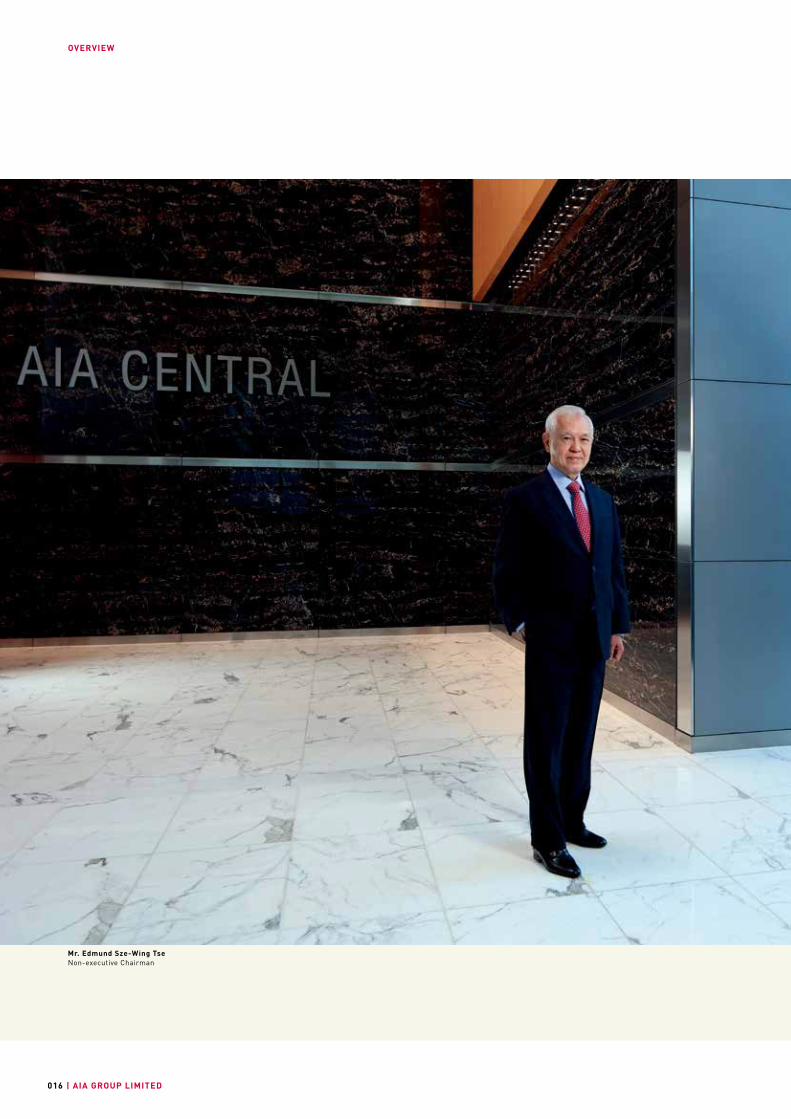
Mr. Edmund Sze-Wing TseNon-executive Chairman
OVERVIEW
ANNUAL REPORT 2015 | 017
OV
ER
VIE
WF
INA
NC
IAL
AN
D O
PE
RA
TIN
G R
EV
IEW
CO
RP
OR
AT
E G
OV
ER
NA
NC
EF
INA
NC
IAL
STA
TE
ME
NT
SA
DD
ITIO
NA
L I
NF
OR
MA
TIO
N
Over the five years since AIA became a listed company, it has been my pleasure and privilege to work as a member of a Board that is committed to maintaining the highest international standards of corporate governance. The Board retains overall responsibility for oversight of the Group’s risk management activities, which are fundamental to AIA’s sustainable development and to maintaining investor, customer and regulatory confidence in our organisation. AIA’s focus continues to be on embedding a risk management culture throughout our organisation and ensuring that our risk framework evolves in the face of a changing business and regulatory environment. Regular external reviews of our risk management principles and practices are an important part of this process.
I speak for the entire Board in conveying my deepest appreciation to all of our customers and shareholders for their continued trust in and support for AIA. We are focused at all times on building shareholder value, and importantly by doing so through the quality of our products and services to our customers. We are confident that our operations make a material difference to the security and prosperity of our customers and their communities.
I should also like once again, on behalf of the Board, to pass on our deepest thanks to AIA’s employees, agents and partners for their dedication and commitment. Special thanks are due to your Group Chief Executive and President Mark Tucker and his team for the leadership they provide in delivering these outstanding results.
Edmund Sze-Wing TseNon-executive Chairman25 February 2016
It gives me great pleasure to report that 2015 was another very successful year for AIA.
The Group has delivered an excellent performance against a global backdrop of volatile capital and currency markets. Our main operating financial metrics exceeded the record results delivered in 2014 by a substantial margin and we have maintained an outstanding track record of strong year-on-year growth over the five years since becoming an independent publicly listed company in 2010.
Value of new business (VONB) growth was 26 per cent on constant exchange rates to US$2,198 million and IFRS operating profit after tax (OPAT) grew by 16 per cent to US$3,209 million compared with 2014. We believe that showing growth using constant exchange rates provides the clearest picture of the underlying performance of our businesses across the Asia-Pacific region during periods of exchange rate volatility.
AIA has succeeded in delivering this consistent growth while maintaining disciplined financial management and a very strong capital position. The solvency ratio for our principal regulated operating company AIA Co. remained stable at 428 per cent and the Group’s free surplus above required regulatory capital stood at US$7.5 billion as at 30 November 2015.
The Board has recommended an upward rebasing of the final dividend by 50 per cent to 51.00 Hong Kong cents per share subject to shareholders’ approval. This brings the total dividend for 2015 to 69.72 Hong Kong cents per share. This substantial increase demonstrates once again AIA’s ability to finance new business growth at attractive rates of return, the health of the business and the Board’s confidence in AIA’s outstanding prospects in the region. The Board intends to maintain AIA’s established prudent, sustainable and progressive dividend policy from this higher base.
CHAIRMAN’S STATEMENT
OVERVIEW
| AIA GROUP LIMITED018
AIA has delivered another excellent set of results in 2015. This continues the strong growth that we have maintained since our IPO in October 2010.
Value of new business (VONB) increased to US$2,198 million, which is 26 per cent growth on a constant exchange rate basis, and we also delivered a 16 per cent growth in IFRS operating profit after tax (OPAT). This strong operating performance reflects the financially disciplined execution of our strategy. Against a backdrop of volatile global capital markets, this outstanding performance reflects a powerful combination of superior profitable growth and strong cash flow generation. This is the fifth full year in a row that we have done so, demonstrating our commitment to building a sustainable business of high quality and both the Group’s past success and our confidence in our future prospects are reflected in the Board’s decision to recommend an upward rebasing of the final dividend by 50 per cent compared with 2014.
We are still in the early stages of our exciting and long-term growth journey. AIA continues to benefit from the profound social, demographic and economic changes taking place across the region. Rapid urbanisation and industrialisation are generating and spreading new wealth, leading to significant increases in disposable incomes, particularly within an expanding middle class. Our insurance and savings products can help to mitigate some of the risks associated with the weakening of traditional family support networks and the limited state-funded welfare available in many countries. The opportunities available to us in Asia are ever-increasing and unparalleled.
AIA is exceptionally well positioned to meet the evolving needs of consumers and to benefit from the scale and resilience of these significant growth opportunities. Our unique and strong platform is based on our unrivalled access to customers through our proprietary agency and partnership distribution channels, our products tailored to local market conditions and needs, our long-established brand reputation across Asia and our financial strength. Our focus remains on generating shareholder value through continuing to increase the reach and professionalism of our distribution force, further expanding and improving our range
GROUP CHIEF EXECUTIVE AND PRESIDENT’S REPORT
of products and raising the quality of service and value that our customers receive, making it easier for them to do business with us.
As the leading pan-Asian life insurer, we not only benefit directly from these fundamental social and economic changes, but are also looking to harness them to help bring about long-term, sustainable economic growth to benefit our local economies and markets. By mobilising savings and pooling premiums we are able to invest billions of dollars on our policyholders’ behalf into local financial markets and infrastructure projects. Our agents are often the very first point of contact that people have with financial products and it is the scale, reach and quality of our distribution that provides the mechanism to create these long-term investments. The scale of the role AIA plays in our local markets is important, clear and unmatched.
In common with all retail financial services providers, AIA’s local businesses across the region are subject to statutory regulation. We continue to play a proactive role, especially in emerging markets, in advising and working with governments to develop effective regulatory frameworks. Since the global financial crisis of 2008, governments have focused attention on the refinement of regulatory and capital adequacy requirements that promote systematic management of risk, both within local markets and in cross-border and global operations. AIA cooperates fully and proactively in the development of these arrangements, emphasising at all times that any new measures must be specific and proportionate to the risks in question, and taking into account not only the direct impact but also any indirect effects that could lead to unintended consequences.
It is important to note that there is a fundamental difference between banking and insurance. Whereas globalisation of banking activities may on occasion give rise to systemic exposures, pure retail life insurance businesses such as AIA maintain high levels of liquidity and engage predominantly in traditional long-term life insurance product underwriting and asset-liability matched investment activity. We have minimal engagement in non-traditional, non-insurance activities. The assets supporting liabilities are effectively matched within each territory, making geographical diversification a source of financial strength.

OVERVIEW
ANNUAL REPORT 2015 | 019
OV
ER
VIE
WF
INA
NC
IAL
AN
D O
PE
RA
TIN
G R
EV
IEW
CO
RP
OR
AT
E G
OV
ER
NA
NC
EF
INA
NC
IAL
STA
TE
ME
NT
SA
DD
ITIO
NA
L I
NF
OR
MA
TIO
N
Mr. Mark Edward Tucker Group Chief Executive and President
OVERVIEW
| AIA GROUP LIMITED020
AIA sees it as very important that due regard is paid to this fundamental distinction. Any attempt to apply a ‘one size fits all’ approach to banking and life insurance will result in increased costs to end-customers and a potential reduction in the portfolio of products that insurers are able to offer within realistic constraints on the use of capital. This would be to the detriment of the consumer and society as a whole and the economic development of the region, especially in the region’s emerging markets where the need is most acute.
2015 PERFORMANCE HIGHLIGHTS (ON A CONSTANT EXCHANGE RATE BASIS)The strong 26 per cent growth in VONB and 16 per cent increase in OPAT were achieved against a sometimes volatile global capital market backdrop. They demonstrate the soundness of AIA’s approach of focusing on and optimising value rather than concentrating on either market share or profit margin in isolation. Each of our geographical market segments, except for Korea, delivered double-digit VONB growth compared with 2014.
Our operations in China achieved outstanding results increasing VONB by 45 per cent, driven by a combination of growth in active agent numbers, increased agent productivity levels and a high-quality product mix. Our focus on regular premium protection and long-term savings business and the consistent execution of our Premier Agency strategy differentiate the quality of AIA’s earnings, and enable us to access the substantial long-term growth opportunities available in the Chinese life insurance market.
Hong Kong and Singapore achieved very strong VONB growth of 32 per cent and 24 per cent respectively. VONB of our Thailand operation continued the positive growth momentum established in the first half of the year driven by further margin expansion. Malaysia achieved excellent VONB growth as a result of higher agent productivity based on strong ANP growth and our strategy of focusing on regular premium products with protection riders. Our Other Markets again produced a very strong performance with VONB growth of 32 per cent.
The financial position of all our businesses was robust and strong during the year, with our main operating company, AIA Co., having a solvency level of 428 per cent on the prudent HKICO basis at 30 November 2015. The financial strength ratings of AIA Co. were stable at AA- (S&P) / Aa3 (Moody’s).
The strength and diversity of our businesses across the region, and the tremendous opportunities for growth available to us, highlight the huge potential for AIA to continue future profitable expansion.
GROUP-WIDE OVERVIEWDISTRIBUTIONAIA pioneered the development of agency life insurance distribution in Asia almost a century ago and our agents continue to be at the heart of our business, accounting for 72 per cent of VONB. The disciplined execution of our Premier Agency strategy has continued to generate excellent and high-quality growth with VONB up by 25 per cent on a constant exchange rate basis compared with 2014. Other forms of distribution have a very valuable and important role to play, and partnership distribution represents a major competitive advantage for AIA. Our bancassurance, broker and direct marketing channels enhance the quality, breadth and scale of our multi-channel distribution platform by extending market reach and broadening our access to prospective customers across Asia. Our partnership distribution activity includes over 60 active and long-term bank distribution relationships across our markets. The continued nurturing of our existing partnership arrangements at both local business and Group levels resulted in a 29 per cent increase in VONB on a constant exchange rate basis compared with 2014.
Advances in technology that simplify communications between customers and our front-line staff are providing an opportunity to upgrade our service and further enhance the expertise of our agents. I have spoken in previous years about the major investment AIA is making in iPoS, our interactive point-of-sale system. The roll-out, expansion and further adaptation of iPoS and other technologies continues, including advanced immediate underwriting capabilities at time of proposal, simplifying our policy documentation and making our claims processes easier and faster for our customers.
As well as increasing our professionalism at point of sale, we have continued to invest in the training of agency management and the development of recruitment and training tools that improve agent productivity and effectiveness. The global standard for financial planners is the Million Dollar Round Table (MDRT) qualification, and AIA has the world’s largest number of registered members, with membership continuing to grow strongly across our businesses.
GROUP CHIEF EXECUTIVE AND PRESIDENT’S REPORT
OVERVIEW
ANNUAL REPORT 2015 | 021
OV
ER
VIE
WF
INA
NC
IAL
AN
D O
PE
RA
TIN
G R
EV
IEW
CO
RP
OR
AT
E G
OV
ER
NA
NC
EF
INA
NC
IAL
STA
TE
ME
NT
SA
DD
ITIO
NA
L I
NF
OR
MA
TIO
N
OUTLOOKAsian economies continue to be resilient even as volatility returns to global capital markets as a consequence of the beginning of US monetary policy normalisation, continuing concerns about the Eurozone and China’s economic transition towards slower but higher-quality growth.
The Asia-Pacific region is the most attractive market in the world for the life insurance industry. Short-term market volatility has little impact on our headroom for growth, particularly in emerging markets such as China, with the protection gap between the need for mortality and morbidity insurance and the levels of cover in place continuing to widen. The substantial long-term structural growth drivers of our markets remain fully intact. The consistent execution of our proven growth strategy and the resilience of AIA’s operating model will see us continue to build on our long and successful history in the region, providing high-quality products and services to our customers and generating further sustainable value for our shareholders. We remain positive and confident regarding the long-term prospects for the Group.
Mark Edward Tucker Group Chief Executive and President 25 February 2016
MARKETING AND PRODUCT INNOVATIONAIA’s The Real Life Company brand position is now well established across our markets. It reinforces our commitment to making a positive impact on our customers’ lives by supporting them through the uncertainties of life and helping them plan for the future. Alongside this, we have been developing our social media presence to gain better insights into customer needs. We have supported this by promoting our brand values through integrated television and print advertising and major outdoor events.
Major product developments in 2015 included the promotion of more flexible savings and protection products that meet changing personal needs, and a heightened emphasis across the region on the healthcare and wellness aspects of personal and family protection. AIA Vitality was launched in Hong Kong and the Philippines, joining our existing programmes in Australia and Singapore. AIA Vitality further differentiates AIA’s proposition to our customers by rewarding healthy lifestyle choices through our numerous AIA Vitality partnerships in these markets.
CORPORATE SOCIAL RESPONSIBILITY (CSR)Our core business directly promotes the financial security of our customers and the social well-being of the communities we serve. Our CSR programme supports this proposition by ensuring that, as The Real Life Company, we are able to contribute directly to support community priorities. Healthy Living is our main theme, and our efforts focus on raising awareness of the benefits of regular exercise and good eating habits on health and on a prolonged, active life. We are also proud of the progress of our five-year deal with Tottenham Hotspur Football Club and appreciate the energy and engagement they bring to our CSR programme through team appearances and youth training events.
ENGAGEMENT WITH PEOPLEAIA’s sustained year-on-year success would not be possible without the high levels of expertise, professionalism, commitment and care shown by employees and agents throughout the organisation. We have a distinctive culture that seeks to combine empowerment of local businesses with a shared commitment to delivering the Group’s core strategy, aligned with our purpose and consistent with our operating principles. Effective leadership and engagement are essential and in turn depend on a commitment by the Group to do everything possible to create opportunities for job satisfaction and personal development.
GROUP CHIEF EXECUTIVE AND PRESIDENT’S REPORT
| AIA GROUP LIMITED022
FINANCIAL ANDOPERATING REVIEW
Financial Review ..............................................................023
Business Review ..............................................................038
Risk Management ............................................................058
Regulatory Developments ................................................071
Our People .......................................................................072
Corporate Social Responsibility .......................................074
FINANCIAL AND OPERATING REVIEW
ANNUAL REPORT 2015 | 023
OV
ER
VIE
WF
INA
NC
IAL
AN
D O
PE
RA
TIN
G R
EV
IEW
CO
RP
OR
AT
E G
OV
ER
NA
NC
EF
INA
NC
IAL
STA
TE
ME
NT
SA
DD
ITIO
NA
L I
NF
OR
MA
TIO
N
AIA is the largest publicly listed pan-Asian life insurance group, with a presence across 18 markets in the Asia-Pacific region. We receive the vast majority of our premiums in local currencies and we closely match our local assets and liabilities to minimise the economic effects of foreign exchange movements. When reporting the Group’s consolidated figures, there is a currency translation effect as we report in US dollars. We have provided growth rates and commentaries on our operating performance on constant exchange rates unless otherwise stated, since this provides a clearer picture of the year-on-year performance of the underlying businesses during the recent period of foreign exchange volatility.
SUMMARYAIA has delivered excellent growth across all of our operating financial metrics with record new business profitability, significant growth in earnings and strong underlying free surplus generation. Our focus on achieving large-scale profitable growth, investing capital at attractive returns in quality new business and with increased capital efficiency, has once again enabled us to deliver a strong, broad-based financial performance and progressive shareholder dividends. We have delivered double-digit growth in value of new business (VONB), embedded value (EV) operating profit as well as IFRS operating profit after tax (OPAT) on both actual and constant exchange rates.
VONB grew by 26 per cent to US$2,198 million and OPAT increased by 16 per cent to US$3,209 million. EV operating profit increased by 17 per cent driven by strong new business growth and positive operating experience from our in-force portfolio. EV Equity was US$39,818 million with a strong operating performance partly offset by investment return variances, mainly due to mark-to-market movements from our equity investment portfolio, foreign exchange translation and the payment of shareholder dividends. Underlying free surplus generation increased by 10 per cent to US$3,719 million. The solvency ratio of AIA Co. was 428 per cent and has remained robust despite interest rate, equity market and currency volatility since IPO, demonstrating the strength and resilience of our capital position. Net remittances to the Group Corporate Centre increased by 28 per cent to US$2,195 million.
Reflecting these financial results and our confidence in the future of AIA, the Board of Directors has recommended an upward rebasing of the final dividend by 50 per cent to 51.00 Hong Kong cents per share subject to shareholders’ approval, bringing the total dividend for 2015 to 69.72 Hong Kong cents per share.
Our financial results in 2015 have once again highlighted AIA’s ability to deliver a strong and resilient performance throughout market cycles and demonstrate the benefits we derive from the quality and diversity of our sources of earnings. AIA is ideally placed to continue to deliver profitable new business growth and increasing returns to our shareholders.
FINANCIAL REVIEW
FINANCIAL AND OPERATING REVIEW
| AIA GROUP LIMITED02 4
FINANCIAL REVIEW
Mr. Garth Jones Group Chief Financial Officer
FINANCIAL AND OPERATING REVIEW
ANNUAL REPORT 2015 | 025
FINANCIAL REVIEW
OV
ER
VIE
WF
INA
NC
IAL
AN
D O
PE
RA
TIN
G R
EV
IEW
CO
RP
OR
AT
E G
OV
ER
NA
NC
EF
INA
NC
IAL
STA
TE
ME
NT
SA
DD
ITIO
NA
L I
NF
OR
MA
TIO
N
VALUE GROWTHVONB increased by 26 per cent compared with 2014 to US$2,198 million.
Each of our geographical market segments, except for Korea, delivered double-digit VONB growth compared with 2014. China delivered 45 per cent growth, Hong Kong and our Other Markets achieved 32 per cent growth and Malaysia and Singapore also delivered strong VONB growth of 27 per cent and 24 per cent respectively.
ANP was higher by 14 per cent to US$3,991 million, while VONB margin increased by 4.6 pps to 54.0 per cent driven by a positive shift in product and geographical mix.
EV operating profit grew by 17 per cent to US$5,068 million, again reflecting the strong growth in VONB and overall positive operating variances of US$248 million. Operating return on EV was 14 per cent for 2015.
EV Equity was US$39,818 million and EV was US$38,198 million at 30 November 2015. The increase was mainly driven by strong EV operating profit growth of 17 per cent offset by investment return variances, mainly due to mark-to-market movements on the equity investment portfolio, foreign exchange translation and the payment of shareholder dividends.
IFRS EARNINGSOPAT growth improved further on a strong first half performance and increased by 16 per cent to US$3,209 million compared with 2014. This excellent result was the result of strong underlying business growth and an improved overall operating margin.
AIA’s IFRS net profit definition includes mark-to-market movements from our equity portfolio. Equity markets declined significantly during the second half of 2015 compared with large gains reported previously in 2014. Consequently, IFRS net profit
decreased by 18 per cent to US$2,691 million mainly due to equity market losses of US$370 million in 2015 compared with equity market gains of US$508 million in 2014.
Shareholders’ allocated equity excludes the impact of fair value movements of debt securities that are classified as available for sale as well as foreign exchange translation and provides a better reflection of the underlying movements in shareholders’ equity over the year. Shareholders’ allocated equity increased by US$1,867 million to US$26,380 million at 30 November 2015 with the increase from net profit of US$2,691 million less the payment of shareholder dividends of US$814 million.
CAPITAL AND DIVIDENDSAt 30 November 2015, the total available capital for AIA Co., our main regulated entity, was US$6,761 million as measured under the HKICO basis. The solvency ratio for AIA Co. remained stable at 428 per cent of regulatory minimum capital required compared with 427 per cent at the end of November 2014. The stable solvency ratio was the result of strong retained earnings partially offset by mark-to-market movements on the investment portfolio and dividends to AIA Group Limited.
Our local businesses remitted US$2,195 million to the Group Corporate Centre in 2015, an increase of 28 per cent compared with 2014.
The Board of Directors has recommended an upward rebasing of the final dividend by 50 per cent to 51.00 Hong Kong cents per share subject to shareholders’ approval at the Company’s forthcoming AGM. This brings the total dividend for 2015 to 69.72 Hong Kong cents per share. The Board intends to maintain AIA’s established prudent, sustainable and progressive dividend policy from this higher base.
FINANCIAL AND OPERATING REVIEW
| AIA GROUP LIMITED026
FINANCIAL REVIEW
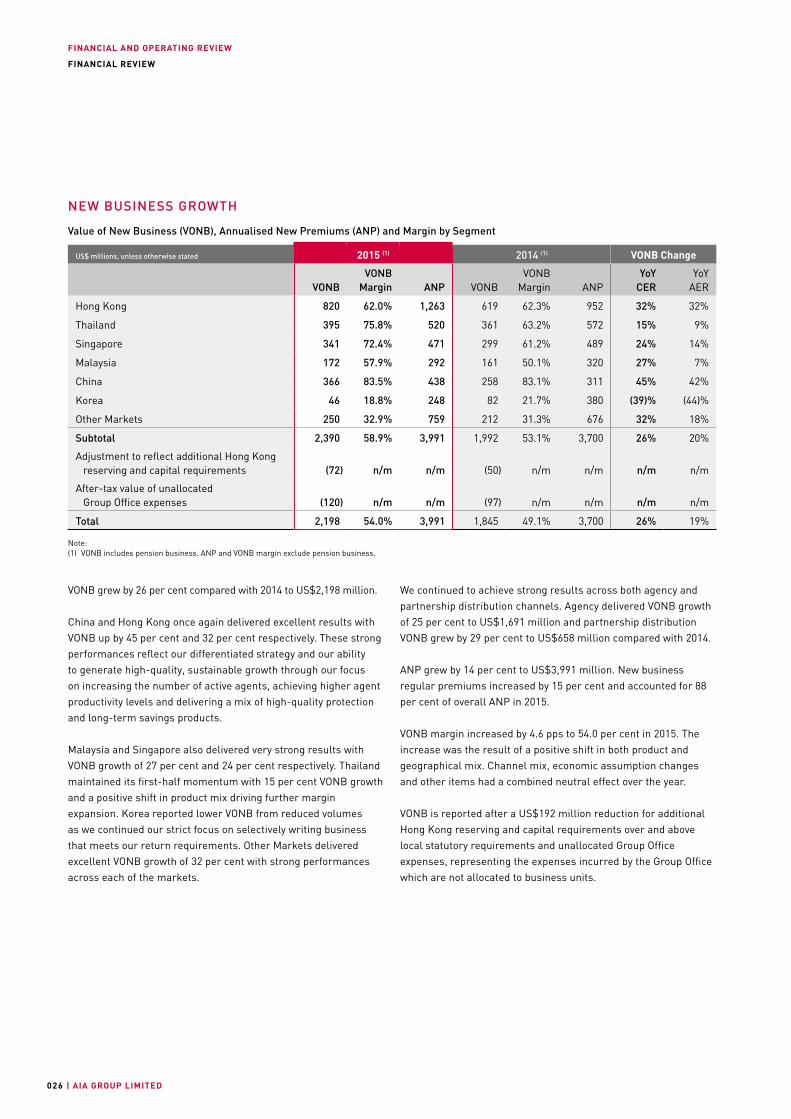
VONB grew by 26 per cent compared with 2014 to US$2,198 million.
China and Hong Kong once again delivered excellent results with VONB up by 45 per cent and 32 per cent respectively. These strong performances reflect our differentiated strategy and our ability to generate high-quality, sustainable growth through our focus on increasing the number of active agents, achieving higher agent productivity levels and delivering a mix of high-quality protection and long-term savings products.
Malaysia and Singapore also delivered very strong results with VONB growth of 27 per cent and 24 per cent respectively. Thailand maintained its first-half momentum with 15 per cent VONB growth and a positive shift in product mix driving further margin expansion. Korea reported lower VONB from reduced volumes as we continued our strict focus on selectively writing business that meets our return requirements. Other Markets delivered excellent VONB growth of 32 per cent with strong performances across each of the markets.
We continued to achieve strong results across both agency and partnership distribution channels. Agency delivered VONB growth of 25 per cent to US$1,691 million and partnership distribution VONB grew by 29 per cent to US$658 million compared with 2014.
ANP grew by 14 per cent to US$3,991 million. New business regular premiums increased by 15 per cent and accounted for 88 per cent of overall ANP in 2015.
VONB margin increased by 4.6 pps to 54.0 per cent in 2015. The increase was the result of a positive shift in both product and geographical mix. Channel mix, economic assumption changes and other items had a combined neutral effect over the year.
VONB is reported after a US$192 million reduction for additional Hong Kong reserving and capital requirements over and above local statutory requirements and unallocated Group Office expenses, representing the expenses incurred by the Group Office which are not allocated to business units.
NEW BUSINESS GROWTH
Value of New Business (VONB), Annualised New Premiums (ANP) and Margin by Segment
US$ millions, unless otherwise stated 2015 (1) 2014 (1) VONB Change
VONBVONB
Margin ANP VONBVONB
Margin ANPYoY
CERYoY
AER
Hong Kong 820 62.0% 1,263 619 62.3% 952 32% 32%
Thailand 395 75.8% 520 361 63.2% 572 15% 9%
Singapore 341 72.4% 471 299 61.2% 489 24% 14%
Malaysia 172 57.9% 292 161 50.1% 320 27% 7%
China 366 83.5% 438 258 83.1% 311 45% 42%
Korea 46 18.8% 248 82 21.7% 380 (39)% (44)%
Other Markets 250 32.9% 759 212 31.3% 676 32% 18%
Subtotal 2,390 58.9% 3,991 1,992 53.1% 3,700 26% 20%
Adjustment to reflect additional Hong Kong reserving and capital requirements (72) n/m n/m (50) n/m n/m n/m n/m
After-tax value of unallocated Group Office expenses (120) n/m n/m (97) n/m n/m n/m n/m
Total 2,198 54.0% 3,991 1,845 49.1% 3,700 26% 19%
Note:(1) VONB includes pension business. ANP and VONB margin exclude pension business.
FINANCIAL AND OPERATING REVIEW
ANNUAL REPORT 2015 | 027
FINANCIAL REVIEW
OV
ER
VIE
WF
INA
NC
IAL
AN
D O
PE
RA
TIN
G R
EV
IEW
CO
RP
OR
AT
E G
OV
ER
NA
NC
EF
INA
NC
IAL
STA
TE
ME
NT
SA
DD
ITIO
NA
L I
NF
OR
MA
TIO
N
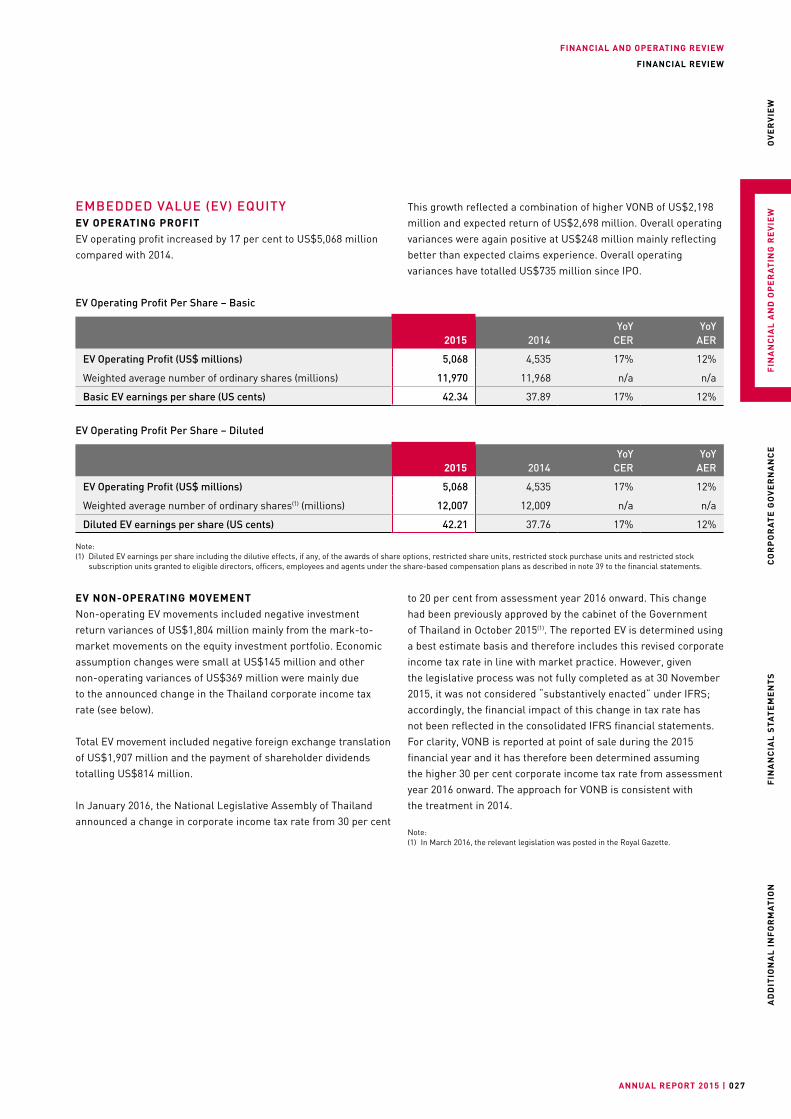
EMBEDDED VALUE (EV) EQUITYEV OPERATING PROFITEV operating profit increased by 17 per cent to US$5,068 million compared with 2014.
EV Operating Profit Per Share – Basic
2015 2014 YoY
CER YoY
AER
EV Operating Profit (US$ millions) 5,068 4,535 17% 12%
Weighted average number of ordinary shares (millions) 11,970 11,968 n/a n/a
Basic EV earnings per share (US cents) 42.34 37.89 17% 12%
EV Operating Profit Per Share – Diluted
2015 2014 YoY
CER YoY
AER
EV Operating Profit (US$ millions) 5,068 4,535 17% 12%
Weighted average number of ordinary shares(1) (millions) 12,007 12,009 n/a n/a
Diluted EV earnings per share (US cents) 42.21 37.76 17% 12%
Note:(1) Diluted EV earnings per share including the dilutive effects, if any, of the awards of share options, restricted share units, restricted stock purchase units and restricted stock
subscription units granted to eligible directors, officers, employees and agents under the share-based compensation plans as described in note 39 to the financial statements.
EV NON-OPERATING MOVEMENTNon-operating EV movements included negative investment return variances of US$1,804 million mainly from the mark-to-market movements on the equity investment portfolio. Economic assumption changes were small at US$145 million and other non-operating variances of US$369 million were mainly due to the announced change in the Thailand corporate income tax rate (see below).
Total EV movement included negative foreign exchange translation of US$1,907 million and the payment of shareholder dividends totalling US$814 million.
In January 2016, the National Legislative Assembly of Thailand announced a change in corporate income tax rate from 30 per cent
This growth reflected a combination of higher VONB of US$2,198 million and expected return of US$2,698 million. Overall operating variances were again positive at US$248 million mainly reflecting better than expected claims experience. Overall operating variances have totalled US$735 million since IPO.
to 20 per cent from assessment year 2016 onward. This change had been previously approved by the cabinet of the Government of Thailand in October 2015(1). The reported EV is determined using a best estimate basis and therefore includes this revised corporate income tax rate in line with market practice. However, given the legislative process was not fully completed as at 30 November 2015, it was not considered “substantively enacted” under IFRS; accordingly, the financial impact of this change in tax rate has not been reflected in the consolidated IFRS financial statements. For clarity, VONB is reported at point of sale during the 2015 financial year and it has therefore been determined assuming the higher 30 per cent corporate income tax rate from assessment year 2016 onward. The approach for VONB is consistent with the treatment in 2014.
Note:(1) In March 2016, the relevant legislation was posted in the Royal Gazette.
FINANCIAL AND OPERATING REVIEW
| AIA GROUP LIMITED028
FINANCIAL REVIEW
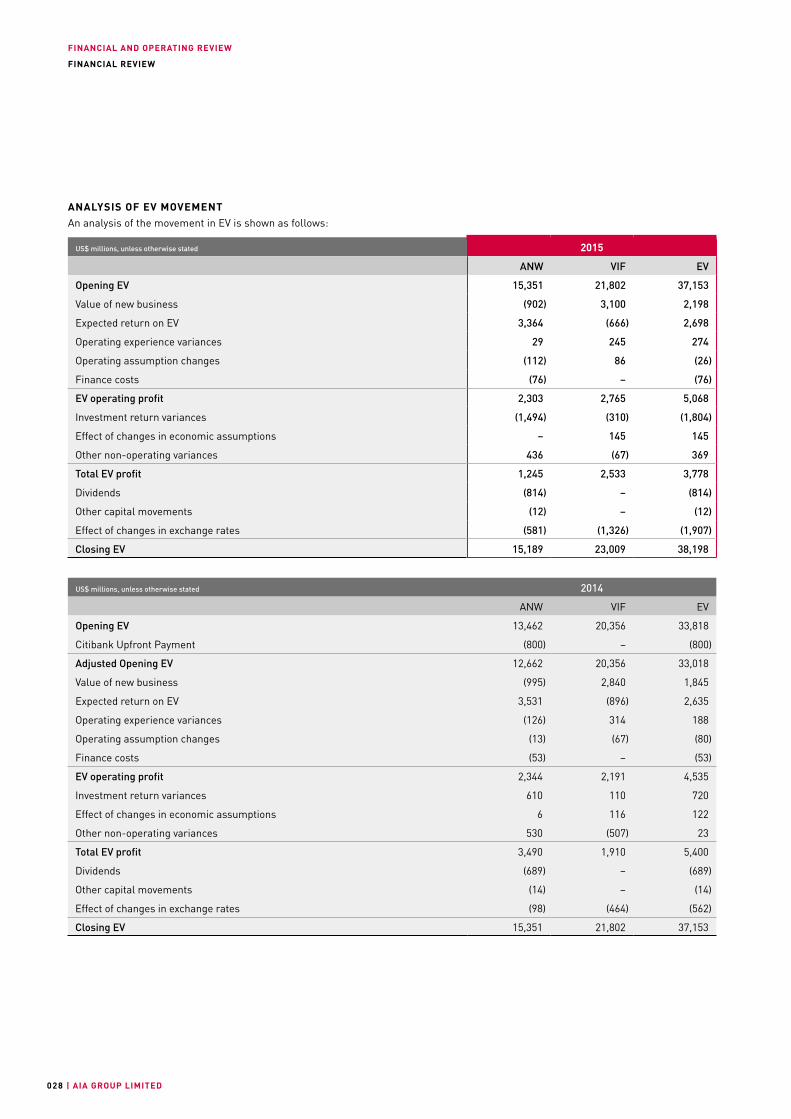
ANALYSIS OF EV MOVEMENTAn analysis of the movement in EV is shown as follows:
US$ millions, unless otherwise stated 2015
ANW VIF EV
Opening EV 15,351 21,802 37,153
Value of new business (902) 3,100 2,198
Expected return on EV 3,364 (666) 2,698
Operating experience variances 29 245 274
Operating assumption changes (112) 86 (26)
Finance costs (76) – (76)
EV operating profit 2,303 2,765 5,068
Investment return variances (1,494) (310) (1,804)
Effect of changes in economic assumptions – 145 145
Other non-operating variances 436 (67) 369
Total EV profit 1,245 2,533 3,778
Dividends (814) – (814)
Other capital movements (12) – (12)
Effect of changes in exchange rates (581) (1,326) (1,907)
Closing EV 15,189 23,009 38,198
US$ millions, unless otherwise stated 2014
ANW VIF EV
Opening EV 13,462 20,356 33,818
Citibank Upfront Payment (800) – (800)
Adjusted Opening EV 12,662 20,356 33,018
Value of new business (995) 2,840 1,845
Expected return on EV 3,531 (896) 2,635
Operating experience variances (126) 314 188
Operating assumption changes (13) (67) (80)
Finance costs (53) – (53)
EV operating profit 2,344 2,191 4,535
Investment return variances 610 110 720
Effect of changes in economic assumptions 6 116 122
Other non-operating variances 530 (507) 23
Total EV profit 3,490 1,910 5,400
Dividends (689) – (689)
Other capital movements (14) – (14)
Effect of changes in exchange rates (98) (464) (562)
Closing EV 15,351 21,802 37,153
FINANCIAL AND OPERATING REVIEW
ANNUAL REPORT 2015 | 029
FINANCIAL REVIEW
OV
ER
VIE
WF
INA
NC
IAL
AN
D O
PE
RA
TIN
G R
EV
IEW
CO
RP
OR
AT
E G
OV
ER
NA
NC
EF
INA
NC
IAL
STA
TE
ME
NT
SA
DD
ITIO
NA
L I
NF
OR
MA
TIO
N
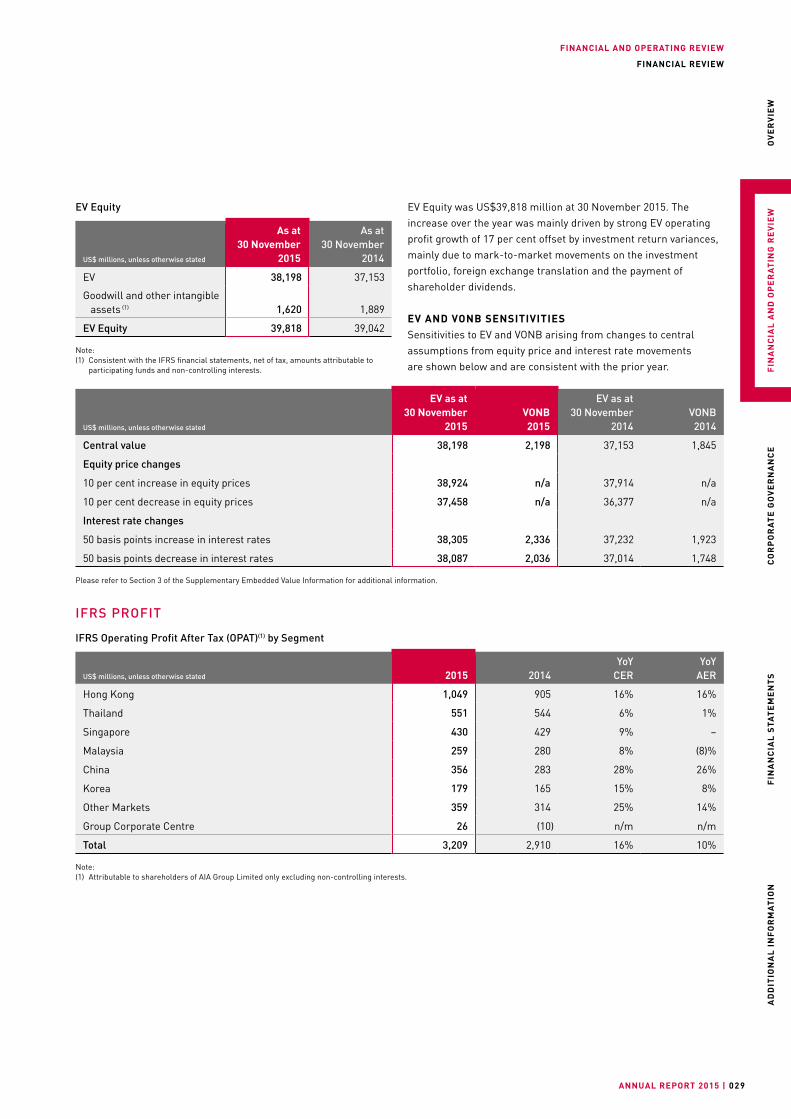
EV Equity
US$ millions, unless otherwise stated
As at 30 November
2015
As at 30 November
2014
EV 38,198 37,153
Goodwill and other intangible assets (1) 1,620 1,889
EV Equity 39,818 39,042
Note:(1) Consistent with the IFRS financial statements, net of tax, amounts attributable to
participating funds and non-controlling interests.
EV Equity was US$39,818 million at 30 November 2015. The increase over the year was mainly driven by strong EV operating profit growth of 17 per cent offset by investment return variances, mainly due to mark-to-market movements on the investment portfolio, foreign exchange translation and the payment of shareholder dividends.
EV AND VONB SENSITIVITIESSensitivities to EV and VONB arising from changes to central assumptions from equity price and interest rate movements are shown below and are consistent with the prior year.
US$ millions, unless otherwise stated
EV as at 30 November
2015
VONB 2015
EV as at 30 November
2014 VONB
2014
Central value 38,198 2,198 37,153 1,845
Equity price changes
10 per cent increase in equity prices 38,924 n/a 37,914 n/a
10 per cent decrease in equity prices 37,458 n/a 36,377 n/a
Interest rate changes
50 basis points increase in interest rates 38,305 2,336 37,232 1,923
50 basis points decrease in interest rates 38,087 2,036 37,014 1,748
Please refer to Section 3 of the Supplementary Embedded Value Information for additional information.
IFRS PROFIT
IFRS Operating Profit After Tax (OPAT)(1) by Segment
US$ millions, unless otherwise stated 2015 2014 YoY CER
YoY AER
Hong Kong 1,049 905 16% 16%
Thailand 551 544 6% 1%
Singapore 430 429 9% –
Malaysia 259 280 8% (8)%
China 356 283 28% 26%
Korea 179 165 15% 8%
Other Markets 359 314 25% 14%
Group Corporate Centre 26 (10) n/m n/m
Total 3,209 2,910 16% 10%
Note:(1) Attributable to shareholders of AIA Group Limited only excluding non-controlling interests.
FINANCIAL AND OPERATING REVIEW
| AIA GROUP LIMITED030
FINANCIAL REVIEW
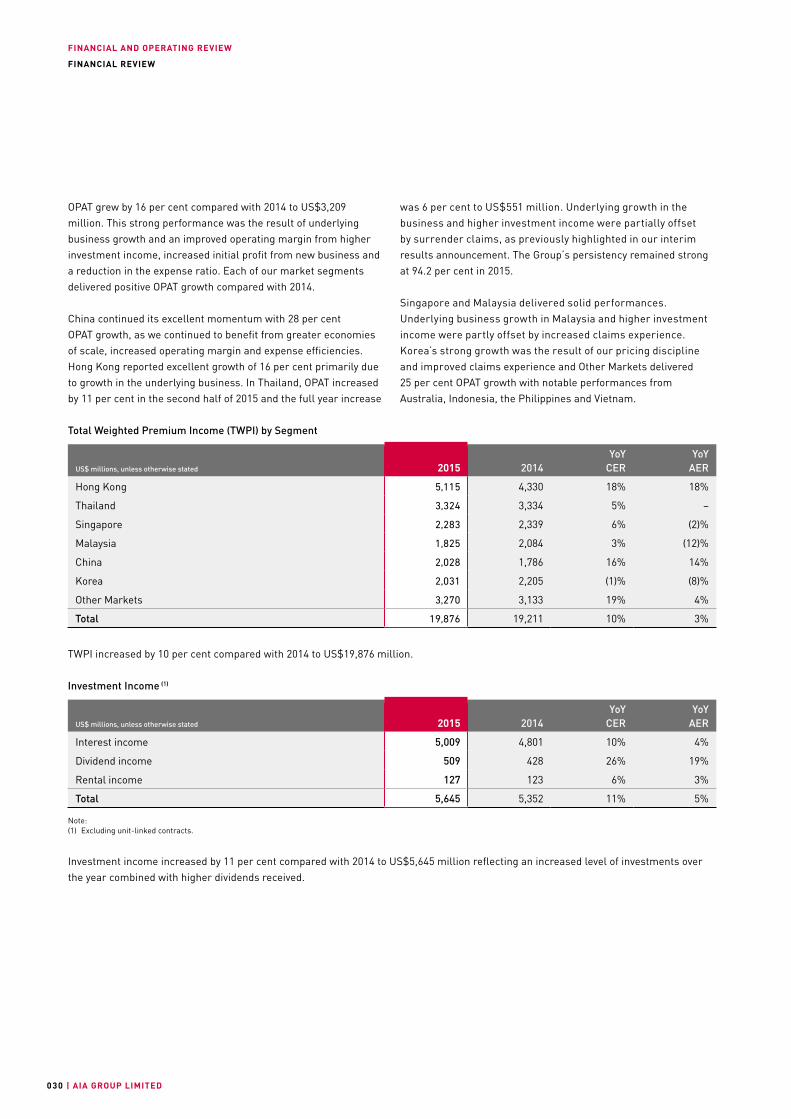
OPAT grew by 16 per cent compared with 2014 to US$3,209 million. This strong performance was the result of underlying business growth and an improved operating margin from higher investment income, increased initial profit from new business and a reduction in the expense ratio. Each of our market segments delivered positive OPAT growth compared with 2014.
China continued its excellent momentum with 28 per cent OPAT growth, as we continued to benefit from greater economies of scale, increased operating margin and expense efficiencies. Hong Kong reported excellent growth of 16 per cent primarily due to growth in the underlying business. In Thailand, OPAT increased by 11 per cent in the second half of 2015 and the full year increase
Total Weighted Premium Income (TWPI) by Segment
US$ millions, unless otherwise stated 2015 2014 YoY CER
YoY AER
Hong Kong 5,115 4,330 18% 18%
Thailand 3,324 3,334 5% –
Singapore 2,283 2,339 6% (2)%
Malaysia 1,825 2,084 3% (12)%
China 2,028 1,786 16% 14%
Korea 2,031 2,205 (1)% (8)%
Other Markets 3,270 3,133 19% 4%
Total 19,876 19,211 10% 3%
TWPI increased by 10 per cent compared with 2014 to US$19,876 million.
Investment Income (1)
US$ millions, unless otherwise stated 2015 2014 YoY CER
YoY AER
Interest income 5,009 4,801 10% 4%
Dividend income 509 428 26% 19%
Rental income 127 123 6% 3%
Total 5,645 5,352 11% 5%
Note:(1) Excluding unit-linked contracts.
Investment income increased by 11 per cent compared with 2014 to US$5,645 million reflecting an increased level of investments over the year combined with higher dividends received.
was 6 per cent to US$551 million. Underlying growth in the business and higher investment income were partially offset by surrender claims, as previously highlighted in our interim results announcement. The Group’s persistency remained strong at 94.2 per cent in 2015.
Singapore and Malaysia delivered solid performances. Underlying business growth in Malaysia and higher investment income were partly offset by increased claims experience. Korea’s strong growth was the result of our pricing discipline and improved claims experience and Other Markets delivered 25 per cent OPAT growth with notable performances from Australia, Indonesia, the Philippines and Vietnam.
FINANCIAL AND OPERATING REVIEW
ANNUAL REPORT 2015 | 031
FINANCIAL REVIEW
OV
ER
VIE
WF
INA
NC
IAL
AN
D O
PE
RA
TIN
G R
EV
IEW
CO
RP
OR
AT
E G
OV
ER
NA
NC
EF
INA
NC
IAL
STA
TE
ME
NT
SA
DD
ITIO
NA
L I
NF
OR
MA
TIO
N
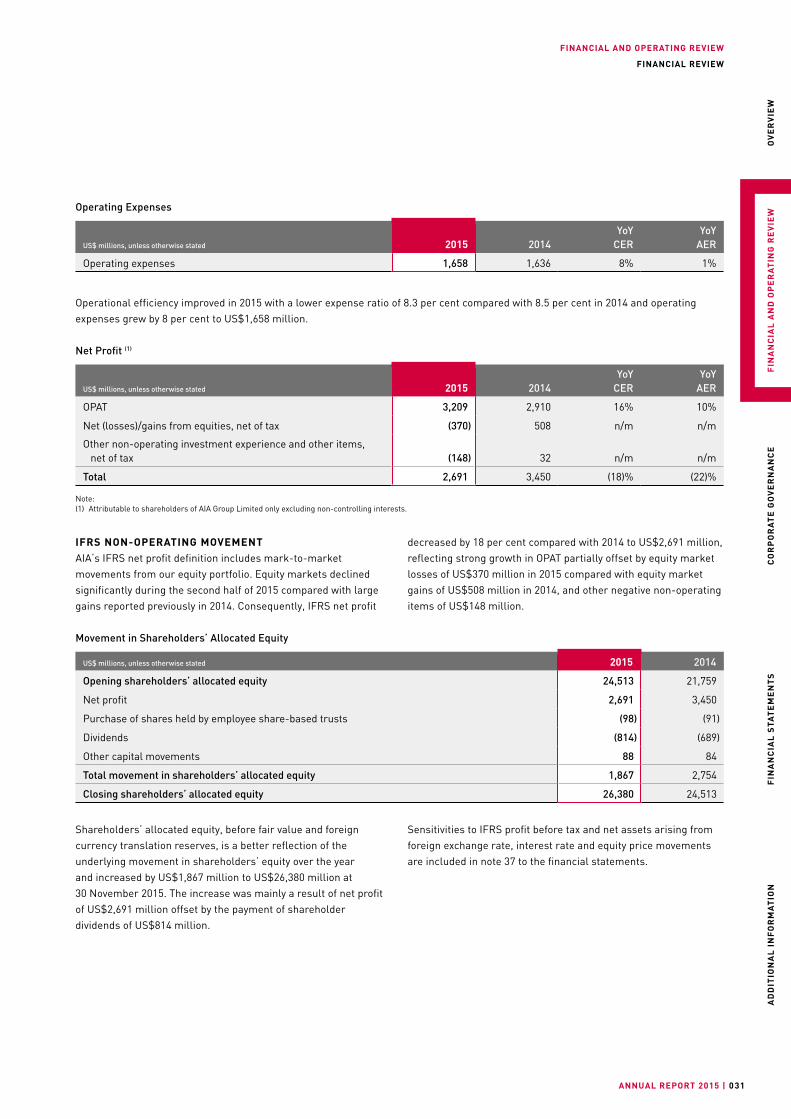
Operating Expenses
US$ millions, unless otherwise stated 2015 2014 YoY CER
YoY AER
Operating expenses 1,658 1,636 8% 1%
Operational efficiency improved in 2015 with a lower expense ratio of 8.3 per cent compared with 8.5 per cent in 2014 and operating expenses grew by 8 per cent to US$1,658 million.
Net Profit (1)
US$ millions, unless otherwise stated 2015 2014 YoY CER
YoY AER
OPAT 3,209 2,910 16% 10%
Net (losses)/gains from equities, net of tax (370) 508 n/m n/m
Other non-operating investment experience and other items, net of tax (148) 32 n/m n/m
Total 2,691 3,450 (18)% (22)%
Note:(1) Attributable to shareholders of AIA Group Limited only excluding non-controlling interests.
IFRS NON-OPERATING MOVEMENTAIA’s IFRS net profit definition includes mark-to-market movements from our equity portfolio. Equity markets declined significantly during the second half of 2015 compared with large gains reported previously in 2014. Consequently, IFRS net profit
decreased by 18 per cent compared with 2014 to US$2,691 million, reflecting strong growth in OPAT partially offset by equity market losses of US$370 million in 2015 compared with equity market gains of US$508 million in 2014, and other negative non-operating items of US$148 million.
Movement in Shareholders’ Allocated Equity
US$ millions, unless otherwise stated 2015 2014
Opening shareholders’ allocated equity 24,513 21,759
Net profit 2,691 3,450
Purchase of shares held by employee share-based trusts (98) (91)
Dividends (814) (689)
Other capital movements 88 84
Total movement in shareholders’ allocated equity 1,867 2,754
Closing shareholders’ allocated equity 26,380 24,513
Shareholders’ allocated equity, before fair value and foreign currency translation reserves, is a better reflection of the underlying movement in shareholders’ equity over the year and increased by US$1,867 million to US$26,380 million at 30 November 2015. The increase was mainly a result of net profit of US$2,691 million offset by the payment of shareholder dividends of US$814 million.
Sensitivities to IFRS profit before tax and net assets arising from foreign exchange rate, interest rate and equity price movements are included in note 37 to the financial statements.
FINANCIAL AND OPERATING REVIEW
| AIA GROUP LIMITED032
FINANCIAL REVIEW
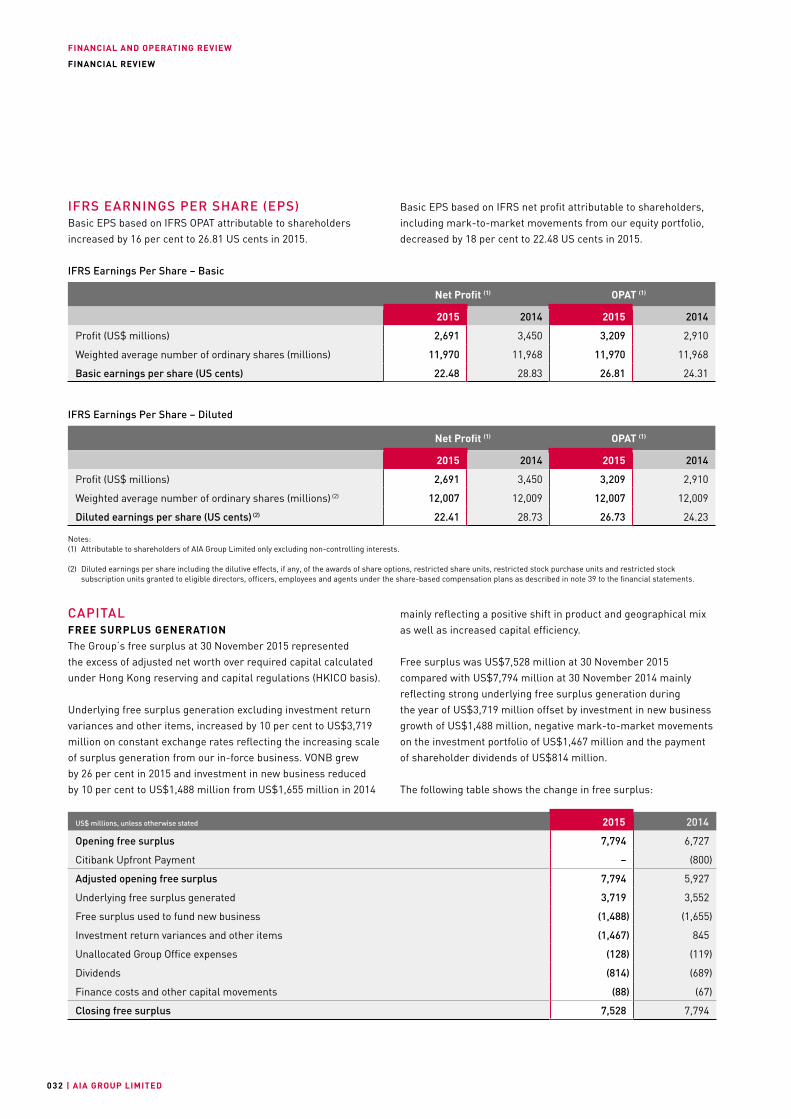
IFRS EARNINGS PER SHARE (EPS)Basic EPS based on IFRS OPAT attributable to shareholders increased by 16 per cent to 26.81 US cents in 2015.
Basic EPS based on IFRS net profit attributable to shareholders, including mark-to-market movements from our equity portfolio, decreased by 18 per cent to 22.48 US cents in 2015.
IFRS Earnings Per Share – Basic
Net Profit (1) OPAT (1)
2015 2014 2015 2014
Profit (US$ millions) 2,691 3,450 3,209 2,910
Weighted average number of ordinary shares (millions) 11,970 11,968 11,970 11,968
Basic earnings per share (US cents) 22.48 28.83 26.81 24.31
IFRS Earnings Per Share – Diluted
Net Profit (1) OPAT (1)
2015 2014 2015 2014
Profit (US$ millions) 2,691 3,450 3,209 2,910
Weighted average number of ordinary shares (millions) (2) 12,007 12,009 12,007 12,009
Diluted earnings per share (US cents) (2) 22.41 28.73 26.73 24.23
Notes:(1) Attributable to shareholders of AIA Group Limited only excluding non-controlling interests.
(2) Diluted earnings per share including the dilutive effects, if any, of the awards of share options, restricted share units, restricted stock purchase units and restricted stock subscription units granted to eligible directors, officers, employees and agents under the share-based compensation plans as described in note 39 to the financial statements.
CAPITALFREE SURPLUS GENERATIONThe Group’s free surplus at 30 November 2015 represented the excess of adjusted net worth over required capital calculated under Hong Kong reserving and capital regulations (HKICO basis).
Underlying free surplus generation excluding investment return variances and other items, increased by 10 per cent to US$3,719 million on constant exchange rates reflecting the increasing scale of surplus generation from our in-force business. VONB grew by 26 per cent in 2015 and investment in new business reduced by 10 per cent to US$1,488 million from US$1,655 million in 2014
mainly reflecting a positive shift in product and geographical mix as well as increased capital efficiency.
Free surplus was US$7,528 million at 30 November 2015 compared with US$7,794 million at 30 November 2014 mainly reflecting strong underlying free surplus generation during the year of US$3,719 million offset by investment in new business growth of US$1,488 million, negative mark-to-market movements on the investment portfolio of US$1,467 million and the payment of shareholder dividends of US$814 million.
The following table shows the change in free surplus:
US$ millions, unless otherwise stated 2015 2014
Opening free surplus 7,794 6,727
Citibank Upfront Payment – (800)
Adjusted opening free surplus 7,794 5,927
Underlying free surplus generated 3,719 3,552
Free surplus used to fund new business (1,488) (1,655)
Investment return variances and other items (1,467) 845
Unallocated Group Office expenses (128) (119)
Dividends (814) (689)
Finance costs and other capital movements (88) (67)
Closing free surplus 7,528 7,794
FINANCIAL AND OPERATING REVIEW
ANNUAL REPORT 2015 | 033
FINANCIAL REVIEW
OV
ER
VIE
WF
INA
NC
IAL
AN
D O
PE
RA
TIN
G R
EV
IEW
CO
RP
OR
AT
E G
OV
ER
NA
NC
EF
INA
NC
IAL
STA
TE
ME
NT
SA
DD
ITIO
NA
L I
NF
OR
MA
TIO
N
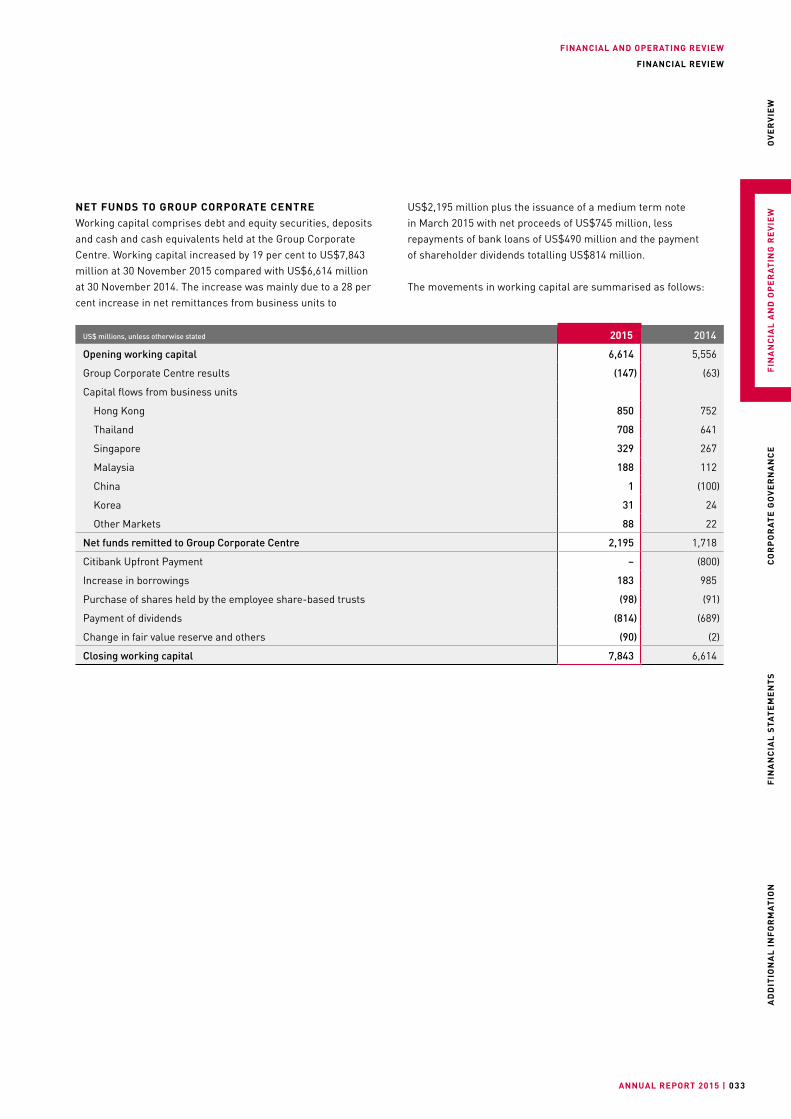
NET FUNDS TO GROUP CORPORATE CENTREWorking capital comprises debt and equity securities, deposits and cash and cash equivalents held at the Group Corporate Centre. Working capital increased by 19 per cent to US$7,843 million at 30 November 2015 compared with US$6,614 million at 30 November 2014. The increase was mainly due to a 28 per cent increase in net remittances from business units to
US$ millions, unless otherwise stated 2015 2014
Opening working capital 6,614 5,556
Group Corporate Centre results (147) (63)
Capital flows from business units
Hong Kong 850 752
Thailand 708 641
Singapore 329 267
Malaysia 188 112
China 1 (100)
Korea 31 24
Other Markets 88 22
Net funds remitted to Group Corporate Centre 2,195 1,718
Citibank Upfront Payment – (800)
Increase in borrowings 183 985
Purchase of shares held by the employee share-based trusts (98) (91)
Payment of dividends (814) (689)
Change in fair value reserve and others (90) (2)
Closing working capital 7,843 6,614
US$2,195 million plus the issuance of a medium term note in March 2015 with net proceeds of US$745 million, less repayments of bank loans of US$490 million and the payment of shareholder dividends totalling US$814 million.
The movements in working capital are summarised as follows:
FINANCIAL AND OPERATING REVIEW
| AIA GROUP LIMITED03 4
FINANCIAL REVIEW
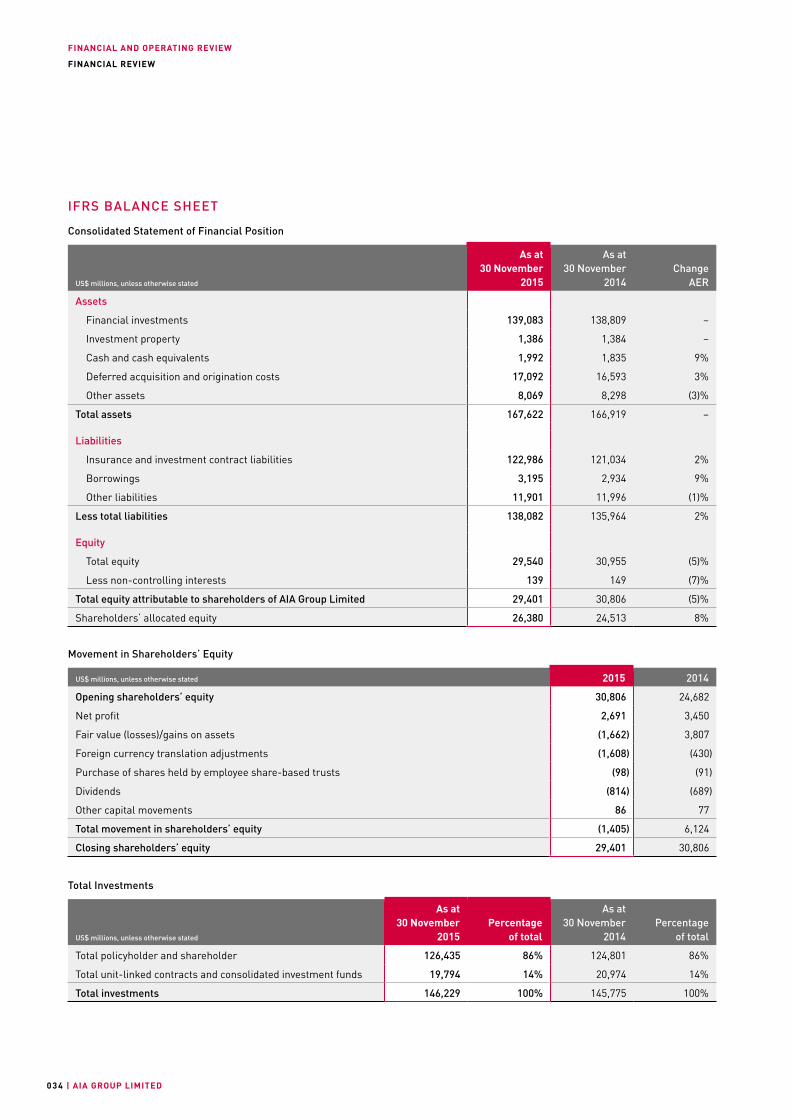
IFRS BALANCE SHEET
Consolidated Statement of Financial Position
US$ millions, unless otherwise stated
As at 30 November 2015
As at 30 November 2014
Change AER
Assets
Financial investments 139,083 138,809 –
Investment property 1,386 1,384 –
Cash and cash equivalents 1,992 1,835 9%
Deferred acquisition and origination costs 17,092 16,593 3%
Other assets 8,069 8,298 (3)%
Total assets 167,622 166,919 –
Liabilities
Insurance and investment contract liabilities 122,986 121,034 2%
Borrowings 3,195 2,934 9%
Other liabilities 11,901 11,996 (1)%
Less total liabilities 138,082 135,964 2%
Equity
Total equity 29,540 30,955 (5)%
Less non-controlling interests 139 149 (7)%
Total equity attributable to shareholders of AIA Group Limited 29,401 30,806 (5)%
Shareholders’ allocated equity 26,380 24,513 8%
Movement in Shareholders’ Equity
US$ millions, unless otherwise stated 2015 2014
Opening shareholders’ equity 30,806 24,682
Net profit 2,691 3,450
Fair value (losses)/gains on assets (1,662) 3,807
Foreign currency translation adjustments (1,608) (430)
Purchase of shares held by employee share-based trusts (98) (91)
Dividends (814) (689)
Other capital movements 86 77
Total movement in shareholders’ equity (1,405) 6,124
Closing shareholders’ equity 29,401 30,806
Total Investments
US$ millions, unless otherwise stated
As at 30 November
2015
Percentage
of total
As at 30 November
2014
Percentage
of total
Total policyholder and shareholder 126,435 86% 124,801 86%
Total unit-linked contracts and consolidated investment funds 19,794 14% 20,974 14%
Total investments 146,229 100% 145,775 100%
FINANCIAL AND OPERATING REVIEW
ANNUAL REPORT 2015 | 035
FINANCIAL REVIEW
OV
ER
VIE
WF
INA
NC
IAL
AN
D O
PE
RA
TIN
G R
EV
IEW
CO
RP
OR
AT
E G
OV
ER
NA
NC
EF
INA
NC
IAL
STA
TE
ME
NT
SA
DD
ITIO
NA
L I
NF
OR
MA
TIO
N
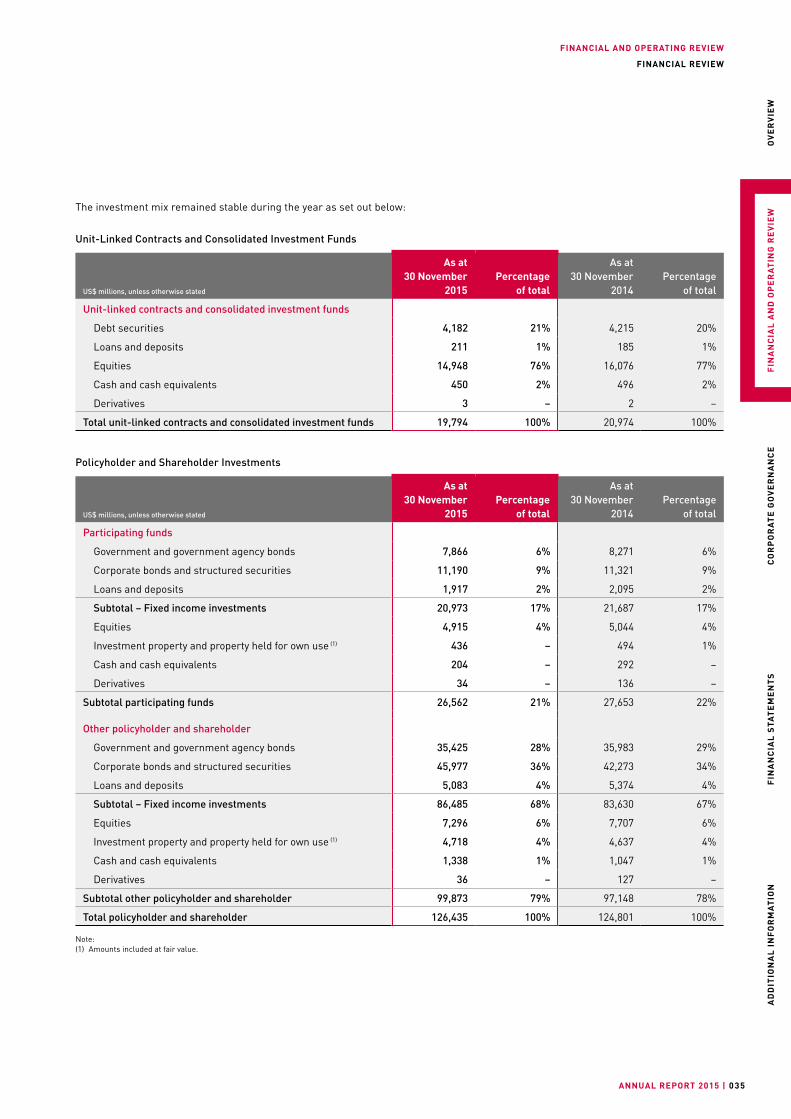
The investment mix remained stable during the year as set out below:
Unit-Linked Contracts and Consolidated Investment Funds
US$ millions, unless otherwise stated
As at 30 November
2015
Percentage
of total
As at 30 November
2014
Percentage
of total
Unit-linked contracts and consolidated investment funds
Debt securities 4,182 21% 4,215 20%
Loans and deposits 211 1% 185 1%
Equities 14,948 76% 16,076 77%
Cash and cash equivalents 450 2% 496 2%
Derivatives 3 – 2 –
Total unit-linked contracts and consolidated investment funds 19,794 100% 20,974 100%
Policyholder and Shareholder Investments
US$ millions, unless otherwise stated
As at 30 November
2015
Percentage
of total
As at 30 November
2014
Percentage
of total
Participating funds
Government and government agency bonds 7,866 6% 8,271 6%
Corporate bonds and structured securities 11,190 9% 11,321 9%
Loans and deposits 1,917 2% 2,095 2%
Subtotal – Fixed income investments 20,973 17% 21,687 17%
Equities 4,915 4% 5,044 4%
Investment property and property held for own use (1) 436 – 494 1%
Cash and cash equivalents 204 – 292 –
Derivatives 34 – 136 –
Subtotal participating funds 26,562 21% 27,653 22%
Other policyholder and shareholder
Government and government agency bonds 35,425 28% 35,983 29%
Corporate bonds and structured securities 45,977 36% 42,273 34%
Loans and deposits 5,083 4% 5,374 4%
Subtotal – Fixed income investments 86,485 68% 83,630 67%
Equities 7,296 6% 7,707 6%
Investment property and property held for own use (1) 4,718 4% 4,637 4%
Cash and cash equivalents 1,338 1% 1,047 1%
Derivatives 36 – 127 –
Subtotal other policyholder and shareholder 99,873 79% 97,148 78%
Total policyholder and shareholder 126,435 100% 124,801 100%
Note:(1) Amounts included at fair value.
FINANCIAL AND OPERATING REVIEW
| AIA GROUP LIMITED036
FINANCIAL REVIEW
ASSETSTotal assets of US$167,622 million at 30 November 2015 were stable compared with US$166,919 million at 30 November 2014, despite volatility in equity and foreign exchange markets over the year.
Total investments include financial investments, investment property, property held for own use, and cash and cash equivalents and remained at a similar level at US$146,229 million at 30 November 2015 compared with US$145,775 million at 30 November 2014.
Of the total US$146,229 million investments at 30 November 2015, 126,435 million are held in respect of policyholders and shareholders and the remaining US$19,794 million are backing unit-linked contracts and consolidated investment funds.
Fixed income investments, including debt securities, loans and term deposits that are held in respect of policyholders and shareholders, totalled US$107,458 million at 30 November 2015 compared with US$105,317 million at 30 November 2014. The average credit rating of the fixed income portfolio remained unchanged compared with the position at 30 November 2014.
Government and government agency bonds represented 40 per cent of fixed income investments at 30 November 2015 compared with 42 per cent at 30 November 2014. Corporate bonds and structured securities accounted for 53 per cent of fixed income investments at 30 November 2015 compared with 51 per cent at 30 November 2014.
Equity securities held in respect of policyholders and shareholders totalled US$12,211 million at 30 November 2015 compared with US$12,751 million at 30 November 2014. The 4 per cent decrease in carrying value was mainly attributable to recent equity market declines and negative foreign exchange translation. Within this figure, equity securities of US$4,915 million were held in participating funds.
Cash and cash equivalents increased by 9 per cent to US$1,992 million at 30 November 2015 compared with US$1,835 million at 30 November 2014. The increase largely reflected positive net
cash inflows from operating activities and proceeds from the issuance of a US$750 million medium term note in March 2015 partly offset by repayments of bank loans of US$490 million and the payment of shareholder dividends totalling US$814 million.
Investment property and property held for own use in respect of policyholders and shareholders totalled US$5,154 million at 30 November 2015 compared with US$5,131 million at 30 November 2014.
Deferred acquisition and origination costs increased to US$17,092 million at 30 November 2015 compared with US$16,593 million at 30 November 2014 largely reflecting new business growth.
LIABILITIESTotal liabilities increased to US$138,082 million at 30 November 2015 from US$135,964 million at 30 November 2014.
Insurance and investment contract liabilities grew to US$122,986 million at 30 November 2015 compared with US$121,034 million at 30 November 2014 reflecting the underlying growth of the in-force portfolio from new business partially offset by negative market movements on equity investments backing unit-linked and participating policies and foreign exchange translation.
Borrowings increased to US$3,195 million at 30 November 2015 due to the issuance of a US$750 million medium term note in March 2015 less the repayments of bank loans.
Other liabilities remained stable with US$11,901 million at 30 November 2015 compared with US$11,996 million at 30 November 2014.
Details of commitments and contingencies are included in note 42 to the financial statements.
FINANCIAL AND OPERATING REVIEW
ANNUAL REPORT 2015 | 037
FINANCIAL REVIEW
OV
ER
VIE
WF
INA
NC
IAL
AN
D O
PE
RA
TIN
G R
EV
IEW
CO
RP
OR
AT
E G
OV
ER
NA
NC
EF
INA
NC
IAL
STA
TE
ME
NT
SA
DD
ITIO
NA
L I
NF
OR
MA
TIO
N
REGULATORY CAPITALThe Group’s lead insurance regulator is the Hong Kong Office of the Commissioner of Insurance (HKOCI). The Group’s principal operating company is AIA Co., a Hong Kong-domiciled insurer.
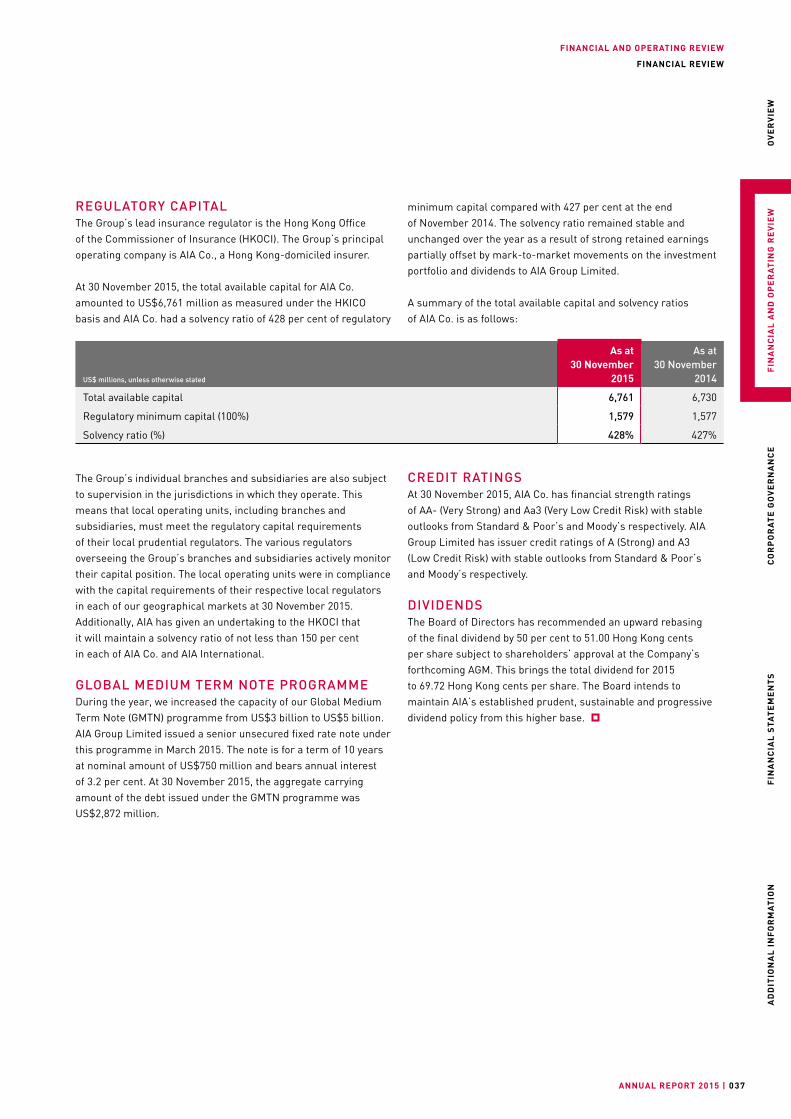
At 30 November 2015, the total available capital for AIA Co. amounted to US$6,761 million as measured under the HKICO basis and AIA Co. had a solvency ratio of 428 per cent of regulatory
minimum capital compared with 427 per cent at the end of November 2014. The solvency ratio remained stable and unchanged over the year as a result of strong retained earnings partially offset by mark-to-market movements on the investment portfolio and dividends to AIA Group Limited.
A summary of the total available capital and solvency ratios of AIA Co. is as follows:
US$ millions, unless otherwise stated
As at 30 November 2015
As at 30 November 2014
Total available capital 6,761 6,730
Regulatory minimum capital (100%) 1,579 1,577
Solvency ratio (%) 428% 427%
The Group’s individual branches and subsidiaries are also subject to supervision in the jurisdictions in which they operate. This means that local operating units, including branches and subsidiaries, must meet the regulatory capital requirements of their local prudential regulators. The various regulators overseeing the Group’s branches and subsidiaries actively monitor their capital position. The local operating units were in compliance with the capital requirements of their respective local regulators in each of our geographical markets at 30 November 2015. Additionally, AIA has given an undertaking to the HKOCI that it will maintain a solvency ratio of not less than 150 per cent in each of AIA Co. and AIA International.
GLOBAL MEDIUM TERM NOTE PROGRAMMEDuring the year, we increased the capacity of our Global Medium Term Note (GMTN) programme from US$3 billion to US$5 billion. AIA Group Limited issued a senior unsecured fixed rate note under this programme in March 2015. The note is for a term of 10 years at nominal amount of US$750 million and bears annual interest of 3.2 per cent. At 30 November 2015, the aggregate carrying amount of the debt issued under the GMTN programme was US$2,872 million.
CREDIT RATINGSAt 30 November 2015, AIA Co. has financial strength ratings of AA- (Very Strong) and Aa3 (Very Low Credit Risk) with stable outlooks from Standard & Poor’s and Moody’s respectively. AIA Group Limited has issuer credit ratings of A (Strong) and A3 (Low Credit Risk) with stable outlooks from Standard & Poor’s and Moody’s respectively.
DIVIDENDSThe Board of Directors has recommended an upward rebasing of the final dividend by 50 per cent to 51.00 Hong Kong cents per share subject to shareholders’ approval at the Company’s forthcoming AGM. This brings the total dividend for 2015 to 69.72 Hong Kong cents per share. The Board intends to maintain AIA’s established prudent, sustainable and progressive dividend policy from this higher base.
| AIA GROUP LIMITED038
BUSINESS REVIEW
Distribution ......................................................................039
Marketing ........................................................................041
Technology and Operations ..............................................042
Geographical Markets......................................................044
FINANCIAL AND OPERATING REVIEW
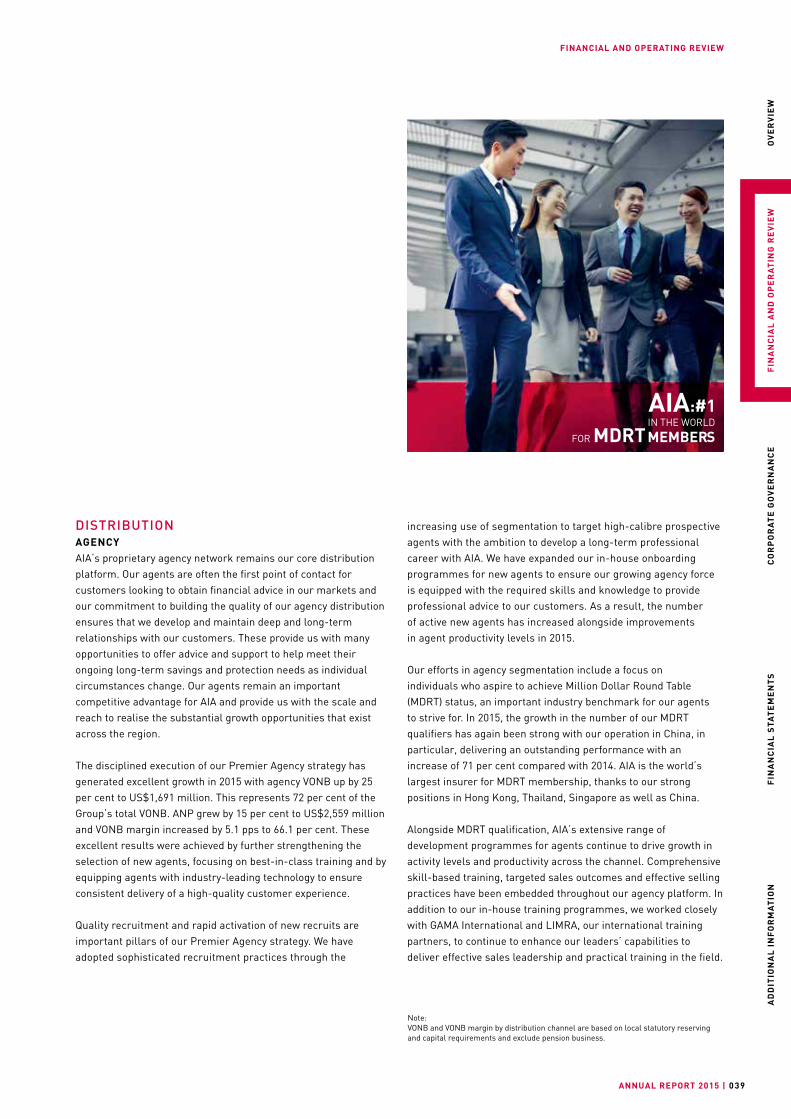
FINANCIAL AND OPERATING REVIEW
ANNUAL REPORT 2015 | 039
OV
ER
VIE
WF
INA
NC
IAL
AN
D O
PE
RA
TIN
G R
EV
IEW
CO
RP
OR
AT
E G
OV
ER
NA
NC
EF
INA
NC
IAL
STA
TE
ME
NT
SA
DD
ITIO
NA
L I
NF
OR
MA
TIO
N
DISTRIBUTIONAGENCYAIA’s proprietary agency network remains our core distribution platform. Our agents are often the first point of contact for customers looking to obtain financial advice in our markets and our commitment to building the quality of our agency distribution ensures that we develop and maintain deep and long-term relationships with our customers. These provide us with many opportunities to offer advice and support to help meet their ongoing long-term savings and protection needs as individual circumstances change. Our agents remain an important competitive advantage for AIA and provide us with the scale and reach to realise the substantial growth opportunities that exist across the region.
The disciplined execution of our Premier Agency strategy has generated excellent growth in 2015 with agency VONB up by 25 per cent to US$1,691 million. This represents 72 per cent of the Group’s total VONB. ANP grew by 15 per cent to US$2,559 million and VONB margin increased by 5.1 pps to 66.1 per cent. These excellent results were achieved by further strengthening the selection of new agents, focusing on best-in-class training and by equipping agents with industry-leading technology to ensure consistent delivery of a high-quality customer experience.
Quality recruitment and rapid activation of new recruits are important pillars of our Premier Agency strategy. We have adopted sophisticated recruitment practices through the
Note:VONB and VONB margin by distribution channel are based on local statutory reserving and capital requirements and exclude pension business.
increasing use of segmentation to target high-calibre prospective agents with the ambition to develop a long-term professional career with AIA. We have expanded our in-house onboarding programmes for new agents to ensure our growing agency force is equipped with the required skills and knowledge to provide professional advice to our customers. As a result, the number of active new agents has increased alongside improvements in agent productivity levels in 2015.
Our efforts in agency segmentation include a focus on individuals who aspire to achieve Million Dollar Round Table (MDRT) status, an important industry benchmark for our agents to strive for. In 2015, the growth in the number of our MDRT qualifiers has again been strong with our operation in China, in particular, delivering an outstanding performance with an increase of 71 per cent compared with 2014. AIA is the world’s largest insurer for MDRT membership, thanks to our strong positions in Hong Kong, Thailand, Singapore as well as China.
Alongside MDRT qualification, AIA’s extensive range of development programmes for agents continue to drive growth in activity levels and productivity across the channel. Comprehensive skill-based training, targeted sales outcomes and effective selling practices have been embedded throughout our agency platform. In addition to our in-house training programmes, we worked closely with GAMA International and LIMRA, our international training partners, to continue to enhance our leaders’ capabilities to deliver effective sales leadership and practical training in the field.
AIA:#1 IN THE WORLD
FOR MDRT MEMBERS
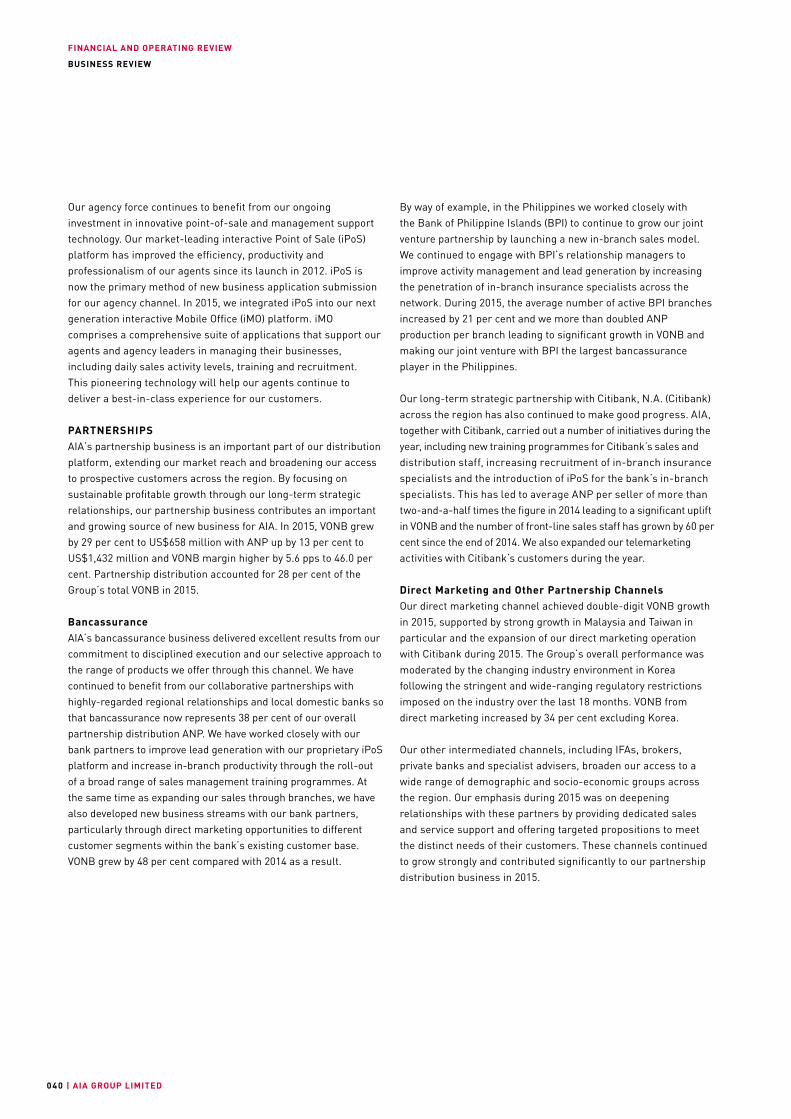
FINANCIAL AND OPERATING REVIEW
| AIA GROUP LIMITED040
BUSINESS REVIEW
Our agency force continues to benefit from our ongoing investment in innovative point-of-sale and management support technology. Our market-leading interactive Point of Sale (iPoS) platform has improved the efficiency, productivity and professionalism of our agents since its launch in 2012. iPoS is now the primary method of new business application submission for our agency channel. In 2015, we integrated iPoS into our next generation interactive Mobile Office (iMO) platform. iMO comprises a comprehensive suite of applications that support our agents and agency leaders in managing their businesses, including daily sales activity levels, training and recruitment. This pioneering technology will help our agents continue to deliver a best-in-class experience for our customers.
PARTNERSHIPSAIA’s partnership business is an important part of our distribution platform, extending our market reach and broadening our access to prospective customers across the region. By focusing on sustainable profitable growth through our long-term strategic relationships, our partnership business contributes an important and growing source of new business for AIA. In 2015, VONB grew by 29 per cent to US$658 million with ANP up by 13 per cent to US$1,432 million and VONB margin higher by 5.6 pps to 46.0 per cent. Partnership distribution accounted for 28 per cent of the Group’s total VONB in 2015.
BancassuranceAIA’s bancassurance business delivered excellent results from our commitment to disciplined execution and our selective approach to the range of products we offer through this channel. We have continued to benefit from our collaborative partnerships with highly-regarded regional relationships and local domestic banks so that bancassurance now represents 38 per cent of our overall partnership distribution ANP. We have worked closely with our bank partners to improve lead generation with our proprietary iPoS platform and increase in-branch productivity through the roll-out of a broad range of sales management training programmes. At the same time as expanding our sales through branches, we have also developed new business streams with our bank partners, particularly through direct marketing opportunities to different customer segments within the bank’s existing customer base. VONB grew by 48 per cent compared with 2014 as a result.
By way of example, in the Philippines we worked closely with the Bank of Philippine Islands (BPI) to continue to grow our joint venture partnership by launching a new in-branch sales model. We continued to engage with BPI’s relationship managers to improve activity management and lead generation by increasing the penetration of in-branch insurance specialists across the network. During 2015, the average number of active BPI branches increased by 21 per cent and we more than doubled ANP production per branch leading to significant growth in VONB and making our joint venture with BPI the largest bancassurance player in the Philippines.
Our long-term strategic partnership with Citibank, N.A. (Citibank) across the region has also continued to make good progress. AIA, together with Citibank, carried out a number of initiatives during the year, including new training programmes for Citibank’s sales and distribution staff, increasing recruitment of in-branch insurance specialists and the introduction of iPoS for the bank’s in-branch specialists. This has led to average ANP per seller of more than two-and-a-half times the figure in 2014 leading to a significant uplift in VONB and the number of front-line sales staff has grown by 60 per cent since the end of 2014. We also expanded our telemarketing activities with Citibank’s customers during the year.
Direct Marketing and Other Partnership ChannelsOur direct marketing channel achieved double-digit VONB growth in 2015, supported by strong growth in Malaysia and Taiwan in particular and the expansion of our direct marketing operation with Citibank during 2015. The Group’s overall performance was moderated by the changing industry environment in Korea following the stringent and wide-ranging regulatory restrictions imposed on the industry over the last 18 months. VONB from direct marketing increased by 34 per cent excluding Korea.
Our other intermediated channels, including IFAs, brokers, private banks and specialist advisers, broaden our access to a wide range of demographic and socio-economic groups across the region. Our emphasis during 2015 was on deepening relationships with these partners by providing dedicated sales and service support and offering targeted propositions to meet the distinct needs of their customers. These channels continued to grow strongly and contributed significantly to our partnership distribution business in 2015.
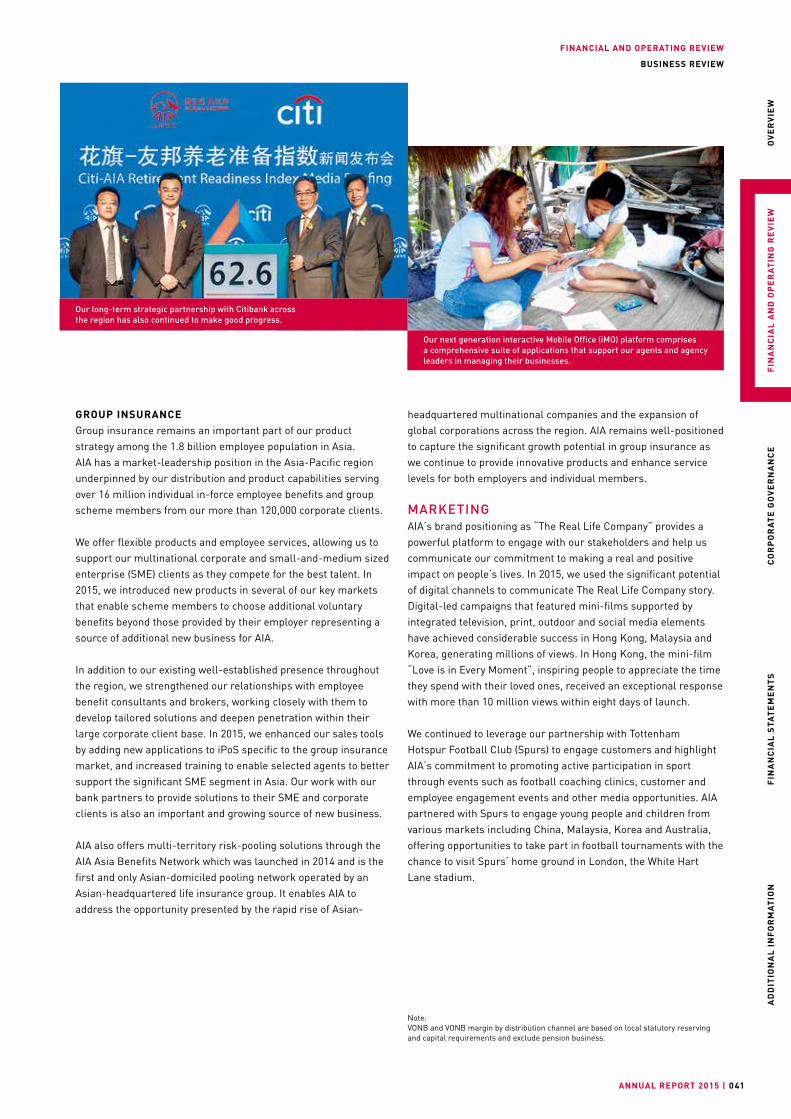
FINANCIAL AND OPERATING REVIEW
ANNUAL REPORT 2015 | 041
OV
ER
VIE
WF
INA
NC
IAL
AN
D O
PE
RA
TIN
G R
EV
IEW
CO
RP
OR
AT
E G
OV
ER
NA
NC
EF
INA
NC
IAL
STA
TE
ME
NT
SA
DD
ITIO
NA
L I
NF
OR
MA
TIO
N
BUSINESS REVIEW
GROUP INSURANCEGroup insurance remains an important part of our product strategy among the 1.8 billion employee population in Asia. AIA has a market-leadership position in the Asia-Pacific region underpinned by our distribution and product capabilities serving over 16 million individual in-force employee benefits and group scheme members from our more than 120,000 corporate clients.
We offer flexible products and employee services, allowing us to support our multinational corporate and small-and-medium sized enterprise (SME) clients as they compete for the best talent. In 2015, we introduced new products in several of our key markets that enable scheme members to choose additional voluntary benefits beyond those provided by their employer representing a source of additional new business for AIA.
In addition to our existing well-established presence throughout the region, we strengthened our relationships with employee benefit consultants and brokers, working closely with them to develop tailored solutions and deepen penetration within their large corporate client base. In 2015, we enhanced our sales tools by adding new applications to iPoS specific to the group insurance market, and increased training to enable selected agents to better support the significant SME segment in Asia. Our work with our bank partners to provide solutions to their SME and corporate clients is also an important and growing source of new business.
AIA also offers multi-territory risk-pooling solutions through the AIA Asia Benefits Network which was launched in 2014 and is the first and only Asian-domiciled pooling network operated by an Asian-headquartered life insurance group. It enables AIA to address the opportunity presented by the rapid rise of Asian-
headquartered multinational companies and the expansion of global corporations across the region. AIA remains well-positioned to capture the significant growth potential in group insurance as we continue to provide innovative products and enhance service levels for both employers and individual members.
MARKETINGAIA’s brand positioning as “The Real Life Company” provides a powerful platform to engage with our stakeholders and help us communicate our commitment to making a real and positive impact on people’s lives. In 2015, we used the significant potential of digital channels to communicate The Real Life Company story. Digital-led campaigns that featured mini-films supported by integrated television, print, outdoor and social media elements have achieved considerable success in Hong Kong, Malaysia and Korea, generating millions of views. In Hong Kong, the mini-film “Love is in Every Moment”, inspiring people to appreciate the time they spend with their loved ones, received an exceptional response with more than 10 million views within eight days of launch.
We continued to leverage our partnership with Tottenham Hotspur Football Club (Spurs) to engage customers and highlight AIA’s commitment to promoting active participation in sport through events such as football coaching clinics, customer and employee engagement events and other media opportunities. AIA partnered with Spurs to engage young people and children from various markets including China, Malaysia, Korea and Australia, offering opportunities to take part in football tournaments with the chance to visit Spurs’ home ground in London, the White Hart Lane stadium.
Our next generation interactive Mobile Office (iMO) platform comprises a comprehensive suite of applications that support our agents and agency leaders in managing their businesses.
Our long-term strategic partnership with Citibank across the region has also continued to make good progress.
Note:VONB and VONB margin by distribution channel are based on local statutory reserving and capital requirements and exclude pension business.
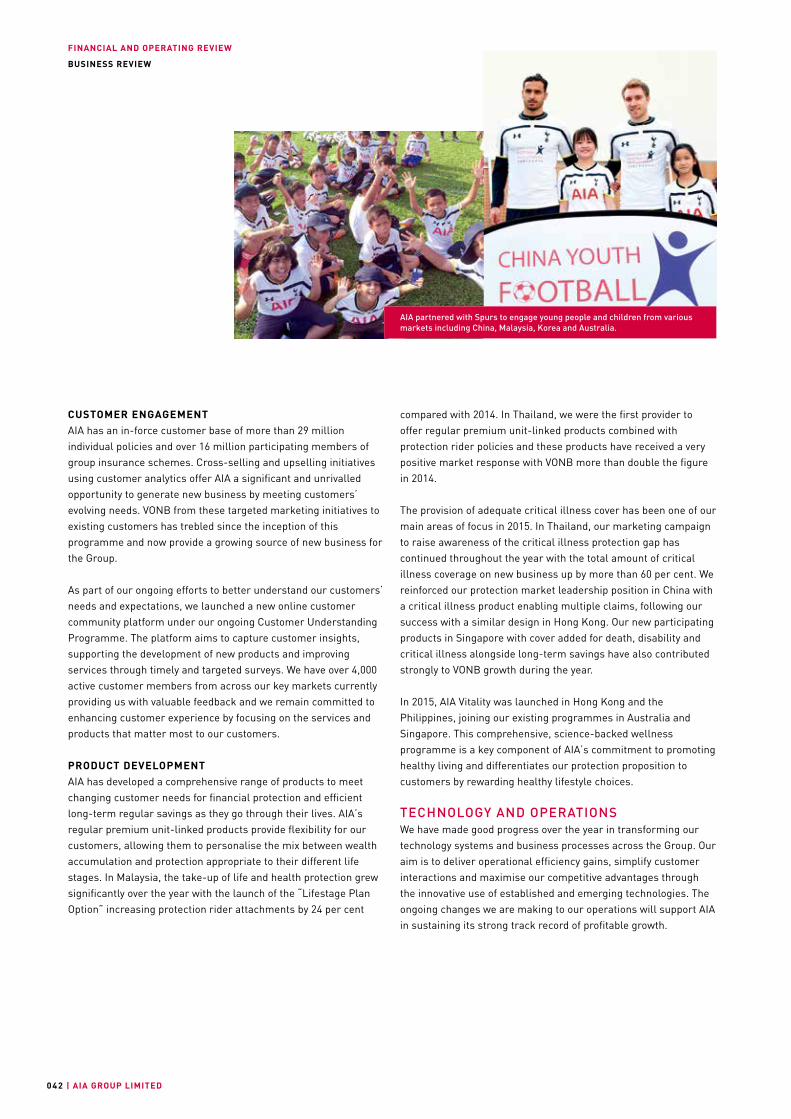
FINANCIAL AND OPERATING REVIEW
| AIA GROUP LIMITED042
BUSINESS REVIEW
CUSTOMER ENGAGEMENTAIA has an in-force customer base of more than 29 million individual policies and over 16 million participating members of group insurance schemes. Cross-selling and upselling initiatives using customer analytics offer AIA a significant and unrivalled opportunity to generate new business by meeting customers’ evolving needs. VONB from these targeted marketing initiatives to existing customers has trebled since the inception of this programme and now provide a growing source of new business for the Group.
As part of our ongoing efforts to better understand our customers’ needs and expectations, we launched a new online customer community platform under our ongoing Customer Understanding Programme. The platform aims to capture customer insights, supporting the development of new products and improving services through timely and targeted surveys. We have over 4,000 active customer members from across our key markets currently providing us with valuable feedback and we remain committed to enhancing customer experience by focusing on the services and products that matter most to our customers.
PRODUCT DEVELOPMENTAIA has developed a comprehensive range of products to meet changing customer needs for financial protection and efficient long-term regular savings as they go through their lives. AIA’s regular premium unit-linked products provide flexibility for our customers, allowing them to personalise the mix between wealth accumulation and protection appropriate to their different life stages. In Malaysia, the take-up of life and health protection grew significantly over the year with the launch of the “Lifestage Plan Option” increasing protection rider attachments by 24 per cent
compared with 2014. In Thailand, we were the first provider to offer regular premium unit-linked products combined with protection rider policies and these products have received a very positive market response with VONB more than double the figure in 2014.
The provision of adequate critical illness cover has been one of our main areas of focus in 2015. In Thailand, our marketing campaign to raise awareness of the critical illness protection gap has continued throughout the year with the total amount of critical illness coverage on new business up by more than 60 per cent. We reinforced our protection market leadership position in China with a critical illness product enabling multiple claims, following our success with a similar design in Hong Kong. Our new participating products in Singapore with cover added for death, disability and critical illness alongside long-term savings have also contributed strongly to VONB growth during the year.
In 2015, AIA Vitality was launched in Hong Kong and the Philippines, joining our existing programmes in Australia and Singapore. This comprehensive, science-backed wellness programme is a key component of AIA’s commitment to promoting healthy living and differentiates our protection proposition to customers by rewarding healthy lifestyle choices.
TECHNOLOGY AND OPERATIONSWe have made good progress over the year in transforming our technology systems and business processes across the Group. Our aim is to deliver operational efficiency gains, simplify customer interactions and maximise our competitive advantages through the innovative use of established and emerging technologies. The ongoing changes we are making to our operations will support AIA in sustaining its strong track record of profitable growth.
AIA partnered with Spurs to engage young people and children from various markets including China, Malaysia, Korea and Australia.
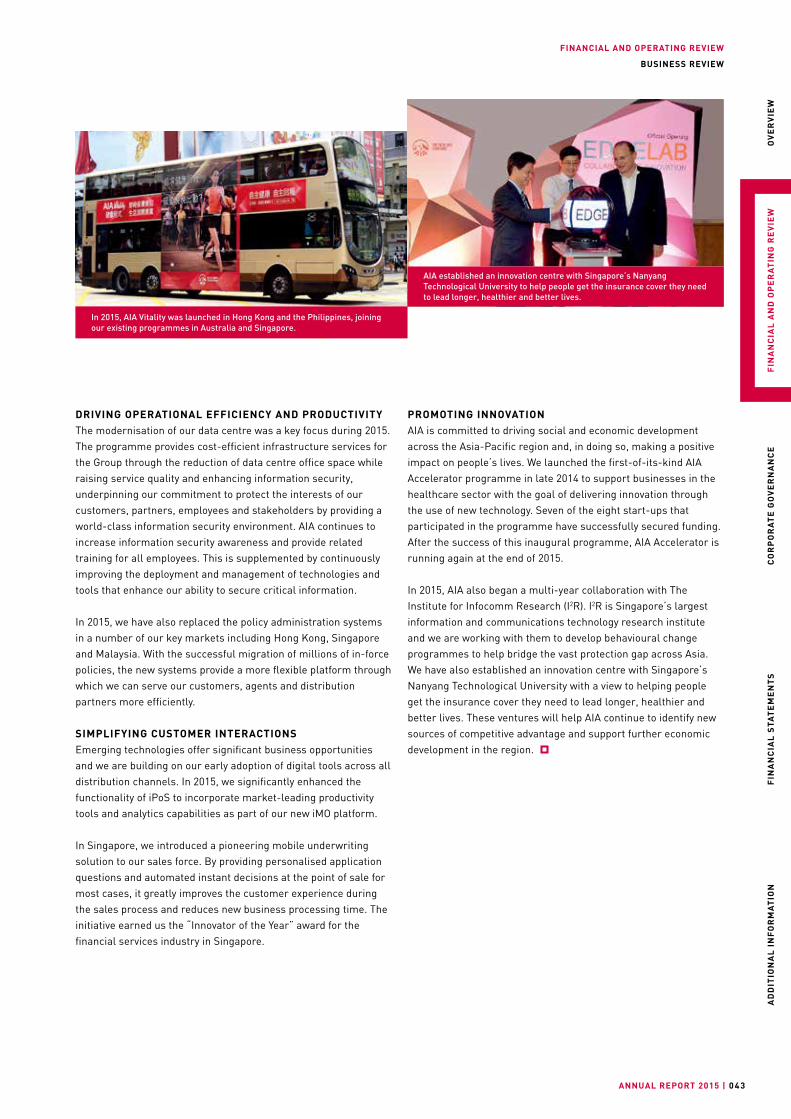
FINANCIAL AND OPERATING REVIEW
ANNUAL REPORT 2015 | 04 3
OV
ER
VIE
WF
INA
NC
IAL
AN
D O
PE
RA
TIN
G R
EV
IEW
CO
RP
OR
AT
E G
OV
ER
NA
NC
EF
INA
NC
IAL
STA
TE
ME
NT
SA
DD
ITIO
NA
L I
NF
OR
MA
TIO
N
BUSINESS REVIEW
PROMOTING INNOVATIONAIA is committed to driving social and economic development across the Asia-Pacific region and, in doing so, making a positive impact on people’s lives. We launched the first-of-its-kind AIA Accelerator programme in late 2014 to support businesses in the healthcare sector with the goal of delivering innovation through the use of new technology. Seven of the eight start-ups that participated in the programme have successfully secured funding. After the success of this inaugural programme, AIA Accelerator is running again at the end of 2015.
In 2015, AIA also began a multi-year collaboration with The Institute for Infocomm Research (I2R). I2R is Singapore’s largest information and communications technology research institute and we are working with them to develop behavioural change programmes to help bridge the vast protection gap across Asia. We have also established an innovation centre with Singapore’s Nanyang Technological University with a view to helping people get the insurance cover they need to lead longer, healthier and better lives. These ventures will help AIA continue to identify new sources of competitive advantage and support further economic development in the region.
DRIVING OPERATIONAL EFFICIENCY AND PRODUCTIVITYThe modernisation of our data centre was a key focus during 2015. The programme provides cost-efficient infrastructure services for the Group through the reduction of data centre office space while raising service quality and enhancing information security, underpinning our commitment to protect the interests of our customers, partners, employees and stakeholders by providing a world-class information security environment. AIA continues to increase information security awareness and provide related training for all employees. This is supplemented by continuously improving the deployment and management of technologies and tools that enhance our ability to secure critical information.
In 2015, we have also replaced the policy administration systems in a number of our key markets including Hong Kong, Singapore and Malaysia. With the successful migration of millions of in-force policies, the new systems provide a more flexible platform through which we can serve our customers, agents and distribution partners more efficiently.
SIMPLIFYING CUSTOMER INTERACTIONSEmerging technologies offer significant business opportunities and we are building on our early adoption of digital tools across all distribution channels. In 2015, we significantly enhanced the functionality of iPoS to incorporate market-leading productivity tools and analytics capabilities as part of our new iMO platform.
In Singapore, we introduced a pioneering mobile underwriting solution to our sales force. By providing personalised application questions and automated instant decisions at the point of sale for most cases, it greatly improves the customer experience during the sales process and reduces new business processing time. The initiative earned us the “Innovator of the Year” award for the financial services industry in Singapore.
In 2015, AIA Vitality was launched in Hong Kong and the Philippines, joining our existing programmes in Australia and Singapore.
AIA established an innovation centre with Singapore’s Nanyang Technological University to help people get the insurance cover they need to lead longer, healthier and better lives.

| AIA GROUP LIMITED04 4
REAL TIMELOVE IS IN EVERY MOMENT
Busy Hong Kong dad Marco Wong took his three year-old daughter Yuet on an 11-day bicycle tour around Taiwan in order to spend some quality time with her before she started kindergarten. Touched by this real-life story, AIA adapted it to demonstrate its own brand promise. A personal record of the journey, shown here, inspired a mini-film which became an internet and social media sensation before its extension to television, print and outdoor advertising platforms.
Scan for further information
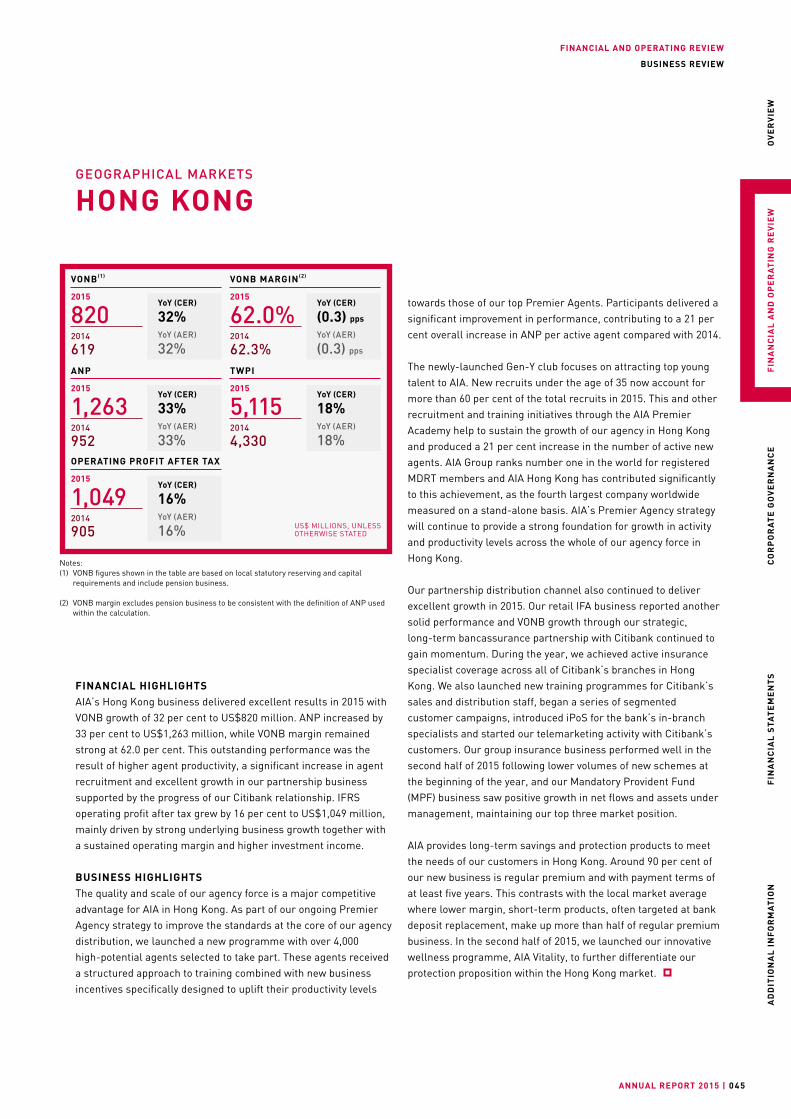
FINANCIAL AND OPERATING REVIEW
ANNUAL REPORT 2015 | 045
OV
ER
VIE
WF
INA
NC
IAL
AN
D O
PE
RA
TIN
G R
EV
IEW
CO
RP
OR
AT
E G
OV
ER
NA
NC
EF
INA
NC
IAL
STA
TE
ME
NT
SA
DD
ITIO
NA
L I
NF
OR
MA
TIO
N
BUSINESS REVIEW
GEOGRAPHICAL MARKETS
HONG KONG
FINANCIAL HIGHLIGHTSAIA’s Hong Kong business delivered excellent results in 2015 with VONB growth of 32 per cent to US$820 million. ANP increased by 33 per cent to US$1,263 million, while VONB margin remained strong at 62.0 per cent. This outstanding performance was the result of higher agent productivity, a significant increase in agent recruitment and excellent growth in our partnership business supported by the progress of our Citibank relationship. IFRS operating profit after tax grew by 16 per cent to US$1,049 million, mainly driven by strong underlying business growth together with a sustained operating margin and higher investment income.
BUSINESS HIGHLIGHTSThe quality and scale of our agency force is a major competitive advantage for AIA in Hong Kong. As part of our ongoing Premier Agency strategy to improve the standards at the core of our agency distribution, we launched a new programme with over 4,000 high-potential agents selected to take part. These agents received a structured approach to training combined with new business incentives specifically designed to uplift their productivity levels
towards those of our top Premier Agents. Participants delivered a significant improvement in performance, contributing to a 21 per cent overall increase in ANP per active agent compared with 2014.
The newly-launched Gen-Y club focuses on attracting top young talent to AIA. New recruits under the age of 35 now account for more than 60 per cent of the total recruits in 2015. This and other recruitment and training initiatives through the AIA Premier Academy help to sustain the growth of our agency in Hong Kong and produced a 21 per cent increase in the number of active new agents. AIA Group ranks number one in the world for registered MDRT members and AIA Hong Kong has contributed significantly to this achievement, as the fourth largest company worldwide measured on a stand-alone basis. AIA’s Premier Agency strategy will continue to provide a strong foundation for growth in activity and productivity levels across the whole of our agency force in Hong Kong.
Our partnership distribution channel also continued to deliver excellent growth in 2015. Our retail IFA business reported another solid performance and VONB growth through our strategic, long-term bancassurance partnership with Citibank continued to gain momentum. During the year, we achieved active insurance specialist coverage across all of Citibank’s branches in Hong Kong. We also launched new training programmes for Citibank’s sales and distribution staff, began a series of segmented customer campaigns, introduced iPoS for the bank’s in-branch specialists and started our telemarketing activity with Citibank’s customers. Our group insurance business performed well in the second half of 2015 following lower volumes of new schemes at the beginning of the year, and our Mandatory Provident Fund (MPF) business saw positive growth in net flows and assets under management, maintaining our top three market position.
AIA provides long-term savings and protection products to meet the needs of our customers in Hong Kong. Around 90 per cent of our new business is regular premium and with payment terms of at least five years. This contrasts with the local market average where lower margin, short-term products, often targeted at bank deposit replacement, make up more than half of regular premium business. In the second half of 2015, we launched our innovative wellness programme, AIA Vitality, to further differentiate our protection proposition within the Hong Kong market.
Notes:(1) VONB figures shown in the table are based on local statutory reserving and capital
requirements and include pension business.
(2) VONB margin excludes pension business to be consistent with the definition of ANP used within the calculation.
US$ MILLIONS, UNLESSOTHERWISE STATED
YoY (CER)
32%YoY (AER)
32%
VONB (1)
2015
8202014
619
YoY (CER)
33%YoY (AER)
33%
ANP
2015
1,2632014
952
YoY (CER)
16%YoY (AER)
16%
OPERATING PROFIT AFTER TAX
2015
1,0492014
905
YoY (CER)
(0.3) pps
YoY (AER)
(0.3) pps
VONB MARGIN (2)
2015
62.0%2014
62.3%
YoY (CER)
18%YoY (AER)
18%
TWPI
2015
5,1152014
4,330
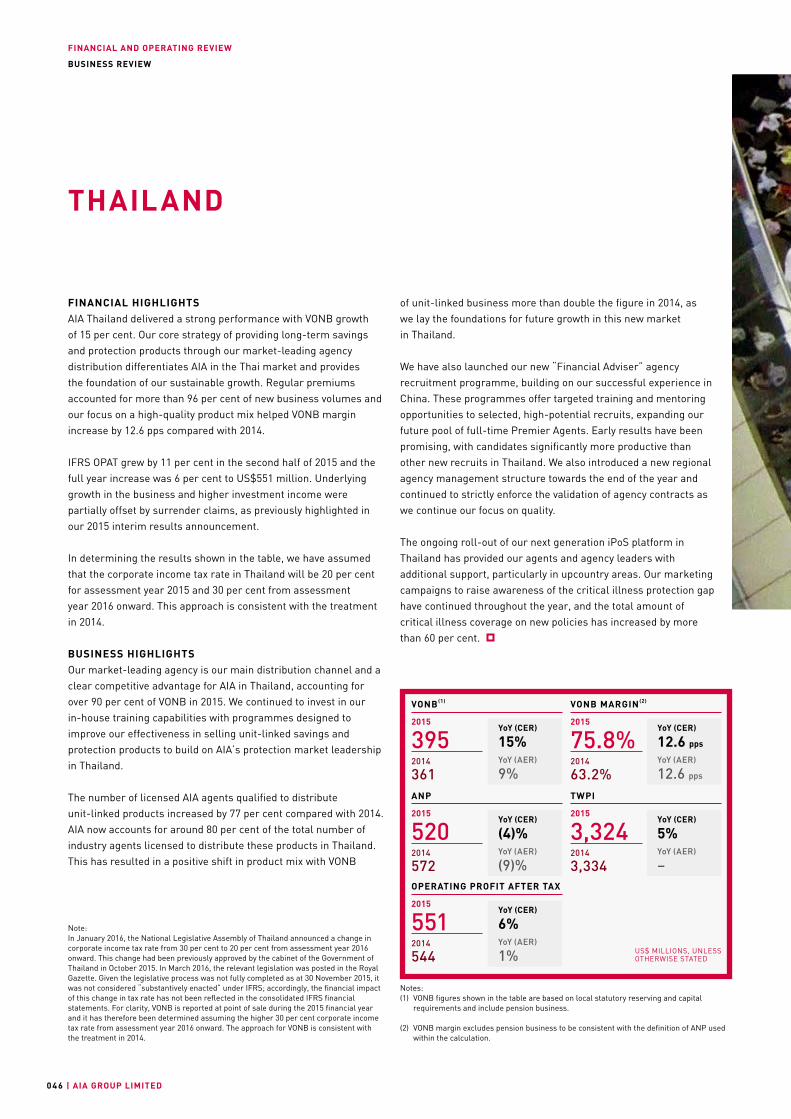
FINANCIAL AND OPERATING REVIEW
| AIA GROUP LIMITED04 6
BUSINESS REVIEW
FINANCIAL HIGHLIGHTSAIA Thailand delivered a strong performance with VONB growth of 15 per cent. Our core strategy of providing long-term savings and protection products through our market-leading agency distribution differentiates AIA in the Thai market and provides the foundation of our sustainable growth. Regular premiums accounted for more than 96 per cent of new business volumes and our focus on a high-quality product mix helped VONB margin increase by 12.6 pps compared with 2014.
IFRS OPAT grew by 11 per cent in the second half of 2015 and the full year increase was 6 per cent to US$551 million. Underlying growth in the business and higher investment income were partially offset by surrender claims, as previously highlighted in our 2015 interim results announcement.
In determining the results shown in the table, we have assumed that the corporate income tax rate in Thailand will be 20 per cent for assessment year 2015 and 30 per cent from assessment year 2016 onward. This approach is consistent with the treatment in 2014.
BUSINESS HIGHLIGHTSOur market-leading agency is our main distribution channel and a clear competitive advantage for AIA in Thailand, accounting for over 90 per cent of VONB in 2015. We continued to invest in our in-house training capabilities with programmes designed to improve our effectiveness in selling unit-linked savings and protection products to build on AIA’s protection market leadership in Thailand.
The number of licensed AIA agents qualified to distribute unit-linked products increased by 77 per cent compared with 2014. AIA now accounts for around 80 per cent of the total number of industry agents licensed to distribute these products in Thailand. This has resulted in a positive shift in product mix with VONB
THAILAND
of unit-linked business more than double the figure in 2014, as we lay the foundations for future growth in this new market in Thailand.
We have also launched our new “Financial Adviser” agency recruitment programme, building on our successful experience in China. These programmes offer targeted training and mentoring opportunities to selected, high-potential recruits, expanding our future pool of full-time Premier Agents. Early results have been promising, with candidates significantly more productive than other new recruits in Thailand. We also introduced a new regional agency management structure towards the end of the year and continued to strictly enforce the validation of agency contracts as we continue our focus on quality.
The ongoing roll-out of our next generation iPoS platform in Thailand has provided our agents and agency leaders with additional support, particularly in upcountry areas. Our marketing campaigns to raise awareness of the critical illness protection gap have continued throughout the year, and the total amount of critical illness coverage on new policies has increased by more than 60 per cent.
Note:In January 2016, the National Legislative Assembly of Thailand announced a change in corporate income tax rate from 30 per cent to 20 per cent from assessment year 2016 onward. This change had been previously approved by the cabinet of the Government of Thailand in October 2015. In March 2016, the relevant legislation was posted in the Royal Gazette. Given the legislative process was not fully completed as at 30 November 2015, it was not considered “substantively enacted” under IFRS; accordingly, the financial impact of this change in tax rate has not been reflected in the consolidated IFRS financial statements. For clarity, VONB is reported at point of sale during the 2015 financial year and it has therefore been determined assuming the higher 30 per cent corporate income tax rate from assessment year 2016 onward. The approach for VONB is consistent with the treatment in 2014.
Notes:(1) VONB figures shown in the table are based on local statutory reserving and capital
requirements and include pension business.
(2) VONB margin excludes pension business to be consistent with the definition of ANP used within the calculation.
US$ MILLIONS, UNLESSOTHERWISE STATED
YoY (CER)
15%YoY (AER)
9%
VONB (1)
2015
3952014
361
YoY (CER)
(4)%YoY (AER)
(9)%
ANP
2015
5202014
572
YoY (CER)
6%YoY (AER)
1%
OPERATING PROFIT AFTER TAX
2015
5512014
544
YoY (CER)
12.6 pps
YoY (AER)
12.6 pps
VONB MARGIN (2)
2015
75.8%2014
63.2%
YoY (CER)
5%YoY (AER)
–
TWPI
2015
3,3242014
3,334
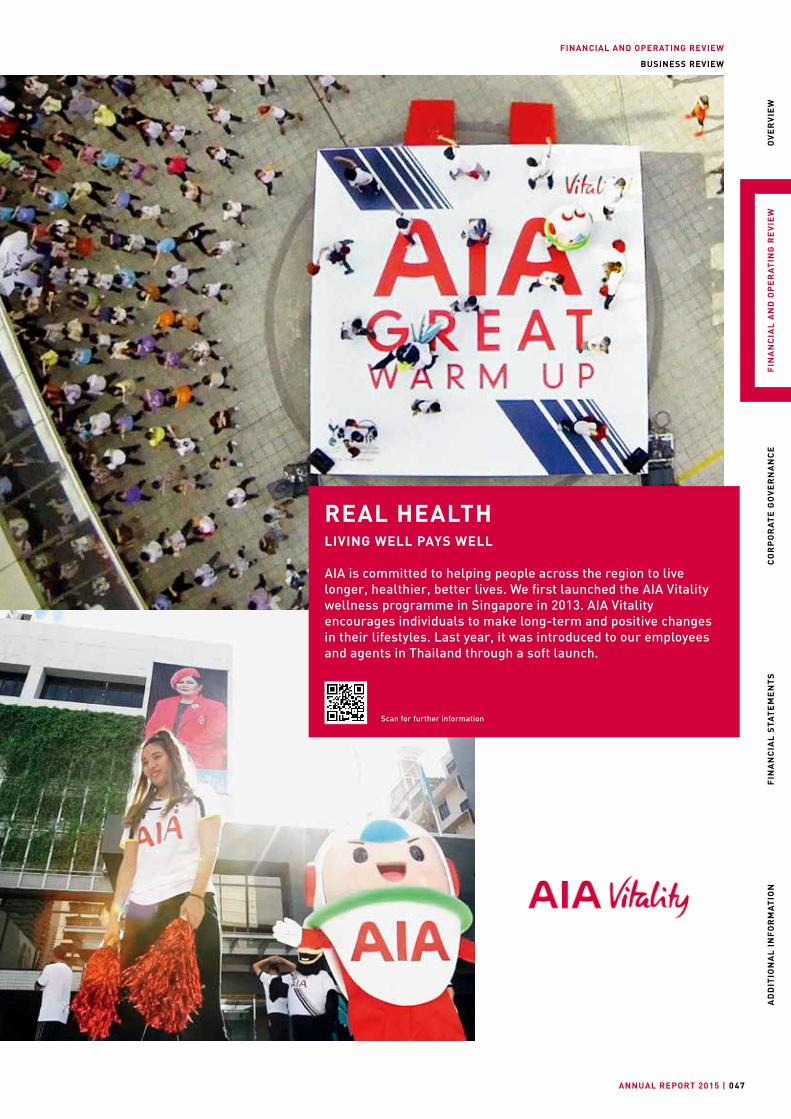
FINANCIAL AND OPERATING REVIEW
ANNUAL REPORT 2015 | 047
OV
ER
VIE
WF
INA
NC
IAL
AN
D O
PE
RA
TIN
G R
EV
IEW
CO
RP
OR
AT
E G
OV
ER
NA
NC
EF
INA
NC
IAL
STA
TE
ME
NT
SA
DD
ITIO
NA
L I
NF
OR
MA
TIO
N
BUSINESS REVIEW
REAL HEALTH LIVING WELL PAYS WELL
AIA is committed to helping people across the region to live longer, healthier, better lives. We first launched the AIA Vitality wellness programme in Singapore in 2013. AIA Vitality encourages individuals to make long-term and positive changes in their lifestyles. Last year, it was introduced to our employees and agents in Thailand through a soft launch.
Scan for further information

FINANCIAL AND OPERATING REVIEW
| AIA GROUP LIMITED04 8
BUSINESS REVIEW
REAL LOVEA SALUTE TO MOTHERS
AIA launched a video to highlight the real life challenges that families in Singapore face every day as part of The Real Love Never Stops campaign. A salute to mothers, who are often perceived as pillars of strength, the video highlights how mothers are often too hard on themselves, having to juggle between family, children and work for the benefit of their loved ones.
Scan for further information
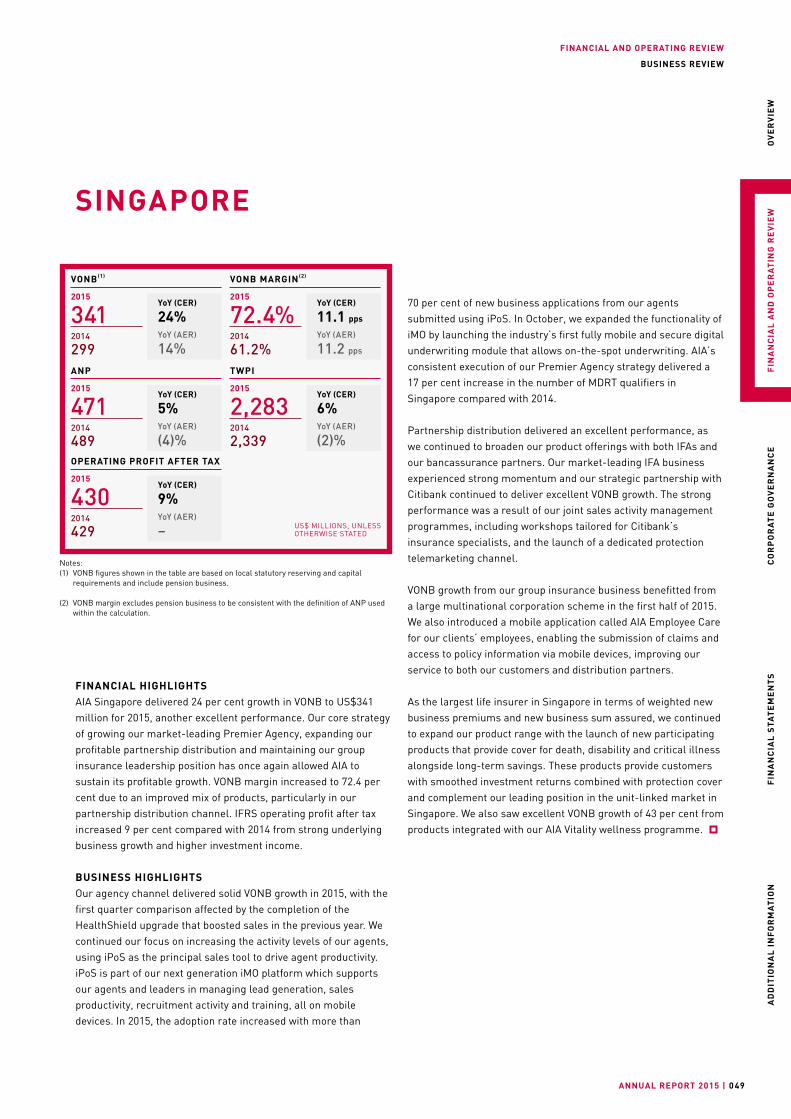
FINANCIAL AND OPERATING REVIEW
ANNUAL REPORT 2015 | 049
OV
ER
VIE
WF
INA
NC
IAL
AN
D O
PE
RA
TIN
G R
EV
IEW
CO
RP
OR
AT
E G
OV
ER
NA
NC
EF
INA
NC
IAL
STA
TE
ME
NT
SA
DD
ITIO
NA
L I
NF
OR
MA
TIO
N
BUSINESS REVIEW
FINANCIAL HIGHLIGHTSAIA Singapore delivered 24 per cent growth in VONB to US$341 million for 2015, another excellent performance. Our core strategy of growing our market-leading Premier Agency, expanding our profitable partnership distribution and maintaining our group insurance leadership position has once again allowed AIA to sustain its profitable growth. VONB margin increased to 72.4 per cent due to an improved mix of products, particularly in our partnership distribution channel. IFRS operating profit after tax increased 9 per cent compared with 2014 from strong underlying business growth and higher investment income.
BUSINESS HIGHLIGHTSOur agency channel delivered solid VONB growth in 2015, with the first quarter comparison affected by the completion of the HealthShield upgrade that boosted sales in the previous year. We continued our focus on increasing the activity levels of our agents, using iPoS as the principal sales tool to drive agent productivity. iPoS is part of our next generation iMO platform which supports our agents and leaders in managing lead generation, sales productivity, recruitment activity and training, all on mobile devices. In 2015, the adoption rate increased with more than
SINGAPORE
70 per cent of new business applications from our agents submitted using iPoS. In October, we expanded the functionality of iMO by launching the industry’s first fully mobile and secure digital underwriting module that allows on-the-spot underwriting. AIA’s consistent execution of our Premier Agency strategy delivered a 17 per cent increase in the number of MDRT qualifiers in Singapore compared with 2014.
Partnership distribution delivered an excellent performance, as we continued to broaden our product offerings with both IFAs and our bancassurance partners. Our market-leading IFA business experienced strong momentum and our strategic partnership with Citibank continued to deliver excellent VONB growth. The strong performance was a result of our joint sales activity management programmes, including workshops tailored for Citibank’s insurance specialists, and the launch of a dedicated protection telemarketing channel.
VONB growth from our group insurance business benefitted from a large multinational corporation scheme in the first half of 2015. We also introduced a mobile application called AIA Employee Care for our clients’ employees, enabling the submission of claims and access to policy information via mobile devices, improving our service to both our customers and distribution partners.
As the largest life insurer in Singapore in terms of weighted new business premiums and new business sum assured, we continued to expand our product range with the launch of new participating products that provide cover for death, disability and critical illness alongside long-term savings. These products provide customers with smoothed investment returns combined with protection cover and complement our leading position in the unit-linked market in Singapore. We also saw excellent VONB growth of 43 per cent from products integrated with our AIA Vitality wellness programme.
Notes:(1) VONB figures shown in the table are based on local statutory reserving and capital
requirements and include pension business.
(2) VONB margin excludes pension business to be consistent with the definition of ANP used within the calculation.
US$ MILLIONS, UNLESSOTHERWISE STATED
YoY (CER)
24%YoY (AER)
14%
VONB (1)
2015
3412014
299
YoY (CER)
5%YoY (AER)
(4)%
ANP
2015
4712014
489
YoY (CER)
9%YoY (AER)
–
OPERATING PROFIT AFTER TAX
2015
4302014
429
YoY (CER)
11.1 pps
YoY (AER)
11.2 pps
VONB MARGIN (2)
2015
72.4%2014
61.2%
YoY (CER)
6%YoY (AER)
(2)%
TWPI
2015
2,2832014
2,339
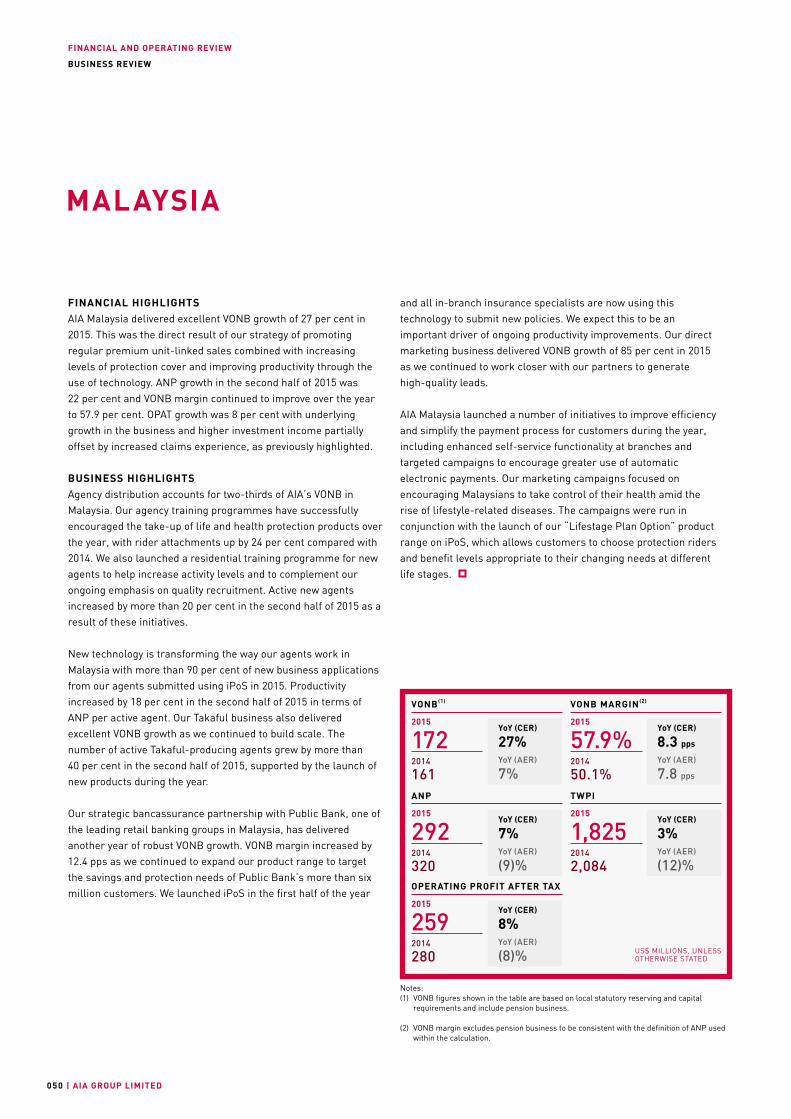
FINANCIAL AND OPERATING REVIEW
| AIA GROUP LIMITED050
BUSINESS REVIEW
FINANCIAL HIGHLIGHTSAIA Malaysia delivered excellent VONB growth of 27 per cent in 2015. This was the direct result of our strategy of promoting regular premium unit-linked sales combined with increasing levels of protection cover and improving productivity through the use of technology. ANP growth in the second half of 2015 was 22 per cent and VONB margin continued to improve over the year to 57.9 per cent. OPAT growth was 8 per cent with underlying growth in the business and higher investment income partially offset by increased claims experience, as previously highlighted.
BUSINESS HIGHLIGHTSAgency distribution accounts for two-thirds of AIA’s VONB in Malaysia. Our agency training programmes have successfully encouraged the take-up of life and health protection products over the year, with rider attachments up by 24 per cent compared with 2014. We also launched a residential training programme for new agents to help increase activity levels and to complement our ongoing emphasis on quality recruitment. Active new agents increased by more than 20 per cent in the second half of 2015 as a result of these initiatives.
New technology is transforming the way our agents work in Malaysia with more than 90 per cent of new business applications from our agents submitted using iPoS in 2015. Productivity increased by 18 per cent in the second half of 2015 in terms of ANP per active agent. Our Takaful business also delivered excellent VONB growth as we continued to build scale. The number of active Takaful-producing agents grew by more than 40 per cent in the second half of 2015, supported by the launch of new products during the year.
Our strategic bancassurance partnership with Public Bank, one of the leading retail banking groups in Malaysia, has delivered another year of robust VONB growth. VONB margin increased by 12.4 pps as we continued to expand our product range to target the savings and protection needs of Public Bank’s more than six million customers. We launched iPoS in the first half of the year
and all in-branch insurance specialists are now using this technology to submit new policies. We expect this to be an important driver of ongoing productivity improvements. Our direct marketing business delivered VONB growth of 85 per cent in 2015 as we continued to work closer with our partners to generate high-quality leads.
AIA Malaysia launched a number of initiatives to improve efficiency and simplify the payment process for customers during the year, including enhanced self-service functionality at branches and targeted campaigns to encourage greater use of automatic electronic payments. Our marketing campaigns focused on encouraging Malaysians to take control of their health amid the rise of lifestyle-related diseases. The campaigns were run in conjunction with the launch of our “Lifestage Plan Option” product range on iPoS, which allows customers to choose protection riders and benefit levels appropriate to their changing needs at different life stages.
MALAYSIA
Notes:(1) VONB figures shown in the table are based on local statutory reserving and capital
requirements and include pension business.
(2) VONB margin excludes pension business to be consistent with the definition of ANP used within the calculation.
US$ MILLIONS, UNLESSOTHERWISE STATED
YoY (CER)
27%YoY (AER)
7%
VONB (1)
2015
1722014
161
YoY (CER)
7%YoY (AER)
(9)%
ANP
2015
2922014
320
YoY (CER)
8%YoY (AER)
(8)%
OPERATING PROFIT AFTER TAX
2015
2592014
280
YoY (CER)
8.3 pps
YoY (AER)
7.8 pps
VONB MARGIN (2)
2015
57.9%2014
50.1%
YoY (CER)
3%YoY (AER)
(12)%
TWPI
2015
1,8252014
2,084

ANNUAL REPORT 2015 | 051
OV
ER
VIE
WF
INA
NC
IAL
AN
D O
PE
RA
TIN
G R
EV
IEW
CO
RP
OR
AT
E G
OV
ER
NA
NC
EF
INA
NC
IAL
STA
TE
ME
NT
SA
DD
ITIO
NA
L I
NF
OR
MA
TIO
N
REPORT CARD CHILDREN KNOW BEST
Although health concerns all of us, many do not take heed. A campaign in Malaysia encouraged family members to send their loved ones a Health Report Card and get recipients to acknowledge potential problems and take preventive action. Children, being naturally observant and candid, show touching care about their parents’ state of health.
Scan for further information

| AIA GROUP LIMITED052
FAMILY MATTERSHOME IS WHERE THE HEART IS
In China, AIA’s bestselling All-in-One product offers real protection to our customers, with a special focus on critical illness protection. We understand the need for strong financial support during treatment and the post-recovery phase. At AIA, we help our customers throughout their life journey.
Scan for further information
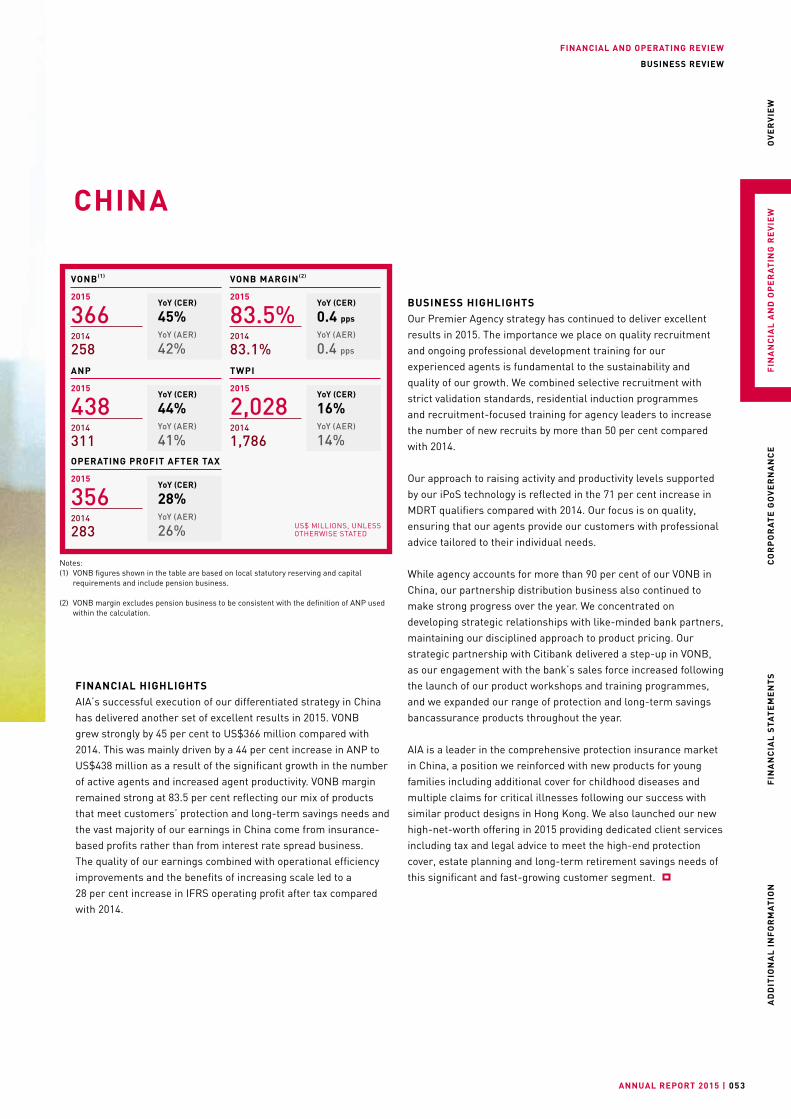
FINANCIAL AND OPERATING REVIEW
ANNUAL REPORT 2015 | 053
OV
ER
VIE
WF
INA
NC
IAL
AN
D O
PE
RA
TIN
G R
EV
IEW
CO
RP
OR
AT
E G
OV
ER
NA
NC
EF
INA
NC
IAL
STA
TE
ME
NT
SA
DD
ITIO
NA
L I
NF
OR
MA
TIO
N
BUSINESS REVIEW
FINANCIAL HIGHLIGHTSAIA’s successful execution of our differentiated strategy in China has delivered another set of excellent results in 2015. VONB grew strongly by 45 per cent to US$366 million compared with 2014. This was mainly driven by a 44 per cent increase in ANP to US$438 million as a result of the significant growth in the number of active agents and increased agent productivity. VONB margin remained strong at 83.5 per cent reflecting our mix of products that meet customers’ protection and long-term savings needs and the vast majority of our earnings in China come from insurance-based profits rather than from interest rate spread business. The quality of our earnings combined with operational efficiency improvements and the benefits of increasing scale led to a 28 per cent increase in IFRS operating profit after tax compared with 2014.
CHINA
BUSINESS HIGHLIGHTSOur Premier Agency strategy has continued to deliver excellent results in 2015. The importance we place on quality recruitment and ongoing professional development training for our experienced agents is fundamental to the sustainability and quality of our growth. We combined selective recruitment with strict validation standards, residential induction programmes and recruitment-focused training for agency leaders to increase the number of new recruits by more than 50 per cent compared with 2014.
Our approach to raising activity and productivity levels supported by our iPoS technology is reflected in the 71 per cent increase in MDRT qualifiers compared with 2014. Our focus is on quality, ensuring that our agents provide our customers with professional advice tailored to their individual needs.
While agency accounts for more than 90 per cent of our VONB in China, our partnership distribution business also continued to make strong progress over the year. We concentrated on developing strategic relationships with like-minded bank partners, maintaining our disciplined approach to product pricing. Our strategic partnership with Citibank delivered a step-up in VONB, as our engagement with the bank’s sales force increased following the launch of our product workshops and training programmes, and we expanded our range of protection and long-term savings bancassurance products throughout the year.
AIA is a leader in the comprehensive protection insurance market in China, a position we reinforced with new products for young families including additional cover for childhood diseases and multiple claims for critical illnesses following our success with similar product designs in Hong Kong. We also launched our new high-net-worth offering in 2015 providing dedicated client services including tax and legal advice to meet the high-end protection cover, estate planning and long-term retirement savings needs of this significant and fast-growing customer segment.
Notes:(1) VONB figures shown in the table are based on local statutory reserving and capital
requirements and include pension business.
(2) VONB margin excludes pension business to be consistent with the definition of ANP used within the calculation.
US$ MILLIONS, UNLESSOTHERWISE STATED
YoY (CER)
45%YoY (AER)
42%
VONB (1)
2015
3662014
258
YoY (CER)
44%YoY (AER)
41%
ANP
2015
4382014
311
YoY (CER)
28%YoY (AER)
26%
OPERATING PROFIT AFTER TAX
2015
3562014
283
YoY (CER)
0.4 pps
YoY (AER)
0.4 pps
VONB MARGIN (2)
2015
83.5%2014
83.1%
YoY (CER)
16%YoY (AER)
14%
TWPI
2015
2,0282014
1,786
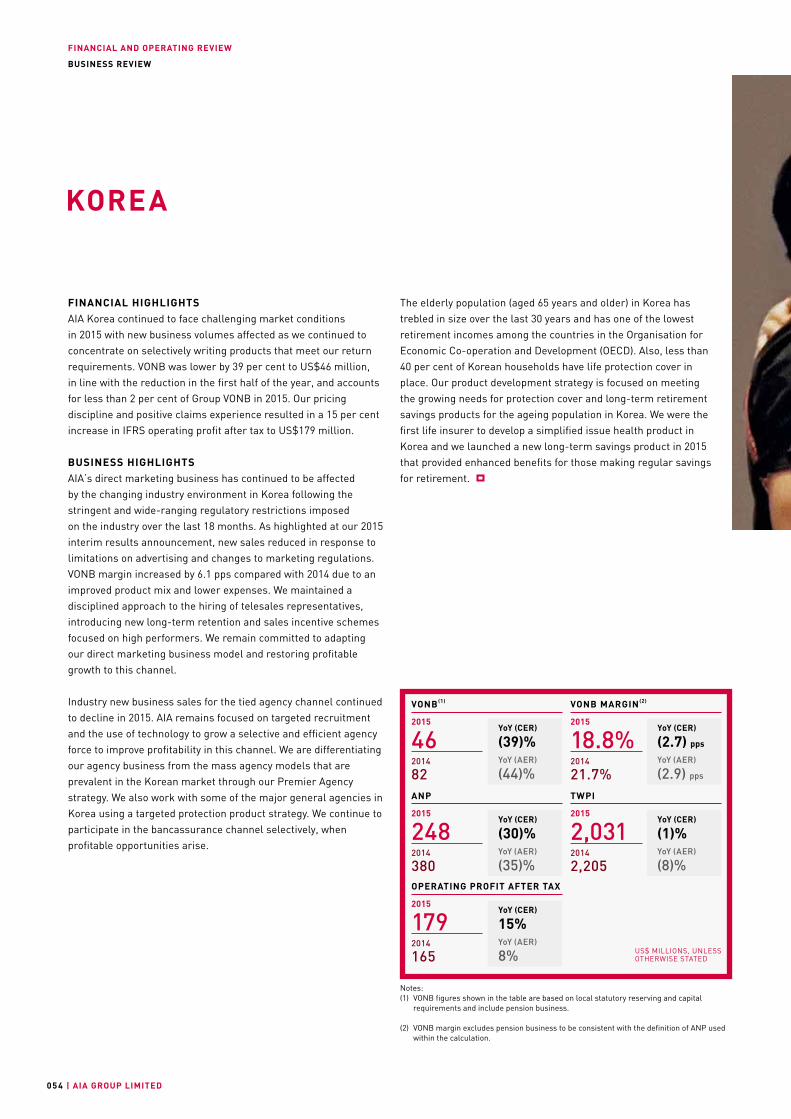
FINANCIAL AND OPERATING REVIEW
| AIA GROUP LIMITED05 4
BUSINESS REVIEW
FINANCIAL HIGHLIGHTSAIA Korea continued to face challenging market conditions in 2015 with new business volumes affected as we continued to concentrate on selectively writing products that meet our return requirements. VONB was lower by 39 per cent to US$46 million, in line with the reduction in the first half of the year, and accounts for less than 2 per cent of Group VONB in 2015. Our pricing discipline and positive claims experience resulted in a 15 per cent increase in IFRS operating profit after tax to US$179 million.
BUSINESS HIGHLIGHTSAIA’s direct marketing business has continued to be affected by the changing industry environment in Korea following the stringent and wide-ranging regulatory restrictions imposed on the industry over the last 18 months. As highlighted at our 2015 interim results announcement, new sales reduced in response to limitations on advertising and changes to marketing regulations. VONB margin increased by 6.1 pps compared with 2014 due to an improved product mix and lower expenses. We maintained a disciplined approach to the hiring of telesales representatives, introducing new long-term retention and sales incentive schemes focused on high performers. We remain committed to adapting our direct marketing business model and restoring profitable growth to this channel.
Industry new business sales for the tied agency channel continued to decline in 2015. AIA remains focused on targeted recruitment and the use of technology to grow a selective and efficient agency force to improve profitability in this channel. We are differentiating our agency business from the mass agency models that are prevalent in the Korean market through our Premier Agency strategy. We also work with some of the major general agencies in Korea using a targeted protection product strategy. We continue to participate in the bancassurance channel selectively, when profitable opportunities arise.
The elderly population (aged 65 years and older) in Korea has trebled in size over the last 30 years and has one of the lowest retirement incomes among the countries in the Organisation for Economic Co-operation and Development (OECD). Also, less than 40 per cent of Korean households have life protection cover in place. Our product development strategy is focused on meeting the growing needs for protection cover and long-term retirement savings products for the ageing population in Korea. We were the first life insurer to develop a simplified issue health product in Korea and we launched a new long-term savings product in 2015 that provided enhanced benefits for those making regular savings for retirement.
KOREA
Notes:(1) VONB figures shown in the table are based on local statutory reserving and capital
requirements and include pension business.
(2) VONB margin excludes pension business to be consistent with the definition of ANP used within the calculation.
US$ MILLIONS, UNLESSOTHERWISE STATED
YoY (CER)
(39)%YoY (AER)
(44)%
VONB (1)
2015
462014
82
YoY (CER)
(30)%YoY (AER)
(35)%
ANP
2015
2482014
380
YoY (CER)
15%YoY (AER)
8%
OPERATING PROFIT AFTER TAX
2015
1792014
165
YoY (CER)
(2.7) pps
YoY (AER)
(2.9) pps
VONB MARGIN (2)
2015
18.8%2014
21.7%
YoY (CER)
(1)%YoY (AER)
(8)%
TWPI
2015
2,0312014
2,205

FINANCIAL AND OPERATING REVIEW
ANNUAL REPORT 2015 | 055
OV
ER
VIE
WF
INA
NC
IAL
AN
D O
PE
RA
TIN
G R
EV
IEW
CO
RP
OR
AT
E G
OV
ER
NA
NC
EF
INA
NC
IAL
STA
TE
ME
NT
SA
DD
ITIO
NA
L I
NF
OR
MA
TIO
N
BUSINESS REVIEW
REAL MEALTHERE’S NO TASTE LIKE HOME
AIA invited a group of homesick young Koreans, working in Australia on holiday visas, to dinner. The food didn’t just taste like the food mom makes – it tasted just like mom’s. Behind the scenes, AIA flew all of their mothers to Australia to create their children’s favourite dishes – served with their own tableware from home.
Scan for further information
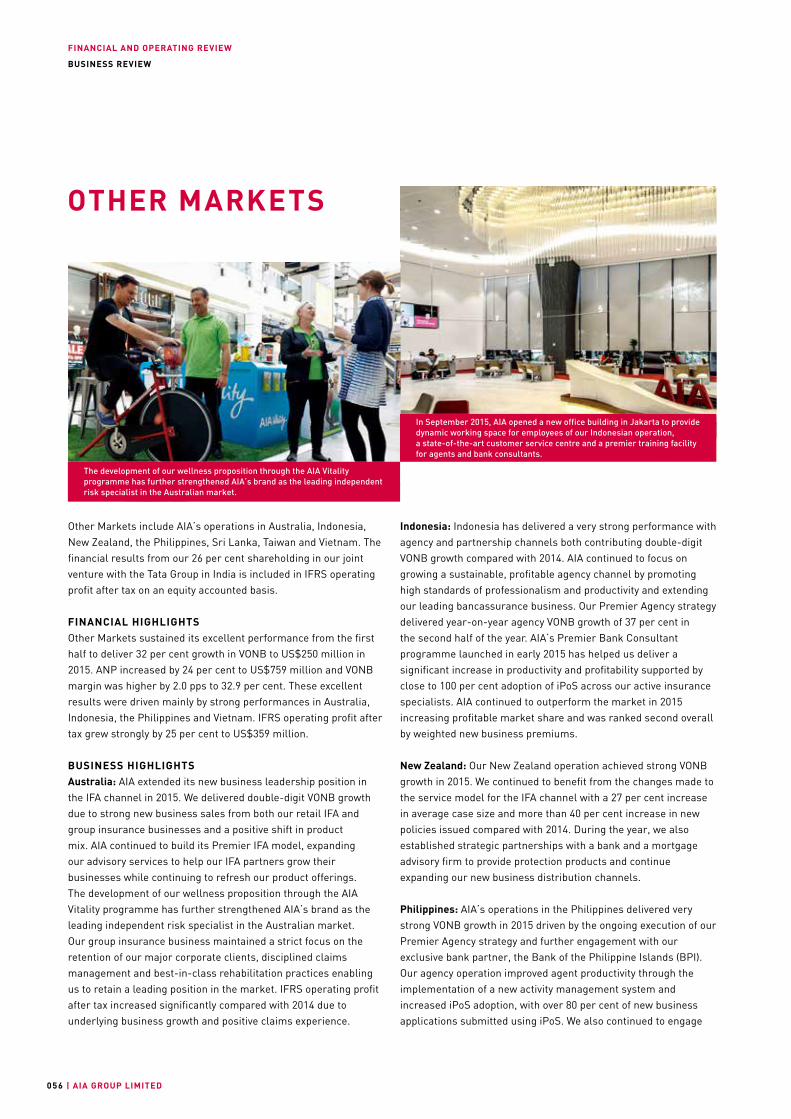
FINANCIAL AND OPERATING REVIEW
| AIA GROUP LIMITED056
BUSINESS REVIEW
Other Markets include AIA’s operations in Australia, Indonesia, New Zealand, the Philippines, Sri Lanka, Taiwan and Vietnam. The financial results from our 26 per cent shareholding in our joint venture with the Tata Group in India is included in IFRS operating profit after tax on an equity accounted basis.
FINANCIAL HIGHLIGHTSOther Markets sustained its excellent performance from the first half to deliver 32 per cent growth in VONB to US$250 million in 2015. ANP increased by 24 per cent to US$759 million and VONB margin was higher by 2.0 pps to 32.9 per cent. These excellent results were driven mainly by strong performances in Australia, Indonesia, the Philippines and Vietnam. IFRS operating profit after tax grew strongly by 25 per cent to US$359 million.
BUSINESS HIGHLIGHTSAustralia: AIA extended its new business leadership position in the IFA channel in 2015. We delivered double-digit VONB growth due to strong new business sales from both our retail IFA and group insurance businesses and a positive shift in product mix. AIA continued to build its Premier IFA model, expanding our advisory services to help our IFA partners grow their businesses while continuing to refresh our product offerings. The development of our wellness proposition through the AIA Vitality programme has further strengthened AIA’s brand as the leading independent risk specialist in the Australian market. Our group insurance business maintained a strict focus on the retention of our major corporate clients, disciplined claims management and best-in-class rehabilitation practices enabling us to retain a leading position in the market. IFRS operating profit after tax increased significantly compared with 2014 due to underlying business growth and positive claims experience.
Indonesia: Indonesia has delivered a very strong performance with agency and partnership channels both contributing double-digit VONB growth compared with 2014. AIA continued to focus on growing a sustainable, profitable agency channel by promoting high standards of professionalism and productivity and extending our leading bancassurance business. Our Premier Agency strategy delivered year-on-year agency VONB growth of 37 per cent in the second half of the year. AIA’s Premier Bank Consultant programme launched in early 2015 has helped us deliver a significant increase in productivity and profitability supported by close to 100 per cent adoption of iPoS across our active insurance specialists. AIA continued to outperform the market in 2015 increasing profitable market share and was ranked second overall by weighted new business premiums.
New Zealand: Our New Zealand operation achieved strong VONB growth in 2015. We continued to benefit from the changes made to the service model for the IFA channel with a 27 per cent increase in average case size and more than 40 per cent increase in new policies issued compared with 2014. During the year, we also established strategic partnerships with a bank and a mortgage advisory firm to provide protection products and continue expanding our new business distribution channels.
Philippines: AIA’s operations in the Philippines delivered very strong VONB growth in 2015 driven by the ongoing execution of our Premier Agency strategy and further engagement with our exclusive bank partner, the Bank of the Philippine Islands (BPI). Our agency operation improved agent productivity through the implementation of a new activity management system and increased iPoS adoption, with over 80 per cent of new business applications submitted using iPoS. We also continued to engage
OTHER MARKETS
The development of our wellness proposition through the AIA Vitality programme has further strengthened AIA’s brand as the leading independent risk specialist in the Australian market.
In September 2015, AIA opened a new office building in Jakarta to provide dynamic working space for employees of our Indonesian operation, a state-of-the-art customer service centre and a premier training facility for agents and bank consultants.
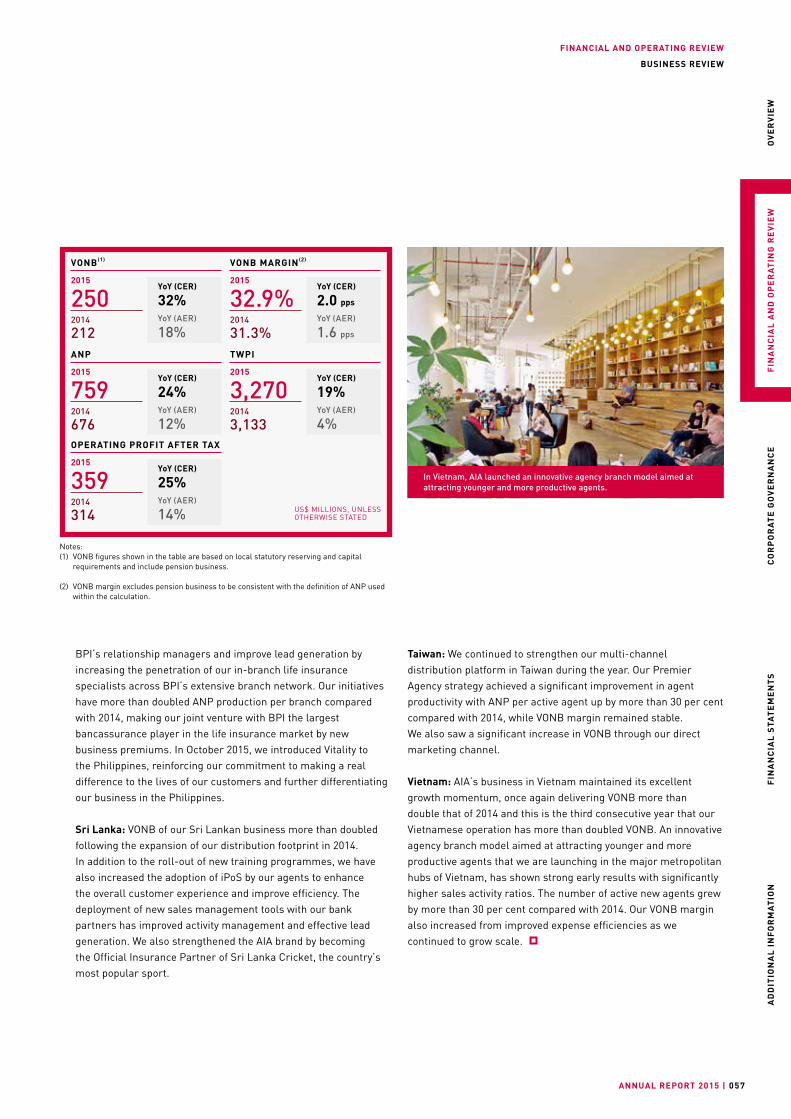
FINANCIAL AND OPERATING REVIEW
ANNUAL REPORT 2015 | 057
OV
ER
VIE
WF
INA
NC
IAL
AN
D O
PE
RA
TIN
G R
EV
IEW
CO
RP
OR
AT
E G
OV
ER
NA
NC
EF
INA
NC
IAL
STA
TE
ME
NT
SA
DD
ITIO
NA
L I
NF
OR
MA
TIO
N
BUSINESS REVIEW
Taiwan: We continued to strengthen our multi-channel distribution platform in Taiwan during the year. Our Premier Agency strategy achieved a significant improvement in agent productivity with ANP per active agent up by more than 30 per cent compared with 2014, while VONB margin remained stable. We also saw a significant increase in VONB through our direct marketing channel.
Vietnam: AIA’s business in Vietnam maintained its excellent growth momentum, once again delivering VONB more than double that of 2014 and this is the third consecutive year that our Vietnamese operation has more than doubled VONB. An innovative agency branch model aimed at attracting younger and more productive agents that we are launching in the major metropolitan hubs of Vietnam, has shown strong early results with significantly higher sales activity ratios. The number of active new agents grew by more than 30 per cent compared with 2014. Our VONB margin also increased from improved expense efficiencies as we continued to grow scale.
BPI’s relationship managers and improve lead generation by increasing the penetration of our in-branch life insurance specialists across BPI’s extensive branch network. Our initiatives have more than doubled ANP production per branch compared with 2014, making our joint venture with BPI the largest bancassurance player in the life insurance market by new business premiums. In October 2015, we introduced Vitality to the Philippines, reinforcing our commitment to making a real difference to the lives of our customers and further differentiating our business in the Philippines.
Sri Lanka: VONB of our Sri Lankan business more than doubled following the expansion of our distribution footprint in 2014. In addition to the roll-out of new training programmes, we have also increased the adoption of iPoS by our agents to enhance the overall customer experience and improve efficiency. The deployment of new sales management tools with our bank partners has improved activity management and effective lead generation. We also strengthened the AIA brand by becoming the Official Insurance Partner of Sri Lanka Cricket, the country’s most popular sport.
In Vietnam, AIA launched an innovative agency branch model aimed at attracting younger and more productive agents.
Notes:(1) VONB figures shown in the table are based on local statutory reserving and capital
requirements and include pension business.
(2) VONB margin excludes pension business to be consistent with the definition of ANP used within the calculation.
US$ MILLIONS, UNLESSOTHERWISE STATED
YoY (CER)
32%YoY (AER)
18%
VONB (1)
2015
2502014
212
YoY (CER)
24%YoY (AER)
12%
ANP
2015
7592014
676
YoY (CER)
25%YoY (AER)
14%
OPERATING PROFIT AFTER TAX
2015
3592014
314
YoY (CER)
2.0 pps
YoY (AER)
1.6 pps
VONB MARGIN (2)
2015
32.9%2014
31.3%
YoY (CER)
19%YoY (AER)
4%
TWPI
2015
3,2702014
3,133
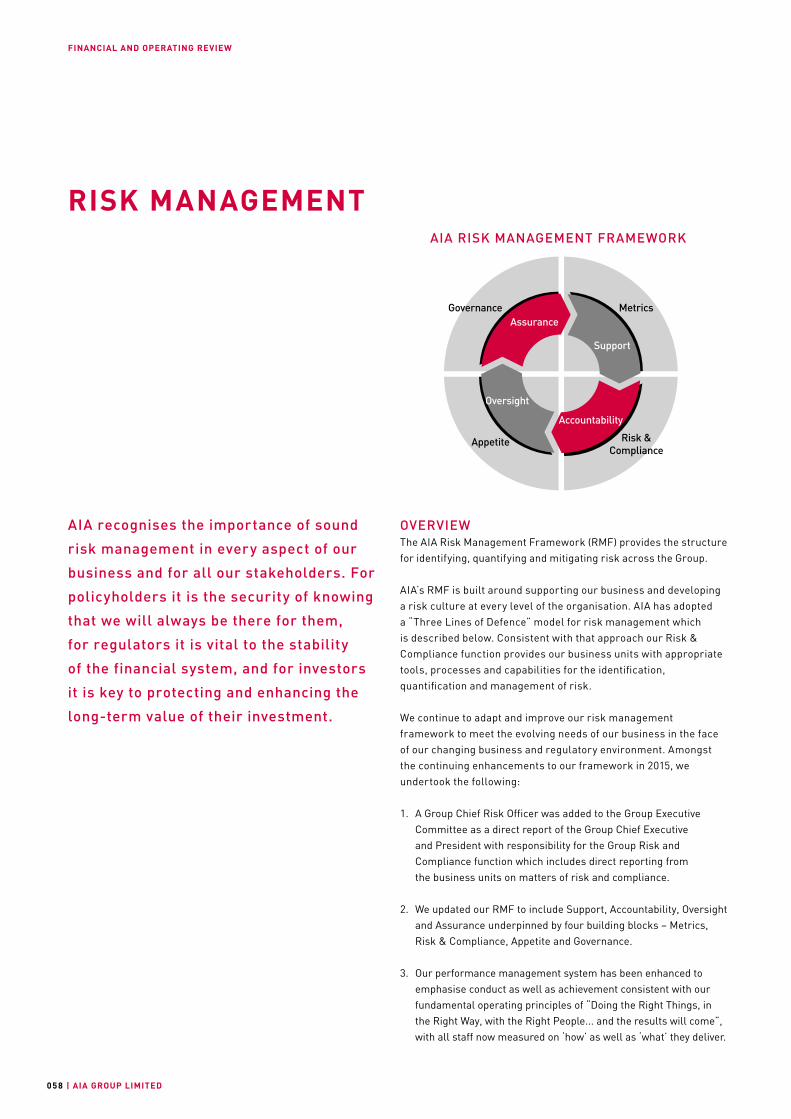
FINANCIAL AND OPERATING REVIEW
| AIA GROUP LIMITED058
OVERVIEWThe AIA Risk Management Framework (RMF) provides the structure for identifying, quantifying and mitigating risk across the Group.
AIA’s RMF is built around supporting our business and developing a risk culture at every level of the organisation. AIA has adopted a “Three Lines of Defence” model for risk management which is described below. Consistent with that approach our Risk & Compliance function provides our business units with appropriate tools, processes and capabilities for the identification, quantification and management of risk.
We continue to adapt and improve our risk management framework to meet the evolving needs of our business in the face of our changing business and regulatory environment. Amongst the continuing enhancements to our framework in 2015, we undertook the following:
1. A Group Chief Risk Officer was added to the Group Executive Committee as a direct report of the Group Chief Executive and President with responsibility for the Group Risk and Compliance function which includes direct reporting from the business units on matters of risk and compliance.
2. We updated our RMF to include Support, Accountability, Oversight and Assurance underpinned by four building blocks – Metrics, Risk & Compliance, Appetite and Governance.
3. Our performance management system has been enhanced to emphasise conduct as well as achievement consistent with our fundamental operating principles of “Doing the Right Things, in the Right Way, with the Right People... and the results will come”, with all staff now measured on ‘how’ as well as ‘what’ they deliver.
RISK MANAGEMENT
AIA recognises the importance of sound
risk management in every aspect of our
business and for all our stakeholders. For
policyholders it is the security of knowing
that we will always be there for them,
for regulators it is vital to the stability
of the financial system, and for investors
it is key to protecting and enhancing the
long-term value of their investment.
AIA RISK MANAGEMENT FRAMEWORK
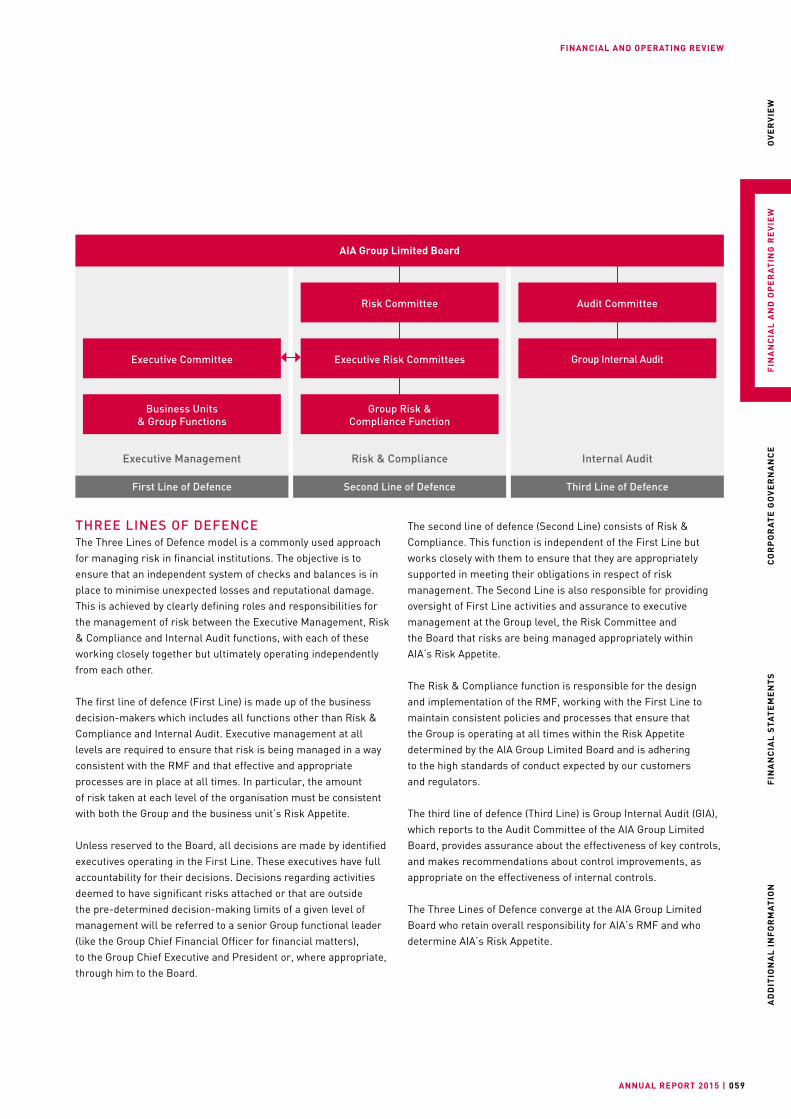
FINANCIAL AND OPERATING REVIEW
ANNUAL REPORT 2015 | 059
OV
ER
VIE
WF
INA
NC
IAL
AN
D O
PE
RA
TIN
G R
EV
IEW
CO
RP
OR
AT
E G
OV
ER
NA
NC
EF
INA
NC
IAL
STA
TE
ME
NT
SA
DD
ITIO
NA
L I
NF
OR
MA
TIO
N
THREE LINES OF DEFENCEThe Three Lines of Defence model is a commonly used approach for managing risk in financial institutions. The objective is to ensure that an independent system of checks and balances is in place to minimise unexpected losses and reputational damage. This is achieved by clearly defining roles and responsibilities for the management of risk between the Executive Management, Risk & Compliance and Internal Audit functions, with each of these working closely together but ultimately operating independently from each other.
The first line of defence (First Line) is made up of the business decision-makers which includes all functions other than Risk & Compliance and Internal Audit. Executive management at all levels are required to ensure that risk is being managed in a way consistent with the RMF and that effective and appropriate processes are in place at all times. In particular, the amount of risk taken at each level of the organisation must be consistent with both the Group and the business unit’s Risk Appetite.
Unless reserved to the Board, all decisions are made by identified executives operating in the First Line. These executives have full accountability for their decisions. Decisions regarding activities deemed to have significant risks attached or that are outside the pre-determined decision-making limits of a given level of management will be referred to a senior Group functional leader (like the Group Chief Financial Officer for financial matters), to the Group Chief Executive and President or, where appropriate, through him to the Board.
Risk Committee
Executive Committee Executive Risk Committees
Group Risk & Compliance Function
Business Units & Group Functions
First Line of Defence
Executive Management
Second Line of Defence
Risk & Compliance
Third Line of Defence
Internal Audit
AIA Group Limited Board
Audit Committee
Group Internal Audit
The second line of defence (Second Line) consists of Risk & Compliance. This function is independent of the First Line but works closely with them to ensure that they are appropriately supported in meeting their obligations in respect of risk management. The Second Line is also responsible for providing oversight of First Line activities and assurance to executive management at the Group level, the Risk Committee and the Board that risks are being managed appropriately within AIA’s Risk Appetite.
The Risk & Compliance function is responsible for the design and implementation of the RMF, working with the First Line to maintain consistent policies and processes that ensure that the Group is operating at all times within the Risk Appetite determined by the AIA Group Limited Board and is adhering to the high standards of conduct expected by our customers and regulators.
The third line of defence (Third Line) is Group Internal Audit (GIA), which reports to the Audit Committee of the AIA Group Limited Board, provides assurance about the effectiveness of key controls, and makes recommendations about control improvements, as appropriate on the effectiveness of internal controls.
The Three Lines of Defence converge at the AIA Group Limited Board who retain overall responsibility for AIA’s RMF and who determine AIA’s Risk Appetite.
FINANCIAL AND OPERATING REVIEW
| AIA GROUP LIMITED060
RISK MANAGEMENT
RISK MANAGEMENT FRAMEWORKAs noted above, AIA’s RMF is defined in terms of four principles – Support, Accountability, Oversight and Assurance underpinned by four building blocks – Governance, Appetite, Metrics and Risk & Compliance.
SUPPORTThe focus of risk management is the identification, quantification, escalation and mitigation of risk. AIA believes that risk is best managed where risk is taken. Therefore Risk & Compliance’s principal focus is on ensuring that the First Line have the tools, understanding, objectivity and resources to manage risk systematically wherever it arises. To support the First Line, AIA has developed processes to identify Risk Metrics with which to quantify risk and a streamlined governance structure to escalate risk issues where appropriate and determine mitigation strategies.
IdentificationEarly identification of risks is essential to ensure that they are understood and either avoided or accepted where appropriate as part of the responsible operation of the business. A network of First Line Risk Owners (formally appointed First Line executive individuals with decision-making capacity) and Risk Champions (formally appointed First Line individuals to support Risk Owners in the identification, assessment and monitoring of key risks) in each business unit is tasked with identifying emerging risks in their areas of activity and, working with the business unit risk teams, performing risk assessments on any new activity to determine whether it is within both business unit and Group Risk Appetite.
QuantificationQuantification of risk is important in establishing the materiality of an issue and in determining whether, where risk is identified, it falls within the limits that support the Group’s Risk Appetite. Various metrics have been developed for this purpose by Risk & Compliance working closely with the First Line. Metrics used in the context of Risk Appetite are described in the box on page 64. Metrics used for individual risks are described under Risk Landscape on page 66.
Escalation & MitigationWhen a transaction or activity is likely to carry risk in excess of the relevant limits or is likely to exceed the limits defined the applicable policies, it is escalated for approval, if appropriate via the Group’s exception process. This process operates consistently
for all affected activities. A Second Line specialist evaluates the materiality of the exception and, based on that evaluation, either passes it back to the business unit for approval, escalates it to the designated Group Executive Committee member or, in the case of significant exceptions, the Group Chief Executive. In each case Risk & Compliance is responsible for ensuring that the ultimate decision-maker is in possession of all relevant information before making a decision.
Risk & Compliance works closely with the First Line in facilitating risk assessments, reviewing the methodologies and calibrating the models that underpin the metrics used by the business unit to quantify risk as well as providing challenge on individual proposals, directing the exception process, as well as organising and preparing reports for the Group and business unit risk committees.
More generally, the Second Line are expected to broaden risk awareness and understanding in the First Line through training and working closely with First Line counterparts on specific issues.
ACCOUNTABILITYA core principle of management in AIA is accountability. Responsibility for implementation and oversight of all risk policies and activities is assigned to First and Second Line executives respectively. While the Second Line is required to monitor and support the business in its risk management responsibilities, the First Line remains responsible for managing risk. To emphasise the importance of accountability, all First Line decision-makers (Risk Owners) are individual executives and not committees. The Second Line Committees, the Financial Risk Committee (FRC) and the Operational Risk Committee (ORC), set risk policies and limits, review significant transactions and Watch List items and oversee the operation and effectiveness of the RMF. They do not approve transactions.
To enforce accountability, business units Risk Owners are required to report incidents and concerns to their risk functions and committees, specific executives are tasked with determining whether activities are within Risk Appetite or require escalation and senior business unit and Group executives are required to approve any transaction that breaches any applicable limit.
Individual accountability is also maintained with all employees signing declarations of compliance with the Group’s Code of Conduct annually.

FINANCIAL AND OPERATING REVIEW
ANNUAL REPORT 2015 | 061
OV
ER
VIE
WF
INA
NC
IAL
AN
D O
PE
RA
TIN
G R
EV
IEW
CO
RP
OR
AT
E G
OV
ER
NA
NC
EF
INA
NC
IAL
STA
TE
ME
NT
SA
DD
ITIO
NA
L I
NF
OR
MA
TIO
N
RISK MANAGEMENT
OVERSIGHTThe Three Lines of Defence model is designed to promote objectivity in the risk management process. As set out above, the Second Line is responsible to provide oversight and does so by the exercise of judgment as to the appropriateness, sufficiency and effectiveness of the measures taken to manage risk and reporting thereon to the executive risk committees at both the business unit and Group level.
The application of oversight includes:
• Systematic Coverage The Group Risk & Compliance function maintain a detailed risk
taxonomy or “Risk Landscape” to ensure that all risks are identified and classified appropriately. All Operational Risk & Compliance Incidents, Risk Control Assessments and Scenario Analysis results are stored in a common database and organised according to the taxonomy, allowing a picture to be presented of the effectiveness of controls by risk or by business unit;
• Risk Metrics A dedicated Risk Metrics team in Group Risk & Compliance is
tasked with reviewing and supporting the development of risk models and methodology in the First Line as well as calibrating all risk models used for reporting and business proposals. All such Risk Metrics are approved by the Group FRC;
• Standardised Reporting The Risk Landscape is reviewed in standardised risk reports
prepared by the Second Line covering Insurance, Investment, Financial and Operational risk. These are submitted on a quarterly basis to FRC and ORC at both a business unit and a Group level;
• Risk Watch Lists These are maintained for each business unit and cover each
category of risk – Investment, Financial and Operational. They are designed to highlight to management issues that require attention. A Group Watch List is reviewed at each executive risk committee meeting and items from business unit Risk Watch Lists that are considered to have a Group dimension, the potential to damage the Group financially or reputationally, may be placed on it;
• Business Unit Compliance Group Risk & Compliance conduct an ongoing programme of
reviews of business unit functions, monitor advisory process through ‘Mystery Shopping’, monitor Key Risk Indicators (KRIs) such as complaints and the time taken to address them, and use the results of predictive modelling to proactively detect misconduct; and
• Internal Audit Working very closely with the Second Line, Internal Audit
reviews the effectiveness of controls and highlights areas where controls require improvement.
ASSURANCEThe AIA Group Limited Board has overall responsibility for the Group’s risk management activities. In this regard the Board sets the Group’s Risk Appetite, agrees the RMF and approves major transactions. In fulfilling these responsibilities the Board is supported and advised by the Risk Committee.
It is the role of the Risk Committee supported by Risk & Compliance to provide assurance to the Board that the RMF is effective and that risk is being managed across the organisation to an acceptable standard. This is achieved through the following channels:
• The Group Chief Risk Officer presents a quarterly risk report to the Risk Committee covering all major risk categories, confirming that the Company is operating within Risk Appetite, summarising the activities of the executive risk committees and highlighting any emerging risks either in the external environment or through the Risk Watch Lists. The Chairman of the Risk Committee presents a similar report to the Board;
• An assurance review is presented to the Risk Committee annually. Historically this has focused on the effectiveness of the risk functions and the development of the RMF. Going forward this review will be included as part of an Own Risk and Solvency Assessment; and
• Each business unit Chief Executive Officer provides annual certification that the business unit conforms with applicable Compliance policies.
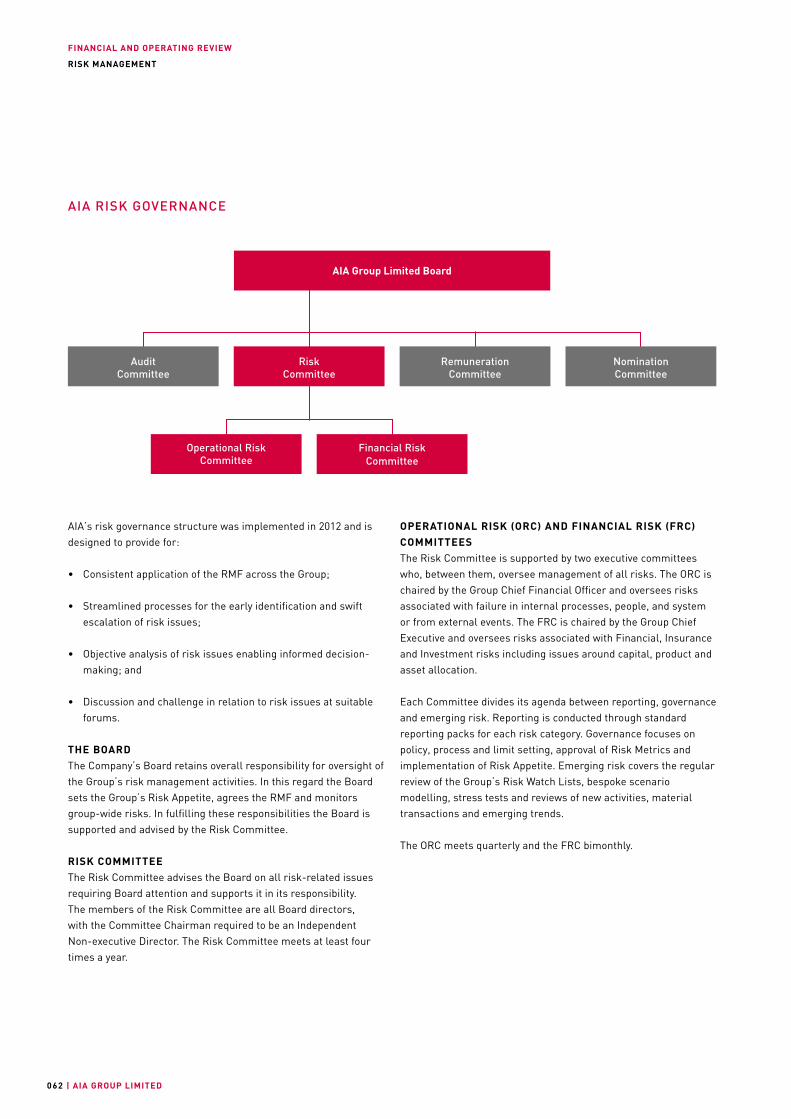
FINANCIAL AND OPERATING REVIEW
| AIA GROUP LIMITED062
RISK MANAGEMENT
AIA RISK GOVERNANCE
AIA’s risk governance structure was implemented in 2012 and is designed to provide for:
• Consistent application of the RMF across the Group;
• Streamlined processes for the early identification and swift escalation of risk issues;
• Objective analysis of risk issues enabling informed decision-making; and
• Discussion and challenge in relation to risk issues at suitable forums.
THE BOARDThe Company’s Board retains overall responsibility for oversight of the Group’s risk management activities. In this regard the Board sets the Group’s Risk Appetite, agrees the RMF and monitors group-wide risks. In fulfilling these responsibilities the Board is supported and advised by the Risk Committee.
RISK COMMITTEEThe Risk Committee advises the Board on all risk-related issues requiring Board attention and supports it in its responsibility. The members of the Risk Committee are all Board directors, with the Committee Chairman required to be an Independent Non-executive Director. The Risk Committee meets at least four times a year.
AIA Group Limited Board
Risk Committee
Nomination Committee
RemunerationCommittee
Audit Committee
Operational Risk Committee
Financial Risk Committee
OPERATIONAL RISK (ORC) AND FINANCIAL RISK (FRC) COMMITTEESThe Risk Committee is supported by two executive committees who, between them, oversee management of all risks. The ORC is chaired by the Group Chief Financial Officer and oversees risks associated with failure in internal processes, people, and system or from external events. The FRC is chaired by the Group Chief Executive and oversees risks associated with Financial, Insurance and Investment risks including issues around capital, product and asset allocation.
Each Committee divides its agenda between reporting, governance and emerging risk. Reporting is conducted through standard reporting packs for each risk category. Governance focuses on policy, process and limit setting, approval of Risk Metrics and implementation of Risk Appetite. Emerging risk covers the regular review of the Group’s Risk Watch Lists, bespoke scenario modelling, stress tests and reviews of new activities, material transactions and emerging trends.
The ORC meets quarterly and the FRC bimonthly.
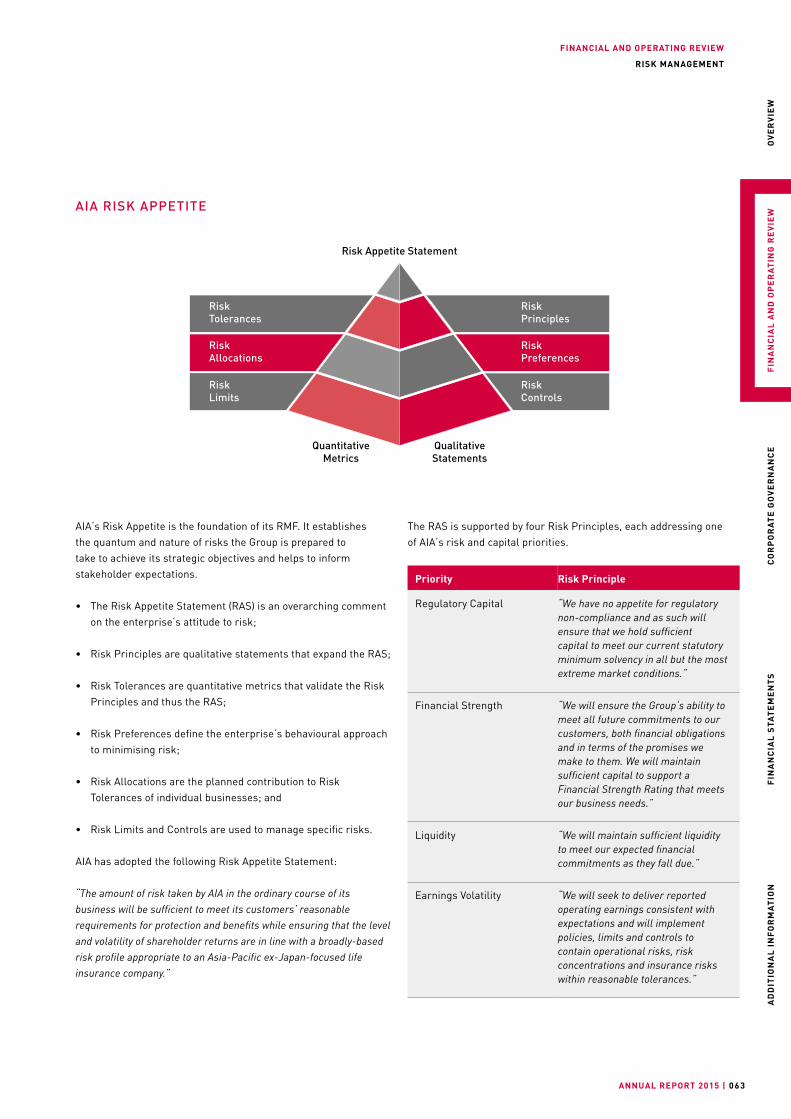
FINANCIAL AND OPERATING REVIEW
ANNUAL REPORT 2015 | 063
OV
ER
VIE
WF
INA
NC
IAL
AN
D O
PE
RA
TIN
G R
EV
IEW
CO
RP
OR
AT
E G
OV
ER
NA
NC
EF
INA
NC
IAL
STA
TE
ME
NT
SA
DD
ITIO
NA
L I
NF
OR
MA
TIO
N
RISK MANAGEMENT
AIA RISK APPETITE
AIA’s Risk Appetite is the foundation of its RMF. It establishes the quantum and nature of risks the Group is prepared to take to achieve its strategic objectives and helps to inform stakeholder expectations.
• The Risk Appetite Statement (RAS) is an overarching comment on the enterprise’s attitude to risk;
• Risk Principles are qualitative statements that expand the RAS;
• Risk Tolerances are quantitative metrics that validate the Risk Principles and thus the RAS;
• Risk Preferences define the enterprise’s behavioural approach to minimising risk;
• Risk Allocations are the planned contribution to Risk Tolerances of individual businesses; and
• Risk Limits and Controls are used to manage specific risks.
AIA has adopted the following Risk Appetite Statement:
“The amount of risk taken by AIA in the ordinary course of its business will be sufficient to meet its customers’ reasonable requirements for protection and benefits while ensuring that the level and volatility of shareholder returns are in line with a broadly-based risk profile appropriate to an Asia-Pacific ex-Japan-focused life insurance company.”
The RAS is supported by four Risk Principles, each addressing one of AIA’s risk and capital priorities.
Priority Risk Principle
Regulatory Capital “We have no appetite for regulatory non-compliance and as such will ensure that we hold sufficient capital to meet our current statutory minimum solvency in all but the most extreme market conditions.”
Financial Strength “We will ensure the Group’s ability to meet all future commitments to our customers, both financial obligations and in terms of the promises we make to them. We will maintain sufficient capital to support a Financial Strength Rating that meets our business needs.”
Liquidity “We will maintain sufficient liquidity to meet our expected financial commitments as they fall due.”
Earnings Volatility “We will seek to deliver reported operating earnings consistent with expectations and will implement policies, limits and controls to contain operational risks, risk concentrations and insurance risks within reasonable tolerances.”
QuantitativeMetrics
QualitativeStatements
Risk Appetite Statement
Risk Tolerances
Risk Allocations
Risk Limits
Risk Principles
Risk Preferences
Risk Controls
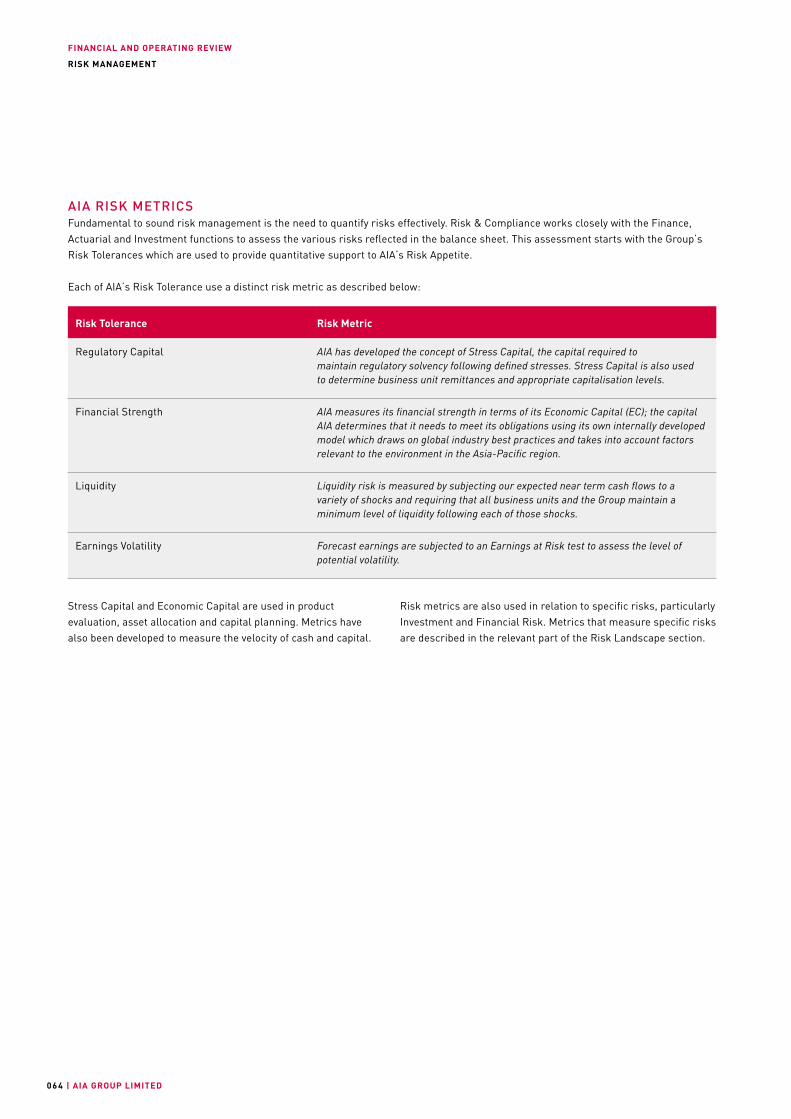
FINANCIAL AND OPERATING REVIEW
| AIA GROUP LIMITED06 4
RISK MANAGEMENT
AIA RISK METRICSFundamental to sound risk management is the need to quantify risks effectively. Risk & Compliance works closely with the Finance, Actuarial and Investment functions to assess the various risks reflected in the balance sheet. This assessment starts with the Group’s Risk Tolerances which are used to provide quantitative support to AIA’s Risk Appetite.
Each of AIA’s Risk Tolerance use a distinct risk metric as described below:
Risk Tolerance Risk Metric
Regulatory Capital AIA has developed the concept of Stress Capital, the capital required to maintain regulatory solvency following defined stresses. Stress Capital is also used to determine business unit remittances and appropriate capitalisation levels.
Financial Strength AIA measures its financial strength in terms of its Economic Capital (EC); the capital AIA determines that it needs to meet its obligations using its own internally developed model which draws on global industry best practices and takes into account factors relevant to the environment in the Asia-Pacific region.
Liquidity Liquidity risk is measured by subjecting our expected near term cash flows to a variety of shocks and requiring that all business units and the Group maintain a minimum level of liquidity following each of those shocks.
Earnings Volatility Forecast earnings are subjected to an Earnings at Risk test to assess the level of potential volatility.
Stress Capital and Economic Capital are used in product evaluation, asset allocation and capital planning. Metrics have also been developed to measure the velocity of cash and capital.
Risk metrics are also used in relation to specific risks, particularly Investment and Financial Risk. Metrics that measure specific risks are described in the relevant part of the Risk Landscape section.
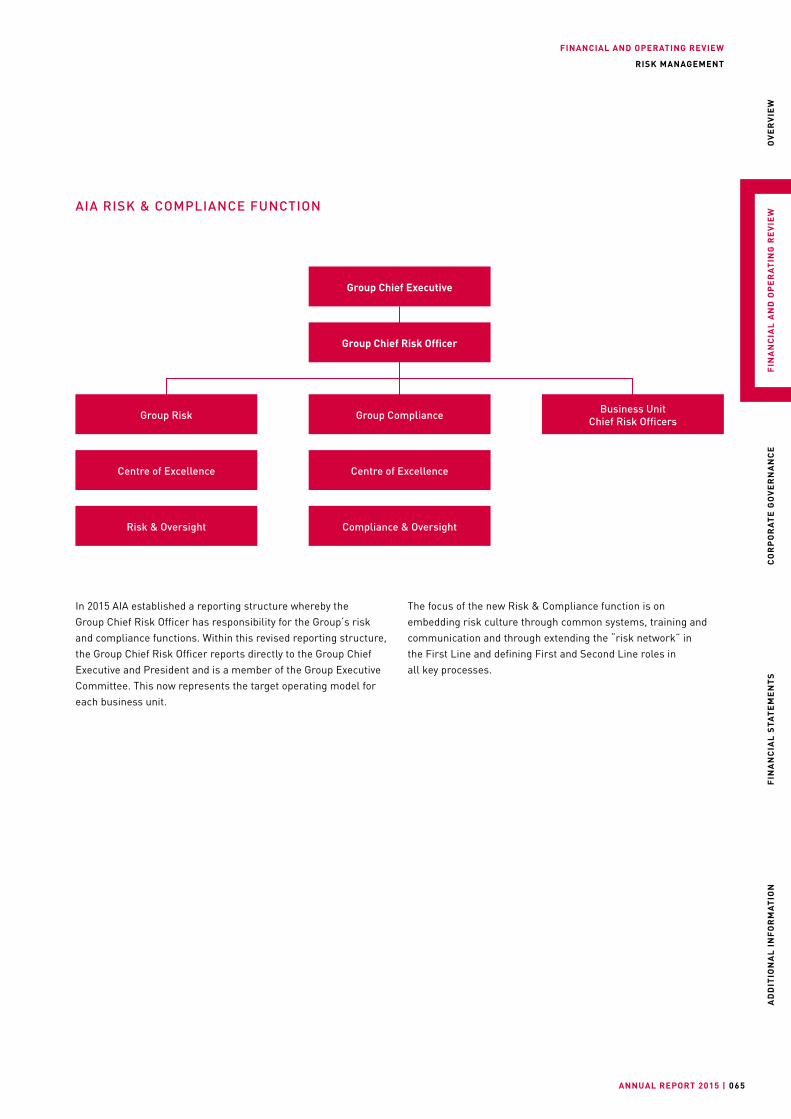
FINANCIAL AND OPERATING REVIEW
ANNUAL REPORT 2015 | 065
OV
ER
VIE
WF
INA
NC
IAL
AN
D O
PE
RA
TIN
G R
EV
IEW
CO
RP
OR
AT
E G
OV
ER
NA
NC
EF
INA
NC
IAL
STA
TE
ME
NT
SA
DD
ITIO
NA
L I
NF
OR
MA
TIO
N
RISK MANAGEMENT
Group Chief Executive
Group Chief Risk Officer
Group Compliance
Centre of Excellence
Compliance & Oversight
Business Unit Chief Risk OfficersGroup Risk
Centre of Excellence
Risk & Oversight
In 2015 AIA established a reporting structure whereby the Group Chief Risk Officer has responsibility for the Group’s risk and compliance functions. Within this revised reporting structure, the Group Chief Risk Officer reports directly to the Group Chief Executive and President and is a member of the Group Executive Committee. This now represents the target operating model for each business unit.
The focus of the new Risk & Compliance function is on embedding risk culture through common systems, training and communication and through extending the “risk network” in the First Line and defining First and Second Line roles in all key processes.
AIA RISK & COMPLIANCE FUNCTION
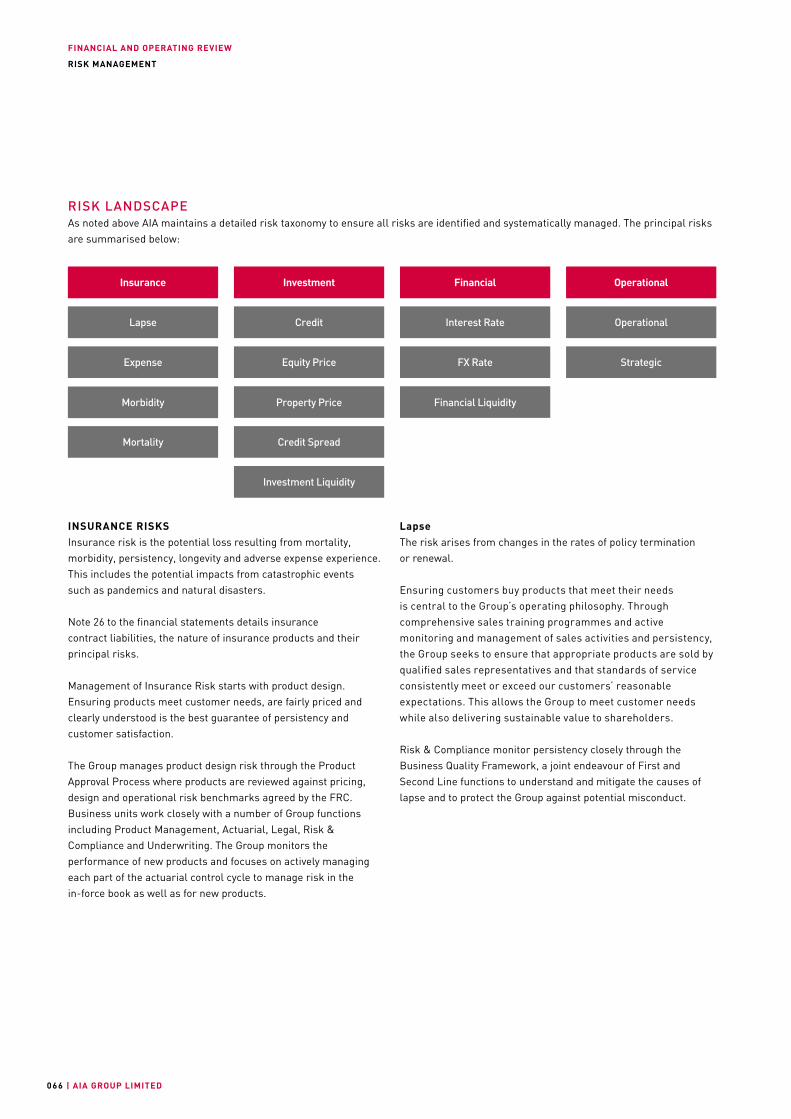
FINANCIAL AND OPERATING REVIEW
| AIA GROUP LIMITED066
RISK MANAGEMENT
Insurance Investment
Credit
Equity Price
Property Price
Credit Spread
Investment Liquidity
Financial
Interest Rate
FX Rate
Financial Liquidity
Operational
Operational
Strategic
Lapse
Expense
Morbidity
Mortality
INSURANCE RISKSInsurance risk is the potential loss resulting from mortality, morbidity, persistency, longevity and adverse expense experience. This includes the potential impacts from catastrophic events such as pandemics and natural disasters.
Note 26 to the financial statements details insurance contract liabilities, the nature of insurance products and their principal risks.
Management of Insurance Risk starts with product design. Ensuring products meet customer needs, are fairly priced and clearly understood is the best guarantee of persistency and customer satisfaction.
The Group manages product design risk through the Product Approval Process where products are reviewed against pricing, design and operational risk benchmarks agreed by the FRC. Business units work closely with a number of Group functions including Product Management, Actuarial, Legal, Risk & Compliance and Underwriting. The Group monitors the performance of new products and focuses on actively managing each part of the actuarial control cycle to manage risk in the in-force book as well as for new products.
LapseThe risk arises from changes in the rates of policy termination or renewal.
Ensuring customers buy products that meet their needs is central to the Group’s operating philosophy. Through comprehensive sales training programmes and active monitoring and management of sales activities and persistency, the Group seeks to ensure that appropriate products are sold by qualified sales representatives and that standards of service consistently meet or exceed our customers’ reasonable expectations. This allows the Group to meet customer needs while also delivering sustainable value to shareholders.
Risk & Compliance monitor persistency closely through the Business Quality Framework, a joint endeavour of First and Second Line functions to understand and mitigate the causes of lapse and to protect the Group against potential misconduct.
RISK LANDSCAPEAs noted above AIA maintains a detailed risk taxonomy to ensure all risks are identified and systematically managed. The principal risks are summarised below:
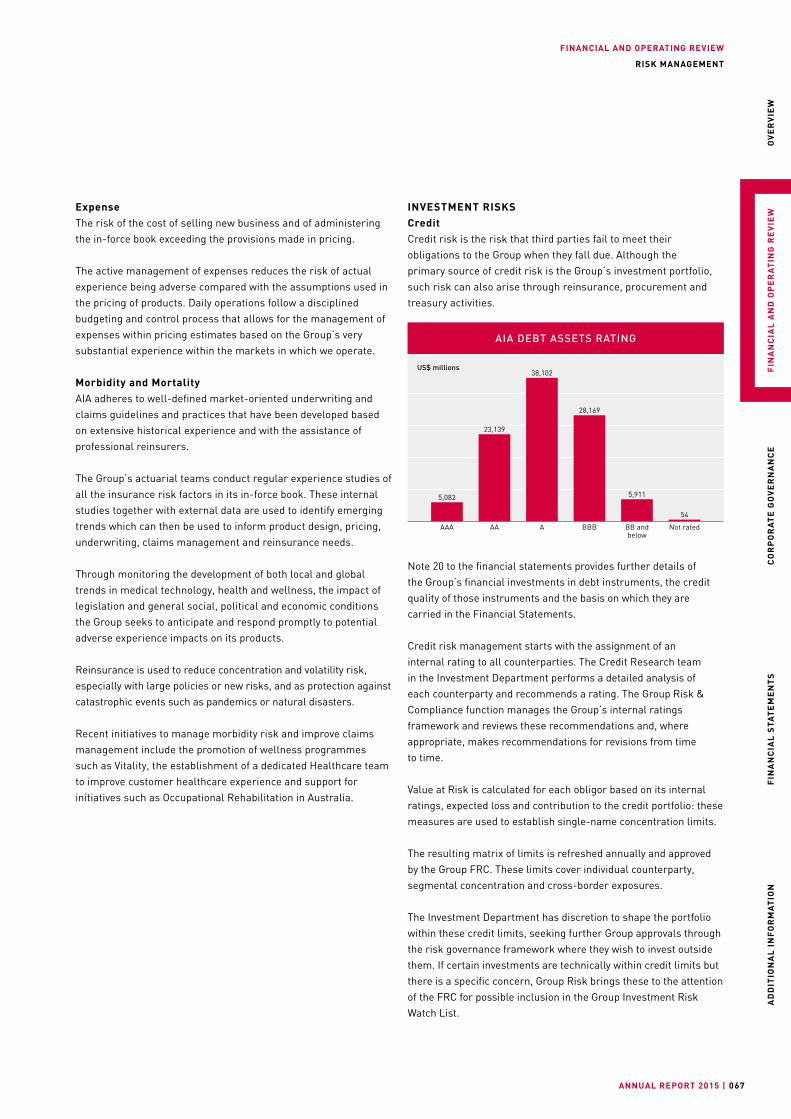
FINANCIAL AND OPERATING REVIEW
ANNUAL REPORT 2015 | 067
OV
ER
VIE
WF
INA
NC
IAL
AN
D O
PE
RA
TIN
G R
EV
IEW
CO
RP
OR
AT
E G
OV
ER
NA
NC
EF
INA
NC
IAL
STA
TE
ME
NT
SA
DD
ITIO
NA
L I
NF
OR
MA
TIO
N
RISK MANAGEMENT
ExpenseThe risk of the cost of selling new business and of administering the in-force book exceeding the provisions made in pricing.
The active management of expenses reduces the risk of actual experience being adverse compared with the assumptions used in the pricing of products. Daily operations follow a disciplined budgeting and control process that allows for the management of expenses within pricing estimates based on the Group’s very substantial experience within the markets in which we operate.
Morbidity and MortalityAIA adheres to well-defined market-oriented underwriting and claims guidelines and practices that have been developed based on extensive historical experience and with the assistance of professional reinsurers.
The Group’s actuarial teams conduct regular experience studies of all the insurance risk factors in its in-force book. These internal studies together with external data are used to identify emerging trends which can then be used to inform product design, pricing, underwriting, claims management and reinsurance needs.
Through monitoring the development of both local and global trends in medical technology, health and wellness, the impact of legislation and general social, political and economic conditions the Group seeks to anticipate and respond promptly to potential adverse experience impacts on its products.
Reinsurance is used to reduce concentration and volatility risk, especially with large policies or new risks, and as protection against catastrophic events such as pandemics or natural disasters.
Recent initiatives to manage morbidity risk and improve claims management include the promotion of wellness programmes such as Vitality, the establishment of a dedicated Healthcare team to improve customer healthcare experience and support for initiatives such as Occupational Rehabilitation in Australia.
INVESTMENT RISKSCreditCredit risk is the risk that third parties fail to meet their obligations to the Group when they fall due. Although the primary source of credit risk is the Group’s investment portfolio, such risk can also arise through reinsurance, procurement and treasury activities.
Note 20 to the financial statements provides further details of the Group’s financial investments in debt instruments, the credit quality of those instruments and the basis on which they are carried in the Financial Statements.
Credit risk management starts with the assignment of an internal rating to all counterparties. The Credit Research team in the Investment Department performs a detailed analysis of each counterparty and recommends a rating. The Group Risk & Compliance function manages the Group’s internal ratings framework and reviews these recommendations and, where appropriate, makes recommendations for revisions from time to time.
Value at Risk is calculated for each obligor based on its internal ratings, expected loss and contribution to the credit portfolio: these measures are used to establish single-name concentration limits.
The resulting matrix of limits is refreshed annually and approved by the Group FRC. These limits cover individual counterparty, segmental concentration and cross-border exposures.
The Investment Department has discretion to shape the portfolio within these credit limits, seeking further Group approvals through the risk governance framework where they wish to invest outside them. If certain investments are technically within credit limits but there is a specific concern, Group Risk brings these to the attention of the FRC for possible inclusion in the Group Investment Risk Watch List.
US$ millions
AAA
5,082
AA
23,139
A
38,102
BBB
28,169
BB andbelow
5,911
Not rated
54
AIA DEBT ASSETS RATING
FINANCIAL AND OPERATING REVIEW
| AIA GROUP LIMITED068
RISK MANAGEMENT
Equity PriceEquity price risk arises from changes in the market value of equity securities and equity funds. Investment in equity assets on a long-term basis is expected to provide diversification benefits and enhance returns.
Note 20 to the financial statements provides further details of the Group’s financial investments in equity securities, including the basis on which they are carried in the Financial Statements. Note 37 to the financial statements indicates the sensitivity of profit and net assets to changes in equity prices.
The extent of exposure to equities at any time is at the discretion of the Investment Department operating within the terms of the Group’s and business units’ strategic asset allocations.
Equity price risk is managed in the first instance through the individual investment mandates which define benchmarks and any tracking error targets. Equity limits are also applied at Group, business unit and individual fund levels to contain individual exposures. Equity exposures are included in the aggregate credit exposure reports on individual counterparties to ensure concentrations are avoided.
Within this framework the Investment team uses a “Margin of Safety Investment” approach to target value in individual stock selection, and they are also permitted to vary equity allocations within a defined range around the benchmark.
Property PriceProperty price risk arises from investments in real estate assets which are subject to market value changes due to general or specific factors. A number of such real estate assets are self-occupied and used for operating purposes. Real estate assets are expected to provide useful diversification benefits and a long-term return with some inflation protection.
The price risk in property can be driven by broader economic and social factors, notably tenant supply and demand, liquidity of individual assets, evolving infrastructure or government actions that may directly or indirectly influence the market. It can also be driven by the characteristics of specific holdings: their location within an area, the competitiveness of their facilities and their physical condition.
In addition to normal due diligence, any material property investment is individually reviewed by the Group to ensure it is neither an unacceptable concentration of exposure nor a compromise of the financial flexibility of the relevant business unit. An Operational Risk checklist is also prepared for each investment.
Credit SpreadCredit Spread Risk arises from changes in the market value of non-government securities as a result of a change in perception as to their likelihood of repayment. These price changes are distinct from those resulting from changes in interest rates.
AIA invests in non-government securities in a number of its portfolios. Because these securities are mostly held to maturity, Credit Spread Risk is only taken to the extent that the Group may be forced to sell those securities before they mature or because the regulatory regime includes market values in their solvency calculation.
AIA manages its Credit Spread Risk carefully, focusing on overall portfolio quality and diversification and seeking to avoid excessive volatility in the mark-to-market value of its investment portfolios.
Investment LiquidityInvestment liquidity risk occurs in relation to our ability to buy and sell investments. This is a function of the size of the Group’s holdings relative to the availability of counterparties willing to buy or sell these holdings at any given time. In times of stress, market losses will generally be compounded by forced sellers seeking unwilling buyers.
As disclosed in note 20 to the financial statements, most of AIA’s investments are in the form of marketable securities, which can typically be converted to cash should the need arise.
However, investment liquidity risk has become more significant since the Global Financial Crisis as new regulations have led banks and dealers to reduce inventory levels and market-making activity.
While life insurance companies are characterised by a relatively low need for liquidity to cover those of their liabilities which are directly linked to mortality and morbidity, this risk is nevertheless carefully managed by continuously assessing the relative liquidity of the Group’s assets and managing the size of individual holdings through limits.
FINANCIAL AND OPERATING REVIEW
ANNUAL REPORT 2015 | 069
OV
ER
VIE
WF
INA
NC
IAL
AN
D O
PE
RA
TIN
G R
EV
IEW
CO
RP
OR
AT
E G
OV
ER
NA
NC
EF
INA
NC
IAL
STA
TE
ME
NT
SA
DD
ITIO
NA
L I
NF
OR
MA
TIO
N
RISK MANAGEMENT
FINANCIAL RISKSInterest RateThe Group’s exposure to interest rate risk predominantly arises from any difference between the duration of the Group’s liabilities and assets, the ALM Mismatch. Since most markets do not have assets of sufficient tenor to match life insurance liabilities, an ALM Mismatch gives rise to uncertainty around the reinvestment of maturing assets to meet the Group’s insurance liabilities.
Management of Interest Rate Risk is complicated by the context in which the relative duration calculations are made. Where local solvency regimes use market values on only one side of the balance sheet the interest rate mismatch will be very different to the economic view where market values are used for both assets and liabilities.
Moreover, since most of AIA’s savings products allow us to vary crediting rates, management actions need to be modelled to determine the extent of interest rate risk at different confidence intervals.
The impact of options and guarantees can further complicate the picture, with a need to consider the impact of both rising and falling interest rates.
AIA manages its interest rate risk by considering all these dimensions, especially during product design and asset allocation. Present Value of a Basis Point analysis is used to highlight mismatches at individual points in the yield curve and Value at Risk is used to assess the riskiness of those mismatches.
For in-force policies, policyholder bonus payout and crediting rates applicable to policyholder account balances are regularly reviewed, considering amongst other things current bond yields and policyholders’ reasonable expectations.
Exposure to interest rate risk is summarised in note 37 to the financial statements, which shows the split of financial assets and liabilities between variable, fixed and non-interest bearing investments.
Foreign Exchange RateAt the Group level, foreign exchange rate risk arises mainly from the Group’s operations in multiple geographical markets in the Asia-Pacific region and the translation of multiple currencies to US dollars for financial reporting purposes.
Note 37 to the financial statements shows the Group’s currency exposures and the sensitivity of shareholders’ equity and profit to movements in those currencies.
Foreign exchange rate risk is managed in AIA on various levels. The balance sheet values of our operating units and subsidiaries are not hedged to the Group’s reporting currency, US dollar.
However, assets, liabilities and all regulatory and stress capital in each business unit are generally currency matched with the exception of holdings of foreign equities or any expected capital movements due within one year which may be hedged at the discretion of Group management. Foreign bond holdings are commonly hedged with cross-currency swaps or foreign exchange forward contracts.
This approach applies to the matching of US dollar and HK dollar assets and liabilities in the Hong Kong businesses.
Financial Resources held at Group are normally held in US dollars. No attempt is made to match the currency of such capital to the currency of AIA’s Required Economic Capital or Hong Kong regulatory capital.
Financial LiquidityFinancial liquidity risk is the risk that insufficient cash is available to meet payment obligations to counterparties as they fall due. While life insurance companies are generally well placed to manage financial liquidity risk on account of the tenor of their liabilities, the experience of the Global Financial Crisis shows the need to be able to withstand extreme liquidity shocks.
One area of particular focus in the management of Financial Liquidity is collateral. Again the Global Financial Crisis exposed the risk to financial institutions from their commitments to post collateral to counterparties.
AIA manages this exposure by determining limits for its activities in the derivatives and repo markets based on the collateral available within the relevant fund or subsidiary to withstand extreme market events. The available collateral is subject to haircuts and then compared to the Peak Exposure of the derivatives exposures to give a “Collateral Coverage Ratio”. For repos a further restriction is imposed based on the volume and maturity profile of repos in relation to the expected premium inflow over a given time period assuming a stress scenario, the “Liquidity Coverage Ratio”.
More broadly AIA supports its liquidity through committed bank facilities, use of the bond repurchase markets and maintaining access to debt markets via the Group’s Global Medium Term Note programme.
Note 37 to the financial statements provides a maturity analysis of the Group’s financial assets and its financial liabilities and insurance contract liabilities.
FINANCIAL AND OPERATING REVIEW
| AIA GROUP LIMITED070
RISK MANAGEMENT
Quantifying Operational Risk is difficult as data is scarce and loss distributions are less predictable. While AIA is developing its own “Asian events database” to support more quantitative study, the principal tools currently used are Risk and Control Assessments. This involve convening a workshop of subject matter experts to consider possible risk scenarios, the likelihood of their occurrence, their potential cost and non-financial consequences to the organisation. Controls are then devised to mitigate the risks identified to reduce the potential exposures. The results of the assessments are recorded in Beehive.
AIA protects itself against financial losses by purchasing insurance coverage against a range of operational loss events including business disruption, property damage and internal fraud. The excess amounts and extent of coverage are determined taking into consideration the results of Risk and Control Assessment.
StrategicStrategic risk refers to adverse impacts from unexpected changes to the Group’s operating and market environment. Strategic risk is addressed as part of the business planning process and ongoing monitoring of and response to social, economic, political, regulatory, competitive and technical changes that may impact AIA’s business.
OPERATIONAL RISKSOperationalOperational risk is the risk of direct or indirect loss resulting from inadequate or failed internal processes, personnel and systems or from external events.
Operational Risk is broken down into a common classification which is used across the Group. At the Group level, it is overseen through 13 defined risk areas or Key Operational Risks (KORs). Each KOR is monitored using Key Risk Indicators (KRIs), with a designated First Line Risk Owner for each KOR.
Beneath the 13 KORs are two further levels of risk categorisation. The Group’s Operational Risk database, “Beehive”, is structured around this taxonomy and is used by Risk & Compliance to document incidents, record a risk assessment, describe controls and store KRI data.
The key to Operational Risk management is early identification of issues. AIA has formalised the use of Operational Risk Checklists in relation to a number of activities e.g. products, project management, Business Continuity Planning etc. These ensure that the business identifies the risks before embarking on an activity and then has a clear process for ensuring those risks are managed through to its conclusion.
In the business unit’s First Line Risk Owners and Risk Champions identify emerging issues and escalate them via the business unit risk functions (including business unit risk committees) to Group. Items deemed to have the potential to be noteworthy at the Group level are placed on the Group Risk Watch List for further action and heightened monitoring.
FINANCIAL AND OPERATING REVIEW
ANNUAL REPORT 2015 | 071
OV
ER
VIE
WF
INA
NC
IAL
AN
D O
PE
RA
TIN
G R
EV
IEW
CO
RP
OR
AT
E G
OV
ER
NA
NC
EF
INA
NC
IAL
STA
TE
ME
NT
SA
DD
ITIO
NA
L I
NF
OR
MA
TIO
N
Internationally, the regulatory environment facing life insurers has continued to evolve. In particular, the International Association of Insurance Supervisors (IAIS) continues a multi-year consultation to review certain Insurance Core Principles with the longer-term aim of developing and implementing an updated common framework (ComFrame) for the international regulation of insurance companies.
Regulators across AIA’s span of operations continued a variety of initiatives intended to align their respective regulatory frameworks with the broad principles recommended by the IAIS. AIA continues to be involved in these initiatives across the region, and is an active participant in the international industry dialogue on a host of relevant issues including formation of an international capital standard.
In Hong Kong, legislation was passed in July 2015 in support of the creation of an Independent Insurance Authority. It is anticipated that the Independent Insurance Authority will take over the responsibilities of the HKOCI and will also directly regulate intermediaries beginning in 2017. In addition, under the guidance of the HKOCI, work continues towards the development of a risk-based capital regime. As previously disclosed, AIA is closely and constructively engaged in these developments.
REGULATORY DEVELOPMENTS
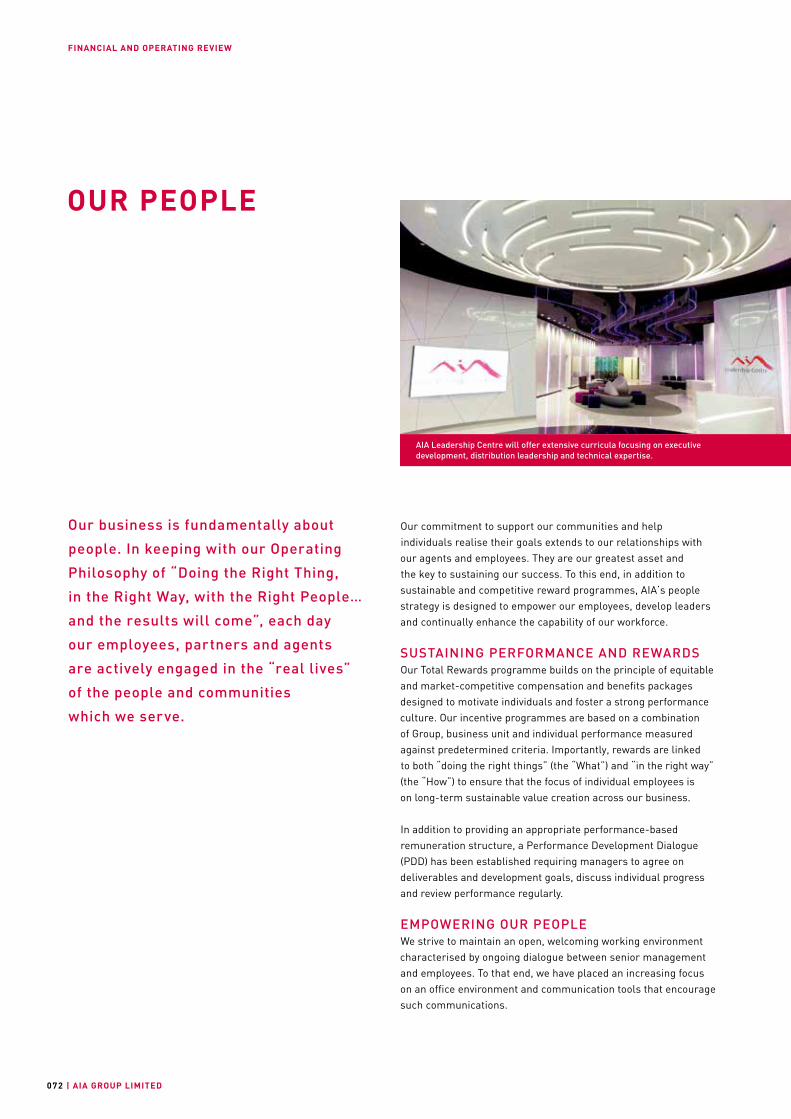
FINANCIAL AND OPERATING REVIEW
| AIA GROUP LIMITED072
OUR PEOPLE
Our commitment to support our communities and help individuals realise their goals extends to our relationships with our agents and employees. They are our greatest asset and the key to sustaining our success. To this end, in addition to sustainable and competitive reward programmes, AIA’s people strategy is designed to empower our employees, develop leaders and continually enhance the capability of our workforce.
SUSTAINING PERFORMANCE AND REWARDSOur Total Rewards programme builds on the principle of equitable and market-competitive compensation and benefits packages designed to motivate individuals and foster a strong performance culture. Our incentive programmes are based on a combination of Group, business unit and individual performance measured against predetermined criteria. Importantly, rewards are linked to both “doing the right things” (the “What”) and “in the right way” (the “How”) to ensure that the focus of individual employees is on long-term sustainable value creation across our business.
In addition to providing an appropriate performance-based remuneration structure, a Performance Development Dialogue (PDD) has been established requiring managers to agree on deliverables and development goals, discuss individual progress and review performance regularly.
EMPOWERING OUR PEOPLEWe strive to maintain an open, welcoming working environment characterised by ongoing dialogue between senior management and employees. To that end, we have placed an increasing focus on an office environment and communication tools that encourage such communications.
AIA Leadership Centre will offer extensive curricula focusing on executive development, distribution leadership and technical expertise.
Our business is fundamentally about
people. In keeping with our Operating
Philosophy of “Doing the Right Thing,
in the Right Way, with the Right People…
and the results will come”, each day
our employees, partners and agents
are actively engaged in the “real lives”
of the people and communities
which we serve.
FINANCIAL AND OPERATING REVIEW
ANNUAL REPORT 2015 | 073
OV
ER
VIE
WF
INA
NC
IAL
AN
D O
PE
RA
TIN
G R
EV
IEW
CO
RP
OR
AT
E G
OV
ER
NA
NC
EF
INA
NC
IAL
STA
TE
ME
NT
SA
DD
ITIO
NA
L I
NF
OR
MA
TIO
N
In order to safeguard our core leadership pool and to ensure robust succession planning, Group leadership continues to build on our established annual Organisation and People Review (OPR) which now covers more than 1,200 individuals Group-wide in senior positions. This includes a review of organisation structure, leadership and technical capabilities, as well as our talent and development pipeline. Follow-up actions are tracked on a quarterly basis through meetings with our Regional Chief Executives. To provide clear steps and support career development for all employees, we have also formalised career conversations in the Performance Development Dialogue process whereby managers and employees engage in two-way dialogues that cover career aspirations and development actions. The deep knowledge of our developing leaders through the OPR process and our other development programmes contributed materially to the Group having been able to fill 10 CEO and Group Functional Head positions with internal candidates in 2015.
A key component of our ongoing commitment to leadership development is the creation of our proprietary Leadership Centre that will open in the first quarter of 2016. Located in our newly completed Grade A office complex in Bangkok, the Centre will be an exclusive bespoke facility for leaders from across the Group to come together and be part of focused and customised leadership development and training programmes. The Centre will offer extensive curricula focusing on executive development, distribution leadership and technical expertise.
ENHANCING WORKFORCE CAPABILITYAs part of our comprehensive employee development framework, we regularly provide opportunities for employees to develop by applying their energies in new ways. During the year, more than 700 internal transfers took place across the Group. A number of these opportunities involve movements between business units or functional areas. To support this “mobility initiative”, we have enhanced our internal career website to include a series of job-mobility guides to highlight opportunities for development. Customised mobility programmes were also formalised in selected functions such as Actuarial, Corporate Solutions, Human Resources and Internal Audit to drive development in areas identified as well suited to such initiatives.
To ensure that developing leaders also have the support that they need, our formal mentoring programme was expanded, leading to more than 100 new mentor-mentee relationships being established in 2015.
In addition, a People Manager Accelerator Programme was piloted across a number of functions to offer a structured “career roadmap” to employees within those functional areas. Building on the success of the pilot programme, similar roadmaps are in development and will be introduced to other functions progressively throughout 2016.
In addition to the everyday dialogue between employees within functions and business units, the interactions between employees across functions and geographies underpin our development as an organisation and help us make the most of our unique pan-Asian market presence. In support of this dynamic we continue to utilise technology, including an enterprise social network (“WAVE”), designed to encourage the exchange of ideas and knowledge at all levels of our organisation. With the addition of mobile-friendly apps, our employees are further encouraged to engage with one another from anywhere and at any time.
Our annual Leadership Conference and Group Office Summit are just two of the many opportunities for our top leaders from across the Group to gather with employees to discuss our successes to date, explore emerging opportunities and plan the execution of bold strategies to drive AIA’s performance.
To track the engagement of our 20,000 employees across the region, AIA conducts an annual company-wide employee engagement survey. In 2015, 98.8 per cent of our workforce responded to the survey. The results of this survey are then reviewed in detail with managers and action plans are developed and refined to ensure that genuine engagement on the part of our employees is always at the forefront of our thinking. Engagement scores have risen to levels above our targeted global benchmarks and this will remain a focus area for management throughout the Group.
STRENGTHENING LEADERSHIPWe recognise the importance of continuing to develop the capability of future leaders within our organisation. This continuing development underpins our ability to continue to deliver sustainable value to shareholders, real solutions to customers and keep our promises to our employees and agents.
In 2015, alongside our established learning and development programmes, we delivered on our commitment to implement several new fit-for-purpose initiatives. Included in this broader initiative, our “Enterprise Leadership Programme” was introduced with the aim of instilling in our senior leadership team the qualities we view as essential to realising on our operating philosophy while supporting our vision of being the pre-eminent life insurance provider in the Asia-Pacific region.
Following the roll-out of our signature, in-house managerial programme series in 2012, “The AIA Manager III” programme was launched this year to deepen middle and senior managers’ understanding of how to leverage their strengths to optimise working relationships and coach team members to help them to realise their full potential.
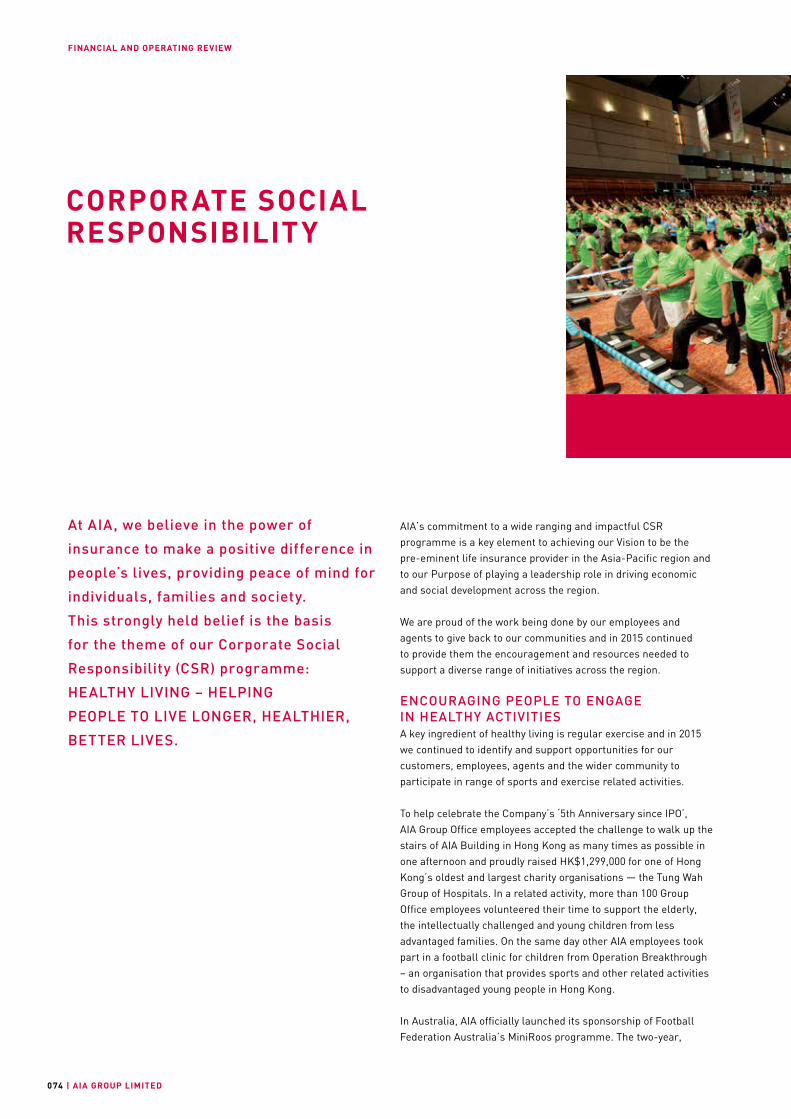
FINANCIAL AND OPERATING REVIEW
| AIA GROUP LIMITED074
CORPORATE SOCIAL RESPONSIBILITY
AIA’s commitment to a wide ranging and impactful CSR programme is a key element to achieving our Vision to be the pre-eminent life insurance provider in the Asia-Pacific region and to our Purpose of playing a leadership role in driving economic and social development across the region.
We are proud of the work being done by our employees and agents to give back to our communities and in 2015 continued to provide them the encouragement and resources needed to support a diverse range of initiatives across the region.
ENCOURAGING PEOPLE TO ENGAGE IN HEALTHY ACTIVITIESA key ingredient of healthy living is regular exercise and in 2015 we continued to identify and support opportunities for our customers, employees, agents and the wider community to participate in range of sports and exercise related activities.
To help celebrate the Company’s ‘5th Anniversary since IPO’, AIA Group Office employees accepted the challenge to walk up the stairs of AIA Building in Hong Kong as many times as possible in one afternoon and proudly raised HK$1,299,000 for one of Hong Kong’s oldest and largest charity organisations — the Tung Wah Group of Hospitals. In a related activity, more than 100 Group Office employees volunteered their time to support the elderly, the intellectually challenged and young children from less advantaged families. On the same day other AIA employees took part in a football clinic for children from Operation Breakthrough – an organisation that provides sports and other related activities to disadvantaged young people in Hong Kong.
In Australia, AIA officially launched its sponsorship of Football Federation Australia’s MiniRoos programme. The two-year,
At AIA, we believe in the power of
insurance to make a positive difference in
people’s lives, providing peace of mind for
individuals, families and society.
This strongly held belief is the basis
for the theme of our Corporate Social
Responsibility (CSR) programme:
HEALTHY LIVING – HELPING
PEOPLE TO LIVE LONGER, HEALTHIER,
BETTER LIVES.
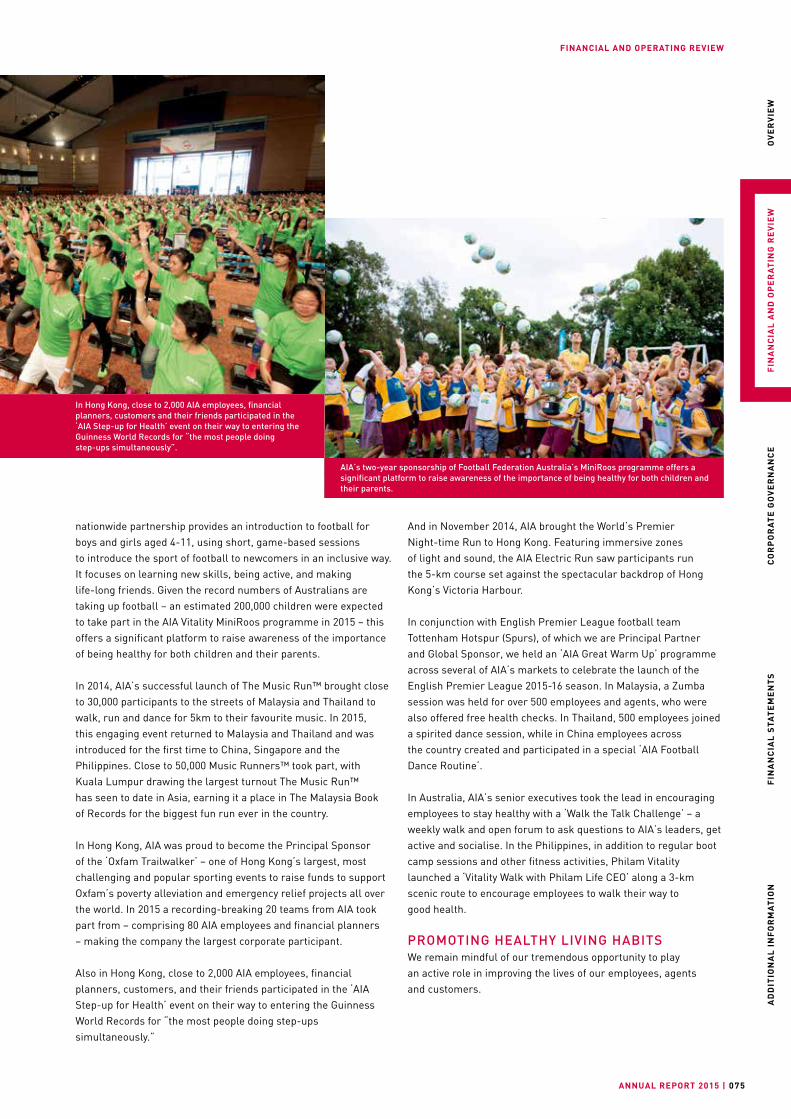
FINANCIAL AND OPERATING REVIEW
ANNUAL REPORT 2015 | 075
OV
ER
VIE
WF
INA
NC
IAL
AN
D O
PE
RA
TIN
G R
EV
IEW
CO
RP
OR
AT
E G
OV
ER
NA
NC
EF
INA
NC
IAL
STA
TE
ME
NT
SA
DD
ITIO
NA
L I
NF
OR
MA
TIO
N
nationwide partnership provides an introduction to football for boys and girls aged 4-11, using short, game-based sessions to introduce the sport of football to newcomers in an inclusive way. It focuses on learning new skills, being active, and making life-long friends. Given the record numbers of Australians are taking up football – an estimated 200,000 children were expected to take part in the AIA Vitality MiniRoos programme in 2015 – this offers a significant platform to raise awareness of the importance of being healthy for both children and their parents.
In 2014, AIA’s successful launch of The Music Run™ brought close to 30,000 participants to the streets of Malaysia and Thailand to walk, run and dance for 5km to their favourite music. In 2015, this engaging event returned to Malaysia and Thailand and was introduced for the first time to China, Singapore and the Philippines. Close to 50,000 Music Runners™ took part, with Kuala Lumpur drawing the largest turnout The Music Run™ has seen to date in Asia, earning it a place in The Malaysia Book of Records for the biggest fun run ever in the country.
In Hong Kong, AIA was proud to become the Principal Sponsor of the ‘Oxfam Trailwalker’ – one of Hong Kong’s largest, most challenging and popular sporting events to raise funds to support Oxfam’s poverty alleviation and emergency relief projects all over the world. In 2015 a recording-breaking 20 teams from AIA took part from – comprising 80 AIA employees and financial planners – making the company the largest corporate participant.
Also in Hong Kong, close to 2,000 AIA employees, financial planners, customers, and their friends participated in the ‘AIA Step-up for Health’ event on their way to entering the Guinness World Records for “the most people doing step-ups simultaneously.”
And in November 2014, AIA brought the World’s Premier Night-time Run to Hong Kong. Featuring immersive zones of light and sound, the AIA Electric Run saw participants run the 5-km course set against the spectacular backdrop of Hong Kong’s Victoria Harbour.
In conjunction with English Premier League football team Tottenham Hotspur (Spurs), of which we are Principal Partner and Global Sponsor, we held an ‘AIA Great Warm Up’ programme across several of AIA’s markets to celebrate the launch of the English Premier League 2015-16 season. In Malaysia, a Zumba session was held for over 500 employees and agents, who were also offered free health checks. In Thailand, 500 employees joined a spirited dance session, while in China employees across the country created and participated in a special ‘AIA Football Dance Routine’.
In Australia, AIA’s senior executives took the lead in encouraging employees to stay healthy with a ‘Walk the Talk Challenge’ – a weekly walk and open forum to ask questions to AIA’s leaders, get active and socialise. In the Philippines, in addition to regular boot camp sessions and other fitness activities, Philam Vitality launched a ‘Vitality Walk with Philam Life CEO’ along a 3-km scenic route to encourage employees to walk their way to good health.
PROMOTING HEALTHY LIVING HABITSWe remain mindful of our tremendous opportunity to play an active role in improving the lives of our employees, agents and customers.
In Hong Kong, close to 2,000 AIA employees, financial planners, customers and their friends participated in the ‘AIA Step-up for Health’ event on their way to entering the Guinness World Records for “the most people doing step-ups simultaneously”.
AIA’s two-year sponsorship of Football Federation Australia’s MiniRoos programme offers a significant platform to raise awareness of the importance of being healthy for both children and their parents.
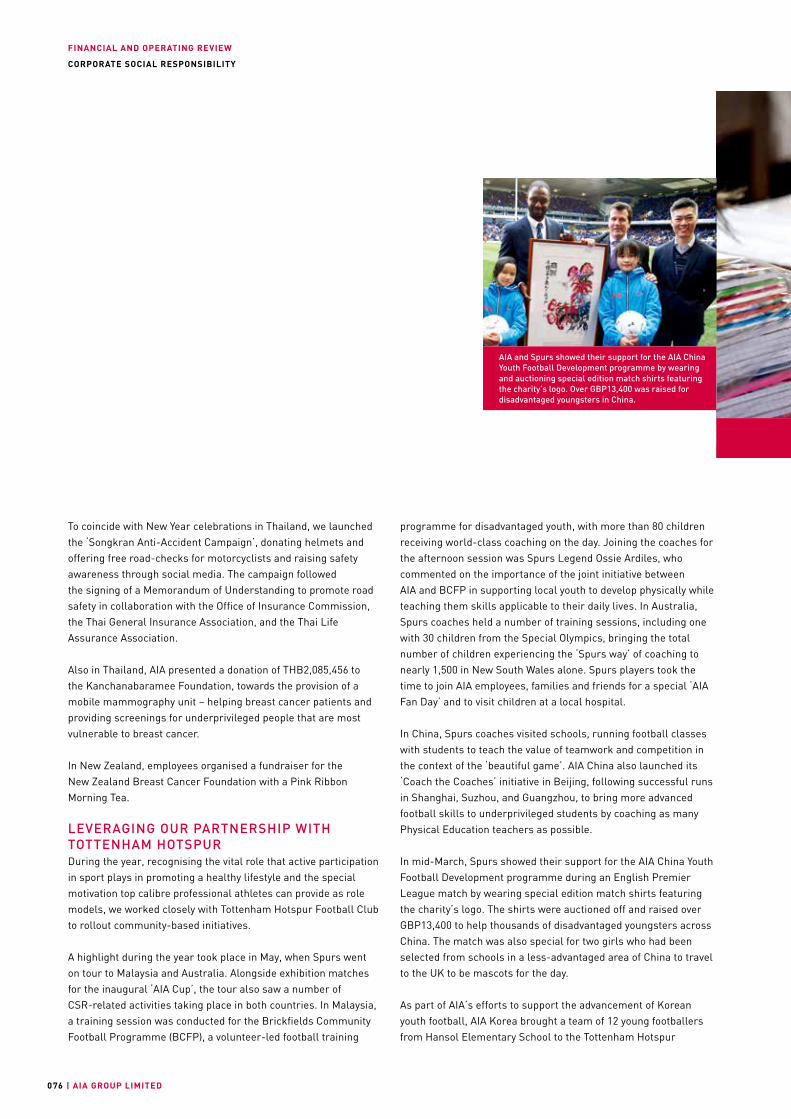
FINANCIAL AND OPERATING REVIEW
| AIA GROUP LIMITED076
CORPORATE SOCIAL RESPONSIBILITY
To coincide with New Year celebrations in Thailand, we launched the ‘Songkran Anti-Accident Campaign’, donating helmets and offering free road-checks for motorcyclists and raising safety awareness through social media. The campaign followed the signing of a Memorandum of Understanding to promote road safety in collaboration with the Office of Insurance Commission, the Thai General Insurance Association, and the Thai Life Assurance Association.
Also in Thailand, AIA presented a donation of THB2,085,456 to the Kanchanabaramee Foundation, towards the provision of a mobile mammography unit – helping breast cancer patients and providing screenings for underprivileged people that are most vulnerable to breast cancer.
In New Zealand, employees organised a fundraiser for the New Zealand Breast Cancer Foundation with a Pink Ribbon Morning Tea.
LEVERAGING OUR PARTNERSHIP WITH TOTTENHAM HOTSPURDuring the year, recognising the vital role that active participation in sport plays in promoting a healthy lifestyle and the special motivation top calibre professional athletes can provide as role models, we worked closely with Tottenham Hotspur Football Club to rollout community-based initiatives.
A highlight during the year took place in May, when Spurs went on tour to Malaysia and Australia. Alongside exhibition matches for the inaugural ‘AIA Cup’, the tour also saw a number of CSR-related activities taking place in both countries. In Malaysia, a training session was conducted for the Brickfields Community Football Programme (BCFP), a volunteer-led football training
programme for disadvantaged youth, with more than 80 children receiving world-class coaching on the day. Joining the coaches for the afternoon session was Spurs Legend Ossie Ardiles, who commented on the importance of the joint initiative between AIA and BCFP in supporting local youth to develop physically while teaching them skills applicable to their daily lives. In Australia, Spurs coaches held a number of training sessions, including one with 30 children from the Special Olympics, bringing the total number of children experiencing the ‘Spurs way’ of coaching to nearly 1,500 in New South Wales alone. Spurs players took the time to join AIA employees, families and friends for a special ‘AIA Fan Day’ and to visit children at a local hospital.
In China, Spurs coaches visited schools, running football classes with students to teach the value of teamwork and competition in the context of the ‘beautiful game’. AIA China also launched its ‘Coach the Coaches’ initiative in Beijing, following successful runs in Shanghai, Suzhou, and Guangzhou, to bring more advanced football skills to underprivileged students by coaching as many Physical Education teachers as possible.
In mid-March, Spurs showed their support for the AIA China Youth Football Development programme during an English Premier League match by wearing special edition match shirts featuring the charity’s logo. The shirts were auctioned off and raised over GBP13,400 to help thousands of disadvantaged youngsters across China. The match was also special for two girls who had been selected from schools in a less-advantaged area of China to travel to the UK to be mascots for the day.
As part of AIA’s efforts to support the advancement of Korean youth football, AIA Korea brought a team of 12 young footballers from Hansol Elementary School to the Tottenham Hotspur
AIA and Spurs showed their support for the AIA China Youth Football Development programme by wearing and auctioning special edition match shirts featuring the charity’s logo. Over GBP13,400 was raised for disadvantaged youngsters in China.

FINANCIAL AND OPERATING REVIEW
ANNUAL REPORT 2015 | 077
OV
ER
VIE
WF
INA
NC
IAL
AN
D O
PE
RA
TIN
G R
EV
IEW
CO
RP
OR
AT
E G
OV
ER
NA
NC
EF
INA
NC
IAL
STA
TE
ME
NT
SA
DD
ITIO
NA
L I
NF
OR
MA
TIO
N
CORPORATE SOCIAL RESPONSIBILITY
In Cambodia, AIA announced a partnership with Cambodia Charitable Trust to support 16 schools and two teacher training colleges and raise educational standards, strengthen economic community development and improve health.
Training Centre in London for one day of advanced football training by Spurs youth academy coaches. The U-12 contingent then represented Korea at the Danone Nation’s Cup, the world’s largest U-12 international football competition. Earlier in the year, AIA and the Spurs U-15 team donated footballs and football shoes to underprivileged children in Yeongdeok-gun, Gyeongsangbuk-do.
In Thailand, we held the AIA Football Clinic 2015 to provide 1,200 children with positive experiences and techniques through the medium of football.
THE POWER OF EDUCATION...CONNECTING BODY AND MINDThe association between education and health has been well documented and many of our markets have long established partnerships and programmes through which they support the education of children and young adults.
In Vietnam, AIA extended its ‘Real Life Journey’ initiative into 2015. With over 200,000 children in the country dropping out of school each year, primarily because of the long distances they need to travel to and from school each day, this initiative continued to raise much needed funds through a series of 15 cycling events across Vietnam that result in the purchase of bicycles for children to ease the burden of getting to and from school each day. In 2015, AIA Vietnam employees and agents, along with colleagues from across the Group committed to donating more than 1,000 bicycles.
In Thailand, as part of our ‘AIA School Libraries’ project, AIA bestowed funds to establish libraries in schools across the country. In Sri Lanka, AIA donated a new building to Kokkadicholai Ramakrishnam Maha Vidyalayam School to inspire academic excellence among the children in previously war torn areas in the
North and East. And in the Philippines, where as a result of frequent torrential rains and high humidity many public schools require constant maintenance to create an environment conducive to learning, AIA made possible the repainting of a Maths building at a local school. A three-classroom building was also donated to Taguig National High School under our Philam Paaralan Programme, which has seen over 80 classrooms donated across the country since 2011.
In our newest market, Cambodia, AIA announced a partnership with Cambodia Charitable Trust, a New Zealand–based charity founded in 2008 that aims to break the poverty cycle in Cambodia. Supporting 16 schools and two teacher training colleges, the organisation works towards raising educational standards, strengthening economic community development and improving health in order to transform the lives of those living in the Takeo and Kampot provinces. From 24-26 June, AIA delegates visited Ang Run, Ang Sleng and Ta Tay Primary Schools and met with representatives from the Takeo and Kampot teacher training colleges. They provided support by distributing six months’ worth of hygiene and school supplies to 480 teacher trainees and presented 340 primary school students with Spurs football jerseys, school uniforms, library books and stationery packs to last 12 months. During the visit, Ta Tay and Ang Sleng Primary Schools each had one classroom tiled, painted and furnished, and had toys and games delivered to the preschool children. Approximately US$16,000 was raised by AIA executives, and over 800 children benefited from the visit.
Recognising the power of higher education to bring about positive change in the lives of individuals as they continue their life journey, AIA presented scholarships to students in Sri Lanka, Vietnam and Indonesia.
In the Philippines, where as a result of torrential rains and high humidity many public schools require constant maintenance, AIA made possible the repainting of a Maths building at a local school. Over 80 classrooms have been donated across the country since 2011.
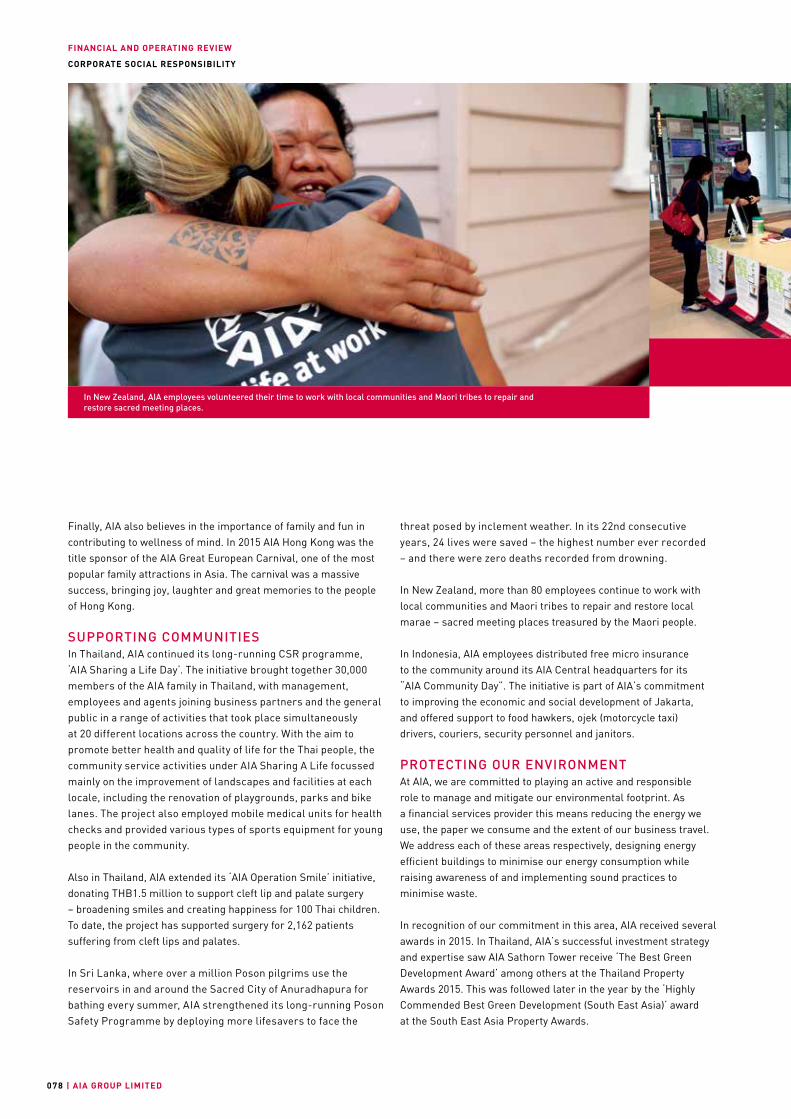
FINANCIAL AND OPERATING REVIEW
| AIA GROUP LIMITED078
CORPORATE SOCIAL RESPONSIBILITY
Finally, AIA also believes in the importance of family and fun in contributing to wellness of mind. In 2015 AIA Hong Kong was the title sponsor of the AIA Great European Carnival, one of the most popular family attractions in Asia. The carnival was a massive success, bringing joy, laughter and great memories to the people of Hong Kong.
SUPPORTING COMMUNITIESIn Thailand, AIA continued its long-running CSR programme, ‘AIA Sharing a Life Day’. The initiative brought together 30,000 members of the AIA family in Thailand, with management, employees and agents joining business partners and the general public in a range of activities that took place simultaneously at 20 different locations across the country. With the aim to promote better health and quality of life for the Thai people, the community service activities under AIA Sharing A Life focussed mainly on the improvement of landscapes and facilities at each locale, including the renovation of playgrounds, parks and bike lanes. The project also employed mobile medical units for health checks and provided various types of sports equipment for young people in the community.
Also in Thailand, AIA extended its ‘AIA Operation Smile’ initiative, donating THB1.5 million to support cleft lip and palate surgery – broadening smiles and creating happiness for 100 Thai children. To date, the project has supported surgery for 2,162 patients suffering from cleft lips and palates.
In Sri Lanka, where over a million Poson pilgrims use the reservoirs in and around the Sacred City of Anuradhapura for bathing every summer, AIA strengthened its long-running Poson Safety Programme by deploying more lifesavers to face the
threat posed by inclement weather. In its 22nd consecutive years, 24 lives were saved – the highest number ever recorded – and there were zero deaths recorded from drowning.
In New Zealand, more than 80 employees continue to work with local communities and Maori tribes to repair and restore local marae – sacred meeting places treasured by the Maori people.
In Indonesia, AIA employees distributed free micro insurance to the community around its AIA Central headquarters for its “AIA Community Day”. The initiative is part of AIA’s commitment to improving the economic and social development of Jakarta, and offered support to food hawkers, ojek (motorcycle taxi) drivers, couriers, security personnel and janitors.
PROTECTING OUR ENVIRONMENTAt AIA, we are committed to playing an active and responsible role to manage and mitigate our environmental footprint. As a financial services provider this means reducing the energy we use, the paper we consume and the extent of our business travel. We address each of these areas respectively, designing energy efficient buildings to minimise our energy consumption while raising awareness of and implementing sound practices to minimise waste.
In recognition of our commitment in this area, AIA received several awards in 2015. In Thailand, AIA’s successful investment strategy and expertise saw AIA Sathorn Tower receive ‘The Best Green Development Award’ among others at the Thailand Property Awards 2015. This was followed later in the year by the ‘Highly Commended Best Green Development (South East Asia)’ award at the South East Asia Property Awards.
In New Zealand, AIA employees volunteered their time to work with local communities and Maori tribes to repair and restore sacred meeting places.
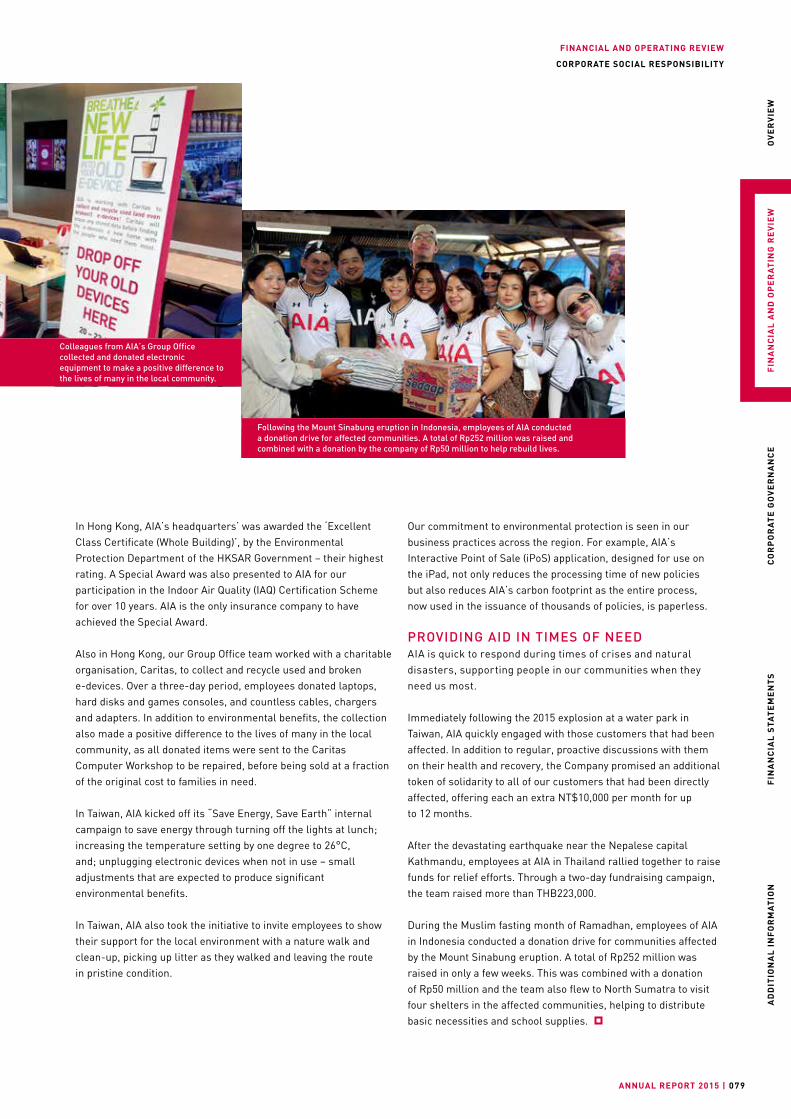
FINANCIAL AND OPERATING REVIEW
ANNUAL REPORT 2015 | 079
OV
ER
VIE
WF
INA
NC
IAL
AN
D O
PE
RA
TIN
G R
EV
IEW
CO
RP
OR
AT
E G
OV
ER
NA
NC
EF
INA
NC
IAL
STA
TE
ME
NT
SA
DD
ITIO
NA
L I
NF
OR
MA
TIO
N
CORPORATE SOCIAL RESPONSIBILITY
Our commitment to environmental protection is seen in our business practices across the region. For example, AIA’s Interactive Point of Sale (iPoS) application, designed for use on the iPad, not only reduces the processing time of new policies but also reduces AIA’s carbon footprint as the entire process, now used in the issuance of thousands of policies, is paperless.
PROVIDING AID IN TIMES OF NEEDAIA is quick to respond during times of crises and natural disasters, supporting people in our communities when they need us most.
Immediately following the 2015 explosion at a water park in Taiwan, AIA quickly engaged with those customers that had been affected. In addition to regular, proactive discussions with them on their health and recovery, the Company promised an additional token of solidarity to all of our customers that had been directly affected, offering each an extra NT$10,000 per month for up to 12 months.
After the devastating earthquake near the Nepalese capital Kathmandu, employees at AIA in Thailand rallied together to raise funds for relief efforts. Through a two-day fundraising campaign, the team raised more than THB223,000.
During the Muslim fasting month of Ramadhan, employees of AIA in Indonesia conducted a donation drive for communities affected by the Mount Sinabung eruption. A total of Rp252 million was raised in only a few weeks. This was combined with a donation of Rp50 million and the team also flew to North Sumatra to visit four shelters in the affected communities, helping to distribute basic necessities and school supplies.
Following the Mount Sinabung eruption in Indonesia, employees of AIA conducted a donation drive for affected communities. A total of Rp252 million was raised and combined with a donation by the company of Rp50 million to help rebuild lives.
In Hong Kong, AIA’s headquarters’ was awarded the ‘Excellent Class Certificate (Whole Building)’, by the Environmental Protection Department of the HKSAR Government – their highest rating. A Special Award was also presented to AIA for our participation in the Indoor Air Quality (IAQ) Certification Scheme for over 10 years. AIA is the only insurance company to have achieved the Special Award.
Also in Hong Kong, our Group Office team worked with a charitable organisation, Caritas, to collect and recycle used and broken e-devices. Over a three-day period, employees donated laptops, hard disks and games consoles, and countless cables, chargers and adapters. In addition to environmental benefits, the collection also made a positive difference to the lives of many in the local community, as all donated items were sent to the Caritas Computer Workshop to be repaired, before being sold at a fraction of the original cost to families in need.
In Taiwan, AIA kicked off its “Save Energy, Save Earth” internal campaign to save energy through turning off the lights at lunch; increasing the temperature setting by one degree to 26°C, and; unplugging electronic devices when not in use – small adjustments that are expected to produce significant environmental benefits.
In Taiwan, AIA also took the initiative to invite employees to show their support for the local environment with a nature walk and clean-up, picking up litter as they walked and leaving the route in pristine condition.
Colleagues from AIA’s Group Office collected and donated electronic equipment to make a positive difference to the lives of many in the local community.
| AIA GROUP LIMITED080
CORPORATE GOVERNANCE
Statement of Directors’ Responsibilities .........................081
Board of Directors ...........................................................082
Executive Committee .......................................................088
Report of the Directors ....................................................092
Corporate Governance Report .........................................099
Remuneration Report ......................................................107
CORPORATE GOVERNANCE
ANNUAL REPORT 2015 | 081
OV
ER
VIE
WF
INA
NC
IAL
AN
D O
PE
RA
TIN
G R
EV
IEW
CO
RP
OR
AT
E G
OV
ER
NA
NC
EF
INA
NC
IAL
STA
TE
ME
NT
SA
DD
ITIO
NA
L I
NF
OR
MA
TIO
N
STATEMENT OF DIRECTORS’ RESPONSIBILITIES
The Directors are responsible for preparing the Company’s consolidated financial statements in accordance with applicable laws and regulations.
In preparing the consolidated financial statements of the Company, the Directors are required to:
• Select suitable accounting policies and apply them consistently;
• Make judgments and estimates that are reasonable and prudent;
• State whether the financial statements have been prepared in accordance with Hong Kong Financial Reporting Standards and International Financial Reporting Standards; and
• Prepare the financial statements on a going concern basis, unless it is not appropriate to make the presumption that the Group will continue in business.
The Directors are responsible for keeping proper accounting records that give a true and fair view of the state of the Company’s affairs and explain its transactions.
The Directors are responsible for taking reasonable steps to safeguard the assets of the Group and to prevent and detect fraud and other irregularities. The Directors are also responsible for preparing a Report of the Directors and the Corporate Governance Report on pages 92 to 106 of this Annual Report.
The Directors confirm that to the best of their knowledge:
1. the consolidated financial statements of the Company, prepared in accordance with Hong Kong Financial Reporting Standards and International Financial Reporting Standards, give a true and fair view of the assets, liabilities, financial position, cash flows and results of the Company and its undertakings included in the consolidated financial statements taken as a whole; and
2. the section headed “Financial and Operating Review” included in this Annual Report presents a fair review of the development and performance of the business and the position of the Company and the undertakings included in the consolidated financial statements taken as a whole, together with a description of the principal risks and uncertainties the Company faces.

CORPORATE GOVERNANCE
| AIA GROUP LIMITED082
BOARD OF DIRECTORS
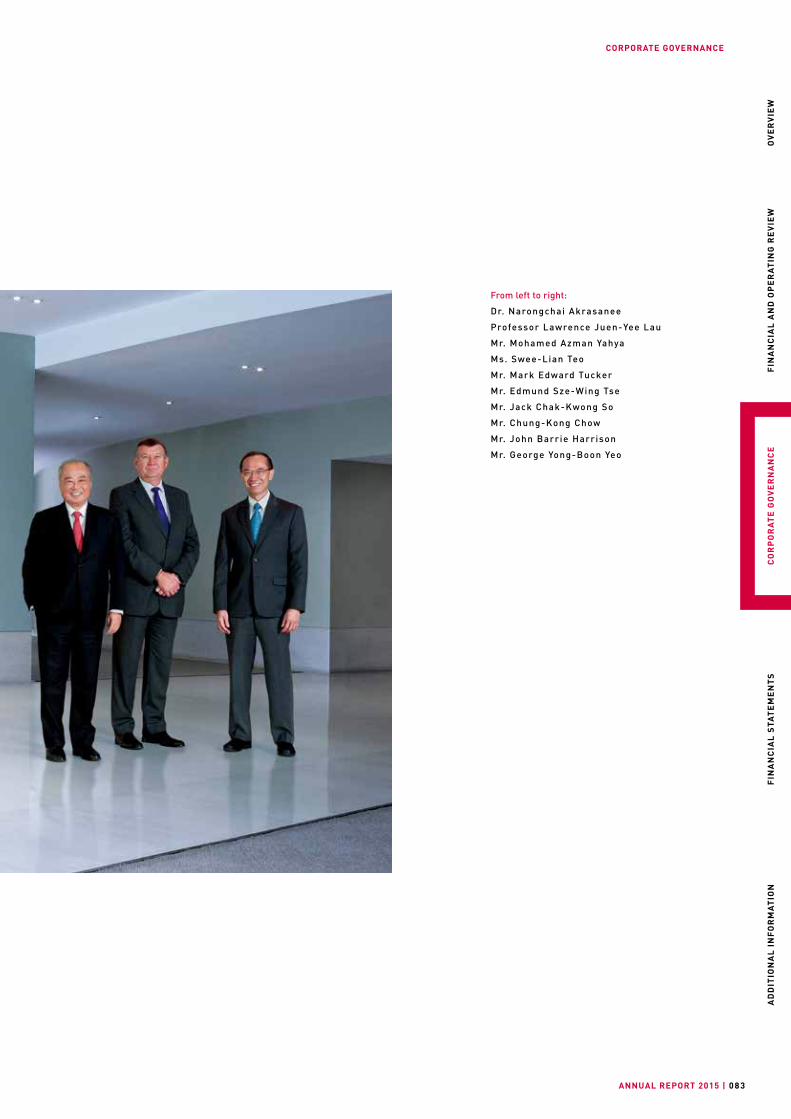
CORPORATE GOVERNANCE
ANNUAL REPORT 2015 | 083
OV
ER
VIE
WF
INA
NC
IAL
AN
D O
PE
RA
TIN
G R
EV
IEW
CO
RP
OR
AT
E G
OV
ER
NA
NC
EF
INA
NC
IAL
STA
TE
ME
NT
SA
DD
ITIO
NA
L I
NF
OR
MA
TIO
N
From left to right:
Dr. Narongchai Akrasanee
Professor Lawrence Juen-Yee Lau
Mr. Mohamed Azman Yahya
Ms. Swee-Lian Teo
Mr. Mark Edward Tucker
Mr. Edmund Sze-Wing Tse
Mr. Jack Chak-Kwong So
Mr. Chung-Kong Chow
Mr. John Barrie Harrison
Mr. George Yong-Boon Yeo
CORPORATE GOVERNANCE
| AIA GROUP LIMITED08 4
BOARD OF DIRECTORS
NON-EXECUTIVE CHAIRMAN AND NON-EXECUTIVE DIRECTOR Mr. Edmund Sze-Wing TseAged 78, is the Non-executive Chairman and a Non-executive Director of the Company. He was appointed Non-executive Director of the Company on 27 September 2010 and was elected Non-executive Chairman on 1 January 2011. He is also the Chairman of AIA Foundation. Mr. Tse’s appointments during more than 50 years with the Group and its predecessor AIG Group, include serving as Honorary Chairman of AIA Co. from July 2009 to December 2010, Chairman and Chief Executive Officer from 2000 to June 2009 and President and Chief Executive Officer from 1983 to 2000. He also served as Chairman of The Philippine American Life and General Insurance (PHILAM LIFE) Company from 2005 to 2015. Mr. Tse is a non-executive director of PCCW Limited and a director of Bridge Holdings Company Limited. He served as a non-executive director of PineBridge Investments Limited from 2012 to 2014 and a non-executive director of PICC Property and Casualty Company Limited from 2004 to July 2014. In recognition of his outstanding contributions to the development of Hong Kong’s insurance industry, Mr. Tse was awarded the Gold Bauhinia Star by the HKSAR Government in 2001. Mr. Tse received an honorary fellowship and an honorary degree of Doctor of Social Sciences from The University of Hong Kong in 1998 and 2002 respectively. In 2003, he was elected to the prestigious Insurance Hall of Fame.
EXECUTIVE DIRECTOR AND GROUP CHIEF EXECUTIVE AND PRESIDENTMr. Mark Edward TuckerAged 58, is an Executive Director and the Group Chief Executive and President of the Company. Mr. Tucker joined the Group in July 2010 and is also Chairman and Chief Executive Officer of AIA Co. and AIA International. Mr. Tucker spearheaded AIA’s record-breaking IPO on 29 October 2010, serving as Executive Chairman and Group Chief Executive Officer of the Company from 12 October 2010 to 31 December 2010. In addition to his responsibilities with AIA, Mr. Tucker has been an Independent Director of The Goldman Sachs Group, Inc. since November 2012. Mr. Tucker is an Associate Professor at the Chinese University of Hong Kong. He serves on the Asia Business Council and the Advisory Board of the Asia Global Institute. He is also a member of the International Advisory Boards of the Lingnan College, Sun Yat-Sen University in China, the Discovery Group of South Africa and the Edinburgh Festival International. Prior to joining the Group, Mr. Tucker was a non-executive director of the Court of The Bank of England from June 2009 to May 2012, also serving as a member of its Financial Stability Committee and Audit and Risk Committee. Mr. Tucker also served as Group Chief Executive of Prudential plc from 2005 to 2009 and was the founder and Chief Executive of Prudential Corporation Asia Limited from 1994 to 2003 and an Executive Director of Prudential plc from 1999 to 2003. From 2004 to 2005 Mr. Tucker served as Group Finance Director, HBOS plc. Mr. Tucker qualified as an Associate of the Institute of Chartered Accountants in England and Wales (ACA) in 1985.
CORPORATE GOVERNANCE
ANNUAL REPORT 2015 | 085
OV
ER
VIE
WF
INA
NC
IAL
AN
D O
PE
RA
TIN
G R
EV
IEW
CO
RP
OR
AT
E G
OV
ER
NA
NC
EF
INA
NC
IAL
STA
TE
ME
NT
SA
DD
ITIO
NA
L I
NF
OR
MA
TIO
N
BOARD OF DIRECTORS
INDEPENDENT NON-EXECUTIVE DIRECTORSMr. Jack Chak-Kwong SoAged 70, is an Independent Non-executive Director of the Company. He was appointed a Non-executive Director of the Company on 28 September 2010 and re-designated as an Independent Non-executive Director of the Company on 26 September 2012. From August 2007 to September 2010, Mr. So served as an Independent Non-executive Director of AIA Co. He is currently an independent non-executive director of China Resources Power Holdings Co. Ltd., a non-executive director of Huanxi Media Group Limited and serves as the Chairman of Airport Authority Hong Kong. He is also an independent senior advisor to Credit Suisse, Greater China and an advisor to The Hong Kong and China Gas Company Limited. Mr. So was Chairman of the Consultative Committee on Economic and Trade Co-operation between Hong Kong and the Mainland from October 2013 to December 2015. He has been a member of the Chinese People’s Political Consultative Conference since 2008. Mr. So was awarded the Gold Bauhinia Star by the HKSAR Government in 2011. He is also the Honorary Consultant to the Mayor of San Francisco. Mr. So served as an executive director of the Hong Kong Trade Development Council from 1985 to 1992 and served as its Chairman from 2007 to 2015. He was an independent non-executive director of Cathay Pacific Airways Limited from 2002 to May 2015 and served as the Chairman of the Hong Kong Film Development Council from 2007 to 2013.
Mr. Chung-Kong ChowAged 65, is an Independent Non-executive Director of the Company having been appointed on 28 September 2010. Mr. Chow is the Chairman of Hong Kong Exchanges and Clearing Limited. He was appointed a non-official member of the Executive Council of Hong Kong from 1 July 2012 and the Chairman of the Advisory Committee on Corruption of the Independent Commission Against Corruption from 1 January 2013. He has also
been a Steward of The Hong Kong Jockey Club since March 2011. Mr. Chow was knighted in the United Kingdom for his contribution to industry in 2000 and was awarded the Gold Bauhinia Star by the HKSAR Government in 2015. Mr. Chow was Chief Executive Officer of MTR Corporation Limited from 2003 to 2011, Chief Executive Officer of Brambles Industries plc, a global support services company from 2001 to 2003, and Chief Executive of GKN plc, a leading industrial company based in the United Kingdom from 1997 to 2001. He was an independent non-executive director of Anglo American plc from 2008 to 2014, independent non-executive director of Standard Chartered plc from 1997 to 2008 and the Chairman of the Hong Kong General Chamber of Commerce from 2012 to June 2014.
Mr. John Barrie HarrisonAged 59, is an Independent Non-executive Director of the Company having been appointed on 1 July 2011. Mr. Harrison is an independent non-executive director of Hong Kong Exchanges and Clearing Limited, The London Metal Exchange Limited, LME Clear Limited and Cathay Pacific Airways Limited. He is also an independent non-executive director of BW Group Limited and has been Vice Chairman of BW LPG Limited since 2013. Mr. Harrison is a council member, standing committee member and honorary treasurer of The Hong Kong University of Science and Technology. From 2008 to 2010, Mr. Harrison was Deputy Chairman of KPMG International. In 2003, he was elected Chairman and Chief Executive Officer of KPMG, China and Hong Kong and Chairman of KPMG Asia Pacific. Mr. Harrison began his career with KPMG in London in 1977, becoming a partner of KPMG Hong Kong in 1987. From 2012 to May 2015, he was also a member of the Asian Advisory Committee of AustralianSuper Pty Ltd. Mr. Harrison is a Fellow of the Institute of Chartered Accountants in England and Wales and a member of the Hong Kong Institute of Certified Public Accountants.
CORPORATE GOVERNANCE
| AIA GROUP LIMITED086
Mr. George Yong-Boon YeoAged 61, is an Independent Non-executive Director of the Company having been appointed on 2 November 2012. Mr. Yeo is currently the Vice-chairman of Kerry Group Limited and the Chairman of Kerry Logistics Network Limited. He has been a member of the International Advisory Committee of Mitsubishi Corporation since June 2014 and a non-executive director of Wilmar International Limited since November 2014. He is a member of the Board of Trustees of the World Economic Forum and the International Advisory Board of the Berggruen Institute on Governance. In 2013, he was appointed a member of the Pontifical Commission for Reference on the Economic-Administrative Structure of the Holy See. He became a member of the Vatican Council for the Economy in February 2014. In 2012, Mr. Yeo was presented with the Order of Sikatuna by the Philippines Government and the Padma Bhushan by the Indian Government, and became an Honorary Officer of the Order of Australia. From 1988 to 2011, Mr. Yeo was a member of the Singapore Parliament and held various Cabinet positions, including Minister for Foreign Affairs, Minister for Trade and Industry, Minister for Health, Minister for Information and the Arts and Minister of State for Finance. From 1972 to 1988, Mr. Yeo served in the Singapore Armed Forces and attained the rank of Brigadier-General in 1988 when he was Director of Joint Operations and Planning in the Ministry of Defence.
Mr. Mohamed Azman YahyaAged 52, is an Independent Non-executive Director of the Company having been appointed on 24 February 2014. Mr. Yahya is the Executive Chairman of Symphony Life Berhad, the Non-executive Chairman of Ranhill Holdings Berhad and an Independent Non-executive Director of Scomi Group Berhad, all of which are listed on the Main Market of Bursa Malaysia Securities Berhad (Bursa Malaysia). Mr. Yahya is a director of various companies including PLUS Expressways International Berhad and Symphony House Berhad. Mr. Yahya is active in public service and sits on the boards of Khazanah Nasional Berhad, the Malaysian government investment arm and Ekuiti Nasional Berhad, a government linked private equity fund management company. He is also a member of the Capital Market Advisory Group of the Malaysian Securities Commission and a member of the Special Economic Council of the Malaysian Prime Minister’s Department. He is a member of the Institute of Chartered Accountants in England and Wales, the Malaysian Institute of Accountants and a fellow of the Institute of Bankers Malaysia. Mr. Yahya was a director of Malaysian Airline System Berhad and AirAsia Berhad until May 2013 and April 2012 respectively. He started his career at
KPMG in London and worked in a variety of roles in investment banking, ultimately being named chief executive of Amanah Merchant Bank. In 1998, he was tasked by the Malaysian Government to set-up and head Danaharta, the national asset management company. He was also the Chairman of the Corporate Debt Restructuring Committee, set up by Bank Negara Malaysia, to mediate and assist in debt restructuring programmes of viable companies.
Professor Lawrence Juen-Yee LauAged 71, is an Independent Non-executive Director of the Company having been appointed on 18 September 2014. Professor Lau currently serves as an independent non-executive director of CNOOC Limited and Hysan Development Company Limited. He is also an independent non-executive director of Far EasTone Telecommunications Company Limited which is listed on the Taiwan Stock Exchange. He has been serving as the Ralph and Claire Landau Professor of Economics at The Chinese University of Hong Kong (CUHK) since 2007. He currently also serves as a member of the Exchange Fund Advisory Committee of the HKSAR, Chairman of its Governance Sub-committee and a member of its Currency Board Sub-committee and Investment Sub-committee. In addition, he also serves as a member and Chairman of the Prize Recommendation Committee for the LUI Che Woo Prize, as well as Vice-Chairman of the Our Hong Kong Foundation. He was awarded the Gold Bauhinia Star by the HKSAR Government in 2011. From 2004 to 2010, Professor Lau served as Vice-Chancellor (President) of CUHK. He was appointed Chairman of CIC International (Hong Kong) Co., Limited, a wholly-owned subsidiary of China Investment Corporation, in September 2010 and retired from the same in September 2014. He also served as a non-executive director of Semiconductor Manufacturing International Corporation from 2011 to 2014. He is a member of the 12th National Committee of the Chinese People’s Political Consultative Conference and the Vice-Chairman of its Sub-committee of Economics. He received his B.S. degree (with Great Distinction) in Physics from Stanford University in 1964 and his M.A. and Ph.D. degrees in Economics from the University of California at Berkeley in 1966 and 1969 respectively. He joined the faculty of the Department of Economics at Stanford University in 1966, becoming its Professor of Economics in 1976 and the first Kwoh-Ting Li Professor in Economic Development in 1992. From 1992 to 1996, he served as a Co-Director of the Asia-Pacific Research Center at Stanford University, and from 1997 to 1999 as the Director of the Stanford Institute for Economic Policy Research. He became its Kwoh-Ting Li Professor in Economic Development, Emeritus, upon his retirement from Stanford University in 2006.
BOARD OF DIRECTORS
CORPORATE GOVERNANCE
ANNUAL REPORT 2015 | 087
OV
ER
VIE
WF
INA
NC
IAL
AN
D O
PE
RA
TIN
G R
EV
IEW
CO
RP
OR
AT
E G
OV
ER
NA
NC
EF
INA
NC
IAL
STA
TE
ME
NT
SA
DD
ITIO
NA
L I
NF
OR
MA
TIO
N
Dr. Narongchai AkrasaneeAged 70, is an Independent Non-executive Director of the Company having been appointed on 15 January 2016. Dr. Narongchai was previously an Independent Non-executive Director of the Company from 21 November 2012 to 31 August 2014. He is the former Minister of Energy and Minister of Commerce for the Kingdom of Thailand, and served as a Senator. Dr. Narongchai served as Chairman of the Export-Import Bank of Thailand from December 2005 to June 2010, as a Director of the Office of the Insurance Commission of Thailand from October 2007 to August 2012, as a Director of the National Economic and Social Development Board for the period from July 2009 to July 2013 and as a member of the Monetary Policy Committee of the Bank of Thailand from November 2011 to September 2014. He is currently the Chairman of the Steering Committee and Vice-Chairman of the Council of Mekong Institute, the Chairman of the Thailand National Committee for the Pacific Economic Cooperation Council and the Chairman of the Khon Kaen University Council in Thailand.Dr. Narongchai also acts as the Chairman and an independent director of two entities listed on the Stock Exchange of Thailand, namely MFC Asset Management Public Company Limited and Ananda Development Public Company Limited. He is also the Chairman and an independent director of The Brooker Group Public Company Limited, which is listed on the Stock Exchange of Thailand’s Market for Alternative Investment. Dr. Narongchai is the Chairman of the Seranee Group of companies. He previously served as an independent director of each of Malee Sampran Public Company Limited and ABICO Holdings Public Company Limited and as the Vice-Chairman and an independent director of Thai-German Products Public Company Limited, companies listed on the Stock Exchange of Thailand. Dr. Narongchai received a Bachelor’s degree in Economics with Honours from the University of Western Australia and M.A. and Ph.D. in Economics from Johns Hopkins University.
Ms. Swee-Lian TeoAged 56, is an Independent Non-executive Director of the Company having been appointed on 14 August 2015. Ms. Teo currently serves as a non-executive and independent director and a member of the Audit Committee, Executive Resource and Compensation Committee and Risk Committee of Singapore Telecommunications Limited, which is listed on the Singapore Exchange. She is also a non-executive director and Chairlady of the Audit and Risk Committee of Avanda Investment Management Pte Ltd., a Singapore-based fund management company. Ms. Teo has over 27 years of experience with the Monetary Authority of Singapore (MAS). During her time at the MAS she worked in foreign reserves management, financial sector development, strategic planning and financial supervision. She was the Deputy Managing Director in charge of Financial Supervision – overseeing the regulation and supervision of the banking, insurance and capital markets industries and macroeconomic surveillance, and also represented the MAS on various international fora including the Basel Committee on Banking Supervision and on various committees and working groups of the Financial Stability Board. She retired from the MAS as Special Advisor in the Managing Director’s office in June 2015. In addition to the MAS, Ms. Teo also served on the Board of the Civil Aviation Authority of Singapore from 2002 to 2010. Ms. Teo received her B.Sc. (First) in Mathematics from the Imperial College of Science and Technology, University of London in 1981 and her M.Sc. in Applied Statistics from the University of Oxford in 1982. She was also awarded the Public Administration Medal (Gold) (Bar) at the Singapore National Day Awards in 2012.
BOARD OF DIRECTORS
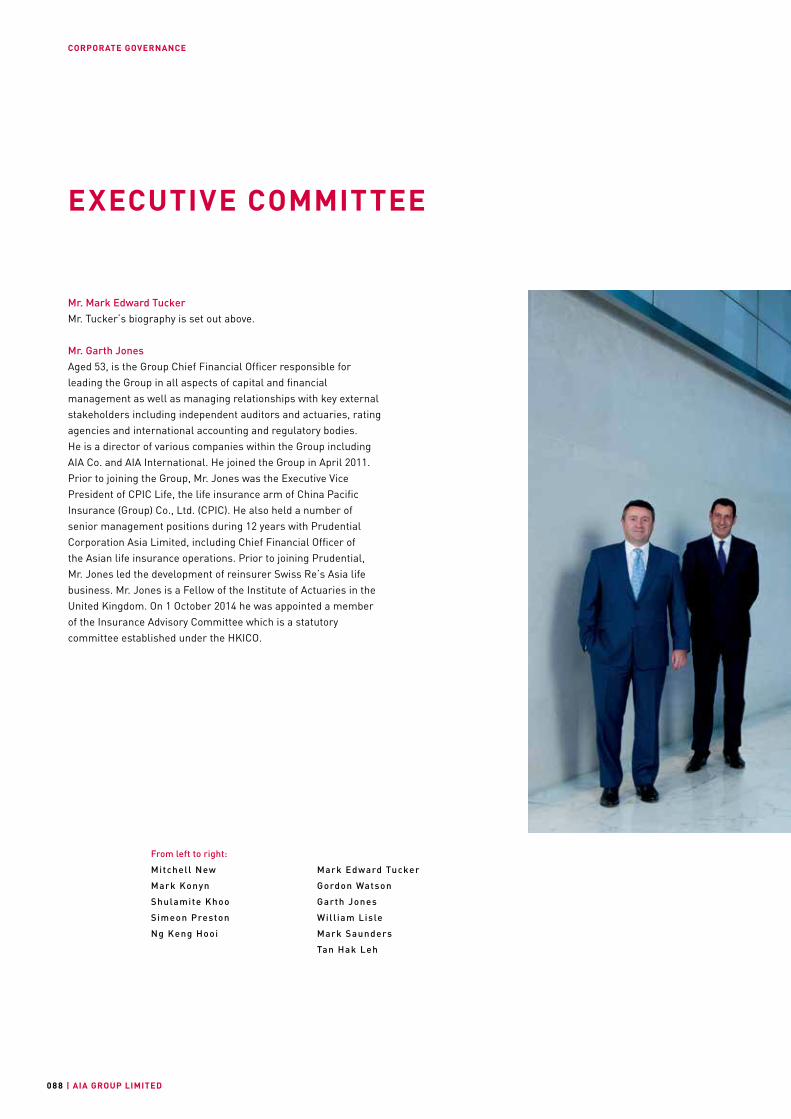
CORPORATE GOVERNANCE
| AIA GROUP LIMITED088
EXECUTIVE COMMITTEE
From left to right:
Mitchell New
Mark Konyn
Shulamite Khoo
Simeon Preston
Ng Keng Hooi
Mr. Mark Edward TuckerMr. Tucker’s biography is set out above.
Mr. Garth JonesAged 53, is the Group Chief Financial Officer responsible for leading the Group in all aspects of capital and financial management as well as managing relationships with key external stakeholders including independent auditors and actuaries, rating agencies and international accounting and regulatory bodies. He is a director of various companies within the Group including AIA Co. and AIA International. He joined the Group in April 2011. Prior to joining the Group, Mr. Jones was the Executive Vice President of CPIC Life, the life insurance arm of China Pacific Insurance (Group) Co., Ltd. (CPIC). He also held a number of senior management positions during 12 years with Prudential Corporation Asia Limited, including Chief Financial Officer of the Asian life insurance operations. Prior to joining Prudential, Mr. Jones led the development of reinsurer Swiss Re’s Asia life business. Mr. Jones is a Fellow of the Institute of Actuaries in the United Kingdom. On 1 October 2014 he was appointed a member of the Insurance Advisory Committee which is a statutory committee established under the HKICO.
Mark Edward Tucker
Gordon Watson
Garth Jones
Will iam Lisle
Mark Saunders
Tan Hak Leh

CORPORATE GOVERNANCE
ANNUAL REPORT 2015 | 089
OV
ER
VIE
WF
INA
NC
IAL
AN
D O
PE
RA
TIN
G R
EV
IEW
CO
RP
OR
AT
E G
OV
ER
NA
NC
EF
INA
NC
IAL
STA
TE
ME
NT
SA
DD
ITIO
NA
L I
NF
OR
MA
TIO
N
CORPORATE GOVERNANCE
| AIA GROUP LIMITED090
EXECUTIVE COMMITTEE
Mr. Ng Keng HooiAged 61, is the Regional Chief Executive responsible for the Group’s businesses operating in Thailand, China, Indonesia, Singapore, Brunei and Taiwan as well as Group Agency Distribution. He is a director of various companies within the Group including AIA Co. and AIA International. He joined the Group in October 2010. Prior to joining the Group, Mr. Ng was Group Chief Executive Officer and Director of Great Eastern Holdings Limited from December 2008. Mr. Ng worked for Prudential plc from 1989 to 2008, serving as a Managing Director of Insurance of Prudential Corporation Asia Limited from 2005 to 2008 responsible for its operations in Malaysia, Singapore, Indonesia and the Philippines. He has been a Fellow of the Society of Actuaries (U.S.) since 1985.
Mr. Gordon WatsonAged 52, is the Regional Chief Executive responsible for the Group’s businesses operating in Hong Kong, Australia, the Philippines, Vietnam, New Zealand and Macau as well as the Group Corporate Solutions business, Group Partnership Distribution and the AIA Vitality initiative. He is a director of various companies within the Group including AIA Co. and AIA International and serves as the Chairman of The Philippine American Life and General Insurance (PHILAM LIFE) Company. Mr. Watson rejoined the Group in January 2011. He worked in various parts of AIG (including within AIA) for over 30 years, during which time he served as Global Vice Chairman of ALICO and Chairman and Chief Executive Officer of ALICO Asia. He also served as Global Chief Operating Officer and as Chairman of ALICO Japan. He is a Fellow of the Chartered Insurance Institute and Chartered Institute of Marketing.
Mr. William LisleAged 50, is the Regional Chief Executive responsible for the Group’s businesses operating in Malaysia, Korea, Sri Lanka, India and Cambodia. Mr. Lisle was Chief Executive Officer of AIA’s operation in Malaysia from December 2012 to May 2015 including leading the large-scale and successful integration of ING Malaysia after its acquisition by the Group in 2012. He is a director of various companies within the Group including AIA Co. and AIA International. Mr. Lisle joined the Group in January 2011 as Group Chief Distribution Officer. Prior to joining the Group, Mr. Lisle was the Managing Director, South Asia for Aviva from May 2009 until 2010. Prior to joining Aviva, Mr. Lisle held a number of senior positions at Prudential Corporation Asia Limited, including Chief Executive Officer in Malaysia from 2008 to 2009, Chief Executive Officer in Korea from 2005 to 2008, Chief Agency Officer for ICICI Prudential from 2002 to 2004 and Director of Agency Development, South Asia in 2001.
Mr. Simeon PrestonAged 45, is the Group Chief Operations Officer responsible at the Group level for technology and operations. He is a director of various companies within the Group. He joined the Group in September 2010. Prior to joining the Group, Mr. Preston served as a senior partner in the financial services practice of global management consultants Bain & Company, where he specialised in the Asia life insurance sector. He previously spent almost nine years with consulting firm Marakon Associates, becoming a partner in 2006.
Ms. Shulamite KhooAged 54, is the Group Chief Human Resources Officer responsible for the development of overall human capital strategies and their implementation across the Group as well as leading and providing support to the human resources functions in country market operations. She is also responsible for the Group Corporate Security function. She joined the Group in January 2011. Prior to joining the Group, Ms. Khoo was Group Executive Vice President, Global Head of Human Resources and Group Executive Management of the AXA Group, based in Paris. Prior to joining AXA, she occupied various senior roles covering life insurance operations and human resources with Prudential Singapore and was Regional Head of Human Resources for Prudential Corporation Asia Limited based in Hong Kong. She is a Chartered Fellow of the Chartered Institute of Personnel and Development.
CORPORATE GOVERNANCE
ANNUAL REPORT 2015 | 091
OV
ER
VIE
WF
INA
NC
IAL
AN
D O
PE
RA
TIN
G R
EV
IEW
CO
RP
OR
AT
E G
OV
ER
NA
NC
EF
INA
NC
IAL
STA
TE
ME
NT
SA
DD
ITIO
NA
L I
NF
OR
MA
TIO
N
EXECUTIVE COMMITTEE
Mr. Mitchell NewAged 52, is the Group General Counsel and Company Secretary responsible for the provision of legal services and company secretarial services for the Group and providing leadership to legal and corporate governance functions within country operations. He is a director of various companies within the Group. He joined the Group in April 2011. Prior to joining the Group, Mr. New occupied various senior roles with Manulife Financial where he was most recently Senior Vice President and Chief Legal Officer for Asia, based in Hong Kong. He was also previously Senior Vice President and General Counsel to Manulife’s Canadian division.
Mr. Mark SaundersAged 52, is the Group Chief Strategy and Marketing Officer responsible for the Group’s strategy, customer propositions, corporate transactions, and marketing. He provides leadership and support on all of these functions at the Group level. He joined the Group in April 2014. Prior to joining the Group, Mr. Saunders was Managing Director of Towers Watson for the Asia-Pacific Insurance Sector, as well as Managing Director for the firm’s Hong Kong office. Prior to joining Towers Watson, he was Asian Regional Leader, Hong Kong Chief Executive Officer, and Executive Director and Board Member of the Isle of Man-based international life insurance operations of Clerical Medical and its joint venture life insurer in Korea (Coryo-CM). Mr. Saunders has been involved in the insurance industry in Asia since 1989. He is a Fellow of the Institute and Faculty of Actuaries and Fellow of five other professional actuarial bodies.
Dr. Mark KonynAged 53, is the Group Chief Investment Officer responsible for providing oversight to the management of the investment portfolios of the Group. He joined the Group in September 2015. Dr. Konyn joined AIA from Cathay Conning Asset Management where he was Chief Executive Officer responsible for the company’s investment business and strategic expansion in the region. He has held senior positions at Allianz Global Investors (where he was Asia-Pacific CEO for RCM Global Investors), Fidelity Investments and Prudential UK. He is a Fellow of the Royal Statistical Society, holds a Diploma from the London Business School in Investment Management having previously completed his Ph.D. in Operational Research sponsored by the UK Government.
Mr. Tan Hak LehAged 49, is the Group Chief Risk Officer responsible for the Group’s risk and compliance functions. Mr. Tan was Chief Executive Officer of AIA’s operation in Singapore from 2011 to 2015. Prior to joining the Group, Mr. Tan was Chief Executive Officer of Great Eastern Life, Singapore. Prior to joining Great Eastern Life, Mr. Tan was Director of the Insurance Department of the Monetary Authority of Singapore. Mr. Tan has played an active role in the life insurance industry since 2005. His appointments include: President of the Life Insurance Association (LIA), Singapore from 2010 to 2013 and Vice Chair of Singapore College of Insurance from 2011 to 2013. He was also a Board member of Financial Industry Disputes Resolution Centre Ltd from 2008 to 2015.
CORPORATE GOVERNANCE
| AIA GROUP LIMITED092
The Board is pleased to present this Annual Report and the audited consolidated financial statements of the Company for the year ended 30 November 2015.
PRINCIPAL ACTIVITIESThe Company is an investment holding company. The principal activities of the Group are the provision of products and services to individuals and businesses for their insurance, protection, savings, investment and retirement needs.
Details of the activities and other particulars of the Company’s principal subsidiaries are set out in note 43 to the financial statements.
RESULTSThe results of the Group for the year ended 30 November 2015 and the state of the Group’s affairs at that date are set out in the financial statements on pages 119 to 244 of this Annual Report.
BUSINESS REVIEWThe review of the business of the Group, including a description of principal risks and uncertainties and an indication of likely future development in the Group’s businesses, for the year ended 30 November 2015 as required by Schedule 5 to the Hong Kong Companies Ordinance is contained in the Financial Review (pages 23 to 37), Business Review (pages 39 to 57), Risk Management (pages 58 to 70) and Corporate Social Responsibility (pages 74 to 79) sections under Financial and Operating Review as well as note 42 and note 45 to the financial statements. These discussions form part of this report.
DIVIDEND An interim dividend of 18.72 Hong Kong cents per share (2014: 16.00 Hong Kong cents per share) was paid on 28 August 2015. The Board has recommended a final dividend of 51.00 Hong Kong cents per share (2014: 34.00 Hong Kong cents per share) in respect of the year ended 30 November 2015. Together with the interim dividend already paid, this will result in a total dividend of 69.72 Hong Kong cents per share (2014: 50.00 Hong Kong cents per share) for the year ended 30 November 2015.
Under the Trust Deed of the Company’s Restricted Share Unit Scheme, shares of the Company are held by the trustee in either of two trust funds. These shares are held against the future entitlements of scheme participants. Provided the shares of the Company are held by the trustee and no beneficial interest in those shares has been vested in any beneficiary, the trustee shall waive any right to dividend payments or other distributions in respect of those shares (unless the Company determines otherwise).
As of 28 August 2015 (being the payment date of the interim dividend), 73,464,556 shares were held by the trustee. The amount of interim dividend waived was approximately US$1.77 million. Pursuant to the Trust Deed, the trustee will waive the right to final dividend if it is declared.
Subject to shareholders’ approval at the AGM, the final dividend will be payable on Friday, 27 May 2016 to shareholders whose names appear on the register of members of the Company at the close of business on Wednesday, 11 May 2016.
REPORT OF THE DIRECTORS
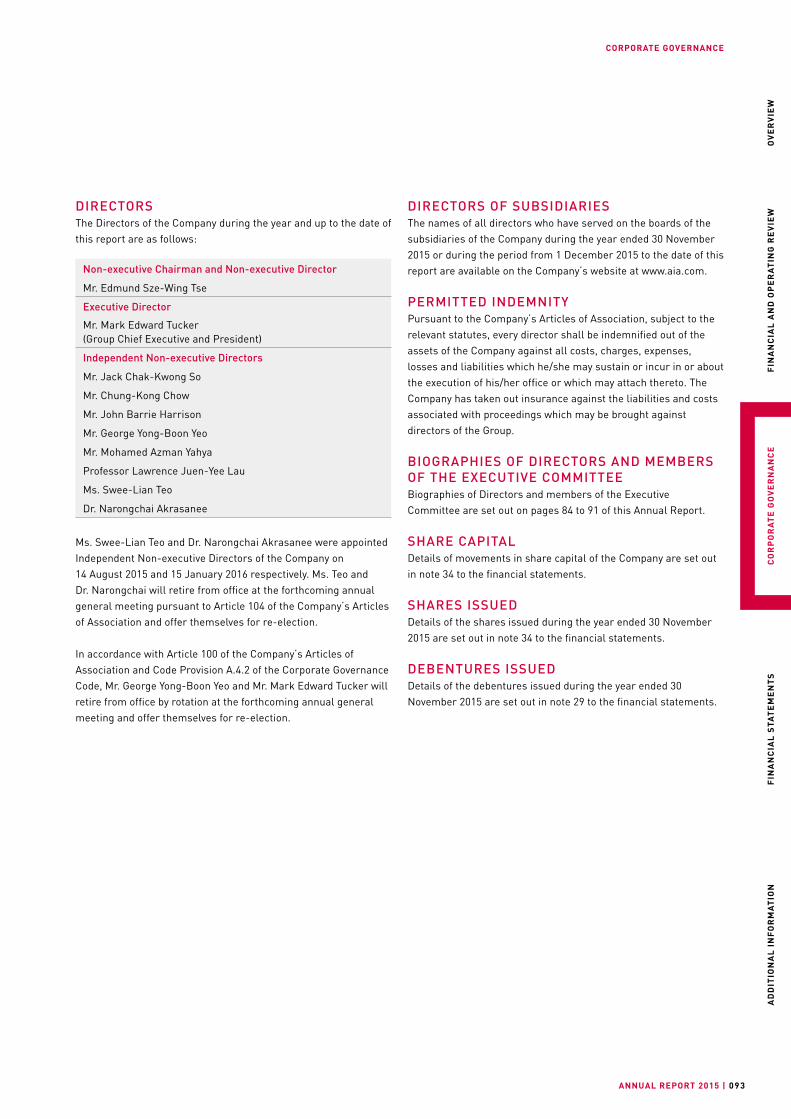
CORPORATE GOVERNANCE
ANNUAL REPORT 2015 | 093
OV
ER
VIE
WF
INA
NC
IAL
AN
D O
PE
RA
TIN
G R
EV
IEW
CO
RP
OR
AT
E G
OV
ER
NA
NC
EF
INA
NC
IAL
STA
TE
ME
NT
SA
DD
ITIO
NA
L I
NF
OR
MA
TIO
N
DIRECTORSThe Directors of the Company during the year and up to the date of this report are as follows:
Non-executive Chairman and Non-executive Director
Mr. Edmund Sze-Wing Tse
Executive Director
Mr. Mark Edward Tucker(Group Chief Executive and President)
Independent Non-executive Directors
Mr. Jack Chak-Kwong So
Mr. Chung-Kong Chow
Mr. John Barrie Harrison
Mr. George Yong-Boon Yeo
Mr. Mohamed Azman Yahya
Professor Lawrence Juen-Yee Lau
Ms. Swee-Lian Teo
Dr. Narongchai Akrasanee
Ms. Swee-Lian Teo and Dr. Narongchai Akrasanee were appointed Independent Non-executive Directors of the Company on 14 August 2015 and 15 January 2016 respectively. Ms. Teo and Dr. Narongchai will retire from office at the forthcoming annual general meeting pursuant to Article 104 of the Company’s Articles of Association and offer themselves for re-election.
In accordance with Article 100 of the Company’s Articles of Association and Code Provision A.4.2 of the Corporate Governance Code, Mr. George Yong-Boon Yeo and Mr. Mark Edward Tucker will retire from office by rotation at the forthcoming annual general meeting and offer themselves for re-election.
DIRECTORS OF SUBSIDIARIESThe names of all directors who have served on the boards of the subsidiaries of the Company during the year ended 30 November 2015 or during the period from 1 December 2015 to the date of this report are available on the Company’s website at www.aia.com.
PERMITTED INDEMNITYPursuant to the Company’s Articles of Association, subject to the relevant statutes, every director shall be indemnified out of the assets of the Company against all costs, charges, expenses, losses and liabilities which he/she may sustain or incur in or about the execution of his/her office or which may attach thereto. The Company has taken out insurance against the liabilities and costs associated with proceedings which may be brought against directors of the Group.
BIOGRAPHIES OF DIRECTORS AND MEMBERS OF THE EXECUTIVE COMMITTEEBiographies of Directors and members of the Executive Committee are set out on pages 84 to 91 of this Annual Report.
SHARE CAPITALDetails of movements in share capital of the Company are set out in note 34 to the financial statements.
SHARES ISSUEDDetails of the shares issued during the year ended 30 November 2015 are set out in note 34 to the financial statements.
DEBENTURES ISSUEDDetails of the debentures issued during the year ended 30 November 2015 are set out in note 29 to the financial statements.
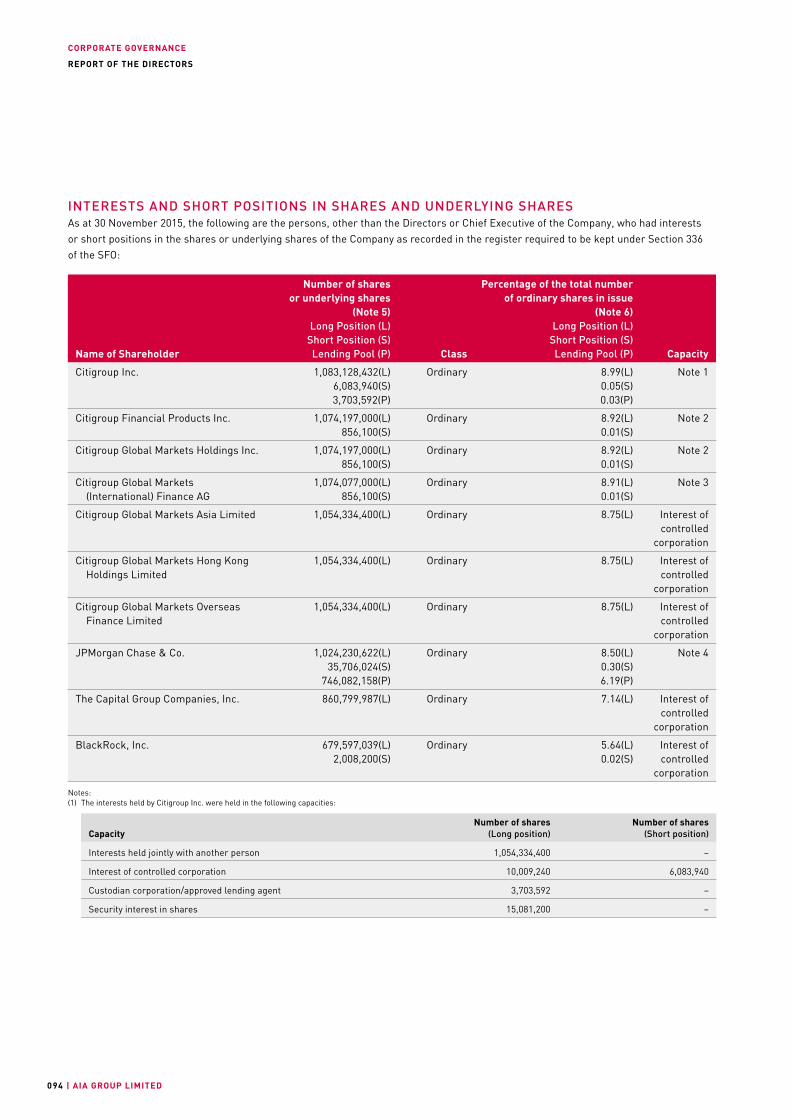
CORPORATE GOVERNANCE
| AIA GROUP LIMITED094
REPORT OF THE DIRECTORS
INTERESTS AND SHORT POSITIONS IN SHARES AND UNDERLYING SHARES As at 30 November 2015, the following are the persons, other than the Directors or Chief Executive of the Company, who had interests or short positions in the shares or underlying shares of the Company as recorded in the register required to be kept under Section 336 of the SFO:
Name of Shareholder
Number of shares or underlying shares
(Note 5) Long Position (L)
Short Position (S)Lending Pool (P) Class
Percentage of the total number of ordinary shares in issue
(Note 6)Long Position (L)
Short Position (S)Lending Pool (P) Capacity
Citigroup Inc. 1,083,128,432(L) 6,083,940(S) 3,703,592(P)
Ordinary 8.99(L)0.05(S)0.03(P)
Note 1
Citigroup Financial Products Inc. 1,074,197,000(L) 856,100(S)
Ordinary 8.92(L)0.01(S)
Note 2
Citigroup Global Markets Holdings Inc. 1,074,197,000(L) 856,100(S)
Ordinary 8.92(L)0.01(S)
Note 2
Citigroup Global Markets (International) Finance AG
1,074,077,000(L) 856,100(S)
Ordinary 8.91(L)0.01(S)
Note 3
Citigroup Global Markets Asia Limited 1,054,334,400(L) Ordinary 8.75(L) Interest of controlled
corporation
Citigroup Global Markets Hong Kong Holdings Limited
1,054,334,400(L) Ordinary 8.75(L) Interest of controlled
corporation
Citigroup Global Markets Overseas Finance Limited
1,054,334,400(L) Ordinary 8.75(L) Interest of controlled
corporation
JPMorgan Chase & Co. 1,024,230,622(L)35,706,024(S)
746,082,158(P)
Ordinary 8.50(L)0.30(S)6.19(P)
Note 4
The Capital Group Companies, Inc. 860,799,987(L) Ordinary 7.14(L) Interest of controlled
corporation
BlackRock, Inc. 679,597,039(L) 2,008,200(S)
Ordinary 5.64(L)0.02(S)
Interest of controlled
corporation
Notes:(1) The interests held by Citigroup Inc. were held in the following capacities:
CapacityNumber of shares
(Long position)Number of shares
(Short position)
Interests held jointly with another person 1,054,334,400 –
Interest of controlled corporation 10,009,240 6,083,940
Custodian corporation/approved lending agent 3,703,592 –
Security interest in shares 15,081,200 –
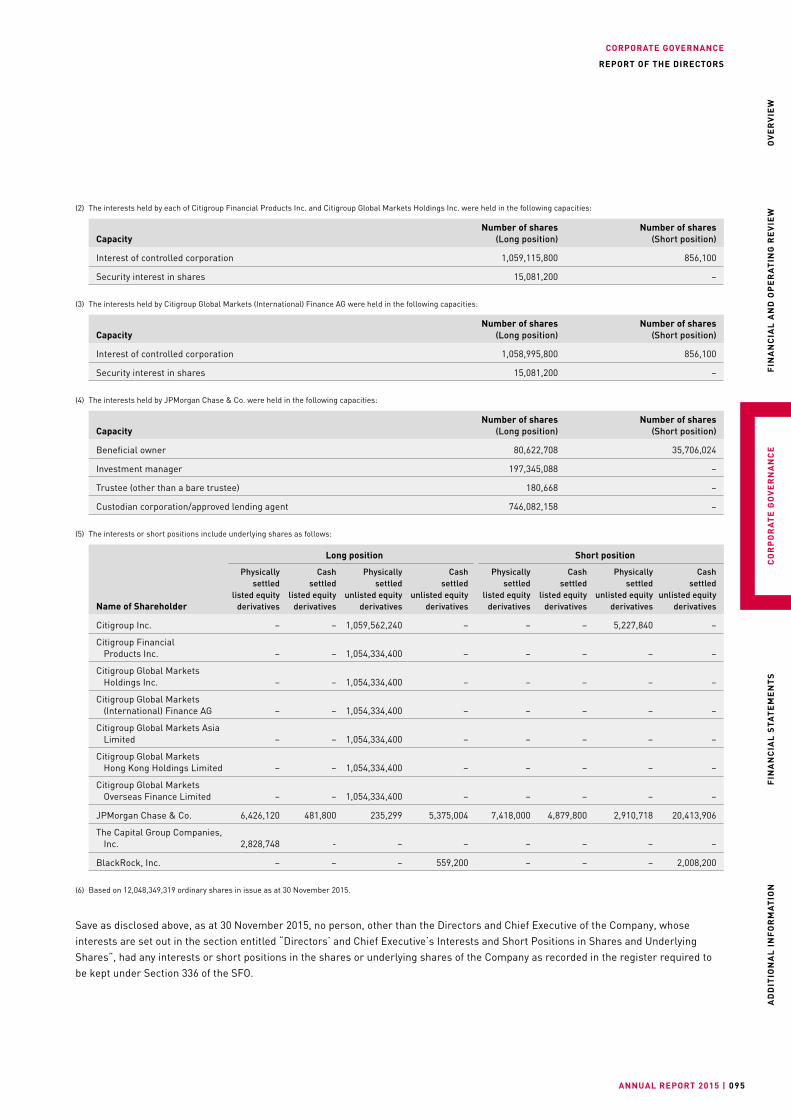
CORPORATE GOVERNANCE
ANNUAL REPORT 2015 | 095
OV
ER
VIE
WF
INA
NC
IAL
AN
D O
PE
RA
TIN
G R
EV
IEW
CO
RP
OR
AT
E G
OV
ER
NA
NC
EF
INA
NC
IAL
STA
TE
ME
NT
SA
DD
ITIO
NA
L I
NF
OR
MA
TIO
N
REPORT OF THE DIRECTORS
(2) The interests held by each of Citigroup Financial Products Inc. and Citigroup Global Markets Holdings Inc. were held in the following capacities:
CapacityNumber of shares
(Long position)Number of shares
(Short position)
Interest of controlled corporation 1,059,115,800 856,100
Security interest in shares 15,081,200 –
(3) The interests held by Citigroup Global Markets (International) Finance AG were held in the following capacities:
CapacityNumber of shares
(Long position)Number of shares
(Short position)
Interest of controlled corporation 1,058,995,800 856,100
Security interest in shares 15,081,200 –
(4) The interests held by JPMorgan Chase & Co. were held in the following capacities:
CapacityNumber of shares
(Long position)Number of shares
(Short position)
Beneficial owner 80,622,708 35,706,024
Investment manager 197,345,088 –
Trustee (other than a bare trustee) 180,668 –
Custodian corporation/approved lending agent 746,082,158 –
(5) The interests or short positions include underlying shares as follows:
Name of Shareholder
Long position Short position
Physically settled
listed equity derivatives
Cashsettled
listed equity derivatives
Physically settled
unlisted equity derivatives
Cash settled
unlisted equity derivatives
Physicallysettled
listed equity derivatives
Cash settled listed equity
derivatives
Physicallysettled
unlisted equity derivatives
Cashsettled
unlisted equity derivatives
Citigroup Inc. – – 1,059,562,240 – – – 5,227,840 –
Citigroup Financial Products Inc. – – 1,054,334,400 – – – – –
Citigroup Global Markets Holdings Inc. – – 1,054,334,400 – – – – –
Citigroup Global Markets (International) Finance AG – – 1,054,334,400 – – – – –
Citigroup Global Markets Asia Limited – – 1,054,334,400 – – – – –
Citigroup Global Markets Hong Kong Holdings Limited – – 1,054,334,400 – – – – –
Citigroup Global Markets Overseas Finance Limited – – 1,054,334,400 – – – – –
JPMorgan Chase & Co. 6,426,120 481,800 235,299 5,375,004 7,418,000 4,879,800 2,910,718 20,413,906
The Capital Group Companies, Inc. 2,828,748 - – – – – – –
BlackRock, Inc. – – – 559,200 – – – 2,008,200
(6) Based on 12,048,349,319 ordinary shares in issue as at 30 November 2015.
Save as disclosed above, as at 30 November 2015, no person, other than the Directors and Chief Executive of the Company, whose interests are set out in the section entitled “Directors’ and Chief Executive’s Interests and Short Positions in Shares and Underlying Shares”, had any interests or short positions in the shares or underlying shares of the Company as recorded in the register required to be kept under Section 336 of the SFO.
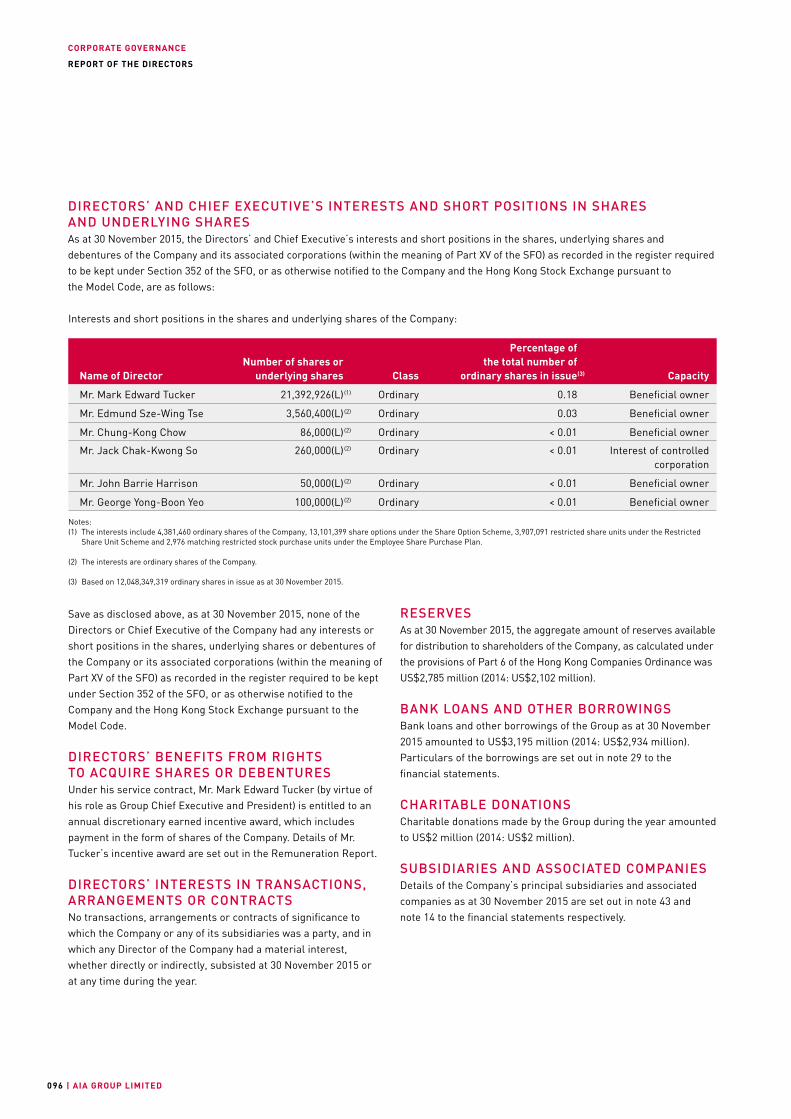
CORPORATE GOVERNANCE
| AIA GROUP LIMITED096
REPORT OF THE DIRECTORS
Save as disclosed above, as at 30 November 2015, none of the Directors or Chief Executive of the Company had any interests or short positions in the shares, underlying shares or debentures of the Company or its associated corporations (within the meaning of Part XV of the SFO) as recorded in the register required to be kept under Section 352 of the SFO, or as otherwise notified to the Company and the Hong Kong Stock Exchange pursuant to the Model Code.
DIRECTORS’ BENEFITS FROM RIGHTS TO ACQUIRE SHARES OR DEBENTURES Under his service contract, Mr. Mark Edward Tucker (by virtue of his role as Group Chief Executive and President) is entitled to an annual discretionary earned incentive award, which includes payment in the form of shares of the Company. Details of Mr. Tucker’s incentive award are set out in the Remuneration Report.
DIRECTORS’ INTERESTS IN TRANSACTIONS, ARRANGEMENTS OR CONTRACTSNo transactions, arrangements or contracts of significance to which the Company or any of its subsidiaries was a party, and in which any Director of the Company had a material interest, whether directly or indirectly, subsisted at 30 November 2015 or at any time during the year.
DIRECTORS’ AND CHIEF EXECUTIVE’S INTERESTS AND SHORT POSITIONS IN SHARES AND UNDERLYING SHARES As at 30 November 2015, the Directors’ and Chief Executive’s interests and short positions in the shares, underlying shares and debentures of the Company and its associated corporations (within the meaning of Part XV of the SFO) as recorded in the register required to be kept under Section 352 of the SFO, or as otherwise notified to the Company and the Hong Kong Stock Exchange pursuant to the Model Code, are as follows:
Interests and short positions in the shares and underlying shares of the Company:
Name of DirectorNumber of shares or
underlying shares Class
Percentage of the total number of
ordinary shares in issue
(3) Capacity
Mr. Mark Edward Tucker 21,392,926(L) (1) Ordinary 0.18 Beneficial owner
Mr. Edmund Sze-Wing Tse 3,560,400(L)(2) Ordinary 0.03 Beneficial owner
Mr. Chung-Kong Chow 86,000(L) (2) Ordinary < 0.01 Beneficial owner
Mr. Jack Chak-Kwong So 260,000(L)(2) Ordinary < 0.01 Interest of controlledcorporation
Mr. John Barrie Harrison 50,000(L)(2) Ordinary < 0.01 Beneficial owner
Mr. George Yong-Boon Yeo 100,000(L)(2) Ordinary < 0.01 Beneficial owner
Notes:(1) The interests include 4,381,460 ordinary shares of the Company, 13,101,399 share options under the Share Option Scheme, 3,907,091 restricted share units under the Restricted
Share Unit Scheme and 2,976 matching restricted stock purchase units under the Employee Share Purchase Plan.
(2) The interests are ordinary shares of the Company.
(3) Based on 12,048,349,319 ordinary shares in issue as at 30 November 2015.
RESERVES As at 30 November 2015, the aggregate amount of reserves available for distribution to shareholders of the Company, as calculated under the provisions of Part 6 of the Hong Kong Companies Ordinance was US$2,785 million (2014: US$2,102 million).
BANK LOANS AND OTHER BORROWINGS Bank loans and other borrowings of the Group as at 30 November 2015 amounted to US$3,195 million (2014: US$2,934 million). Particulars of the borrowings are set out in note 29 to the financial statements.
CHARITABLE DONATIONSCharitable donations made by the Group during the year amounted to US$2 million (2014: US$2 million).
SUBSIDIARIES AND ASSOCIATED COMPANIESDetails of the Company’s principal subsidiaries and associated companies as at 30 November 2015 are set out in note 43 and note 14 to the financial statements respectively.
CORPORATE GOVERNANCE
ANNUAL REPORT 2015 | 097
OV
ER
VIE
WF
INA
NC
IAL
AN
D O
PE
RA
TIN
G R
EV
IEW
CO
RP
OR
AT
E G
OV
ER
NA
NC
EF
INA
NC
IAL
STA
TE
ME
NT
SA
DD
ITIO
NA
L I
NF
OR
MA
TIO
N
REPORT OF THE DIRECTORS
CHANGES IN EQUITY Details of changes in equity of the Group during the year ended 30 November 2015 are set out in the Consolidated Statement of Changes in Equity on pages 123 to 124 of this Annual Report.
MAJOR CUSTOMERS AND SUPPLIERS During the year ended 30 November 2015, the percentage of the aggregate purchases attributable to the Group’s five largest suppliers was less than 30 per cent of the Group’s total value of purchases and the percentage of the aggregate sales attributable to the Group’s five largest customers was less than 30 per cent of the Group’s total value of sales.
RETIREMENT SCHEMES The Group operates a number of defined benefit plans and defined contribution plans. Particulars of these plans are set out in note 38 to the financial statements.
EVENTS AFTER THE REPORTING PERIODDetails of significant events after the year ended 30 November 2015 are set out in note 45 to the financial statements.
EQUITY-LINKED AGREEMENTSDuring the year ended 30 November 2015, the Company has not entered into any equity-linked agreements, save for the restricted share units awarded, share options outstanding, restricted stock purchase units and restricted stock subscription units awarded to employees and agents under the Restricted Share Unit Scheme, Share Option Scheme, Employee Share Purchase Plan and Agency Share Purchase Plan respectively described below and in the Remuneration Report and note 39 to the financial statements.
RESTRICTED SHARE UNIT SCHEME During the year ended 30 November 2015, 17,933,566 restricted share units were awarded by the Company under the Restricted Share Unit Scheme adopted by the Company on 28 September 2010 (as amended). Details of the awards are set out in the Remuneration Report and note 39 to the financial statements.
SHARE OPTION SCHEMEDuring the year ended 30 November 2015, 5,937,871 share options were awarded by the Company under the Share Option Scheme adopted by the Company on 28 September 2010 (as amended). 2,190,404 share options were exercised during the year and the Company issued 2,190,404 new shares accordingly. The proceeds received amounted to approximately US$8 million. Details of the Share Option Scheme are set out in the Remuneration Report and note 39 to the financial statements.
EMPLOYEE SHARE PURCHASE PLANDuring the year ended 30 November 2015, 979,728 restricted stock subscription units were awarded by the Company under the Employee Share Purchase Plan adopted by the Company on 25 July 2011. 646,996 matching restricted stock subscription units were vested during the year and no shares have been issued pursuant to the Employee Share Purchase Plan. Details of the plan are set out in the Remuneration Report and note 39 to the financial statements.
AGENCY SHARE PURCHASE PLANDuring the year ended 30 November 2015, 1,168,085 restricted stock subscription units were awarded by the Company under the Agency Share Purchase Plan adopted by the Company on 23 February 2012. 1,041,529 matching restricted stock subscription units were vested during the year and the Company issued 1,041,690 new shares accordingly. The proceeds received amounted to approximately US$1 million. Details of the plan are set out in note 39 to the financial statements.
NON-EXEMPT CONNECTED TRANSACTIONSDuring the year ended 30 November 2015, the Group had not entered into any connected transactions which are not exempt from annual reporting requirement in Chapter 14A of the Listing Rules.
RELATED PARTY TRANSACTIONSDetails of the related party transactions undertaken by the Group during the year ended 30 November 2015 in the ordinary course of business are set out in note 41 to the financial statements. Such related party transactions are all exempt connected transactions.
PURCHASE, SALE AND REDEMPTION OF THE SECURITIES OF THE COMPANYSave for the purchase of 16,867,524 shares and sale of 204,295 forfeited shares of the Company under the Restricted Share Unit Scheme and the Employee Share Purchase Plan at a total consideration of approximately US$99 million and US$1 million respectively, neither the Company nor any of its subsidiaries purchased, sold or redeemed any of the Company’s listed securities during the year ended 30 November 2015. These purchases and sales were made by the relevant scheme trustees on the Hong Kong Stock Exchange. These shares are held on trust for participants of the relevant schemes and therefore were not cancelled. Please refer to note 39 to the financial statements for details.
CORPORATE GOVERNANCE
| AIA GROUP LIMITED098
REPORT OF THE DIRECTORS
PUBLIC FLOATBased on information that is publicly available to the Company and within the knowledge of the Directors, the Company has maintained the amount of public float as approved by the Hong Kong Stock Exchange and as permitted under the Listing Rules as at the date of this report.
COMPLIANCE WITH THE CORPORATE GOVERNANCE CODEDetails of the compliance by the Company with the Corporate Governance Code are set out in the Corporate Governance Report on page 99 of this Annual Report.
MODEL CODEDetails of the compliance by the Company with the Model Code are set out in the Corporate Governance Report on page 99 of this Annual Report.
AUDITORPricewaterhouseCoopers was re-appointed auditor of the Company in 2015.
PricewaterhouseCoopers will retire and, being eligible, offer themselves for re-appointment. A resolution for the re-appointment of PricewaterhouseCoopers as auditor of the Company is to be proposed at the forthcoming annual general meeting.
By Order of the Board
Edmund Sze-Wing Tse
Non-executive Chairman
25 February 2016
CORPORATE GOVERNANCE
ANNUAL REPORT 2015 | 099
OV
ER
VIE
WF
INA
NC
IAL
AN
D O
PE
RA
TIN
G R
EV
IEW
CO
RP
OR
AT
E G
OV
ER
NA
NC
EF
INA
NC
IAL
STA
TE
ME
NT
SA
DD
ITIO
NA
L I
NF
OR
MA
TIO
N
CORE PRINCIPLESThe Board believes that strong corporate governance is essential for delivering sustainable value, enhancing a culture of business integrity and maintaining investor confidence. The Board is ultimately responsible for the performance of the Group, including the consistent achievement of business plans and compliance with statutory as well as corporate obligations. The Board is also responsible for the development and implementation of the Group’s corporate governance practices. This Corporate Governance Report explains the Company’s corporate governance principles and practices, including how the Board manages the business to deliver long-term shareholder value and to promote the development of the Group.
As a company listed on the Main Board of the Hong Kong Stock Exchange, the Company is committed to high standards of corporate governance and sees the maintenance of good corporate governance practices as essential to its sustainable growth. It is vital that Board members, in aggregate, have their requisite skills and expertise supported by a structure that enables delegation, where appropriate, between the Board, its committees and management, whilst ensuring that the Board retains overall control. To promote effective governance across all of its operations, the Board has approved a governance framework, which maps out internal approval processes including those matters that may be delegated.
Except as noted below, throughout the year ended 30 November 2015, the Company complied with all applicable provisions of the Corporate Governance Code. For the period from 1 December 2014 to 22 July 2015, the Company operated under a variant of the model required under Code Provision F.1.3, which provides that the company secretary should report to the chairman of the board and/or the chief executive such that the Group Company Secretary reported to the Group General Counsel who is ultimately
accountable for the company secretarial function and who in turn reported directly to the Group Chief Executive. Following the appointment of the Group General Counsel as the Company Secretary on 22 July 2015, the Company has complied with Code Provision F.1.3.
The Company has also adopted its own Directors’ and Chief Executives’ Dealing Policy on terms no less exacting than those set out in the Model Code in respect of dealings by the Directors in the securities of the Company. All of the Directors confirmed, following specific enquiry by the Company, that they have complied with the required standards set out in the Model Code and the Directors’ and Chief Executives’ Dealing Policy throughout the year ended 30 November 2015.
BOARD OF DIRECTORSROLES AND RESPONSIBILITIESThe Board is accountable to shareholders for the affairs of the Company. It meets these obligations by ensuring the maintenance of high standards of governance in all aspects of the Company’s business, setting the strategic direction for the Group and maintaining appropriate levels of review, challenge and guidance in its relationship with Group management. It is also the ultimate decision-making body for all matters considered material to the Group and is responsible for ensuring that, as a collective body, it has the appropriate skills, knowledge and experience to perform its role effectively.
In these matters, the Board provides leadership to the Company in respect of operational issues through the Group Chief Executive, who is authorised to act on behalf of the Board in the operational management of the Company. Any responsibilities not so delegated by the Board to the Group Chief Executive remain the responsibility of the Board.
CORPORATE GOVERNANCE REPORT
CORPORATE GOVERNANCE
| AIA GROUP LIMITED100
CORPORATE GOVERNANCE REPORT
During the year, the Board updated the terms of reference of the Risk Committee to reflect best practice and reviewed the Company’s compliance with the Corporate Governance Code including the necessary disclosures in its reports to shareholders. The Board also adopted various policies as recommended by the Audit Committee and Risk Committee.
The Board discharges the following responsibilities either by itself or through delegation to the Audit Committee, Nomination Committee, Remuneration Committee and Risk Committee:
(a) the development and review of the Company’s policies and practices on corporate governance;
(b) the review and monitoring of the training and continuous professional development of Directors;
(c) the review and monitoring of the Company’s policies and practices on compliance with legal and regulatory requirements;
(d) the development, review and monitoring of the Code of Conduct applicable to employees; and
(e) the review of the Company’s compliance with the Corporate Governance Code and disclosure in this Corporate Governance Report.
BOARD COMPOSITIONAs of the end of the financial year and up to the date of this Corporate Governance Report, the Board consists of ten members, comprising one Executive Director and nine Non-executive Directors, eight of whom are Independent Non-executive Directors. All Directors are expressly identified by reference to such categories in all corporate communications that disclose their names.
The composition of the Board is well balanced with each Director having sound board level experience and expertise relevant to the business operations and development of the Group. The Board is comprised of members with extensive business, government, regulatory and policy experience from a variety of backgrounds. There is diversity of nationality, ethnicity, educational background, functional expertise, gender, age and experience.
Biographies of the Directors are set out on pages 84 to 87 of this Annual Report.
BOARD INDEPENDENCEEach of the Independent Non-executive Directors of the Company meets the independence guidelines set out in Rule 3.13 of the Listing Rules and has provided to the Company the requisite annual confirmation as to his or her independence. None of the Independent Non-executive Directors of the Company has any business with or significant financial interests in the Company or its subsidiaries and therefore all the Independent Non-executive Directors continue to be considered by the Company to be independent.
BOARD PROCESSBoard meetings are held at least four times a year to determine overall strategies, receive management updates, approve business plans as well as interim and annual results and to consider other significant matters. At these meetings, senior management also provides regular updates to the Board with respect to the business activities and development of the Group.
During the year, there were six scheduled Board meetings, all of which were convened in accordance with the Articles of Association of the Company and attended by the Directors either in person or through electronic means of communication.
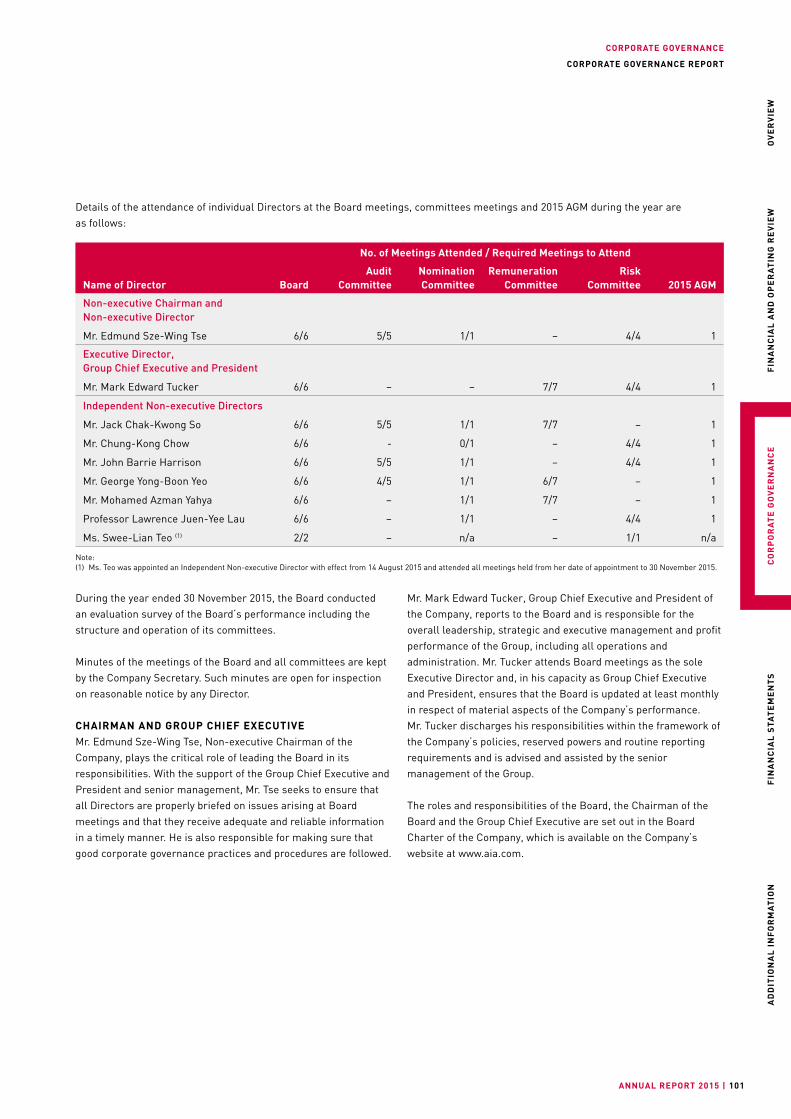
CORPORATE GOVERNANCE
ANNUAL REPORT 2015 | 101
OV
ER
VIE
WF
INA
NC
IAL
AN
D O
PE
RA
TIN
G R
EV
IEW
CO
RP
OR
AT
E G
OV
ER
NA
NC
EF
INA
NC
IAL
STA
TE
ME
NT
SA
DD
ITIO
NA
L I
NF
OR
MA
TIO
N
CORPORATE GOVERNANCE REPORT
Details of the attendance of individual Directors at the Board meetings, committees meetings and 2015 AGM during the year are as follows:
No. of Meetings Attended / Required Meetings to Attend
Name of Director BoardAudit
CommitteeNomination Committee
Remuneration Committee
Risk Committee 2015 AGM
Non-executive Chairman and Non-executive Director
Mr. Edmund Sze-Wing Tse 6/6 5/5 1/1 – 4/4 1
Executive Director, Group Chief Executive and President
Mr. Mark Edward Tucker 6/6 – – 7/7 4/4 1
Independent Non-executive Directors
Mr. Jack Chak-Kwong So 6/6 5/5 1/1 7/7 – 1
Mr. Chung-Kong Chow 6/6 - 0/1 – 4/4 1
Mr. John Barrie Harrison 6/6 5/5 1/1 – 4/4 1
Mr. George Yong-Boon Yeo 6/6 4/5 1/1 6/7 – 1
Mr. Mohamed Azman Yahya 6/6 – 1/1 7/7 – 1
Professor Lawrence Juen-Yee Lau 6/6 – 1/1 – 4/4 1
Ms. Swee-Lian Teo (1) 2/2 – n/a – 1/1 n/a
Note:(1) Ms. Teo was appointed an Independent Non-executive Director with effect from 14 August 2015 and attended all meetings held from her date of appointment to 30 November 2015.
During the year ended 30 November 2015, the Board conducted an evaluation survey of the Board’s performance including the structure and operation of its committees.
Minutes of the meetings of the Board and all committees are kept by the Company Secretary. Such minutes are open for inspection on reasonable notice by any Director.
CHAIRMAN AND GROUP CHIEF EXECUTIVEMr. Edmund Sze-Wing Tse, Non-executive Chairman of the Company, plays the critical role of leading the Board in its responsibilities. With the support of the Group Chief Executive and President and senior management, Mr. Tse seeks to ensure that all Directors are properly briefed on issues arising at Board meetings and that they receive adequate and reliable information in a timely manner. He is also responsible for making sure that good corporate governance practices and procedures are followed.
Mr. Mark Edward Tucker, Group Chief Executive and President of the Company, reports to the Board and is responsible for the overall leadership, strategic and executive management and profit performance of the Group, including all operations and administration. Mr. Tucker attends Board meetings as the sole Executive Director and, in his capacity as Group Chief Executive and President, ensures that the Board is updated at least monthly in respect of material aspects of the Company’s performance. Mr. Tucker discharges his responsibilities within the framework of the Company’s policies, reserved powers and routine reporting requirements and is advised and assisted by the senior management of the Group.
The roles and responsibilities of the Board, the Chairman of the Board and the Group Chief Executive are set out in the Board Charter of the Company, which is available on the Company’s website at www.aia.com.
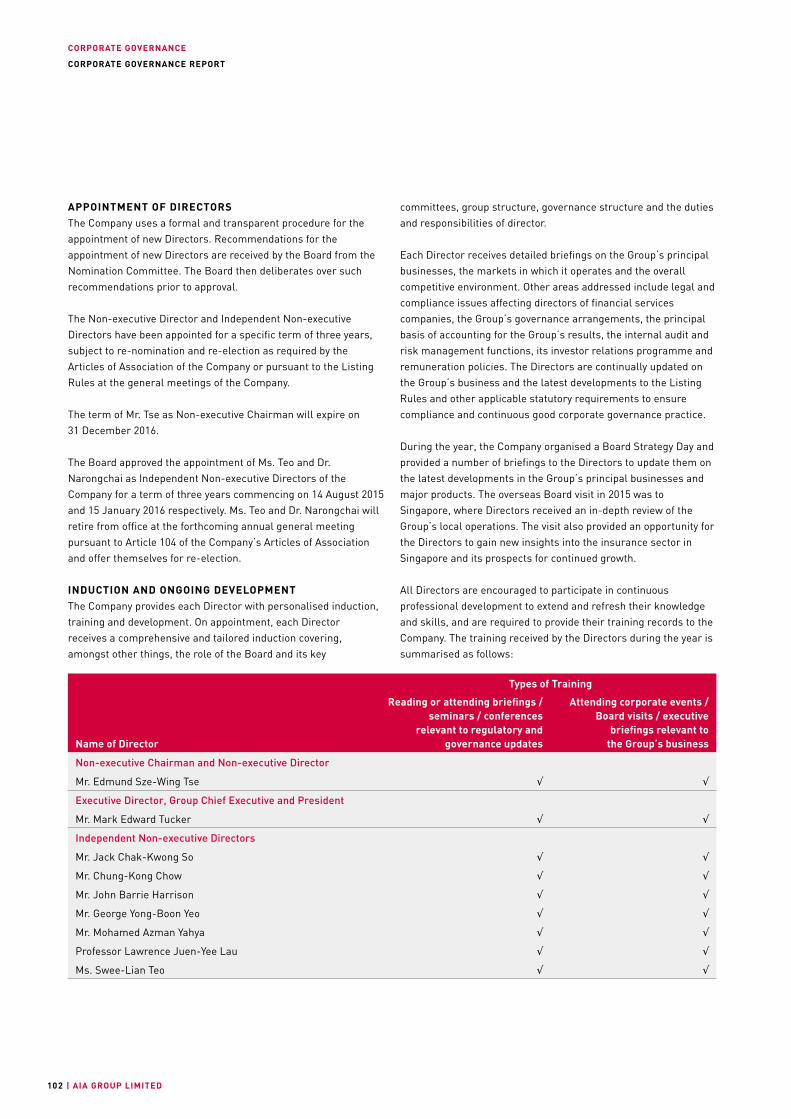
CORPORATE GOVERNANCE
| AIA GROUP LIMITED102
CORPORATE GOVERNANCE REPORT
Name of Director
Types of Training
Reading or attending briefings / seminars / conferences
relevant to regulatory and governance updates
Attending corporate events / Board visits / executive
briefings relevant to the Group’s business
Non-executive Chairman and Non-executive Director
Mr. Edmund Sze-Wing Tse √ √
Executive Director, Group Chief Executive and President
Mr. Mark Edward Tucker √ √
Independent Non-executive Directors
Mr. Jack Chak-Kwong So √ √
Mr. Chung-Kong Chow √ √
Mr. John Barrie Harrison √ √
Mr. George Yong-Boon Yeo √ √
Mr. Mohamed Azman Yahya √ √
Professor Lawrence Juen-Yee Lau √ √
Ms. Swee-Lian Teo √ √
APPOINTMENT OF DIRECTORSThe Company uses a formal and transparent procedure for the appointment of new Directors. Recommendations for the appointment of new Directors are received by the Board from the Nomination Committee. The Board then deliberates over such recommendations prior to approval.
The Non-executive Director and Independent Non-executive Directors have been appointed for a specific term of three years, subject to re-nomination and re-election as required by the Articles of Association of the Company or pursuant to the Listing Rules at the general meetings of the Company.
The term of Mr. Tse as Non-executive Chairman will expire on 31 December 2016.
The Board approved the appointment of Ms. Teo and Dr. Narongchai as Independent Non-executive Directors of the Company for a term of three years commencing on 14 August 2015 and 15 January 2016 respectively. Ms. Teo and Dr. Narongchai will retire from office at the forthcoming annual general meeting pursuant to Article 104 of the Company’s Articles of Association and offer themselves for re-election.
INDUCTION AND ONGOING DEVELOPMENTThe Company provides each Director with personalised induction, training and development. On appointment, each Director receives a comprehensive and tailored induction covering, amongst other things, the role of the Board and its key
committees, group structure, governance structure and the duties and responsibilities of director.
Each Director receives detailed briefings on the Group’s principal businesses, the markets in which it operates and the overall competitive environment. Other areas addressed include legal and compliance issues affecting directors of financial services companies, the Group’s governance arrangements, the principal basis of accounting for the Group’s results, the internal audit and risk management functions, its investor relations programme and remuneration policies. The Directors are continually updated on the Group’s business and the latest developments to the Listing Rules and other applicable statutory requirements to ensure compliance and continuous good corporate governance practice.
During the year, the Company organised a Board Strategy Day and provided a number of briefings to the Directors to update them on the latest developments in the Group’s principal businesses and major products. The overseas Board visit in 2015 was to Singapore, where Directors received an in-depth review of the Group’s local operations. The visit also provided an opportunity for the Directors to gain new insights into the insurance sector in Singapore and its prospects for continued growth.
All Directors are encouraged to participate in continuous professional development to extend and refresh their knowledge and skills, and are required to provide their training records to the Company. The training received by the Directors during the year is summarised as follows:
CORPORATE GOVERNANCE
ANNUAL REPORT 2015 | 103
OV
ER
VIE
WF
INA
NC
IAL
AN
D O
PE
RA
TIN
G R
EV
IEW
CO
RP
OR
AT
E G
OV
ER
NA
NC
EF
INA
NC
IAL
STA
TE
ME
NT
SA
DD
ITIO
NA
L I
NF
OR
MA
TIO
N
CORPORATE GOVERNANCE REPORT
COMMITTEES OF THE BOARDThe Company’s corporate governance is implemented through a structured hierarchy, which includes the Board of Directors and four committees of the Board established by resolutions of the Board, namely the Audit Committee, the Nomination Committee, the Remuneration Committee and the Risk Committee. The Terms of Reference of the Board committees are available on the websites of both the Hong Kong Stock Exchange and the Company. In addition, the Group Chief Executive has established a number of management committees including, among others, an Executive Committee and Operational and Financial Risk Committees.
Further details of the roles and functions and the composition of the Board committees are set out below.
AUDIT COMMITTEEThe Audit Committee consists of four members. All are Independent Non-executive Directors including Mr. Harrison, who serves as chairman of the Committee, Mr. So, Mr. Yeo and Dr. Narongchai who became a member on 15 January 2016. Mr. Tse ceased to be a member of the Committee on 15 January 2016. The primary duties performed by the Audit Committee during the year were the oversight of the Group’s financial reporting system and internal control procedures, monitoring the integrity of preparation of the Company’s financial information including quarterly business highlights, interim and annual results of the Group, reviewing the Group’s financial and accounting policies and practices as well as its whistle-blowing arrangements and monitoring the effectiveness of the internal audit function. The Audit Committee also provided oversight for and management of the relationship with the Group’s external auditor, including reviewing and monitoring in accordance with applicable standards the external auditor’s independence and objectivity and the effectiveness of the audit process.
Five meetings were held by the Audit Committee during the year ended 30 November 2015. The attendance records of the Audit Committee members are set out on page 101 of this Annual Report. NOMINATION COMMITTEEThe Nomination Committee consists of nine members. This includes the Non-executive Chairman, Mr. Tse, who serves as chairman of the Committee, and the eight Independent Non-executive Directors. Ms. Teo and Dr. Narongchai have been members of the Committee since 14 August 2015 and 15 January 2016 respectively. The primary duties performed by the
Nomination Committee during the year included reviewing and making recommendations to the Board on the structure, size and composition of the Board, including the skills, knowledge, experience and diversity of background of its membership, overseeing the identification and assessment of potential board candidates, providing oversight and direction in respect of the succession planning for directors and determining the composition of the Board committees.
The Nomination Committee’s processes and criteria for selecting and making recommendations on appointment of Board members are designed to satisfy high standards of corporate governance. These processes meet or exceed the Hong Kong Stock Exchange requirements to ensure that every director of the Company has the requisite character, experience and integrity and is able to demonstrate a standard of competence, commensurate with his or her position as a director of a listed issuer (including without limitation, race, gender, age, nationality, cultural and educational background), with due regard for the benefits of diversity, as set out in the Board Diversity Policy which was adopted by the Board in 2013 and is available on the Company’s website, and that where the nomination of Independent Non-executive Directors is under consideration the requirements of Rule 3.13 of the Listing Rules are satisfied.
One meeting was held by the Nomination Committee during the year ended 30 November 2015. The attendance records of the Nomination Committee members are set out on page 101 of this Annual Report.
REMUNERATION COMMITTEEThe Remuneration Committee consists of four members. This includes three Independent Non-executive Directors: Mr. So, the Committee chairman, Mr. Yeo, Mr. Yahya as well as the Non-executive Chairman, Mr. Tse who became a member on 15 January 2016. Mr. Tucker ceased to be a member of the Committee on 15 January 2016. The primary duties of the Remuneration Committee are to evaluate and make recommendations to the Board on the remuneration policy covering the Directors and senior management of the Group.
Seven meetings were held by the Remuneration Committee during the year ended 30 November 2015. Details of the attendance records are set out on page 101 of this Annual Report and key activities performed by the Remuneration Committee during the year have been set out in the Remuneration Report, which forms part of this Corporate Governance Report.
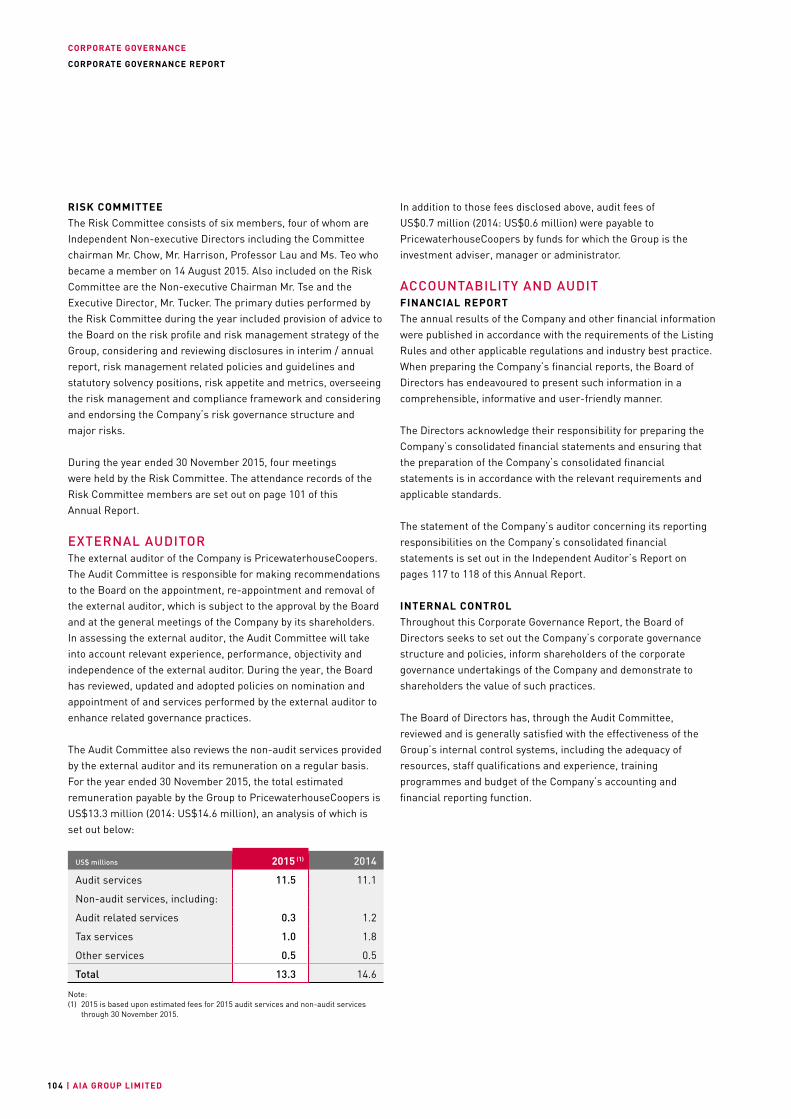
CORPORATE GOVERNANCE
| AIA GROUP LIMITED104
CORPORATE GOVERNANCE REPORT
RISK COMMITTEEThe Risk Committee consists of six members, four of whom are Independent Non-executive Directors including the Committee chairman Mr. Chow, Mr. Harrison, Professor Lau and Ms. Teo who became a member on 14 August 2015. Also included on the Risk Committee are the Non-executive Chairman Mr. Tse and the Executive Director, Mr. Tucker. The primary duties performed by the Risk Committee during the year included provision of advice to the Board on the risk profile and risk management strategy of the Group, considering and reviewing disclosures in interim / annual report, risk management related policies and guidelines and statutory solvency positions, risk appetite and metrics, overseeing the risk management and compliance framework and considering and endorsing the Company’s risk governance structure and major risks.
During the year ended 30 November 2015, four meetings were held by the Risk Committee. The attendance records of the Risk Committee members are set out on page 101 of this Annual Report.
EXTERNAL AUDITORThe external auditor of the Company is PricewaterhouseCoopers. The Audit Committee is responsible for making recommendations to the Board on the appointment, re-appointment and removal of the external auditor, which is subject to the approval by the Board and at the general meetings of the Company by its shareholders. In assessing the external auditor, the Audit Committee will take into account relevant experience, performance, objectivity and independence of the external auditor. During the year, the Board has reviewed, updated and adopted policies on nomination and appointment of and services performed by the external auditor to enhance related governance practices.
The Audit Committee also reviews the non-audit services provided by the external auditor and its remuneration on a regular basis. For the year ended 30 November 2015, the total estimated remuneration payable by the Group to PricewaterhouseCoopers is US$13.3 million (2014: US$14.6 million), an analysis of which is set out below:
US$ millions 2015 (1) 2014
Audit services 11.5 11.1
Non-audit services, including:
Audit related services 0.3 1.2
Tax services 1.0 1.8
Other services 0.5 0.5
Total 13.3 14.6
Note:(1) 2015 is based upon estimated fees for 2015 audit services and non-audit services
through 30 November 2015.
In addition to those fees disclosed above, audit fees of US$0.7 million (2014: US$0.6 million) were payable to PricewaterhouseCoopers by funds for which the Group is the investment adviser, manager or administrator.
ACCOUNTABILITY AND AUDITFINANCIAL REPORTThe annual results of the Company and other financial information were published in accordance with the requirements of the Listing Rules and other applicable regulations and industry best practice. When preparing the Company’s financial reports, the Board of Directors has endeavoured to present such information in a comprehensible, informative and user-friendly manner.
The Directors acknowledge their responsibility for preparing the Company’s consolidated financial statements and ensuring that the preparation of the Company’s consolidated financial statements is in accordance with the relevant requirements and applicable standards.
The statement of the Company’s auditor concerning its reporting responsibilities on the Company’s consolidated financial statements is set out in the Independent Auditor’s Report on pages 117 to 118 of this Annual Report.
INTERNAL CONTROLThroughout this Corporate Governance Report, the Board of Directors seeks to set out the Company’s corporate governance structure and policies, inform shareholders of the corporate governance undertakings of the Company and demonstrate to shareholders the value of such practices.
The Board of Directors has, through the Audit Committee, reviewed and is generally satisfied with the effectiveness of the Group’s internal control systems, including the adequacy of resources, staff qualifications and experience, training programmes and budget of the Company’s accounting and financial reporting function.
CORPORATE GOVERNANCE
ANNUAL REPORT 2015 | 105
OV
ER
VIE
WF
INA
NC
IAL
AN
D O
PE
RA
TIN
G R
EV
IEW
CO
RP
OR
AT
E G
OV
ER
NA
NC
EF
INA
NC
IAL
STA
TE
ME
NT
SA
DD
ITIO
NA
L I
NF
OR
MA
TIO
N
CORPORATE GOVERNANCE REPORT
COMPANY SECRETARYAll the Directors have access to the advice and services of the Company Secretary. Starting from 22 July 2015, the Group General Counsel, who reports to the Group Chief Executive, assumed the duties of the Company Secretary. The Company Secretary advises the Board on all corporate governance matters, facilitates the induction and professional development of Directors and ensures good information flows and communications within the Board and its committees and between management and non-executive directors. The Company Secretary also plays an important role in ensuring that Board and committee policies and procedures are followed. During the year, the Company Secretary undertook over 15 hours of relevant professional training.
ENGAGEMENT WITH SHAREHOLDERSThe Board recognises the importance of maintaining an ongoing dialogue with the shareholders of the Company through general meetings, releases, announcements and corporate communications such as the annual report, interim report and circulars. The Board is committed to the timely disclosure of information. The latest information regarding the Group’s activities, announcements, results presentation, webcasts and corporate communications is made available on the Company’s website at www.aia.com in a timely manner. The financial calendar highlighting the key dates for shareholders is set out on page 267 of this Annual Report.
The Investor Relations function oversees the Company’s engagement with investors. The Company’s institutional shareholder base is geographically diversified and the Company is also extensively covered by research analysts from a wide range of brokerage houses. An active and open dialogue with institutional investors is maintained through regular investor interactions, including meetings, investment conferences and roadshows. Investor feedback and analysts’ reports on the Company are circulated to the Board and the Executive Committee on a regular and systematic basis to promote an understanding of external views on the Company’s performance.
The Board has adopted a Shareholders’ Communication Policy and such policy will be reviewed on a regular basis to ensure its effectiveness. The Board welcomes views, questions and concerns from shareholders and stakeholders. Shareholders and stakeholders may send their enquiries and concerns to the Board. The contact details are set out on pages 267 to 268 of this Annual Report.
2015 ANNUAL GENERAL MEETINGThe most recent general meeting of the Company was the 2015 Annual General Meeting of the Company (2015 AGM) held at the Grand Ballroom, 2/F, New World Millennium Hong Kong Hotel, 72 Mody Road, Tsim Sha Tsui East, Hong Kong on 8 May 2015 at 11:00 a.m. The Chairman and all other members of the Board, together with the Group’s senior management and external auditor, attended the 2015 AGM. The poll voting results are available on the Company’s website. The matters resolved thereat are summarised below:
• Receipt of the audited consolidated financial statements of the Company, the Report of the Directors and the Independent Auditor’s Report for the year ended 30 November 2014;
• Declaration of a final dividend of 34.00 Hong Kong cents per share for the year ended 30 November 2014;
• Re-election of Professor Lau, Mr. Chow and Mr. Harrison as Independent Non-executive Directors of the Company;
• Re-appointment of PricewaterhouseCoopers as auditor of the Company until the conclusion of the next annual general meeting and authorising the Board to fix its remuneration;
• General mandate to Directors to cause the Company to issue additional shares of the Company, not exceeding 10 per cent of the aggregate number of shares in the Company on the date of the 2015 AGM and the discount for any shares to be issued not exceeding 10 per cent to the benchmarked price;
• General mandate to Directors to cause the Company to repurchase shares of the Company, not exceeding 10 per cent of the aggregate number of shares of the Company in issue on the date of the 2015 AGM; and
• General mandate to Directors to cause the Company to issue shares of the Company, not exceeding 2.5 per cent of the number of shares in the Company on the date of the 2015 AGM under the restricted share unit scheme.
The forthcoming annual general meeting of the Company will be held on Friday, 6 May 2016. Further details will be set out in the circular to the shareholders of the Company to be sent together with this Annual Report.
CORPORATE GOVERNANCE
| AIA GROUP LIMITED106
CORPORATE GOVERNANCE REPORT
SHAREHOLDERS’ RIGHTSGENERAL MEETINGShareholder(s) of the Company may request to call a general meeting. If such request is made by shareholder(s) of the Company representing at least 5 per cent of the total voting rights of all the shareholders of the Company having a right to vote at general meetings, such general meeting must be called. Such request, either in hard copy form or in electronic form and being authenticated by the person or persons making it, must be deposited at the registered office of the Company at 35/F, AIA Central, No. 1 Connaught Road Central, Hong Kong or sent by email to [email protected] for the attention of the Company Secretary. Shareholder(s) of the Company should make reference to the provisions under Sections 566 to 568 of the Hong Kong Companies Ordinance for calling a general meeting.
MOVING A RESOLUTION AT AN ANNUAL GENERAL MEETINGShareholder(s) of the Company may request the Company to give notice of a resolution and move such resolution at an annual general meeting. Such notice of resolution must be given by the Company if it has received such request from:
(a) shareholder(s) of the Company representing at least 2.5 per cent of the total voting rights of all the shareholders of the Company who have a right to vote on the resolution at the annual general meeting to which the request relates; or
(b) at least 50 shareholders of the Company who have a right to vote on the resolution at the annual general meeting to which the request relates.
Such a request must identify the resolution of which notice is to be given, be either in hard copy form or in electronic form and be authenticated by the person or persons making it, and be received by the Company not later than six weeks before the annual general meeting to which the request relates or, if later, the time at which notice is given of that meeting. The request must be
deposited at the registered office of the Company at 35/F, AIA Central, No. 1 Connaught Road Central, Hong Kong or sent by email to [email protected] for the attention of the Company Secretary. Shareholder(s) of the Company should make reference to Sections 615 and 616 of the Hong Kong Companies Ordinance for the relevant procedures to move a resolution at an annual general meeting.
PROPOSING A PERSON FOR ELECTION AS A DIRECTOR Shareholders can propose a person (other than a retiring Director or himself / herself) for election as a director at a general meeting of the Company. Relevant procedures are available on the Company’s website at www.aia.com.
CONSTITUTIONAL DOCUMENTSThe Company’s Articles of Association (in both English and Chinese) is available on both the websites of the Company and the Hong Kong Stock Exchange. During the year, there has been no change to the Articles of Association of the Company.
By Order of the Board
Mitchell New
Company Secretary
25 February 2016
CORPORATE GOVERNANCE
ANNUAL REPORT 2015 | 107
OV
ER
VIE
WF
INA
NC
IAL
AN
D O
PE
RA
TIN
G R
EV
IEW
CO
RP
OR
AT
E G
OV
ER
NA
NC
EF
INA
NC
IAL
STA
TE
ME
NT
SA
DD
ITIO
NA
L I
NF
OR
MA
TIO
N
As discussed later in this report, the remuneration for senior Group executives consists of four elements: basic salary, short-term incentive, long-term incentive and benefits, with a significant proportion of total remuneration awarded subject to multi-year performance-based vesting conditions. The Remuneration Committee believes that this structure continues to reflect an appropriate balance between risks and rewards. Payments under the short-term incentive plan continue to be capped and the maximum number of restricted share units and share options that can be earned pursuant to our long-term incentive plan is fixed at the date of grant. In combination, these incentive structures provide appropriate incentives for the creation of sustainable value for shareholders while discouraging excessive risk-taking.
During the year the Remuneration Committee also reviewed the Non-executive Directors’ remuneration structure which has remained unchanged since the Company’s IPO. With the Committee’s recommendation the Board has made certain adjustments to the structure with effect from 1 December 2015 to maintain the structure’s competitiveness.
Overall, the Remuneration Committee believes that the Group’s current remuneration policies and practices should be maintained. I trust that this report provides clear and detailed information regarding such policies and practices and look forward to your continued support.
Jack Chak-Kwong So
Chairman, Remuneration Committee
25 February 2016
REMUNERATION REPORT
Dear Shareholders,
I am pleased to present the Report on Remuneration for Directors and Key Management Personnel (the Report) for the year ended 30 November 2015.
At the outset, I am delighted to say that our Non-executive Chairman of the Board, Mr. Edmund Tse, has joined the Remuneration Committee (the Committee) effective 15 January 2016. Our Group Chief Executive and President, Mr. Mark Edward Tucker, ceased to be a member of the Remuneration Committee on the same day and I would like to express my sincere appreciation for his insights, contribution and support on remuneration-related matters over the years.
As in prior years, the determination of executive remuneration at the Group follows a rigorous process that takes into account the Group’s business priorities and performance, market practices, the regulatory environment, as well as risk management considerations. Independent professional advice was obtained throughout the year and to this end, the Remuneration Committee undertook an advisor assessment process in the first half of the year screening five potential providers. After due consideration, the Committee decided to re-appoint its current advisor.
The Remuneration Committee’s work in 2015 continued to focus, amongst other things, on risk-related areas. The Committee reviewed and updated the Group’s approach to total remuneration, codifying the practices that the Group adopts to ensure appropriate governance over executive remuneration and institutionalising risk management considerations as part of its total remuneration policy. The Committee also continued to monitor short-term incentive plan performance measures in light of the Group’s risk management framework and confirmed that these measures are appropriate and broadly consistent with the measures adopted by peer companies. Similar to previous years, the Committee communicated its deliberations to and coordinated its activities with the Risk Committee.
CORPORATE GOVERNANCE
| AIA GROUP LIMITED108
REMUNERATION REPORT
REMUNERATION COMMITTEEThe Remuneration Committee is responsible for determining the specific remuneration packages of the Group Chief Executive and President (who is also the sole Executive Director) and Key Management Personnel (senior executives who, by the nature and accountabilities of their respective positions, participate directly in the development, monitoring and reporting of the overall business strategies of the Group) and making recommendations to the Board on the remuneration policy and structure to be applied for the Chairman and Non-executive Directors.
The Remuneration Committee is also responsible for establishing formal and transparent procedures for developing remuneration policies and structures. In making its determinations and recommendations, the Remuneration Committee considers such factors as the responsibilities of the Group Chief Executive and President and Key Management Personnel, the remuneration paid by comparable companies, remuneration levels within the Group and the application of performance-based remuneration programmes. The Remuneration Committee also oversees the operation of the Company’s share option scheme and other incentive schemes, recommending share-based employee awards to the Board for approval as well as reviewing and, where appropriate, amending the terms of the schemes as may be required.
The Remuneration Committee is authorised by the Board to discharge its duties as outlined in its Terms of Reference. It is also authorised to seek any remuneration information it requires from the Group Chief Executive and President and/or Key Management Personnel and may obtain external independent professional advice if necessary.
The full Terms of Reference of the Remuneration Committee can be accessed at www.aia.com.
MEETINGS IN 2015As at 30 November 2015, the Committee consisted of four members: three Independent Non-executive Directors, being Mr. Jack Chak-Kwong So, who is the Chairman of the Committee, Mr. George Yong-Boon Yeo, and Mr. Mohamed Azman Yahya; and one Executive Director, being Mr. Mark Edward Tucker.
During the year ended 30 November 2015, seven meetings were held by the Remuneration Committee. The attendance records of the Remuneration Committee members are set out on page 101 of this Annual Report.
During the year, major activities performed by the Remuneration Committee in relation to the remuneration of the Group Chief Executive and President, Key Management Personnel, Chairman and Non-executive Directors were as follows:
• Reviewed the executive benchmark results and approved the 2015 remuneration packages for the Group Chief Executive and President and Key Management Personnel (the Group Chief Executive and President was not involved in discussion of his own remuneration and the long-term incentive awards for the Group Chief Executive and President were subsequently approved by the Independent Non-executive Directors);
• Provided the Risk Committee with an updated summary of considerations undertaken by the Remuneration Committee in ensuring that the Group’s compensation and benefits arrangements align with stakeholders’ interests and avoid excessive risk-taking;
• Reviewed and approved the 2014 short-term incentive plan payout and the vesting of the 2012 long-term incentive award;
• Reviewed and approved the 2015 long-term incentive award;
• Reviewed and approved the performance measures to be used in the 2016 short-term incentive plan and the 2016 long-term incentive award;
• Reviewed and approved the peer group for benchmarking the compensation of the Group Chief Executive and President;
• Reviewed the Company’s approach to total remuneration and recommended the updated approach to the Board for adoption;
• Reviewed the Non-executive Directors’ remuneration structure and recommended new structure to the Board for adoption;
• Reviewed and approved the 2014 Remuneration Report; and
• Undertook an advisor assessment process and approved the re-appointment of the current advisor.
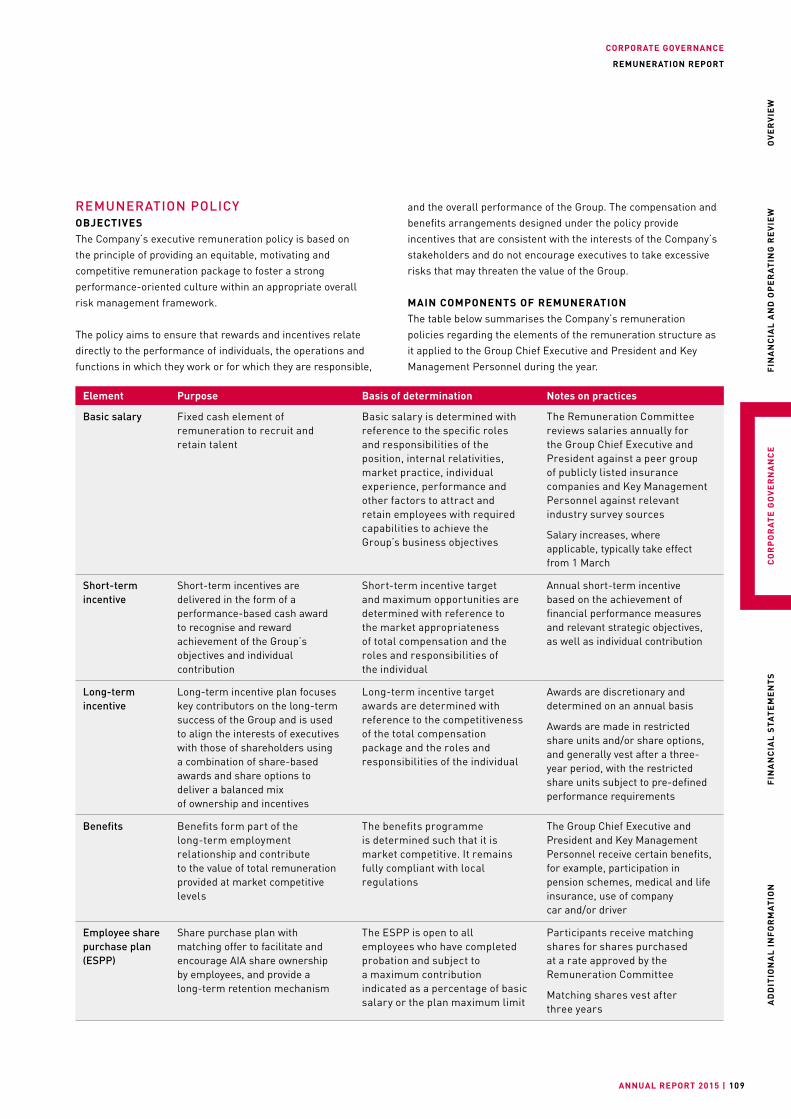
CORPORATE GOVERNANCE
ANNUAL REPORT 2015 | 109
OV
ER
VIE
WF
INA
NC
IAL
AN
D O
PE
RA
TIN
G R
EV
IEW
CO
RP
OR
AT
E G
OV
ER
NA
NC
EF
INA
NC
IAL
STA
TE
ME
NT
SA
DD
ITIO
NA
L I
NF
OR
MA
TIO
N
REMUNERATION REPORT
REMUNERATION POLICYOBJECTIVES The Company’s executive remuneration policy is based on the principle of providing an equitable, motivating and competitive remuneration package to foster a strong performance-oriented culture within an appropriate overall risk management framework.
The policy aims to ensure that rewards and incentives relate directly to the performance of individuals, the operations and functions in which they work or for which they are responsible,
and the overall performance of the Group. The compensation and benefits arrangements designed under the policy provide incentives that are consistent with the interests of the Company’s stakeholders and do not encourage executives to take excessive risks that may threaten the value of the Group.
MAIN COMPONENTS OF REMUNERATIONThe table below summarises the Company’s remuneration policies regarding the elements of the remuneration structure as it applied to the Group Chief Executive and President and Key Management Personnel during the year.
Element Purpose Basis of determination Notes on practices
Basic salary Fixed cash element of remuneration to recruit and retain talent
Basic salary is determined with reference to the specific roles and responsibilities of the position, internal relativities, market practice, individual experience, performance and other factors to attract and retain employees with required capabilities to achieve the Group’s business objectives
The Remuneration Committee reviews salaries annually for the Group Chief Executive and President against a peer group of publicly listed insurance companies and Key Management Personnel against relevant industry survey sources
Salary increases, where applicable, typically take effect from 1 March
Short-term incentive
Short-term incentives are delivered in the form of a performance-based cash award to recognise and reward achievement of the Group’s objectives and individual contribution
Short-term incentive target and maximum opportunities are determined with reference to the market appropriateness of total compensation and the roles and responsibilities of the individual
Annual short-term incentive based on the achievement of financial performance measures and relevant strategic objectives, as well as individual contribution
Long-term incentive
Long-term incentive plan focuses key contributors on the long-term success of the Group and is used to align the interests of executives with those of shareholders using a combination of share-based awards and share options to deliver a balanced mix of ownership and incentives
Long-term incentive target awards are determined with reference to the competitiveness of the total compensation package and the roles and responsibilities of the individual
Awards are discretionary and determined on an annual basis
Awards are made in restricted share units and/or share options, and generally vest after a three-year period, with the restricted share units subject to pre-defined performance requirements
Benefits Benefits form part of the long-term employment relationship and contribute to the value of total remuneration provided at market competitive levels
The benefits programme is determined such that it is market competitive. It remains fully compliant with local regulations
The Group Chief Executive and President and Key Management Personnel receive certain benefits, for example, participation in pension schemes, medical and life insurance, use of company car and/or driver
Employee share purchase plan (ESPP)
Share purchase plan with matching offer to facilitate and encourage AIA share ownership by employees, and provide a long-term retention mechanism
The ESPP is open to all employees who have completed probation and subject to a maximum contribution indicated as a percentage of basic salary or the plan maximum limit
Participants receive matching shares for shares purchased at a rate approved by the Remuneration Committee
Matching shares vest after three years
CORPORATE GOVERNANCE
| AIA GROUP LIMITED110
REMUNERATION REPORT
SHORT-TERM INCENTIVE PLANFor 2015, short-term incentive targets were determined and communicated to the Group Chief Executive and President and Key Management Personnel at the beginning of the financial year. The performance measures for 2015 short-term incentives were:
• Value of new business;• Excess embedded value growth; and• Operating profit after tax.
Value of new business (VONB) is an estimate of the economic value of one year’s sales as published by the Company.
Excess embedded value growth (EEV Growth) is the sum of the operating experience variances (current year performance against the operating assumptions for calculating embedded value or EV) and operating assumption changes (value of future operating outperformance considered permanent enough for recognition in the current year) in the EV operating profit.
Operating profit after tax (OPAT) is the IFRS operating profit after tax based on the IFRS results published by the Company.
The weighting of the three performance measures described above is 60 per cent, 10 per cent and 30 per cent for VONB, EEV Growth and OPAT respectively. Based on the level of achievement of the performance measures, short-term incentive awards in respect of 2015 will be paid to the Group Chief Executive and President and Key Management Personnel in March 2016. The total value of short-term incentive awards accrued for the Group Chief Executive and President and Key Management Personnel for the financial year ended 30 November 2015 is US$13,384,600. Such amount is included in note 40 to the financial statements as the “Bonuses” to the Group Chief Executive and President and as part of the “Salaries and other short-term employee benefits” to the Key Management Personnel.
LONG-TERM INCENTIVE PLANThe Restricted Share Unit Scheme and the Share Option Scheme were adopted on 28 September 2010 and are effective for a period of 10 years from the date of adoption. Summary details are provided in the pages that follow and in detail in note 39 to the financial statements.
These schemes are designed to motivate and reward participants who have not only made an important contribution to AIA’s success but are expected to play a significant role in the future.
Awards made under these schemes are discretionary and are determined on an annual basis with reference to the magnitude of overall variable remuneration, the competitiveness of the total remuneration package, the roles, responsibilities, performance and potential of the individual.
The schemes operate through the award of restricted share units and share options to deliver a balanced mix of incentives and ownership. The awards made are subject to eligibility criteria and generally vest after a three-year period.
As applicable to other remuneration payments, long-term incentive vesting is subject to the Remuneration Committee’s approval and is in compliance with all relevant Group policies.
The schemes are reviewed regularly to ensure that the design, process, structure and governance work together to balance risk and incentives.
RESTRICTED SHARE UNIT SCHEME Under the Restricted Share Unit Scheme, the Company may award restricted share units to employees, Directors (excluding Independent Non-executive Directors) or officers of the Company or any of its subsidiaries. The objectives of the Restricted Share Unit Scheme are to retain participants, align their interests with those of the Company’s investors and reward the creation of sustainable value for shareholders through the award of restricted share units to participants.
During the year ended 30 November 2015, 17,933,566 restricted share units were awarded by the Company under the Restricted Share Unit Scheme.
Performance Measures and VestingVesting of performance-based restricted share unit awards will be contingent on the extent of achievement of three-year performance targets as outlined below for the following metrics:
• Value of new business;• Equity attributable to shareholders of the Company on the
embedded value basis; and• Total shareholder return.
Value of new business (VONB) is an estimate of the economic value of one year’s sales as published by the Company.
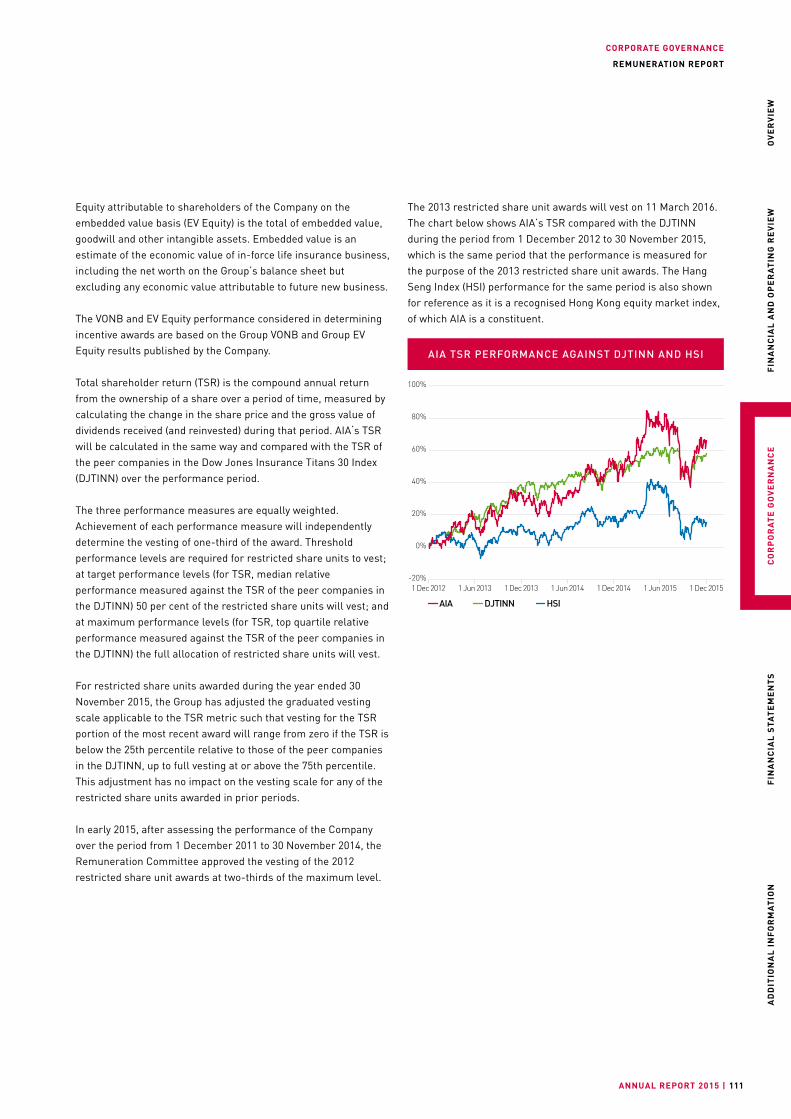
CORPORATE GOVERNANCE
ANNUAL REPORT 2015 | 111
OV
ER
VIE
WF
INA
NC
IAL
AN
D O
PE
RA
TIN
G R
EV
IEW
CO
RP
OR
AT
E G
OV
ER
NA
NC
EF
INA
NC
IAL
STA
TE
ME
NT
SA
DD
ITIO
NA
L I
NF
OR
MA
TIO
N
REMUNERATION REPORT
Equity attributable to shareholders of the Company on the embedded value basis (EV Equity) is the total of embedded value, goodwill and other intangible assets. Embedded value is an estimate of the economic value of in-force life insurance business, including the net worth on the Group’s balance sheet but excluding any economic value attributable to future new business.
The VONB and EV Equity performance considered in determining incentive awards are based on the Group VONB and Group EV Equity results published by the Company.
Total shareholder return (TSR) is the compound annual return from the ownership of a share over a period of time, measured by calculating the change in the share price and the gross value of dividends received (and reinvested) during that period. AIA‘s TSR will be calculated in the same way and compared with the TSR of the peer companies in the Dow Jones Insurance Titans 30 Index (DJTINN) over the performance period.
The three performance measures are equally weighted. Achievement of each performance measure will independently determine the vesting of one-third of the award. Threshold performance levels are required for restricted share units to vest; at target performance levels (for TSR, median relative performance measured against the TSR of the peer companies in the DJTINN) 50 per cent of the restricted share units will vest; and at maximum performance levels (for TSR, top quartile relative performance measured against the TSR of the peer companies in the DJTINN) the full allocation of restricted share units will vest.
For restricted share units awarded during the year ended 30 November 2015, the Group has adjusted the graduated vesting scale applicable to the TSR metric such that vesting for the TSR portion of the most recent award will range from zero if the TSR is below the 25th percentile relative to those of the peer companies in the DJTINN, up to full vesting at or above the 75th percentile. This adjustment has no impact on the vesting scale for any of the restricted share units awarded in prior periods.
In early 2015, after assessing the performance of the Company over the period from 1 December 2011 to 30 November 2014, the Remuneration Committee approved the vesting of the 2012 restricted share unit awards at two-thirds of the maximum level.
The 2013 restricted share unit awards will vest on 11 March 2016.The chart below shows AIA’s TSR compared with the DJTINN during the period from 1 December 2012 to 30 November 2015, which is the same period that the performance is measured for the purpose of the 2013 restricted share unit awards. The Hang Seng Index (HSI) performance for the same period is also shown for reference as it is a recognised Hong Kong equity market index, of which AIA is a constituent.
-20%
0%
20%
40%
60%
80%
100%
1 Dec 2012 1 Jun 2013 1 Dec 2013 1 Jun 2014 1 Dec 2014 1 Jun 2015 1 Dec 2015
AIA HSIDJTINN
AIA TSR PERFORMANCE AGAINST DJTINN AND HSI
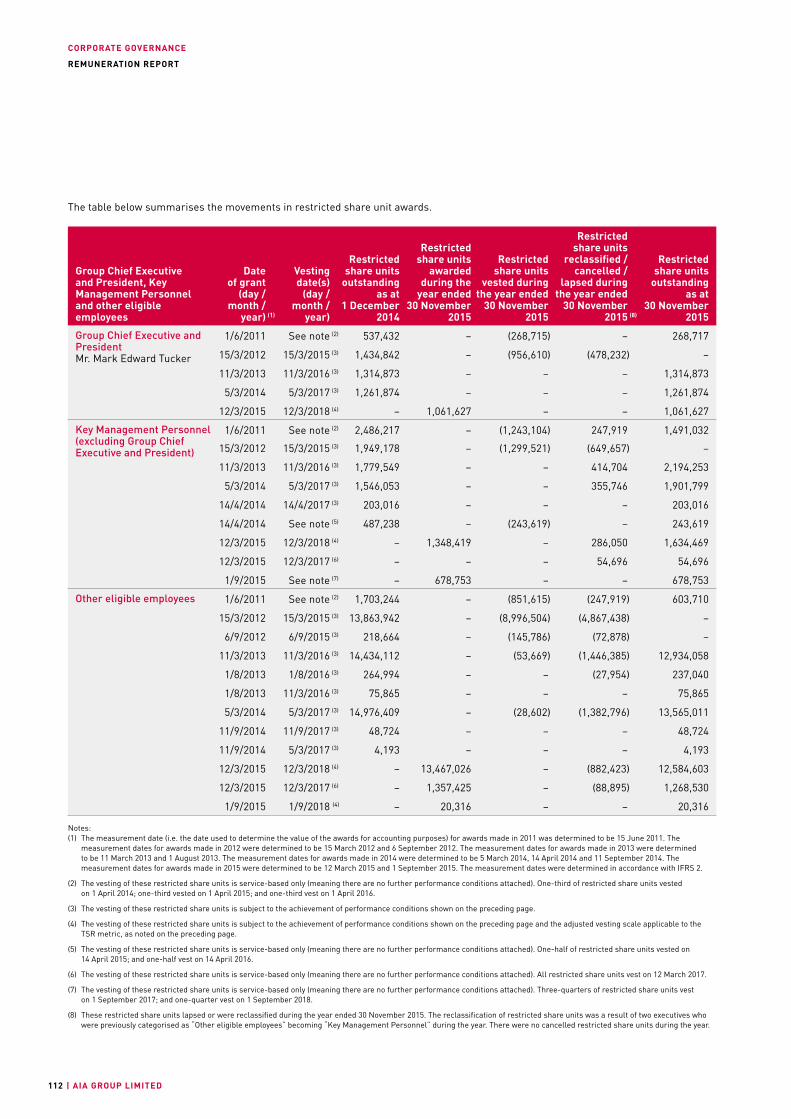
CORPORATE GOVERNANCE
| AIA GROUP LIMITED112
REMUNERATION REPORT
The table below summarises the movements in restricted share unit awards.
Group Chief Executive and President, Key Management Personnel and other eligible employees
Date
of grant (day /
month / year) (1)
Vesting date(s) (day /
month / year)
Restricted share units
outstanding as at
1 December 2014
Restricted share units
awarded during the
year ended30 November
2015
Restricted
share units vested during
the year ended30 November
2015
Restricted share units
reclassified / cancelled /
lapsed during the year ended
30 November 2015 (8)
Restricted share units
outstanding as at
30 November 2015
Group Chief Executive and PresidentMr. Mark Edward Tucker
1/6/2011 See note (2) 537,432 – (268,715) – 268,717
15/3/2012 15/3/2015 (3) 1,434,842 – (956,610) (478,232) –
11/3/2013 11/3/2016 (3) 1,314,873 – – – 1,314,873
5/3/2014 5/3/2017 (3) 1,261,874 – – – 1,261,874
12/3/2015 12/3/2018 (4) – 1,061,627 – – 1,061,627
Key Management Personnel (excluding Group Chief Executive and President)
1/6/2011 See note (2) 2,486,217 – (1,243,104) 247,919 1,491,032
15/3/2012 15/3/2015 (3) 1,949,178 – (1,299,521) (649,657) –
11/3/2013 11/3/2016 (3) 1,779,549 – – 414,704 2,194,253
5/3/2014 5/3/2017 (3) 1,546,053 – – 355,746 1,901,799
14/4/2014 14/4/2017 (3) 203,016 – – – 203,016
14/4/2014 See note (5) 487,238 – (243,619) – 243,619
12/3/2015 12/3/2018 (4) – 1,348,419 – 286,050 1,634,469
12/3/2015 12/3/2017 (6) – – – 54,696 54,696
1/9/2015 See note (7) – 678,753 – – 678,753
Other eligible employees 1/6/2011 See note (2) 1,703,244 – (851,615) (247,919) 603,710
15/3/2012 15/3/2015 (3) 13,863,942 – (8,996,504) (4,867,438) –
6/9/2012 6/9/2015 (3) 218,664 – (145,786) (72,878) –
11/3/2013 11/3/2016 (3) 14,434,112 – (53,669) (1,446,385) 12,934,058
1/8/2013 1/8/2016 (3) 264,994 – – (27,954) 237,040
1/8/2013 11/3/2016 (3) 75,865 – – – 75,865
5/3/2014 5/3/2017 (3) 14,976,409 – (28,602) (1,382,796) 13,565,011
11/9/2014 11/9/2017 (3) 48,724 – – – 48,724
11/9/2014 5/3/2017 (3) 4,193 – – – 4,193
12/3/2015 12/3/2018 (4) – 13,467,026 – (882,423) 12,584,603
12/3/2015 12/3/2017 (6) – 1,357,425 – (88,895) 1,268,530
1/9/2015 1/9/2018 (4) – 20,316 – – 20,316
Notes:(1) The measurement date (i.e. the date used to determine the value of the awards for accounting purposes) for awards made in 2011 was determined to be 15 June 2011. The
measurement dates for awards made in 2012 were determined to be 15 March 2012 and 6 September 2012. The measurement dates for awards made in 2013 were determined to be 11 March 2013 and 1 August 2013. The measurement dates for awards made in 2014 were determined to be 5 March 2014, 14 April 2014 and 11 September 2014. The measurement dates for awards made in 2015 were determined to be 12 March 2015 and 1 September 2015. The measurement dates were determined in accordance with IFRS 2.
(2) The vesting of these restricted share units is service-based only (meaning there are no further performance conditions attached). One-third of restricted share units vested on 1 April 2014; one-third vested on 1 April 2015; and one-third vest on 1 April 2016.
(3) The vesting of these restricted share units is subject to the achievement of performance conditions shown on the preceding page.
(4) The vesting of these restricted share units is subject to the achievement of performance conditions shown on the preceding page and the adjusted vesting scale applicable to the TSR metric, as noted on the preceding page.
(5) The vesting of these restricted share units is service-based only (meaning there are no further performance conditions attached). One-half of restricted share units vested on 14 April 2015; and one-half vest on 14 April 2016.
(6) The vesting of these restricted share units is service-based only (meaning there are no further performance conditions attached). All restricted share units vest on 12 March 2017.
(7) The vesting of these restricted share units is service-based only (meaning there are no further performance conditions attached). Three-quarters of restricted share units vest on 1 September 2017; and one-quarter vest on 1 September 2018.
(8) These restricted share units lapsed or were reclassified during the year ended 30 November 2015. The reclassification of restricted share units was a result of two executives who were previously categorised as “Other eligible employees” becoming “Key Management Personnel” during the year. There were no cancelled restricted share units during the year.
CORPORATE GOVERNANCE
ANNUAL REPORT 2015 | 113
OV
ER
VIE
WF
INA
NC
IAL
AN
D O
PE
RA
TIN
G R
EV
IEW
CO
RP
OR
AT
E G
OV
ER
NA
NC
EF
INA
NC
IAL
STA
TE
ME
NT
SA
DD
ITIO
NA
L I
NF
OR
MA
TIO
N
REMUNERATION REPORT
SHARE OPTION SCHEMEThe objective of the Share Option Scheme is to align the interests of Scheme participants with those of the Company’s shareholders. Under the Share Option Scheme, the Company may award share options to employees, Directors (excluding Independent Non-executive Directors) or officers of the Company or any of its subsidiaries. No amount is payable by the eligible participants on the acceptance of a share option.
During the year ended 30 November 2015, 5,937,871 share options were awarded by the Company under the Share Option Scheme to employees and officers of the Company and employees, officers and directors of a number of its subsidiaries. The exercise price of such share options was determined by applying the highest of (i) the closing price of the shares on the date of grant, (ii) the average closing price of the shares for the five business days immediately preceding the date of grant and (iii) the nominal value of a share.
The total number of share options that can be awarded under the scheme is 301,100,000, representing approximately 2.5 per cent of the number of shares in issue as at the date of this report. Unless shareholders’ approval is obtained in accordance with the relevant procedural requirements under the Listing Rules, the maximum number of shares under options that may be awarded to any employee in any 12-month period up to and including a proposed date of grant is 0.25 per cent of the number of shares in issue as of the proposed date of grant. No share options have been awarded to substantial shareholders, or in excess of the individual limit.
Performance Measures and VestingShare options awarded under the Share Option Scheme have a life of 10 years before expiry. Generally, share options become exercisable three years after the date of grant and remain exercisable for another seven years, subject to participants’ continued employment in good standing. There are no performance conditions attached to the vesting of share options. Each share option entitles the eligible participant to subscribe for one ordinary share. Benefits are realised only to the extent that share price exceeds exercise price.
All share options awarded in 2012 became exercisable on 15 March 2015. The share options awarded in 2015 will vest in 2018. Details of the valuation of the share options are set out in note 39 to the financial statements.
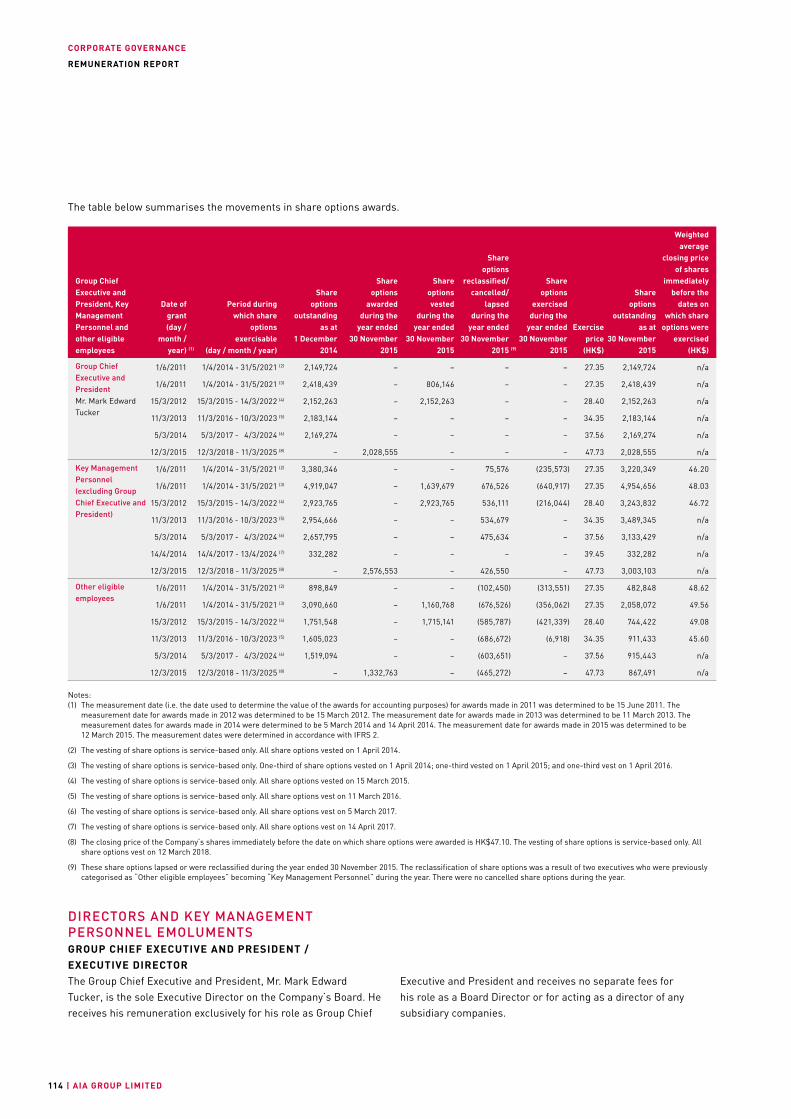
CORPORATE GOVERNANCE
| AIA GROUP LIMITED114
REMUNERATION REPORT
The table below summarises the movements in share options awards.
Group Chief Executive and President, Key Management Personnel and other eligible employees
Date of grant (day /
month / year) (1)
Period during which share
options exercisable
(day / month / year)
Share options
outstanding as at
1 December 2014
Share options
awarded during the
year ended 30 November
2015
Share options vested
during the year ended
30 November 2015
Share options
reclassified/ cancelled/
lapsed during the
year ended 30 November
2015 (9)
Share options
exercised during the
year ended 30 November
2015
Exercise price (HK$)
Share options
outstanding as at
30 November 2015
Weighted average
closing price of shares
immediately before the
dates on which share
options were exercised
(HK$)
Group Chief Executive and PresidentMr. Mark Edward Tucker
1/6/2011 1/4/2014 - 31/5/2021 (2) 2,149,724 – – – – 27.35 2,149,724 n/a
1/6/2011 1/4/2014 - 31/5/2021 (3) 2,418,439 – 806,146 – – 27.35 2,418,439 n/a
15/3/2012 15/3/2015 - 14/3/2022 (4) 2,152,263 – 2,152,263 – – 28.40 2,152,263 n/a
11/3/2013 11/3/2016 - 10/3/2023 (5) 2,183,144 – – – – 34.35 2,183,144 n/a
5/3/2014 5/3/2017 - 4/3/2024 (6) 2,169,274 – – – – 37.56 2,169,274 n/a
12/3/2015 12/3/2018 - 11/3/2025 (8) – 2,028,555 – – – 47.73 2,028,555 n/a
Key Management Personnel (excluding Group Chief Executive and President)
1/6/2011 1/4/2014 - 31/5/2021 (2) 3,380,346 – – 75,576 (235,573) 27.35 3,220,349 46.20
1/6/2011 1/4/2014 - 31/5/2021 (3) 4,919,047 – 1,639,679 676,526 (640,917) 27.35 4,954,656 48.03
15/3/2012 15/3/2015 - 14/3/2022 (4) 2,923,765 – 2,923,765 536,111 (216,044) 28.40 3,243,832 46.72
11/3/2013 11/3/2016 - 10/3/2023 (5) 2,954,666 – – 534,679 – 34.35 3,489,345 n/a
5/3/2014 5/3/2017 - 4/3/2024 (6) 2,657,795 – – 475,634 – 37.56 3,133,429 n/a
14/4/2014 14/4/2017 - 13/4/2024 (7) 332,282 – – – – 39.45 332,282 n/a
12/3/2015 12/3/2018 - 11/3/2025 (8) – 2,576,553 – 426,550 – 47.73 3,003,103 n/a
Other eligible employees
1/6/2011 1/4/2014 - 31/5/2021 (2) 898,849 – – (102,450) (313,551) 27.35 482,848 48.62
1/6/2011 1/4/2014 - 31/5/2021 (3) 3,090,660 – 1,160,768 (676,526) (356,062) 27.35 2,058,072 49.56
15/3/2012 15/3/2015 - 14/3/2022 (4) 1,751,548 – 1,715,141 (585,787) (421,339) 28.40 744,422 49.08
11/3/2013 11/3/2016 - 10/3/2023 (5) 1,605,023 – – (686,672) (6,918) 34.35 911,433 45.60
5/3/2014 5/3/2017 - 4/3/2024 (6) 1,519,094 – – (603,651) – 37.56 915,443 n/a
12/3/2015 12/3/2018 - 11/3/2025 (8) – 1,332,763 – (465,272) – 47.73 867,491 n/a
Notes:(1) The measurement date (i.e. the date used to determine the value of the awards for accounting purposes) for awards made in 2011 was determined to be 15 June 2011. The
measurement date for awards made in 2012 was determined to be 15 March 2012. The measurement date for awards made in 2013 was determined to be 11 March 2013. The measurement dates for awards made in 2014 were determined to be 5 March 2014 and 14 April 2014. The measurement date for awards made in 2015 was determined to be 12 March 2015. The measurement dates were determined in accordance with IFRS 2.
(2) The vesting of share options is service-based only. All share options vested on 1 April 2014.
(3) The vesting of share options is service-based only. One-third of share options vested on 1 April 2014; one-third vested on 1 April 2015; and one-third vest on 1 April 2016.
(4) The vesting of share options is service-based only. All share options vested on 15 March 2015.
(5) The vesting of share options is service-based only. All share options vest on 11 March 2016.
(6) The vesting of share options is service-based only. All share options vest on 5 March 2017.
(7) The vesting of share options is service-based only. All share options vest on 14 April 2017.
(8) The closing price of the Company’s shares immediately before the date on which share options were awarded is HK$47.10. The vesting of share options is service-based only. All share options vest on 12 March 2018.
(9) These share options lapsed or were reclassified during the year ended 30 November 2015. The reclassification of share options was a result of two executives who were previously categorised as “Other eligible employees” becoming “Key Management Personnel” during the year. There were no cancelled share options during the year.
DIRECTORS AND KEY MANAGEMENT PERSONNEL EMOLUMENTSGROUP CHIEF EXECUTIVE AND PRESIDENT / EXECUTIVE DIRECTORThe Group Chief Executive and President, Mr. Mark Edward Tucker, is the sole Executive Director on the Company’s Board. He receives his remuneration exclusively for his role as Group Chief
Executive and President and receives no separate fees for his role as a Board Director or for acting as a director of any subsidiary companies.
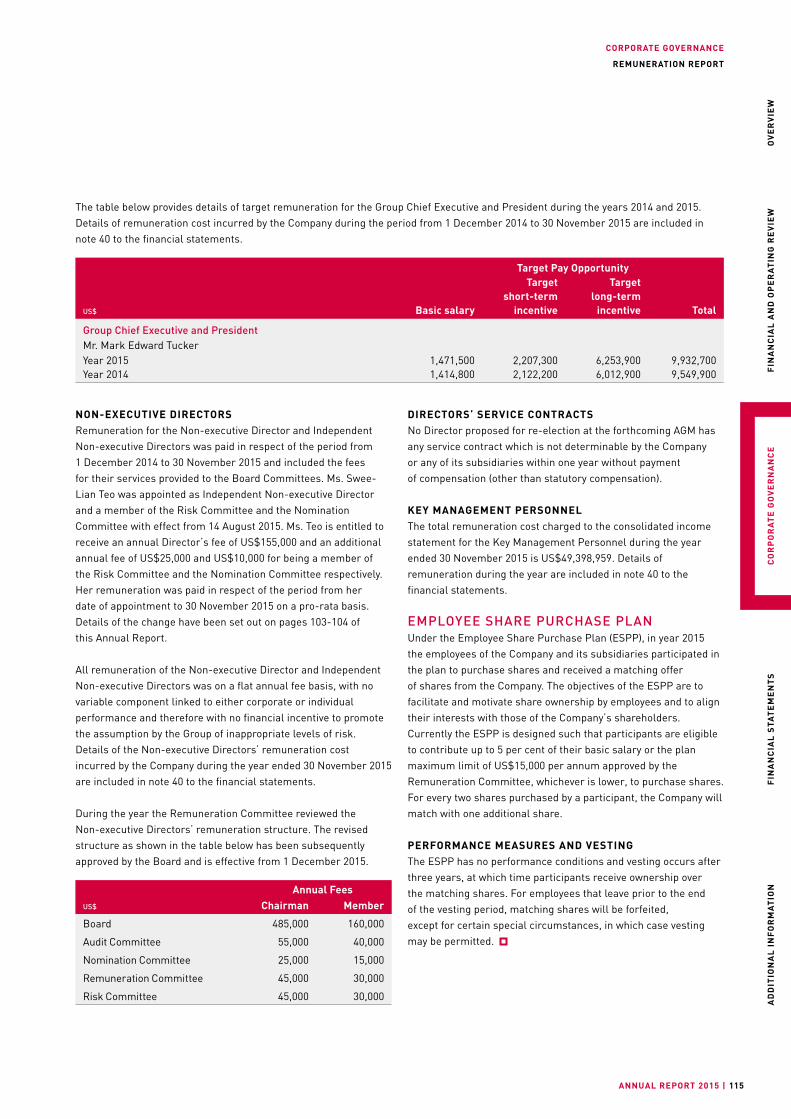
CORPORATE GOVERNANCE
ANNUAL REPORT 2015 | 115
OV
ER
VIE
WF
INA
NC
IAL
AN
D O
PE
RA
TIN
G R
EV
IEW
CO
RP
OR
AT
E G
OV
ER
NA
NC
EF
INA
NC
IAL
STA
TE
ME
NT
SA
DD
ITIO
NA
L I
NF
OR
MA
TIO
N
REMUNERATION REPORT
DIRECTORS’ SERVICE CONTRACTS No Director proposed for re-election at the forthcoming AGM has any service contract which is not determinable by the Company or any of its subsidiaries within one year without payment of compensation (other than statutory compensation).
KEY MANAGEMENT PERSONNELThe total remuneration cost charged to the consolidated income statement for the Key Management Personnel during the year ended 30 November 2015 is US$49,398,959. Details of remuneration during the year are included in note 40 to the financial statements.
EMPLOYEE SHARE PURCHASE PLANUnder the Employee Share Purchase Plan (ESPP), in year 2015 the employees of the Company and its subsidiaries participated in the plan to purchase shares and received a matching offer of shares from the Company. The objectives of the ESPP are to facilitate and motivate share ownership by employees and to align their interests with those of the Company’s shareholders. Currently the ESPP is designed such that participants are eligible to contribute up to 5 per cent of their basic salary or the plan maximum limit of US$15,000 per annum approved by the Remuneration Committee, whichever is lower, to purchase shares. For every two shares purchased by a participant, the Company will match with one additional share.
PERFORMANCE MEASURES AND VESTINGThe ESPP has no performance conditions and vesting occurs after three years, at which time participants receive ownership over the matching shares. For employees that leave prior to the end of the vesting period, matching shares will be forfeited, except for certain special circumstances, in which case vesting may be permitted.
The table below provides details of target remuneration for the Group Chief Executive and President during the years 2014 and 2015. Details of remuneration cost incurred by the Company during the period from 1 December 2014 to 30 November 2015 are included in note 40 to the financial statements.
Target Pay Opportunity
US$ Basic salary
Targetshort-term
incentive
Targetlong-term
incentive Total
Group Chief Executive and PresidentMr. Mark Edward TuckerYear 2015 1,471,500 2,207,300 6,253,900 9,932,700Year 2014 1,414,800 2,122,200 6,012,900 9,549,900
NON-EXECUTIVE DIRECTORS Remuneration for the Non-executive Director and Independent Non-executive Directors was paid in respect of the period from 1 December 2014 to 30 November 2015 and included the fees for their services provided to the Board Committees. Ms. Swee-Lian Teo was appointed as Independent Non-executive Director and a member of the Risk Committee and the Nomination Committee with effect from 14 August 2015. Ms. Teo is entitled to receive an annual Director’s fee of US$155,000 and an additional annual fee of US$25,000 and US$10,000 for being a member of the Risk Committee and the Nomination Committee respectively. Her remuneration was paid in respect of the period from her date of appointment to 30 November 2015 on a pro-rata basis. Details of the change have been set out on pages 103-104 of this Annual Report.
All remuneration of the Non-executive Director and Independent Non-executive Directors was on a flat annual fee basis, with no variable component linked to either corporate or individual performance and therefore with no financial incentive to promote the assumption by the Group of inappropriate levels of risk. Details of the Non-executive Directors’ remuneration cost incurred by the Company during the year ended 30 November 2015 are included in note 40 to the financial statements.
During the year the Remuneration Committee reviewed the Non-executive Directors’ remuneration structure. The revised structure as shown in the table below has been subsequently approved by the Board and is effective from 1 December 2015.
Annual FeesUS$ Chairman Member
Board 485,000 160,000
Audit Committee 55,000 40,000
Nomination Committee 25,000 15,000
Remuneration Committee 45,000 30,000
Risk Committee 45,000 30,000
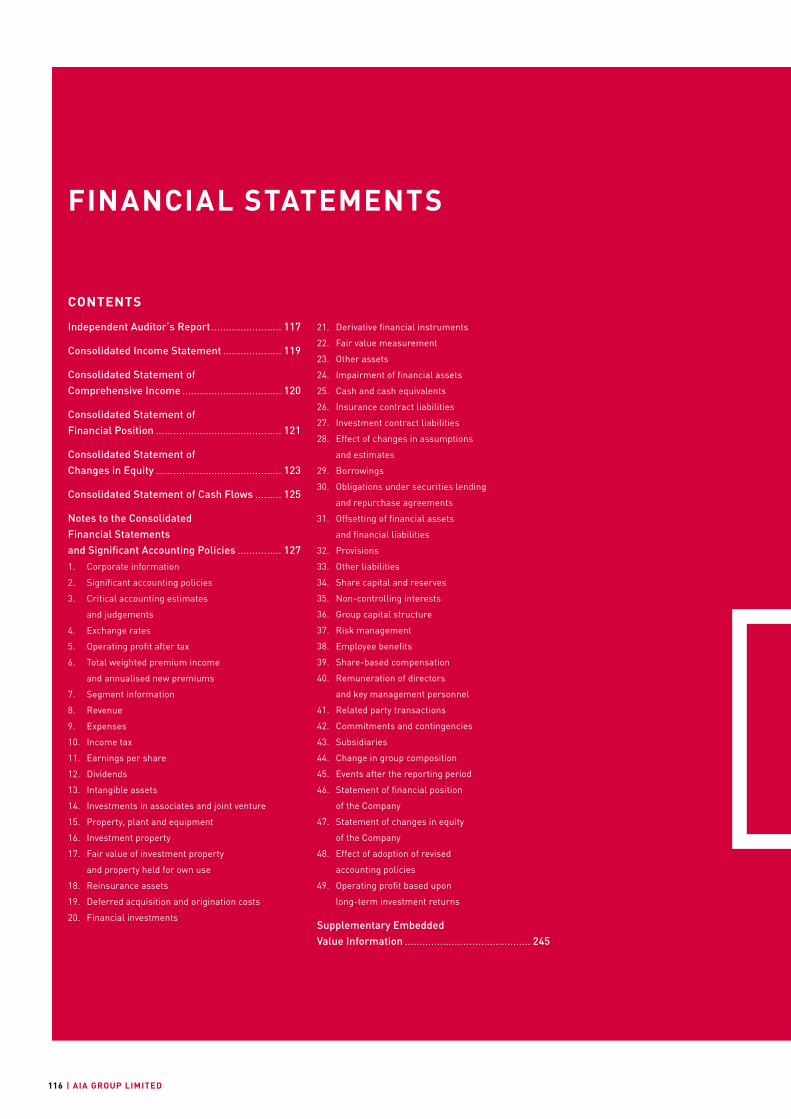
| AIA GROUP LIMITED116
CONTENTS
Independent Auditor’s Report ........................ 117
Consolidated Income Statement .................... 119
Consolidated Statement of Comprehensive Income .................................. 120
Consolidated Statement of Financial Position ........................................... 121
Consolidated Statement of Changes in Equity ........................................... 123
Consolidated Statement of Cash Flows ......... 125
Notes to the Consolidated Financial Statements and Significant Accounting Policies ............... 1271. Corporate information
2. Significant accounting policies
3. Critical accounting estimates
and judgements
4. Exchange rates
5. Operating profit after tax
6. Total weighted premium income
and annualised new premiums
7. Segment information
8. Revenue
9. Expenses
10. Income tax
11. Earnings per share
12. Dividends
13. Intangible assets
14. Investments in associates and joint venture
15. Property, plant and equipment
16. Investment property
17. Fair value of investment property
and property held for own use
18. Reinsurance assets
19. Deferred acquisition and origination costs
20. Financial investments
21. Derivative financial instruments
22. Fair value measurement
23. Other assets
24. Impairment of financial assets
25. Cash and cash equivalents
26. Insurance contract liabilities
27. Investment contract liabilities
28. Effect of changes in assumptions
and estimates
29. Borrowings
30. Obligations under securities lending
and repurchase agreements
31. Offsetting of financial assets
and financial liabilities
32. Provisions
33. Other liabilities
34. Share capital and reserves
35. Non-controlling interests
36. Group capital structure
37. Risk management
38. Employee benefits
39. Share-based compensation
40. Remuneration of directors
and key management personnel
41. Related party transactions
42. Commitments and contingencies
43. Subsidiaries
44. Change in group composition
45. Events after the reporting period
46. Statement of financial position
of the Company
47. Statement of changes in equity
of the Company
48. Effect of adoption of revised
accounting policies
49. Operating profit based upon
long-term investment returns
Supplementary Embedded Value Information ........................................... 245
FINANCIAL STATEMENTS
FINANCIAL STATEMENTS
ANNUAL REPORT 2015 | 117
INDEPENDENT AUDITOR’S REPORT
OV
ER
VIE
WF
INA
NC
IAL
AN
D O
PE
RA
TIN
G R
EV
IEW
CO
RP
OR
AT
E G
OV
ER
NA
NC
EF
INA
NC
IAL
ST
AT
EM
EN
TS
AD
DIT
ION
AL
IN
FO
RM
AT
ION
TO THE SHAREHOLDERS OF AIA GROUP LIMITED(incorporated in Hong Kong with limited liability)
We have audited the consolidated financial statements of AIA Group Limited (the “Company”) and
its subsidiaries set out on pages 119 to 244, which comprise the consolidated statement of financial
position as at 30 November 2015, and the consolidated income statement, the consolidated statement of
comprehensive income, the consolidated statement of changes in equity and the consolidated statement of
cash flows for the year then ended, and a summary of significant accounting policies and other explanatory
information.
Directors’ responsibility for the consolidated financial statementsThe directors of the Company are responsible for the preparation of consolidated financial statements that
give a true and fair view in accordance with Hong Kong Financial Reporting Standards issued by the Hong
Kong Institute of Certified Public Accountants (HKICPA), and with the International Financial Reporting
Standards issued by the International Accounting Standards Board (IASB) and the Hong Kong Companies
Ordinance, and for such internal control as the directors determine is necessary to enable the preparation
of consolidated financial statements that are free from material misstatement, whether due to fraud or
error.
Auditor’s responsibilityOur responsibility is to express an opinion on these consolidated financial statements based on our
audit and to report our opinion solely to you, as a body, in accordance with section 405 of the Hong Kong
Companies Ordinance and for no other purpose. We do not assume responsibility towards or accept liability
to any other person for the contents of this report.
We conducted our audit in accordance with Hong Kong Standards on Auditing issued by the HKICPA.
Those standards require that we comply with ethical requirements and plan and perform the audit to
obtain reasonable assurance about whether the consolidated financial statements are free from material
misstatement.
FINANCIAL STATEMENTS
| AIA GROUP LIMITED118
INDEPENDENT AUDITOR’S REPORT
Auditor’s responsibility (continued)
An audit involves performing procedures to obtain audit evidence about the amounts and disclosures
in the consolidated financial statements. The procedures selected depend on the auditor’s judgement,
including the assessment of the risks of material misstatement of the consolidated financial statements,
whether due to fraud or error. In making those risk assessments, the auditor considers internal control
relevant to the entity’s preparation of consolidated financial statements that give a true and fair view in
order to design audit procedures that are appropriate in the circumstances, but not for the purpose of
expressing an opinion on the effectiveness of the entity’s internal control. An audit also includes evaluating
the appropriateness of accounting policies used and the reasonableness of accounting estimates made
by the directors, as well as evaluating the overall presentation of the consolidated financial statements.
We believe that the audit evidence we have obtained is sufficient and appropriate to provide a basis for our
audit opinion.
OpinionIn our opinion, the consolidated financial statements give a true and fair view of the financial position of
the Company and its subsidiaries as at 30 November 2015 and of their financial performance and cash
flows for the year then ended in accordance with both Hong Kong Financial Reporting Standards and with
International Financial Reporting Standards and have been properly prepared in compliance with the Hong
Kong Companies Ordinance.
PricewaterhouseCoopers
Certified Public Accountants
Hong Kong
25 February 2016
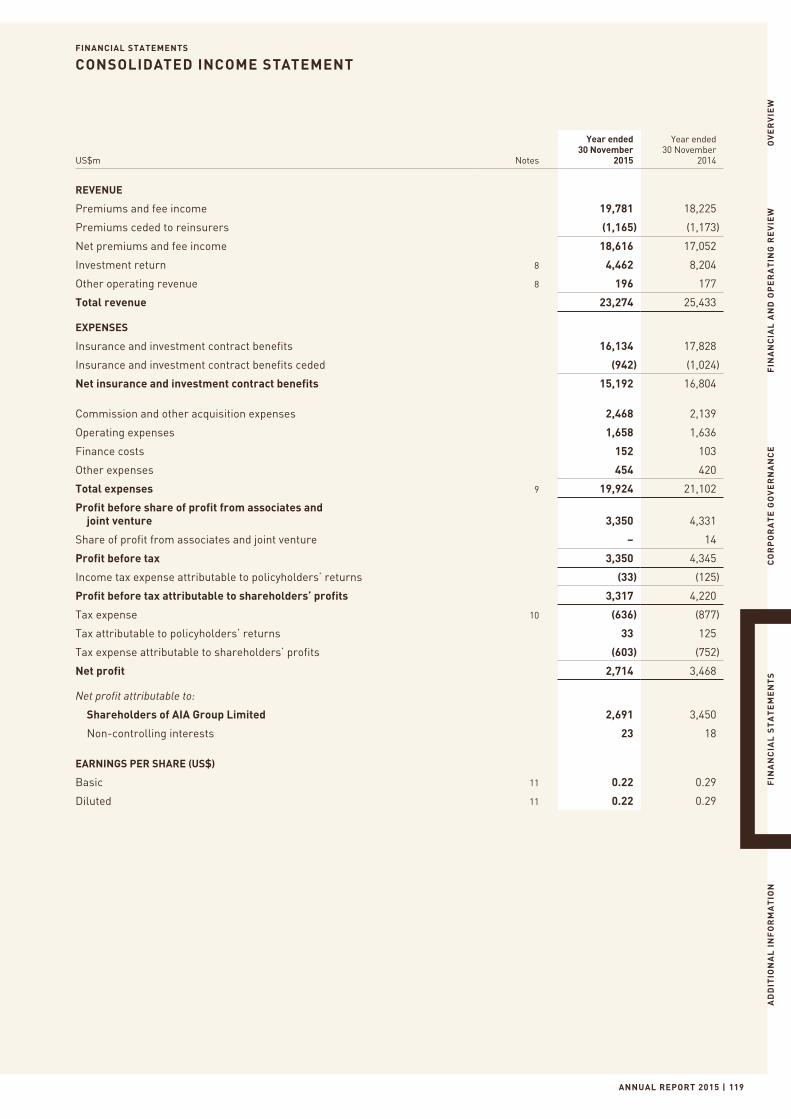
FINANCIAL STATEMENTS
ANNUAL REPORT 2015 | 119
CONSOLIDATED INCOME STATEMENT
OV
ER
VIE
WF
INA
NC
IAL
AN
D O
PE
RA
TIN
G R
EV
IEW
CO
RP
OR
AT
E G
OV
ER
NA
NC
EF
INA
NC
IAL
ST
AT
EM
EN
TS
AD
DIT
ION
AL
IN
FO
RM
AT
ION
US$m Notes
Year ended30 November
2015
Year ended30 November
2014
REVENUE
Premiums and fee income 19,781 18,225
Premiums ceded to reinsurers (1,165) (1,173)
Net premiums and fee income 18,616 17,052
Investment return 8 4,462 8,204
Other operating revenue 8 196 177
Total revenue 23,274 25,433
EXPENSES
Insurance and investment contract benefits 16,134 17,828
Insurance and investment contract benefits ceded (942) (1,024)
Net insurance and investment contract benefits 15,192 16,804
Commission and other acquisition expenses 2,468 2,139
Operating expenses 1,658 1,636
Finance costs 152 103
Other expenses 454 420
Total expenses 9 19,924 21,102
Profit before share of profit from associates and joint venture 3,350 4,331
Share of profit from associates and joint venture – 14
Profit before tax 3,350 4,345
Income tax expense attributable to policyholders’ returns (33) (125)
Profit before tax attributable to shareholders’ profits 3,317 4,220
Tax expense 10 (636) (877)
Tax attributable to policyholders’ returns 33 125
Tax expense attributable to shareholders’ profits (603) (752)
Net profit 2,714 3,468
Net profit attributable to:
Shareholders of AIA Group Limited 2,691 3,450
Non-controlling interests 23 18
EARNINGS PER SHARE (US$)
Basic 11 0.22 0.29
Diluted 11 0.22 0.29
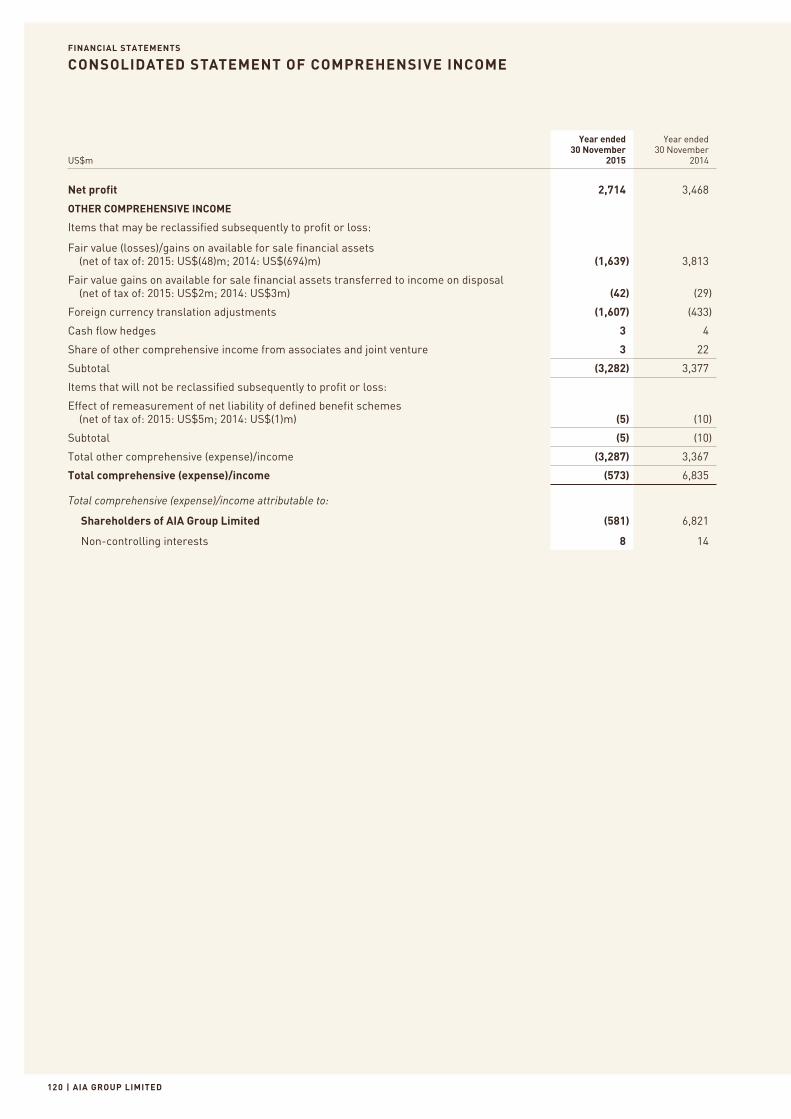
FINANCIAL STATEMENTS
| AIA GROUP LIMITED120
CONSOLIDATED STATEMENT OF COMPREHENSIVE INCOME
US$m
Year ended30 November
2015
Year ended30 November
2014
Net profit 2,714 3,468
OTHER COMPREHENSIVE INCOME
Items that may be reclassified subsequently to profit or loss:
Fair value (losses)/gains on available for sale financial assets (net of tax of: 2015: US$(48)m; 2014: US$(694)m) (1,639) 3,813
Fair value gains on available for sale financial assets transferred to income on disposal (net of tax of: 2015: US$2m; 2014: US$3m) (42) (29)
Foreign currency translation adjustments (1,607) (433)
Cash flow hedges 3 4
Share of other comprehensive income from associates and joint venture 3 22
Subtotal (3,282) 3,377
Items that will not be reclassified subsequently to profit or loss:
Effect of remeasurement of net liability of defined benefit schemes (net of tax of: 2015: US$5m; 2014: US$(1)m) (5) (10)
Subtotal (5) (10)
Total other comprehensive (expense)/income (3,287) 3,367
Total comprehensive (expense)/income (573) 6,835
Total comprehensive (expense)/income attributable to:
Shareholders of AIA Group Limited (581) 6,821
Non-controlling interests 8 14
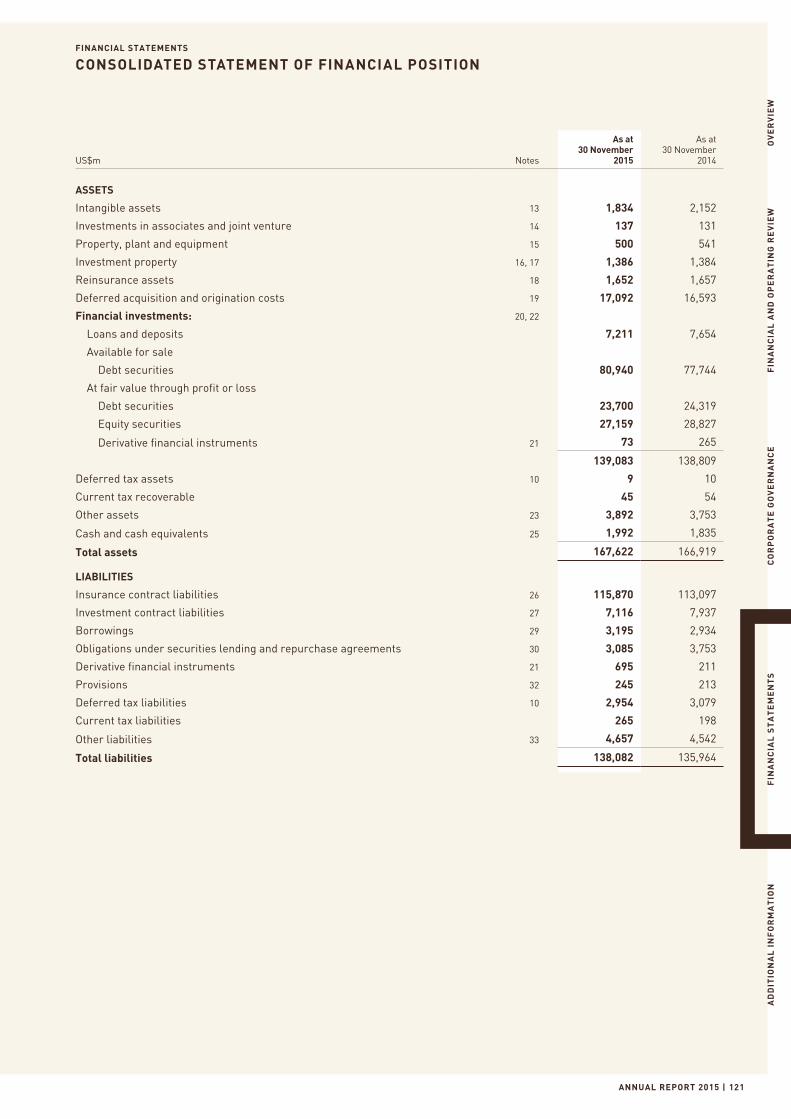
FINANCIAL STATEMENTS
ANNUAL REPORT 2015 | 121
CONSOLIDATED STATEMENT OF FINANCIAL POSITION
OV
ER
VIE
WF
INA
NC
IAL
AN
D O
PE
RA
TIN
G R
EV
IEW
CO
RP
OR
AT
E G
OV
ER
NA
NC
EF
INA
NC
IAL
ST
AT
EM
EN
TS
AD
DIT
ION
AL
IN
FO
RM
AT
ION
US$m Notes
As at30 November
2015
As at30 November
2014
ASSETS
Intangible assets 13 1,834 2,152
Investments in associates and joint venture 14 137 131
Property, plant and equipment 15 500 541
Investment property 16, 17 1,386 1,384
Reinsurance assets 18 1,652 1,657
Deferred acquisition and origination costs 19 17,092 16,593
Financial investments: 20, 22
Loans and deposits 7,211 7,654
Available for sale
Debt securities 80,940 77,744
At fair value through profit or loss
Debt securities 23,700 24,319
Equity securities 27,159 28,827
Derivative financial instruments 21 73 265
139,083 138,809
Deferred tax assets 10 9 10
Current tax recoverable 45 54
Other assets 23 3,892 3,753
Cash and cash equivalents 25 1,992 1,835
Total assets 167,622 166,919
LIABILITIES
Insurance contract liabilities 26 115,870 113,097
Investment contract liabilities 27 7,116 7,937
Borrowings 29 3,195 2,934
Obligations under securities lending and repurchase agreements 30 3,085 3,753
Derivative financial instruments 21 695 211
Provisions 32 245 213
Deferred tax liabilities 10 2,954 3,079
Current tax liabilities 265 198
Other liabilities 33 4,657 4,542
Total liabilities 138,082 135,964
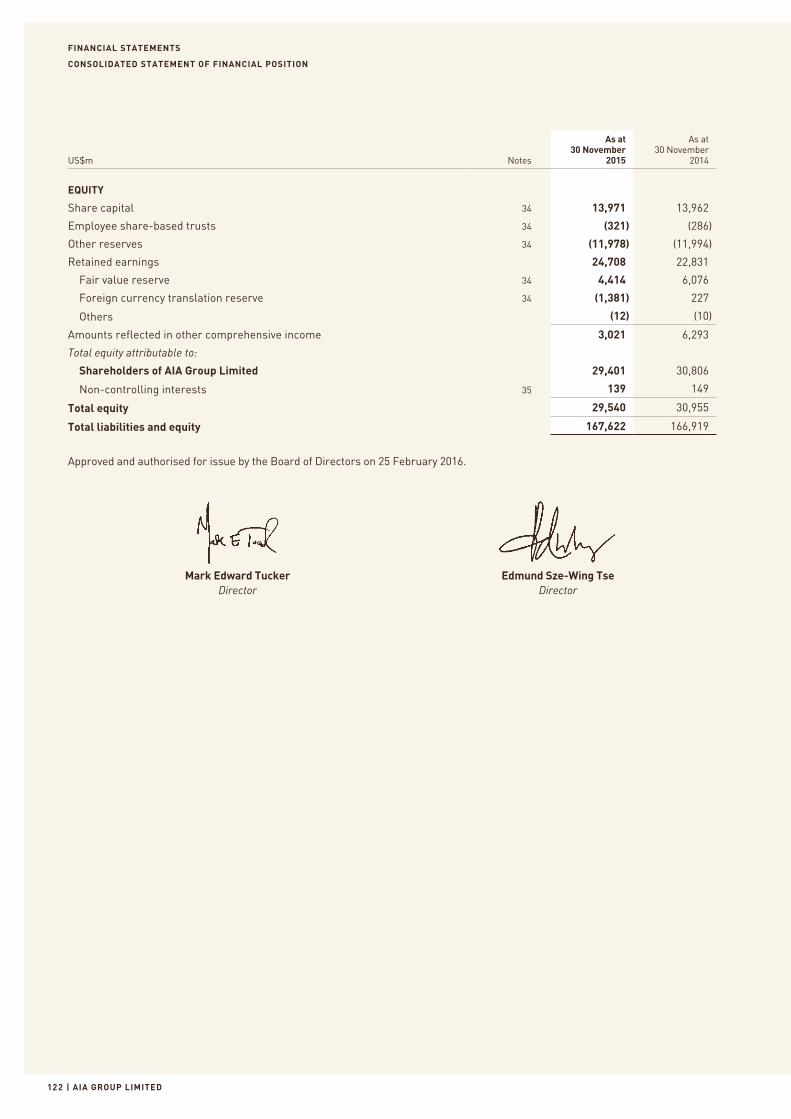
FINANCIAL STATEMENTS
| AIA GROUP LIMITED122
CONSOLIDATED STATEMENT OF FINANCIAL POSITION
US$m Notes
As at30 November
2015
As at30 November
2014
EQUITY
Share capital 34 13,971 13,962
Employee share-based trusts 34 (321) (286)
Other reserves 34 (11,978) (11,994)
Retained earnings 24,708 22,831
Fair value reserve 34 4,414 6,076
Foreign currency translation reserve 34 (1,381) 227
Others (12) (10)
Amounts reflected in other comprehensive income 3,021 6,293
Total equity attributable to:
Shareholders of AIA Group Limited 29,401 30,806
Non-controlling interests 35 139 149
Total equity 29,540 30,955
Total liabilities and equity 167,622 166,919
Approved and authorised for issue by the Board of Directors on 25 February 2016.
Mark Edward Tucker Edmund Sze-Wing Tse Director Director
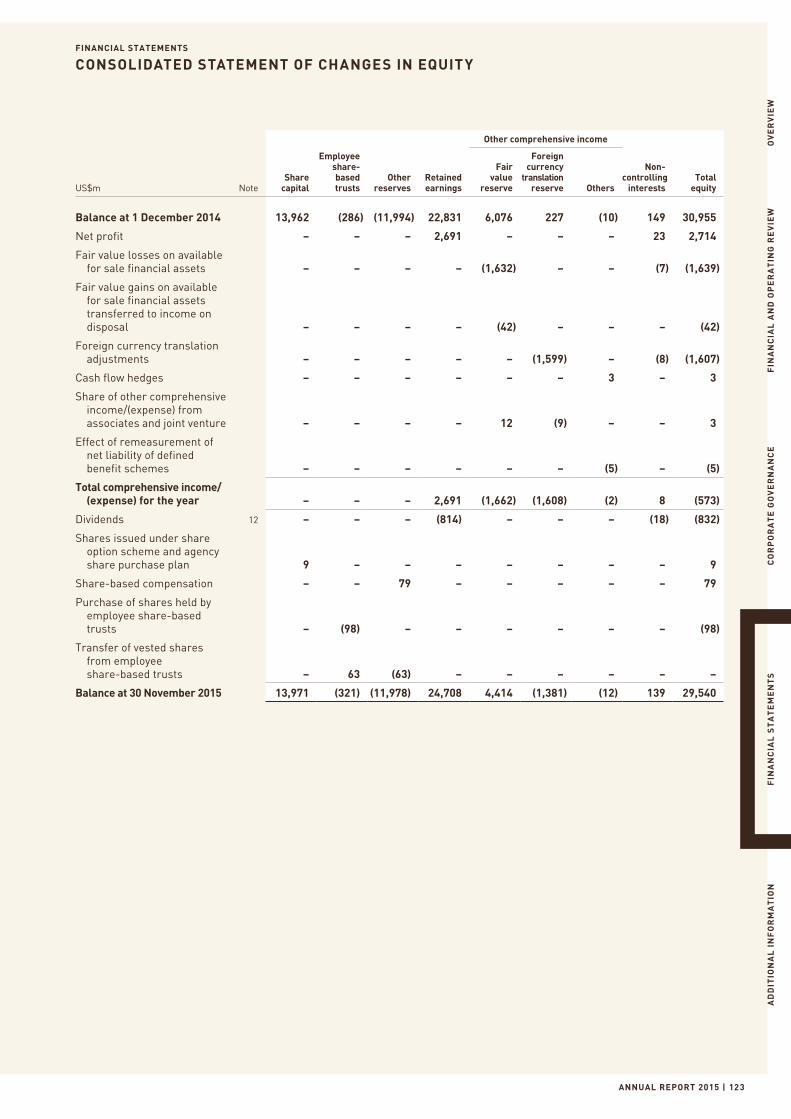
FINANCIAL STATEMENTS
ANNUAL REPORT 2015 | 123
CONSOLIDATED STATEMENT OF CHANGES IN EQUIT Y
OV
ER
VIE
WF
INA
NC
IAL
AN
D O
PE
RA
TIN
G R
EV
IEW
CO
RP
OR
AT
E G
OV
ER
NA
NC
EF
INA
NC
IAL
ST
AT
EM
EN
TS
AD
DIT
ION
AL
IN
FO
RM
AT
ION
Other comprehensive income
US$m NoteShare
capital
Employee share-based trusts
Other reserves
Retained earnings
Fair value
reserve
Foreign currency
translation reserve Others
Non-controlling
interestsTotal
equity
Balance at 1 December 2014 13,962 (286) (11,994) 22,831 6,076 227 (10) 149 30,955
Net profit – – – 2,691 – – – 23 2,714
Fair value losses on available for sale financial assets – – – – (1,632) – – (7) (1,639)
Fair value gains on available for sale financial assets transferred to income on disposal – – – – (42) – – – (42)
Foreign currency translation adjustments – – – – – (1,599) – (8) (1,607)
Cash flow hedges – – – – – – 3 – 3
Share of other comprehensive income/(expense) from associates and joint venture – – – – 12 (9) – – 3
Effect of remeasurement of net liability of defined benefit schemes – – – – – – (5) – (5)
Total comprehensive income/ (expense) for the year – – – 2,691 (1,662) (1,608) (2) 8 (573)
Dividends 12 – – – (814) – – – (18) (832)
Shares issued under share option scheme and agency share purchase plan 9 – – – – – – – 9
Share-based compensation – – 79 – – – – – 79
Purchase of shares held by employee share-based trusts – (98) – – – – – – (98)
Transfer of vested shares from employee share-based trusts – 63 (63) – – – – – –
Balance at 30 November 2015 13,971 (321) (11,978) 24,708 4,414 (1,381) (12) 139 29,540
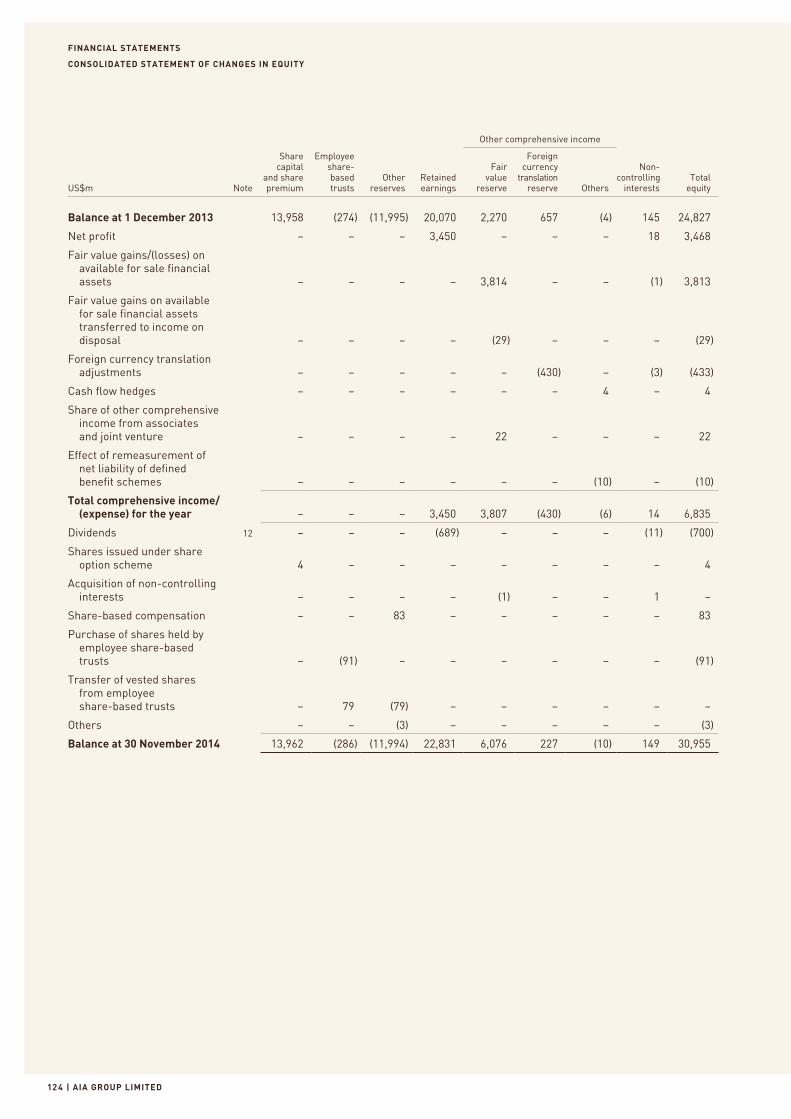
FINANCIAL STATEMENTS
| AIA GROUP LIMITED12 4
CONSOLIDATED STATEMENT OF CHANGES IN EQUITY
Other comprehensive income
US$m Note
Share capital
and sharepremium
Employee share-based trusts
Other reserves
Retained earnings
Fair value
reserve
Foreign currency
translation reserve Others
Non-controlling
interestsTotal
equity
Balance at 1 December 2013 13,958 (274) (11,995) 20,070 2,270 657 (4) 145 24,827
Net profit – – – 3,450 – – – 18 3,468
Fair value gains/(losses) on available for sale financial assets – – – – 3,814 – – (1) 3,813
Fair value gains on available for sale financial assets transferred to income on disposal – – – – (29) – – – (29)
Foreign currency translation adjustments – – – – – (430) – (3) (433)
Cash flow hedges – – – – – – 4 – 4
Share of other comprehensive income from associates and joint venture – – – – 22 – – – 22
Effect of remeasurement of net liability of defined benefit schemes – – – – – – (10) – (10)
Total comprehensive income/ (expense) for the year – – – 3,450 3,807 (430) (6) 14 6,835
Dividends 12 – – – (689) – – – (11) (700)
Shares issued under share option scheme 4 – – – – – – – 4
Acquisition of non-controlling interests – – – – (1) – – 1 –
Share-based compensation – – 83 – – – – – 83
Purchase of shares held by employee share-based trusts – (91) – – – – – – (91)
Transfer of vested shares from employee share-based trusts – 79 (79) – – – – – –
Others – – (3) – – – – – (3)
Balance at 30 November 2014 13,962 (286) (11,994) 22,831 6,076 227 (10) 149 30,955
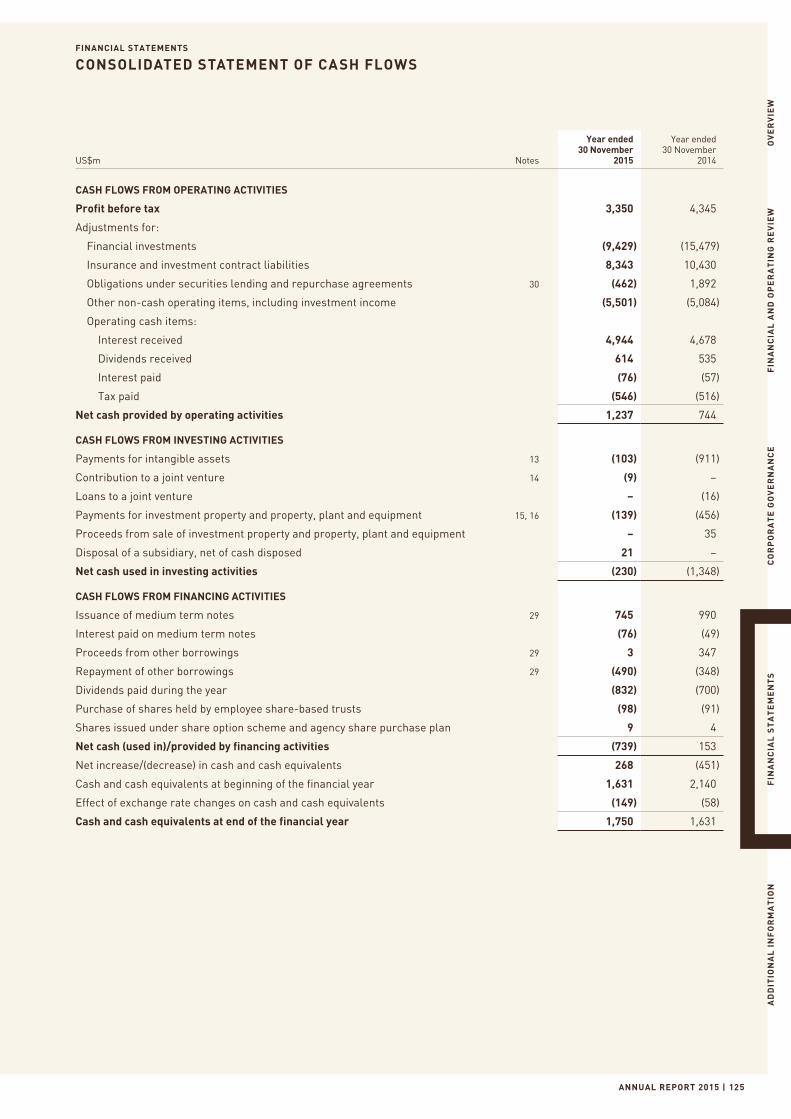
FINANCIAL STATEMENTS
ANNUAL REPORT 2015 | 125
CONSOLIDATED STATEMENT OF CASH FLOWS
OV
ER
VIE
WF
INA
NC
IAL
AN
D O
PE
RA
TIN
G R
EV
IEW
CO
RP
OR
AT
E G
OV
ER
NA
NC
EF
INA
NC
IAL
ST
AT
EM
EN
TS
AD
DIT
ION
AL
IN
FO
RM
AT
ION
US$m Notes
Year ended30 November
2015
Year ended30 November
2014
CASH FLOWS FROM OPERATING ACTIVITIES
Profit before tax 3,350 4,345
Adjustments for:
Financial investments (9,429) (15,479)
Insurance and investment contract liabilities 8,343 10,430
Obligations under securities lending and repurchase agreements 30 (462) 1,892
Other non-cash operating items, including investment income (5,501) (5,084)
Operating cash items:
Interest received 4,944 4,678
Dividends received 614 535
Interest paid (76) (57)
Tax paid (546) (516)
Net cash provided by operating activities 1,237 744
CASH FLOWS FROM INVESTING ACTIVITIES
Payments for intangible assets 13 (103) (911)
Contribution to a joint venture 14 (9) –
Loans to a joint venture – (16)
Payments for investment property and property, plant and equipment 15, 16 (139) (456)
Proceeds from sale of investment property and property, plant and equipment – 35
Disposal of a subsidiary, net of cash disposed 21 –
Net cash used in investing activities (230) (1,348)
CASH FLOWS FROM FINANCING ACTIVITIES
Issuance of medium term notes 29 745 990
Interest paid on medium term notes (76) (49)
Proceeds from other borrowings 29 3 347
Repayment of other borrowings 29 (490) (348)
Dividends paid during the year (832) (700)
Purchase of shares held by employee share-based trusts (98) (91)
Shares issued under share option scheme and agency share purchase plan 9 4
Net cash (used in)/provided by financing activities (739) 153
Net increase/(decrease) in cash and cash equivalents 268 (451)
Cash and cash equivalents at beginning of the financial year 1,631 2,140
Effect of exchange rate changes on cash and cash equivalents (149) (58)
Cash and cash equivalents at end of the financial year 1,750 1,631

FINANCIAL STATEMENTS
| AIA GROUP LIMITED126
CONSOLIDATED STATEMENT OF CASH FLOWS
Cash and cash equivalents in the above consolidated statement of cash flows can be further analysed as follows:
Notes
Year ended30 November
2015
Year ended30 November
2014
Cash and cash equivalents in the consolidated statement of financial position 25 1,992 1,835
Bank overdrafts (242) (204)
CASH AND CASH EQUIVALENTS IN THE CONSOLIDATED STATEMENT OF CASH FLOWS 1,750 1,631
FINANCIAL STATEMENTS
ANNUAL REPORT 2015 | 127
NOTES TO THE CONSOLIDATED FINANCIAL STATEMENTS ANDSIGNIFICANT ACCOUNTING POLICIES
OV
ER
VIE
WF
INA
NC
IAL
AN
D O
PE
RA
TIN
G R
EV
IEW
CO
RP
OR
AT
E G
OV
ER
NA
NC
EF
INA
NC
IAL
ST
AT
EM
EN
TS
AD
DIT
ION
AL
IN
FO
RM
AT
ION
1. CORPORATE INFORMATIONAIA Group Limited (the “Company”) was established as a company with limited liability incorporated in Hong Kong on 24 August 2009.
The address of its registered office is 35/F, AIA Central, No. 1 Connaught Road Central, Hong Kong.
AIA Group Limited is listed on the Main Board of The Stock Exchange of Hong Kong Limited under the stock code “1299” with American
Depositary Receipts (Level 1) being traded on the over-the-counter market (ticker symbol: “AAGIY”).
AIA Group Limited and its subsidiaries (collectively “AIA” or the “Group”) is a life insurance based financial services provider operating
in 18 markets throughout the Asia-Pacific region. The Group’s principal activity is the writing of life insurance business, providing life
insurance, accident and health insurance and savings plans throughout Asia, and distributing related investment and other financial
services products to its customers.
2. SIGNIFICANT ACCOUNTING POLICIES2.1 Basis of preparation and statement of complianceThe consolidated financial statements have been prepared in accordance with all applicable Hong Kong Financial Reporting Standards
(HKFRS), International Financial Reporting Standards (IFRS) and the Hong Kong Companies Ordinance. IFRS is substantially consistent
with HKFRS and the accounting policy selections that the Group has made in preparing these consolidated financial statements are
such that the Group is able to comply with both HKFRS and IFRS. References to IFRS, International Accounting Standards (IAS) and
Interpretations developed by the IFRS Interpretations Committee (IFRS IC) in these consolidated financial statements should be read
as referring to the equivalent HKFRS, Hong Kong Accounting Standards (HKAS) and Hong Kong (IFRIC) Interpretations (HK(IFRIC) –
Int) as the case may be. Accordingly, there are not any differences of accounting practice between HKFRS and IFRS affecting these
consolidated financial statements.
The consolidated financial statements have been approved for issue by the Board of Directors on 25 February 2016.
The consolidated financial statements have been prepared using the historical cost convention, as modified by the revaluation of
available for sale financial assets, certain financial assets and liabilities designated at fair value through profit or loss and derivative
financial instruments, all of which are carried at fair value.
Items included in the consolidated financial statements of each of the Group’s entities are measured in the currency of the primary
economic environment in which that entity operates (the functional currency). The Company’s functional currency and the presentation
currency of the Company and the Group is the US dollar. The consolidated financial statements are presented in millions of US dollars
(US$m) unless otherwise stated.
The accounting policies adopted are consistent with those of the previous financial year, except as described below.
(a) The following relevant new interpretation, amendments to standards and implementation of new Hong Kong Companies Ordinance
(Cap. 622) are mandatory for the first time for the financial year beginning 1 December 2014 and do not have material impact to
the Group:
• IFRIC 21, Levies;
• Amendment to IAS 24, Related Parties Disclosures, Key management personnel;
• Amendments to IAS 32, Financial Instruments: Presentation on offsetting financial assets and financial liabilities;
• Amendment to IAS 40, Investment Property, Clarifying the interrelationship between IFRS 3 and IAS 40 when classifying
property as investment property or owner-occupied property;
• Amendment to IFRS 2, Share-based Payment, Definition of vesting condition;
• Amendment to IFRS 3, Business Combinations, Accounting for contingent consideration in a business combination;
• Amendments to IFRS 8, Operating Segments, Aggregation of operating segments and Reconciliation of the total of the
reportable segments’ assets to the entity’s assets; and
• The annual report requirements of Part 9 ‘Accounts and Audit’ of the new Hong Kong Companies Ordinance (Cap. 622) come
into operation during the financial year beginning 1 December 2014, as a result, there are changes to presentation and
disclosures of certain information in the consolidated financial statements.
FINANCIAL STATEMENTS
| AIA GROUP LIMITED128
NOTES TO THE CONSOLIDATED FINANCIAL STATEMENTS AND SIGNIFICANT ACCOUNTING POLICIES
2. SIGNIFICANT ACCOUNTING POLICIES (continued)
2.1 Basis of preparation and statement of compliance (continued)
(b) The following relevant new standards and amendments to standards have been issued but are not effective for the financial year
ended 30 November 2015 and have not been early adopted (the financial years for which the adoption is required for the Group
are stated in parentheses). The Group has assessed the full impact of these new standards on its financial position and results of
operations and they are not expected to have a material impact on the financial position or results of operations of the Group but
may require additional disclosures:
• Amendments to IAS 1, Disclosure Initiative (2017);
• Amendments to IAS 12, Recognition of Deferred Tax Assets for Unrealised Losses (2018);
• Amendments to IAS 16 and IAS 38, Clarification of Acceptable Methods of Depreciation and Amortisation (2017);
• Amendments to IAS 19, Employee Benefits, Discount rate: regional market issue (2017);
• Amendments to IAS 27, Equity Method in Separate Financial Statements (2017);
• Amendments to IAS 34, Interim Financial Reporting, Disclosure of information ‘elsewhere in the interim financial report’
(2017);
• Amendments to IFRS 5, Non-current Assets Held for Sale and Discontinued Operations, Changes in methods of disposal
(2017);
• Amendments to IFRS 7, Financial Instruments: Disclosure, Servicing contracts and applicability of the amendments to IFRS 7
to condensed interim financial statements (2017);
• Amendments to IFRS 11, Acquisitions of Interests in Joint Operations (2017);
• IFRS 15, Revenue from Contracts with Customers (2019); and
• Amendments to IAS 7, Disclosure Initiative (2018).
(c) The following relevant new standard and requirements have been issued but are not effective for the financial year ended 30
November 2015 and have not been early adopted:
• IFRS 9, Financial Instruments, addresses the classification, measurement and recognition of financial assets and financial
liabilities. IFRS 9 requires financial assets to be classified into two measurement categories: those measured as at fair value
and those measured at amortised cost. The determination is made at initial recognition. The classification depends on the
entity’s business model for managing its financial instruments and the contractual cash flow characteristics of the instrument.
In addition, a revised expected credit losses model will replace the incurred loss impairment model in IAS 39. For financial
liabilities, the standard retains most of the IAS 39 requirements. The main change is that, in cases where the fair value
option is taken for financial liabilities, part of the fair value change due to an entity’s own credit risk is recorded in other
comprehensive income rather than profit or loss, unless this creates an accounting mismatch. In addition, the new standard
revises the hedge accounting model to more closely align with the entity’s risk management strategies. The Group is yet to
fully assess the impact of the standard on its financial position and results of operations. The standard is mandatorily effective
for annual periods beginning on or after 1 January 2018.
The IASB has published an exposure draft on 9 December 2015 seeking public comment on two alternative measures to
address the different effective dates of IFRS 9 and the forthcoming insurance contracts standard. These measures include a
temporary option for companies predominantly issue insurance contracts to defer the effective date of IFRS 9 until the earlier
of the effective date of the forthcoming insurance contracts standard and the annual reporting periods beginning on or after
1 January 2021, as well as an approach that allows an entity to remove from profit or loss the effects of certain accounting
mismatches that may occur before the forthcoming insurance contracts standard is applied. The Group will monitor the
development of this matter and evaluate available alternatives in determining the adoption date of the relevant standard.
ANNUAL REPORT 2015 | 129
OV
ER
VIE
WF
INA
NC
IAL
AN
D O
PE
RA
TIN
G R
EV
IEW
CO
RP
OR
AT
E G
OV
ER
NA
NC
EF
INA
NC
IAL
ST
AT
EM
EN
TS
AD
DIT
ION
AL
IN
FO
RM
AT
ION
2. SIGNIFICANT ACCOUNTING POLICIES (continued)
2.1 Basis of preparation and statement of compliance (continued)
(c) The following relevant new standard and requirements have been issued but are not effective for the financial year ended 30
November 2015 and have not been early adopted: (continued)
• IFRS 16, Leases, sets out the principles for the recognition, measurement, presentation and disclosure of leases. The standard
introduces a single lessee accounting model and requires a lessee to recognise assets and liabilities for all leases with a
term of more than 12 months, unless the underlying asset is of low value. A lessee is required to recognise a right-of-use
asset representing its right to use the underlying leased asset and a lease liability representing its obligation to make lease
payments. IFRS 16 substantially carries forward the lessor accounting requirements in IAS 17. Accordingly, a lessor continues
to classify its leases as operating leases or finance leases, and to account for those two types of leases differently. The Group
is yet to assess the full impact of the standard on its financial position and results of operations. The standard is mandatorily
effective for annual periods beginning on or after 1 January 2019.
In addition, for the periods beginning 1 December 2015, the Group revised certain accounting policies and basis of presentation
and assessed the impact to the consolidated financial statements (see note 48 and note 49). The Group will report its results
including these policies for the first time for the six months ending 31 May 2016.
The significant accounting policies adopted in the preparation of the Group’s consolidated financial statements are set out below.
These policies have been applied consistently in all periods presented.
2.2 Operating profitThe long-term nature of much of the Group’s operations means that, for management’s decision-making and internal performance
management purposes, the Group evaluates its results and its operating segments using a financial performance measure referred
to as “operating profit”. The Group defines operating profit before and after tax respectively as profit excluding the following non-
operating items:
• investment experience (which consists of realised gains and losses, foreign exchange gains and losses, impairments and
unrealised gains and losses on investments held at fair value through profit or loss);
• investment income related to unit-linked contracts (consisting of dividends, interest income and rental income);
• investment management expenses related to unit-linked contracts;
• corresponding changes in insurance and investment contract liabilities in respect of unit-linked contracts and participating funds
(see note 2.4) and changes in third-party interests in consolidated investment funds;
• policyholders’ share of tax relating to changes in insurance and investment contract liabilities; and
• other significant items that management considers to be non-operating income and expenses.
Whilst these excluded non-operating items are significant components of the Group’s profit, the Group considers that the presentation
of operating profit enhances the understanding and comparability of its performance and that of its operating segments. The Group
considers that trends can be more clearly identified without the fluctuating effects of these non-operating items, many of which are
largely dependent on market factors.
Operating profit is provided as additional information to assist in the comparison of business trends in different reporting periods on
a consistent basis and enhance overall understanding of financial performance.
FINANCIAL STATEMENTS
| AIA GROUP LIMITED130
NOTES TO THE CONSOLIDATED FINANCIAL STATEMENTS AND SIGNIFICANT ACCOUNTING POLICIES
2. SIGNIFICANT ACCOUNTING POLICIES (continued)
2.3 Basis of consolidationSubsidiaries
Subsidiaries are all entities (including structured entities) over which the Group has control. A structured entity is an entity that
has been designed so that voting or similar rights are not the dominant factor in deciding who controls the entity, such as when any
voting rights relate to administrative tasks only, and the relevant activities are directed by means of contractual arrangements. The
Group has determined that the investment funds and structured securities, such as collateralised debt obligations, mortgage-backed
securities and other asset-backed securities that the Group has interest are structured entities.
The Group controls an entity when the Group is exposed to, or has rights to, variable returns from its involvement with the entity and
has the ability to affect those returns through its power over the entity. Subsidiaries are consolidated from the date on which control is
transferred to the Group and are excluded from consolidation from the date at which the Group no longer has control. Intercompany
transactions are eliminated.
The Group utilises the acquisition method of accounting to account for the acquisition of subsidiaries, unless the acquisition forms part
of the Group reorganisation of entities under common control. Under this method, the cost of an acquisition is measured as the fair
value of consideration payable, shares issued or liabilities assumed at the date of acquisition. The excess of the cost of acquisition over
the fair value of the net assets of the subsidiary acquired is recorded as goodwill (see 2.10 below). The Group recognises, separately
from goodwill, the identifiable assets acquired, the liabilities assumed and any non-controlling interest in the subsidiary. Any surplus
of the acquirer’s interest in the subsidiary’s net assets over the cost of acquisition is credited to the consolidated income statement.
The consolidated financial statements of the Group include the assets, liabilities and results of the Company and subsidiaries in which
AIA Group Limited has a controlling interest, using accounts drawn up to the reporting date.
Investment funds
Investment funds in which the Group has interests and power to direct their relevant activities that affect the return of the funds are
consolidated in the financial statements. In conducting the assessment, the Group considers substantive contractual rights as well
as de facto control. De facto control of an entity may arise from circumstances where the Group does not have more than 50% of the
voting power but it has the practical ability to direct the relevant activities of the entity. If the Group has power to remove or control
over the party having the ability to direct the relevant activities of the fund based on the facts and circumstances and that the Group
has exposure to variable returns of the investment funds, they are consolidated. Variable returns include both rights to the profits or
distributions as well as the obligation to absorb losses of the investees.
Employee share-based trusts
Trusts are set up to acquire shares of the Company for distribution to participants in future periods through the share-based
compensation schemes. The consolidation of these trusts is evaluated in accordance with IFRS 10; where the Group is deemed to
control the trusts, they are consolidated. Shares acquired by the trusts to the extent not provided to the participants upon vesting are
carried at cost and reported as “employee share-based trusts” in the consolidated statement of financial position, and as a deduction
from the equity in the consolidated statement of changes in equity.
Non-controlling interests
Non-controlling interests are presented within equity except when they arise through the minority’s interest in puttable liabilities such
as the unit holders’ interest in consolidated investment funds, when they are recognised as a liability, reflecting the net assets of the
consolidated entity.
Acquisitions and disposals of non-controlling interests, except when they arise through the minority’s interest in puttable liabilities,
are treated as transactions between equity holders. As a result, any difference between the acquisition cost or sale price of the non-
controlling interest and the carrying value of the non-controlling interest is recognised as an increase or decrease in equity.
ANNUAL REPORT 2015 | 131
OV
ER
VIE
WF
INA
NC
IAL
AN
D O
PE
RA
TIN
G R
EV
IEW
CO
RP
OR
AT
E G
OV
ER
NA
NC
EF
INA
NC
IAL
ST
AT
EM
EN
TS
AD
DIT
ION
AL
IN
FO
RM
AT
ION
2. SIGNIFICANT ACCOUNTING POLICIES (continued)
2.3 Basis of consolidation (continued)
Associates and joint ventures
Associates are entities over which the Group has significant influence, but which it does not control. Generally, it is presumed that the
Group has significant influence if it has between 20 per cent and 50 per cent of voting rights. Joint ventures are entities whereby the
Group and other parties undertake an economic activity which is subject to joint control arising from a contractual agreement.
Gains on transactions between the Group and its associates and joint ventures are eliminated to the extent of the Group’s interest in
the associates and joint ventures. Losses are also eliminated, unless the transaction provides evidence of an impairment of an asset
transferred between entities.
Investments in associates and joint ventures are accounted for using the equity method of accounting. Under this method, the cost
of the investment in an associate or joint venture, together with the Group’s share of that entity’s post-acquisition changes to equity,
is included as an asset in the consolidated statement of financial position. Cost includes goodwill arising on acquisition. The Group’s
share of post-acquisition profits or losses is recognised in the consolidated income statement and its share of post-acquisition
movement in equity is recognised in other comprehensive income. Equity accounting is discontinued when the Group no longer has
significant influence over the investment. If the Group’s share of losses in an associate or joint venture equals or exceeds its interest
in the undertaking, additional losses are provided for, and a liability recognised, only to the extent that the Group has incurred legal
or constructive obligations or made payments on behalf of the associate or joint venture. The Group also accounts for investments in
joint ventures that are subject to joint control using the equity method of accounting.
The Company’s investments
In the Company’s statement of financial position, subsidiaries, associates and joint ventures are stated at cost, unless impaired. The
Company’s interests in investment funds such as mutual funds and unit trusts are designated at fair value through profit or loss.
2.4 Insurance and investment contractsConsistent accounting policies for the measurement and recognition of insurance and investment contracts have been adopted
throughout the Group to substantially all of its business.
In a limited number of cases, the Group measures insurance contract liabilities with reference to statutory requirements in the
applicable jurisdiction, without deferral of acquisition costs.
Product classification
The Group classified its contracts written as either insurance contracts or investment contracts, depending on the level of insurance
risk. Insurance contracts are those contracts that transfer significant insurance risk, while investment contracts are those contracts
without significant insurance risk. Some insurance and investment contracts, referred to as participating business, have discretionary
participation features, “DPF”, which may entitle the customer to receive, as a supplement to guaranteed benefits, additional non-
guaranteed benefits, such as policyholder dividends or bonuses. The Group applies the same accounting policies for the recognition
and measurement of obligations arising from investment contracts with DPF as it does for insurance contracts.
In the event that a scenario (other than those lacking commercial substance) exists in which an insured event would require the Group
to pay significant additional benefits to its customers, the contract is accounted for as an insurance contract. For investment contracts
that do not contain DPF, IAS 39, Financial Instruments: Measurement and Recognition, and, if the contract includes an investment
management element, IAS 18, Revenue Recognition, are applied. IFRS 4 permits the continued use of previously applied accounting
policies for insurance contracts and investment contracts with DPF, and this basis has been adopted by the Group in accounting for
such contracts. Once a contract has been classified as an insurance or investment contract, reclassification is not subsequently
performed unless the terms of the agreement are later amended.
FINANCIAL STATEMENTS
| AIA GROUP LIMITED132
NOTES TO THE CONSOLIDATED FINANCIAL STATEMENTS AND SIGNIFICANT ACCOUNTING POLICIES
2. SIGNIFICANT ACCOUNTING POLICIES (continued)
2.4 Insurance and investment contracts (continued)
Product classification (continued)
Certain contracts with DPF supplement the amount of guaranteed benefits due to policyholders. These contracts are distinct from
other insurance and investment contracts as the Group has discretion in the amount and/or timing of the benefits declared, and how
such benefits are allocated between groups of policyholders. Customers may be entitled to receive, as a supplement to guaranteed
benefits, additional benefits or bonuses:
• that are likely to be a significant portion of the total contractual benefits;
• whose amount or timing is contractually at the discretion of the Group; and
• that are contractually based on:
– the performance of a specified pool of contracts or a specified type of contract;
– realised and/or unrealised investment returns on a specified pool of assets held by the issuer; or
– the profit or loss of the Company, fund or other entity that issues the contract.
The Group applies the same accounting policies for the recognition and measurement of obligations and the deferral of acquisition
costs arising from investment contracts with DPF as it does to insurance contracts. The Group refers to such contracts as participating
business. In some jurisdictions participating business is written in a participating fund which is distinct from the other assets of the
Company or branch. The allocation of benefits from the assets held in such participating funds is subject to minimum policyholder
participation mechanisms which are established by regulation. The extent of such policy participation may change over time. The
current policyholder participation in declared dividends for locations with participating funds is set out below:
Country Current policyholder participation
Singapore 90%
Malaysia 90%
China 70%
Australia 80%
Brunei 80%
In some jurisdictions participating business is not written in a distinct fund and the Group refers to this as other participating business.
ANNUAL REPORT 2015 | 133
OV
ER
VIE
WF
INA
NC
IAL
AN
D O
PE
RA
TIN
G R
EV
IEW
CO
RP
OR
AT
E G
OV
ER
NA
NC
EF
INA
NC
IAL
ST
AT
EM
EN
TS
AD
DIT
ION
AL
IN
FO
RM
AT
ION
2. SIGNIFICANT ACCOUNTING POLICIES (continued)
2.4 Insurance and investment contracts (continued)
Product classification (continued)
The Group’s products may be divided into the following main categories:
Basis of accounting for:
Policy type Description of benefits payable Insurance contract liabilitiesInvestment contract liabilities
Traditional participatinglife assurance with DPF
Participating funds Participating products combine protection with a savings element. The basic sum assured, payable on death or maturity, may be enhanced by dividends or bonuses, the aggregate amount of which is determined by the performance of a distinct fund of assets and liabilities
The timing of dividend and bonus declarations is at the discretion of the insurer. Local regulations generally prescribe a minimum proportion of policyholder participation in declared dividends
Insurance contract liabilities make provision for the present value of guaranteed benefits less estimated future net premiums to be collected from policyholders. In addition, an insurance liability is recorded for the proportion of the net assets of the participating funds that would be allocated to policyholders, assuming all performance would be declared as a dividend based upon local regulations
Not applicable, as IFRS 4 permits contracts with DPF to be accounted for as insurance contracts
Other participating business
Participating products combine protection with a savings element. The basic sum assured, payable on death or maturity, may be enhanced by dividends or bonuses, the timing or amount of which are at the discretion of the insurer taking into account factors such as investment experience
Insurance contract liabilities make provision for the present value of guaranteed benefits and non-guaranteed participation less estimated future net premiums to be collected from policyholders
Not applicable, as IFRS 4 permits contracts with DPF to be accounted for as insurance contracts
Non-participating life assurance, annuities and other protection products
Benefits payable are not at the discretion of the insurer
Insurance contract liabilities reflect the present value of future policy benefits to be paid less the present value of estimated future net premiums to be collected from policyholders. In addition, deferred profit liabilities for limited payment contracts are recognised
Investment contract liabilities are measured at amortised cost
Universal life Benefits are based on an account balance, credited with interest at a rate set by the insurer, and a death benefit, which may be varied by the customer
Insurance contract liabilities reflect the accumulation value, representing premiums received and investment return credited, less deductions for front-end loads, mortality and morbidity costs and expense charges. In addition, liabilities for unearned revenue and additional insurance benefits are recorded
Not applicable as such contracts generally contain significant insurance risk
Unit-linked These may be primarily savings products or may combine savings with an element of protection
Insurance contract liabilities reflect the accumulation value, representing premiums received and investment return credited, less deductions for front-end loads, mortality and morbidity costs and expense charges. In addition, liabilities for unearned revenue and additional insurance benefits are recorded
Investment contract liabilities are measured at fair value (determined with reference to the accumulation value)
In the notes to the financial statements, unit-linked contracts are presented together with pension contracts for disclosure purposes.
FINANCIAL STATEMENTS
| AIA GROUP LIMITED13 4
NOTES TO THE CONSOLIDATED FINANCIAL STATEMENTS AND SIGNIFICANT ACCOUNTING POLICIES
2. SIGNIFICANT ACCOUNTING POLICIES (continued)
2.4 Insurance and investment contracts (continued)
Product classification (continued)
The basis of accounting for insurance and investment contracts is discussed in notes 2.4.1 and 2.4.2 below.
2.4.1 Insurance contracts and investment contracts with DPF
Premiums
Premiums from life insurance contracts, including participating policies and annuity policies with life contingencies, are recognised
as revenue when due from the policyholder. Benefits and expenses are provided in respect of such revenue so as to recognise profits
over the estimated life of the policies. For limited pay contracts, premiums are recognised in profit or loss when due, with any excess
profit deferred and recognised in income in a constant relationship to the insurance in-force or, for annuities, the amount of expected
benefit payments.
Amounts collected as premiums from insurance contracts with investment features but with sufficient insurance risk to be considered
insurance contracts, such as universal life, and certain unit-linked contracts, are accumulated as deposits. Revenue from these
contracts consists of policy fees for the cost of insurance, administration, and surrenders during the period.
Upfront fees are recognised over the estimated life of the contracts to which they relate. Policy benefits and claims that are charged
to expenses include benefit claims incurred in the period in excess of related policyholder contract deposits and interest credited to
policyholder deposits.
Unearned revenue liability
Unearned revenue liability arising from insurance contracts representing upfront fees and other non-level charges is deferred and
released to the consolidated income statement over the estimated life of the business.
Deferred acquisition costs
The costs of acquiring new insurance contracts, including commissions and distribution costs, underwriting and other policy issue
expenses which vary with and are primarily related to the production of new business or renewal of existing business, are deferred as
an asset. Deferred acquisition costs are assessed for recoverability in the year of policy issue to ensure that these costs are recoverable
out of the estimated future margins to be earned on the policy. Deferred acquisition costs are assessed for recoverability at least
annually thereafter. Future investment income is also taken into account in assessing recoverability. To the extent that acquisition
costs are not considered to be recoverable at inception or thereafter, these costs are expensed in the consolidated income statement.
Deferred acquisition costs for life insurance and annuity policies are amortised over the expected life of the contracts as a constant
percentage of expected premiums. Expected premiums are estimated at the date of policy issue and are consistently applied
throughout the life of the contract unless a deficiency occurs when performing liability adequacy testing (see below).
Deferred acquisition costs for universal life and unit-linked contracts are amortised over the expected life of the contracts based
on a constant percentage of the present value of estimated gross profits expected to be realised over the life of the contract or on a
straight-line basis. Estimated gross profits include expected amounts to be assessed for mortality, administration, investment and
surrenders, less benefit claims in excess of policyholder balances, administrative expenses and interest credited. Estimated gross
profits are revised regularly. The interest rate used to compute the present value of revised estimates of expected gross profits is
the latest revised rate applied to the remaining benefit period. Deviations of actual results from estimated experience are reflected
in earnings.
Deferred sales inducements
Deferred sales inducements, consisting of day one bonuses, persistency bonuses and enhanced crediting rates are deferred and
amortised using the same methodology and assumptions used to amortise acquisition costs when:
• the sales inducements are recognised as part of insurance contract liabilities;
• they are explicitly identified in the contract on inception;
• they are incremental to amounts credited on similar contracts without sales inducements; and
• they are higher than the expected ongoing crediting rates for periods after the inducement.
ANNUAL REPORT 2015 | 135
OV
ER
VIE
WF
INA
NC
IAL
AN
D O
PE
RA
TIN
G R
EV
IEW
CO
RP
OR
AT
E G
OV
ER
NA
NC
EF
INA
NC
IAL
ST
AT
EM
EN
TS
AD
DIT
ION
AL
IN
FO
RM
AT
ION
2. SIGNIFICANT ACCOUNTING POLICIES (continued)
2.4 Insurance and investment contracts (continued)
2.4.1 Insurance contracts and investment contracts with DPF (continued)
Unbundling
The deposit component of an insurance contract is unbundled when both of the following conditions are met:
• the deposit component (including any embedded surrender option) can be measured separately (i.e. without taking into account
the insurance component); and
• the Group’s accounting policies do not otherwise require the recognition of all obligations and rights arising from the deposit
component.
Bifurcation
To the extent that certain of the Group’s insurance contracts include embedded derivatives that are not clearly and closely related to
the host contract, these are bifurcated from the insurance contracts and accounted for as derivatives.
Benefits and claims
Insurance contract benefits reflect the cost of all maturities, surrenders, withdrawals and claims arising during the year, as well as
policyholder dividends accrued in anticipation of dividend declarations.
Accident and health claims incurred include all losses occurring during the year, whether reported or not, related handling costs, a
reduction for recoveries, and any adjustments to claims outstanding from previous years.
Claims handling costs include internal and external costs incurred in connection with the negotiation and settlement of claims, and
are included in operating expenses.
Insurance contract liabilities (including liabilities in respect of investment contracts with DPF)
Insurance contract liabilities represent the estimated future policyholder benefit liability for life insurance policies.
Future policy benefits for life insurance policies are calculated using a net level premium valuation method which represents the
present value of estimated future policy benefits to be paid, less the present value of estimated future net premiums to be collected
from policyholders.
For contracts with an explicit account balance, such as universal life and unit-linked contracts, insurance contract liabilities are equal
to the accumulation value, which represents premiums received and investment returns credited to the policy less deductions for
mortality and morbidity costs and expense charges.
Settlement options are accounted for as an integral component of the underlying insurance or investment contract unless they provide
annuitisation benefits, in which case an additional liability is established to the extent that the present value of expected annuitisation
payments at the expected annuitisation date exceeds the expected account balance at that date. Where settlement options have
been issued with guaranteed rates less than market interest rates, the insurance or investment contract liability does not reflect any
provision for subsequent declines in market interest rates unless a deficiency is identified through liability adequacy testing.
The Group accounts for participating policies within participating funds by establishing a liability for the present value of guaranteed
benefits less estimated future net premiums to be collected from policyholders. In addition, an insurance liability is recorded for the
proportion of the net assets of the participating funds that would be allocated to policyholders assuming all performance were to be
declared as a dividend based upon local regulations. The Group accounts for other participating business by establishing a liability for
the present value of guaranteed benefits and non-guaranteed participation, less estimated future net premiums to be collected from
policyholders.
FINANCIAL STATEMENTS
| AIA GROUP LIMITED136
NOTES TO THE CONSOLIDATED FINANCIAL STATEMENTS AND SIGNIFICANT ACCOUNTING POLICIES
2. SIGNIFICANT ACCOUNTING POLICIES (continued)
2.4 Insurance and investment contracts (continued)
2.4.1 Insurance contracts and investment contracts with DPF (continued)
Liability adequacy testing
The adequacy of liabilities is assessed by portfolio of contracts, in accordance with the Group’s manner of acquiring, servicing and
measuring the profitability of its insurance contracts. Liability adequacy testing is performed for each geographical market.
For traditional life insurance contracts, insurance contract liabilities reduced by deferred acquisition costs and value of business
acquired on acquired insurance contracts, are compared to the gross premium valuation calculated on a best estimate basis, as of the
valuation date. If there is a deficiency, the unamortised balance of deferred acquisition cost and value of business acquired on acquired
insurance contracts are written down to the extent of the deficiency. If, after writing down the unamortised balance for the specific
portfolio of contracts to nil, a deficiency still exists, the net liability is increased by the amount of the remaining deficiency.
For universal life and investment contracts, deferred acquisition costs, net of unearned revenue liabilities, are compared to estimated
gross profits. If a deficiency exists, deferred acquisition costs are written down.
Financial guarantees
Financial guarantees are regarded as insurance contracts. Liabilities in respect of such contracts are recognised as loss is incurred
by a holder.
2.4.2 Investment contracts
Investment contracts do not contain sufficient insurance risk to be considered insurance contracts and are accounted for as a financial
liability, other than investment contracts with DPF which are excluded from the scope of IAS 39 and are accounted for as insurance
contracts.
Revenue from these contracts consists of various charges (policy fees, handling fees, management fees and surrender charges)
made against the contract for the cost of insurance, expenses and early surrender. First year charges are amortised over the life of
the contract as the services are provided.
Investment contract fee revenue
Customers are charged fees for policy administration, investment management, surrenders or other contract services. The fees
may be fixed amounts or vary with the amounts being managed, and will generally be charged as an adjustment to the policyholder’s
account balance. The fees are recognised as revenue in the period in which they are received unless they relate to services to be
provided in future periods, in which case they are deferred and recognised as the service is provided.
Origination and other “upfront” fees (fees that are assessed against the account balance as consideration for origination of the
contract) are charged on some non-participating investment and pension contracts. Where the investment contract is recorded at
amortised cost, these fees are amortised and recognised over the expected term of the policy as an adjustment to the effective yield.
Where the investment contract is measured at fair value, the front-end fees that relate to the provision of investment management
services are amortised and recognised as the services are provided.
Deferred origination costs
The costs of acquiring investment contracts with investment management services, including commissions and other incremental
expenses directly related to the issue of each new contract, are deferred and amortised over the period that services are provided.
Deferred origination costs are tested for recoverability at each reporting date.
The costs of acquiring new investment contracts without investment management services are included as part of the effective interest
rate used to calculate the amortised cost of the related investment contract liabilities.
ANNUAL REPORT 2015 | 137
OV
ER
VIE
WF
INA
NC
IAL
AN
D O
PE
RA
TIN
G R
EV
IEW
CO
RP
OR
AT
E G
OV
ER
NA
NC
EF
INA
NC
IAL
ST
AT
EM
EN
TS
AD
DIT
ION
AL
IN
FO
RM
AT
ION
2. SIGNIFICANT ACCOUNTING POLICIES (continued)
2.4 Insurance and investment contracts (continued)
2.4.2 Investment contracts (continued)
Investment contract liabilities
Deposits received in respect of investment contracts are not accounted for through the consolidated income statement, except for
the investment income and fees attributable to those contracts, but are accounted for directly through the consolidated statement of
financial position as an adjustment to the investment contract liability, which reflects the account balance.
The majority of the Group’s contracts classified as investment contracts are unit-linked contracts, with measurement directly linked
to the underlying investment assets. These represent investment portfolios maintained to meet specific investment objectives
of policyholders who generally bear the credit and market risks on those investments. The liabilities are carried at fair value
determined with reference to the accumulation value (current unit value) with changes recognised in profit or loss. The costs of policy
administration, investment management, surrender charges and certain policyholder taxes assessed against customers’ account
balances are included in revenue, and accounted for as described under “Investment contract fee revenue” above.
Non unit-linked investment contract liabilities are carried at amortised cost, being the fair value of consideration received at the
date of initial recognition, less the net effect of principal payments such as transaction costs and front-end fees, plus or minus the
cumulative amortisation using the effective interest method of any difference between that initial amount and the maturity value, and
less any write-down for surrender payments. The effective interest rate equates the discounted cash payments to the initial amount.
At each reporting date, the unearned revenue liability is determined as the value of the future best estimate cash flows discounted
at the effective interest rate. Any adjustment is immediately recognised as income or expense in the consolidated income statement.
The amortised cost of the financial liability is never recorded at less than the amount payable on surrender, discounted for the time
value of money where applicable, if the investment contract is subject to a surrender option.
2.4.3 Insurance and investment contracts
Reinsurance
The Group cedes reinsurance in the normal course of business, with retentions varying by line of business. The cost of reinsurance
is accounted for over the life of the underlying reinsured policies, using assumptions consistent with those used to account for such
policies.
Premiums ceded and claims reimbursed are presented on a gross basis in the consolidated income statement and statement of
financial position.
Reinsurance assets consist of amounts receivable in respect of ceded insurance liabilities. Amounts recoverable from reinsurers are
estimated in a manner consistent with the reinsured insurance or investment contract liabilities or benefits paid and in accordance
with the relevant reinsurance contract.
To the extent that reinsurance contracts principally transfer financial risk (as opposed to insurance risk) they are accounted for
directly through the consolidated statement of financial position and are not included in reinsurance assets or liabilities. A deposit
asset or liability is recognised, based on the consideration paid or received less any explicitly identified premiums or fees to be
retained by the reinsured.
If a reinsurance asset is impaired, the Group reduces the carrying amount accordingly and recognises that impairment loss in the
consolidated income statement. A reinsurance asset is impaired if there is objective evidence, as a result of an event that occurred
after initial recognition of the reinsurance asset, that the Group may not receive all amounts due to it under the terms of the contract,
and the impact on the amounts that the Group will receive from the reinsurer can be reliably measured.
Value of business acquired (VOBA)
The VOBA in respect of a portfolio of long-term insurance and investment contracts, either directly or through the purchase of a
subsidiary, is recognised as an asset. If this results from the acquisition of an investment in a joint venture or an associate, the VOBA
is held within the carrying amount of that investment. In all cases, the VOBA is amortised over the estimated life of the contracts in
the acquired portfolio on a systematic basis. The rate of amortisation reflects the profile of the value of in-force business acquired.
The carrying value of VOBA is reviewed annually for impairment and any reduction is charged to the consolidated income statement.
FINANCIAL STATEMENTS
| AIA GROUP LIMITED138
NOTES TO THE CONSOLIDATED FINANCIAL STATEMENTS AND SIGNIFICANT ACCOUNTING POLICIES
2. SIGNIFICANT ACCOUNTING POLICIES (continued)
2.4 Insurance and investment contracts (continued)
2.4.3 Insurance and investment contracts (continued)
Shadow accounting
Shadow accounting is applied to insurance and certain investment contracts with discretionary participation feature where financial
assets backing insurance and investment contract liabilities are classified as available for sale. Shadow accounting is applied to
deferred acquisition costs, VOBA, deferred origination costs and the contract liabilities for investment contracts with DPF to take into
account the effect of unrealised gains or losses on insurance liabilities or assets that are recognised in other comprehensive income
in the same way as for a realised gain or loss recognised in the consolidated income statement. Such assets or liabilities are adjusted
with corresponding charges or credits recognised directly in shareholders’ equity as a component of the related unrealised gains and
losses.
Other assessments and levies
The Group is potentially subject to various periodic insurance-related assessments or guarantee fund levies. Related provisions are
established where there is a present obligation (legal or constructive) as a result of a past event. Such amounts are not included in
insurance or investment contract liabilities but are included under “Provisions” in the consolidated statement of financial position.
2.5 Financial instruments2.5.1 Classification of and designation of financial instruments
Financial assets and liabilities at fair value through profit or loss
Financial assets and liabilities at fair value through profit or loss comprise two categories:
• financial assets or liabilities designated at fair value through profit or loss upon initial recognition; and
• financial assets or liabilities classified as held for trading.
Management designates financial assets and liabilities at fair value through profit or loss if this eliminates a measurement
inconsistency or if the related assets and liabilities are actively managed on a fair value basis, including:
• financial assets held to back unit-linked contracts and participating funds;
• other financial assets managed on a fair value basis; consisting of the Group’s equity portfolio and investments held by the Group’s
fully consolidated investment funds; and
• compound instruments containing an embedded derivative, where the embedded derivative would otherwise require bifurcation.
Financial assets and liabilities classified as held for trading include financial assets acquired principally for the purpose of selling
them in the near future and those that form part of a portfolio of financial assets in which there is evidence of short-term profit taking,
as well as derivative assets and liabilities.
Dividend income from equity instruments designated at fair value through profit or loss is recognised in investment income in the
consolidated income statement, generally when the security becomes ex-dividend. Interest income is recognised on an accrued basis.
For all financial assets designated at fair value through profit or loss, changes in fair value are recognised in investment experience.
Transaction costs in respect of financial assets and liabilities at fair value through profit or loss are expensed as they are incurred.
ANNUAL REPORT 2015 | 139
OV
ER
VIE
WF
INA
NC
IAL
AN
D O
PE
RA
TIN
G R
EV
IEW
CO
RP
OR
AT
E G
OV
ER
NA
NC
EF
INA
NC
IAL
ST
AT
EM
EN
TS
AD
DIT
ION
AL
IN
FO
RM
AT
ION
2. SIGNIFICANT ACCOUNTING POLICIES (continued)
2.5 Financial instruments (continued)
2.5.1 Classification of and designation of financial instruments (continued)
Available for sale financial assets
Financial assets, other than those at fair value through profit or loss, and loans and receivables, are classified as available for sale.
The available for sale category is used where the relevant investments backing insurance and investment contract liabilities and
shareholders’ equity are not managed on a fair value basis. These principally consist of the Group’s debt securities (other than those
backing participating funds and unit-linked contracts). Available for sale financial assets are initially recognised at fair value plus
attributable transaction costs. For available for sale debt securities, the difference between their cost and par value is amortised.
Available for sale financial assets are subsequently measured at fair value. Interest income from debt securities classified as available
for sale is recognised in investment income in the consolidated income statement using the effective interest method.
Unrealised gains and losses on securities classified as available for sale are analysed between differences resulting from foreign
currency translation, and other fair value changes. Foreign currency translation differences on monetary available for sale
investments, such as debt securities are calculated as if they were carried at amortised cost and so are recognised in the consolidated
income statement as investment experience. For impairments of available for sale financial assets, reference is made to the section “Impairment of financial assets”.
Changes in the fair value of securities classified as available for sale, except for impairment losses and relevant foreign exchange
gains and losses, are recognised in other comprehensive income and accumulated in a separate fair value reserve within equity.
Impairment losses and relevant foreign exchange gains and losses are recognised in the income statement.
Realised gains and losses on financial assets
Realised gains and losses on available for sale financial assets are determined as the difference between the sale proceeds and
amortised cost. Amortised cost is determined by specific identification.
Recognition of financial instruments
Purchases and sales of financial instruments are recognised on the trade date, which is the date at which the Group commits to
purchase or sell the assets.
Derecognition and offset of financial assets
Financial assets are derecognised when the rights to receive cash flows from the financial assets have expired or where the Group
has transferred substantially all risks and rewards of ownership. If the Group neither transfers nor retains substantially all the risks
and rewards of ownership of a financial asset, it derecognises the financial asset if it no longer has control over the asset. In transfers
where control over the asset is retained, the Group continues to recognise the asset to the extent of its continuing involvement. The
extent of continuing involvement is determined by the extent to which the Group is exposed to changes in the fair value of the asset.
Financial assets and liabilities are offset and the net amount reported in the consolidated statement of financial position only when
there is a legally enforceable right to offset the recognised amounts and there is an intention to settle on a net basis, or realise the
asset and settle the liability simultaneously.
Loans and receivables
Loans and receivables are non-derivative financial assets with fixed or determinable payments that are not quoted in an active market.
They are initially recognised at fair value plus transaction costs. Subsequently, they are carried at amortised cost using the effective
interest method less any impairment losses. Interest income from loans and receivables is recognised in investment income in the
consolidated income statement using the effective interest method.
Term deposits
Deposits include time deposits with financial institutions which do not meet the definition of cash and cash equivalents as their maturity
at acquisition exceeds three months. Certain of these balances are subject to regulatory or other restriction as disclosed in note 20
Loans and deposits. Deposits are stated at amortised cost using the effective interest method.
Cash and cash equivalents
Cash and cash equivalents include cash in hand, deposits held at call with banks and other short-term highly liquid investments with
maturities at acquisition of three months or less, which are held for cash management purposes. Cash and cash equivalents also
include cash received as collateral for derivative transactions, securities lending transactions, and repo and reverse repo transactions,
as well as cash and cash equivalents held for the benefit of policyholders in connection with unit-linked products. Cash and cash
equivalents are measured at amortised cost using the effective interest method.
FINANCIAL STATEMENTS
| AIA GROUP LIMITED14 0
NOTES TO THE CONSOLIDATED FINANCIAL STATEMENTS AND SIGNIFICANT ACCOUNTING POLICIES
2. SIGNIFICANT ACCOUNTING POLICIES (continued)
2.5 Financial instruments (continued)
2.5.2 Fair values of non-derivative financial instruments
The fair value of a financial instrument is the amount that would be received to sell an asset or paid to transfer a liability in an orderly
transaction between market participants at the measurement date, having regard to the specific characteristics of the asset or liability
concerned, assuming that the transfer takes place in the most advantageous market to which the Group has access. The fair values
of financial instruments traded in active markets (such as financial instruments at fair value through profit or loss and available for
sale securities) are based on quoted market prices at the date of the consolidated statement of financial position. The quoted market
price used for financial assets held by the Group is the current bid price, which is considered to be the price within the bid-ask spread
that is most representative of the fair value in the circumstances. The fair values of financial instruments that are not traded in active
markets are determined using valuation techniques. The Group uses a variety of methods and makes assumptions that are based
on market conditions at the date of each consolidated statement of financial position. The objective of using a valuation technique is
to estimate the price at which an orderly transaction would take place between market participants at the date of the consolidated
statement of financial position.
Financial instruments carried at fair value are measured using a fair value hierarchy described in note 22.
2.5.3 Impairment of financial assets
General
Financial assets are assessed for impairment on a regular basis. The Group assesses at each reporting date whether there is objective
evidence that a financial asset or group of financial assets is impaired. A financial asset, or group of financial assets, is impaired and
impairment losses are incurred only if there is objective evidence of impairment as a result of one or more events that have occurred
after the initial recognition of the asset (a loss event) and that loss event (or events) has an impact on the estimated future cash flows
of the financial asset or group of financial assets that can be reliably estimated.
For loans and receivables, the Group first assesses whether objective evidence of impairment exists for financial assets that are
individually significant. If the Group determines that objective evidence of impairment does not exist for an individually assessed
financial asset, whether significant or not, it includes the asset in a group of financial assets with similar credit risk characteristics and
collectively assesses them for impairment. Assets that are individually assessed for impairment and for which an impairment loss is
or continues to be recognised are not included in a collective assessment of impairment.
Available for sale financial instruments
When a decline in the fair value of an available for sale asset has been recognised in other comprehensive income and there is objective
evidence that the asset is impaired, the cumulative loss already recognised directly in other comprehensive income is recognised in
current period profit or loss.
If the fair value of a debt instrument classified as available for sale increases in a subsequent period, and the increase can be objectively
related to an event occurring after the impairment loss was recognised in profit or loss, the impairment loss is reversed through profit
or loss. Where, following the recognition of an impairment loss in respect of an available for sale debt security, the asset suffers
further falls in value, such further falls are recognised as an impairment only in the case when objective evidence exists of a further
impairment event to which the losses can be attributed.
Loans and receivables
For loans and receivables, impairment is considered to have taken place if it is probable that the Group will not be able to collect
principal and/or interest due according to the contractual terms of the instrument. When impairment is determined to have occurred,
the carrying amount is decreased through a charge to profit or loss. The carrying amount of mortgage loans or receivables is reduced
through the use of an allowance account, and the amount of any allowance is recognised as an impairment loss in profit or loss.
ANNUAL REPORT 2015 | 141
OV
ER
VIE
WF
INA
NC
IAL
AN
D O
PE
RA
TIN
G R
EV
IEW
CO
RP
OR
AT
E G
OV
ER
NA
NC
EF
INA
NC
IAL
ST
AT
EM
EN
TS
AD
DIT
ION
AL
IN
FO
RM
AT
ION
2. SIGNIFICANT ACCOUNTING POLICIES (continued)
2.5 Financial instruments (continued)
2.5.4 Derivative financial instruments
Derivative financial instruments primarily include foreign exchange contracts and interest rate swaps that derive their value mainly
from underlying foreign exchange rates and interest rates. All derivatives are initially recognised in the consolidated statement of
financial position at their fair value, which represents their cost excluding transaction costs, which are expensed, giving rise to a day
one loss. They are subsequently remeasured at their fair value, with movements in this value recognised in profit or loss. Fair values
are obtained from quoted market prices or, if these are not available, by using valuation techniques such as discounted cash flow
models or option pricing models. All derivatives are carried as assets when the fair values are positive and as liabilities when the fair
values are negative.
Derivative instruments for economic hedging
Whilst the Group enters into derivative transactions to provide economic hedges under the Group’s risk management framework, it
adopts hedge accounting to these transactions only in limited circumstances. This is either because the transactions would not meet
the specific IFRS rules to be eligible for hedge accounting or the documentation requirements to meet hedge accounting criteria
would be unduly onerous. Where hedge accounting does not apply, these transactions are treated as held for trading and fair value
movements are recognised immediately in investment experience.
Embedded derivatives
Embedded derivatives are derivatives embedded within other non-derivative host financial instruments to create hybrid instruments.
Where the economic characteristics and risks of the embedded derivatives are not closely related to the economic characteristics and
risks of the host instrument, and where the hybrid instrument is not measured at fair value with changes in fair value recognised in
profit or loss, the embedded derivative is bifurcated and carried at fair value as a derivative in accordance with IAS 39.
2.6 Segment reportingAn operating segment is a component of the Group that engages in business activity from which it earns revenues and incurs expenses
and, for which, discrete financial information is available, and whose operating results are regularly reviewed by the Group’s chief
operating decision-maker, considered to be the Executive Committee of the Group (ExCo).
2.7 Foreign currency translationIncome statements and cash flows of foreign entities are translated into the Group’s presentation currency at average exchange rates
for the year as this approximates to the exchange rates prevailing at the transaction date. Their statements of financial position are
translated at year or period end exchange rates. Exchange differences arising from the translation of the net investment in foreign
operations, are taken to the currency translation reserve within equity. On disposal of a foreign operation, such exchange differences
are transferred out of this reserve and are recognised in the consolidated income statement as part of the gain or loss on sale.
Foreign currency transactions are accounted for at the exchange rates prevailing at the date of the transactions. Gains and losses
resulting from the settlement of such transactions, and from the translation of monetary assets and liabilities denominated in foreign
currencies into functional currency, are recognised in the consolidated income statement.
Translation differences on financial assets designated at fair value through profit or loss are included in investment experience. For
monetary financial assets classified as available for sale, translation differences are calculated as if they were carried at amortised
cost and so are recognised in the consolidated income statement. Foreign exchange movements on non-monetary equities that are
accounted for as available for sale are included in the fair value reserve.
FINANCIAL STATEMENTS
| AIA GROUP LIMITED142
NOTES TO THE CONSOLIDATED FINANCIAL STATEMENTS AND SIGNIFICANT ACCOUNTING POLICIES
2. SIGNIFICANT ACCOUNTING POLICIES (continued)
2.8 Property, plant and equipmentProperty, plant and equipment is stated at historical cost less accumulated depreciation and any accumulated impairment losses.
Historical cost includes expenditure that is directly attributable to the acquisition of the items. Depreciation is calculated using the
straight-line method to allocate cost less any residual value over the estimated useful life, generally:
Furniture, fixtures and office equipment 5 years
Buildings 20-40 years
Other assets 3-5 years
Freehold land Not depreciated
Subsequent costs are included in the carrying amount or recognised as a separate asset, as appropriate, when it is probable that
future economic benefits will flow to the Group. Repairs and maintenance are charged to the consolidated income statement during
the financial period in which they are incurred.
Residual values and useful lives are reviewed and adjusted, if applicable, at each reporting date. An asset is written down to its
recoverable amount if the carrying value is greater than the estimated recoverable amount.
Any gain and loss arising on disposal of property, plant and equipment is measured as the difference between the net sale proceeds
and the carrying amount of the relevant asset, and is recognised in the consolidated income statement.
Where the cost of the Group’s leasehold land is known, or can be reliably determined at the inception of the lease, the Group records
its interest in leasehold land and land use rights separately as operating leases or finance leases depending on whether substantially
all the risks and rewards incidental to ownership of the land are transferred to the Group. These leases are recorded at original cost
and amortised over the term of the lease (see 2.19).
2.9 Investment propertyProperty held for long-term rental that is not occupied by the Group is classified as investment property, and is carried at cost less
accumulated depreciation and any accumulated impairment losses.
Investment property comprises freehold or leasehold land and buildings. Buildings located on leasehold land are classified as
investment property if held for long-term rental and not occupied by the Group. Where the cost of the land is known, or can be
reliably determined at the inception of the lease, the Group records its interest in leasehold land and land use rights separately as
operating leases or finance leases depending on whether substantially all the risks and rewards incidental to ownership of the land
are transferred to the Group (see 2.19). These leases are recorded at original cost and amortised over the term of the lease. Buildings
that are held as investment properties are amortised on a straight-line basis over their estimated useful lives of 20 to 40 years.
If an investment property becomes held for own use, it is reclassified as property, plant and equipment. Where a property is partly used
as an investment property and partly for the use of the Group, these elements are recorded separately within investment property and
property, plant and equipment respectively, where the component used as investment property would be capable of separate sale or
finance lease.
The fair value of investment property and property held for own use is disclosed under note 17. It is the Group’s policy to obtain
external property valuations annually except in the case of a discrete event occurring in the interim that has a significant impact on
the fair value of the properties.
ANNUAL REPORT 2015 | 14 3
OV
ER
VIE
WF
INA
NC
IAL
AN
D O
PE
RA
TIN
G R
EV
IEW
CO
RP
OR
AT
E G
OV
ER
NA
NC
EF
INA
NC
IAL
ST
AT
EM
EN
TS
AD
DIT
ION
AL
IN
FO
RM
AT
ION
2. SIGNIFICANT ACCOUNTING POLICIES (continued)
2.10 Goodwill and other intangible assetsGoodwill
Goodwill represents the excess of the cost of an acquisition over the fair value of the Group’s share of the net identifiable assets of the
acquired subsidiary, associate or joint venture at the date of acquisition. Goodwill on acquisitions prior to 1 December 2006 (the date of
transition to IFRS) is carried at book value (original cost less cumulative amortisation) on that date, less any impairment subsequently
incurred. Goodwill arising on the Group’s investment in subsidiaries since that date is shown as a separate asset and is carried at cost
less any accumulated impairment losses, whilst that on associates and joint ventures is included within the carrying value of those
investments. All acquisition-related costs are expensed as incurred.
Other intangible assets
Other intangible assets consist primarily of acquired computer software and contractual relationships, such as access to distribution
networks, and are amortised over their estimated useful lives. The amortisation charge for rights to access distribution networks is
included in the consolidated income statement under “Commission and other acquisition expenses”.
Acquired computer software licences are capitalised on the basis of the costs incurred to acquire and bring to use the specific software.
Costs directly associated with the internal production of identifiable and unique software by the Group that will generate economic
benefits exceeding those costs over a period greater than a year, are recognised as intangible assets. All other costs associated with
developing or maintaining computer software programmes are recognised as an expense as incurred. Costs of acquiring computer
software licences and incurred in the internal production of computer software are amortised using the straight-line method over the
estimated useful life of the software, which does not generally exceed a period of 3 to 15 years. The amortisation charge for the year
is included in the consolidated income statement under “Operating expenses”.
2.11 Impairment of non-financial assetsProperty, plant and equipment, goodwill and other non-financial assets are reviewed for impairment whenever events or changes
in circumstances indicate that the carrying amount may not be recoverable. An impairment loss is recognised to the extent that the
carrying amount of the asset exceeds its recoverable amount, which is the higher of the fair value of the asset less cost to sell and
value in use. For the purposes of assessing impairment, assets are grouped into cash-generating units at the level of the Group’s
operating segments, the lowest level for which separately identifiable cash flows are reported. The carrying values of goodwill and
intangible assets with indefinite useful lives are reviewed at least annually or when circumstances or events indicate that there may
be uncertainty over this value.
The Group assesses at the end of each reporting period whether there is any objective evidence that its investments in associates
and joint ventures are impaired. Such objective evidence includes whether there has been any significant adverse changes in the
technological, market, economic or legal environment in which the associates and joint ventures operate or whether there has been
a significant or prolonged decline in value below their cost. If there is an indication that an interest in an associate or a joint venture is
impaired, the Group assesses whether the entire carrying amount of the investment (including goodwill) is recoverable. An impairment
loss is recognised in profit or loss for the amount by which the carrying amount is lower than the higher of the investment’s fair value
less costs to sell or value in use. Any reversal of such impairment loss in subsequent periods is reversed through profit or loss.
In the statement of financial position of the Company, impairment testing of the investments in subsidiaries, associates and joint
ventures is required upon receiving dividends from these investments if the dividend exceeds the total comprehensive income of the
subsidiaries, associates or joint ventures in the period the dividend is declared or if the carrying amount of the relevant investment in
the Company’s statement of financial position exceeds its carrying amount in the consolidated financial statements of the investees’
net assets including goodwill.
FINANCIAL STATEMENTS
| AIA GROUP LIMITED14 4
NOTES TO THE CONSOLIDATED FINANCIAL STATEMENTS AND SIGNIFICANT ACCOUNTING POLICIES
2. SIGNIFICANT ACCOUNTING POLICIES (continued)
2.12 Securities lending including repurchase agreementsThe Group has been a party to various securities lending agreements under which securities are loaned to third parties on a short-
term basis. The loaned securities are not derecognised and so they continue to be recognised within the appropriate investment
classification.
Assets sold under repurchase agreements (repos)
Assets sold under repurchase agreements continue to be recognised and a liability is established for the consideration received. The
Group may be required to provide additional collateral based on the fair value of the underlying assets, and such collateral assets
remain on the consolidated statement of financial position.
Assets purchased under agreements to resell (reverse repos)
The Group enters into purchases of assets under agreements to resell (reverse repos). Reverse repos are initially recorded at the cost
of the loan or collateral advanced within the caption “Loans and deposits” in the consolidated statement of financial position. In the
event of failure by the counterparty to repay the loan, the Group has the right to the underlying assets.
2.13 CollateralThe Group receives and pledges collateral in the form of cash or non-cash assets in respect of derivative transactions, securities
lending transactions, and repo and reverse repo transactions, in order to reduce the credit risk of these transactions. The amount and
type of collateral depends on an assessment of the credit risk of the counterparty. Collateral received in the form of cash, which is not
legally segregated from the Group, is recognised as an asset in the consolidated statement of financial position with a corresponding
liability for the repayment. Non-cash collateral received is not recognised on the consolidated statement of financial position unless
the Group either sells or repledges these assets in the absence of default, at which point the obligation to return this collateral is
recognised as a liability. To further minimise credit risk, the financial condition of counterparties is monitored on a regular basis.
Collateral pledged in the form of cash which is legally segregated from the Group is derecognised from the consolidated statement of
financial position and a corresponding receivable established for its return. Non-cash collateral pledged is not derecognised (except in
the event of default) and therefore continues to be recognised in the consolidated statement of financial position within the appropriate
financial instrument classification.
2.14 BorrowingsBorrowings are recognised initially at their issue proceeds less transaction costs incurred. Subsequently, borrowings are stated at
amortised cost, and any difference between net proceeds and redemption value is recognised in the consolidated income statement
over the period of the borrowings using the effective interest method. All borrowing costs are expensed as they are incurred, except
for borrowing costs directly attributable to the development of investment properties and other qualifying assets, which are capitalised
as part of the cost of the asset.
ANNUAL REPORT 2015 | 145
OV
ER
VIE
WF
INA
NC
IAL
AN
D O
PE
RA
TIN
G R
EV
IEW
CO
RP
OR
AT
E G
OV
ER
NA
NC
EF
INA
NC
IAL
ST
AT
EM
EN
TS
AD
DIT
ION
AL
IN
FO
RM
AT
ION
2. SIGNIFICANT ACCOUNTING POLICIES (continued)
2.15 Income taxesThe current tax expense is based on the taxable profits for the year, including any adjustments in respect of prior years. Tax is
allocated to profit or loss before taxation and amounts charged or credited to equity as appropriate.
Deferred tax is recognised in respect of temporary differences between the tax bases of assets and liabilities and their carrying
amounts in the consolidated financial statements, except as described below.
The principal temporary differences arise from the basis of recognition of insurance and investment contract liabilities, revaluation
of certain financial assets and liabilities including derivative contracts, deferred acquisition costs and the future taxes arising on the
surplus in life funds where the relevant local tax regime is distributions-based. The rates enacted or substantively enacted at the date
of the consolidated statement of financial position are used to determine deferred tax.
Deferred tax assets are recognised to the extent that it is probable that future taxable profit will be available against which the
temporary differences can be utilised. In countries where there is a history of tax losses, deferred tax assets are only recognised in
excess of deferred tax liabilities if there is evidence that future profits will be available.
Deferred taxes are not provided in respect of temporary differences arising from the initial recognition of goodwill or from goodwill for
which amortisation is not deductible for tax purposes, or from the initial recognition of an asset or liability in a transaction which is not
a business combination and which affects neither accounting nor taxable profit or loss at the time of the transaction.
Deferred tax related to fair value remeasurement of available for sale investments and other amounts taken directly to equity, is
recognised initially within the applicable component of equity. It is subsequently recognised in the consolidated income statement,
together with the gain or loss arising on the underlying item.
In addition to paying tax on shareholders’ profits, certain of the Group’s life insurance businesses pay tax on policyholders’ investment
returns (policyholder tax) at policyholder tax rates. Policyholder tax is accounted for as an income tax and is included in the total tax
expense and disclosed separately.
2.16 RevenueInvestment return
Investment income consists of dividends, interest and rents receivable for the reporting period. Investment experience comprises
realised gains and losses, impairments and unrealised gains and losses on investments held at fair value through profit or loss.
Interest income is recognised as it accrues, taking into account the effective yield on the investment. Rental income on investment
property is recognised on an accrual basis. Investment return consists of investment income and investment experience.
The realised gain or loss on disposal of an investment is the difference between the proceeds received, net of transaction costs, and its
original cost or amortised cost as appropriate. Unrealised gains and losses represent the difference between the carrying value at the
year end and the carrying value at the previous year end or purchase price if purchased during the year, less the reversal of previously
recognised unrealised gains and losses in respect of disposals made during the year.
Other fee and commission income
Other fee and commission income consists primarily of fund management fees, income from any incidental non-insurance activities,
distribution fees from mutual funds, commissions on reinsurance ceded and commission revenue from the sale of mutual fund
shares. Reinsurance commissions receivable are deferred in the same way as acquisition costs. All other fee and commission income
is recognised as the services are provided.
FINANCIAL STATEMENTS
| AIA GROUP LIMITED14 6
NOTES TO THE CONSOLIDATED FINANCIAL STATEMENTS AND SIGNIFICANT ACCOUNTING POLICIES
2. SIGNIFICANT ACCOUNTING POLICIES (continued)
2.17 Employee benefitsAnnual leave and long service leave
Employee entitlements to annual leave and long service leave are recognised when they accrue to employees. A provision is made for
the estimated liability for annual leave and long service leave as a result of services rendered by employees up to the reporting date.
Post-retirement benefit obligations
The Group operates a number of funded and unfunded post-retirement employee benefit schemes, whose members receive benefits
on either a defined benefit basis (generally related to salary and length of service) or a defined contribution basis (generally related to
the amount invested, investment return and annuity rates), the assets of which are generally held in separate trustee-administered
funds. The defined benefit plans provide life and medical benefits for employees after retirement and a lump sum benefit on cessation
of employment, and the defined contribution plans provide post-retirement pension benefits.
For defined benefit plans, the costs are assessed using the projected unit credit method. Under this method, the cost of providing
benefits is charged to the consolidated income statement so as to spread the regular cost over the service lives of employees, in
accordance with the advice of qualified actuaries. The obligation is measured as the present value of the estimated future cash
outflows, using a discount rate based on market yields for high-quality corporate bonds that are denominated in the currency in which
the benefits will be paid and that have terms to maturity approximating to the terms of the related liability. The resulting scheme
surplus or deficit appears as an asset or liability in the consolidated statement of financial position.
Remeasurements arising from defined benefit plans comprise actuarial gains and losses, the return on plan assets (excluding interest)
and the effect of the asset ceiling (if any, excluding interest). The Group recognises them immediately in other comprehensive income
and all other expenses related to defined benefit plans in staff costs in the consolidated income statement.
When the benefits of a plan are changed, or when a plan is curtailed, the portion of the changed benefit related to past service by
employees, or the gain or loss on curtailment, is recognised immediately in consolidated income statement when the plan amendment
or curtailment occurs.
For defined contribution plans, the Group pays contributions to publicly or privately administered pension plans. Once the contributions
have been paid, the Group, as employer, does not have any further payment obligations. The Group’s contributions are charged to the
consolidated income statement in the reporting period to which they relate and are included in staff costs.
Share-based compensation and cash incentive plans
The Group launched a number of share-based compensation plans, under which the Group receives services from the employees,
directors, officers and agents as consideration for the shares and/or share options of the Company. These share-based compensation
plans comprise the Share Option Scheme (SO Scheme), the Restricted Share Unit Scheme (RSU Scheme), the Employee Share
Purchase Plan (ESPP) and the Agency Share Purchase Plan (ASPP).
The Group’s share-based compensation plans are predominantly equity-settled plans. Under equity-settled share-based compensation
plan, the fair value of the employee services received in exchange for the award of shares and/or share options is recognised as an
expense in profit or loss over the vesting period with a corresponding amount recorded in equity.
The total amount to be expensed over the vesting period is determined by reference to the fair value of the share and/or share options
awarded. Non-market vesting conditions are included in assumptions about the number of shares and/or share options that are
expected to be vested. At each period end, the Group revises its estimates of the number of shares and/or share options that are
expected to be vested. Any impact of the revision to original estimates is recognised in profit or loss with a corresponding adjustment
to equity. Where awards of share-based payment arrangements have graded vesting terms, each tranche is recognised as a separate
award, and therefore the fair value of each tranche is recognised over the applicable vesting period.
The Group estimates the fair value of share options using a binomial lattice model. This model requires inputs such as share price,
implied volatility, risk-free interest rate, expected dividend rate and the expected life of the share option.
Where modification or cancellation of an equity-settled share-based compensation plan occurs, the grant date fair value continues to
be recognised, together with any incremental value arising on the date of modification if non-market conditions are met.
For cash-settled share-based compensation plans, the fair value of the employee services in exchange for the award of cash-settled
award is recognised as an expense in profit or loss, with a corresponding amount recognised in liability. At the end of each reporting
period, any unsettled award is remeasured based on the change in fair value of the underlying asset and the liability and expense are
adjusted accordingly.
ANNUAL REPORT 2015 | 147
OV
ER
VIE
WF
INA
NC
IAL
AN
D O
PE
RA
TIN
G R
EV
IEW
CO
RP
OR
AT
E G
OV
ER
NA
NC
EF
INA
NC
IAL
ST
AT
EM
EN
TS
AD
DIT
ION
AL
IN
FO
RM
AT
ION
2. SIGNIFICANT ACCOUNTING POLICIES (continued)
2.18 Provisions and contingenciesProvisions are recognised when the Group has a present legal or constructive obligation as a result of past events, it is probable that
an outflow of economic resources will be required to settle the obligation, and a reliable estimate of the amount of the obligation can
be made. Where the Group expects a provision to be reimbursed, for example under an insurance contract held, the reimbursement
is recognised as a separate asset only when the reimbursement is virtually certain.
The Group recognises a provision for onerous contracts when the expected benefits to be derived from a contract are less than the
unavoidable costs of meeting the obligations under the contract.
Contingencies are disclosed if material and if there is a possible future obligation as a result of a past event, or if there is a present
obligation as a result of a past event, but either a payment is not probable or the amount cannot be reliably estimated.
2.19 LeasesLeases, where a significant portion of the risks and rewards of ownership is retained by the Group as a lessor, are classified as operating
leases. Assets subject to such leases are included in property, plant and equipment or investment property, and are depreciated to
their residual values over their estimated useful lives. Rentals from such leases are credited to the consolidated income statement
on a straight-line basis over the period of the relevant lease. Payments made by the Group as lessee under operating leases (net of
any incentives received from the lessor) are charged to the consolidated income statement on a straight-line basis over the period
of the relevant lease. The Group classifies amounts paid to acquire leasehold land either as an operating lease prepayment or as a
component of property, plant and equipment or investment property depending on whether substantially all the risks and rewards
incidental to the ownership of the land are transferred to the Group.
There are not any freehold land interests in Hong Kong. The Group classifies the amounts paid to acquire leasehold land under
operating leases and finance leases as operating lease prepayments and property, plant and equipment or investment property
respectively. Operating lease prepayments are included within “Other assets”. Amortisation is calculated to write off the cost of the
land on a straight-line basis over the terms of the lease.
2.20 Share capitalOrdinary shares are classified in equity when there is not any obligation to transfer cash or other assets to the holders.
Share issue costs
Incremental external costs directly attributable to the issue of new shares are shown in equity as a deduction, net of tax, from the
proceeds of the issue.
Dividends
Interim dividends on ordinary shares are recognised when they have been paid. Final dividends on ordinary shares are recognised
when they have been approved by shareholders.
2.21 Presentation of the consolidated statement of financial positionThe Group’s insurance and investment contract liabilities and related assets are realised and settled over periods of several years,
reflecting the long-term nature of the Group’s products. Accordingly, the Group presents the assets and liabilities in its consolidated
statement of financial position in approximate order of liquidity, rather than distinguishing current and non-current assets and
liabilities. The Group regards its intangible assets, investments in associates and joint ventures, property, plant and equipment,
investment property and deferred acquisition and origination costs as non-current assets as these are held for the longer-term use
of the Group.
FINANCIAL STATEMENTS
| AIA GROUP LIMITED14 8
NOTES TO THE CONSOLIDATED FINANCIAL STATEMENTS AND SIGNIFICANT ACCOUNTING POLICIES
2. SIGNIFICANT ACCOUNTING POLICIES (continued)
2.22 Earnings per shareBasic earnings per share is calculated by dividing net profit available to ordinary shareholders by the weighted average number of
ordinary shares in issue during the year.
Earnings per share has also been calculated on the operating profit before adjusting items, attributable to ordinary shareholders, as
the Directors believe this figure provides a better indication of operating performance.
For diluted earnings per share, the weighted average number of ordinary shares in issue is adjusted to assume conversion of all
dilutive potential ordinary shares, such as share options awarded to employees.
Potential or contingent share issuances are treated as dilutive when their conversion to shares would decrease net earnings per
share.
2.23 Fiduciary activitiesAssets and income arising from fiduciary activities, together with related undertakings to return such assets to customers, are
excluded from these consolidated financial statements where the Group does not have contractual rights to the assets and acts in a
fiduciary capacity such as nominee, trustee or agent.
2.24 Consolidated statement of cash flowThe consolidated statement of cash flow presents movements in cash and cash equivalents and bank overdrafts as shown in the
consolidated statement of financial position.
Purchases and sales of financial investments are included in operating cash flows as the purchases are funded from cash flows
associated with the origination of insurance and investment contracts, net of payments of related benefits and claims. Purchases and
sales of investment property are included within cash flows from investing activities.
2.25 Related party transactionsTransactions with related parties are recorded at amounts mutually agreed and transacted between the parties to the arrangement.
3. CRITICAL ACCOUNTING ESTIMATES AND JUDGEMENTSThe Group makes estimates and assumptions that affect the reported amounts of assets, liabilities, and revenue and expenses. All
estimates are based on management’s knowledge of current facts and circumstances, assumptions based on that knowledge and
predictions of future events and actions. Actual results can always differ from those estimates, possibly significantly.
Items that are considered particularly sensitive to changes in estimates and assumptions, and the relevant accounting policies are
those which relate to product classification, insurance contract liabilities (including liabilities in respect of investment contracts with
DPF), deferred acquisition and origination costs, liability adequacy testing, fair value of financial assets, impairment of financial assets
and impairment of goodwill and other intangible assets.
3.1 Product classificationThe Group issues contracts that transfer insurance risk or financial risk or both. Insurance contracts are those contracts that transfer
significant insurance risk, while investment contracts are those contracts without significant insurance risk. The Group exercises
significant judgement to determine whether there is a scenario (other than those lacking commercial substance) in which an insured
event would require the Group to pay significant additional benefits to its customers. In the event the Group has to pay significant
additional benefits to its customers, the contract is accounted for as an insurance contract. The judgements exercised in determining
the level of insurance risk in product classification affect the amounts recognised in the consolidated financial statements as insurance
and investment contract liabilities and deferred acquisition and origination costs. The accounting policy on product classification is
described in note 2.4.
ANNUAL REPORT 2015 | 149
OV
ER
VIE
WF
INA
NC
IAL
AN
D O
PE
RA
TIN
G R
EV
IEW
CO
RP
OR
AT
E G
OV
ER
NA
NC
EF
INA
NC
IAL
ST
AT
EM
EN
TS
AD
DIT
ION
AL
IN
FO
RM
AT
ION
3. CRITICAL ACCOUNTING ESTIMATES AND JUDGEMENTS (continued)
3.2 Insurance contract liabilities (including liabilities in respect of investment contracts with DPF)The Group calculates the insurance contract liabilities for traditional life insurance using a net level premium valuation method,
whereby the liability represents the present value of estimated future policy benefits to be paid, less the present value of estimated
future net premiums to be collected from policyholders. This method uses best estimate assumptions at inception adjusted for
a provision for the risk of adverse deviation for mortality, morbidity, expected investment yields, policyholder dividends (for other
participating business), surrenders and expenses set at the policy inception date. These assumptions remain locked in thereafter,
unless a deficiency arises on liability adequacy testing. Interest rate assumptions can vary by geographical market, year of issuance
and product. Mortality, surrender and expense assumptions are based on actual experience by each geographical market, modified to
allow for variations in policy form. The Group exercises significant judgement in making appropriate assumptions.
For contracts with an explicit account balance, such as universal life and unit-linked contracts, insurance contract liabilities represent
the accumulation value, which represents premiums received and investment returns credited to the policy less deductions for
mortality and morbidity costs and expense charges. Significant judgement is exercised in making appropriate estimates of gross
profits which are based on historical and anticipated future experiences, these estimates are regularly reviewed by the Group.
The Group accounts for insurance contract liabilities for participating business written in participating funds by establishing a liability
for the present value of guaranteed benefits less estimated future net premiums to be collected from policyholders. In addition, an
insurance liability is recorded for the proportion of the net assets of the participating funds that would be allocated to policyholders
assuming all relevant surplus at the date of the consolidated statement of financial position were to be declared as a policyholder
dividend based upon applicable regulations. Establishing these liabilities requires the exercise of significant judgement. In addition,
the assumption that all relevant performance is declared as a policyholder dividend may not be borne out in practice. The Group
accounts for other participating business by establishing a liability for the present value of guaranteed benefits and non-guaranteed
participation, less estimated future net premiums to be collected from policyholders.
The judgements exercised in the valuation of insurance contract liabilities (including investment contracts with DPF) affect the
amounts recognised in the consolidated financial statements as insurance contract benefits and insurance contract liabilities. Further
details of the related accounting policy, key risk and variables, and the sensitivities of assumptions to the key variables in respect of
insurance contract liabilities are provided in notes 2.4, 26 and 28.
3.3 Deferred acquisition and origination costsThe judgements exercised in the deferral and amortisation of acquisition and origination costs affect amounts recognised in the
consolidated financial statements as deferred acquisition and origination costs and insurance and investment contract benefits.
As noted in note 2.4.1, deferred acquisition costs for traditional life insurance and annuity policies are amortised over the expected
life of the contracts as a constant percentage of expected premiums. Expected premiums are estimated at the date of policy issue
and are applied consistently throughout the life of the contract unless a deficiency occurs when performing liability adequacy testing.
As noted in note 2.4.1, deferred acquisition costs for universal life and unit-linked contracts are amortised over the expected life of
the contracts based on a constant percentage of the present value of estimated gross profits expected to be realised over the life of
the contract or on a straight-line basis. As noted in note 3.2, significant judgement is exercised in making appropriate estimates of
gross profits. The expensing of acquisition costs is accelerated following adverse investment performance. Likewise, in periods of
favourable investment performance, previously expensed acquisition costs are reversed, not exceeding the amount initially deferred.
Additional details of deferred acquisition and origination costs are provided in notes 2.4 and 19.
3.4 Liability adequacy testingThe Group evaluates the adequacy of its insurance and investment contract liabilities with DPF at least annually. Significant judgement
is exercised in determining the level of aggregation at which liability adequacy testing is performed and in selecting best estimate
assumptions. Liability adequacy is assessed by portfolio of contracts in accordance with the Group’s manner of acquiring, servicing and
measuring the profitability of its insurance contracts. The Group performs liability adequacy testing separately for each geographical
market in which it operates.
The judgements exercised in liability adequacy testing affect amounts recognised in the consolidated financial statements as
commission and other acquisition expenses, deferred acquisition costs, insurance contract benefits and insurance and investment
contract liabilities.
FINANCIAL STATEMENTS
| AIA GROUP LIMITED150
NOTES TO THE CONSOLIDATED FINANCIAL STATEMENTS AND SIGNIFICANT ACCOUNTING POLICIES
3. CRITICAL ACCOUNTING ESTIMATES AND JUDGEMENTS (continued)
3.5 Fair values of financial assetsThe Group determines the fair values of financial assets traded in active markets using quoted bid prices as of each reporting date.
The fair values of financial assets that are not traded in active markets are typically determined using a variety of other valuation
techniques, such as prices observed in recent transactions and values obtained from current bid prices of comparable investments.
More judgement is used in measuring the fair value of financial assets for which market observable prices are not available or are
available only infrequently.
The degree of judgement used in measuring the fair value of financial instruments generally correlates with the level of pricing
observability. Pricing observability is affected by a number of factors, including the type of financial instrument, whether the financial
instrument is new to the market and not yet established, the characteristics specific to the transaction and general market conditions.
Changes in the fair value of financial assets held by the Group’s participating funds affect not only the value of financial assets, but are
also reflected in corresponding movements in insurance and investment contract liabilities. This is due to an insurance liability being
recorded for the proportion of the net assets of the participating funds that would be allocated to policyholders if all relevant surplus
at the date of the consolidated statement of financial position were to be declared as a policyholder dividend based on current local
regulations. Both of the foregoing changes are reflected in the consolidated income statement.
Changes in the fair value of financial assets held to back the Group’s unit-linked contracts result in a corresponding change in
insurance and investment contract liabilities. Both of the foregoing changes are also reflected in the consolidated income statement.
Further details of the fair value of financial assets and the sensitivity analysis to interest rates and equity prices are provided in notes
22 and 37.
3.6 Impairment of financial assetsFinancial assets, other than those at fair value through profit or loss, are assessed for impairment regularly. This requires the exercise
of significant judgement. The Group assesses at each reporting date whether there is objective evidence that a financial asset or a
group of financial assets is impaired. Objective evidence that a financial asset, or group of assets, is impaired includes observable data
that comes to the attention of the Group about the following events:
• significant financial difficulty of the issuer or debtor;
• a breach of contract, such as a default or delinquency in payments;
• it becomes probable that the issuer or debtor will enter bankruptcy or other financial reorganisation;
• the disappearance of an active market for that financial asset because of financial difficulties; or
• observable data, including market prices, indicating that there is a potential decrease in the estimated future cash flows since the
initial recognition of those assets, including:
– adverse changes in the payment status of issuers; or
– national or local economic conditions that correlate with increased default risk.
For loans and receivables, impairment loss is determined using an analytical method based on knowledge of each loan group or
receivable. The method is usually based on historical statistics, adjusted for trends in the group of financial assets or individual
accounts.
Further details of the impairment of financial assets during the year are provided in note 24.
3.7 Impairment of goodwill and other intangible assetsFor the purposes of impairment testing, goodwill and other intangible assets are grouped into cash-generating units. These assets are
tested for impairment by comparing the carrying amount of the cash-generating unit, including goodwill, to the recoverable amount
of that cash-generating unit. The determination of the recoverable amount requires significant judgement regarding the selection of
appropriate valuation techniques and assumptions. Further details of the impairment of goodwill during the year are provided in note
13.
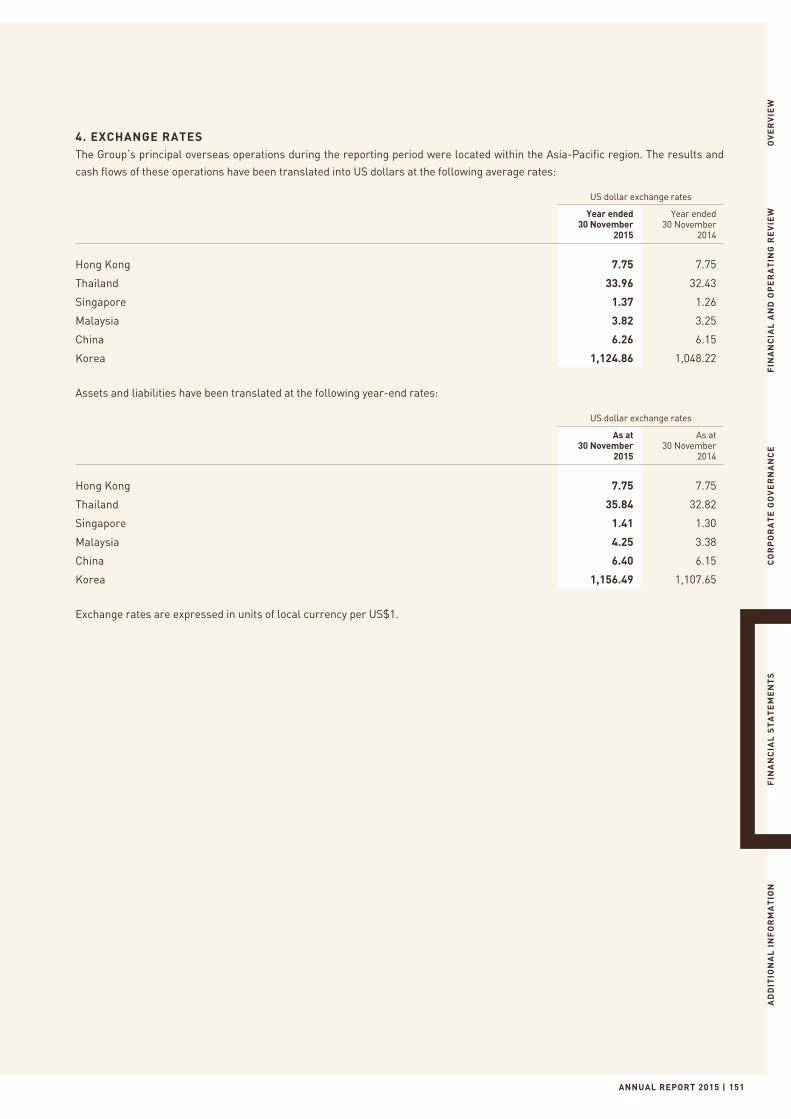
ANNUAL REPORT 2015 | 151
OV
ER
VIE
WF
INA
NC
IAL
AN
D O
PE
RA
TIN
G R
EV
IEW
CO
RP
OR
AT
E G
OV
ER
NA
NC
EF
INA
NC
IAL
ST
AT
EM
EN
TS
AD
DIT
ION
AL
IN
FO
RM
AT
ION
4. EXCHANGE RATESThe Group’s principal overseas operations during the reporting period were located within the Asia-Pacific region. The results and
cash flows of these operations have been translated into US dollars at the following average rates:
US dollar exchange rates
Year ended30 November
2015
Year ended30 November
2014
Hong Kong 7.75 7.75
Thailand 33.96 32.43
Singapore 1.37 1.26
Malaysia 3.82 3.25
China 6.26 6.15
Korea 1,124.86 1,048.22
Assets and liabilities have been translated at the following year-end rates:
US dollar exchange rates
As at30 November
2015
As at30 November
2014
Hong Kong 7.75 7.75
Thailand 35.84 32.82
Singapore 1.41 1.30
Malaysia 4.25 3.38
China 6.40 6.15
Korea 1,156.49 1,107.65
Exchange rates are expressed in units of local currency per US$1.
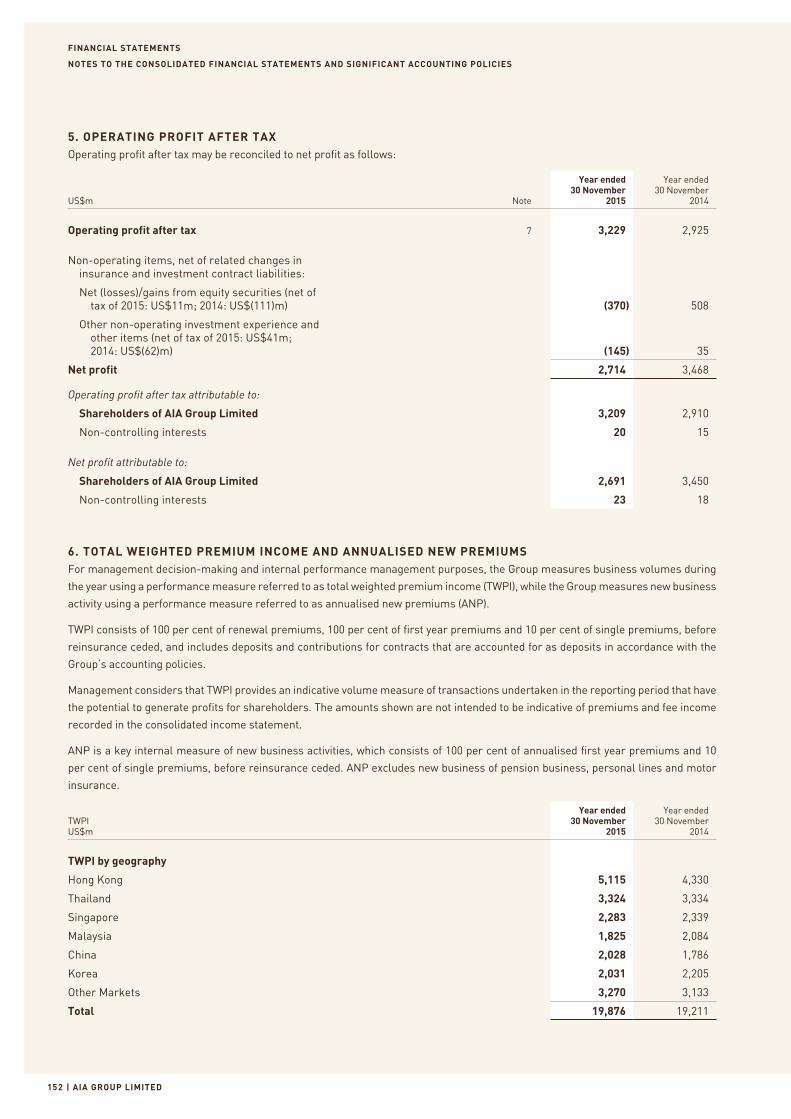
FINANCIAL STATEMENTS
| AIA GROUP LIMITED152
NOTES TO THE CONSOLIDATED FINANCIAL STATEMENTS AND SIGNIFICANT ACCOUNTING POLICIES
5. OPERATING PROFIT AFTER TAXOperating profit after tax may be reconciled to net profit as follows:
US$m Note
Year ended30 November
2015
Year ended30 November
2014
Operating profit after tax 7 3,229 2,925
Non-operating items, net of related changes in insurance and investment contract liabilities:
Net (losses)/gains from equity securities (net of tax of 2015: US$11m; 2014: US$(111)m) (370) 508
Other non-operating investment experience and other items (net of tax of 2015: US$41m; 2014: US$(62)m) (145) 35
Net profit 2,714 3,468
Operating profit after tax attributable to:
Shareholders of AIA Group Limited 3,209 2,910
Non-controlling interests 20 15
Net profit attributable to:
Shareholders of AIA Group Limited 2,691 3,450
Non-controlling interests 23 18
6. TOTAL WEIGHTED PREMIUM INCOME AND ANNUALISED NEW PREMIUMSFor management decision-making and internal performance management purposes, the Group measures business volumes during
the year using a performance measure referred to as total weighted premium income (TWPI), while the Group measures new business
activity using a performance measure referred to as annualised new premiums (ANP).
TWPI consists of 100 per cent of renewal premiums, 100 per cent of first year premiums and 10 per cent of single premiums, before
reinsurance ceded, and includes deposits and contributions for contracts that are accounted for as deposits in accordance with the
Group’s accounting policies.
Management considers that TWPI provides an indicative volume measure of transactions undertaken in the reporting period that have
the potential to generate profits for shareholders. The amounts shown are not intended to be indicative of premiums and fee income
recorded in the consolidated income statement.
ANP is a key internal measure of new business activities, which consists of 100 per cent of annualised first year premiums and 10
per cent of single premiums, before reinsurance ceded. ANP excludes new business of pension business, personal lines and motor
insurance.
TWPIUS$m
Year ended30 November
2015
Year ended30 November
2014
TWPI by geography
Hong Kong 5,115 4,330
Thailand 3,324 3,334
Singapore 2,283 2,339
Malaysia 1,825 2,084
China 2,028 1,786
Korea 2,031 2,205
Other Markets 3,270 3,133
Total 19,876 19,211
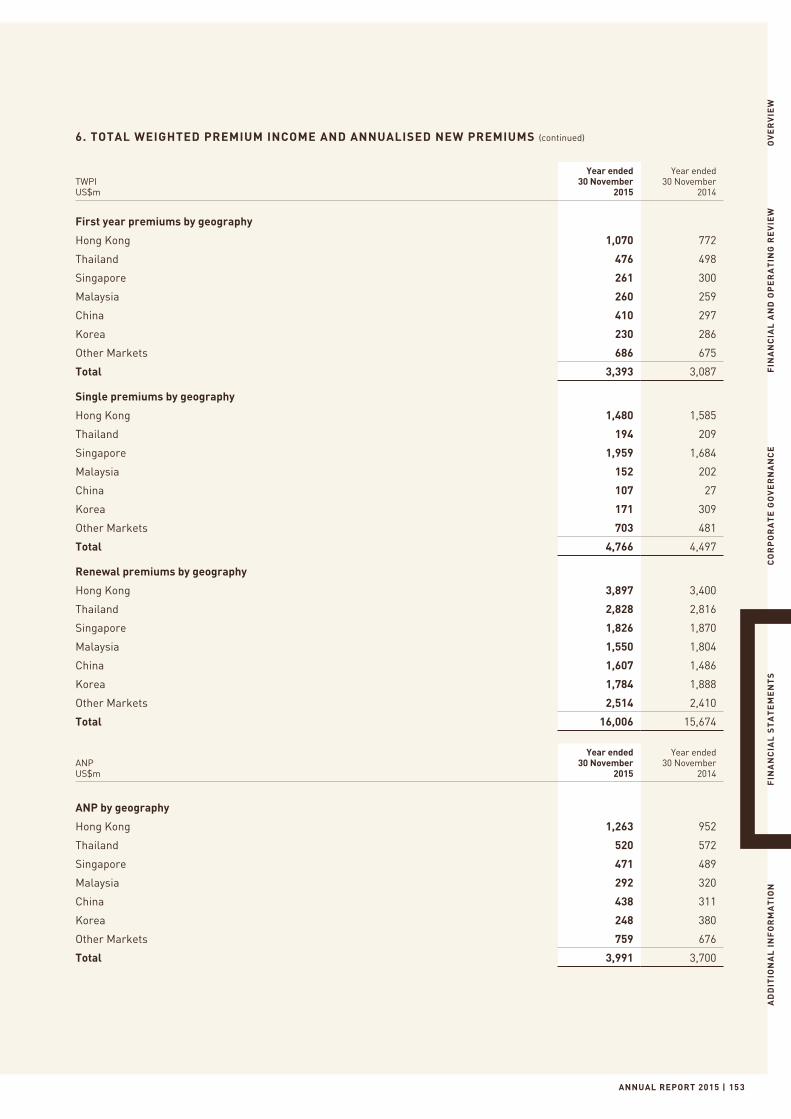
ANNUAL REPORT 2015 | 153
OV
ER
VIE
WF
INA
NC
IAL
AN
D O
PE
RA
TIN
G R
EV
IEW
CO
RP
OR
AT
E G
OV
ER
NA
NC
EF
INA
NC
IAL
ST
AT
EM
EN
TS
AD
DIT
ION
AL
IN
FO
RM
AT
ION
6. TOTAL WEIGHTED PREMIUM INCOME AND ANNUALISED NEW PREMIUMS (continued)
TWPIUS$m
Year ended30 November
2015
Year ended30 November
2014
First year premiums by geography
Hong Kong 1,070 772
Thailand 476 498
Singapore 261 300
Malaysia 260 259
China 410 297
Korea 230 286
Other Markets 686 675
Total 3,393 3,087
Single premiums by geography
Hong Kong 1,480 1,585
Thailand 194 209
Singapore 1,959 1,684
Malaysia 152 202
China 107 27
Korea 171 309
Other Markets 703 481
Total 4,766 4,497
Renewal premiums by geography
Hong Kong 3,897 3,400
Thailand 2,828 2,816
Singapore 1,826 1,870
Malaysia 1,550 1,804
China 1,607 1,486
Korea 1,784 1,888
Other Markets 2,514 2,410
Total 16,006 15,674
ANPUS$m
Year ended30 November
2015
Year ended30 November
2014
ANP by geography
Hong Kong 1,263 952
Thailand 520 572
Singapore 471 489
Malaysia 292 320
China 438 311
Korea 248 380
Other Markets 759 676
Total 3,991 3,700
FINANCIAL STATEMENTS
| AIA GROUP LIMITED15 4
NOTES TO THE CONSOLIDATED FINANCIAL STATEMENTS AND SIGNIFICANT ACCOUNTING POLICIES
7. SEGMENT INFORMATIONThe Group’s operating segments, based on the reports received by the ExCo, are each of the geographical markets in which the
Group operates. Each of the reportable segments, other than the “Group Corporate Centre” segment, writes life insurance business,
providing life insurance, accident and health insurance and savings plans to customers in its local market, and distributes related
investment and other financial services products. The reportable segments are Hong Kong (including Macau), Thailand, Singapore
(including Brunei), Malaysia, China, Korea, Other Markets and Group Corporate Centre. Other Markets includes the Group’s operations
in Australia, Indonesia, New Zealand, the Philippines, Sri Lanka, Taiwan, Vietnam and India. The activities of the Group Corporate
Centre segment consist of the Group’s corporate functions, shared services and eliminations of intragroup transactions.
Because each reportable segment other than the Group Corporate Centre segment focuses on serving the life insurance needs of
its local market, there are limited transactions between reportable segments. The key performance indicators reported in respect of
each segment are:
• ANP;
• TWPI;
• investment income (excluding investment income in respect of unit-linked contracts);
• operating expenses;
• operating profit after tax attributable to shareholders of AIA Group Limited;
• expense ratio, measured as operating expenses divided by TWPI;
• operating margin, measured as operating profit before tax expressed as a percentage of TWPI; and
• operating return on shareholders’ allocated equity, measured as operating profit after tax attributable to shareholders of AIA
Group Limited expressed as a percentage of the simple average of opening and closing shareholders’ allocated segment equity
(being the segment assets less segment liabilities in respect of each reportable segment less non-controlling interests, fair value
reserve and foreign currency translation reserve and others).
In presenting net capital in/(out) flows to reportable segments, capital outflows consist of dividends and profit distributions to the Group
Corporate Centre segment and capital inflows consist of capital injections into reportable segments by the Group Corporate Centre
segment. For the Group, net capital in/(out) flows reflect the net amount received from shareholders by way of capital contributions
less amounts distributed by way of dividends.
Business volumes in respect of the Group’s five largest customers are less than 30 per cent of premiums and fee income.
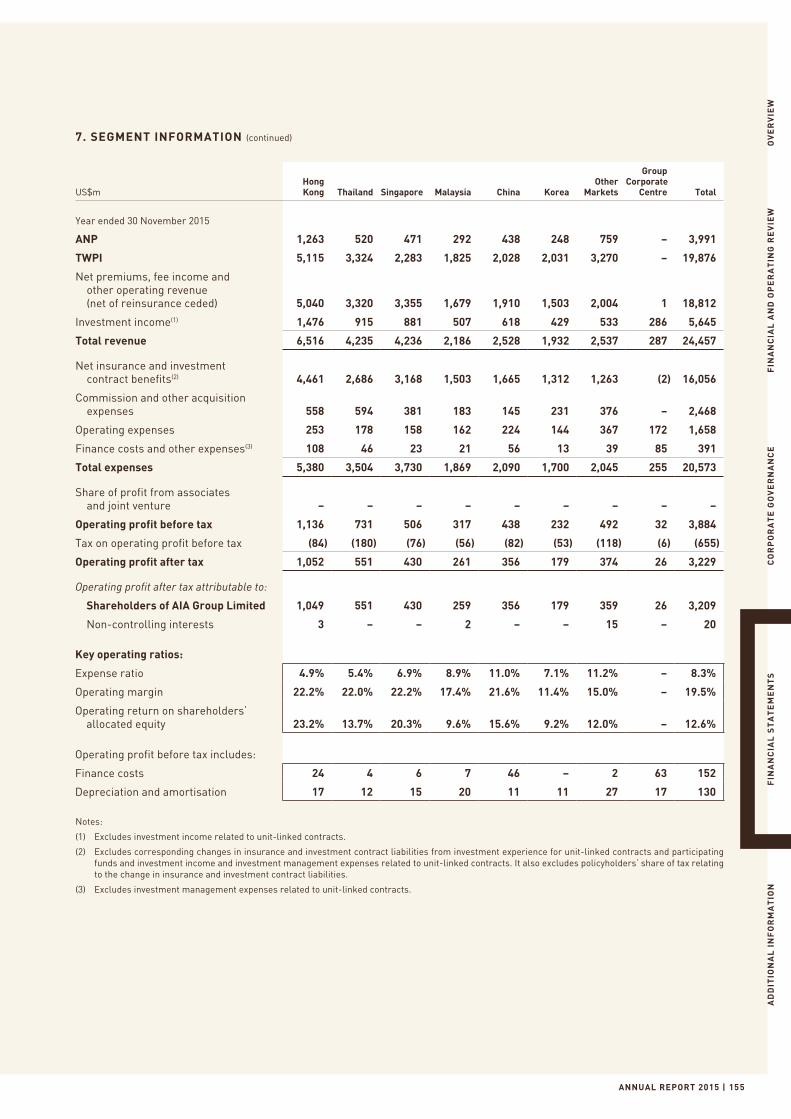
ANNUAL REPORT 2015 | 155
OV
ER
VIE
WF
INA
NC
IAL
AN
D O
PE
RA
TIN
G R
EV
IEW
CO
RP
OR
AT
E G
OV
ER
NA
NC
EF
INA
NC
IAL
ST
AT
EM
EN
TS
AD
DIT
ION
AL
IN
FO
RM
AT
ION
7. SEGMENT INFORMATION (continued)
US$mHong Kong Thailand Singapore Malaysia China Korea
Other Markets
Group Corporate
Centre Total
Year ended 30 November 2015
ANP 1,263 520 471 292 438 248 759 – 3,991
TWPI 5,115 3,324 2,283 1,825 2,028 2,031 3,270 – 19,876
Net premiums, fee income and other operating revenue (net of reinsurance ceded) 5,040 3,320 3,355 1,679 1,910 1,503 2,004 1 18,812
Investment income(1) 1,476 915 881 507 618 429 533 286 5,645
Total revenue 6,516 4,235 4,236 2,186 2,528 1,932 2,537 287 24,457
Net insurance and investment contract benefits(2) 4,461 2,686 3,168 1,503 1,665 1,312 1,263 (2) 16,056
Commission and other acquisition expenses 558 594 381 183 145 231 376 – 2,468
Operating expenses 253 178 158 162 224 144 367 172 1,658
Finance costs and other expenses(3) 108 46 23 21 56 13 39 85 391
Total expenses 5,380 3,504 3,730 1,869 2,090 1,700 2,045 255 20,573
Share of profit from associates and joint venture – – – – – – – – –
Operating profit before tax 1,136 731 506 317 438 232 492 32 3,884
Tax on operating profit before tax (84) (180) (76) (56) (82) (53) (118) (6) (655)
Operating profit after tax 1,052 551 430 261 356 179 374 26 3,229
Operating profit after tax attributable to:
Shareholders of AIA Group Limited 1,049 551 430 259 356 179 359 26 3,209
Non-controlling interests 3 – – 2 – – 15 – 20
Key operating ratios:
Expense ratio 4.9% 5.4% 6.9% 8.9% 11.0% 7.1% 11.2% – 8.3%
Operating margin 22.2% 22.0% 22.2% 17.4% 21.6% 11.4% 15.0% – 19.5%
Operating return on shareholders’ allocated equity 23.2% 13.7% 20.3% 9.6% 15.6% 9.2% 12.0% – 12.6%
Operating profit before tax includes:
Finance costs 24 4 6 7 46 – 2 63 152
Depreciation and amortisation 17 12 15 20 11 11 27 17 130
Notes:
(1) Excludes investment income related to unit-linked contracts.
(2) Excludes corresponding changes in insurance and investment contract liabilities from investment experience for unit-linked contracts and participating funds and investment income and investment management expenses related to unit-linked contracts. It also excludes policyholders’ share of tax relating to the change in insurance and investment contract liabilities.
(3) Excludes investment management expenses related to unit-linked contracts.
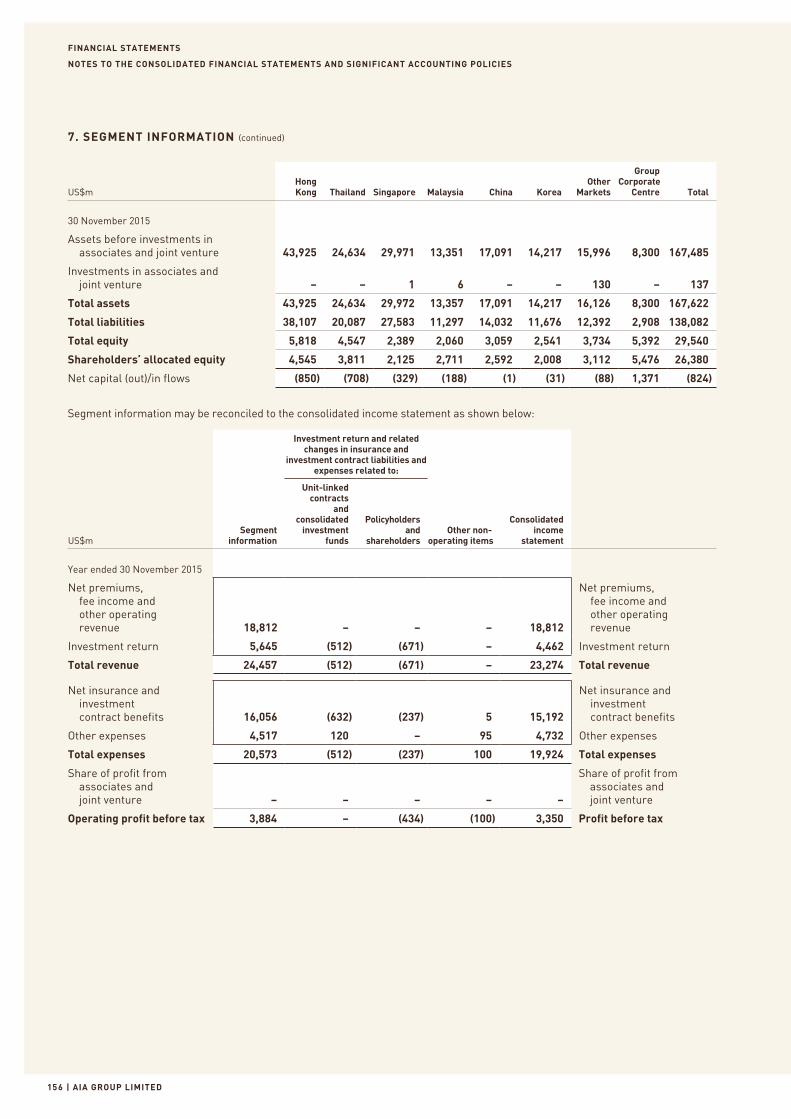
FINANCIAL STATEMENTS
| AIA GROUP LIMITED156
NOTES TO THE CONSOLIDATED FINANCIAL STATEMENTS AND SIGNIFICANT ACCOUNTING POLICIES
7. SEGMENT INFORMATION (continued)
US$mHong Kong Thailand Singapore Malaysia China Korea
Other Markets
Group Corporate
Centre Total
30 November 2015
Assets before investments in associates and joint venture 43,925 24,634 29,971 13,351 17,091 14,217 15,996 8,300 167,485
Investments in associates and joint venture – – 1 6 – – 130 – 137
Total assets 43,925 24,634 29,972 13,357 17,091 14,217 16,126 8,300 167,622
Total liabilities 38,107 20,087 27,583 11,297 14,032 11,676 12,392 2,908 138,082
Total equity 5,818 4,547 2,389 2,060 3,059 2,541 3,734 5,392 29,540
Shareholders’ allocated equity 4,545 3,811 2,125 2,711 2,592 2,008 3,112 5,476 26,380
Net capital (out)/in flows (850) (708) (329) (188) (1) (31) (88) 1,371 (824)
Segment information may be reconciled to the consolidated income statement as shown below:
US$mSegment
information
Investment return and related changes in insurance and
investment contract liabilities and expenses related to:
Other non-operating items
Consolidated income
statement
Unit-linked contracts
and consolidated
investment funds
Policyholders and
shareholders
Year ended 30 November 2015
Net premiums, fee income and other operating revenue 18,812 – – – 18,812
Net premiums, fee income and other operating revenue
Investment return 5,645 (512) (671) – 4,462 Investment return
Total revenue 24,457 (512) (671) – 23,274 Total revenue
Net insurance and investment contract benefits 16,056 (632) (237) 5 15,192
Net insurance and investment contract benefits
Other expenses 4,517 120 – 95 4,732 Other expenses
Total expenses 20,573 (512) (237) 100 19,924 Total expenses
Share of profit from associates and joint venture – – – – –
Share of profit from associates and joint venture
Operating profit before tax 3,884 – (434) (100) 3,350 Profit before tax
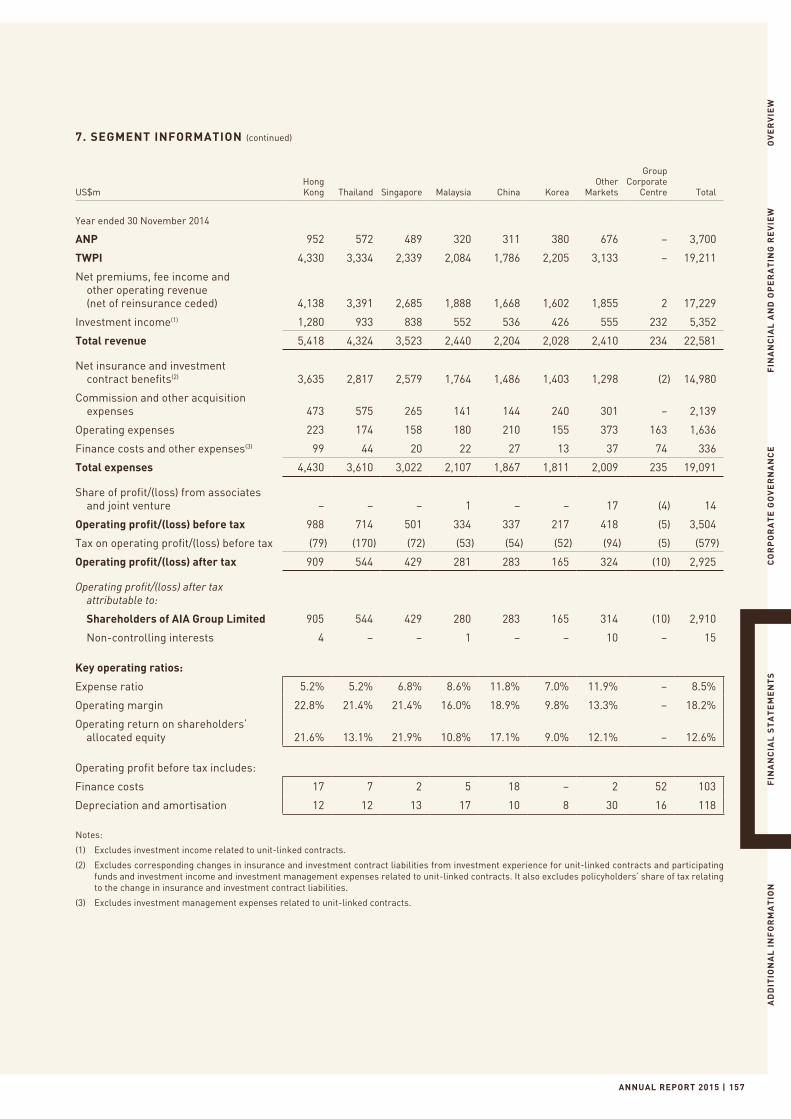
ANNUAL REPORT 2015 | 157
OV
ER
VIE
WF
INA
NC
IAL
AN
D O
PE
RA
TIN
G R
EV
IEW
CO
RP
OR
AT
E G
OV
ER
NA
NC
EF
INA
NC
IAL
ST
AT
EM
EN
TS
AD
DIT
ION
AL
IN
FO
RM
AT
ION
7. SEGMENT INFORMATION (continued)
US$mHong Kong Thailand Singapore Malaysia China Korea
Other Markets
Group Corporate
Centre Total
Year ended 30 November 2014
ANP 952 572 489 320 311 380 676 – 3,700
TWPI 4,330 3,334 2,339 2,084 1,786 2,205 3,133 – 19,211
Net premiums, fee income and other operating revenue (net of reinsurance ceded) 4,138 3,391 2,685 1,888 1,668 1,602 1,855 2 17,229
Investment income(1) 1,280 933 838 552 536 426 555 232 5,352
Total revenue 5,418 4,324 3,523 2,440 2,204 2,028 2,410 234 22,581
Net insurance and investment contract benefits(2) 3,635 2,817 2,579 1,764 1,486 1,403 1,298 (2) 14,980
Commission and other acquisition expenses 473 575 265 141 144 240 301 – 2,139
Operating expenses 223 174 158 180 210 155 373 163 1,636
Finance costs and other expenses(3) 99 44 20 22 27 13 37 74 336
Total expenses 4,430 3,610 3,022 2,107 1,867 1,811 2,009 235 19,091
Share of profit/(loss) from associates and joint venture – – – 1 – – 17 (4) 14
Operating profit/(loss) before tax 988 714 501 334 337 217 418 (5) 3,504
Tax on operating profit/(loss) before tax (79) (170) (72) (53) (54) (52) (94) (5) (579)
Operating profit/(loss) after tax 909 544 429 281 283 165 324 (10) 2,925
Operating profit/(loss) after tax attributable to:
Shareholders of AIA Group Limited 905 544 429 280 283 165 314 (10) 2,910
Non-controlling interests 4 – – 1 – – 10 – 15
Key operating ratios:
Expense ratio 5.2% 5.2% 6.8% 8.6% 11.8% 7.0% 11.9% – 8.5%
Operating margin 22.8% 21.4% 21.4% 16.0% 18.9% 9.8% 13.3% – 18.2%
Operating return on shareholders’ allocated equity 21.6% 13.1% 21.9% 10.8% 17.1% 9.0% 12.1% – 12.6%
Operating profit before tax includes:
Finance costs 17 7 2 5 18 – 2 52 103
Depreciation and amortisation 12 12 13 17 10 8 30 16 118
Notes:
(1) Excludes investment income related to unit-linked contracts.
(2) Excludes corresponding changes in insurance and investment contract liabilities from investment experience for unit-linked contracts and participating funds and investment income and investment management expenses related to unit-linked contracts. It also excludes policyholders’ share of tax relating to the change in insurance and investment contract liabilities.
(3) Excludes investment management expenses related to unit-linked contracts.
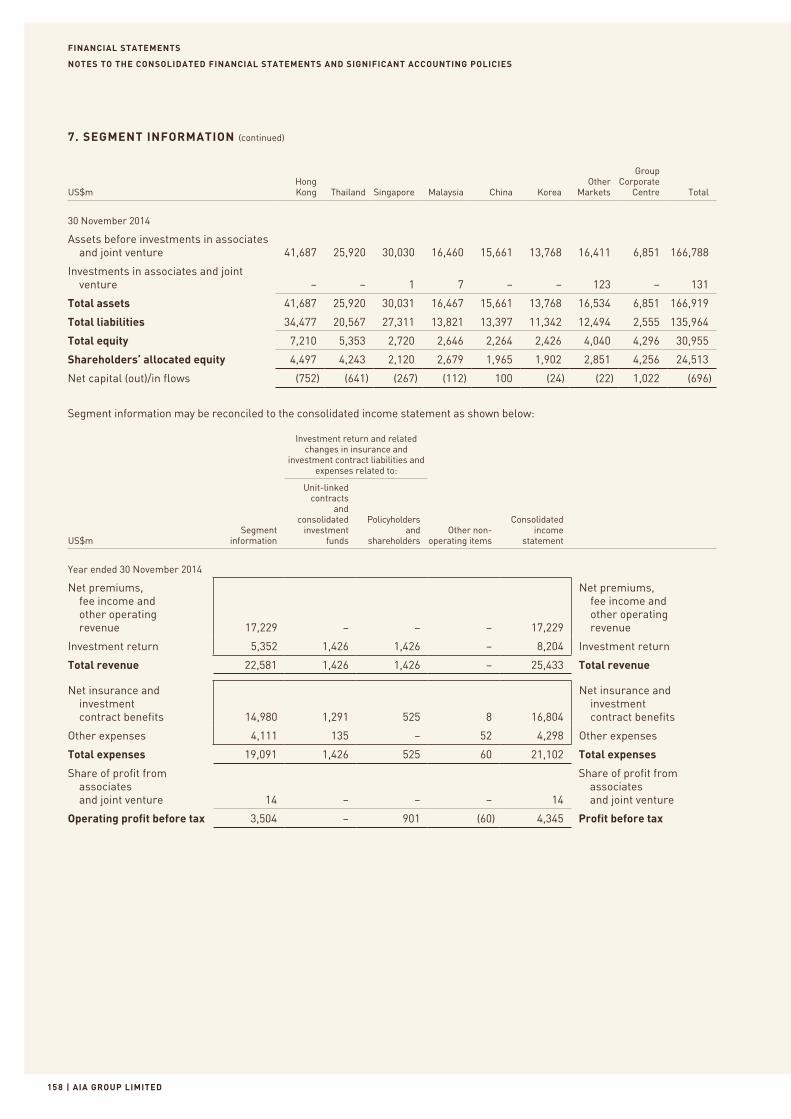
FINANCIAL STATEMENTS
| AIA GROUP LIMITED158
NOTES TO THE CONSOLIDATED FINANCIAL STATEMENTS AND SIGNIFICANT ACCOUNTING POLICIES
7. SEGMENT INFORMATION (continued)
US$mHong Kong Thailand Singapore Malaysia China Korea
Other Markets
Group Corporate
Centre Total
30 November 2014
Assets before investments in associates and joint venture 41,687 25,920 30,030 16,460 15,661 13,768 16,411 6,851 166,788
Investments in associates and joint venture – – 1 7 – – 123 – 131
Total assets 41,687 25,920 30,031 16,467 15,661 13,768 16,534 6,851 166,919
Total liabilities 34,477 20,567 27,311 13,821 13,397 11,342 12,494 2,555 135,964
Total equity 7,210 5,353 2,720 2,646 2,264 2,426 4,040 4,296 30,955
Shareholders’ allocated equity 4,497 4,243 2,120 2,679 1,965 1,902 2,851 4,256 24,513
Net capital (out)/in flows (752) (641) (267) (112) 100 (24) (22) 1,022 (696)
Segment information may be reconciled to the consolidated income statement as shown below:
US$mSegment
information
Investment return and related changes in insurance and
investment contract liabilities and expenses related to:
Other non-operating items
Consolidated income
statement
Unit-linked contracts
and consolidated
investment funds
Policyholders and
shareholders
Year ended 30 November 2014
Net premiums, fee income and other operating revenue 17,229 – – – 17,229
Net premiums, fee income and other operating revenue
Investment return 5,352 1,426 1,426 – 8,204 Investment return
Total revenue 22,581 1,426 1,426 – 25,433 Total revenue
Net insurance and investment contract benefits 14,980 1,291 525 8 16,804
Net insurance and investment contract benefits
Other expenses 4,111 135 – 52 4,298 Other expenses
Total expenses 19,091 1,426 525 60 21,102 Total expenses
Share of profit from associates and joint venture 14 – – – 14
Share of profit from associates and joint venture
Operating profit before tax 3,504 – 901 (60) 4,345 Profit before tax
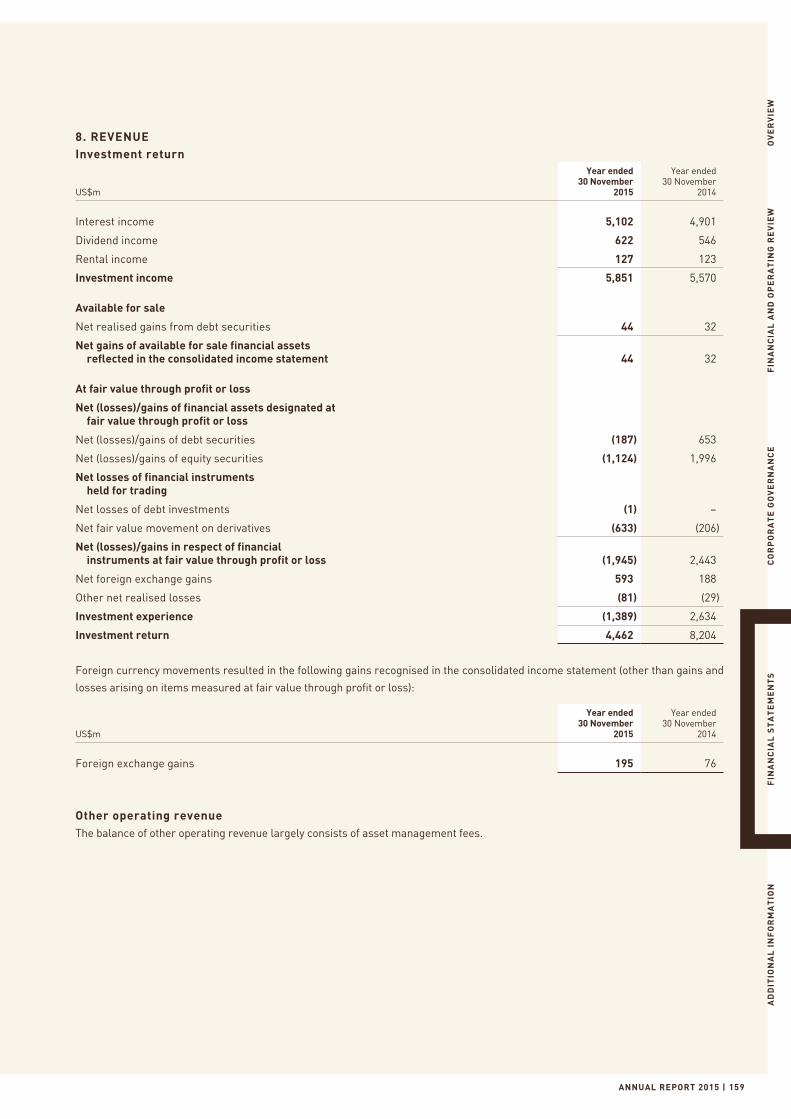
ANNUAL REPORT 2015 | 159
OV
ER
VIE
WF
INA
NC
IAL
AN
D O
PE
RA
TIN
G R
EV
IEW
CO
RP
OR
AT
E G
OV
ER
NA
NC
EF
INA
NC
IAL
ST
AT
EM
EN
TS
AD
DIT
ION
AL
IN
FO
RM
AT
ION
8. REVENUEInvestment return
US$m
Year ended30 November
2015
Year ended30 November
2014
Interest income 5,102 4,901
Dividend income 622 546
Rental income 127 123
Investment income 5,851 5,570
Available for sale
Net realised gains from debt securities 44 32
Net gains of available for sale financial assets reflected in the consolidated income statement 44 32
At fair value through profit or loss
Net (losses)/gains of financial assets designated at fair value through profit or loss
Net (losses)/gains of debt securities (187) 653
Net (losses)/gains of equity securities (1,124) 1,996
Net losses of financial instruments held for trading
Net losses of debt investments (1) –
Net fair value movement on derivatives (633) (206)
Net (losses)/gains in respect of financial instruments at fair value through profit or loss (1,945) 2,443
Net foreign exchange gains 593 188
Other net realised losses (81) (29)
Investment experience (1,389) 2,634
Investment return 4,462 8,204
Foreign currency movements resulted in the following gains recognised in the consolidated income statement (other than gains and
losses arising on items measured at fair value through profit or loss):
US$m
Year ended30 November
2015
Year ended30 November
2014
Foreign exchange gains 195 76
Other operating revenueThe balance of other operating revenue largely consists of asset management fees.
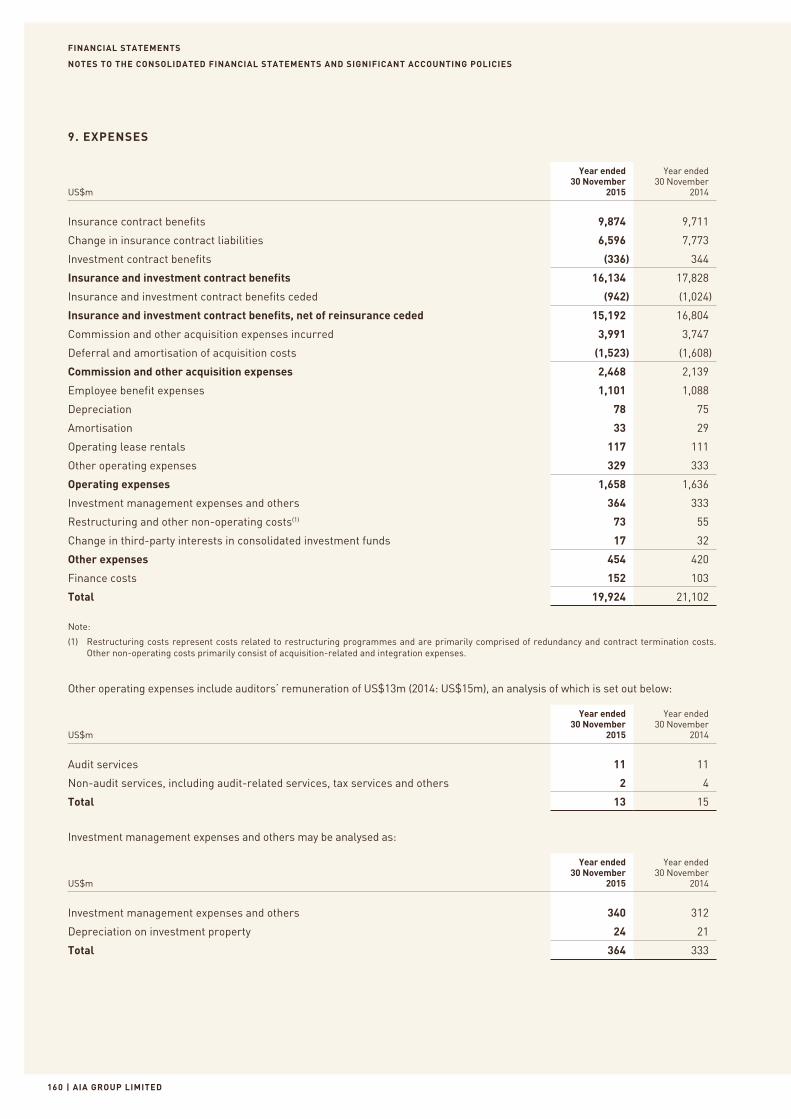
FINANCIAL STATEMENTS
| AIA GROUP LIMITED160
NOTES TO THE CONSOLIDATED FINANCIAL STATEMENTS AND SIGNIFICANT ACCOUNTING POLICIES
9. EXPENSES
US$m
Year ended30 November
2015
Year ended30 November
2014
Insurance contract benefits 9,874 9,711
Change in insurance contract liabilities 6,596 7,773
Investment contract benefits (336) 344
Insurance and investment contract benefits 16,134 17,828
Insurance and investment contract benefits ceded (942) (1,024)
Insurance and investment contract benefits, net of reinsurance ceded 15,192 16,804
Commission and other acquisition expenses incurred 3,991 3,747
Deferral and amortisation of acquisition costs (1,523) (1,608)
Commission and other acquisition expenses 2,468 2,139
Employee benefit expenses 1,101 1,088
Depreciation 78 75
Amortisation 33 29
Operating lease rentals 117 111
Other operating expenses 329 333
Operating expenses 1,658 1,636
Investment management expenses and others 364 333
Restructuring and other non-operating costs(1) 73 55
Change in third-party interests in consolidated investment funds 17 32
Other expenses 454 420
Finance costs 152 103
Total 19,924 21,102
Note:
(1) Restructuring costs represent costs related to restructuring programmes and are primarily comprised of redundancy and contract termination costs. Other non-operating costs primarily consist of acquisition-related and integration expenses.
Other operating expenses include auditors’ remuneration of US$13m (2014: US$15m), an analysis of which is set out below:
US$m
Year ended30 November
2015
Year ended30 November
2014
Audit services 11 11
Non-audit services, including audit-related services, tax services and others 2 4
Total 13 15
Investment management expenses and others may be analysed as:
US$m
Year ended30 November
2015
Year ended30 November
2014
Investment management expenses and others 340 312
Depreciation on investment property 24 21
Total 364 333
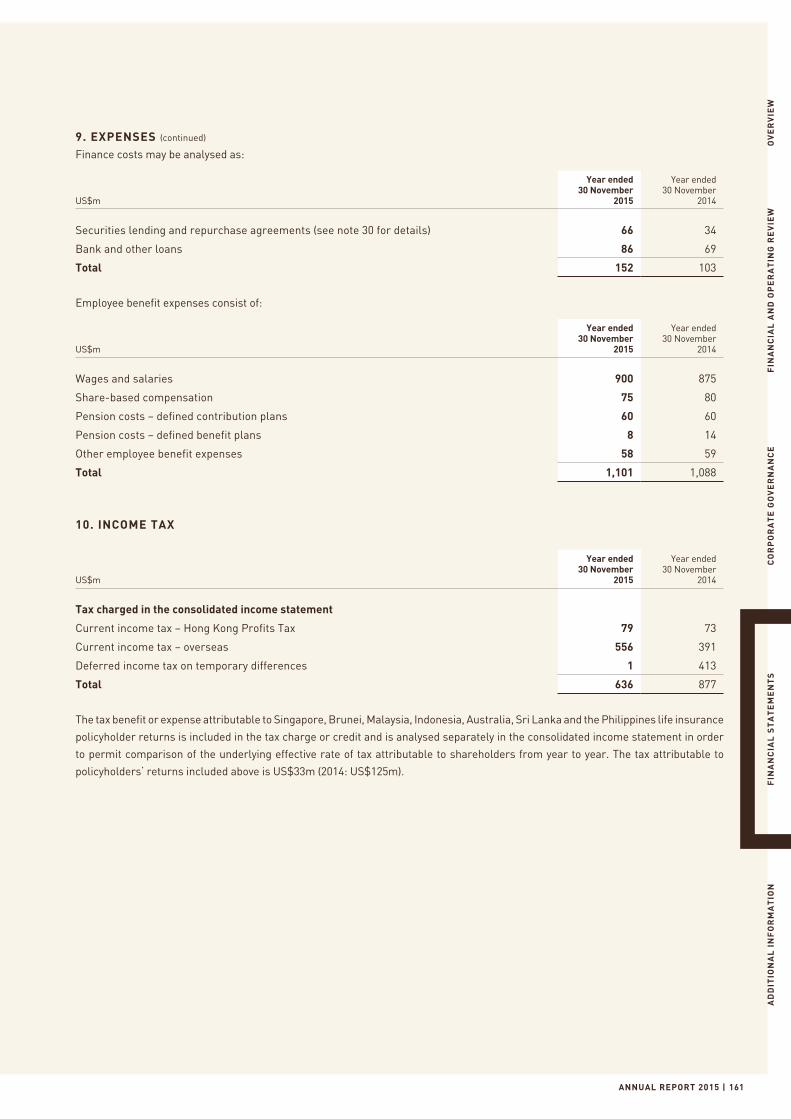
ANNUAL REPORT 2015 | 161
OV
ER
VIE
WF
INA
NC
IAL
AN
D O
PE
RA
TIN
G R
EV
IEW
CO
RP
OR
AT
E G
OV
ER
NA
NC
EF
INA
NC
IAL
ST
AT
EM
EN
TS
AD
DIT
ION
AL
IN
FO
RM
AT
ION
9. EXPENSES (continued)
Finance costs may be analysed as:
US$m
Year ended30 November
2015
Year ended30 November
2014
Securities lending and repurchase agreements (see note 30 for details) 66 34
Bank and other loans 86 69
Total 152 103
Employee benefit expenses consist of:
US$m
Year ended30 November
2015
Year ended30 November
2014
Wages and salaries 900 875
Share-based compensation 75 80
Pension costs – defined contribution plans 60 60
Pension costs – defined benefit plans 8 14
Other employee benefit expenses 58 59
Total 1,101 1,088
10. INCOME TAX
US$m
Year ended30 November
2015
Year ended30 November
2014
Tax charged in the consolidated income statement
Current income tax – Hong Kong Profits Tax 79 73
Current income tax – overseas 556 391
Deferred income tax on temporary differences 1 413
Total 636 877
The tax benefit or expense attributable to Singapore, Brunei, Malaysia, Indonesia, Australia, Sri Lanka and the Philippines life insurance
policyholder returns is included in the tax charge or credit and is analysed separately in the consolidated income statement in order
to permit comparison of the underlying effective rate of tax attributable to shareholders from year to year. The tax attributable to
policyholders’ returns included above is US$33m (2014: US$125m).
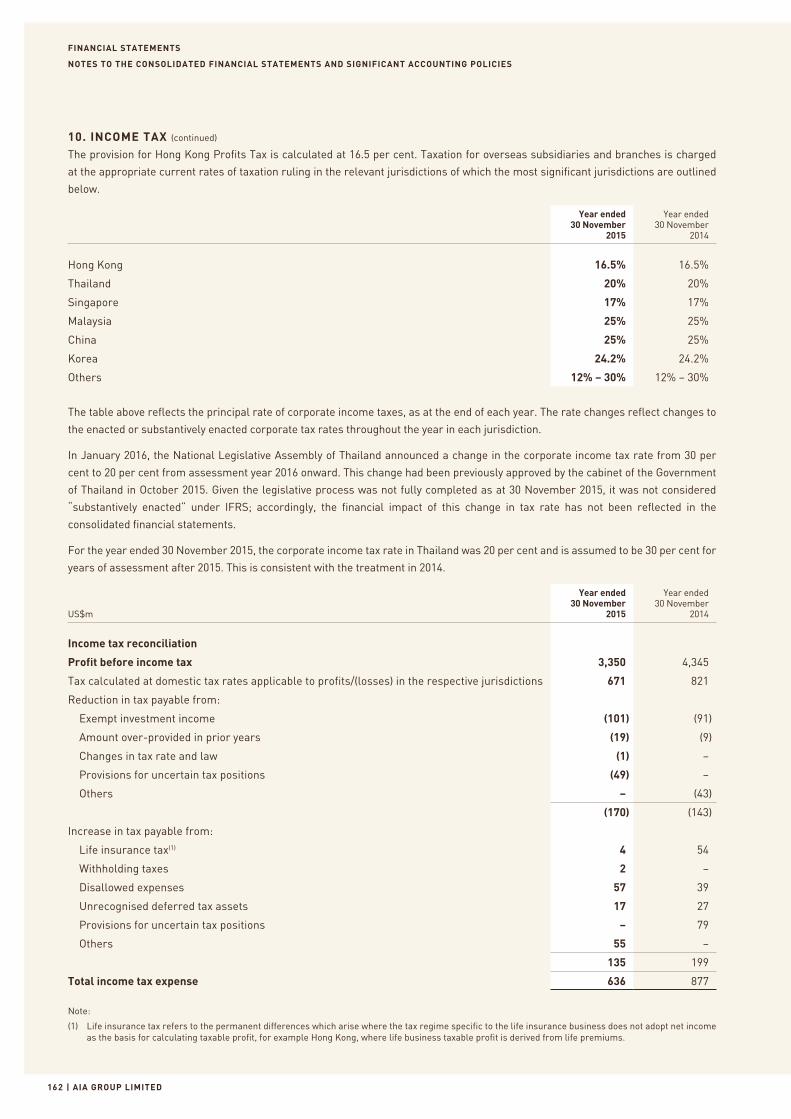
FINANCIAL STATEMENTS
| AIA GROUP LIMITED162
NOTES TO THE CONSOLIDATED FINANCIAL STATEMENTS AND SIGNIFICANT ACCOUNTING POLICIES
10. INCOME TAX (continued)
The provision for Hong Kong Profits Tax is calculated at 16.5 per cent. Taxation for overseas subsidiaries and branches is charged
at the appropriate current rates of taxation ruling in the relevant jurisdictions of which the most significant jurisdictions are outlined
below.
Year ended30 November
2015
Year ended30 November
2014
Hong Kong 16.5% 16.5%
Thailand 20% 20%
Singapore 17% 17%
Malaysia 25% 25%
China 25% 25%
Korea 24.2% 24.2%
Others 12% – 30% 12% – 30%
The table above reflects the principal rate of corporate income taxes, as at the end of each year. The rate changes reflect changes to
the enacted or substantively enacted corporate tax rates throughout the year in each jurisdiction.
In January 2016, the National Legislative Assembly of Thailand announced a change in the corporate income tax rate from 30 per
cent to 20 per cent from assessment year 2016 onward. This change had been previously approved by the cabinet of the Government
of Thailand in October 2015. Given the legislative process was not fully completed as at 30 November 2015, it was not considered “substantively enacted” under IFRS; accordingly, the financial impact of this change in tax rate has not been reflected in the
consolidated financial statements.
For the year ended 30 November 2015, the corporate income tax rate in Thailand was 20 per cent and is assumed to be 30 per cent for
years of assessment after 2015. This is consistent with the treatment in 2014.
US$m
Year ended30 November
2015
Year ended30 November
2014
Income tax reconciliation
Profit before income tax 3,350 4,345
Tax calculated at domestic tax rates applicable to profits/(losses) in the respective jurisdictions 671 821
Reduction in tax payable from:
Exempt investment income (101) (91)
Amount over-provided in prior years (19) (9)
Changes in tax rate and law (1) –
Provisions for uncertain tax positions (49) –
Others – (43)
(170) (143)
Increase in tax payable from:
Life insurance tax(1) 4 54
Withholding taxes 2 –
Disallowed expenses 57 39
Unrecognised deferred tax assets 17 27
Provisions for uncertain tax positions – 79
Others 55 –
135 199
Total income tax expense 636 877
Note:
(1) Life insurance tax refers to the permanent differences which arise where the tax regime specific to the life insurance business does not adopt net income as the basis for calculating taxable profit, for example Hong Kong, where life business taxable profit is derived from life premiums.
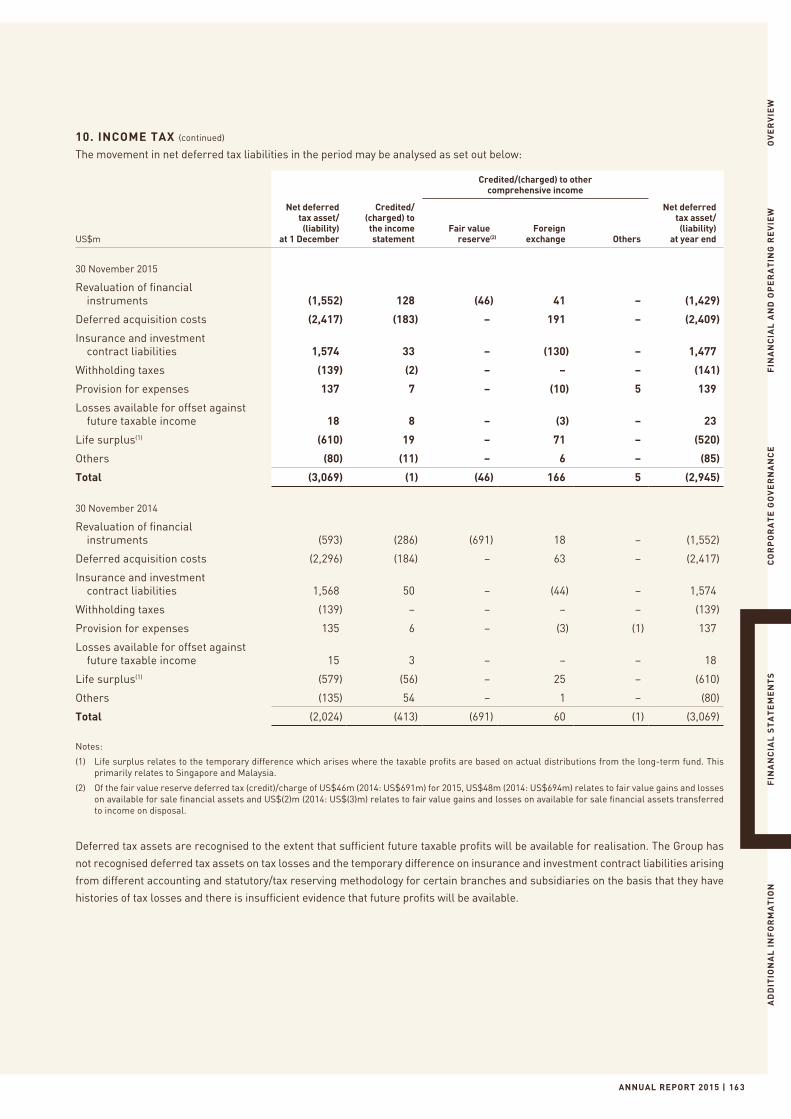
ANNUAL REPORT 2015 | 163
OV
ER
VIE
WF
INA
NC
IAL
AN
D O
PE
RA
TIN
G R
EV
IEW
CO
RP
OR
AT
E G
OV
ER
NA
NC
EF
INA
NC
IAL
ST
AT
EM
EN
TS
AD
DIT
ION
AL
IN
FO
RM
AT
ION
10. INCOME TAX (continued)
The movement in net deferred tax liabilities in the period may be analysed as set out below:
Credited/(charged) to othercomprehensive income
US$m
Net deferred tax asset/(liability)
at 1 December
Credited/(charged) to the income statement
Fair value reserve(2)
Foreign exchange Others
Net deferred tax asset/(liability)
at year end
30 November 2015
Revaluation of financial instruments (1,552) 128 (46) 41 – (1,429)
Deferred acquisition costs (2,417) (183) – 191 – (2,409)
Insurance and investment contract liabilities 1,574 33 – (130) – 1,477
Withholding taxes (139) (2) – – – (141)
Provision for expenses 137 7 – (10) 5 139
Losses available for offset against future taxable income 18 8 – (3) – 23
Life surplus(1) (610) 19 – 71 – (520)
Others (80) (11) – 6 – (85)
Total (3,069) (1) (46) 166 5 (2,945)
30 November 2014
Revaluation of financial instruments (593) (286) (691) 18 – (1,552)
Deferred acquisition costs (2,296) (184) – 63 – (2,417)
Insurance and investment contract liabilities 1,568 50 – (44) – 1,574
Withholding taxes (139) – – – – (139)
Provision for expenses 135 6 – (3) (1) 137
Losses available for offset against future taxable income 15 3 – – – 18
Life surplus(1) (579) (56) – 25 – (610)
Others (135) 54 – 1 – (80)
Total (2,024) (413) (691) 60 (1) (3,069)
Notes:
(1) Life surplus relates to the temporary difference which arises where the taxable profits are based on actual distributions from the long-term fund. This primarily relates to Singapore and Malaysia.
(2) Of the fair value reserve deferred tax (credit)/charge of US$46m (2014: US$691m) for 2015, US$48m (2014: US$694m) relates to fair value gains and losses on available for sale financial assets and US$(2)m (2014: US$(3)m) relates to fair value gains and losses on available for sale financial assets transferred to income on disposal.
Deferred tax assets are recognised to the extent that sufficient future taxable profits will be available for realisation. The Group has
not recognised deferred tax assets on tax losses and the temporary difference on insurance and investment contract liabilities arising
from different accounting and statutory/tax reserving methodology for certain branches and subsidiaries on the basis that they have
histories of tax losses and there is insufficient evidence that future profits will be available.
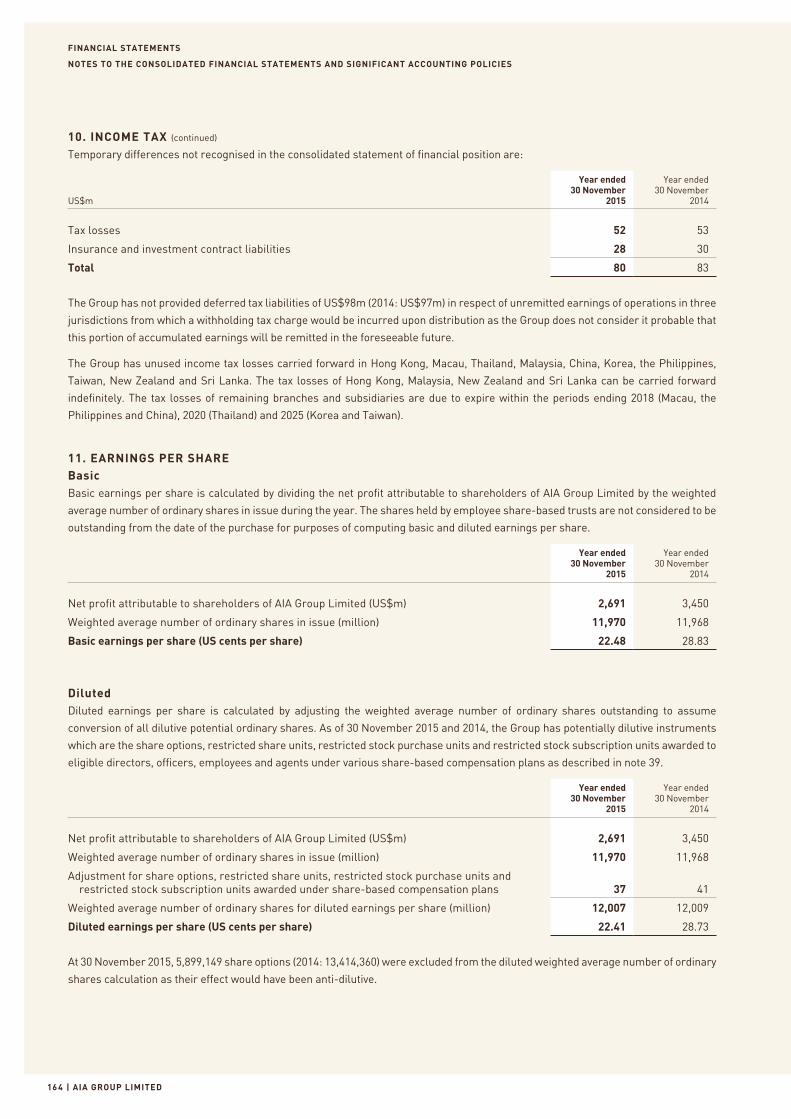
FINANCIAL STATEMENTS
| AIA GROUP LIMITED16 4
NOTES TO THE CONSOLIDATED FINANCIAL STATEMENTS AND SIGNIFICANT ACCOUNTING POLICIES
10. INCOME TAX (continued)
Temporary differences not recognised in the consolidated statement of financial position are:
US$m
Year ended30 November
2015
Year ended30 November
2014
Tax losses 52 53
Insurance and investment contract liabilities 28 30
Total 80 83
The Group has not provided deferred tax liabilities of US$98m (2014: US$97m) in respect of unremitted earnings of operations in three
jurisdictions from which a withholding tax charge would be incurred upon distribution as the Group does not consider it probable that
this portion of accumulated earnings will be remitted in the foreseeable future.
The Group has unused income tax losses carried forward in Hong Kong, Macau, Thailand, Malaysia, China, Korea, the Philippines,
Taiwan, New Zealand and Sri Lanka. The tax losses of Hong Kong, Malaysia, New Zealand and Sri Lanka can be carried forward
indefinitely. The tax losses of remaining branches and subsidiaries are due to expire within the periods ending 2018 (Macau, the
Philippines and China), 2020 (Thailand) and 2025 (Korea and Taiwan).
11. EARNINGS PER SHAREBasicBasic earnings per share is calculated by dividing the net profit attributable to shareholders of AIA Group Limited by the weighted
average number of ordinary shares in issue during the year. The shares held by employee share-based trusts are not considered to be
outstanding from the date of the purchase for purposes of computing basic and diluted earnings per share.
Year ended30 November
2015
Year ended30 November
2014
Net profit attributable to shareholders of AIA Group Limited (US$m) 2,691 3,450
Weighted average number of ordinary shares in issue (million) 11,970 11,968
Basic earnings per share (US cents per share) 22.48 28.83
DilutedDiluted earnings per share is calculated by adjusting the weighted average number of ordinary shares outstanding to assume
conversion of all dilutive potential ordinary shares. As of 30 November 2015 and 2014, the Group has potentially dilutive instruments
which are the share options, restricted share units, restricted stock purchase units and restricted stock subscription units awarded to
eligible directors, officers, employees and agents under various share-based compensation plans as described in note 39.
Year ended30 November
2015
Year ended30 November
2014
Net profit attributable to shareholders of AIA Group Limited (US$m) 2,691 3,450
Weighted average number of ordinary shares in issue (million) 11,970 11,968
Adjustment for share options, restricted share units, restricted stock purchase units and restricted stock subscription units awarded under share-based compensation plans 37 41
Weighted average number of ordinary shares for diluted earnings per share (million) 12,007 12,009
Diluted earnings per share (US cents per share) 22.41 28.73
At 30 November 2015, 5,899,149 share options (2014: 13,414,360) were excluded from the diluted weighted average number of ordinary
shares calculation as their effect would have been anti-dilutive.
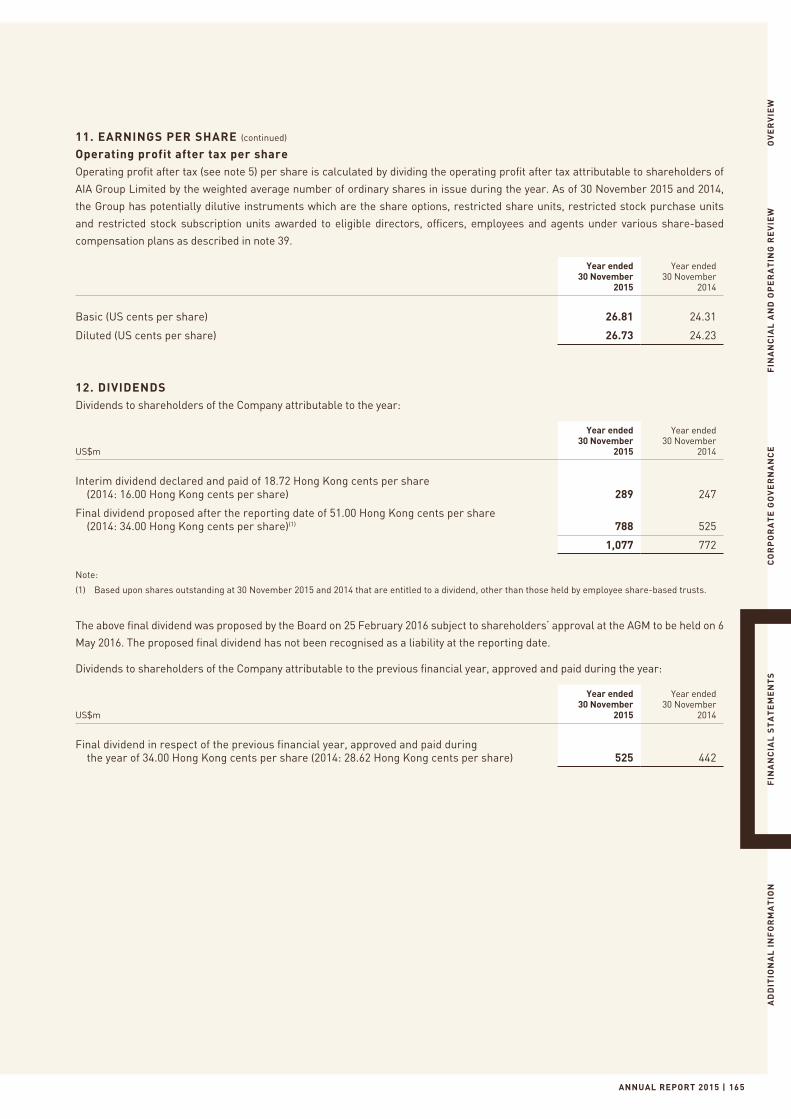
ANNUAL REPORT 2015 | 165
OV
ER
VIE
WF
INA
NC
IAL
AN
D O
PE
RA
TIN
G R
EV
IEW
CO
RP
OR
AT
E G
OV
ER
NA
NC
EF
INA
NC
IAL
ST
AT
EM
EN
TS
AD
DIT
ION
AL
IN
FO
RM
AT
ION
11. EARNINGS PER SHARE (continued)
Operating profit after tax per shareOperating profit after tax (see note 5) per share is calculated by dividing the operating profit after tax attributable to shareholders of
AIA Group Limited by the weighted average number of ordinary shares in issue during the year. As of 30 November 2015 and 2014,
the Group has potentially dilutive instruments which are the share options, restricted share units, restricted stock purchase units
and restricted stock subscription units awarded to eligible directors, officers, employees and agents under various share-based
compensation plans as described in note 39.
Year ended30 November
2015
Year ended30 November
2014
Basic (US cents per share) 26.81 24.31
Diluted (US cents per share) 26.73 24.23
12. DIVIDENDSDividends to shareholders of the Company attributable to the year:
US$m
Year ended30 November
2015
Year ended30 November
2014
Interim dividend declared and paid of 18.72 Hong Kong cents per share (2014: 16.00 Hong Kong cents per share) 289 247
Final dividend proposed after the reporting date of 51.00 Hong Kong cents per share (2014: 34.00 Hong Kong cents per share)(1) 788 525
1,077 772
Note:
(1) Based upon shares outstanding at 30 November 2015 and 2014 that are entitled to a dividend, other than those held by employee share-based trusts.
The above final dividend was proposed by the Board on 25 February 2016 subject to shareholders’ approval at the AGM to be held on 6
May 2016. The proposed final dividend has not been recognised as a liability at the reporting date.
Dividends to shareholders of the Company attributable to the previous financial year, approved and paid during the year:
US$m
Year ended30 November
2015
Year ended30 November
2014
Final dividend in respect of the previous financial year, approved and paid during the year of 34.00 Hong Kong cents per share (2014: 28.62 Hong Kong cents per share) 525 442
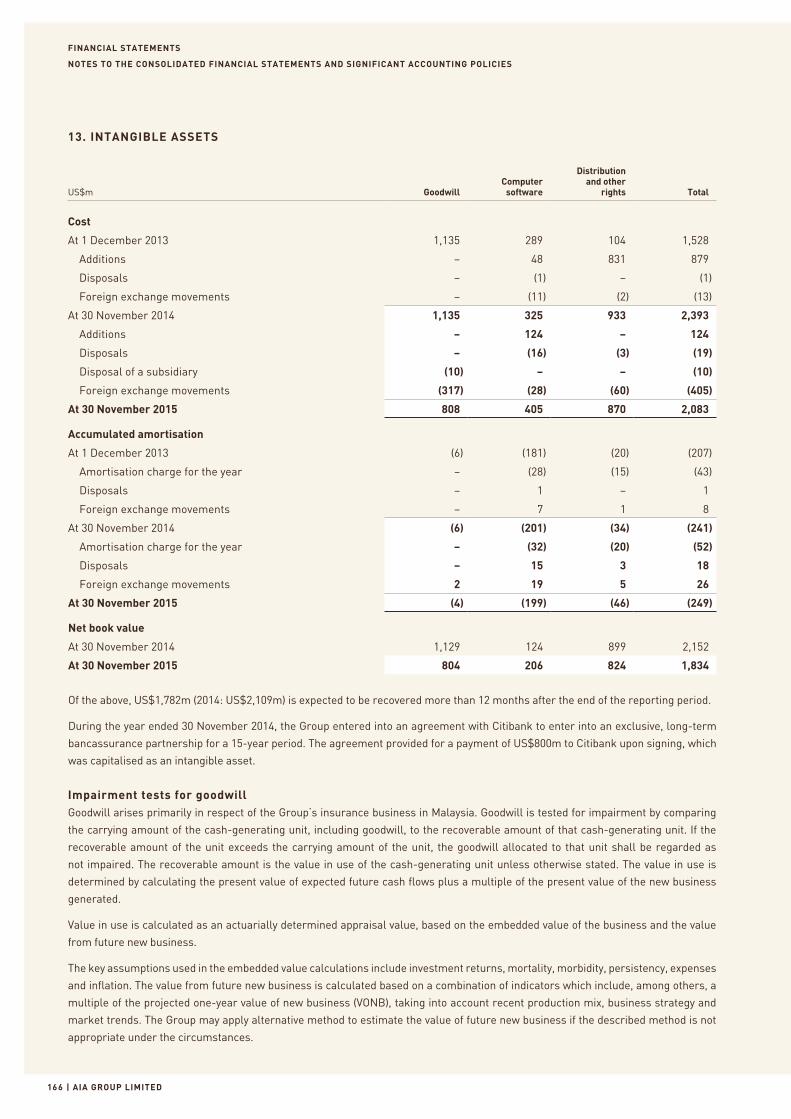
FINANCIAL STATEMENTS
| AIA GROUP LIMITED166
NOTES TO THE CONSOLIDATED FINANCIAL STATEMENTS AND SIGNIFICANT ACCOUNTING POLICIES
13. INTANGIBLE ASSETS
US$m GoodwillComputer
software
Distribution and other
rights Total
Cost
At 1 December 2013 1,135 289 104 1,528
Additions – 48 831 879
Disposals – (1) – (1)
Foreign exchange movements – (11) (2) (13)
At 30 November 2014 1,135 325 933 2,393
Additions – 124 – 124
Disposals – (16) (3) (19)
Disposal of a subsidiary (10) – – (10)
Foreign exchange movements (317) (28) (60) (405)
At 30 November 2015 808 405 870 2,083
Accumulated amortisation
At 1 December 2013 (6) (181) (20) (207)
Amortisation charge for the year – (28) (15) (43)
Disposals – 1 – 1
Foreign exchange movements – 7 1 8
At 30 November 2014 (6) (201) (34) (241)
Amortisation charge for the year – (32) (20) (52)
Disposals – 15 3 18
Foreign exchange movements 2 19 5 26
At 30 November 2015 (4) (199) (46) (249)
Net book value
At 30 November 2014 1,129 124 899 2,152
At 30 November 2015 804 206 824 1,834
Of the above, US$1,782m (2014: US$2,109m) is expected to be recovered more than 12 months after the end of the reporting period.
During the year ended 30 November 2014, the Group entered into an agreement with Citibank to enter into an exclusive, long-term
bancassurance partnership for a 15-year period. The agreement provided for a payment of US$800m to Citibank upon signing, which
was capitalised as an intangible asset.
Impairment tests for goodwillGoodwill arises primarily in respect of the Group’s insurance business in Malaysia. Goodwill is tested for impairment by comparing
the carrying amount of the cash-generating unit, including goodwill, to the recoverable amount of that cash-generating unit. If the
recoverable amount of the unit exceeds the carrying amount of the unit, the goodwill allocated to that unit shall be regarded as
not impaired. The recoverable amount is the value in use of the cash-generating unit unless otherwise stated. The value in use is
determined by calculating the present value of expected future cash flows plus a multiple of the present value of the new business
generated.
Value in use is calculated as an actuarially determined appraisal value, based on the embedded value of the business and the value
from future new business.
The key assumptions used in the embedded value calculations include investment returns, mortality, morbidity, persistency, expenses
and inflation. The value from future new business is calculated based on a combination of indicators which include, among others, a
multiple of the projected one-year value of new business (VONB), taking into account recent production mix, business strategy and
market trends. The Group may apply alternative method to estimate the value of future new business if the described method is not
appropriate under the circumstances.
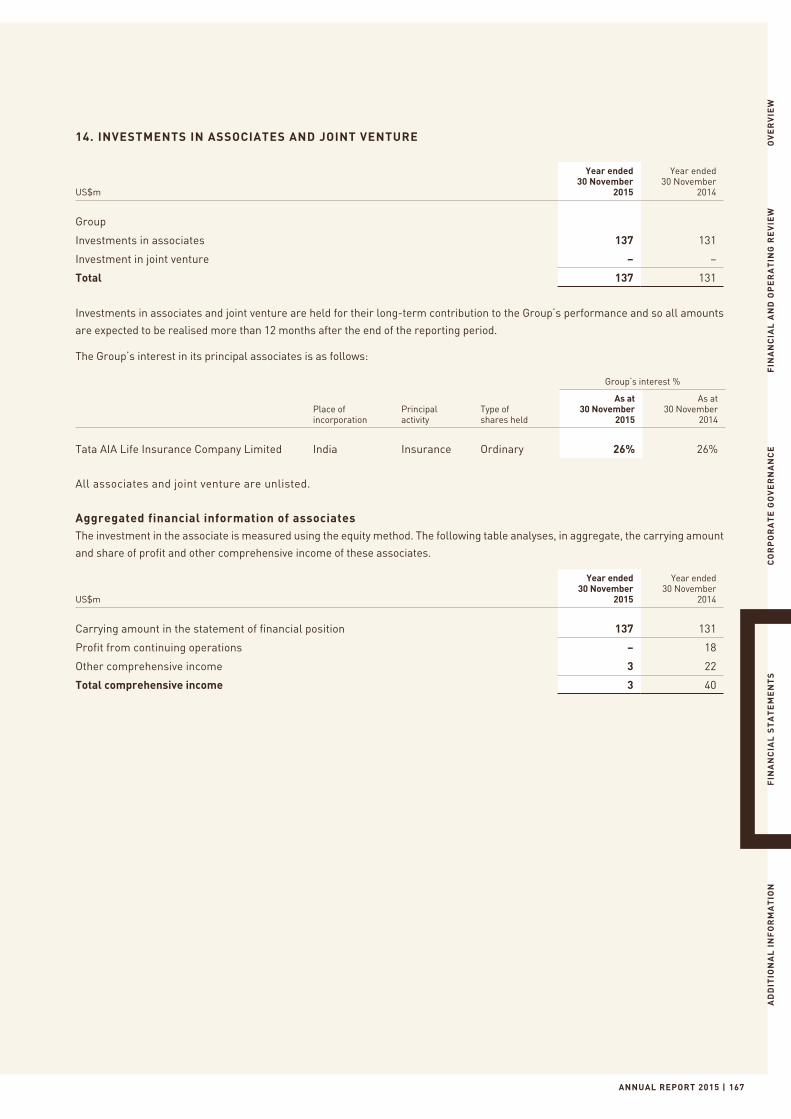
ANNUAL REPORT 2015 | 167
OV
ER
VIE
WF
INA
NC
IAL
AN
D O
PE
RA
TIN
G R
EV
IEW
CO
RP
OR
AT
E G
OV
ER
NA
NC
EF
INA
NC
IAL
ST
AT
EM
EN
TS
AD
DIT
ION
AL
IN
FO
RM
AT
ION
14. INVESTMENTS IN ASSOCIATES AND JOINT VENTURE
US$m
Year ended30 November
2015
Year ended30 November
2014
Group
Investments in associates 137 131
Investment in joint venture – –
Total 137 131
Investments in associates and joint venture are held for their long-term contribution to the Group’s performance and so all amounts
are expected to be realised more than 12 months after the end of the reporting period.
The Group’s interest in its principal associates is as follows:
Group’s interest %
Place of incorporation
Principal activity
Type of shares held
As at30 November
2015
As at30 November
2014
Tata AIA Life Insurance Company Limited India Insurance Ordinary 26% 26%
All associates and joint venture are unlisted.
Aggregated financial information of associatesThe investment in the associate is measured using the equity method. The following table analyses, in aggregate, the carrying amount
and share of profit and other comprehensive income of these associates.
US$m
Year ended30 November
2015
Year ended30 November
2014
Carrying amount in the statement of financial position 137 131
Profit from continuing operations – 18
Other comprehensive income 3 22
Total comprehensive income 3 40
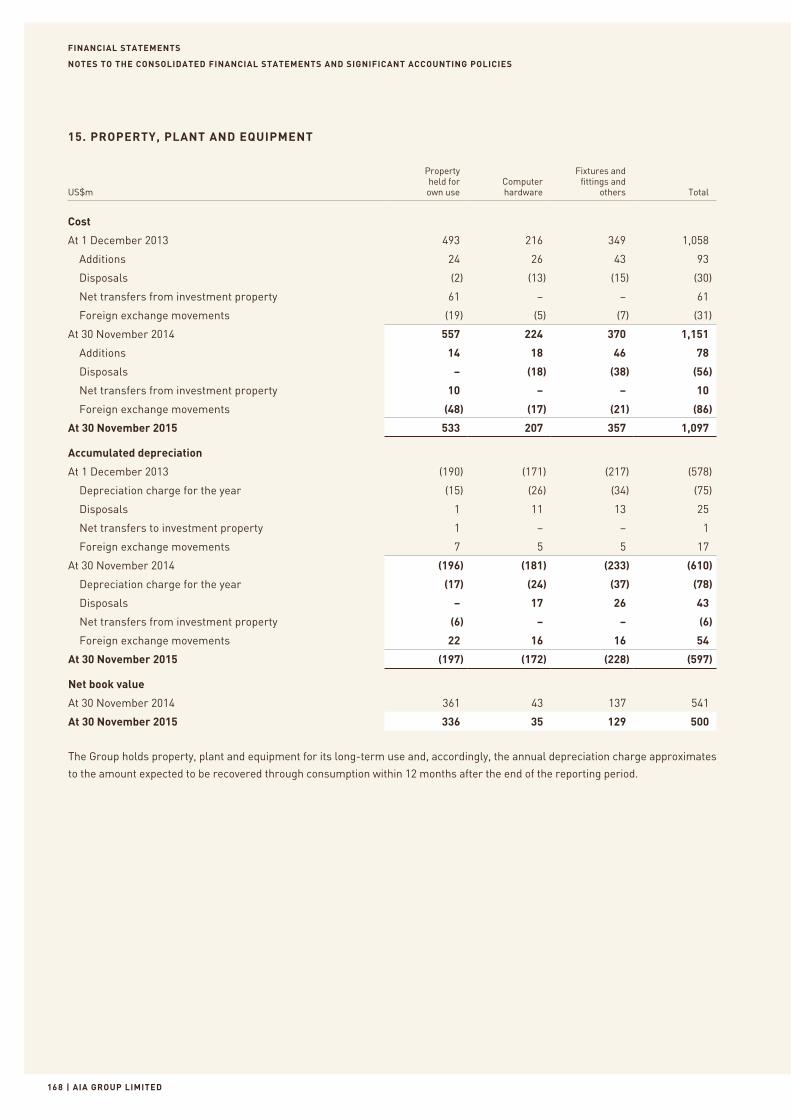
FINANCIAL STATEMENTS
| AIA GROUP LIMITED168
NOTES TO THE CONSOLIDATED FINANCIAL STATEMENTS AND SIGNIFICANT ACCOUNTING POLICIES
15. PROPERTY, PLANT AND EQUIPMENT
US$m
Propertyheld for own use
Computerhardware
Fixtures andfittings and
others Total
Cost
At 1 December 2013 493 216 349 1,058
Additions 24 26 43 93
Disposals (2) (13) (15) (30)
Net transfers from investment property 61 – – 61
Foreign exchange movements (19) (5) (7) (31)
At 30 November 2014 557 224 370 1,151
Additions 14 18 46 78
Disposals – (18) (38) (56)
Net transfers from investment property 10 – – 10
Foreign exchange movements (48) (17) (21) (86)
At 30 November 2015 533 207 357 1,097
Accumulated depreciation
At 1 December 2013 (190) (171) (217) (578)
Depreciation charge for the year (15) (26) (34) (75)
Disposals 1 11 13 25
Net transfers to investment property 1 – – 1
Foreign exchange movements 7 5 5 17
At 30 November 2014 (196) (181) (233) (610)
Depreciation charge for the year (17) (24) (37) (78)
Disposals – 17 26 43
Net transfers from investment property (6) – – (6)
Foreign exchange movements 22 16 16 54
At 30 November 2015 (197) (172) (228) (597)
Net book value
At 30 November 2014 361 43 137 541
At 30 November 2015 336 35 129 500
The Group holds property, plant and equipment for its long-term use and, accordingly, the annual depreciation charge approximates
to the amount expected to be recovered through consumption within 12 months after the end of the reporting period.
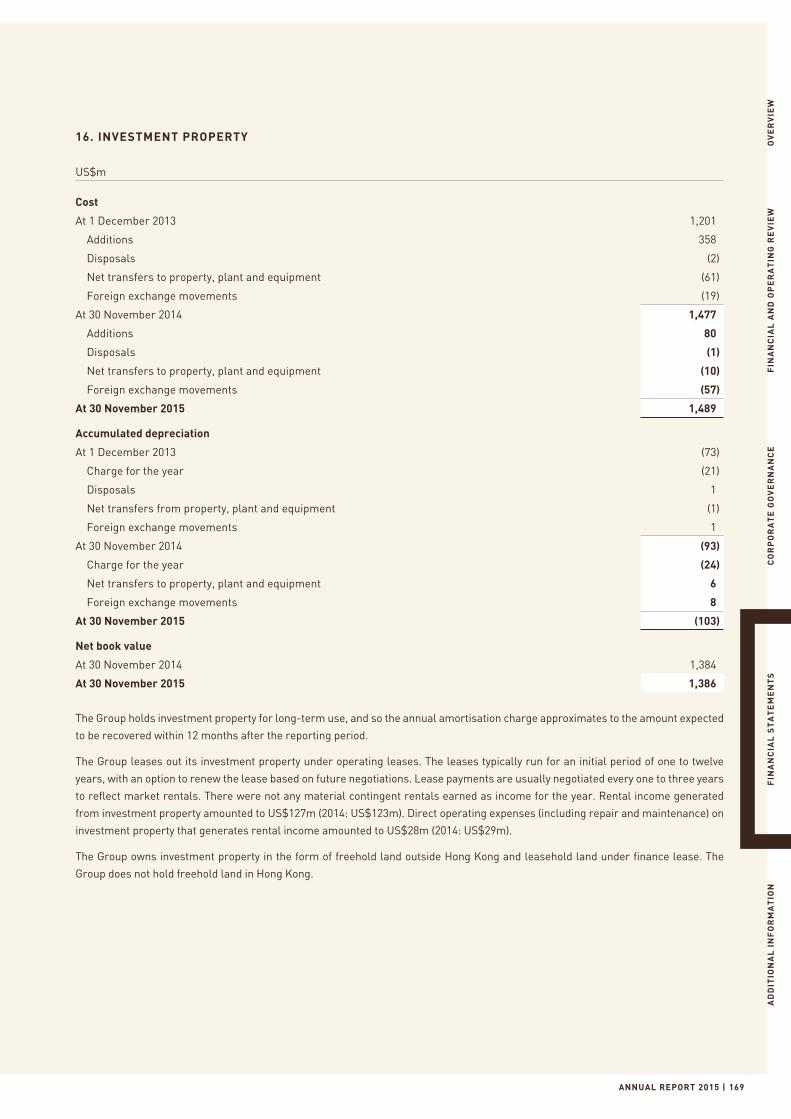
ANNUAL REPORT 2015 | 169
OV
ER
VIE
WF
INA
NC
IAL
AN
D O
PE
RA
TIN
G R
EV
IEW
CO
RP
OR
AT
E G
OV
ER
NA
NC
EF
INA
NC
IAL
ST
AT
EM
EN
TS
AD
DIT
ION
AL
IN
FO
RM
AT
ION
16. INVESTMENT PROPERTY
US$m
Cost
At 1 December 2013 1,201
Additions 358
Disposals (2)
Net transfers to property, plant and equipment (61)
Foreign exchange movements (19)
At 30 November 2014 1,477
Additions 80
Disposals (1)
Net transfers to property, plant and equipment (10)
Foreign exchange movements (57)
At 30 November 2015 1,489
Accumulated depreciation
At 1 December 2013 (73)
Charge for the year (21)
Disposals 1
Net transfers from property, plant and equipment (1)
Foreign exchange movements 1
At 30 November 2014 (93)
Charge for the year (24)
Net transfers to property, plant and equipment 6
Foreign exchange movements 8
At 30 November 2015 (103)
Net book value
At 30 November 2014 1,384
At 30 November 2015 1,386
The Group holds investment property for long-term use, and so the annual amortisation charge approximates to the amount expected
to be recovered within 12 months after the reporting period.
The Group leases out its investment property under operating leases. The leases typically run for an initial period of one to twelve
years, with an option to renew the lease based on future negotiations. Lease payments are usually negotiated every one to three years
to reflect market rentals. There were not any material contingent rentals earned as income for the year. Rental income generated
from investment property amounted to US$127m (2014: US$123m). Direct operating expenses (including repair and maintenance) on
investment property that generates rental income amounted to US$28m (2014: US$29m).
The Group owns investment property in the form of freehold land outside Hong Kong and leasehold land under finance lease. The
Group does not hold freehold land in Hong Kong.
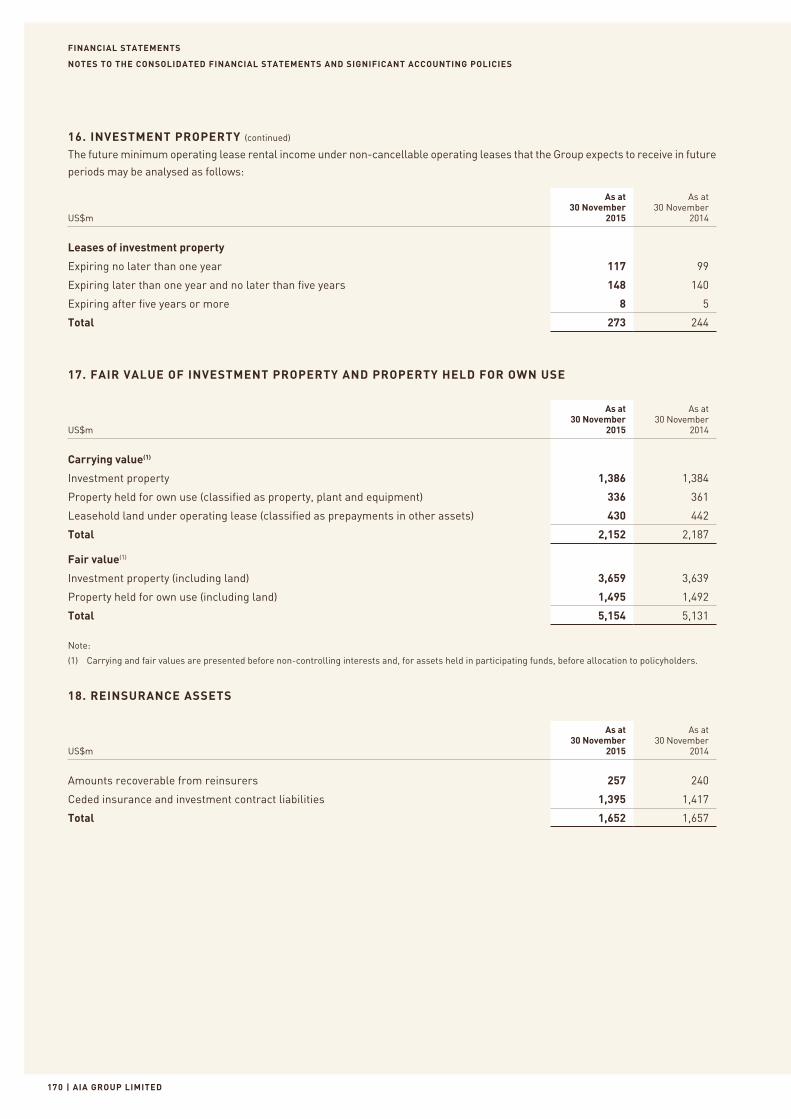
FINANCIAL STATEMENTS
| AIA GROUP LIMITED170
NOTES TO THE CONSOLIDATED FINANCIAL STATEMENTS AND SIGNIFICANT ACCOUNTING POLICIES
16. INVESTMENT PROPERTY (continued)
The future minimum operating lease rental income under non-cancellable operating leases that the Group expects to receive in future
periods may be analysed as follows:
US$m
As at30 November
2015
As at30 November
2014
Leases of investment property
Expiring no later than one year 117 99
Expiring later than one year and no later than five years 148 140
Expiring after five years or more 8 5
Total 273 244
17. FAIR VALUE OF INVESTMENT PROPERTY AND PROPERTY HELD FOR OWN USE
US$m
As at30 November
2015
As at30 November
2014
Carrying value(1)
Investment property 1,386 1,384
Property held for own use (classified as property, plant and equipment) 336 361
Leasehold land under operating lease (classified as prepayments in other assets) 430 442
Total 2,152 2,187
Fair value(1)
Investment property (including land) 3,659 3,639
Property held for own use (including land) 1,495 1,492
Total 5,154 5,131
Note:
(1) Carrying and fair values are presented before non-controlling interests and, for assets held in participating funds, before allocation to policyholders.
18. REINSURANCE ASSETS
US$m
As at30 November
2015
As at30 November
2014
Amounts recoverable from reinsurers 257 240
Ceded insurance and investment contract liabilities 1,395 1,417
Total 1,652 1,657
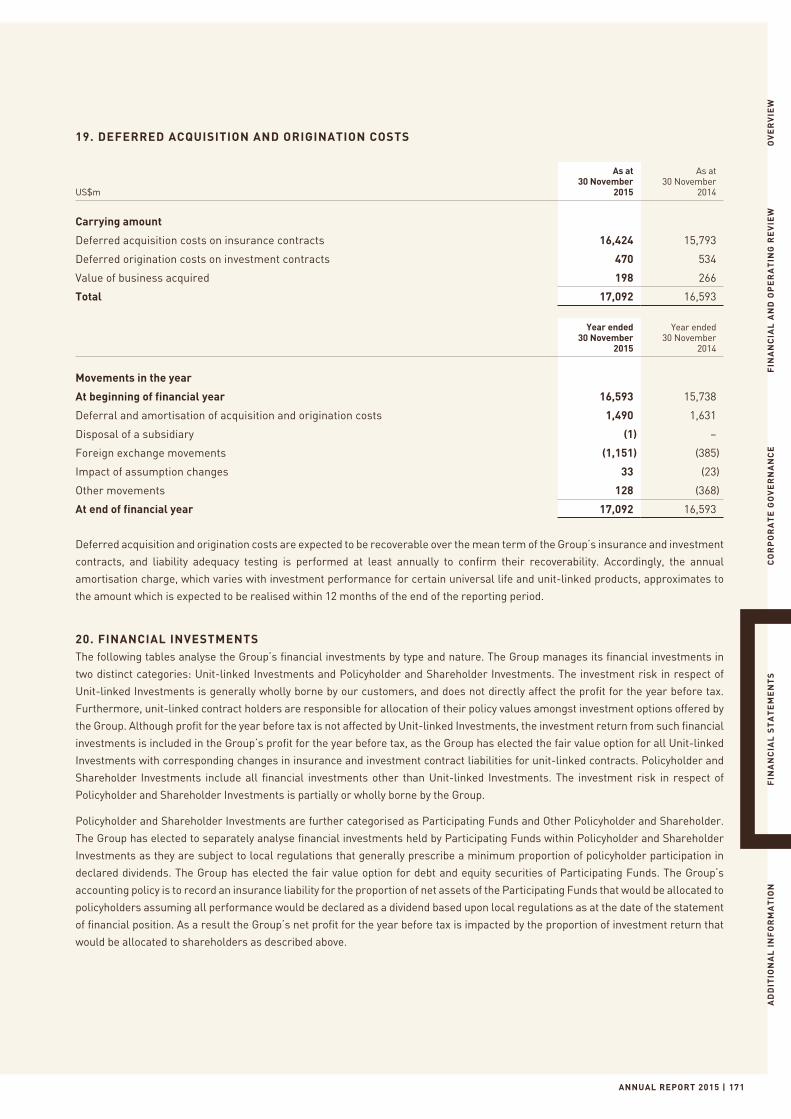
ANNUAL REPORT 2015 | 171
OV
ER
VIE
WF
INA
NC
IAL
AN
D O
PE
RA
TIN
G R
EV
IEW
CO
RP
OR
AT
E G
OV
ER
NA
NC
EF
INA
NC
IAL
ST
AT
EM
EN
TS
AD
DIT
ION
AL
IN
FO
RM
AT
ION
19. DEFERRED ACQUISITION AND ORIGINATION COSTS
US$m
As at30 November
2015
As at30 November
2014
Carrying amount
Deferred acquisition costs on insurance contracts 16,424 15,793
Deferred origination costs on investment contracts 470 534
Value of business acquired 198 266
Total 17,092 16,593
Year ended30 November
2015
Year ended30 November
2014
Movements in the year
At beginning of financial year 16,593 15,738
Deferral and amortisation of acquisition and origination costs 1,490 1,631
Disposal of a subsidiary (1) –
Foreign exchange movements (1,151) (385)
Impact of assumption changes 33 (23)
Other movements 128 (368)
At end of financial year 17,092 16,593
Deferred acquisition and origination costs are expected to be recoverable over the mean term of the Group’s insurance and investment
contracts, and liability adequacy testing is performed at least annually to confirm their recoverability. Accordingly, the annual
amortisation charge, which varies with investment performance for certain universal life and unit-linked products, approximates to
the amount which is expected to be realised within 12 months of the end of the reporting period.
20. FINANCIAL INVESTMENTSThe following tables analyse the Group’s financial investments by type and nature. The Group manages its financial investments in
two distinct categories: Unit-linked Investments and Policyholder and Shareholder Investments. The investment risk in respect of
Unit-linked Investments is generally wholly borne by our customers, and does not directly affect the profit for the year before tax.
Furthermore, unit-linked contract holders are responsible for allocation of their policy values amongst investment options offered by
the Group. Although profit for the year before tax is not affected by Unit-linked Investments, the investment return from such financial
investments is included in the Group’s profit for the year before tax, as the Group has elected the fair value option for all Unit-linked
Investments with corresponding changes in insurance and investment contract liabilities for unit-linked contracts. Policyholder and
Shareholder Investments include all financial investments other than Unit-linked Investments. The investment risk in respect of
Policyholder and Shareholder Investments is partially or wholly borne by the Group.
Policyholder and Shareholder Investments are further categorised as Participating Funds and Other Policyholder and Shareholder.
The Group has elected to separately analyse financial investments held by Participating Funds within Policyholder and Shareholder
Investments as they are subject to local regulations that generally prescribe a minimum proportion of policyholder participation in
declared dividends. The Group has elected the fair value option for debt and equity securities of Participating Funds. The Group’s
accounting policy is to record an insurance liability for the proportion of net assets of the Participating Funds that would be allocated to
policyholders assuming all performance would be declared as a dividend based upon local regulations as at the date of the statement
of financial position. As a result the Group’s net profit for the year before tax is impacted by the proportion of investment return that
would be allocated to shareholders as described above.
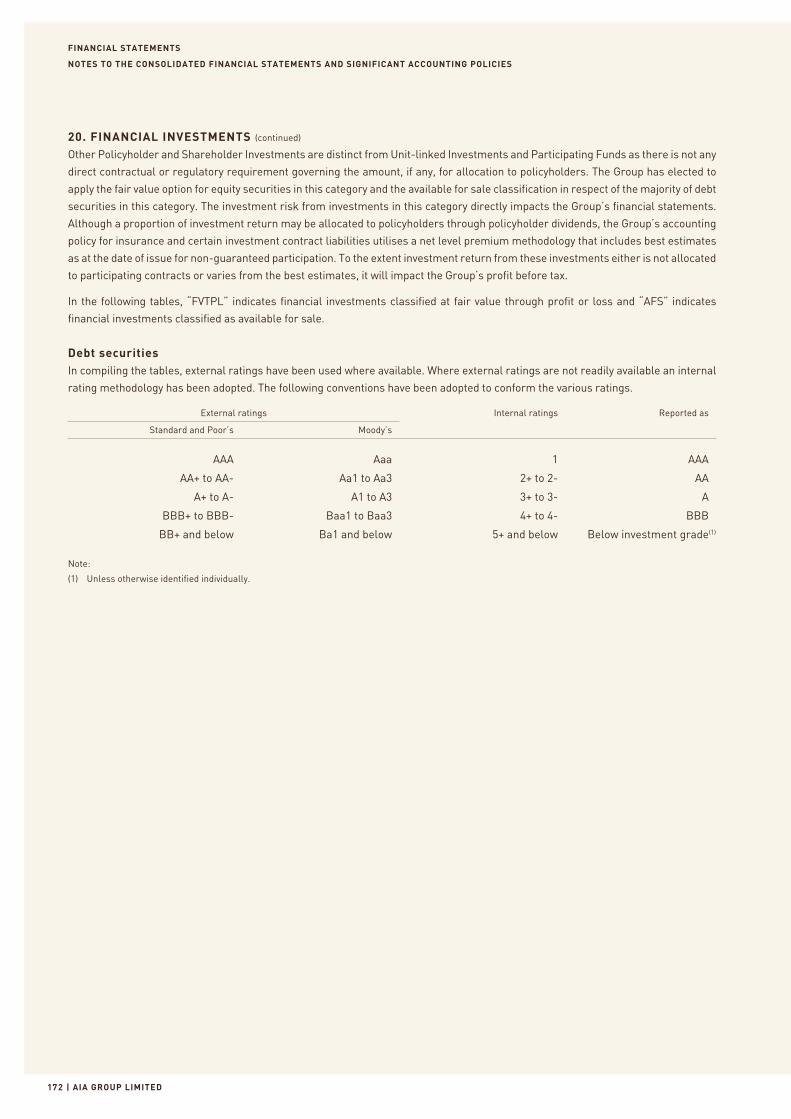
FINANCIAL STATEMENTS
| AIA GROUP LIMITED172
NOTES TO THE CONSOLIDATED FINANCIAL STATEMENTS AND SIGNIFICANT ACCOUNTING POLICIES
20. FINANCIAL INVESTMENTS (continued)
Other Policyholder and Shareholder Investments are distinct from Unit-linked Investments and Participating Funds as there is not any
direct contractual or regulatory requirement governing the amount, if any, for allocation to policyholders. The Group has elected to
apply the fair value option for equity securities in this category and the available for sale classification in respect of the majority of debt
securities in this category. The investment risk from investments in this category directly impacts the Group’s financial statements.
Although a proportion of investment return may be allocated to policyholders through policyholder dividends, the Group’s accounting
policy for insurance and certain investment contract liabilities utilises a net level premium methodology that includes best estimates
as at the date of issue for non-guaranteed participation. To the extent investment return from these investments either is not allocated
to participating contracts or varies from the best estimates, it will impact the Group’s profit before tax.
In the following tables, “FVTPL” indicates financial investments classified at fair value through profit or loss and “AFS” indicates
financial investments classified as available for sale.
Debt securitiesIn compiling the tables, external ratings have been used where available. Where external ratings are not readily available an internal
rating methodology has been adopted. The following conventions have been adopted to conform the various ratings.
External ratings Internal ratings Reported as
Standard and Poor’s Moody’s
AAA Aaa 1 AAA
AA+ to AA- Aa1 to Aa3 2+ to 2- AA
A+ to A- A1 to A3 3+ to 3- A
BBB+ to BBB- Baa1 to Baa3 4+ to 4- BBB
BB+ and below Ba1 and below 5+ and below Below investment grade(1)
Note:
(1) Unless otherwise identified individually.
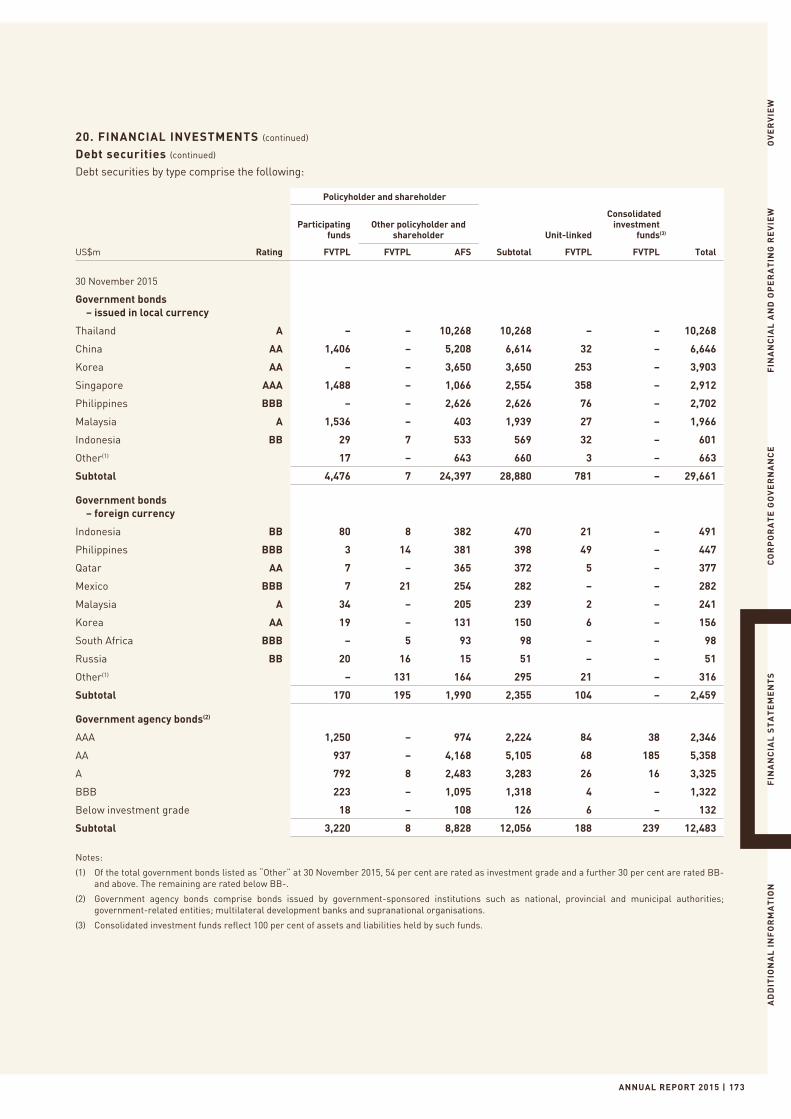
ANNUAL REPORT 2015 | 173
OV
ER
VIE
WF
INA
NC
IAL
AN
D O
PE
RA
TIN
G R
EV
IEW
CO
RP
OR
AT
E G
OV
ER
NA
NC
EF
INA
NC
IAL
ST
AT
EM
EN
TS
AD
DIT
ION
AL
IN
FO
RM
AT
ION
20. FINANCIAL INVESTMENTS (continued)
Debt securities (continued)
Debt securities by type comprise the following:
Policyholder and shareholder
Participating funds
Other policyholder and shareholder Unit-linked
Consolidatedinvestment
funds(3)
US$m Rating FVTPL FVTPL AFS Subtotal FVTPL FVTPL Total
30 November 2015
Government bonds – issued in local currency
Thailand A – – 10,268 10,268 – – 10,268
China AA 1,406 – 5,208 6,614 32 – 6,646
Korea AA – – 3,650 3,650 253 – 3,903
Singapore AAA 1,488 – 1,066 2,554 358 – 2,912
Philippines BBB – – 2,626 2,626 76 – 2,702
Malaysia A 1,536 – 403 1,939 27 – 1,966
Indonesia BB 29 7 533 569 32 – 601
Other(1) 17 – 643 660 3 – 663
Subtotal 4,476 7 24,397 28,880 781 – 29,661
Government bonds – foreign currency
Indonesia BB 80 8 382 470 21 – 491
Philippines BBB 3 14 381 398 49 – 447
Qatar AA 7 – 365 372 5 – 377
Mexico BBB 7 21 254 282 – – 282
Malaysia A 34 – 205 239 2 – 241
Korea AA 19 – 131 150 6 – 156
South Africa BBB – 5 93 98 – – 98
Russia BB 20 16 15 51 – – 51
Other(1) – 131 164 295 21 – 316
Subtotal 170 195 1,990 2,355 104 – 2,459
Government agency bonds(2)
AAA 1,250 – 974 2,224 84 38 2,346
AA 937 – 4,168 5,105 68 185 5,358
A 792 8 2,483 3,283 26 16 3,325
BBB 223 – 1,095 1,318 4 – 1,322
Below investment grade 18 – 108 126 6 – 132
Subtotal 3,220 8 8,828 12,056 188 239 12,483
Notes:
(1) Of the total government bonds listed as “Other” at 30 November 2015, 54 per cent are rated as investment grade and a further 30 per cent are rated BB- and above. The remaining are rated below BB-.
(2) Government agency bonds comprise bonds issued by government-sponsored institutions such as national, provincial and municipal authorities; government-related entities; multilateral development banks and supranational organisations.
(3) Consolidated investment funds reflect 100 per cent of assets and liabilities held by such funds.
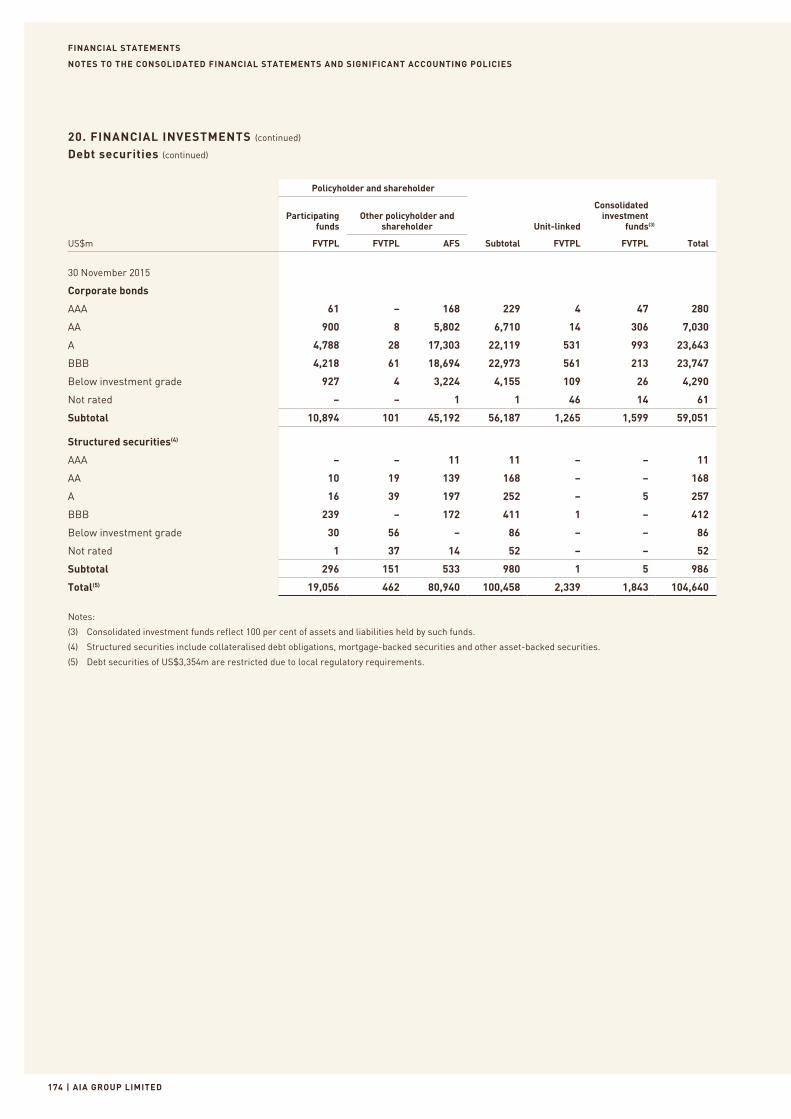
FINANCIAL STATEMENTS
| AIA GROUP LIMITED174
NOTES TO THE CONSOLIDATED FINANCIAL STATEMENTS AND SIGNIFICANT ACCOUNTING POLICIES
20. FINANCIAL INVESTMENTS (continued)
Debt securities (continued)
Policyholder and shareholder
Participating funds
Other policyholder and shareholder Unit-linked
Consolidated investment
funds(3)
US$m FVTPL FVTPL AFS Subtotal FVTPL FVTPL Total
30 November 2015
Corporate bonds
AAA 61 – 168 229 4 47 280
AA 900 8 5,802 6,710 14 306 7,030
A 4,788 28 17,303 22,119 531 993 23,643
BBB 4,218 61 18,694 22,973 561 213 23,747
Below investment grade 927 4 3,224 4,155 109 26 4,290
Not rated – – 1 1 46 14 61
Subtotal 10,894 101 45,192 56,187 1,265 1,599 59,051
Structured securities(4)
AAA – – 11 11 – – 11
AA 10 19 139 168 – – 168
A 16 39 197 252 – 5 257
BBB 239 – 172 411 1 – 412
Below investment grade 30 56 – 86 – – 86
Not rated 1 37 14 52 – – 52
Subtotal 296 151 533 980 1 5 986
Total(5) 19,056 462 80,940 100,458 2,339 1,843 104,640
Notes:
(3) Consolidated investment funds reflect 100 per cent of assets and liabilities held by such funds.
(4) Structured securities include collateralised debt obligations, mortgage-backed securities and other asset-backed securities.
(5) Debt securities of US$3,354m are restricted due to local regulatory requirements.
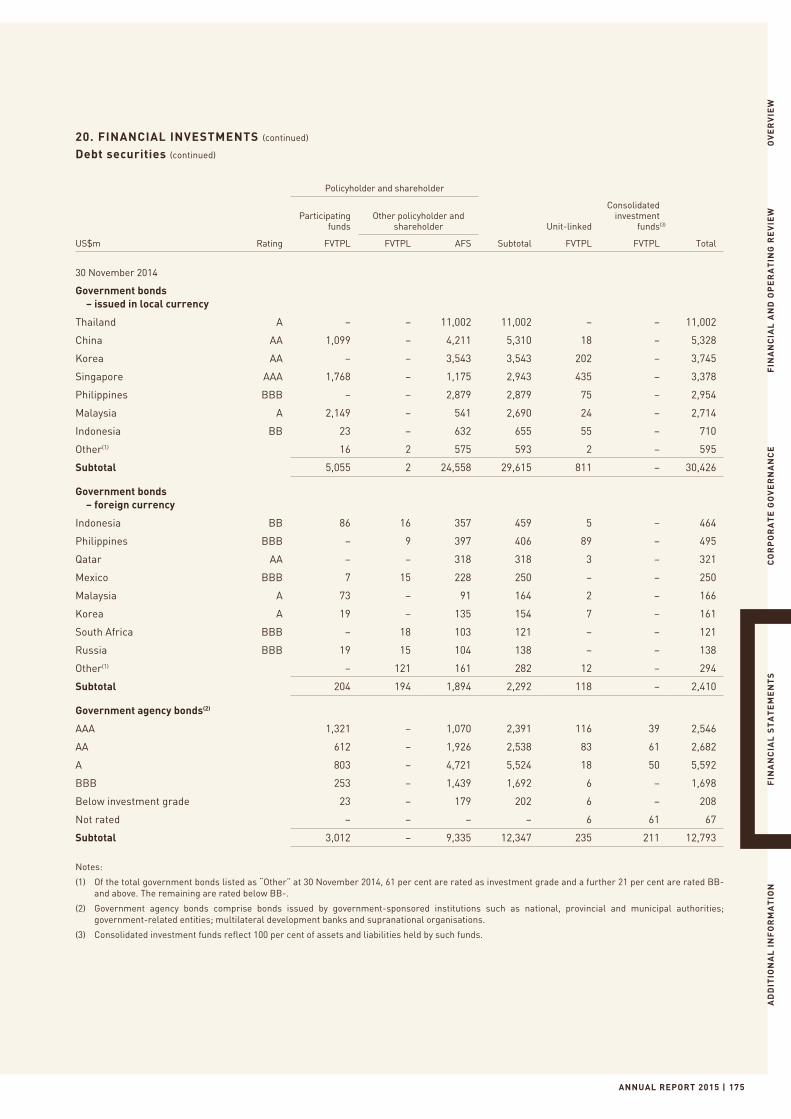
ANNUAL REPORT 2015 | 175
OV
ER
VIE
WF
INA
NC
IAL
AN
D O
PE
RA
TIN
G R
EV
IEW
CO
RP
OR
AT
E G
OV
ER
NA
NC
EF
INA
NC
IAL
ST
AT
EM
EN
TS
AD
DIT
ION
AL
IN
FO
RM
AT
ION
20. FINANCIAL INVESTMENTS (continued)
Debt securities (continued)
Policyholder and shareholder
Participating funds
Other policyholder and shareholder Unit-linked
Consolidated investment
funds(3)
US$m Rating FVTPL FVTPL AFS Subtotal FVTPL FVTPL Total
30 November 2014
Government bonds – issued in local currency
Thailand A – – 11,002 11,002 – – 11,002
China AA 1,099 – 4,211 5,310 18 – 5,328
Korea AA – – 3,543 3,543 202 – 3,745
Singapore AAA 1,768 – 1,175 2,943 435 – 3,378
Philippines BBB – – 2,879 2,879 75 – 2,954
Malaysia A 2,149 – 541 2,690 24 – 2,714
Indonesia BB 23 – 632 655 55 – 710
Other(1) 16 2 575 593 2 – 595
Subtotal 5,055 2 24,558 29,615 811 – 30,426
Government bonds – foreign currency
Indonesia BB 86 16 357 459 5 – 464
Philippines BBB – 9 397 406 89 – 495
Qatar AA – – 318 318 3 – 321
Mexico BBB 7 15 228 250 – – 250
Malaysia A 73 – 91 164 2 – 166
Korea A 19 – 135 154 7 – 161
South Africa BBB – 18 103 121 – – 121
Russia BBB 19 15 104 138 – – 138
Other(1) – 121 161 282 12 – 294
Subtotal 204 194 1,894 2,292 118 – 2,410
Government agency bonds(2)
AAA 1,321 – 1,070 2,391 116 39 2,546
AA 612 – 1,926 2,538 83 61 2,682
A 803 – 4,721 5,524 18 50 5,592
BBB 253 – 1,439 1,692 6 – 1,698
Below investment grade 23 – 179 202 6 – 208
Not rated – – – – 6 61 67
Subtotal 3,012 – 9,335 12,347 235 211 12,793
Notes:
(1) Of the total government bonds listed as “Other” at 30 November 2014, 61 per cent are rated as investment grade and a further 21 per cent are rated BB- and above. The remaining are rated below BB-.
(2) Government agency bonds comprise bonds issued by government-sponsored institutions such as national, provincial and municipal authorities; government-related entities; multilateral development banks and supranational organisations.
(3) Consolidated investment funds reflect 100 per cent of assets and liabilities held by such funds.
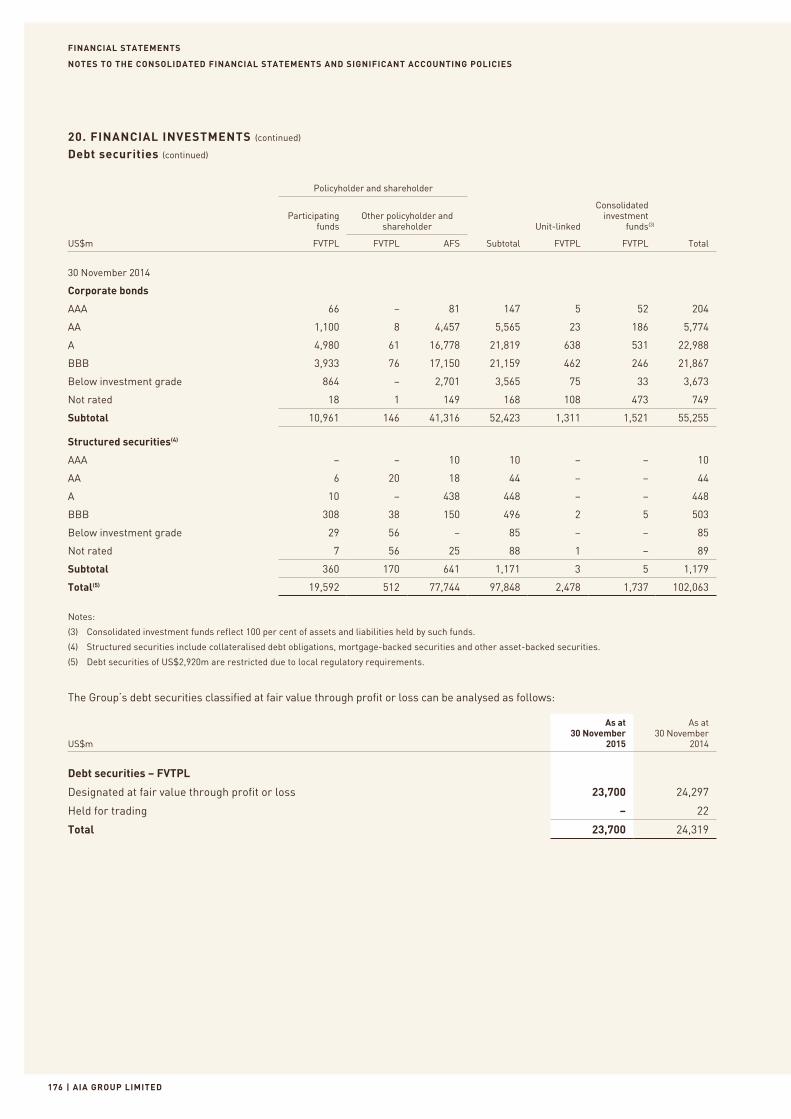
FINANCIAL STATEMENTS
| AIA GROUP LIMITED176
NOTES TO THE CONSOLIDATED FINANCIAL STATEMENTS AND SIGNIFICANT ACCOUNTING POLICIES
20. FINANCIAL INVESTMENTS (continued)
Debt securities (continued)
Policyholder and shareholder
Participating funds
Other policyholder and shareholder Unit-linked
Consolidated investment
funds(3)
US$m FVTPL FVTPL AFS Subtotal FVTPL FVTPL Total
30 November 2014
Corporate bonds
AAA 66 – 81 147 5 52 204
AA 1,100 8 4,457 5,565 23 186 5,774
A 4,980 61 16,778 21,819 638 531 22,988
BBB 3,933 76 17,150 21,159 462 246 21,867
Below investment grade 864 – 2,701 3,565 75 33 3,673
Not rated 18 1 149 168 108 473 749
Subtotal 10,961 146 41,316 52,423 1,311 1,521 55,255
Structured securities(4)
AAA – – 10 10 – – 10
AA 6 20 18 44 – – 44
A 10 – 438 448 – – 448
BBB 308 38 150 496 2 5 503
Below investment grade 29 56 – 85 – – 85
Not rated 7 56 25 88 1 – 89
Subtotal 360 170 641 1,171 3 5 1,179
Total(5) 19,592 512 77,744 97,848 2,478 1,737 102,063
Notes:
(3) Consolidated investment funds reflect 100 per cent of assets and liabilities held by such funds.
(4) Structured securities include collateralised debt obligations, mortgage-backed securities and other asset-backed securities.
(5) Debt securities of US$2,920m are restricted due to local regulatory requirements.
The Group’s debt securities classified at fair value through profit or loss can be analysed as follows:
US$m
As at30 November
2015
As at30 November
2014
Debt securities – FVTPL
Designated at fair value through profit or loss 23,700 24,297
Held for trading – 22
Total 23,700 24,319
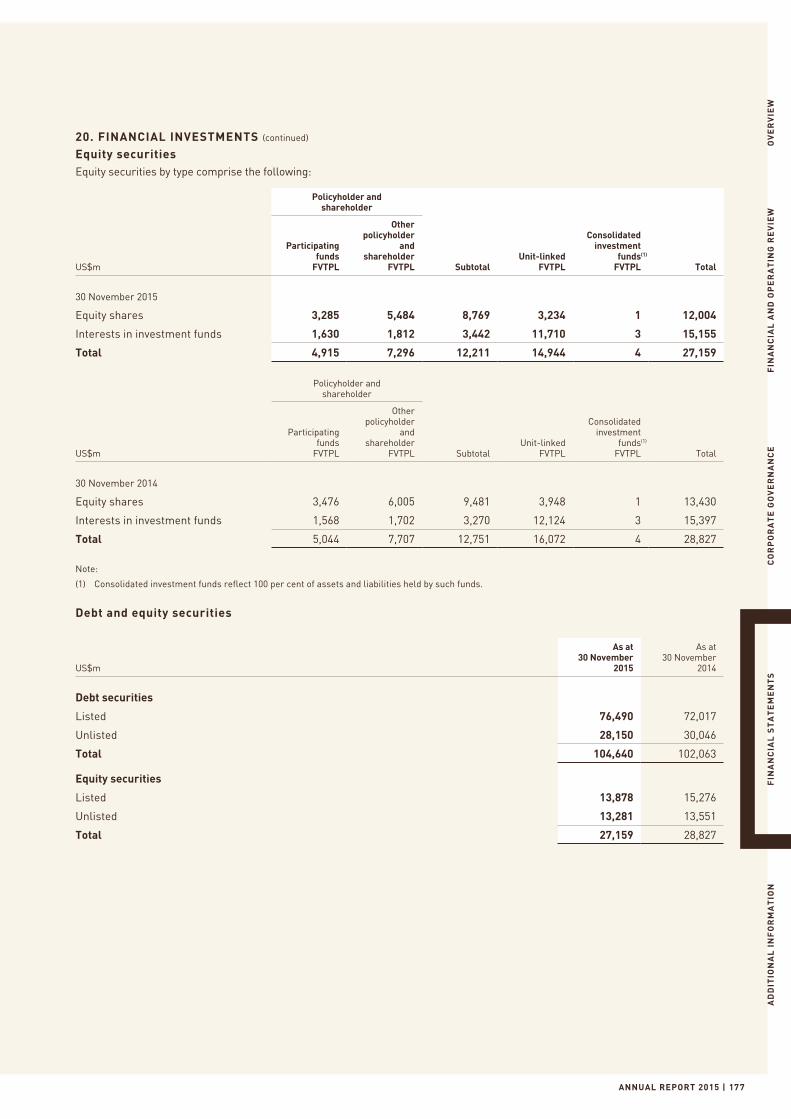
ANNUAL REPORT 2015 | 177
OV
ER
VIE
WF
INA
NC
IAL
AN
D O
PE
RA
TIN
G R
EV
IEW
CO
RP
OR
AT
E G
OV
ER
NA
NC
EF
INA
NC
IAL
ST
AT
EM
EN
TS
AD
DIT
ION
AL
IN
FO
RM
AT
ION
20. FINANCIAL INVESTMENTS (continued)
Equity securitiesEquity securities by type comprise the following:
Policyholder and shareholder
US$m
Participating funds
FVTPL
Other policyholder
and shareholder
FVTPL SubtotalUnit-linked
FVTPL
Consolidated investment
funds(1)
FVTPL Total
30 November 2015
Equity shares 3,285 5,484 8,769 3,234 1 12,004
Interests in investment funds 1,630 1,812 3,442 11,710 3 15,155
Total 4,915 7,296 12,211 14,944 4 27,159
Policyholder and shareholder
US$m
Participating funds
FVTPL
Other policyholder
and shareholder
FVTPL SubtotalUnit-linked
FVTPL
Consolidated investment
funds(1)
FVTPL Total
30 November 2014
Equity shares 3,476 6,005 9,481 3,948 1 13,430
Interests in investment funds 1,568 1,702 3,270 12,124 3 15,397
Total 5,044 7,707 12,751 16,072 4 28,827
Note:
(1) Consolidated investment funds reflect 100 per cent of assets and liabilities held by such funds.
Debt and equity securities
US$m
As at30 November
2015
As at30 November
2014
Debt securities
Listed 76,490 72,017
Unlisted 28,150 30,046
Total 104,640 102,063
Equity securities
Listed 13,878 15,276
Unlisted 13,281 13,551
Total 27,159 28,827
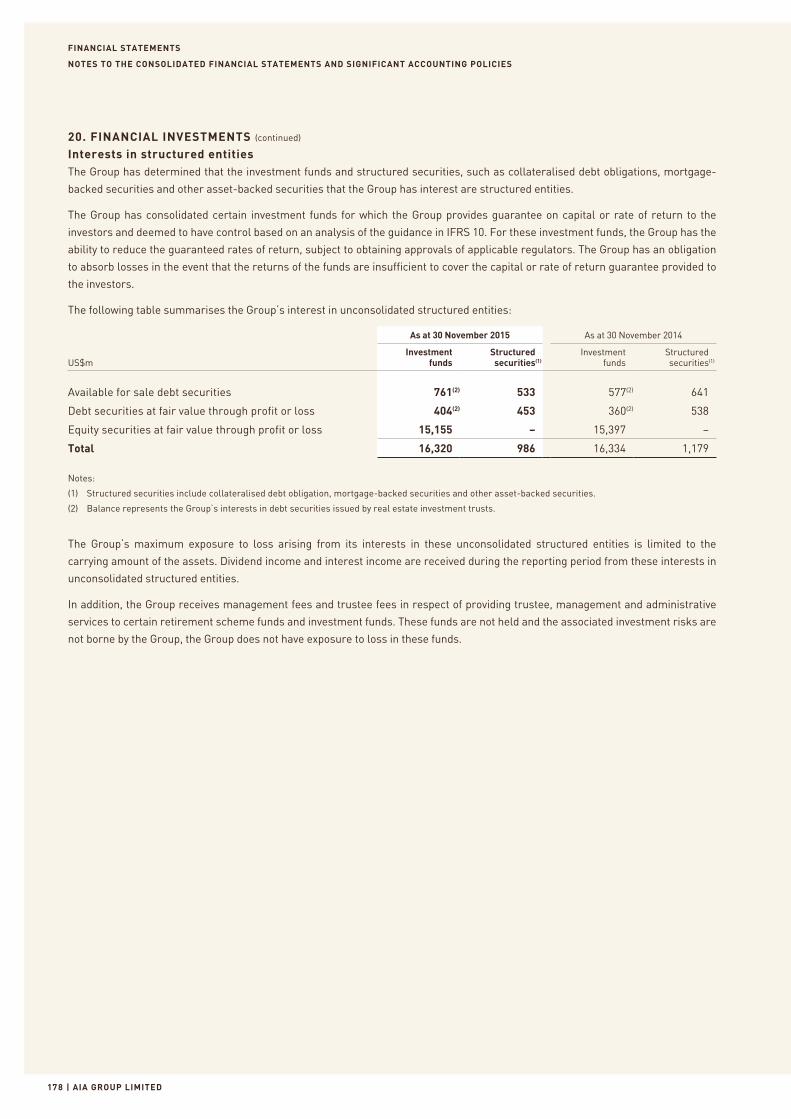
FINANCIAL STATEMENTS
| AIA GROUP LIMITED178
NOTES TO THE CONSOLIDATED FINANCIAL STATEMENTS AND SIGNIFICANT ACCOUNTING POLICIES
20. FINANCIAL INVESTMENTS (continued)
Interests in structured entitiesThe Group has determined that the investment funds and structured securities, such as collateralised debt obligations, mortgage-
backed securities and other asset-backed securities that the Group has interest are structured entities.
The Group has consolidated certain investment funds for which the Group provides guarantee on capital or rate of return to the
investors and deemed to have control based on an analysis of the guidance in IFRS 10. For these investment funds, the Group has the
ability to reduce the guaranteed rates of return, subject to obtaining approvals of applicable regulators. The Group has an obligation
to absorb losses in the event that the returns of the funds are insufficient to cover the capital or rate of return guarantee provided to
the investors.
The following table summarises the Group’s interest in unconsolidated structured entities:
As at 30 November 2015 As at 30 November 2014
US$mInvestment
fundsStructuredsecurities(1)
Investmentfunds
Structuredsecurities(1)
Available for sale debt securities 761(2) 533 577(2) 641
Debt securities at fair value through profit or loss 404(2) 453 360(2) 538
Equity securities at fair value through profit or loss 15,155 – 15,397 –
Total 16,320 986 16,334 1,179
Notes:
(1) Structured securities include collateralised debt obligation, mortgage-backed securities and other asset-backed securities.
(2) Balance represents the Group’s interests in debt securities issued by real estate investment trusts.
The Group’s maximum exposure to loss arising from its interests in these unconsolidated structured entities is limited to the
carrying amount of the assets. Dividend income and interest income are received during the reporting period from these interests in
unconsolidated structured entities.
In addition, the Group receives management fees and trustee fees in respect of providing trustee, management and administrative
services to certain retirement scheme funds and investment funds. These funds are not held and the associated investment risks are
not borne by the Group, the Group does not have exposure to loss in these funds.
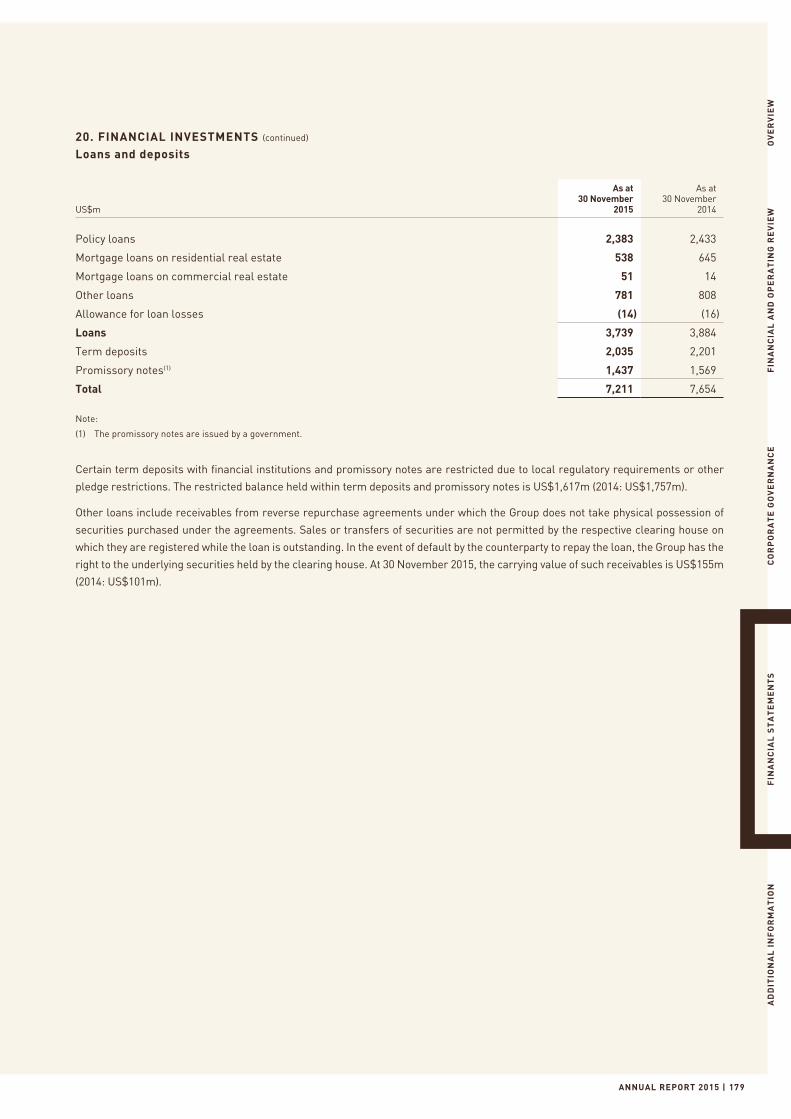
ANNUAL REPORT 2015 | 179
OV
ER
VIE
WF
INA
NC
IAL
AN
D O
PE
RA
TIN
G R
EV
IEW
CO
RP
OR
AT
E G
OV
ER
NA
NC
EF
INA
NC
IAL
ST
AT
EM
EN
TS
AD
DIT
ION
AL
IN
FO
RM
AT
ION
20. FINANCIAL INVESTMENTS (continued)
Loans and deposits
US$m
As at30 November
2015
As at30 November
2014
Policy loans 2,383 2,433
Mortgage loans on residential real estate 538 645
Mortgage loans on commercial real estate 51 14
Other loans 781 808
Allowance for loan losses (14) (16)
Loans 3,739 3,884
Term deposits 2,035 2,201
Promissory notes(1) 1,437 1,569
Total 7,211 7,654
Note:
(1) The promissory notes are issued by a government.
Certain term deposits with financial institutions and promissory notes are restricted due to local regulatory requirements or other
pledge restrictions. The restricted balance held within term deposits and promissory notes is US$1,617m (2014: US$1,757m).
Other loans include receivables from reverse repurchase agreements under which the Group does not take physical possession of
securities purchased under the agreements. Sales or transfers of securities are not permitted by the respective clearing house on
which they are registered while the loan is outstanding. In the event of default by the counterparty to repay the loan, the Group has the
right to the underlying securities held by the clearing house. At 30 November 2015, the carrying value of such receivables is US$155m
(2014: US$101m).
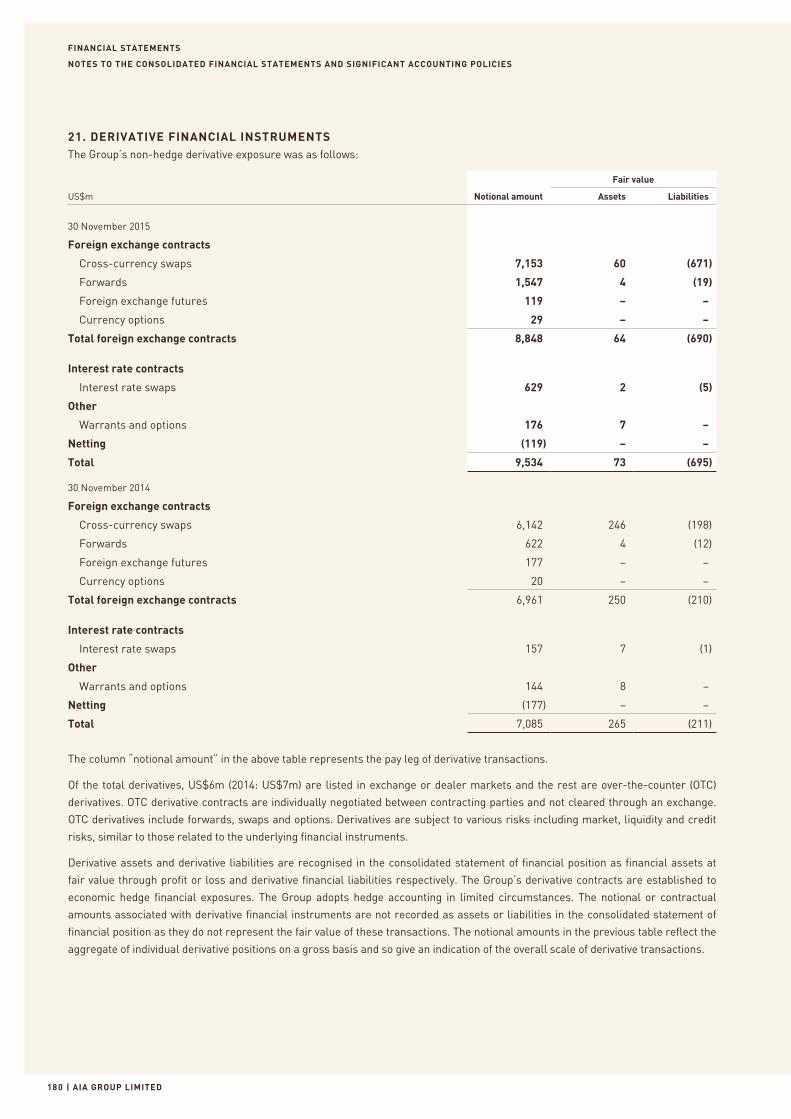
FINANCIAL STATEMENTS
| AIA GROUP LIMITED180
NOTES TO THE CONSOLIDATED FINANCIAL STATEMENTS AND SIGNIFICANT ACCOUNTING POLICIES
21. DERIVATIVE FINANCIAL INSTRUMENTSThe Group’s non-hedge derivative exposure was as follows:
Fair value
US$m Notional amount Assets Liabilities
30 November 2015
Foreign exchange contracts
Cross-currency swaps 7,153 60 (671)
Forwards 1,547 4 (19)
Foreign exchange futures 119 – –
Currency options 29 – –
Total foreign exchange contracts 8,848 64 (690)
Interest rate contracts
Interest rate swaps 629 2 (5)
Other
Warrants and options 176 7 –
Netting (119) – –
Total 9,534 73 (695)
30 November 2014
Foreign exchange contracts
Cross-currency swaps 6,142 246 (198)
Forwards 622 4 (12)
Foreign exchange futures 177 – –
Currency options 20 – –
Total foreign exchange contracts 6,961 250 (210)
Interest rate contracts
Interest rate swaps 157 7 (1)
Other
Warrants and options 144 8 –
Netting (177) – –
Total 7,085 265 (211)
The column “notional amount” in the above table represents the pay leg of derivative transactions.
Of the total derivatives, US$6m (2014: US$7m) are listed in exchange or dealer markets and the rest are over-the-counter (OTC)
derivatives. OTC derivative contracts are individually negotiated between contracting parties and not cleared through an exchange.
OTC derivatives include forwards, swaps and options. Derivatives are subject to various risks including market, liquidity and credit
risks, similar to those related to the underlying financial instruments.
Derivative assets and derivative liabilities are recognised in the consolidated statement of financial position as financial assets at
fair value through profit or loss and derivative financial liabilities respectively. The Group’s derivative contracts are established to
economic hedge financial exposures. The Group adopts hedge accounting in limited circumstances. The notional or contractual
amounts associated with derivative financial instruments are not recorded as assets or liabilities in the consolidated statement of
financial position as they do not represent the fair value of these transactions. The notional amounts in the previous table reflect the
aggregate of individual derivative positions on a gross basis and so give an indication of the overall scale of derivative transactions.
ANNUAL REPORT 2015 | 181
OV
ER
VIE
WF
INA
NC
IAL
AN
D O
PE
RA
TIN
G R
EV
IEW
CO
RP
OR
AT
E G
OV
ER
NA
NC
EF
INA
NC
IAL
ST
AT
EM
EN
TS
AD
DIT
ION
AL
IN
FO
RM
AT
ION
21. DERIVATIVE FINANCIAL INSTRUMENTS (continued)
Foreign exchange contractsForeign exchange forward and futures contracts represent agreements to exchange the currency of one country for the currency of
another country at an agreed price and settlement date. Currency options are agreements that give the buyer the right to exchange the
currency of one country for the currency of another country at agreed prices and settlement dates. Currency swaps are contractual
agreements that involve the exchange of both periodic and final amounts in two different currencies. Exposure to gain and loss on the
foreign exchange contracts will increase or decrease over their respective lives as a function of maturity dates, interest and foreign
exchange rates, implied volatilities of the underlying indices and the timing of payments.
Interest rate swapsInterest rate swaps are contractual agreements between two parties to exchange periodic payments in the same currency, each of
which is computed on a different interest rate basis, on a specified notional amount. Most interest rate swaps involve the net exchange
of payments calculated as the difference between the fixed and floating rate interest payments.
Other derivativesWarrants and options are option agreements that give the owner the right to buy or sell securities at an agreed price and settlement
date.
Netting adjustmentThe netting adjustment is related to futures contracts executed through clearing house where the settlement arrangement satisfied
the netting criteria under IFRS.
Collateral under derivative transactionsAt 30 November 2015, the Group had posted cash collateral of US$189m (2014: US$20m) and pledged debt securities with carrying
value of US$439m (2014: US$96m) for liabilities and held cash collateral of US$8m (2014: US$122m), debt securities collateral with
carrying value of US$2m (2014: US$2m) and no deposit collateral (2014: US$25m) for assets in respect of derivative transactions. The
Group did not sell or repledge the collateral received. These transactions are conducted under terms that are usual and customary to
collateralised transactions including, where relevant, standard securities lending and repurchase agreements.
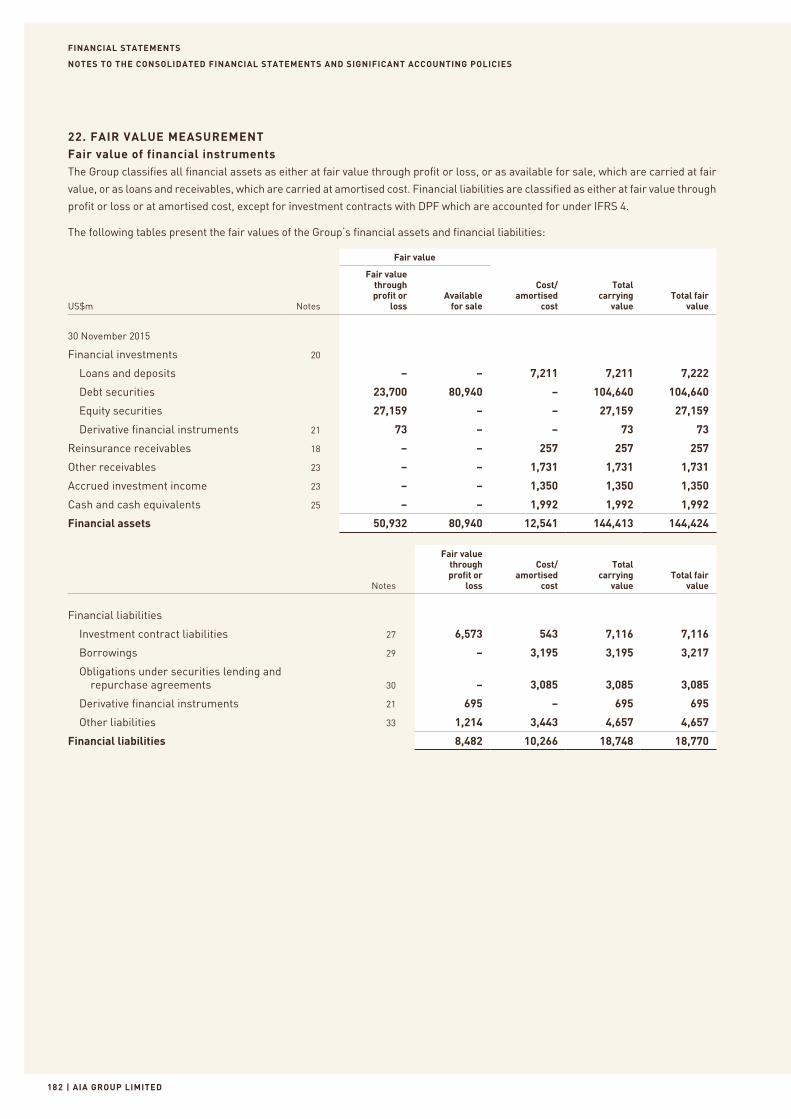
FINANCIAL STATEMENTS
| AIA GROUP LIMITED182
NOTES TO THE CONSOLIDATED FINANCIAL STATEMENTS AND SIGNIFICANT ACCOUNTING POLICIES
22. FAIR VALUE MEASUREMENTFair value of financial instrumentsThe Group classifies all financial assets as either at fair value through profit or loss, or as available for sale, which are carried at fair
value, or as loans and receivables, which are carried at amortised cost. Financial liabilities are classified as either at fair value through
profit or loss or at amortised cost, except for investment contracts with DPF which are accounted for under IFRS 4.
The following tables present the fair values of the Group’s financial assets and financial liabilities:
Fair value
US$m Notes
Fair valuethroughprofit or
lossAvailable
for sale
Cost/amortised
cost
Totalcarrying
valueTotal fair
value
30 November 2015
Financial investments 20
Loans and deposits – – 7,211 7,211 7,222
Debt securities 23,700 80,940 – 104,640 104,640
Equity securities 27,159 – – 27,159 27,159
Derivative financial instruments 21 73 – – 73 73
Reinsurance receivables 18 – – 257 257 257
Other receivables 23 – – 1,731 1,731 1,731
Accrued investment income 23 – – 1,350 1,350 1,350
Cash and cash equivalents 25 – – 1,992 1,992 1,992
Financial assets 50,932 80,940 12,541 144,413 144,424
Notes
Fair value through profit or
loss
Cost/amortised
cost
Total carrying
valueTotal fair
value
Financial liabilities
Investment contract liabilities 27 6,573 543 7,116 7,116
Borrowings 29 – 3,195 3,195 3,217
Obligations under securities lending and repurchase agreements 30 – 3,085 3,085 3,085
Derivative financial instruments 21 695 – 695 695
Other liabilities 33 1,214 3,443 4,657 4,657
Financial liabilities 8,482 10,266 18,748 18,770
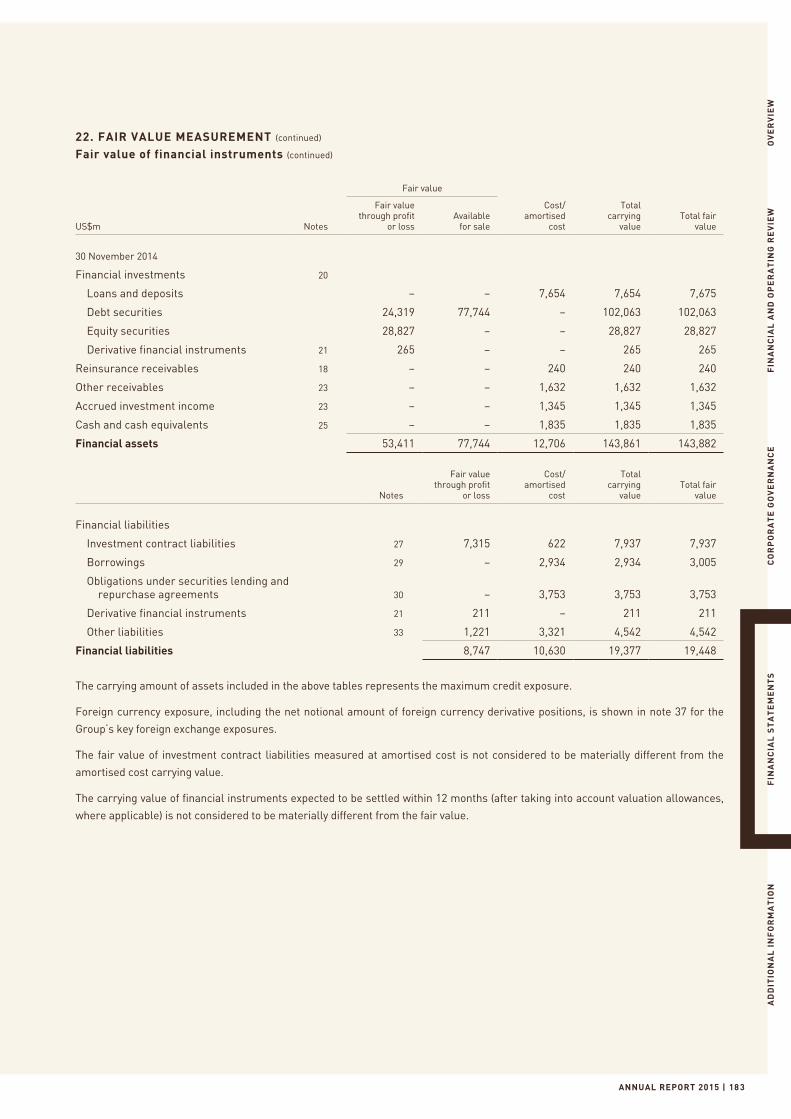
ANNUAL REPORT 2015 | 18 3
OV
ER
VIE
WF
INA
NC
IAL
AN
D O
PE
RA
TIN
G R
EV
IEW
CO
RP
OR
AT
E G
OV
ER
NA
NC
EF
INA
NC
IAL
ST
AT
EM
EN
TS
AD
DIT
ION
AL
IN
FO
RM
AT
ION
22. FAIR VALUE MEASUREMENT (continued)
Fair value of financial instruments (continued)
Fair value
US$m Notes
Fair value through profit
or lossAvailable
for sale
Cost/amortised
cost
Total carrying
valueTotal fair
value
30 November 2014
Financial investments 20
Loans and deposits – – 7,654 7,654 7,675
Debt securities 24,319 77,744 – 102,063 102,063
Equity securities 28,827 – – 28,827 28,827
Derivative financial instruments 21 265 – – 265 265
Reinsurance receivables 18 – – 240 240 240
Other receivables 23 – – 1,632 1,632 1,632
Accrued investment income 23 – – 1,345 1,345 1,345
Cash and cash equivalents 25 – – 1,835 1,835 1,835
Financial assets 53,411 77,744 12,706 143,861 143,882
Notes
Fair value through profit
or loss
Cost/amortised
cost
Total carrying
valueTotal fair
value
Financial liabilities
Investment contract liabilities 27 7,315 622 7,937 7,937
Borrowings 29 – 2,934 2,934 3,005
Obligations under securities lending and repurchase agreements 30 – 3,753 3,753 3,753
Derivative financial instruments 21 211 – 211 211
Other liabilities 33 1,221 3,321 4,542 4,542
Financial liabilities 8,747 10,630 19,377 19,448
The carrying amount of assets included in the above tables represents the maximum credit exposure.
Foreign currency exposure, including the net notional amount of foreign currency derivative positions, is shown in note 37 for the
Group’s key foreign exchange exposures.
The fair value of investment contract liabilities measured at amortised cost is not considered to be materially different from the
amortised cost carrying value.
The carrying value of financial instruments expected to be settled within 12 months (after taking into account valuation allowances,
where applicable) is not considered to be materially different from the fair value.
FINANCIAL STATEMENTS
| AIA GROUP LIMITED18 4
NOTES TO THE CONSOLIDATED FINANCIAL STATEMENTS AND SIGNIFICANT ACCOUNTING POLICIES
22. FAIR VALUE MEASUREMENT (continued)
Fair value measurements on a recurring basisThe Group measures at fair value financial instruments classified at fair value through profit or loss, available for sale securities
portfolios, derivative assets and liabilities, investments held by investment funds which are consolidated, investments in non-
consolidated investment funds and certain investment contract liabilities on a recurring basis. The fair value of a financial instrument
is the amount that would be received on sale of an asset or paid to transfer a liability in an orderly transaction between market
participants at the measurement date.
The degree of judgement used in measuring the fair value of financial instruments generally correlates with the level of pricing
observability. Financial instruments with quoted prices in active markets generally have more pricing observability and less judgement
is used in measuring fair value. Conversely, financial instruments traded in other than active markets or that do not have quoted
prices have less observability and are measured at fair value using valuation models or other pricing techniques that require more
judgement. An active market is one in which transactions for the asset or liability being valued occur with sufficient frequency and
volume to provide pricing information on an ongoing basis.
An other than active market is one in which there are few transactions, the prices are not current, price quotations vary substantially
either over time or among market makers, or in which little information is released publicly for the asset or liability being valued.
Pricing observability is affected by a number of factors, including the type of financial instrument, whether the financial instrument is
new to the market and not yet established, the characteristics specific to the transaction and general market conditions.
The Group does not have assets or liabilities measured at fair value on a non-recurring basis during the year ended 30 November 2015.
The following methods and assumptions were used by the Group to estimate the fair value of financial instruments.
Determination of fair value for financial instrumentsLoans and receivables
For loans and advances that are repriced frequently and have not had any significant changes in credit risk, carrying amounts
represent a reasonable estimate of fair values. The fair values of other loans are estimated by discounting expected future cash flows
using interest rates offered for similar loans to borrowers with similar credit ratings.
The fair values of mortgage loans are estimated by discounting future cash flows using interest rates currently being offered in
respect of similar loans to borrowers with similar credit ratings. The fair values of fixed rate policy loans are estimated by discounting
cash flows at the interest rates charged on policy loans of similar policies currently being issued. Loans with similar characteristics
are aggregated for purposes of the calculations. The carrying values of policy loans with variable rates approximate to their fair values.
Debt securities and equity securities
The fair values of equity securities are based on quoted market prices or, if unquoted, on estimated market values generally based
on quoted prices for similar securities. Fair values for fixed interest securities are based on quoted market prices, where available.
For those securities not actively traded, fair values are estimated using values obtained from brokers, private pricing services or
by discounting expected future cash flows using a current market rate applicable to the yield, credit quality and maturity of the
investment. Priority is given to values from independent sources when available, but overall the source of pricing and/or valuation
technique is chosen with the objective of arriving at the price at which an orderly transaction would take place between market
participants on the measurement date. The inputs to determining fair value that are relevant to fixed interest securities include, but
not limited to risk-free interest rates, the obligor’s credit spreads, foreign exchange rates and credit default rates. For holdings in
hedge funds and limited partnerships, fair values are determined based on the net asset values provided by the general partner or
manager of each investment, the accounts of which are generally audited on an annual basis. The transaction price is used as the best
estimate of fair value at inception.
ANNUAL REPORT 2015 | 185
OV
ER
VIE
WF
INA
NC
IAL
AN
D O
PE
RA
TIN
G R
EV
IEW
CO
RP
OR
AT
E G
OV
ER
NA
NC
EF
INA
NC
IAL
ST
AT
EM
EN
TS
AD
DIT
ION
AL
IN
FO
RM
AT
ION
22. FAIR VALUE MEASUREMENT (continued)
Determination of fair value for financial instruments (continued)
Derivative financial instruments
The Group values its derivative financial assets and liabilities using market transactions and other market evidence whenever
possible, including market-based inputs to models, model calibration to market clearing transactions, broker or dealer quotations or
alternative pricing sources with reasonable levels of price transparency. When models are used, the selection of a particular model to
value a derivative depends on the contract terms of, and specific risks inherent in, the instrument as well as the availability of pricing
information in the market. The Group generally uses similar models to value similar instruments. Valuation models require a variety
of inputs, including contractual terms, market prices and rates, yield curves, credit curves, measures of volatility, prepayment rates
and correlations of such inputs. For derivatives that trade in liquid markets, such as generic forwards, swaps and options, model
inputs can generally be verified and model selection does not involve significant management judgement. Examples of inputs that are
generally observable include foreign exchange spot and forward rates, benchmark interest rate curves and volatilities for commonly
traded option products. Examples of inputs that may be unobservable include volatilities for less commonly traded option products
and correlations between market factors.
When the Group holds a group of derivative assets and derivative liabilities entered into with a particular counterparty, the Group
takes into account the arrangements that mitigate credit risk exposure in the event of default (e.g. International Swap and Derivatives
Association (ISDA) Master Agreements and Credit Support Annex (CSA) that require the exchange of collateral on the basis of each
party’s net credit risk exposure). The Group measures the fair value of the group of financial assets and financial liabilities on the basis
of its net exposure to the credit risk of that counterparty or the counterparty’s net exposure to our credit risk that reflects market
participants’ expectations about the likelihood that such an arrangement would be legally enforceable in the event of default.
Cash and cash equivalents
The carrying amount of cash approximates its fair value.
Reinsurance receivables
The carrying amount of amounts receivable from reinsurers is not considered materially different to their fair value.
Fair value of securities sold under repurchase agreements and the associated payables
The contract values of payables under repurchase agreements approximate their fair value as these obligations are short-term in
nature.
Other assets
The carrying amount of other financial assets is not materially different to their fair value. The fair values of deposits with banks are
generally based on quoted market prices or, if unquoted, on estimates based on discounting future cash flows using available market
interest rates offered for receivables with similar characteristics.
Investment contract liabilities
For investment contract liabilities, the fair values have been estimated using a discounted cash flow approach based on interest
rates currently being offered for similar contracts with maturities consistent with those remaining for the contracts being valued. For
investment contracts where the investment risk is borne by the policyholder, the fair value generally approximates to the fair value of
the underlying assets.
Investment contracts with DPF enable the contract holder to receive additional benefits as a supplement to guaranteed benefits. These
are referred to as participating business and are measured and classified according to the Group practice for insurance contract
liabilities and hence are disclosed within note 26. These are not measured at fair value as there is currently not an agreed definition
of fair value for investment and insurance contracts with DPF under IFRS. In the absence of any agreed methodology, it is not possible
to provide a range of estimates within which fair value is likely to fall. The IASB is expecting to address this issue in Phase II of its
insurance contracts project.
FINANCIAL STATEMENTS
| AIA GROUP LIMITED186
NOTES TO THE CONSOLIDATED FINANCIAL STATEMENTS AND SIGNIFICANT ACCOUNTING POLICIES
22. FAIR VALUE MEASUREMENT (continued)
Determination of fair value for financial instruments (continued)
Borrowings
The fair values of borrowings with stated maturities have been estimated based on discounting future cash flows using the interest
rates currently applicable to deposits of similar maturities or prices obtained from brokers.
Other liabilities
The fair values of other unquoted financial liabilities is estimated by discounting expected future cash flows using current market rates
applicable to their yield, credit quality and maturity, except for those without stated maturity, where the carrying value approximates
to fair value.
Fair value hierarchy for fair value measurement on a recurring basis
Assets and liabilities recorded at fair value in the consolidated statement of financial position are measured and classified in a
hierarchy for disclosure purposes consisting of three “levels” based on the observability of inputs available in the marketplace used
to measure their fair values as discussed below:
• Level 1: Fair value measurements that are quoted prices (unadjusted) in active markets for identical assets or liabilities that the
Group has the ability to access as of the measurement date. Market price data is generally obtained from exchange or dealer
markets. The Group does not adjust the quoted price for such instruments. Assets measured at fair value on a recurring basis
and classified as Level 1 are actively traded listed equities. The Group considers that government debt securities issued by G7
countries (the United States, Canada, France, Germany, Italy, Japan, the United Kingdom) and traded in a dealer market to be
Level 1, until they no longer trade with sufficient frequency and volume to be considered actively traded.
• Level 2: Fair value measurements based on inputs other than quoted prices included in Level 1 that are observable for the asset
or liability, either directly (as prices) or indirectly (derived from prices). Level 2 inputs include quoted prices for similar assets and
liabilities in active markets, quoted prices for identical or similar assets or liabilities in markets that are not active and inputs other
than quoted prices that are observable for the asset and liability, such as interest rates and yield curves that are observable at
commonly quoted intervals. Assets and liabilities measured at fair value on a recurring basis and classified as Level 2 generally
include government securities issued by non-G7 countries, most investment grade corporate bonds, hedge fund investments and
derivative contracts.
• Level 3: Fair value measurements based on valuation techniques that use significant inputs that are unobservable. Unobservable
inputs are only used to measure fair value to the extent that relevant observable inputs are not available, allowing for circumstances
in which there is little, if any, market activity for the asset or liability. Assets and liabilities measured at fair value on a recurring
basis and classified as Level 3 include certain classes of structured securities, certain derivative contracts, private equity and real
estate fund investments, and direct private equity investments.
In certain cases, the inputs used to measure fair value may fall into different levels of the fair value hierarchy. In such cases, the level
in the fair value hierarchy within which the fair value measurement in its entirety falls is determined based on the lowest level input
that is significant to the fair value measurement in its entirety. The Group’s assessment of the significance of a particular input to
the fair value measurement in its entirety requires judgement. In making the assessment, the Group considers factors specific to the
asset or liability.
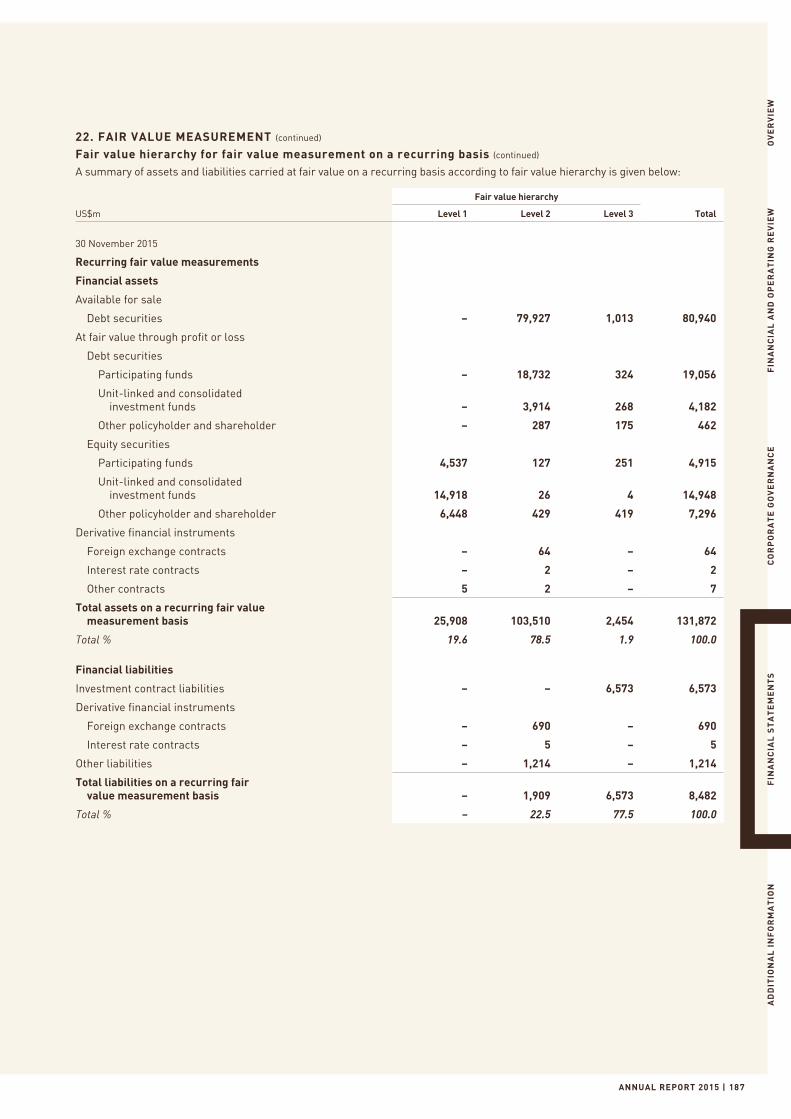
ANNUAL REPORT 2015 | 187
OV
ER
VIE
WF
INA
NC
IAL
AN
D O
PE
RA
TIN
G R
EV
IEW
CO
RP
OR
AT
E G
OV
ER
NA
NC
EF
INA
NC
IAL
ST
AT
EM
EN
TS
AD
DIT
ION
AL
IN
FO
RM
AT
ION
22. FAIR VALUE MEASUREMENT (continued)
Fair value hierarchy for fair value measurement on a recurring basis (continued)
A summary of assets and liabilities carried at fair value on a recurring basis according to fair value hierarchy is given below:
Fair value hierarchy
US$m Level 1 Level 2 Level 3 Total
30 November 2015
Recurring fair value measurements
Financial assets
Available for sale
Debt securities – 79,927 1,013 80,940
At fair value through profit or loss
Debt securities
Participating funds – 18,732 324 19,056
Unit-linked and consolidated investment funds – 3,914 268 4,182
Other policyholder and shareholder – 287 175 462
Equity securities
Participating funds 4,537 127 251 4,915
Unit-linked and consolidated investment funds 14,918 26 4 14,948
Other policyholder and shareholder 6,448 429 419 7,296
Derivative financial instruments
Foreign exchange contracts – 64 – 64
Interest rate contracts – 2 – 2
Other contracts 5 2 – 7
Total assets on a recurring fair value measurement basis 25,908 103,510 2,454 131,872
Total % 19.6 78.5 1.9 100.0
Financial liabilities
Investment contract liabilities – – 6,573 6,573
Derivative financial instruments
Foreign exchange contracts – 690 – 690
Interest rate contracts – 5 – 5
Other liabilities – 1,214 – 1,214
Total liabilities on a recurring fair value measurement basis – 1,909 6,573 8,482
Total % – 22.5 77.5 100.0
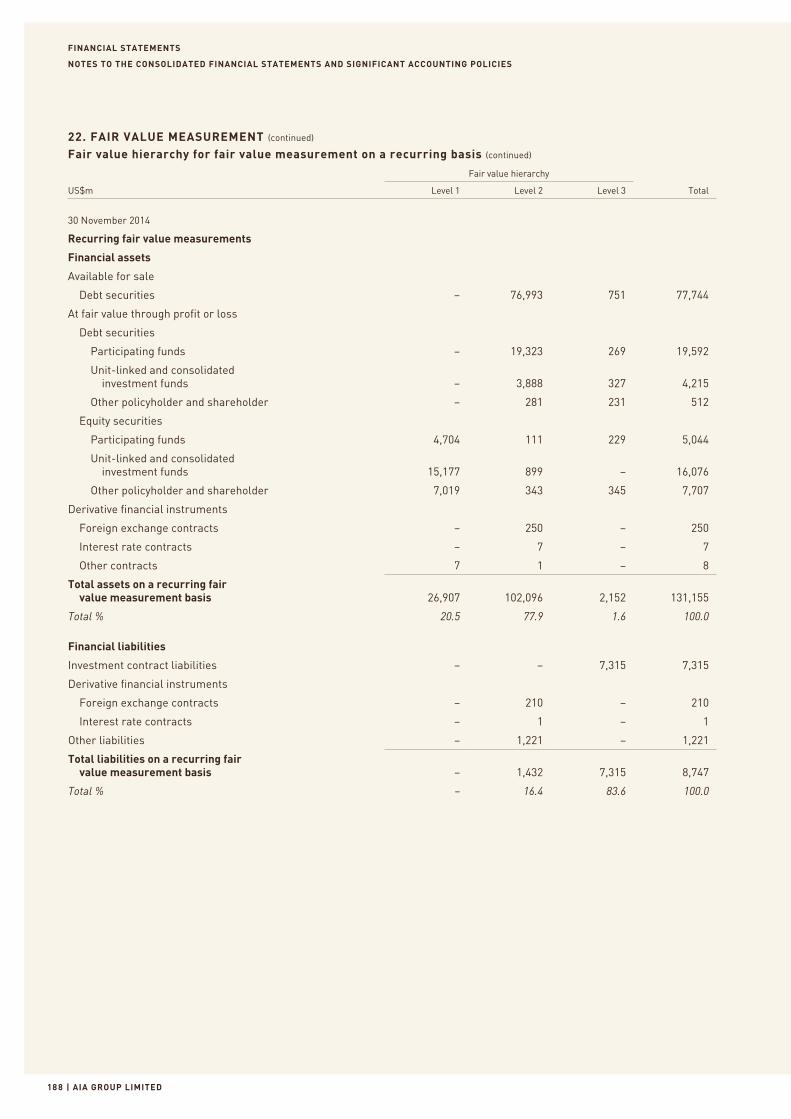
FINANCIAL STATEMENTS
| AIA GROUP LIMITED188
NOTES TO THE CONSOLIDATED FINANCIAL STATEMENTS AND SIGNIFICANT ACCOUNTING POLICIES
22. FAIR VALUE MEASUREMENT (continued)
Fair value hierarchy for fair value measurement on a recurring basis (continued)
Fair value hierarchy
US$m Level 1 Level 2 Level 3 Total
30 November 2014
Recurring fair value measurements
Financial assets
Available for sale
Debt securities – 76,993 751 77,744
At fair value through profit or loss
Debt securities
Participating funds – 19,323 269 19,592
Unit-linked and consolidated investment funds – 3,888 327 4,215
Other policyholder and shareholder – 281 231 512
Equity securities
Participating funds 4,704 111 229 5,044
Unit-linked and consolidated investment funds 15,177 899 – 16,076
Other policyholder and shareholder 7,019 343 345 7,707
Derivative financial instruments
Foreign exchange contracts – 250 – 250
Interest rate contracts – 7 – 7
Other contracts 7 1 – 8
Total assets on a recurring fair value measurement basis 26,907 102,096 2,152 131,155
Total % 20.5 77.9 1.6 100.0
Financial liabilities
Investment contract liabilities – – 7,315 7,315
Derivative financial instruments
Foreign exchange contracts – 210 – 210
Interest rate contracts – 1 – 1
Other liabilities – 1,221 – 1,221
Total liabilities on a recurring fair value measurement basis – 1,432 7,315 8,747
Total % – 16.4 83.6 100.0
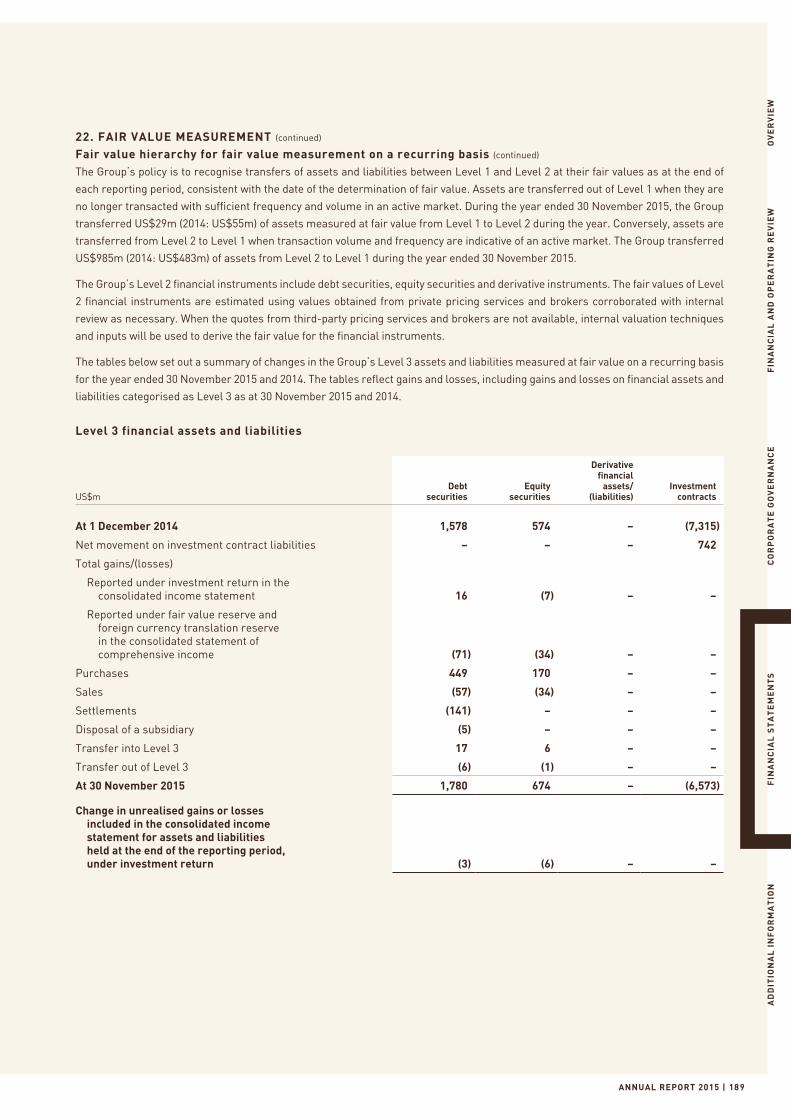
ANNUAL REPORT 2015 | 189
OV
ER
VIE
WF
INA
NC
IAL
AN
D O
PE
RA
TIN
G R
EV
IEW
CO
RP
OR
AT
E G
OV
ER
NA
NC
EF
INA
NC
IAL
ST
AT
EM
EN
TS
AD
DIT
ION
AL
IN
FO
RM
AT
ION
22. FAIR VALUE MEASUREMENT (continued)
Fair value hierarchy for fair value measurement on a recurring basis (continued)
The Group’s policy is to recognise transfers of assets and liabilities between Level 1 and Level 2 at their fair values as at the end of
each reporting period, consistent with the date of the determination of fair value. Assets are transferred out of Level 1 when they are
no longer transacted with sufficient frequency and volume in an active market. During the year ended 30 November 2015, the Group
transferred US$29m (2014: US$55m) of assets measured at fair value from Level 1 to Level 2 during the year. Conversely, assets are
transferred from Level 2 to Level 1 when transaction volume and frequency are indicative of an active market. The Group transferred
US$985m (2014: US$483m) of assets from Level 2 to Level 1 during the year ended 30 November 2015.
The Group’s Level 2 financial instruments include debt securities, equity securities and derivative instruments. The fair values of Level
2 financial instruments are estimated using values obtained from private pricing services and brokers corroborated with internal
review as necessary. When the quotes from third-party pricing services and brokers are not available, internal valuation techniques
and inputs will be used to derive the fair value for the financial instruments.
The tables below set out a summary of changes in the Group’s Level 3 assets and liabilities measured at fair value on a recurring basis
for the year ended 30 November 2015 and 2014. The tables reflect gains and losses, including gains and losses on financial assets and
liabilities categorised as Level 3 as at 30 November 2015 and 2014.
Level 3 financial assets and liabilities
US$mDebt
securitiesEquity
securities
Derivative financial
assets/(liabilities)
Investment contracts
At 1 December 2014 1,578 574 – (7,315)
Net movement on investment contract liabilities – – – 742
Total gains/(losses)
Reported under investment return in the consolidated income statement 16 (7) – –
Reported under fair value reserve and foreign currency translation reserve in the consolidated statement of comprehensive income (71) (34) – –
Purchases 449 170 – –
Sales (57) (34) – –
Settlements (141) – – –
Disposal of a subsidiary (5) – – –
Transfer into Level 3 17 6 – –
Transfer out of Level 3 (6) (1) – –
At 30 November 2015 1,780 674 – (6,573)
Change in unrealised gains or losses included in the consolidated income statement for assets and liabilities held at the end of the reporting period, under investment return (3) (6) – –
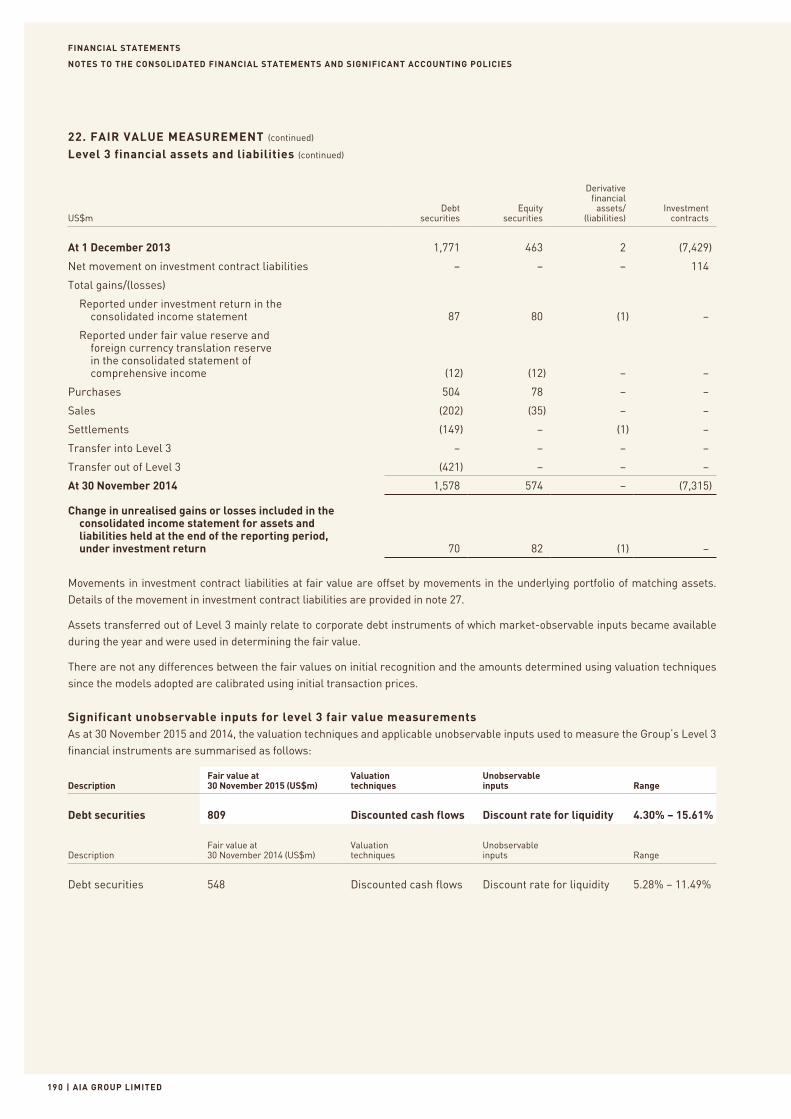
FINANCIAL STATEMENTS
| AIA GROUP LIMITED190
NOTES TO THE CONSOLIDATED FINANCIAL STATEMENTS AND SIGNIFICANT ACCOUNTING POLICIES
22. FAIR VALUE MEASUREMENT (continued)
Level 3 financial assets and liabilities (continued)
US$mDebt
securitiesEquity
securities
Derivative financial
assets/(liabilities)
Investment contracts
At 1 December 2013 1,771 463 2 (7,429)
Net movement on investment contract liabilities – – – 114
Total gains/(losses)
Reported under investment return in the consolidated income statement 87 80 (1) –
Reported under fair value reserve and foreign currency translation reserve in the consolidated statement of comprehensive income (12) (12) – –
Purchases 504 78 – –
Sales (202) (35) – –
Settlements (149) – (1) –
Transfer into Level 3 – – – –
Transfer out of Level 3 (421) – – –
At 30 November 2014 1,578 574 – (7,315)
Change in unrealised gains or losses included in the consolidated income statement for assets and liabilities held at the end of the reporting period, under investment return 70 82 (1) –
Movements in investment contract liabilities at fair value are offset by movements in the underlying portfolio of matching assets. Details of the movement in investment contract liabilities are provided in note 27.
Assets transferred out of Level 3 mainly relate to corporate debt instruments of which market-observable inputs became available during the year and were used in determining the fair value.
There are not any differences between the fair values on initial recognition and the amounts determined using valuation techniques since the models adopted are calibrated using initial transaction prices.
Significant unobservable inputs for level 3 fair value measurementsAs at 30 November 2015 and 2014, the valuation techniques and applicable unobservable inputs used to measure the Group’s Level 3 financial instruments are summarised as follows:
DescriptionFair value at 30 November 2015 (US$m)
Valuation techniques
Unobservable inputs Range
Debt securities 809 Discounted cash flows Discount rate for liquidity 4.30% – 15.61%
DescriptionFair value at 30 November 2014 (US$m)
Valuation techniques
Unobservable inputs Range
Debt securities 548 Discounted cash flows Discount rate for liquidity 5.28% – 11.49%
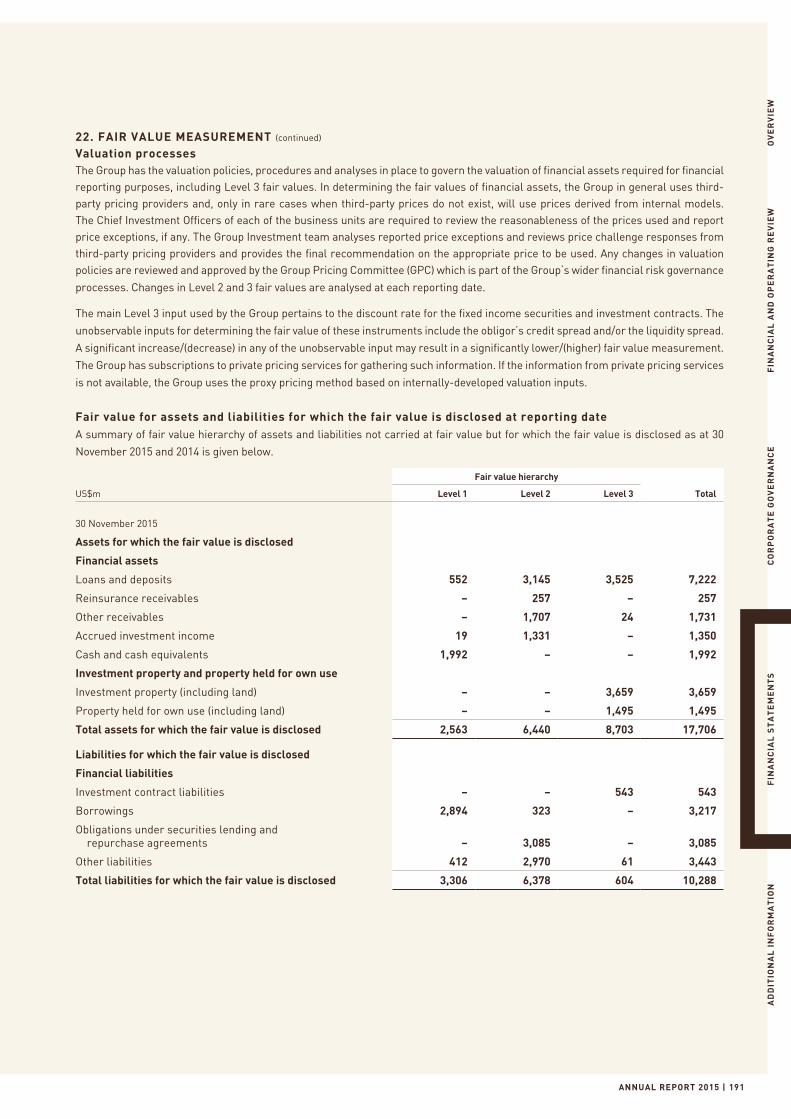
ANNUAL REPORT 2015 | 191
OV
ER
VIE
WF
INA
NC
IAL
AN
D O
PE
RA
TIN
G R
EV
IEW
CO
RP
OR
AT
E G
OV
ER
NA
NC
EF
INA
NC
IAL
ST
AT
EM
EN
TS
AD
DIT
ION
AL
IN
FO
RM
AT
ION
22. FAIR VALUE MEASUREMENT (continued)
Valuation processesThe Group has the valuation policies, procedures and analyses in place to govern the valuation of financial assets required for financial reporting purposes, including Level 3 fair values. In determining the fair values of financial assets, the Group in general uses third-party pricing providers and, only in rare cases when third-party prices do not exist, will use prices derived from internal models. The Chief Investment Officers of each of the business units are required to review the reasonableness of the prices used and report price exceptions, if any. The Group Investment team analyses reported price exceptions and reviews price challenge responses from third-party pricing providers and provides the final recommendation on the appropriate price to be used. Any changes in valuation policies are reviewed and approved by the Group Pricing Committee (GPC) which is part of the Group’s wider financial risk governance
processes. Changes in Level 2 and 3 fair values are analysed at each reporting date.
The main Level 3 input used by the Group pertains to the discount rate for the fixed income securities and investment contracts. The
unobservable inputs for determining the fair value of these instruments include the obligor’s credit spread and/or the liquidity spread.
A significant increase/(decrease) in any of the unobservable input may result in a significantly lower/(higher) fair value measurement.
The Group has subscriptions to private pricing services for gathering such information. If the information from private pricing services
is not available, the Group uses the proxy pricing method based on internally-developed valuation inputs.
Fair value for assets and liabilities for which the fair value is disclosed at reporting dateA summary of fair value hierarchy of assets and liabilities not carried at fair value but for which the fair value is disclosed as at 30
November 2015 and 2014 is given below.
Fair value hierarchy
US$m Level 1 Level 2 Level 3 Total
30 November 2015
Assets for which the fair value is disclosed
Financial assets
Loans and deposits 552 3,145 3,525 7,222
Reinsurance receivables – 257 – 257
Other receivables – 1,707 24 1,731
Accrued investment income 19 1,331 – 1,350
Cash and cash equivalents 1,992 – – 1,992
Investment property and property held for own use
Investment property (including land) – – 3,659 3,659
Property held for own use (including land) – – 1,495 1,495
Total assets for which the fair value is disclosed 2,563 6,440 8,703 17,706
Liabilities for which the fair value is disclosed
Financial liabilities
Investment contract liabilities – – 543 543
Borrowings 2,894 323 – 3,217
Obligations under securities lending and repurchase agreements – 3,085 – 3,085
Other liabilities 412 2,970 61 3,443
Total liabilities for which the fair value is disclosed 3,306 6,378 604 10,288
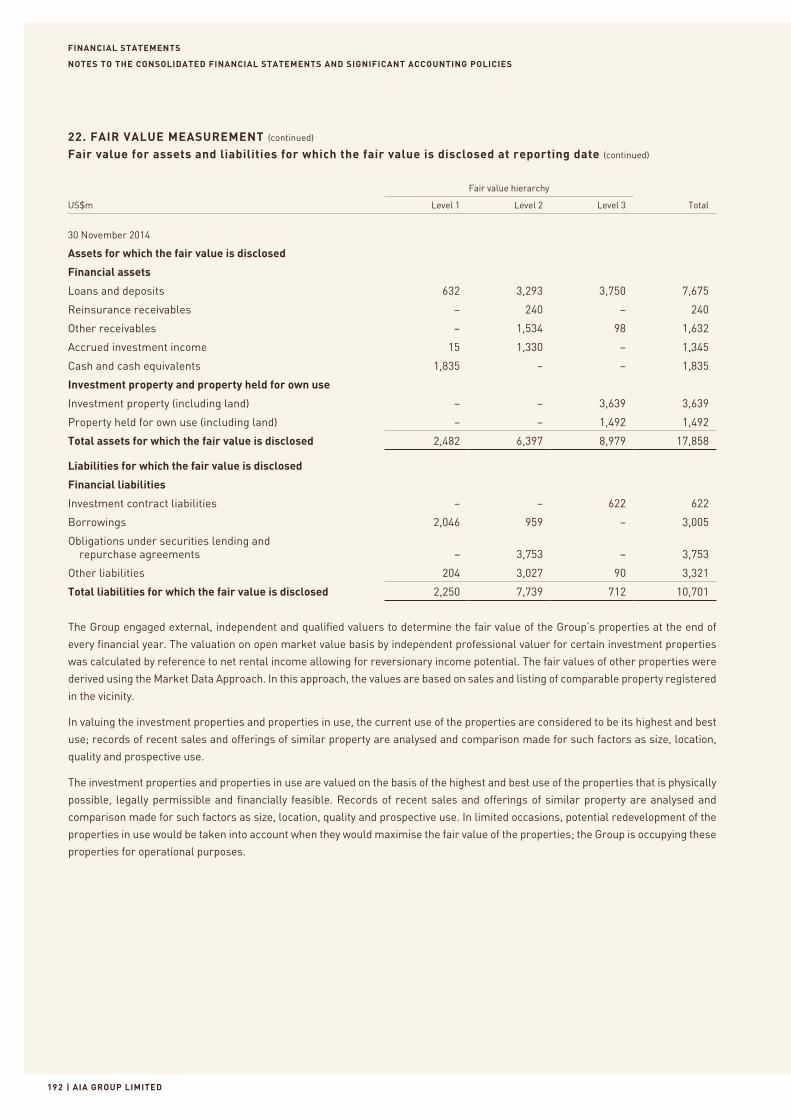
FINANCIAL STATEMENTS
| AIA GROUP LIMITED192
NOTES TO THE CONSOLIDATED FINANCIAL STATEMENTS AND SIGNIFICANT ACCOUNTING POLICIES
22. FAIR VALUE MEASUREMENT (continued)
Fair value for assets and liabilities for which the fair value is disclosed at reporting date (continued)
Fair value hierarchy
US$m Level 1 Level 2 Level 3 Total
30 November 2014
Assets for which the fair value is disclosed
Financial assets
Loans and deposits 632 3,293 3,750 7,675
Reinsurance receivables – 240 – 240
Other receivables – 1,534 98 1,632
Accrued investment income 15 1,330 – 1,345
Cash and cash equivalents 1,835 – – 1,835
Investment property and property held for own use
Investment property (including land) – – 3,639 3,639
Property held for own use (including land) – – 1,492 1,492
Total assets for which the fair value is disclosed 2,482 6,397 8,979 17,858
Liabilities for which the fair value is disclosed
Financial liabilities
Investment contract liabilities – – 622 622
Borrowings 2,046 959 – 3,005
Obligations under securities lending and repurchase agreements – 3,753 – 3,753
Other liabilities 204 3,027 90 3,321
Total liabilities for which the fair value is disclosed 2,250 7,739 712 10,701
The Group engaged external, independent and qualified valuers to determine the fair value of the Group’s properties at the end of
every financial year. The valuation on open market value basis by independent professional valuer for certain investment properties
was calculated by reference to net rental income allowing for reversionary income potential. The fair values of other properties were
derived using the Market Data Approach. In this approach, the values are based on sales and listing of comparable property registered
in the vicinity.
In valuing the investment properties and properties in use, the current use of the properties are considered to be its highest and best
use; records of recent sales and offerings of similar property are analysed and comparison made for such factors as size, location,
quality and prospective use.
The investment properties and properties in use are valued on the basis of the highest and best use of the properties that is physically
possible, legally permissible and financially feasible. Records of recent sales and offerings of similar property are analysed and
comparison made for such factors as size, location, quality and prospective use. In limited occasions, potential redevelopment of the
properties in use would be taken into account when they would maximise the fair value of the properties; the Group is occupying these
properties for operational purposes.
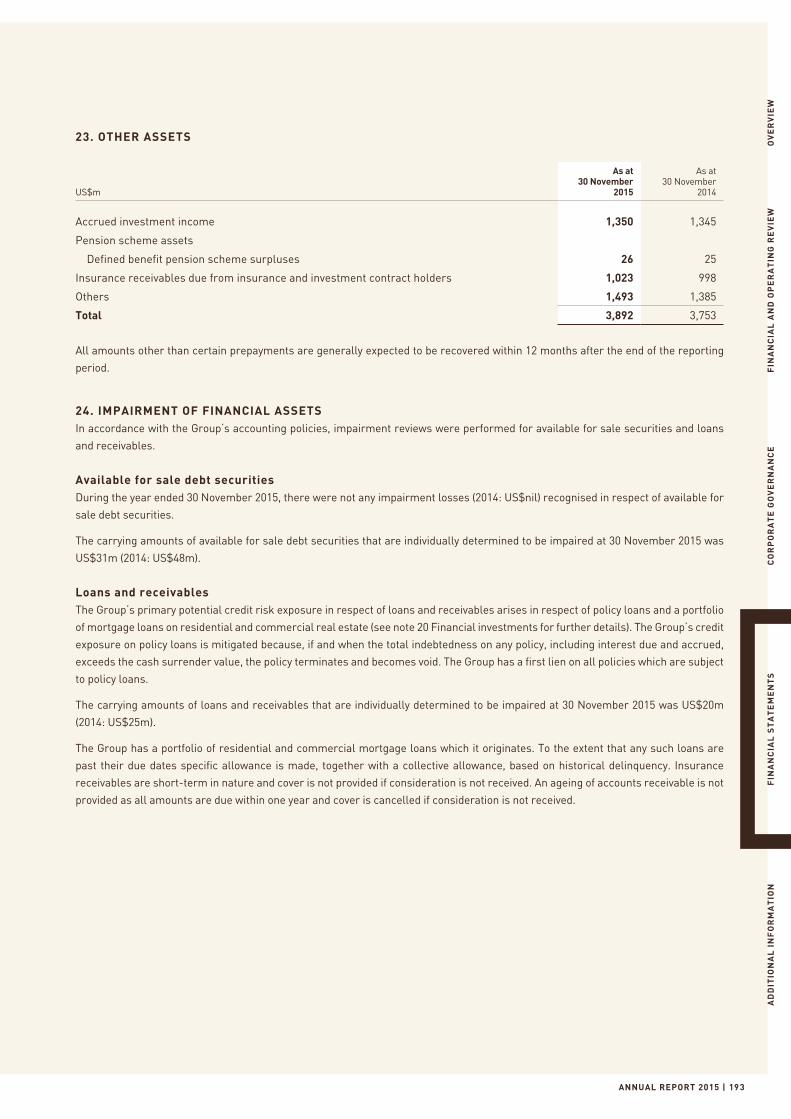
ANNUAL REPORT 2015 | 193
OV
ER
VIE
WF
INA
NC
IAL
AN
D O
PE
RA
TIN
G R
EV
IEW
CO
RP
OR
AT
E G
OV
ER
NA
NC
EF
INA
NC
IAL
ST
AT
EM
EN
TS
AD
DIT
ION
AL
IN
FO
RM
AT
ION
23. OTHER ASSETS
US$m
As at30 November
2015
As at30 November
2014
Accrued investment income 1,350 1,345
Pension scheme assets
Defined benefit pension scheme surpluses 26 25
Insurance receivables due from insurance and investment contract holders 1,023 998
Others 1,493 1,385
Total 3,892 3,753
All amounts other than certain prepayments are generally expected to be recovered within 12 months after the end of the reporting
period.
24. IMPAIRMENT OF FINANCIAL ASSETSIn accordance with the Group’s accounting policies, impairment reviews were performed for available for sale securities and loans
and receivables.
Available for sale debt securitiesDuring the year ended 30 November 2015, there were not any impairment losses (2014: US$nil) recognised in respect of available for
sale debt securities.
The carrying amounts of available for sale debt securities that are individually determined to be impaired at 30 November 2015 was
US$31m (2014: US$48m).
Loans and receivablesThe Group’s primary potential credit risk exposure in respect of loans and receivables arises in respect of policy loans and a portfolio
of mortgage loans on residential and commercial real estate (see note 20 Financial investments for further details). The Group’s credit
exposure on policy loans is mitigated because, if and when the total indebtedness on any policy, including interest due and accrued,
exceeds the cash surrender value, the policy terminates and becomes void. The Group has a first lien on all policies which are subject
to policy loans.
The carrying amounts of loans and receivables that are individually determined to be impaired at 30 November 2015 was US$20m
(2014: US$25m).
The Group has a portfolio of residential and commercial mortgage loans which it originates. To the extent that any such loans are
past their due dates specific allowance is made, together with a collective allowance, based on historical delinquency. Insurance
receivables are short-term in nature and cover is not provided if consideration is not received. An ageing of accounts receivable is not
provided as all amounts are due within one year and cover is cancelled if consideration is not received.
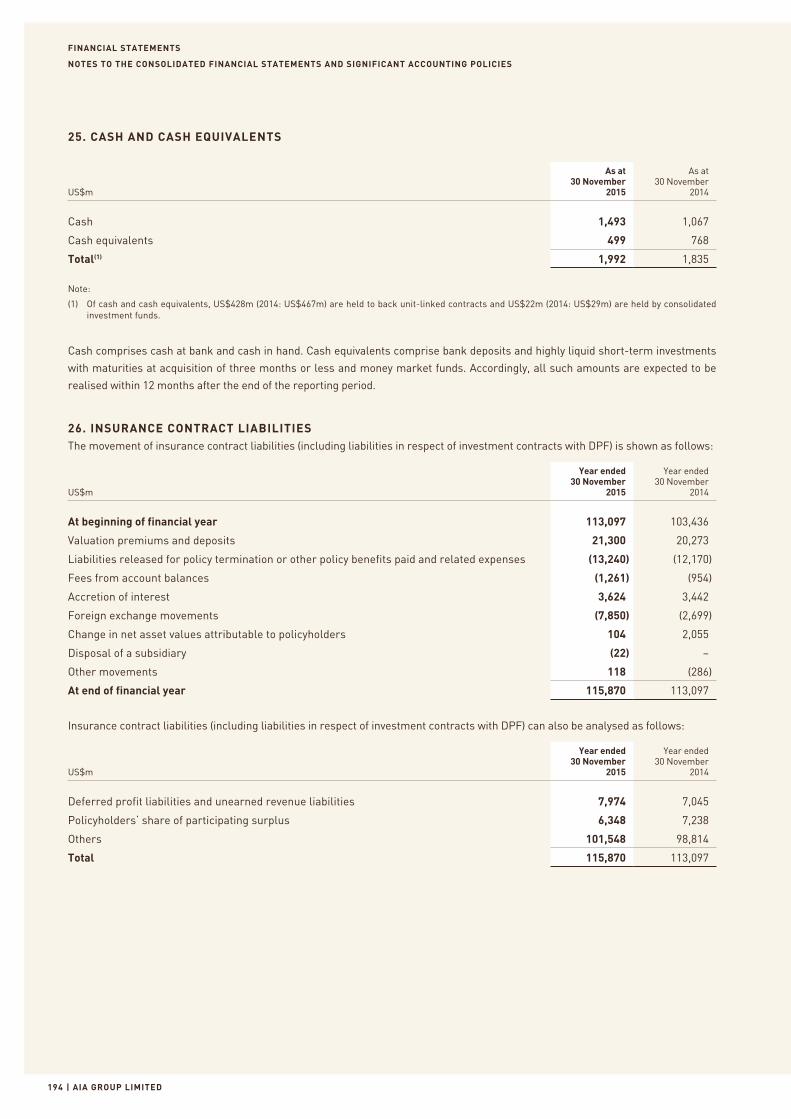
FINANCIAL STATEMENTS
| AIA GROUP LIMITED194
NOTES TO THE CONSOLIDATED FINANCIAL STATEMENTS AND SIGNIFICANT ACCOUNTING POLICIES
25. CASH AND CASH EQUIVALENTS
US$m
As at30 November
2015
As at30 November
2014
Cash 1,493 1,067
Cash equivalents 499 768
Total(1) 1,992 1,835
Note:
(1) Of cash and cash equivalents, US$428m (2014: US$467m) are held to back unit-linked contracts and US$22m (2014: US$29m) are held by consolidated investment funds.
Cash comprises cash at bank and cash in hand. Cash equivalents comprise bank deposits and highly liquid short-term investments
with maturities at acquisition of three months or less and money market funds. Accordingly, all such amounts are expected to be
realised within 12 months after the end of the reporting period.
26. INSURANCE CONTRACT LIABILITIESThe movement of insurance contract liabilities (including liabilities in respect of investment contracts with DPF) is shown as follows:
US$m
Year ended30 November
2015
Year ended30 November
2014
At beginning of financial year 113,097 103,436
Valuation premiums and deposits 21,300 20,273
Liabilities released for policy termination or other policy benefits paid and related expenses (13,240) (12,170)
Fees from account balances (1,261) (954)
Accretion of interest 3,624 3,442
Foreign exchange movements (7,850) (2,699)
Change in net asset values attributable to policyholders 104 2,055
Disposal of a subsidiary (22) –
Other movements 118 (286)
At end of financial year 115,870 113,097
Insurance contract liabilities (including liabilities in respect of investment contracts with DPF) can also be analysed as follows:
US$m
Year ended 30 November
2015
Year ended 30 November
2014
Deferred profit liabilities and unearned revenue liabilities 7,974 7,045
Policyholders’ share of participating surplus 6,348 7,238
Others 101,548 98,814
Total 115,870 113,097
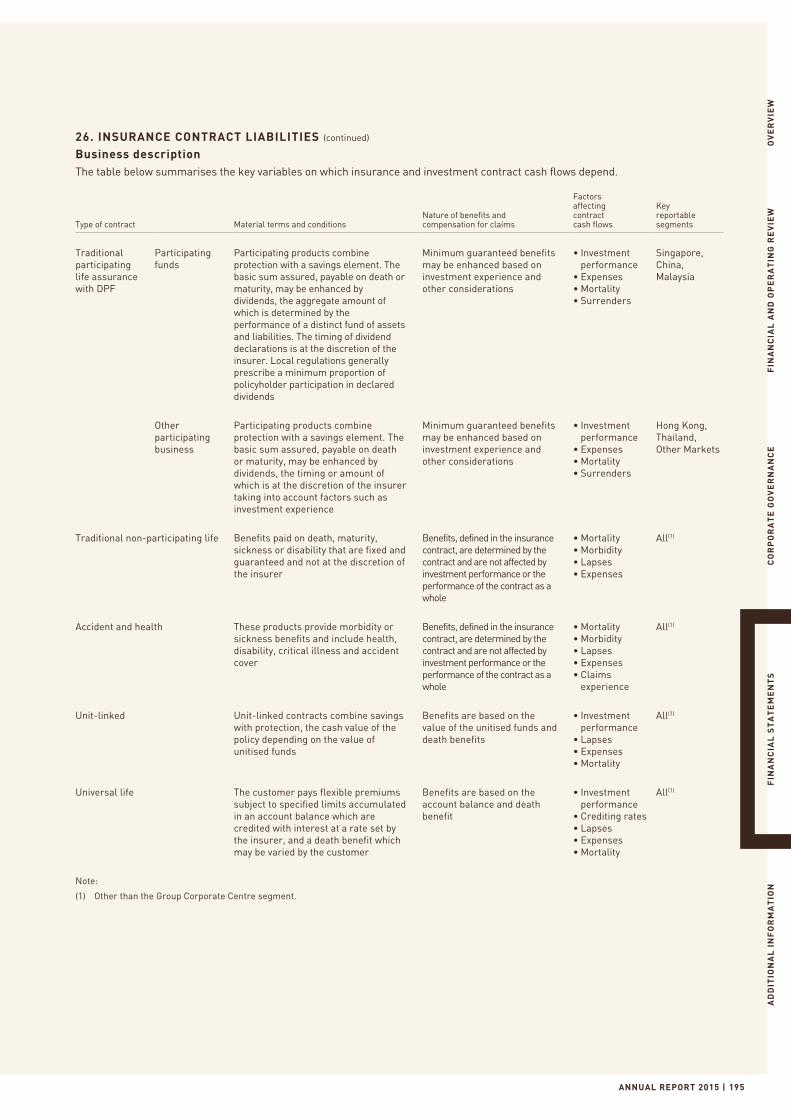
ANNUAL REPORT 2015 | 195
OV
ER
VIE
WF
INA
NC
IAL
AN
D O
PE
RA
TIN
G R
EV
IEW
CO
RP
OR
AT
E G
OV
ER
NA
NC
EF
INA
NC
IAL
ST
AT
EM
EN
TS
AD
DIT
ION
AL
IN
FO
RM
AT
ION
26. INSURANCE CONTRACT LIABILITIES (continued)
Business descriptionThe table below summarises the key variables on which insurance and investment contract cash flows depend.
Type of contract Material terms and conditionsNature of benefits and compensation for claims
Factors affecting contract cash flows
Key reportable segments
Traditional participating life assurance with DPF
Participating funds
Participating products combine protection with a savings element. The basic sum assured, payable on death or maturity, may be enhanced by dividends, the aggregate amount of which is determined by the performance of a distinct fund of assets and liabilities. The timing of dividend declarations is at the discretion of the insurer. Local regulations generally prescribe a minimum proportion of policyholder participation in declared dividends
Minimum guaranteed benefits may be enhanced based on investment experience and other considerations
• Investment performance
• Expenses• Mortality• Surrenders
Singapore, China, Malaysia
Other participating business
Participating products combine protection with a savings element. The basic sum assured, payable on death or maturity, may be enhanced by dividends, the timing or amount of which is at the discretion of the insurer taking into account factors such as investment experience
Minimum guaranteed benefits may be enhanced based on investment experience and other considerations
• Investment performance
• Expenses• Mortality• Surrenders
Hong Kong,Thailand,Other Markets
Traditional non-participating life Benefits paid on death, maturity, sickness or disability that are fixed and guaranteed and not at the discretion of the insurer
Benefits, defined in the insurance contract, are determined by the contract and are not affected by investment performance or the performance of the contract as a whole
• Mortality• Morbidity• Lapses• Expenses
All(1)
Accident and health These products provide morbidity or sickness benefits and include health, disability, critical illness and accident cover
Benefits, defined in the insurance contract, are determined by the contract and are not affected by investment performance or the performance of the contract as a whole
• Mortality• Morbidity• Lapses• Expenses• Claims
experience
All(1)
Unit-linked Unit-linked contracts combine savings with protection, the cash value of the policy depending on the value of unitised funds
Benefits are based on the value of the unitised funds and death benefits
• Investment performance
• Lapses• Expenses• Mortality
All(1)
Universal life The customer pays flexible premiums subject to specified limits accumulated in an account balance which are credited with interest at a rate set by the insurer, and a death benefit which may be varied by the customer
Benefits are based on the account balance and death benefit
• Investment performance
• Crediting rates• Lapses• Expenses• Mortality
All(1)
Note:
(1) Other than the Group Corporate Centre segment.
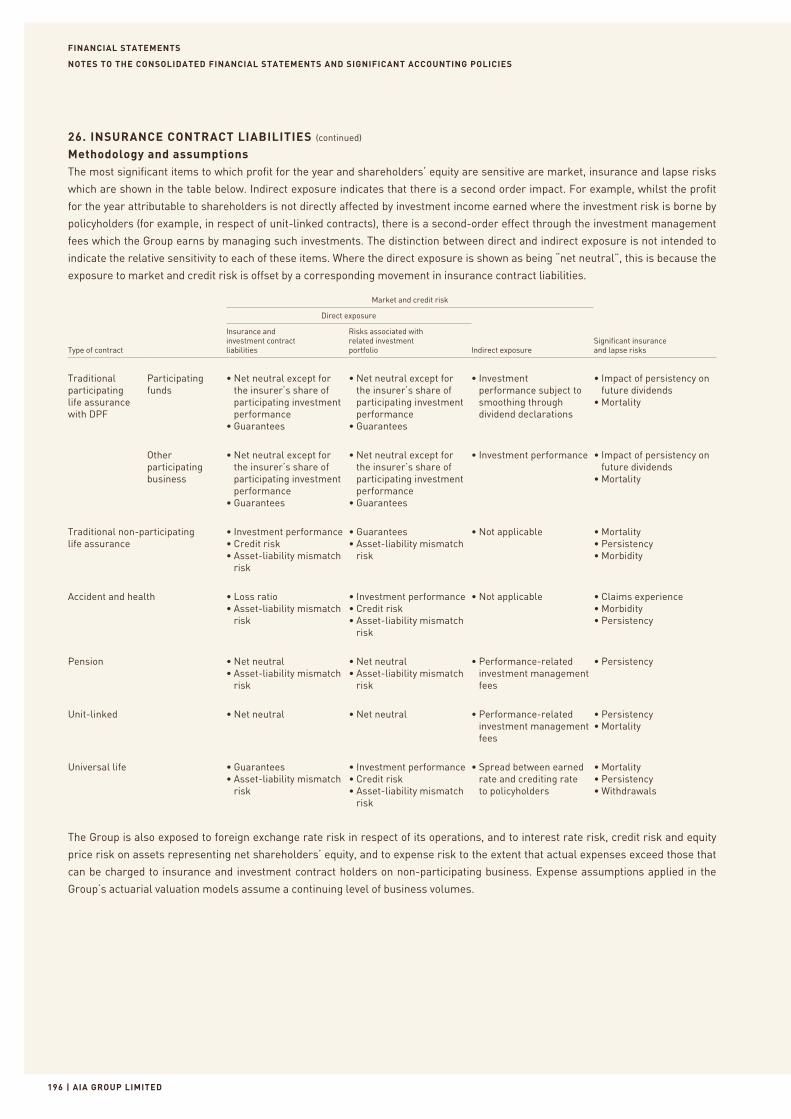
FINANCIAL STATEMENTS
| AIA GROUP LIMITED196
NOTES TO THE CONSOLIDATED FINANCIAL STATEMENTS AND SIGNIFICANT ACCOUNTING POLICIES
26. INSURANCE CONTRACT LIABILITIES (continued)
Methodology and assumptionsThe most significant items to which profit for the year and shareholders’ equity are sensitive are market, insurance and lapse risks
which are shown in the table below. Indirect exposure indicates that there is a second order impact. For example, whilst the profit
for the year attributable to shareholders is not directly affected by investment income earned where the investment risk is borne by
policyholders (for example, in respect of unit-linked contracts), there is a second-order effect through the investment management
fees which the Group earns by managing such investments. The distinction between direct and indirect exposure is not intended to
indicate the relative sensitivity to each of these items. Where the direct exposure is shown as being “net neutral”, this is because the
exposure to market and credit risk is offset by a corresponding movement in insurance contract liabilities.
Market and credit risk
Direct exposure
Type of contract
Insurance and investment contract liabilities
Risks associated with related investment portfolio Indirect exposure
Significant insuranceand lapse risks
Traditional participating life assurance with DPF
Participating funds
• Net neutral except for the insurer’s share of participating investment performance
• Guarantees
• Net neutral except for the insurer’s share of participating investment performance
• Guarantees
• Investment performance subject to smoothing through dividend declarations
• Impact of persistency on future dividends
• Mortality
Other participating business
• Net neutral except for the insurer’s share of participating investment performance
• Guarantees
• Net neutral except for the insurer’s share of participating investment performance
• Guarantees
• Investment performance • Impact of persistency on future dividends
• Mortality
Traditional non-participating life assurance
• Investment performance• Credit risk• Asset-liability mismatch
risk
• Guarantees• Asset-liability mismatch
risk
• Not applicable • Mortality• Persistency• Morbidity
Accident and health • Loss ratio• Asset-liability mismatch
risk
• Investment performance• Credit risk• Asset-liability mismatch
risk
• Not applicable • Claims experience• Morbidity• Persistency
Pension • Net neutral• Asset-liability mismatch
risk
• Net neutral• Asset-liability mismatch
risk
• Performance-related investment management fees
• Persistency
Unit-linked • Net neutral • Net neutral • Performance-related investment management fees
• Persistency• Mortality
Universal life • Guarantees• Asset-liability mismatch
risk
• Investment performance• Credit risk• Asset-liability mismatch
risk
• Spread between earned rate and crediting rate to policyholders
• Mortality• Persistency• Withdrawals
The Group is also exposed to foreign exchange rate risk in respect of its operations, and to interest rate risk, credit risk and equity
price risk on assets representing net shareholders’ equity, and to expense risk to the extent that actual expenses exceed those that
can be charged to insurance and investment contract holders on non-participating business. Expense assumptions applied in the
Group’s actuarial valuation models assume a continuing level of business volumes.
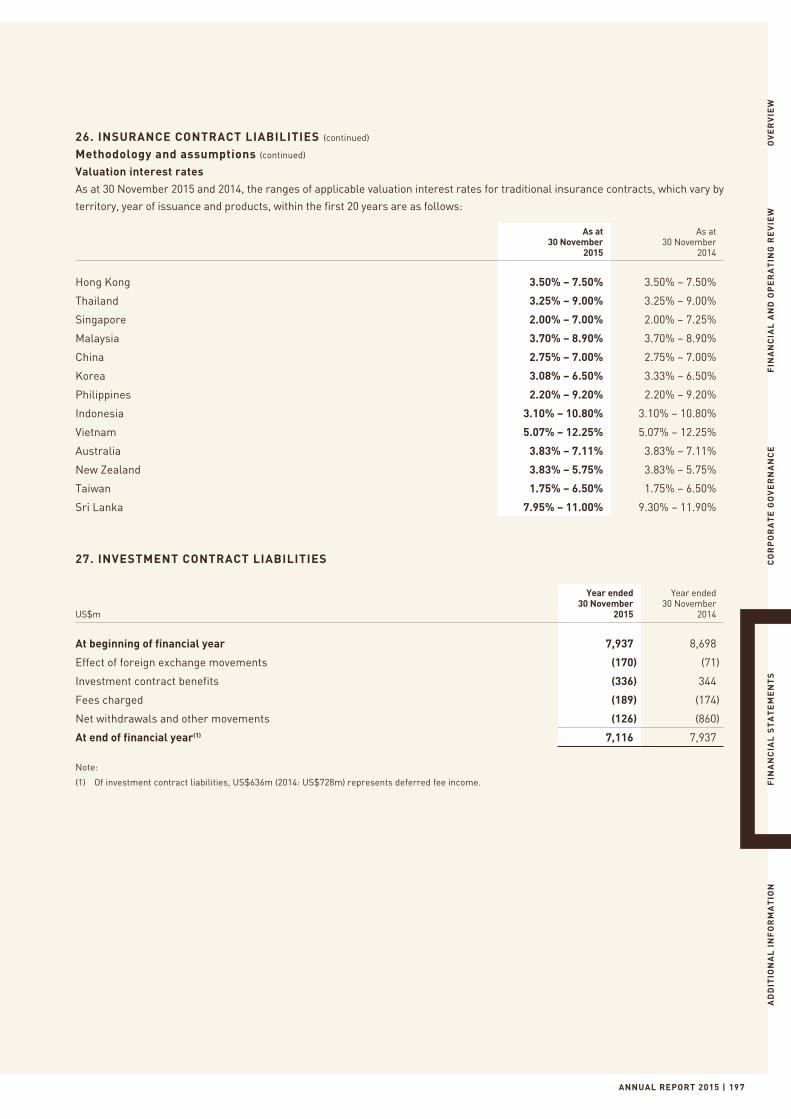
ANNUAL REPORT 2015 | 197
OV
ER
VIE
WF
INA
NC
IAL
AN
D O
PE
RA
TIN
G R
EV
IEW
CO
RP
OR
AT
E G
OV
ER
NA
NC
EF
INA
NC
IAL
ST
AT
EM
EN
TS
AD
DIT
ION
AL
IN
FO
RM
AT
ION
26. INSURANCE CONTRACT LIABILITIES (continued)
Methodology and assumptions (continued)
Valuation interest rates
As at 30 November 2015 and 2014, the ranges of applicable valuation interest rates for traditional insurance contracts, which vary by
territory, year of issuance and products, within the first 20 years are as follows:
As at30 November
2015
As at30 November
2014
Hong Kong 3.50% – 7.50% 3.50% – 7.50%
Thailand 3.25% – 9.00% 3.25% – 9.00%
Singapore 2.00% – 7.00% 2.00% – 7.25%
Malaysia 3.70% – 8.90% 3.70% – 8.90%
China 2.75% – 7.00% 2.75% – 7.00%
Korea 3.08% – 6.50% 3.33% – 6.50%
Philippines 2.20% – 9.20% 2.20% – 9.20%
Indonesia 3.10% – 10.80% 3.10% – 10.80%
Vietnam 5.07% – 12.25% 5.07% – 12.25%
Australia 3.83% – 7.11% 3.83% – 7.11%
New Zealand 3.83% – 5.75% 3.83% – 5.75%
Taiwan 1.75% – 6.50% 1.75% – 6.50%
Sri Lanka 7.95% – 11.00% 9.30% – 11.90%
27. INVESTMENT CONTRACT LIABILITIES
US$m
Year ended30 November
2015
Year ended30 November
2014
At beginning of financial year 7,937 8,698
Effect of foreign exchange movements (170) (71)
Investment contract benefits (336) 344
Fees charged (189) (174)
Net withdrawals and other movements (126) (860)
At end of financial year(1) 7,116 7,937
Note:
(1) Of investment contract liabilities, US$636m (2014: US$728m) represents deferred fee income.
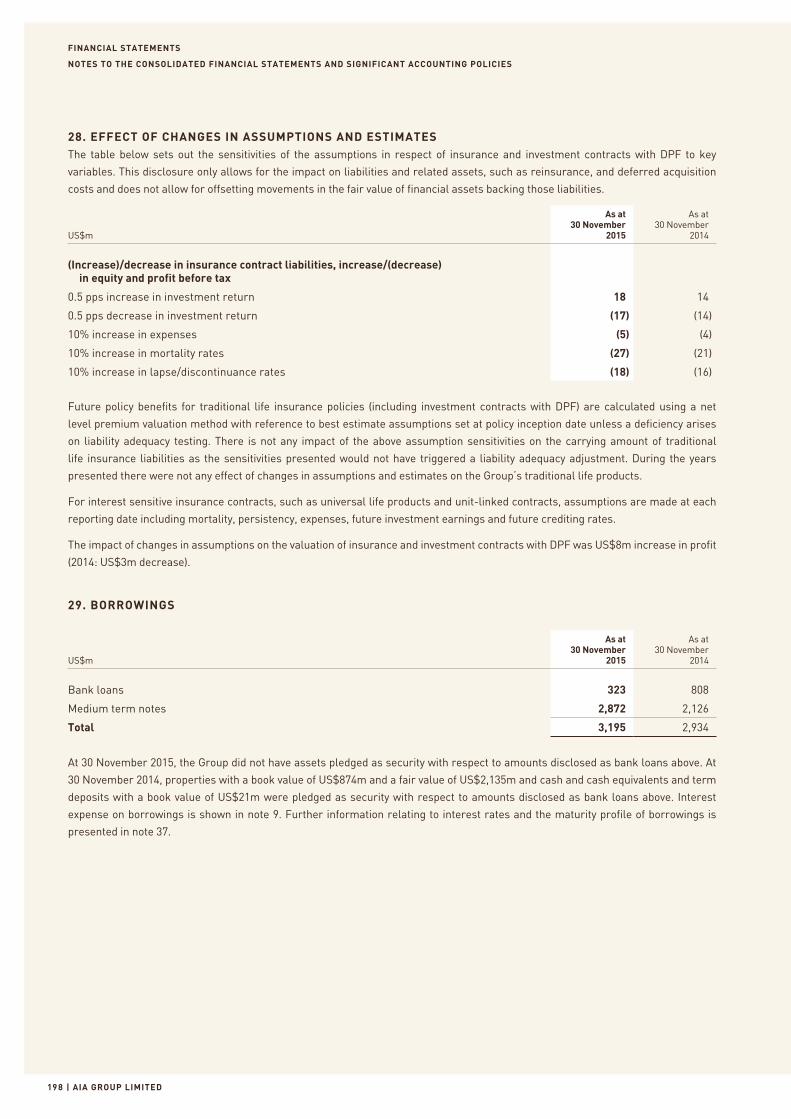
FINANCIAL STATEMENTS
| AIA GROUP LIMITED198
NOTES TO THE CONSOLIDATED FINANCIAL STATEMENTS AND SIGNIFICANT ACCOUNTING POLICIES
28. EFFECT OF CHANGES IN ASSUMPTIONS AND ESTIMATESThe table below sets out the sensitivities of the assumptions in respect of insurance and investment contracts with DPF to key
variables. This disclosure only allows for the impact on liabilities and related assets, such as reinsurance, and deferred acquisition
costs and does not allow for offsetting movements in the fair value of financial assets backing those liabilities.
US$m
As at30 November
2015
As at30 November
2014
(Increase)/decrease in insurance contract liabilities, increase/(decrease) in equity and profit before tax
0.5 pps increase in investment return 18 14
0.5 pps decrease in investment return (17) (14)
10% increase in expenses (5) (4)
10% increase in mortality rates (27) (21)
10% increase in lapse/discontinuance rates (18) (16)
Future policy benefits for traditional life insurance policies (including investment contracts with DPF) are calculated using a net
level premium valuation method with reference to best estimate assumptions set at policy inception date unless a deficiency arises
on liability adequacy testing. There is not any impact of the above assumption sensitivities on the carrying amount of traditional
life insurance liabilities as the sensitivities presented would not have triggered a liability adequacy adjustment. During the years
presented there were not any effect of changes in assumptions and estimates on the Group’s traditional life products.
For interest sensitive insurance contracts, such as universal life products and unit-linked contracts, assumptions are made at each
reporting date including mortality, persistency, expenses, future investment earnings and future crediting rates.
The impact of changes in assumptions on the valuation of insurance and investment contracts with DPF was US$8m increase in profit
(2014: US$3m decrease).
29. BORROWINGS
US$m
As at30 November
2015
As at30 November
2014
Bank loans 323 808
Medium term notes 2,872 2,126
Total 3,195 2,934
At 30 November 2015, the Group did not have assets pledged as security with respect to amounts disclosed as bank loans above. At
30 November 2014, properties with a book value of US$874m and a fair value of US$2,135m and cash and cash equivalents and term
deposits with a book value of US$21m were pledged as security with respect to amounts disclosed as bank loans above. Interest
expense on borrowings is shown in note 9. Further information relating to interest rates and the maturity profile of borrowings is
presented in note 37.
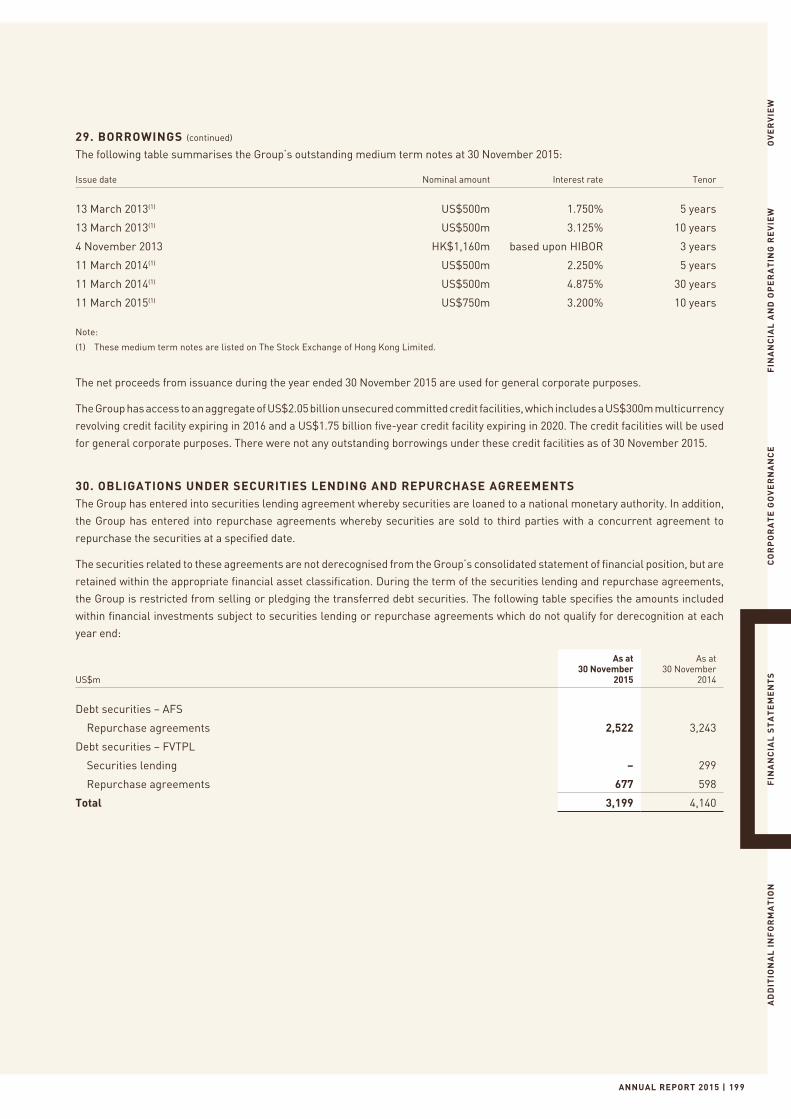
ANNUAL REPORT 2015 | 199
OV
ER
VIE
WF
INA
NC
IAL
AN
D O
PE
RA
TIN
G R
EV
IEW
CO
RP
OR
AT
E G
OV
ER
NA
NC
EF
INA
NC
IAL
ST
AT
EM
EN
TS
AD
DIT
ION
AL
IN
FO
RM
AT
ION
29. BORROWINGS (continued)
The following table summarises the Group’s outstanding medium term notes at 30 November 2015:
Issue date Nominal amount Interest rate Tenor
13 March 2013(1) US$500m 1.750% 5 years
13 March 2013(1) US$500m 3.125% 10 years
4 November 2013 HK$1,160m based upon HIBOR 3 years
11 March 2014(1) US$500m 2.250% 5 years
11 March 2014(1) US$500m 4.875% 30 years
11 March 2015(1) US$750m 3.200% 10 years
Note:
(1) These medium term notes are listed on The Stock Exchange of Hong Kong Limited.
The net proceeds from issuance during the year ended 30 November 2015 are used for general corporate purposes.
The Group has access to an aggregate of US$2.05 billion unsecured committed credit facilities, which includes a US$300m multicurrency
revolving credit facility expiring in 2016 and a US$1.75 billion five-year credit facility expiring in 2020. The credit facilities will be used
for general corporate purposes. There were not any outstanding borrowings under these credit facilities as of 30 November 2015.
30. OBLIGATIONS UNDER SECURITIES LENDING AND REPURCHASE AGREEMENTSThe Group has entered into securities lending agreement whereby securities are loaned to a national monetary authority. In addition,
the Group has entered into repurchase agreements whereby securities are sold to third parties with a concurrent agreement to
repurchase the securities at a specified date.
The securities related to these agreements are not derecognised from the Group’s consolidated statement of financial position, but are
retained within the appropriate financial asset classification. During the term of the securities lending and repurchase agreements,
the Group is restricted from selling or pledging the transferred debt securities. The following table specifies the amounts included
within financial investments subject to securities lending or repurchase agreements which do not qualify for derecognition at each
year end:
US$m
As at30 November
2015
As at30 November
2014
Debt securities – AFS
Repurchase agreements 2,522 3,243
Debt securities – FVTPL
Securities lending – 299
Repurchase agreements 677 598
Total 3,199 4,140
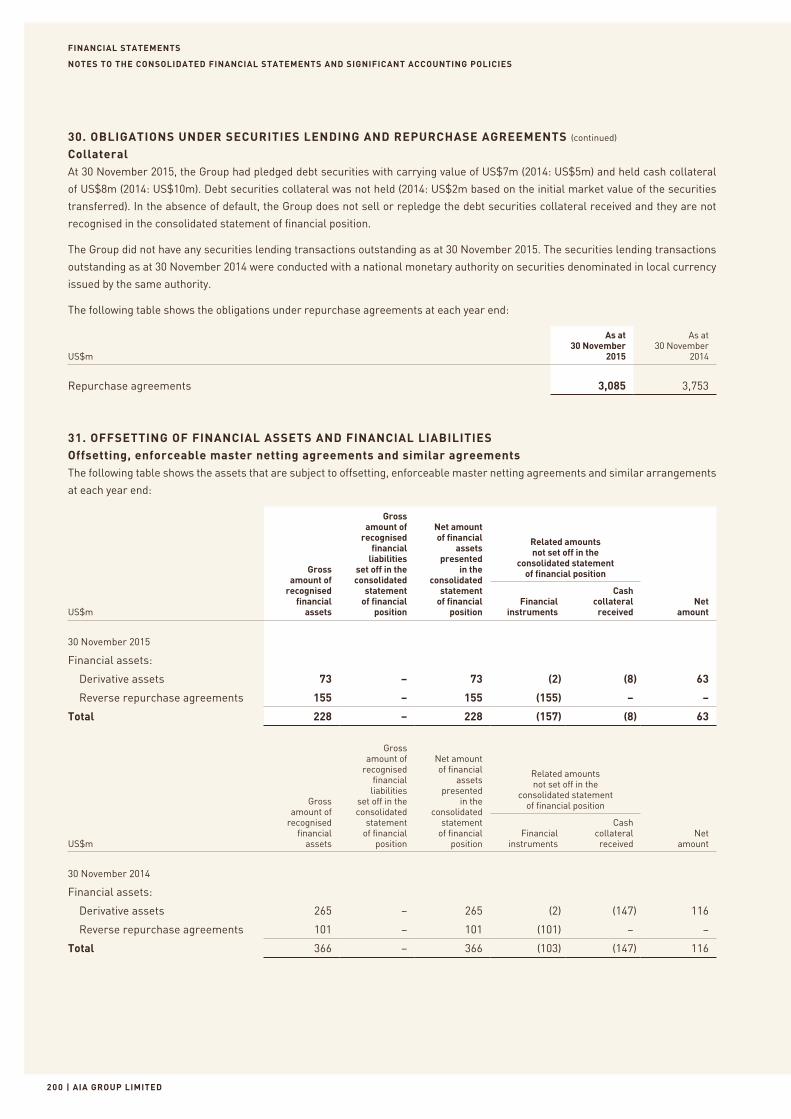
FINANCIAL STATEMENTS
| AIA GROUP LIMITED200
NOTES TO THE CONSOLIDATED FINANCIAL STATEMENTS AND SIGNIFICANT ACCOUNTING POLICIES
30. OBLIGATIONS UNDER SECURITIES LENDING AND REPURCHASE AGREEMENTS (continued)
CollateralAt 30 November 2015, the Group had pledged debt securities with carrying value of US$7m (2014: US$5m) and held cash collateral
of US$8m (2014: US$10m). Debt securities collateral was not held (2014: US$2m based on the initial market value of the securities
transferred). In the absence of default, the Group does not sell or repledge the debt securities collateral received and they are not
recognised in the consolidated statement of financial position.
The Group did not have any securities lending transactions outstanding as at 30 November 2015. The securities lending transactions
outstanding as at 30 November 2014 were conducted with a national monetary authority on securities denominated in local currency
issued by the same authority.
The following table shows the obligations under repurchase agreements at each year end:
US$m
As at30 November
2015
As at30 November
2014
Repurchase agreements 3,085 3,753
31. OFFSETTING OF FINANCIAL ASSETS AND FINANCIAL LIABILITIESOffsetting, enforceable master netting agreements and similar agreementsThe following table shows the assets that are subject to offsetting, enforceable master netting agreements and similar arrangements
at each year end:
US$m
Gross amount of
recognised financial
assets
Grossamount of
recognised financial
liabilities set off in the consolidated
statement of financial
position
Net amount of financial
assets presented
in the consolidated
statement of financial
position
Related amounts not set off in the
consolidated statement of financial position
Net amount
Financial instruments
Cash collateral
received
30 November 2015
Financial assets:
Derivative assets 73 – 73 (2) (8) 63
Reverse repurchase agreements 155 – 155 (155) – –
Total 228 – 228 (157) (8) 63
US$m
Gross amount of
recognised financial
assets
Gross amount of
recognised financial liabilities
set off in the consolidated
statement of financial
position
Net amount of financial
assets presented
in the consolidated
statement of financial
position
Related amounts not set off in the
consolidated statement of financial position
Net amount
Financial instruments
Cash collateral received
30 November 2014
Financial assets:
Derivative assets 265 – 265 (2) (147) 116
Reverse repurchase agreements 101 – 101 (101) – –
Total 366 – 366 (103) (147) 116
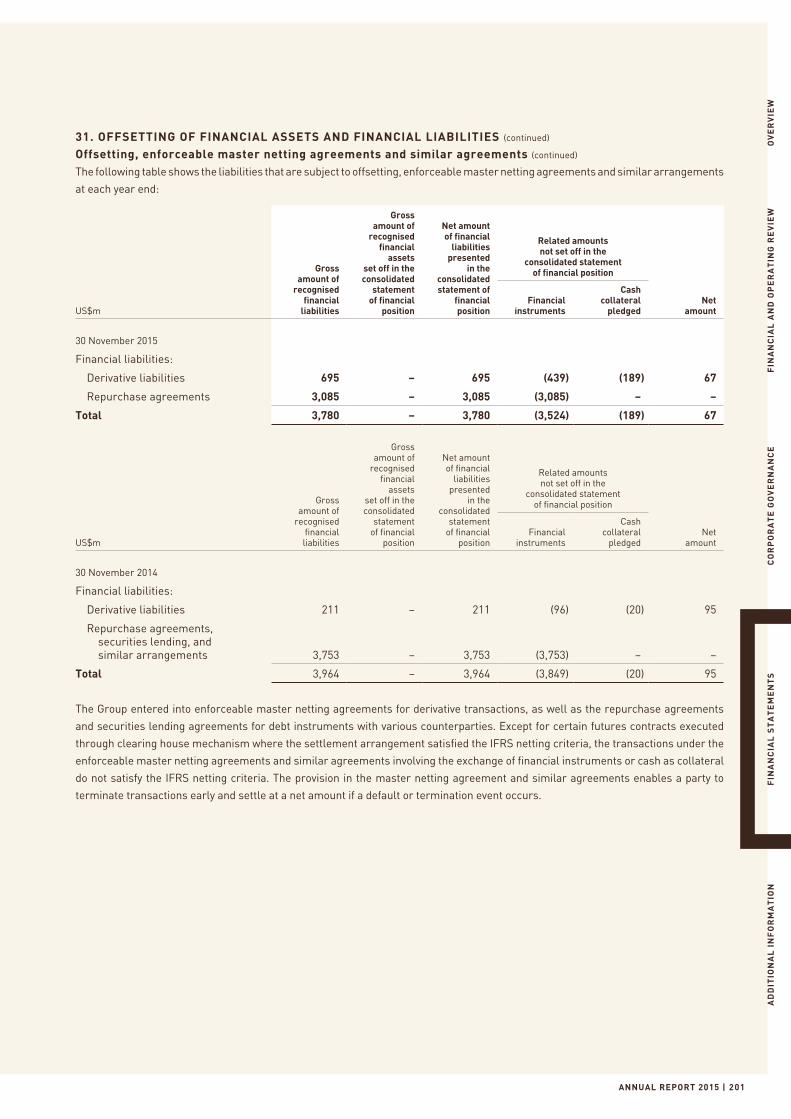
ANNUAL REPORT 2015 | 201
OV
ER
VIE
WF
INA
NC
IAL
AN
D O
PE
RA
TIN
G R
EV
IEW
CO
RP
OR
AT
E G
OV
ER
NA
NC
EF
INA
NC
IAL
ST
AT
EM
EN
TS
AD
DIT
ION
AL
IN
FO
RM
AT
ION
31. OFFSETTING OF FINANCIAL ASSETS AND FINANCIAL LIABILITIES (continued)
Offsetting, enforceable master netting agreements and similar agreements (continued)
The following table shows the liabilities that are subject to offsetting, enforceable master netting agreements and similar arrangements
at each year end:
US$m
Gross amount of
recognised financial
liabilities
Gross amount of
recognised financial
assets set off in the consolidated
statement of financial
position
Net amount of financial
liabilities presented
in the consolidated statement of
financial position
Related amounts not set off in the
consolidated statement of financial position
Net amount
Financial instruments
Cash collateral
pledged
30 November 2015
Financial liabilities:
Derivative liabilities 695 – 695 (439) (189) 67
Repurchase agreements 3,085 – 3,085 (3,085) – –
Total 3,780 – 3,780 (3,524) (189) 67
US$m
Gross amount of
recognised financial liabilities
Gross amount of
recognised financial
assets set off in the consolidated
statement of financial
position
Net amount of financial
liabilities presented
in the consolidated
statement of financial
position
Related amounts not set off in the
consolidated statement of financial position
Net amount
Financial instruments
Cash collateral
pledged
30 November 2014
Financial liabilities:
Derivative liabilities 211 – 211 (96) (20) 95
Repurchase agreements, securities lending, and similar arrangements 3,753 – 3,753 (3,753) – –
Total 3,964 – 3,964 (3,849) (20) 95
The Group entered into enforceable master netting agreements for derivative transactions, as well as the repurchase agreements
and securities lending agreements for debt instruments with various counterparties. Except for certain futures contracts executed
through clearing house mechanism where the settlement arrangement satisfied the IFRS netting criteria, the transactions under the
enforceable master netting agreements and similar agreements involving the exchange of financial instruments or cash as collateral
do not satisfy the IFRS netting criteria. The provision in the master netting agreement and similar agreements enables a party to
terminate transactions early and settle at a net amount if a default or termination event occurs.
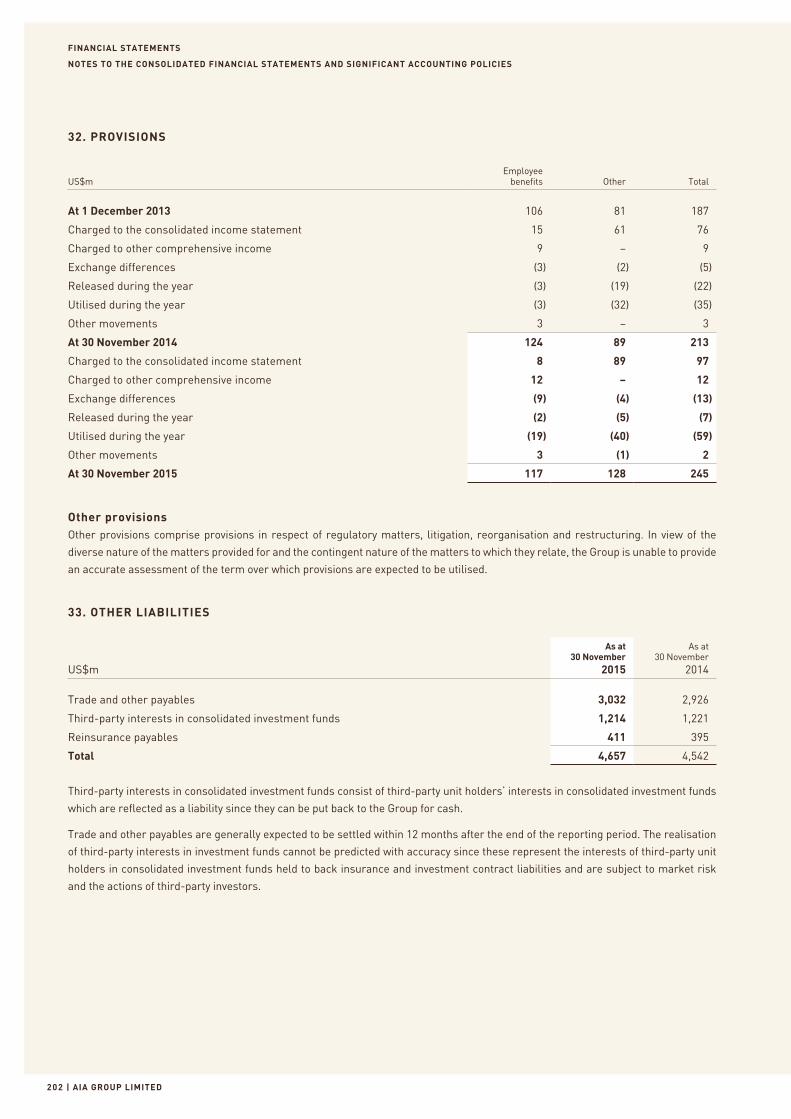
FINANCIAL STATEMENTS
| AIA GROUP LIMITED202
NOTES TO THE CONSOLIDATED FINANCIAL STATEMENTS AND SIGNIFICANT ACCOUNTING POLICIES
32. PROVISIONS
US$mEmployee
benefits Other Total
At 1 December 2013 106 81 187
Charged to the consolidated income statement 15 61 76
Charged to other comprehensive income 9 – 9
Exchange differences (3) (2) (5)
Released during the year (3) (19) (22)
Utilised during the year (3) (32) (35)
Other movements 3 – 3
At 30 November 2014 124 89 213
Charged to the consolidated income statement 8 89 97
Charged to other comprehensive income 12 – 12
Exchange differences (9) (4) (13)
Released during the year (2) (5) (7)
Utilised during the year (19) (40) (59)
Other movements 3 (1) 2
At 30 November 2015 117 128 245
Other provisionsOther provisions comprise provisions in respect of regulatory matters, litigation, reorganisation and restructuring. In view of the
diverse nature of the matters provided for and the contingent nature of the matters to which they relate, the Group is unable to provide
an accurate assessment of the term over which provisions are expected to be utilised.
33. OTHER LIABILITIES
US$m
As at30 November
2015
As at30 November
2014
Trade and other payables 3,032 2,926
Third-party interests in consolidated investment funds 1,214 1,221
Reinsurance payables 411 395
Total 4,657 4,542
Third-party interests in consolidated investment funds consist of third-party unit holders’ interests in consolidated investment funds
which are reflected as a liability since they can be put back to the Group for cash.
Trade and other payables are generally expected to be settled within 12 months after the end of the reporting period. The realisation
of third-party interests in investment funds cannot be predicted with accuracy since these represent the interests of third-party unit
holders in consolidated investment funds held to back insurance and investment contract liabilities and are subject to market risk
and the actions of third-party investors.
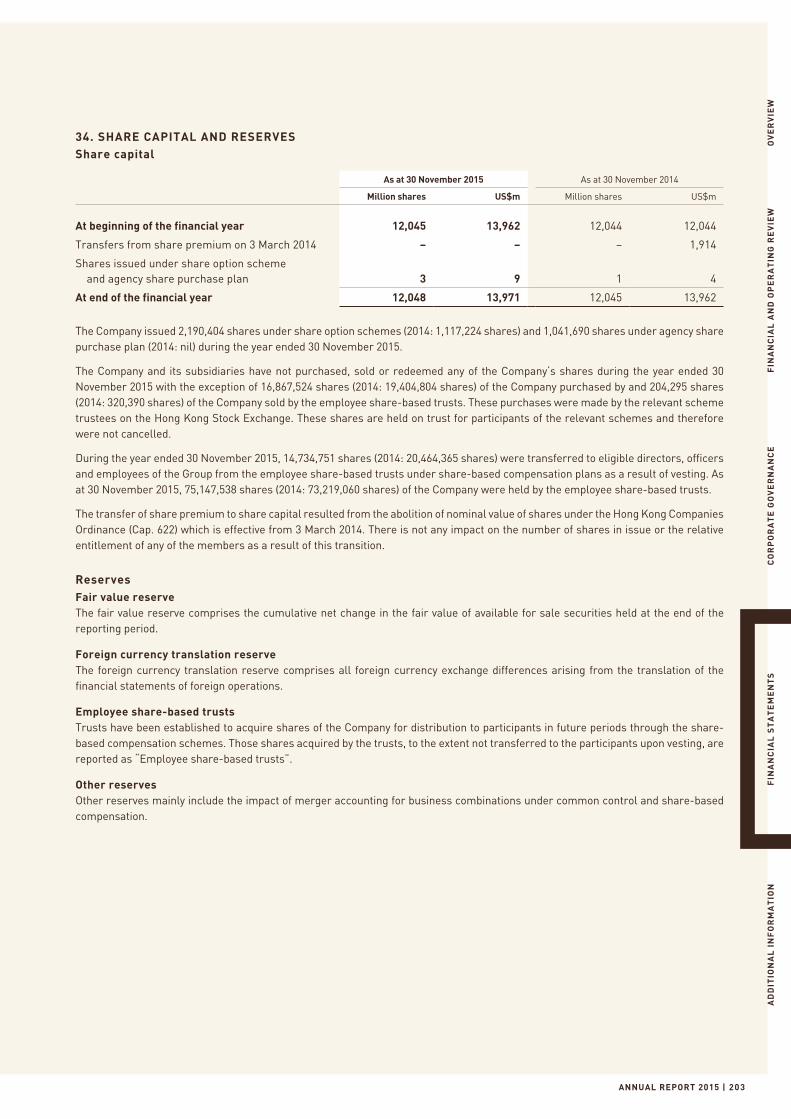
ANNUAL REPORT 2015 | 203
OV
ER
VIE
WF
INA
NC
IAL
AN
D O
PE
RA
TIN
G R
EV
IEW
CO
RP
OR
AT
E G
OV
ER
NA
NC
EF
INA
NC
IAL
ST
AT
EM
EN
TS
AD
DIT
ION
AL
IN
FO
RM
AT
ION
34. SHARE CAPITAL AND RESERVESShare capital
As at 30 November 2015 As at 30 November 2014
Million shares US$m Million shares US$m
At beginning of the financial year 12,045 13,962 12,044 12,044
Transfers from share premium on 3 March 2014 – – – 1,914
Shares issued under share option scheme and agency share purchase plan 3 9 1 4
At end of the financial year 12,048 13,971 12,045 13,962
The Company issued 2,190,404 shares under share option schemes (2014: 1,117,224 shares) and 1,041,690 shares under agency share purchase plan (2014: nil) during the year ended 30 November 2015.
The Company and its subsidiaries have not purchased, sold or redeemed any of the Company’s shares during the year ended 30 November 2015 with the exception of 16,867,524 shares (2014: 19,404,804 shares) of the Company purchased by and 204,295 shares (2014: 320,390 shares) of the Company sold by the employee share-based trusts. These purchases were made by the relevant scheme trustees on the Hong Kong Stock Exchange. These shares are held on trust for participants of the relevant schemes and therefore were not cancelled.
During the year ended 30 November 2015, 14,734,751 shares (2014: 20,464,365 shares) were transferred to eligible directors, officers and employees of the Group from the employee share-based trusts under share-based compensation plans as a result of vesting. As at 30 November 2015, 75,147,538 shares (2014: 73,219,060 shares) of the Company were held by the employee share-based trusts.
The transfer of share premium to share capital resulted from the abolition of nominal value of shares under the Hong Kong Companies Ordinance (Cap. 622) which is effective from 3 March 2014. There is not any impact on the number of shares in issue or the relative entitlement of any of the members as a result of this transition.
ReservesFair value reserveThe fair value reserve comprises the cumulative net change in the fair value of available for sale securities held at the end of the reporting period.
Foreign currency translation reserveThe foreign currency translation reserve comprises all foreign currency exchange differences arising from the translation of the financial statements of foreign operations.
Employee share-based trustsTrusts have been established to acquire shares of the Company for distribution to participants in future periods through the share-based compensation schemes. Those shares acquired by the trusts, to the extent not transferred to the participants upon vesting, are reported as “Employee share-based trusts”.
Other reservesOther reserves mainly include the impact of merger accounting for business combinations under common control and share-based compensation.
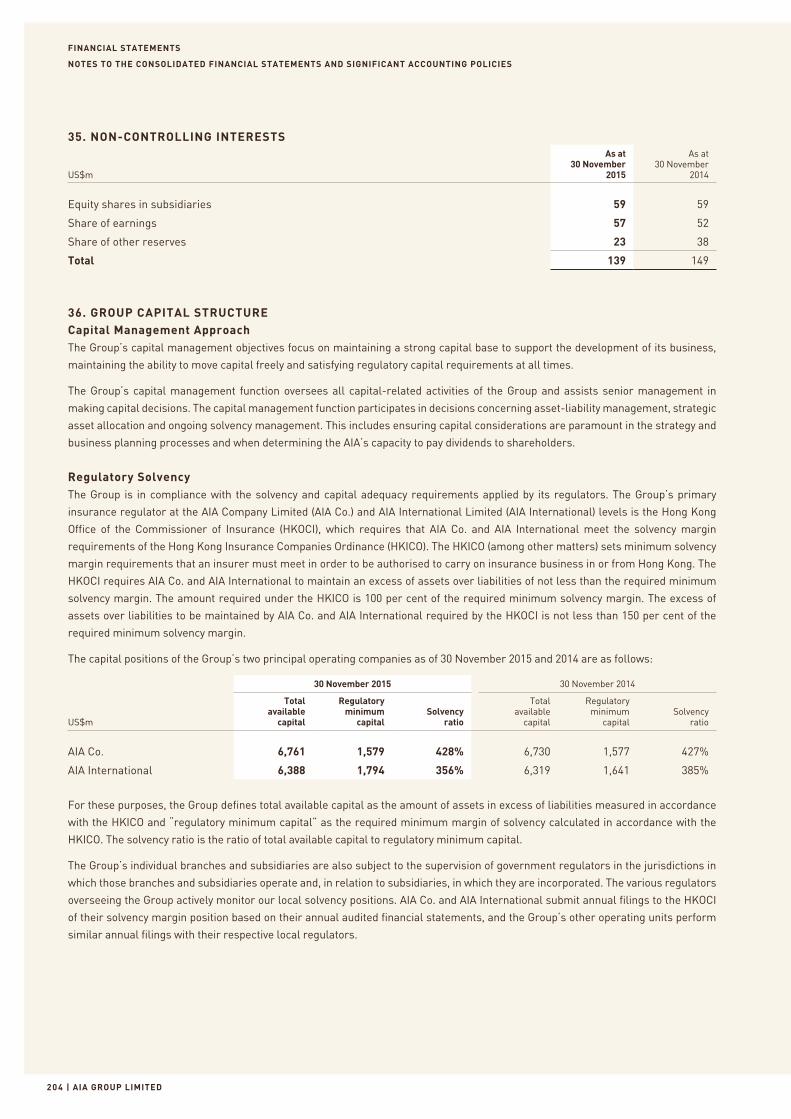
FINANCIAL STATEMENTS
| AIA GROUP LIMITED20 4
NOTES TO THE CONSOLIDATED FINANCIAL STATEMENTS AND SIGNIFICANT ACCOUNTING POLICIES
35. NON-CONTROLLING INTERESTS
US$m
As at 30 November
2015
As at 30 November
2014
Equity shares in subsidiaries 59 59
Share of earnings 57 52
Share of other reserves 23 38
Total 139 149
36. GROUP CAPITAL STRUCTURECapital Management ApproachThe Group’s capital management objectives focus on maintaining a strong capital base to support the development of its business,
maintaining the ability to move capital freely and satisfying regulatory capital requirements at all times.
The Group’s capital management function oversees all capital-related activities of the Group and assists senior management in
making capital decisions. The capital management function participates in decisions concerning asset-liability management, strategic
asset allocation and ongoing solvency management. This includes ensuring capital considerations are paramount in the strategy and
business planning processes and when determining the AIA’s capacity to pay dividends to shareholders.
Regulatory SolvencyThe Group is in compliance with the solvency and capital adequacy requirements applied by its regulators. The Group’s primary
insurance regulator at the AIA Company Limited (AIA Co.) and AIA International Limited (AIA International) levels is the Hong Kong
Office of the Commissioner of Insurance (HKOCI), which requires that AIA Co. and AIA International meet the solvency margin
requirements of the Hong Kong Insurance Companies Ordinance (HKICO). The HKICO (among other matters) sets minimum solvency
margin requirements that an insurer must meet in order to be authorised to carry on insurance business in or from Hong Kong. The
HKOCI requires AIA Co. and AIA International to maintain an excess of assets over liabilities of not less than the required minimum
solvency margin. The amount required under the HKICO is 100 per cent of the required minimum solvency margin. The excess of
assets over liabilities to be maintained by AIA Co. and AIA International required by the HKOCI is not less than 150 per cent of the
required minimum solvency margin.
The capital positions of the Group’s two principal operating companies as of 30 November 2015 and 2014 are as follows:
30 November 2015 30 November 2014
US$m
Total available
capital
Regulatory minimum
capitalSolvency
ratio
Total available
capital
Regulatory minimum
capitalSolvency
ratio
AIA Co. 6,761 1,579 428% 6,730 1,577 427%
AIA International 6,388 1,794 356% 6,319 1,641 385%
For these purposes, the Group defines total available capital as the amount of assets in excess of liabilities measured in accordance
with the HKICO and “regulatory minimum capital” as the required minimum margin of solvency calculated in accordance with the
HKICO. The solvency ratio is the ratio of total available capital to regulatory minimum capital.
The Group’s individual branches and subsidiaries are also subject to the supervision of government regulators in the jurisdictions in
which those branches and subsidiaries operate and, in relation to subsidiaries, in which they are incorporated. The various regulators
overseeing the Group actively monitor our local solvency positions. AIA Co. and AIA International submit annual filings to the HKOCI
of their solvency margin position based on their annual audited financial statements, and the Group’s other operating units perform
similar annual filings with their respective local regulators.
ANNUAL REPORT 2015 | 205
OV
ER
VIE
WF
INA
NC
IAL
AN
D O
PE
RA
TIN
G R
EV
IEW
CO
RP
OR
AT
E G
OV
ER
NA
NC
EF
INA
NC
IAL
ST
AT
EM
EN
TS
AD
DIT
ION
AL
IN
FO
RM
AT
ION
36. GROUP CAPITAL STRUCTURE (continued)
Regulatory Solvency (continued)
The ability of the Company to pay dividends to shareholders and to meet other obligations depends ultimately on dividends and
other payments being received from its operating subsidiaries and branches, which are subject to contractual, regulatory and other
limitations. The various regulators overseeing the individual branches and subsidiaries of the Group have the discretion to impose
additional restrictions on the ability of those regulated subsidiaries and branches to make payment of dividends or other distributions
and payments to AIA Co., including increasing the required margin of solvency that an operating unit must maintain. For example,
capital may not be remitted without the consent from regulators for certain individual branches or subsidiaries of the Group. The
payment of dividends, distributions and other payments to shareholders is subject to the oversight of the HKOCI.
Capital and Regulatory Orders Specific to the GroupAs of 30 November 2015, the requirements and restrictions summarised below may be considered material to the Group and remain
in effect unless otherwise stated.
Hong Kong Office of the Commissioner of Insurance
AIA Group Limited has given to the Insurance Authority an undertaking that AIA Group Limited will:
(i) ensure that (a) AIA Co. and AIA International will at all times maintain a solvency ratio of not less than 150 per cent, both on an
individual insurer basis and on an AIA Co./AIA International consolidated basis; (b) it will not withdraw capital or transfer any funds
or assets out of either AIA Co. or AIA International that will cause AIA Co.’s or AIA International’s solvency ratio to fall below 150
per cent, except with, in either case, the prior written consent of the Insurance Authority; and (c) should the solvency ratio of either
AIA Co. or AIA International fall below 150 per cent, AIA Group Limited will take steps as soon as possible to restore it to at least
150 per cent in a manner acceptable to the Insurance Authority;
(ii) notify the Insurance Authority in writing as soon as the Company becomes aware of any person (a) becoming a controller (within
the meaning of Section 9(1)(c)(ii) of the HKICO) of AIA Co. and AIA International through the acquisition of our shares traded on
the HKSE; or (b) ceasing to be a controller (within the meaning of Section 9(1)(c)(ii) of the HKICO) of AIA Co. and AIA International
through the disposal of our shares traded on the HKSE;
(iii) be subject to the supervision of the Insurance Authority and AIA Group Limited will be required to continually comply with the
Insurance Authority’s guidance on the “fit and proper” standards of a controller pursuant to Section 8(2) of the HKICO. The Insurance
Authority is empowered by the HKICO to raise objection if it appears to it that any person is not fit and proper to be a controller or
director of an authorised insurer. These standards include the sufficiency of a holding company’s financial resources; the viability
of a holding company’s business plan for its insurance subsidiaries which are regulated by the Insurance Authority; the clarity
of the Group’s legal, managerial and operational structures; the identities of any other holding companies or major regulated
subsidiaries; whether the holding company, its directors or controllers is subject to receivership, administration, liquidation or
other similar proceedings or failed to satisfy any judgement debt under a court order or the subject of any criminal convictions
or in breach of any statutory or regulatory requirements; the soundness of the Group’s corporate governance; the soundness of
the Group’s risk management framework; the receipt of information from its insurance subsidiaries which are regulated by the
Insurance Authority to ensure that they are managed in compliance with applicable laws, rules and regulation; and its role in
overseeing and managing the operations of its insurance subsidiaries which are regulated by the Insurance Authority; and
(iv) fulfil all enhancements or improvements to the guidance referred to in subparagraph (iii) above, as well as administrative
measures issued from time to time by the Insurance Authority or requirements that may be prescribed by the Insurance Authority
in accordance with the HKICO, regulations under the HKICO or guidance notes issued by the Insurance Authority from time to time.
FINANCIAL STATEMENTS
| AIA GROUP LIMITED206
NOTES TO THE CONSOLIDATED FINANCIAL STATEMENTS AND SIGNIFICANT ACCOUNTING POLICIES
37. RISK MANAGEMENTRisk management frameworkAIA recognises the importance of sound risk management in every aspect of our business and for all our stakeholders. The Risk
Management Framework (RMF) provides the structure for identifying, quantifying and mitigating risk across the Group. An effective
RMF is the key to avoiding the financial and reputational damage that arises from inadequate or ineffective control of the risks in the
business.
Insurance riskInsurance risk is the potential loss resulting from mortality, morbidity, persistency, longevity and adverse expense experience. This
includes the potential impacts from catastrophic events such as pandemics and natural disasters.
Management of insurance risk starts with product design. Ensuring products meet customer needs, are fairly priced and clearly
understood is the best guarantee of persistency and customer satisfaction.
The Group manages product design risk through the New Product Approval Process where products are reviewed against pricing,
design and operational risk benchmarks agreed by the Group’s Financial Risk Committee (FRC). Local business units work closely
with a number of Group functions including product management, actuarial, legal, risk & compliance and underwriting. The Group
monitors the performance of new products and focuses on actively managing each part of the actuarial control cycle to minimise risk
in the in-force book as well as for new products.
Lapse
The risk arises from changes in the rates of policy termination or renewal.
Ensuring customers buy products that meet their needs is central to the Group’s operating philosophy. Through comprehensive
sales training programmes and active monitoring and management of sales activities and persistency, the Group seeks to ensure
that appropriate products are sold by qualified sales representatives and that standards of service consistently meet or exceed
our customers’ reasonable expectations. This allows the Group to meet customer needs while also delivering sustainable value to
shareholders.
Risk & compliance monitor persistency closely through the Business Quality Framework, a joint endeavour of First and Second Line
functions to understand and mitigate the causes of lapse and to protect the Group against potential misconduct.
Expense
The active management of expenses reduces the risk of actual experience being adverse compared with the assumptions used in the
pricing of products. Daily operations follow a disciplined budgeting and control process that allows for the management of expenses
within pricing estimates based on the Group’s very substantial experience within the markets in which we operate.
Morbidity and Mortality
AIA adheres to well-defined market-oriented underwriting and claims guidelines and practices that have been developed based on
extensive historical experience and with the assistance of professional reinsurers.
The Group’s actuarial teams conduct regular experience studies of all the insurance risk factors in its in-force book. These internal
studies together with external data are used to identify emerging trends which can then be used to inform product design, pricing,
underwriting, claims management and reinsurance needs.
Through monitoring the development of both local and global trends in medical technology, health and wellness, the impact of
legislation and general social, political and economic conditions the Group seeks to anticipate and respond promptly to potential
adverse experience impacts on its products.
Reinsurance is used to reduce concentration and volatility risk, especially with large policies or new risks, and as protection against
catastrophic events such as pandemics or natural disasters.
Recent initiatives to manage morbidity risk and improve claims management include the promotion of wellness programmes such as
Vitality, the establishment of a dedicated Healthcare team to improve customer healthcare experience and support for initiatives such
as Occupational Rehabilitation in Australia.
ANNUAL REPORT 2015 | 207
OV
ER
VIE
WF
INA
NC
IAL
AN
D O
PE
RA
TIN
G R
EV
IEW
CO
RP
OR
AT
E G
OV
ER
NA
NC
EF
INA
NC
IAL
ST
AT
EM
EN
TS
AD
DIT
ION
AL
IN
FO
RM
AT
ION
37. RISK MANAGEMENT (continued)
Investment and financial risksFinancial risk is the potential loss resulting from adverse movements in financial markets, changes in the financial condition of
counterparties and in market liquidity to buy and sell investments. The Group is exposed to a range of investment and financial risks,
including credit risk, market risk and liquidity risk. The Group manages its exposure to investment and financial risk within tolerances
agreed by the FRC.
The following section summarises the Group’s key risk exposures and the primary policies and processes used by the Group to
manage its exposures to these risks.
Credit risk
Credit risk is the risk that third parties fail to meet their obligations to the Group when they fall due. Although the primary source of
credit risk is the Group’s investment portfolio, such risk can also arise through reinsurance, procurement and treasury activities.
Credit risk management starts with the assignment of an internal rating to all counterparties. The Credit Research team in the
Investment Department performs a detailed analysis of each counterparty and recommends a rating. The Group Risk & Compliance
function manages the Group’s internal ratings framework and reviews these recommendations and, where appropriate, makes
recommendations for revisions from time to time.
Value at Risk is calculated for each obligor based on its internal ratings, expected loss and contribution to the credit portfolio: these
measures are used to establish single-name concentration limits.
The resulting matrix of limits is refreshed annually and approved by the Group FRC. These limits cover individual counterparty,
segmental concentration and cross-border exposures.
The Investment Department has discretion to shape the portfolio within these credit limits, seeking further Group approvals through
the risk governance framework where they wish to invest outside them. If certain investments are technically within credit limits but
there is a specific concern, Group Risk brings these to the attention of the FRC for possible inclusion in the Group Investment Watch
List.
Interest rate risk
The Group’s exposure to interest rate risk predominantly arises from any difference between the duration of the Group’s liabilities
and assets, the ALM Mismatch. Since most markets do not have assets of sufficient tenor to match life insurance liabilities, an ALM
Mismatch gives rise to uncertainty around the reinvestment of maturing assets to meet the Group’s insurance liabilities.
Management of Interest Rate Risk is complicated by the context in which the relative duration calculations are made. Where local
solvency regimes use market values on only one side of the balance sheet the interest rate mismatch will be very different to the
economic view where market values are used for both assets and liabilities.
Moreover, since most of AIA’s savings products allow us to vary crediting rates, management actions need to be modelled to determine
the extent of interest rate risk at different confidence intervals.
The impact of options and guarantees can further complicate the picture, with a need to consider the impact of both rising and falling
interest rates.
AIA manages its interest rate risk by considering all these dimensions, especially during product design and asset allocation. Present
Value of a Basis Point analysis is used to highlight mismatches at individual points in the yield curve and Value at Risk is used to assess
the riskiness of those mismatches.
For in-force policies, policyholder bonus payout and crediting rates applicable to policyholder account balances are regularly reviewed,
considering amongst other things current bond yields and policyholders’ reasonable expectations.
Exposure to interest rate risk is summarised below, which shows the split of financial assets and liabilities between variable, fixed and
non-interest bearing investments.
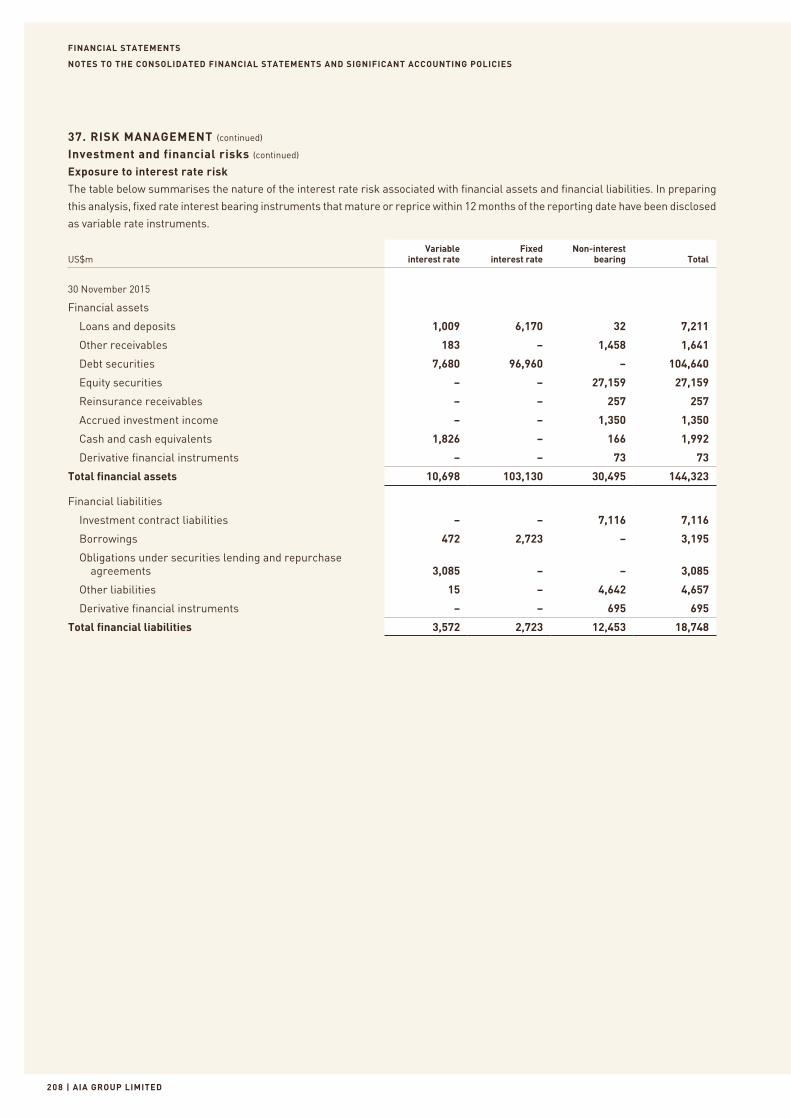
FINANCIAL STATEMENTS
| AIA GROUP LIMITED208
NOTES TO THE CONSOLIDATED FINANCIAL STATEMENTS AND SIGNIFICANT ACCOUNTING POLICIES
37. RISK MANAGEMENT (continued)
Investment and financial risks (continued)
Exposure to interest rate risk
The table below summarises the nature of the interest rate risk associated with financial assets and financial liabilities. In preparing
this analysis, fixed rate interest bearing instruments that mature or reprice within 12 months of the reporting date have been disclosed
as variable rate instruments.
US$mVariable
interest rateFixed
interest rateNon-interest
bearing Total
30 November 2015
Financial assets
Loans and deposits 1,009 6,170 32 7,211
Other receivables 183 – 1,458 1,641
Debt securities 7,680 96,960 – 104,640
Equity securities – – 27,159 27,159
Reinsurance receivables – – 257 257
Accrued investment income – – 1,350 1,350
Cash and cash equivalents 1,826 – 166 1,992
Derivative financial instruments – – 73 73
Total financial assets 10,698 103,130 30,495 144,323
Financial liabilities
Investment contract liabilities – – 7,116 7,116
Borrowings 472 2,723 – 3,195
Obligations under securities lending and repurchase agreements 3,085 – – 3,085
Other liabilities 15 – 4,642 4,657
Derivative financial instruments – – 695 695
Total financial liabilities 3,572 2,723 12,453 18,748
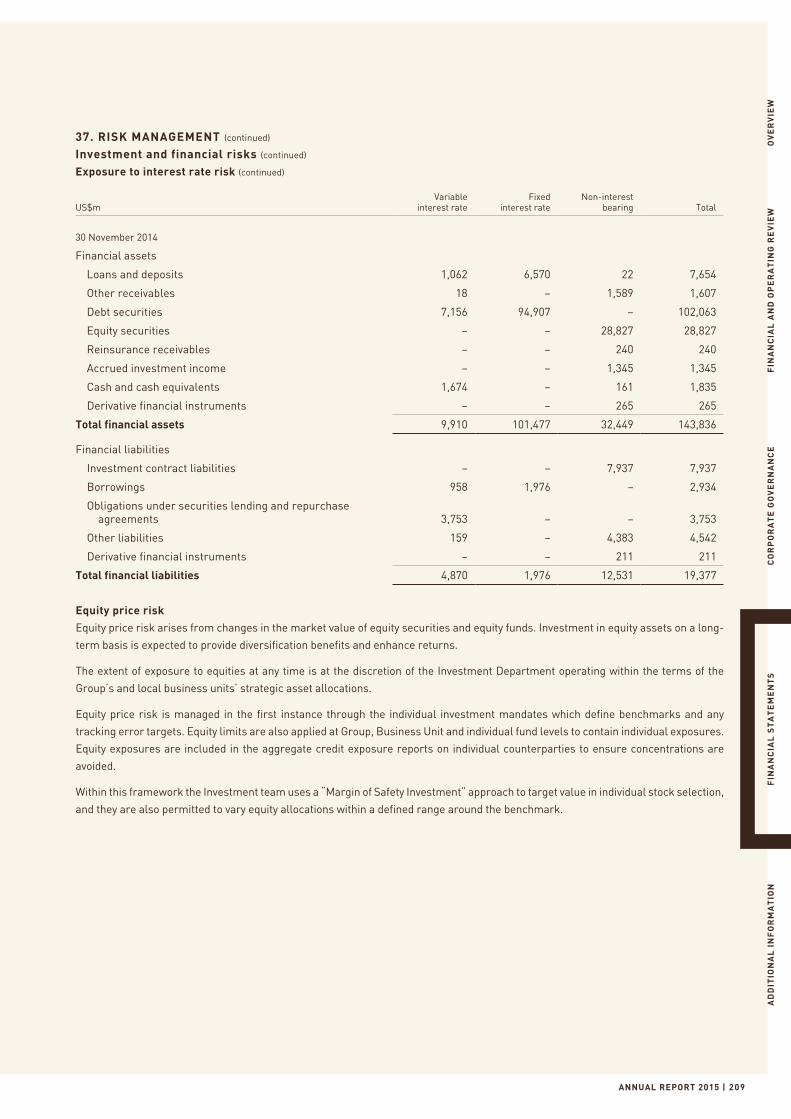
ANNUAL REPORT 2015 | 209
OV
ER
VIE
WF
INA
NC
IAL
AN
D O
PE
RA
TIN
G R
EV
IEW
CO
RP
OR
AT
E G
OV
ER
NA
NC
EF
INA
NC
IAL
ST
AT
EM
EN
TS
AD
DIT
ION
AL
IN
FO
RM
AT
ION
37. RISK MANAGEMENT (continued)
Investment and financial risks (continued)
Exposure to interest rate risk (continued)
US$mVariable
interest rateFixed
interest rateNon-interest
bearing Total
30 November 2014
Financial assets
Loans and deposits 1,062 6,570 22 7,654
Other receivables 18 – 1,589 1,607
Debt securities 7,156 94,907 – 102,063
Equity securities – – 28,827 28,827
Reinsurance receivables – – 240 240
Accrued investment income – – 1,345 1,345
Cash and cash equivalents 1,674 – 161 1,835
Derivative financial instruments – – 265 265
Total financial assets 9,910 101,477 32,449 143,836
Financial liabilities
Investment contract liabilities – – 7,937 7,937
Borrowings 958 1,976 – 2,934
Obligations under securities lending and repurchase agreements 3,753 – – 3,753
Other liabilities 159 – 4,383 4,542
Derivative financial instruments – – 211 211
Total financial liabilities 4,870 1,976 12,531 19,377
Equity price risk
Equity price risk arises from changes in the market value of equity securities and equity funds. Investment in equity assets on a long-
term basis is expected to provide diversification benefits and enhance returns.
The extent of exposure to equities at any time is at the discretion of the Investment Department operating within the terms of the
Group’s and local business units’ strategic asset allocations.
Equity price risk is managed in the first instance through the individual investment mandates which define benchmarks and any
tracking error targets. Equity limits are also applied at Group, Business Unit and individual fund levels to contain individual exposures.
Equity exposures are included in the aggregate credit exposure reports on individual counterparties to ensure concentrations are
avoided.
Within this framework the Investment team uses a “Margin of Safety Investment” approach to target value in individual stock selection,
and they are also permitted to vary equity allocations within a defined range around the benchmark.
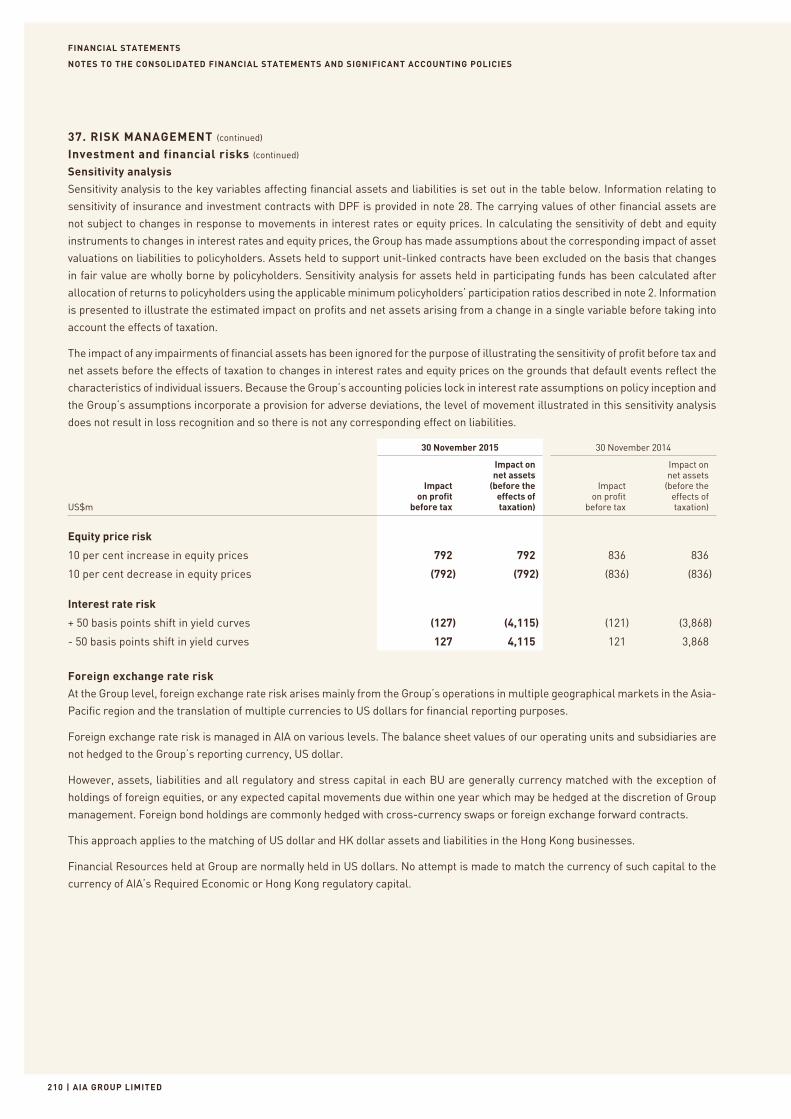
FINANCIAL STATEMENTS
| AIA GROUP LIMITED210
NOTES TO THE CONSOLIDATED FINANCIAL STATEMENTS AND SIGNIFICANT ACCOUNTING POLICIES
37. RISK MANAGEMENT (continued)
Investment and financial risks (continued)
Sensitivity analysis
Sensitivity analysis to the key variables affecting financial assets and liabilities is set out in the table below. Information relating to
sensitivity of insurance and investment contracts with DPF is provided in note 28. The carrying values of other financial assets are
not subject to changes in response to movements in interest rates or equity prices. In calculating the sensitivity of debt and equity
instruments to changes in interest rates and equity prices, the Group has made assumptions about the corresponding impact of asset
valuations on liabilities to policyholders. Assets held to support unit-linked contracts have been excluded on the basis that changes
in fair value are wholly borne by policyholders. Sensitivity analysis for assets held in participating funds has been calculated after
allocation of returns to policyholders using the applicable minimum policyholders’ participation ratios described in note 2. Information
is presented to illustrate the estimated impact on profits and net assets arising from a change in a single variable before taking into
account the effects of taxation.
The impact of any impairments of financial assets has been ignored for the purpose of illustrating the sensitivity of profit before tax and
net assets before the effects of taxation to changes in interest rates and equity prices on the grounds that default events reflect the
characteristics of individual issuers. Because the Group’s accounting policies lock in interest rate assumptions on policy inception and
the Group’s assumptions incorporate a provision for adverse deviations, the level of movement illustrated in this sensitivity analysis
does not result in loss recognition and so there is not any corresponding effect on liabilities.
30 November 2015 30 November 2014
US$m
Impact on profit
before tax
Impact on net assets(before the
effects of taxation)
Impact on profit
before tax
Impact on net assets(before the
effects of taxation)
Equity price risk
10 per cent increase in equity prices 792 792 836 836
10 per cent decrease in equity prices (792) (792) (836) (836)
Interest rate risk
+ 50 basis points shift in yield curves (127) (4,115) (121) (3,868)
- 50 basis points shift in yield curves 127 4,115 121 3,868
Foreign exchange rate risk
At the Group level, foreign exchange rate risk arises mainly from the Group’s operations in multiple geographical markets in the Asia-
Pacific region and the translation of multiple currencies to US dollars for financial reporting purposes.
Foreign exchange rate risk is managed in AIA on various levels. The balance sheet values of our operating units and subsidiaries are
not hedged to the Group’s reporting currency, US dollar.
However, assets, liabilities and all regulatory and stress capital in each BU are generally currency matched with the exception of
holdings of foreign equities, or any expected capital movements due within one year which may be hedged at the discretion of Group
management. Foreign bond holdings are commonly hedged with cross-currency swaps or foreign exchange forward contracts.
This approach applies to the matching of US dollar and HK dollar assets and liabilities in the Hong Kong businesses.
Financial Resources held at Group are normally held in US dollars. No attempt is made to match the currency of such capital to the
currency of AIA’s Required Economic or Hong Kong regulatory capital.
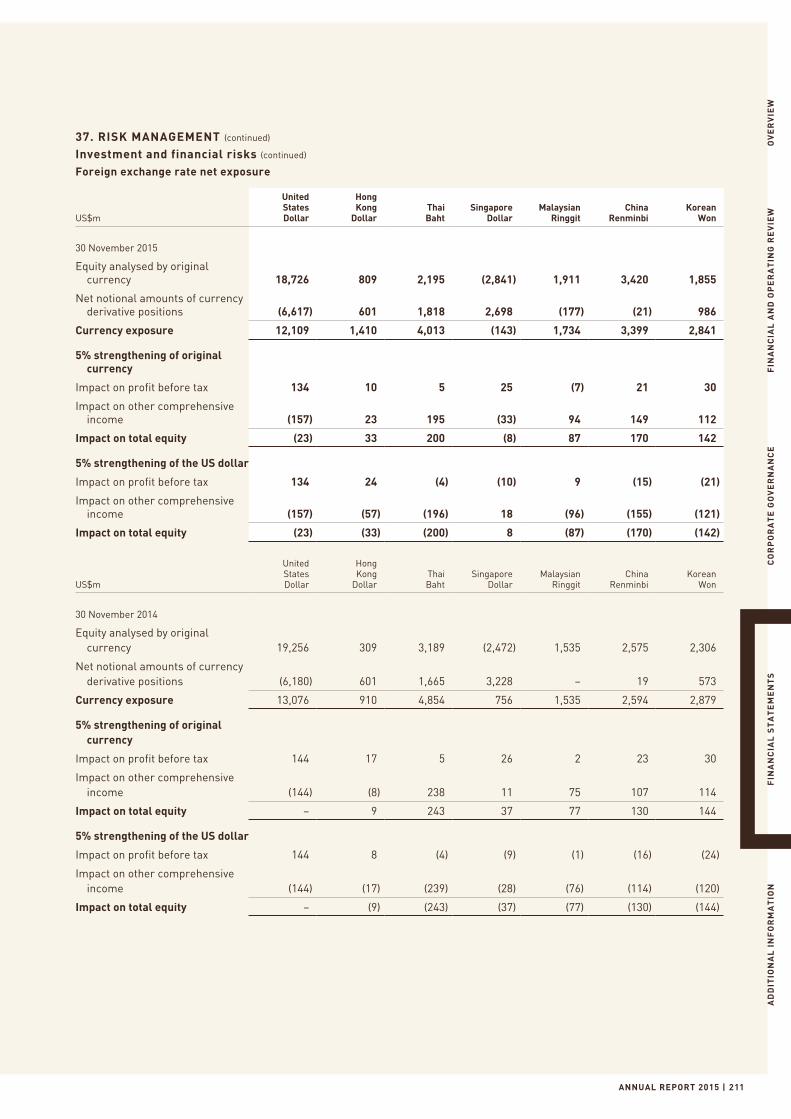
ANNUAL REPORT 2015 | 211
OV
ER
VIE
WF
INA
NC
IAL
AN
D O
PE
RA
TIN
G R
EV
IEW
CO
RP
OR
AT
E G
OV
ER
NA
NC
EF
INA
NC
IAL
ST
AT
EM
EN
TS
AD
DIT
ION
AL
IN
FO
RM
AT
ION
37. RISK MANAGEMENT (continued)
Investment and financial risks (continued)
Foreign exchange rate net exposure
US$m
United States Dollar
Hong Kong
DollarThai Baht
Singapore Dollar
Malaysian Ringgit
China Renminbi
Korean Won
30 November 2015
Equity analysed by original currency 18,726 809 2,195 (2,841) 1,911 3,420 1,855
Net notional amounts of currency derivative positions (6,617) 601 1,818 2,698 (177) (21) 986
Currency exposure 12,109 1,410 4,013 (143) 1,734 3,399 2,841
5% strengthening of original currency
Impact on profit before tax 134 10 5 25 (7) 21 30
Impact on other comprehensive income (157) 23 195 (33) 94 149 112
Impact on total equity (23) 33 200 (8) 87 170 142
5% strengthening of the US dollar
Impact on profit before tax 134 24 (4) (10) 9 (15) (21)
Impact on other comprehensive income (157) (57) (196) 18 (96) (155) (121)
Impact on total equity (23) (33) (200) 8 (87) (170) (142)
US$m
United States Dollar
Hong Kong
DollarThai Baht
Singapore Dollar
Malaysian Ringgit
China Renminbi
Korean Won
30 November 2014
Equity analysed by original currency 19,256 309 3,189 (2,472) 1,535 2,575 2,306
Net notional amounts of currency derivative positions (6,180) 601 1,665 3,228 – 19 573
Currency exposure 13,076 910 4,854 756 1,535 2,594 2,879
5% strengthening of original currency
Impact on profit before tax 144 17 5 26 2 23 30
Impact on other comprehensive income (144) (8) 238 11 75 107 114
Impact on total equity – 9 243 37 77 130 144
5% strengthening of the US dollar
Impact on profit before tax 144 8 (4) (9) (1) (16) (24)
Impact on other comprehensive income (144) (17) (239) (28) (76) (114) (120)
Impact on total equity – (9) (243) (37) (77) (130) (144)
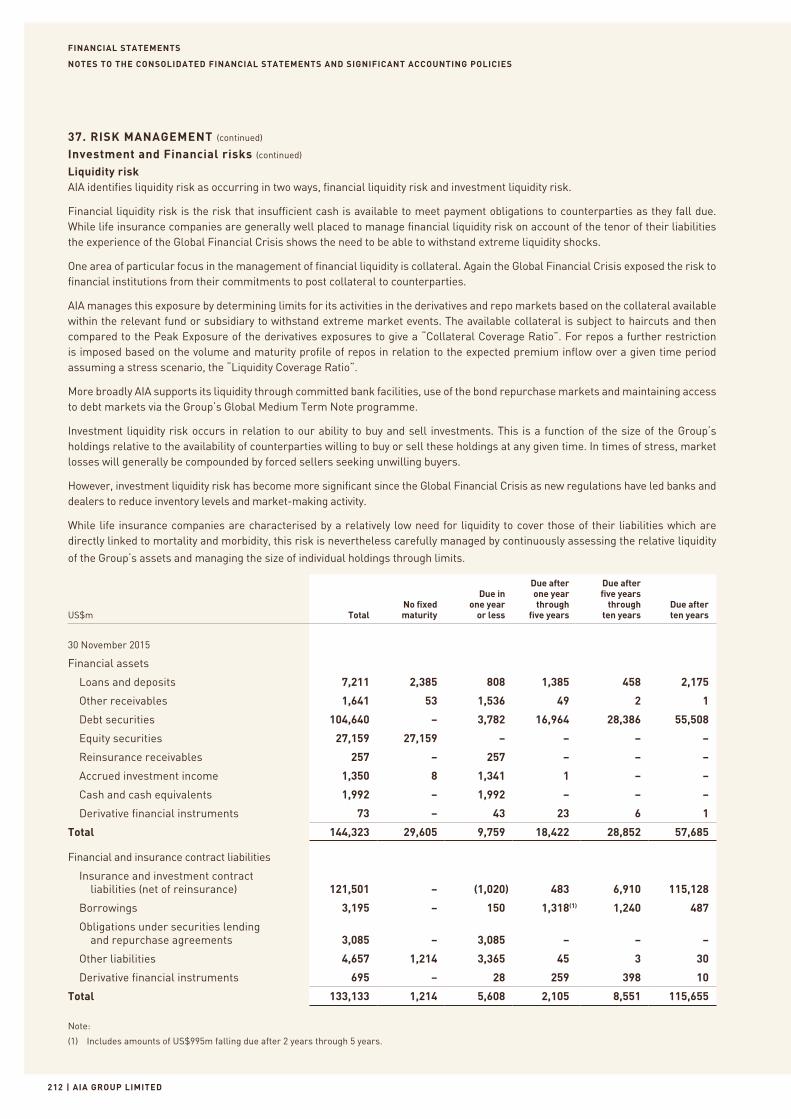
FINANCIAL STATEMENTS
| AIA GROUP LIMITED212
NOTES TO THE CONSOLIDATED FINANCIAL STATEMENTS AND SIGNIFICANT ACCOUNTING POLICIES
37. RISK MANAGEMENT (continued)
Investment and Financial risks (continued)
Liquidity riskAIA identifies liquidity risk as occurring in two ways, financial liquidity risk and investment liquidity risk.
Financial liquidity risk is the risk that insufficient cash is available to meet payment obligations to counterparties as they fall due. While life insurance companies are generally well placed to manage financial liquidity risk on account of the tenor of their liabilities the experience of the Global Financial Crisis shows the need to be able to withstand extreme liquidity shocks.
One area of particular focus in the management of financial liquidity is collateral. Again the Global Financial Crisis exposed the risk to financial institutions from their commitments to post collateral to counterparties.
AIA manages this exposure by determining limits for its activities in the derivatives and repo markets based on the collateral available within the relevant fund or subsidiary to withstand extreme market events. The available collateral is subject to haircuts and then compared to the Peak Exposure of the derivatives exposures to give a “Collateral Coverage Ratio”. For repos a further restriction is imposed based on the volume and maturity profile of repos in relation to the expected premium inflow over a given time period assuming a stress scenario, the “Liquidity Coverage Ratio”.
More broadly AIA supports its liquidity through committed bank facilities, use of the bond repurchase markets and maintaining access to debt markets via the Group’s Global Medium Term Note programme.
Investment liquidity risk occurs in relation to our ability to buy and sell investments. This is a function of the size of the Group’s holdings relative to the availability of counterparties willing to buy or sell these holdings at any given time. In times of stress, market losses will generally be compounded by forced sellers seeking unwilling buyers.
However, investment liquidity risk has become more significant since the Global Financial Crisis as new regulations have led banks and dealers to reduce inventory levels and market-making activity.
While life insurance companies are characterised by a relatively low need for liquidity to cover those of their liabilities which are directly linked to mortality and morbidity, this risk is nevertheless carefully managed by continuously assessing the relative liquidity
of the Group’s assets and managing the size of individual holdings through limits.
US$m TotalNo fixed maturity
Due in one year
or less
Due after one year through
five years
Due after five years
through ten years
Due after ten years
30 November 2015
Financial assets
Loans and deposits 7,211 2,385 808 1,385 458 2,175
Other receivables 1,641 53 1,536 49 2 1
Debt securities 104,640 – 3,782 16,964 28,386 55,508
Equity securities 27,159 27,159 – – – –
Reinsurance receivables 257 – 257 – – –
Accrued investment income 1,350 8 1,341 1 – –
Cash and cash equivalents 1,992 – 1,992 – – –
Derivative financial instruments 73 – 43 23 6 1
Total 144,323 29,605 9,759 18,422 28,852 57,685
Financial and insurance contract liabilities
Insurance and investment contract liabilities (net of reinsurance) 121,501 – (1,020) 483 6,910 115,128
Borrowings 3,195 – 150 1,318(1) 1,240 487
Obligations under securities lending and repurchase agreements 3,085 – 3,085 – – –
Other liabilities 4,657 1,214 3,365 45 3 30
Derivative financial instruments 695 – 28 259 398 10
Total 133,133 1,214 5,608 2,105 8,551 115,655
Note:
(1) Includes amounts of US$995m falling due after 2 years through 5 years.
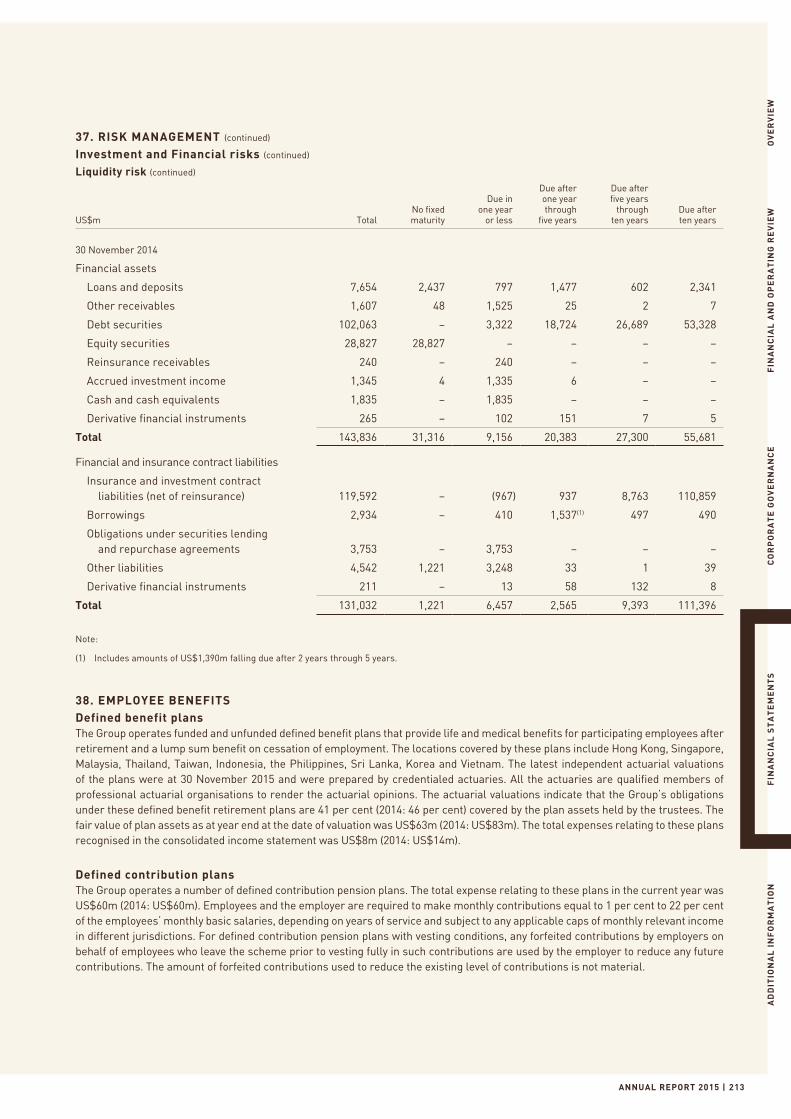
ANNUAL REPORT 2015 | 213
OV
ER
VIE
WF
INA
NC
IAL
AN
D O
PE
RA
TIN
G R
EV
IEW
CO
RP
OR
AT
E G
OV
ER
NA
NC
EF
INA
NC
IAL
ST
AT
EM
EN
TS
AD
DIT
ION
AL
IN
FO
RM
AT
ION
37. RISK MANAGEMENT (continued)
Investment and Financial risks (continued)
Liquidity risk (continued)
US$m TotalNo fixed maturity
Due in one year
or less
Due after one year through
five years
Due after five years
through ten years
Due after ten years
30 November 2014
Financial assets
Loans and deposits 7,654 2,437 797 1,477 602 2,341
Other receivables 1,607 48 1,525 25 2 7
Debt securities 102,063 – 3,322 18,724 26,689 53,328
Equity securities 28,827 28,827 – – – –
Reinsurance receivables 240 – 240 – – –
Accrued investment income 1,345 4 1,335 6 – –
Cash and cash equivalents 1,835 – 1,835 – – –
Derivative financial instruments 265 – 102 151 7 5
Total 143,836 31,316 9,156 20,383 27,300 55,681
Financial and insurance contract liabilities
Insurance and investment contract liabilities (net of reinsurance) 119,592 – (967) 937 8,763 110,859
Borrowings 2,934 – 410 1,537(1) 497 490
Obligations under securities lending and repurchase agreements 3,753 – 3,753 – – –
Other liabilities 4,542 1,221 3,248 33 1 39
Derivative financial instruments 211 – 13 58 132 8
Total 131,032 1,221 6,457 2,565 9,393 111,396
Note:
(1) Includes amounts of US$1,390m falling due after 2 years through 5 years.
38. EMPLOYEE BENEFITSDefined benefit plansThe Group operates funded and unfunded defined benefit plans that provide life and medical benefits for participating employees after retirement and a lump sum benefit on cessation of employment. The locations covered by these plans include Hong Kong, Singapore, Malaysia, Thailand, Taiwan, Indonesia, the Philippines, Sri Lanka, Korea and Vietnam. The latest independent actuarial valuations of the plans were at 30 November 2015 and were prepared by credentialed actuaries. All the actuaries are qualified members of professional actuarial organisations to render the actuarial opinions. The actuarial valuations indicate that the Group’s obligations under these defined benefit retirement plans are 41 per cent (2014: 46 per cent) covered by the plan assets held by the trustees. The fair value of plan assets as at year end at the date of valuation was US$63m (2014: US$83m). The total expenses relating to these plans recognised in the consolidated income statement was US$8m (2014: US$14m).
Defined contribution plansThe Group operates a number of defined contribution pension plans. The total expense relating to these plans in the current year was US$60m (2014: US$60m). Employees and the employer are required to make monthly contributions equal to 1 per cent to 22 per cent of the employees’ monthly basic salaries, depending on years of service and subject to any applicable caps of monthly relevant income in different jurisdictions. For defined contribution pension plans with vesting conditions, any forfeited contributions by employers on behalf of employees who leave the scheme prior to vesting fully in such contributions are used by the employer to reduce any future contributions. The amount of forfeited contributions used to reduce the existing level of contributions is not material.
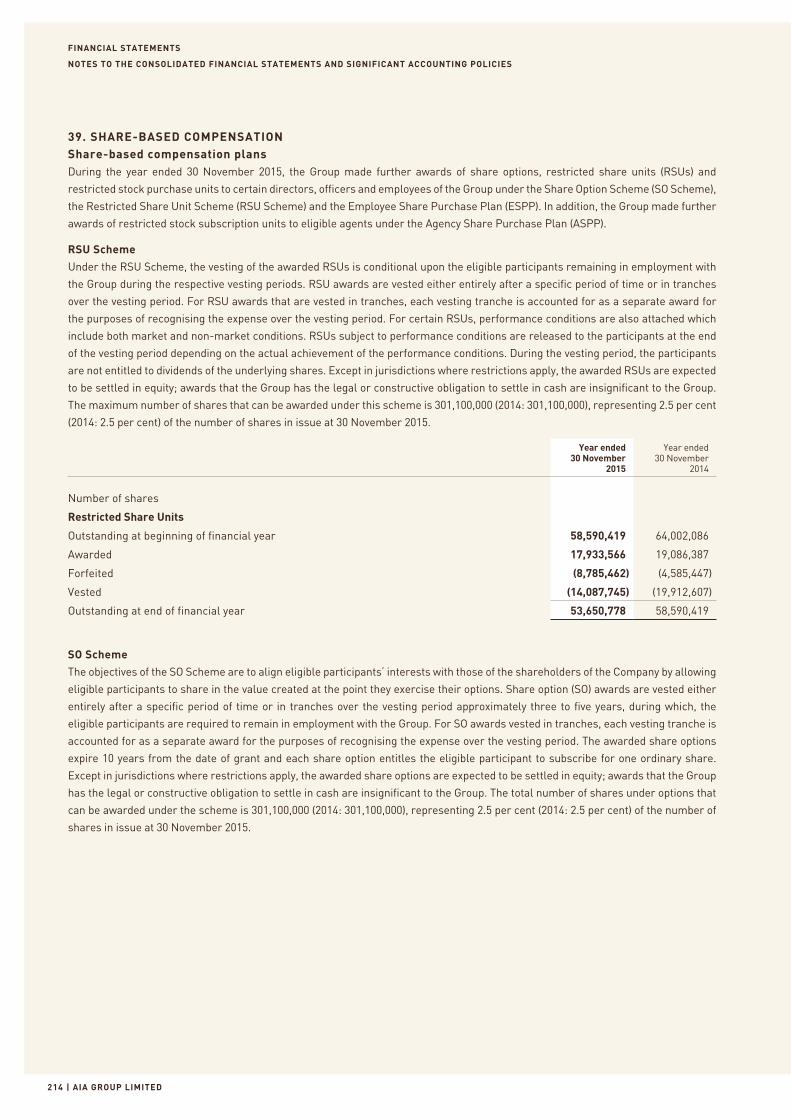
FINANCIAL STATEMENTS
| AIA GROUP LIMITED214
NOTES TO THE CONSOLIDATED FINANCIAL STATEMENTS AND SIGNIFICANT ACCOUNTING POLICIES
39. SHARE-BASED COMPENSATIONShare-based compensation plansDuring the year ended 30 November 2015, the Group made further awards of share options, restricted share units (RSUs) and
restricted stock purchase units to certain directors, officers and employees of the Group under the Share Option Scheme (SO Scheme),
the Restricted Share Unit Scheme (RSU Scheme) and the Employee Share Purchase Plan (ESPP). In addition, the Group made further
awards of restricted stock subscription units to eligible agents under the Agency Share Purchase Plan (ASPP).
RSU Scheme
Under the RSU Scheme, the vesting of the awarded RSUs is conditional upon the eligible participants remaining in employment with
the Group during the respective vesting periods. RSU awards are vested either entirely after a specific period of time or in tranches
over the vesting period. For RSU awards that are vested in tranches, each vesting tranche is accounted for as a separate award for
the purposes of recognising the expense over the vesting period. For certain RSUs, performance conditions are also attached which
include both market and non-market conditions. RSUs subject to performance conditions are released to the participants at the end
of the vesting period depending on the actual achievement of the performance conditions. During the vesting period, the participants
are not entitled to dividends of the underlying shares. Except in jurisdictions where restrictions apply, the awarded RSUs are expected
to be settled in equity; awards that the Group has the legal or constructive obligation to settle in cash are insignificant to the Group.
The maximum number of shares that can be awarded under this scheme is 301,100,000 (2014: 301,100,000), representing 2.5 per cent
(2014: 2.5 per cent) of the number of shares in issue at 30 November 2015.
Year ended 30 November
2015
Year ended 30 November
2014
Number of shares
Restricted Share Units
Outstanding at beginning of financial year 58,590,419 64,002,086
Awarded 17,933,566 19,086,387
Forfeited (8,785,462) (4,585,447)
Vested (14,087,745) (19,912,607)
Outstanding at end of financial year 53,650,778 58,590,419
SO Scheme
The objectives of the SO Scheme are to align eligible participants’ interests with those of the shareholders of the Company by allowing
eligible participants to share in the value created at the point they exercise their options. Share option (SO) awards are vested either
entirely after a specific period of time or in tranches over the vesting period approximately three to five years, during which, the
eligible participants are required to remain in employment with the Group. For SO awards vested in tranches, each vesting tranche is
accounted for as a separate award for the purposes of recognising the expense over the vesting period. The awarded share options
expire 10 years from the date of grant and each share option entitles the eligible participant to subscribe for one ordinary share.
Except in jurisdictions where restrictions apply, the awarded share options are expected to be settled in equity; awards that the Group
has the legal or constructive obligation to settle in cash are insignificant to the Group. The total number of shares under options that
can be awarded under the scheme is 301,100,000 (2014: 301,100,000), representing 2.5 per cent (2014: 2.5 per cent) of the number of
shares in issue at 30 November 2015.
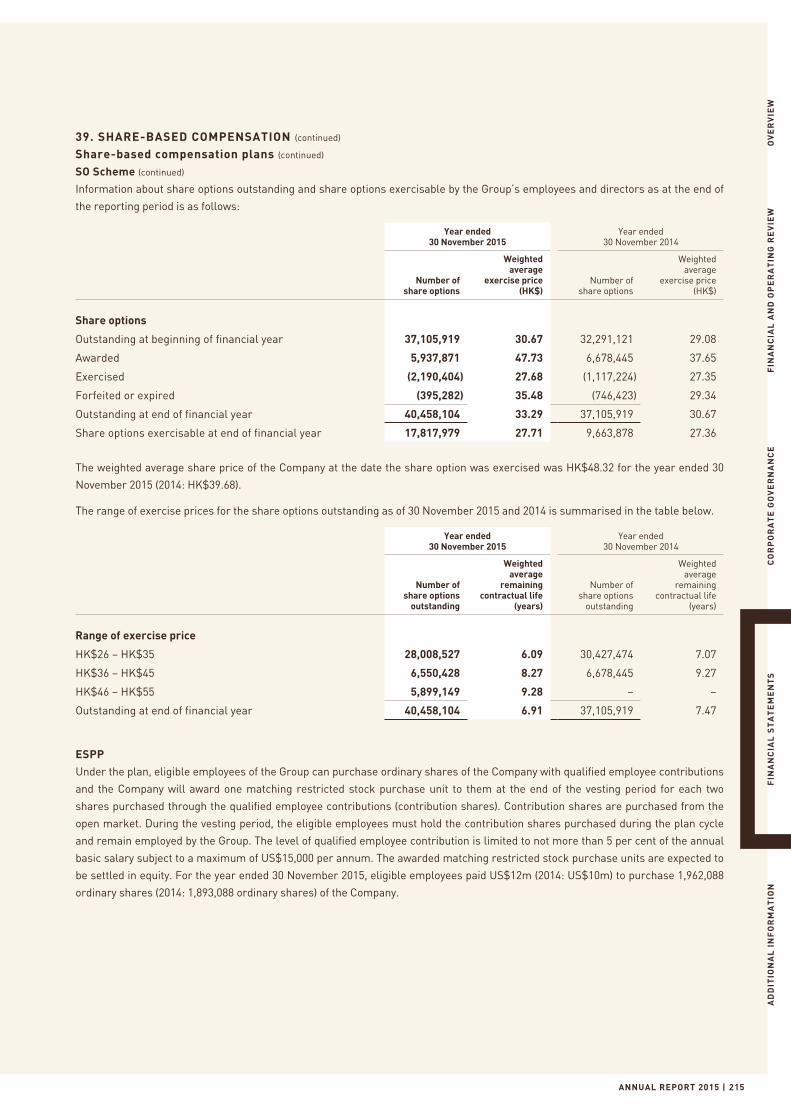
ANNUAL REPORT 2015 | 215
OV
ER
VIE
WF
INA
NC
IAL
AN
D O
PE
RA
TIN
G R
EV
IEW
CO
RP
OR
AT
E G
OV
ER
NA
NC
EF
INA
NC
IAL
ST
AT
EM
EN
TS
AD
DIT
ION
AL
IN
FO
RM
AT
ION
39. SHARE-BASED COMPENSATION (continued)
Share-based compensation plans (continued)
SO Scheme (continued)
Information about share options outstanding and share options exercisable by the Group’s employees and directors as at the end of
the reporting period is as follows:
Year ended 30 November 2015
Year ended 30 November 2014
Number ofshare options
Weighted average
exercise price(HK$)
Number ofshare options
Weighted average
exercise price(HK$)
Share options
Outstanding at beginning of financial year 37,105,919 30.67 32,291,121 29.08
Awarded 5,937,871 47.73 6,678,445 37.65
Exercised (2,190,404) 27.68 (1,117,224) 27.35
Forfeited or expired (395,282) 35.48 (746,423) 29.34
Outstanding at end of financial year 40,458,104 33.29 37,105,919 30.67
Share options exercisable at end of financial year 17,817,979 27.71 9,663,878 27.36
The weighted average share price of the Company at the date the share option was exercised was HK$48.32 for the year ended 30
November 2015 (2014: HK$39.68).
The range of exercise prices for the share options outstanding as of 30 November 2015 and 2014 is summarised in the table below.
Year ended 30 November 2015
Year ended 30 November 2014
Number ofshare options
outstanding
Weighted average
remaining contractual life
(years)
Number ofshare options
outstanding
Weighted average
remaining contractual life
(years)
Range of exercise price
HK$26 – HK$35 28,008,527 6.09 30,427,474 7.07
HK$36 – HK$45 6,550,428 8.27 6,678,445 9.27
HK$46 – HK$55 5,899,149 9.28 – –
Outstanding at end of financial year 40,458,104 6.91 37,105,919 7.47
ESPP
Under the plan, eligible employees of the Group can purchase ordinary shares of the Company with qualified employee contributions
and the Company will award one matching restricted stock purchase unit to them at the end of the vesting period for each two
shares purchased through the qualified employee contributions (contribution shares). Contribution shares are purchased from the
open market. During the vesting period, the eligible employees must hold the contribution shares purchased during the plan cycle
and remain employed by the Group. The level of qualified employee contribution is limited to not more than 5 per cent of the annual
basic salary subject to a maximum of US$15,000 per annum. The awarded matching restricted stock purchase units are expected to
be settled in equity. For the year ended 30 November 2015, eligible employees paid US$12m (2014: US$10m) to purchase 1,962,088
ordinary shares (2014: 1,893,088 ordinary shares) of the Company.
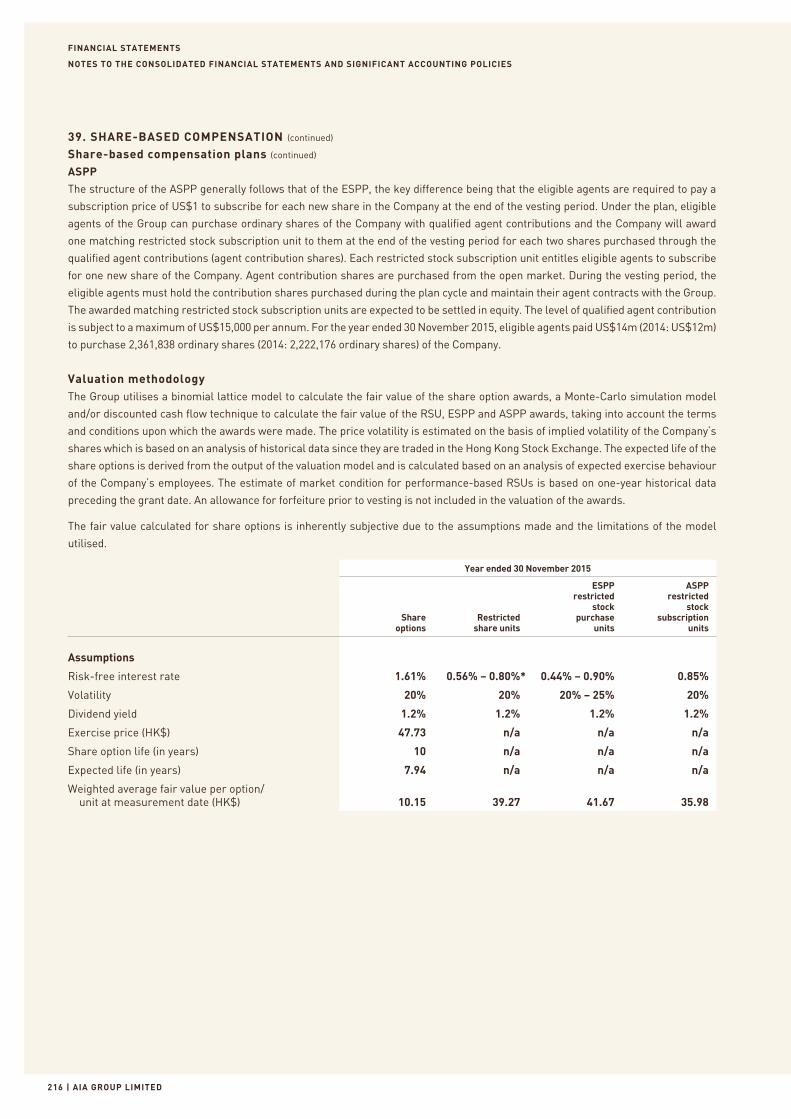
FINANCIAL STATEMENTS
| AIA GROUP LIMITED216
NOTES TO THE CONSOLIDATED FINANCIAL STATEMENTS AND SIGNIFICANT ACCOUNTING POLICIES
39. SHARE-BASED COMPENSATION (continued)
Share-based compensation plans (continued)
ASPP
The structure of the ASPP generally follows that of the ESPP, the key difference being that the eligible agents are required to pay a
subscription price of US$1 to subscribe for each new share in the Company at the end of the vesting period. Under the plan, eligible
agents of the Group can purchase ordinary shares of the Company with qualified agent contributions and the Company will award
one matching restricted stock subscription unit to them at the end of the vesting period for each two shares purchased through the
qualified agent contributions (agent contribution shares). Each restricted stock subscription unit entitles eligible agents to subscribe
for one new share of the Company. Agent contribution shares are purchased from the open market. During the vesting period, the
eligible agents must hold the contribution shares purchased during the plan cycle and maintain their agent contracts with the Group.
The awarded matching restricted stock subscription units are expected to be settled in equity. The level of qualified agent contribution
is subject to a maximum of US$15,000 per annum. For the year ended 30 November 2015, eligible agents paid US$14m (2014: US$12m)
to purchase 2,361,838 ordinary shares (2014: 2,222,176 ordinary shares) of the Company.
Valuation methodologyThe Group utilises a binomial lattice model to calculate the fair value of the share option awards, a Monte-Carlo simulation model
and/or discounted cash flow technique to calculate the fair value of the RSU, ESPP and ASPP awards, taking into account the terms
and conditions upon which the awards were made. The price volatility is estimated on the basis of implied volatility of the Company’s
shares which is based on an analysis of historical data since they are traded in the Hong Kong Stock Exchange. The expected life of the
share options is derived from the output of the valuation model and is calculated based on an analysis of expected exercise behaviour
of the Company’s employees. The estimate of market condition for performance-based RSUs is based on one-year historical data
preceding the grant date. An allowance for forfeiture prior to vesting is not included in the valuation of the awards.
The fair value calculated for share options is inherently subjective due to the assumptions made and the limitations of the model
utilised.
Year ended 30 November 2015
Share options
Restricted share units
ESPP restricted
stock purchase
units
ASPP restricted
stock subscription
units
Assumptions
Risk-free interest rate 1.61% 0.56% – 0.80%* 0.44% – 0.90% 0.85%
Volatility 20% 20% 20% – 25% 20%
Dividend yield 1.2% 1.2% 1.2% 1.2%
Exercise price (HK$) 47.73 n/a n/a n/a
Share option life (in years) 10 n/a n/a n/a
Expected life (in years) 7.94 n/a n/a n/a
Weighted average fair value per option/ unit at measurement date (HK$) 10.15 39.27 41.67 35.98
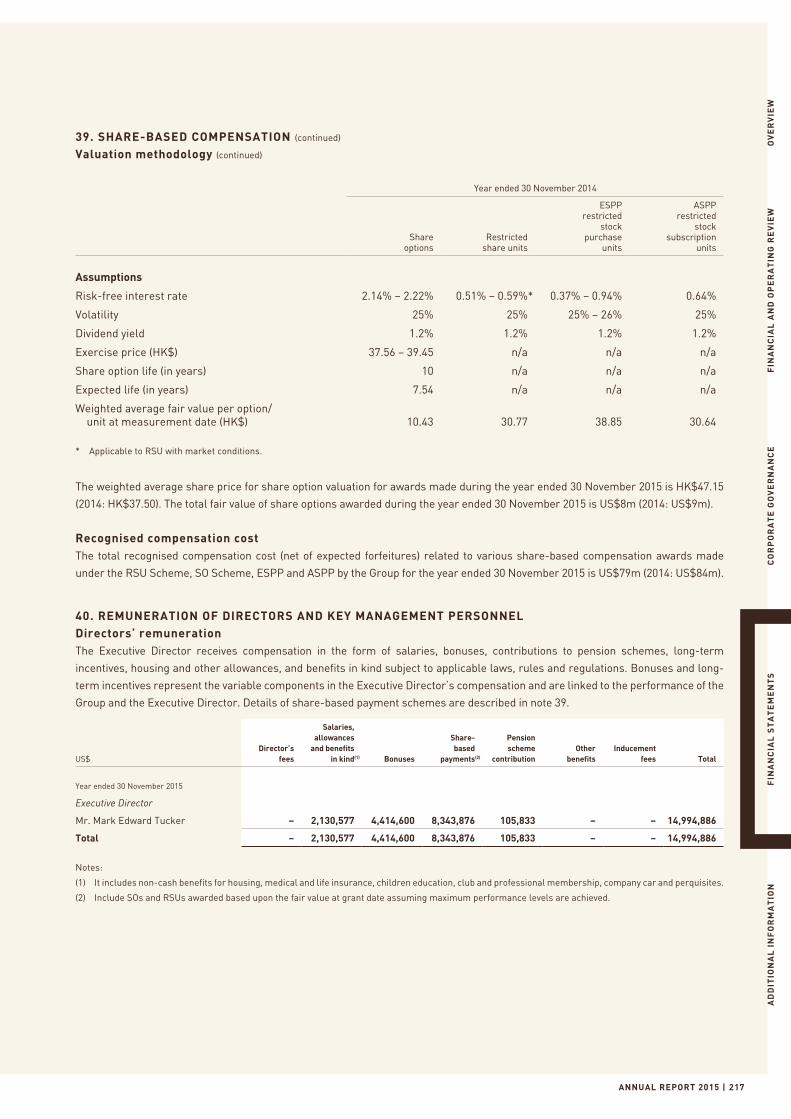
ANNUAL REPORT 2015 | 217
OV
ER
VIE
WF
INA
NC
IAL
AN
D O
PE
RA
TIN
G R
EV
IEW
CO
RP
OR
AT
E G
OV
ER
NA
NC
EF
INA
NC
IAL
ST
AT
EM
EN
TS
AD
DIT
ION
AL
IN
FO
RM
AT
ION
39. SHARE-BASED COMPENSATION (continued)
Valuation methodology (continued)
Year ended 30 November 2014
Share options
Restricted share units
ESPP restricted
stock purchase
units
ASPP restricted
stock subscription
units
Assumptions
Risk-free interest rate 2.14% – 2.22% 0.51% – 0.59%* 0.37% – 0.94% 0.64%
Volatility 25% 25% 25% – 26% 25%
Dividend yield 1.2% 1.2% 1.2% 1.2%
Exercise price (HK$) 37.56 – 39.45 n/a n/a n/a
Share option life (in years) 10 n/a n/a n/a
Expected life (in years) 7.54 n/a n/a n/a
Weighted average fair value per option/ unit at measurement date (HK$) 10.43 30.77 38.85 30.64
* Applicable to RSU with market conditions.
The weighted average share price for share option valuation for awards made during the year ended 30 November 2015 is HK$47.15
(2014: HK$37.50). The total fair value of share options awarded during the year ended 30 November 2015 is US$8m (2014: US$9m).
Recognised compensation costThe total recognised compensation cost (net of expected forfeitures) related to various share-based compensation awards made
under the RSU Scheme, SO Scheme, ESPP and ASPP by the Group for the year ended 30 November 2015 is US$79m (2014: US$84m).
40. REMUNERATION OF DIRECTORS AND KEY MANAGEMENT PERSONNELDirectors’ remunerationThe Executive Director receives compensation in the form of salaries, bonuses, contributions to pension schemes, long-term
incentives, housing and other allowances, and benefits in kind subject to applicable laws, rules and regulations. Bonuses and long-
term incentives represent the variable components in the Executive Director’s compensation and are linked to the performance of the
Group and the Executive Director. Details of share-based payment schemes are described in note 39.
US$Director’s
fees
Salaries, allowances
and benefits in kind(1) Bonuses
Share-based
payments(2)
Pension scheme
contributionOther
benefitsInducement
fees Total
Year ended 30 November 2015
Executive Director
Mr. Mark Edward Tucker – 2,130,577 4,414,600 8,343,876 105,833 – – 14,994,886
Total – 2,130,577 4,414,600 8,343,876 105,833 – – 14,994,886
Notes:
(1) It includes non-cash benefits for housing, medical and life insurance, children education, club and professional membership, company car and perquisites.
(2) Include SOs and RSUs awarded based upon the fair value at grant date assuming maximum performance levels are achieved.
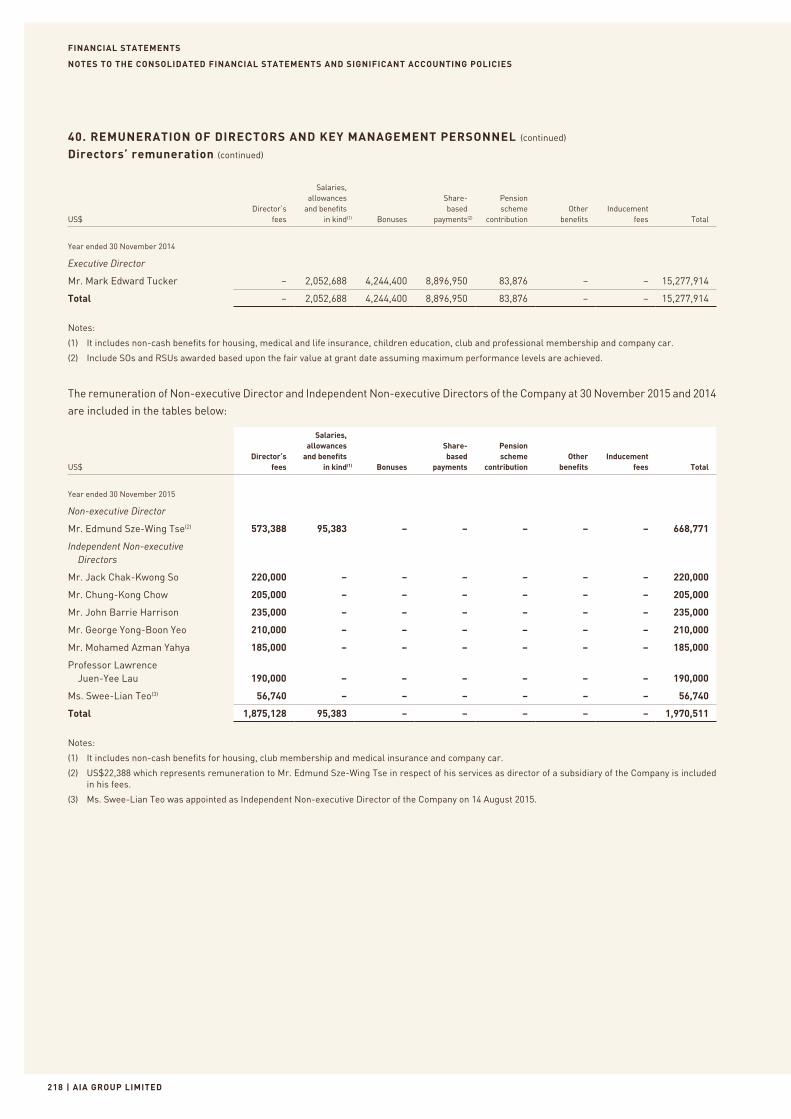
FINANCIAL STATEMENTS
| AIA GROUP LIMITED218
NOTES TO THE CONSOLIDATED FINANCIAL STATEMENTS AND SIGNIFICANT ACCOUNTING POLICIES
40. REMUNERATION OF DIRECTORS AND KEY MANAGEMENT PERSONNEL (continued)
Directors’ remuneration (continued)
US$Director’s
fees
Salaries, allowances
and benefits in kind(1) Bonuses
Share-based
payments(2)
Pension scheme
contributionOther
benefitsInducement
fees Total
Year ended 30 November 2014
Executive Director
Mr. Mark Edward Tucker – 2,052,688 4,244,400 8,896,950 83,876 – – 15,277,914
Total – 2,052,688 4,244,400 8,896,950 83,876 – – 15,277,914
Notes:
(1) It includes non-cash benefits for housing, medical and life insurance, children education, club and professional membership and company car.
(2) Include SOs and RSUs awarded based upon the fair value at grant date assuming maximum performance levels are achieved.
The remuneration of Non-executive Director and Independent Non-executive Directors of the Company at 30 November 2015 and 2014
are included in the tables below:
US$Director’s
fees
Salaries, allowances
and benefits in kind(1) Bonuses
Share-based
payments
Pension scheme
contributionOther
benefitsInducement
fees Total
Year ended 30 November 2015
Non-executive Director
Mr. Edmund Sze-Wing Tse(2) 573,388 95,383 – – – – – 668,771
Independent Non-executive Directors
Mr. Jack Chak-Kwong So 220,000 – – – – – – 220,000
Mr. Chung-Kong Chow 205,000 – – – – – – 205,000
Mr. John Barrie Harrison 235,000 – – – – – – 235,000
Mr. George Yong-Boon Yeo 210,000 – – – – – – 210,000
Mr. Mohamed Azman Yahya 185,000 – – – – – – 185,000
Professor Lawrence Juen-Yee Lau 190,000 – – – – – – 190,000
Ms. Swee-Lian Teo(3) 56,740 – – – – – – 56,740
Total 1,875,128 95,383 – – – – – 1,970,511
Notes:
(1) It includes non-cash benefits for housing, club membership and medical insurance and company car.
(2) US$22,388 which represents remuneration to Mr. Edmund Sze-Wing Tse in respect of his services as director of a subsidiary of the Company is included in his fees.
(3) Ms. Swee-Lian Teo was appointed as Independent Non-executive Director of the Company on 14 August 2015.
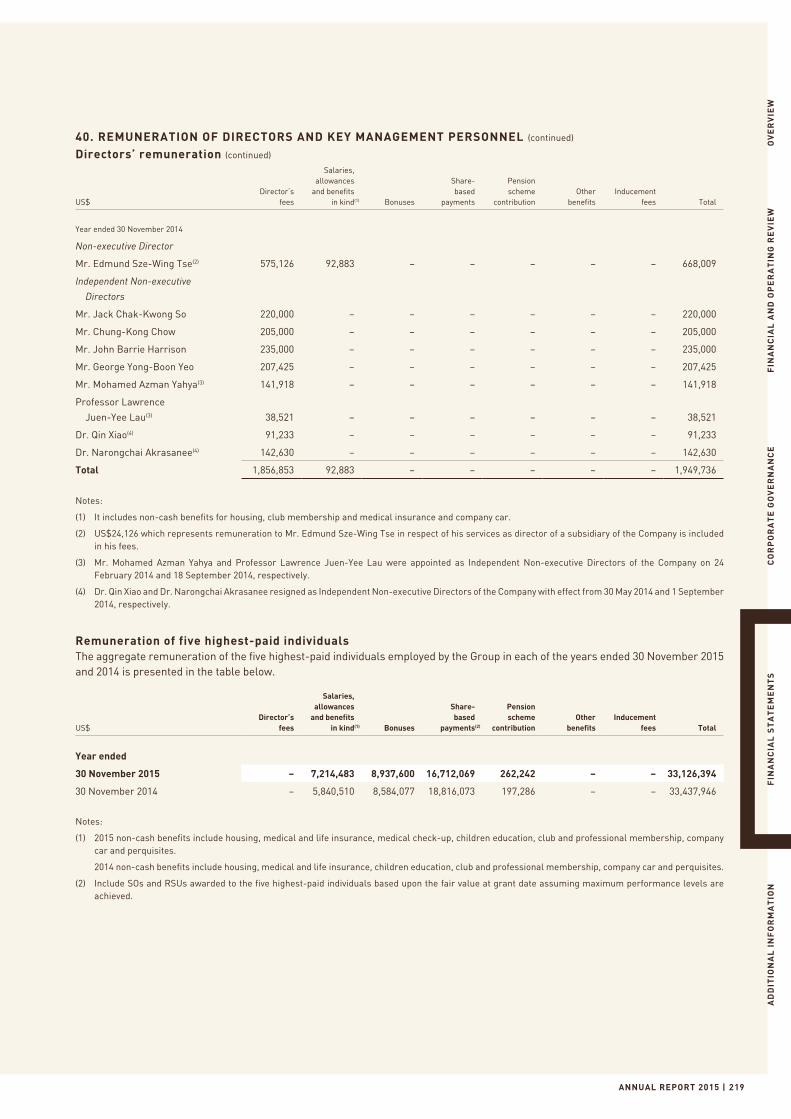
ANNUAL REPORT 2015 | 219
OV
ER
VIE
WF
INA
NC
IAL
AN
D O
PE
RA
TIN
G R
EV
IEW
CO
RP
OR
AT
E G
OV
ER
NA
NC
EF
INA
NC
IAL
ST
AT
EM
EN
TS
AD
DIT
ION
AL
IN
FO
RM
AT
ION
40. REMUNERATION OF DIRECTORS AND KEY MANAGEMENT PERSONNEL (continued)
Directors’ remuneration (continued)
US$Director’s
fees
Salaries, allowances
and benefits in kind(1) Bonuses
Share-based
payments
Pension scheme
contributionOther
benefitsInducement
fees Total
Year ended 30 November 2014
Non-executive Director
Mr. Edmund Sze-Wing Tse(2) 575,126 92,883 – – – – – 668,009
Independent Non-executive
Directors
Mr. Jack Chak-Kwong So 220,000 – – – – – – 220,000
Mr. Chung-Kong Chow 205,000 – – – – – – 205,000
Mr. John Barrie Harrison 235,000 – – – – – – 235,000
Mr. George Yong-Boon Yeo 207,425 – – – – – – 207,425
Mr. Mohamed Azman Yahya(3) 141,918 – – – – – – 141,918
Professor Lawrence
Juen-Yee Lau(3) 38,521 – – – – – – 38,521
Dr. Qin Xiao(4) 91,233 – – – – – – 91,233
Dr. Narongchai Akrasanee(4) 142,630 – – – – – – 142,630
Total 1,856,853 92,883 – – – – – 1,949,736
Notes:
(1) It includes non-cash benefits for housing, club membership and medical insurance and company car.
(2) US$24,126 which represents remuneration to Mr. Edmund Sze-Wing Tse in respect of his services as director of a subsidiary of the Company is included in his fees.
(3) Mr. Mohamed Azman Yahya and Professor Lawrence Juen-Yee Lau were appointed as Independent Non-executive Directors of the Company on 24 February 2014 and 18 September 2014, respectively.
(4) Dr. Qin Xiao and Dr. Narongchai Akrasanee resigned as Independent Non-executive Directors of the Company with effect from 30 May 2014 and 1 September 2014, respectively.
Remuneration of five highest-paid individualsThe aggregate remuneration of the five highest-paid individuals employed by the Group in each of the years ended 30 November 2015 and 2014 is presented in the table below.
US$Director’s
fees
Salaries, allowances
and benefits in kind(1) Bonuses
Share-based
payments(2)
Pension scheme
contributionOther
benefitsInducement
fees Total
Year ended
30 November 2015 – 7,214,483 8,937,600 16,712,069 262,242 – – 33,126,394
30 November 2014 – 5,840,510 8,584,077 18,816,073 197,286 – – 33,437,946
Notes:
(1) 2015 non-cash benefits include housing, medical and life insurance, medical check-up, children education, club and professional membership, company car and perquisites.
2014 non-cash benefits include housing, medical and life insurance, children education, club and professional membership, company car and perquisites.
(2) Include SOs and RSUs awarded to the five highest-paid individuals based upon the fair value at grant date assuming maximum performance levels are achieved.
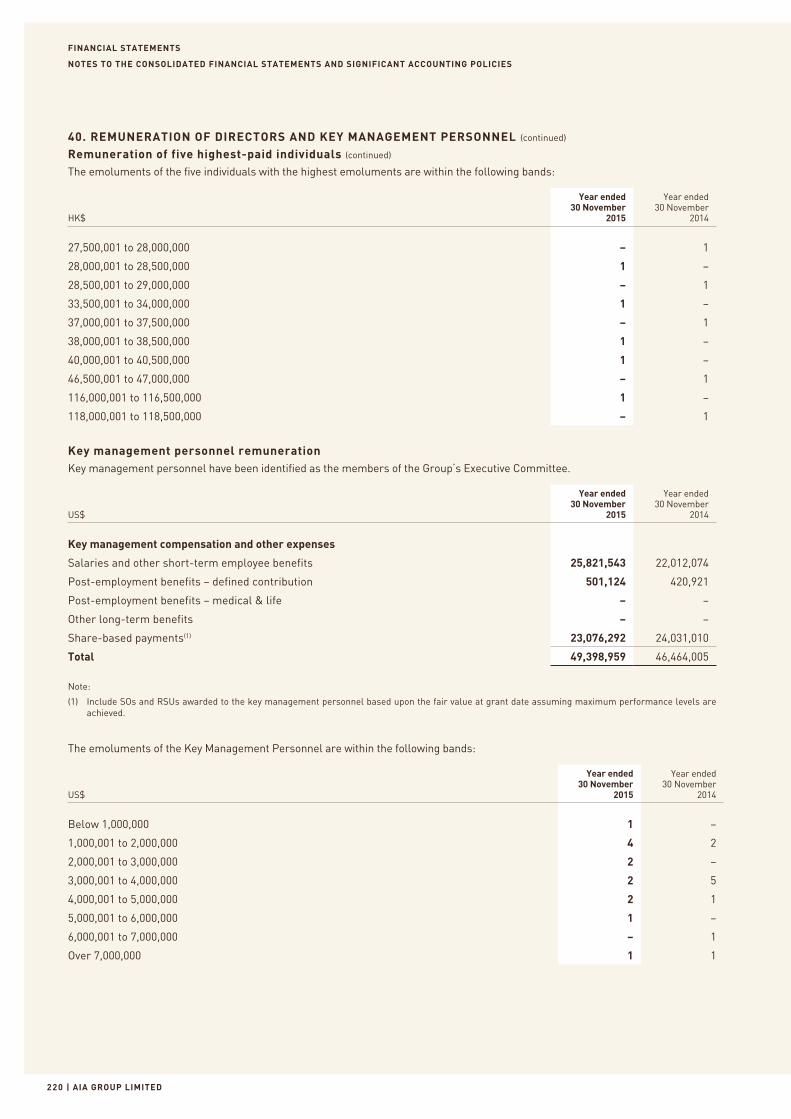
FINANCIAL STATEMENTS
| AIA GROUP LIMITED220
NOTES TO THE CONSOLIDATED FINANCIAL STATEMENTS AND SIGNIFICANT ACCOUNTING POLICIES
40. REMUNERATION OF DIRECTORS AND KEY MANAGEMENT PERSONNEL (continued)
Remuneration of five highest-paid individuals (continued)
The emoluments of the five individuals with the highest emoluments are within the following bands:
Year ended30 November
2015
Year ended30 November
2014HK$
27,500,001 to 28,000,000 – 1
28,000,001 to 28,500,000 1 –
28,500,001 to 29,000,000 – 1
33,500,001 to 34,000,000 1 –
37,000,001 to 37,500,000 – 1
38,000,001 to 38,500,000 1 –
40,000,001 to 40,500,000 1 –
46,500,001 to 47,000,000 – 1
116,000,001 to 116,500,000 1 –
118,000,001 to 118,500,000 – 1
Key management personnel remunerationKey management personnel have been identified as the members of the Group’s Executive Committee.
Year ended30 November
2015
Year ended30 November
2014US$
Key management compensation and other expenses
Salaries and other short-term employee benefits 25,821,543 22,012,074
Post-employment benefits – defined contribution 501,124 420,921
Post-employment benefits – medical & life – –
Other long-term benefits – –
Share-based payments(1) 23,076,292 24,031,010
Total 49,398,959 46,464,005
Note:
(1) Include SOs and RSUs awarded to the key management personnel based upon the fair value at grant date assuming maximum performance levels are achieved.
The emoluments of the Key Management Personnel are within the following bands:
Year ended30 November
2015
Year ended30 November
2014US$
Below 1,000,000 1 –
1,000,001 to 2,000,000 4 2
2,000,001 to 3,000,000 2 –
3,000,001 to 4,000,000 2 5
4,000,001 to 5,000,000 2 1
5,000,001 to 6,000,000 1 –
6,000,001 to 7,000,000 – 1
Over 7,000,000 1 1
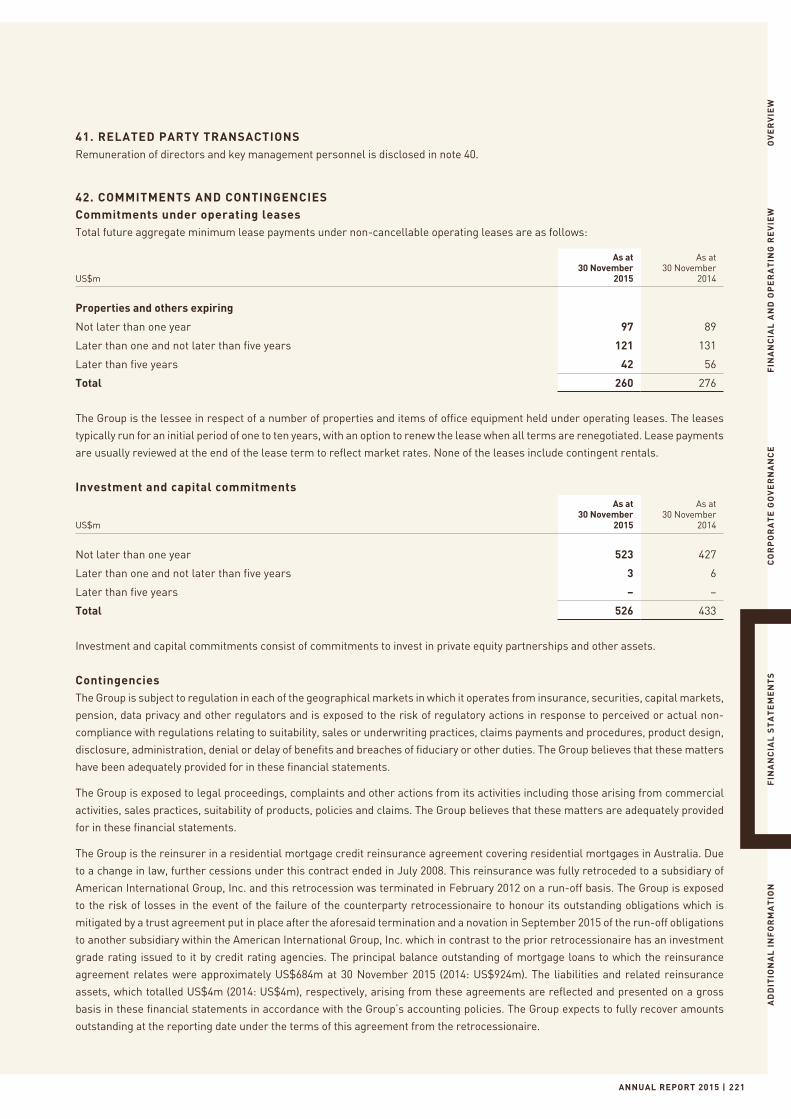
ANNUAL REPORT 2015 | 221
OV
ER
VIE
WF
INA
NC
IAL
AN
D O
PE
RA
TIN
G R
EV
IEW
CO
RP
OR
AT
E G
OV
ER
NA
NC
EF
INA
NC
IAL
ST
AT
EM
EN
TS
AD
DIT
ION
AL
IN
FO
RM
AT
ION
41. RELATED PARTY TRANSACTIONSRemuneration of directors and key management personnel is disclosed in note 40.
42. COMMITMENTS AND CONTINGENCIESCommitments under operating leasesTotal future aggregate minimum lease payments under non-cancellable operating leases are as follows:
US$m
As at30 November
2015
As at30 November
2014
Properties and others expiring
Not later than one year 97 89
Later than one and not later than five years 121 131
Later than five years 42 56
Total 260 276
The Group is the lessee in respect of a number of properties and items of office equipment held under operating leases. The leases
typically run for an initial period of one to ten years, with an option to renew the lease when all terms are renegotiated. Lease payments
are usually reviewed at the end of the lease term to reflect market rates. None of the leases include contingent rentals.
Investment and capital commitments
US$m
As at30 November
2015
As at30 November
2014
Not later than one year 523 427
Later than one and not later than five years 3 6
Later than five years – –
Total 526 433
Investment and capital commitments consist of commitments to invest in private equity partnerships and other assets.
ContingenciesThe Group is subject to regulation in each of the geographical markets in which it operates from insurance, securities, capital markets,
pension, data privacy and other regulators and is exposed to the risk of regulatory actions in response to perceived or actual non-
compliance with regulations relating to suitability, sales or underwriting practices, claims payments and procedures, product design,
disclosure, administration, denial or delay of benefits and breaches of fiduciary or other duties. The Group believes that these matters
have been adequately provided for in these financial statements.
The Group is exposed to legal proceedings, complaints and other actions from its activities including those arising from commercial
activities, sales practices, suitability of products, policies and claims. The Group believes that these matters are adequately provided
for in these financial statements.
The Group is the reinsurer in a residential mortgage credit reinsurance agreement covering residential mortgages in Australia. Due
to a change in law, further cessions under this contract ended in July 2008. This reinsurance was fully retroceded to a subsidiary of
American International Group, Inc. and this retrocession was terminated in February 2012 on a run-off basis. The Group is exposed
to the risk of losses in the event of the failure of the counterparty retrocessionaire to honour its outstanding obligations which is
mitigated by a trust agreement put in place after the aforesaid termination and a novation in September 2015 of the run-off obligations
to another subsidiary within the American International Group, Inc. which in contrast to the prior retrocessionaire has an investment
grade rating issued to it by credit rating agencies. The principal balance outstanding of mortgage loans to which the reinsurance
agreement relates were approximately US$684m at 30 November 2015 (2014: US$924m). The liabilities and related reinsurance
assets, which totalled US$4m (2014: US$4m), respectively, arising from these agreements are reflected and presented on a gross
basis in these financial statements in accordance with the Group’s accounting policies. The Group expects to fully recover amounts
outstanding at the reporting date under the terms of this agreement from the retrocessionaire.
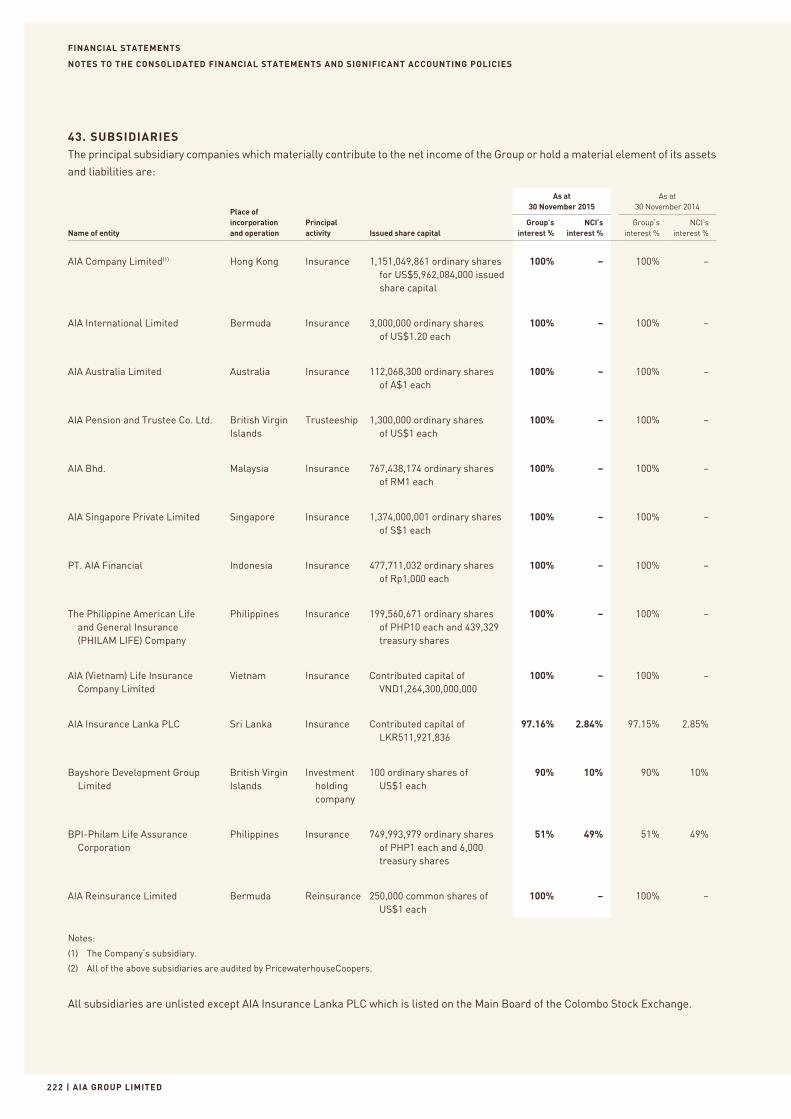
FINANCIAL STATEMENTS
| AIA GROUP LIMITED222
NOTES TO THE CONSOLIDATED FINANCIAL STATEMENTS AND SIGNIFICANT ACCOUNTING POLICIES
43. SUBSIDIARIESThe principal subsidiary companies which materially contribute to the net income of the Group or hold a material element of its assets
and liabilities are:
Name of entity
Place of incorporation and operation
Principal activity Issued share capital
As at 30 November 2015
As at 30 November 2014
Group’s interest %
NCI’s interest %
Group’s interest %
NCI’s interest %
AIA Company Limited(1) Hong Kong Insurance 1,151,049,861 ordinary shares for US$5,962,084,000 issued share capital
100% – 100% –
AIA International Limited Bermuda Insurance 3,000,000 ordinary shares of US$1.20 each
100% – 100% –
AIA Australia Limited Australia Insurance 112,068,300 ordinary shares of A$1 each
100% – 100% –
AIA Pension and Trustee Co. Ltd. British Virgin Islands
Trusteeship 1,300,000 ordinary shares of US$1 each
100% – 100% –
AIA Bhd. Malaysia Insurance 767,438,174 ordinary shares of RM1 each
100% – 100% –
AIA Singapore Private Limited Singapore Insurance 1,374,000,001 ordinary shares of S$1 each
100% – 100% –
PT. AIA Financial Indonesia Insurance 477,711,032 ordinary shares of Rp1,000 each
100% – 100% –
The Philippine American Life and General Insurance (PHILAM LIFE) Company
Philippines Insurance 199,560,671 ordinary shares of PHP10 each and 439,329 treasury shares
100% – 100% –
AIA (Vietnam) Life Insurance Company Limited
Vietnam Insurance Contributed capital of VND1,264,300,000,000
100% – 100% –
AIA Insurance Lanka PLC Sri Lanka Insurance Contributed capital of LKR511,921,836
97.16% 2.84% 97.15% 2.85%
Bayshore Development Group Limited
British Virgin Islands
Investment holding company
100 ordinary shares of US$1 each
90% 10% 90% 10%
BPI-Philam Life Assurance Corporation
Philippines Insurance 749,993,979 ordinary shares of PHP1 each and 6,000 treasury shares
51% 49% 51% 49%
AIA Reinsurance Limited Bermuda Reinsurance 250,000 common shares of US$1 each
100% – 100% –
Notes:
(1) The Company’s subsidiary.
(2) All of the above subsidiaries are audited by PricewaterhouseCoopers.
All subsidiaries are unlisted except AIA Insurance Lanka PLC which is listed on the Main Board of the Colombo Stock Exchange.
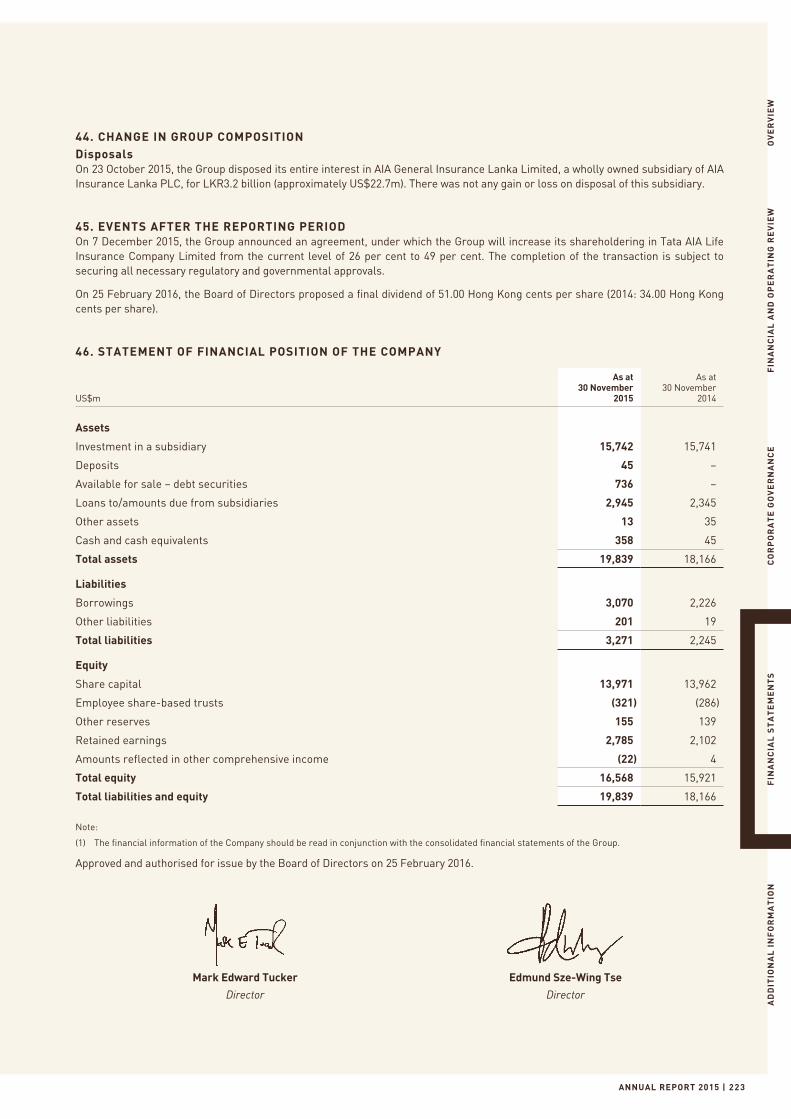
ANNUAL REPORT 2015 | 223
OV
ER
VIE
WF
INA
NC
IAL
AN
D O
PE
RA
TIN
G R
EV
IEW
CO
RP
OR
AT
E G
OV
ER
NA
NC
EF
INA
NC
IAL
ST
AT
EM
EN
TS
AD
DIT
ION
AL
IN
FO
RM
AT
ION
44. CHANGE IN GROUP COMPOSITIONDisposalsOn 23 October 2015, the Group disposed its entire interest in AIA General Insurance Lanka Limited, a wholly owned subsidiary of AIA Insurance Lanka PLC, for LKR3.2 billion (approximately US$22.7m). There was not any gain or loss on disposal of this subsidiary.
45. EVENTS AFTER THE REPORTING PERIODOn 7 December 2015, the Group announced an agreement, under which the Group will increase its shareholdering in Tata AIA Life Insurance Company Limited from the current level of 26 per cent to 49 per cent. The completion of the transaction is subject to securing all necessary regulatory and governmental approvals.
On 25 February 2016, the Board of Directors proposed a final dividend of 51.00 Hong Kong cents per share (2014: 34.00 Hong Kong cents per share).
46. STATEMENT OF FINANCIAL POSITION OF THE COMPANY
US$m
As at30 November
2015
As at30 November
2014
Assets
Investment in a subsidiary 15,742 15,741
Deposits 45 –
Available for sale – debt securities 736 –
Loans to/amounts due from subsidiaries 2,945 2,345
Other assets 13 35
Cash and cash equivalents 358 45
Total assets 19,839 18,166
Liabilities
Borrowings 3,070 2,226
Other liabilities 201 19
Total liabilities 3,271 2,245
Equity
Share capital 13,971 13,962
Employee share-based trusts (321) (286)
Other reserves 155 139
Retained earnings 2,785 2,102
Amounts reflected in other comprehensive income (22) 4
Total equity 16,568 15,921
Total liabilities and equity 19,839 18,166
Note:
(1) The financial information of the Company should be read in conjunction with the consolidated financial statements of the Group.
Approved and authorised for issue by the Board of Directors on 25 February 2016.
Mark Edward Tucker Edmund Sze-Wing Tse
Director Director
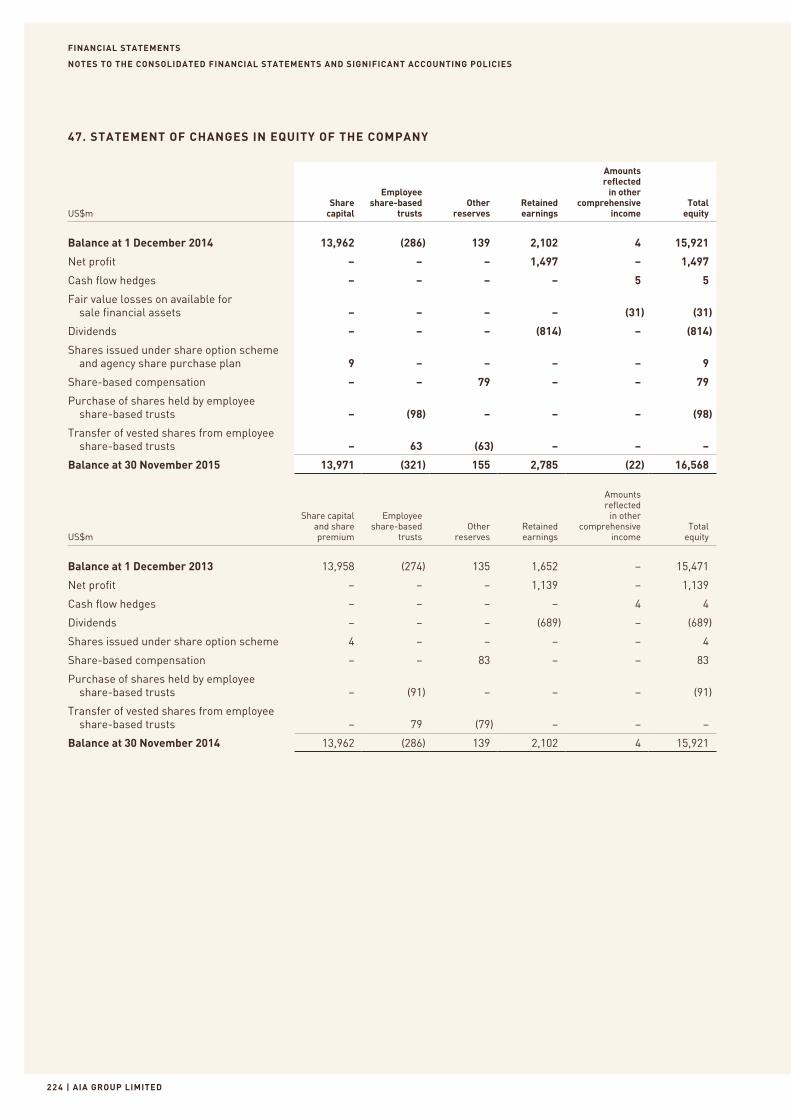
FINANCIAL STATEMENTS
| AIA GROUP LIMITED22 4
NOTES TO THE CONSOLIDATED FINANCIAL STATEMENTS AND SIGNIFICANT ACCOUNTING POLICIES
47. STATEMENT OF CHANGES IN EQUITY OF THE COMPANY
US$mShare
capital
Employee share-based
trustsOther
reservesRetained earnings
Amounts reflected
in other comprehensive
incomeTotal
equity
Balance at 1 December 2014 13,962 (286) 139 2,102 4 15,921
Net profit – – – 1,497 – 1,497
Cash flow hedges – – – – 5 5
Fair value losses on available for sale financial assets – – – – (31) (31)
Dividends – – – (814) – (814)
Shares issued under share option scheme and agency share purchase plan 9 – – – – 9
Share-based compensation – – 79 – – 79
Purchase of shares held by employee share-based trusts – (98) – – – (98)
Transfer of vested shares from employee share-based trusts – 63 (63) – – –
Balance at 30 November 2015 13,971 (321) 155 2,785 (22) 16,568
US$m
Share capital and share premium
Employee share-based
trustsOther
reservesRetained earnings
Amounts reflected
in other comprehensive
incomeTotal
equity
Balance at 1 December 2013 13,958 (274) 135 1,652 – 15,471
Net profit – – – 1,139 – 1,139
Cash flow hedges – – – – 4 4
Dividends – – – (689) – (689)
Shares issued under share option scheme 4 – – – – 4
Share-based compensation – – 83 – – 83
Purchase of shares held by employee share-based trusts – (91) – – – (91)
Transfer of vested shares from employee share-based trusts – 79 (79) – – –
Balance at 30 November 2014 13,962 (286) 139 2,102 4 15,921
ANNUAL REPORT 2015 | 225
OV
ER
VIE
WF
INA
NC
IAL
AN
D O
PE
RA
TIN
G R
EV
IEW
CO
RP
OR
AT
E G
OV
ER
NA
NC
EF
INA
NC
IAL
ST
AT
EM
EN
TS
AD
DIT
ION
AL
IN
FO
RM
AT
ION
48. EFFECT OF ADOPTION OF REVISED ACCOUNTING POLICIESWith effect from 1 December 2015, the Group revised its accounting policies for real estate as follows:
• Property held for own use is carried at fair value at last valuation date less accumulated depreciation. Previously, property held
for own use was carried at historical cost less accumulated depreciation. When an asset is adjusted for the latest fair value, any
accumulated depreciation at the date of valuation is eliminated against the gross carrying amount of the asset. The movement of
fair values is generally recognised in other comprehensive income. When such properties are sold, the amounts accumulated in
other comprehensive income are transferred to retained earnings. The revised accounting policy is applied prospectively from the
date of adoption, resulting in increases of US$450m and US$259m in total assets and total equity, respectively, as of 1 December
2015.
Property held for own use is valued by independent professional valuation firm at least annually to ensure that fair value of the
revalued asset does not differ materially from its carrying value. Changes in fair values are recognised in the other comprehensive
income and reported in the consolidated statement of financial position as property revaluation reserve.
In conjunction with the revised real estate accounting policies, depreciation expense for property held for own use is presented as ‘other expenses’ for IFRS reporting and this presentation change will be applied retrospectively. Operating leasehold land relating
to property held for own use will continue to be carried at cost less accumulated amortisation and impairment losses (if any) and
be reported as part of ‘other assets’ on the consolidated statement of financial position.
• Investment property, including land and buildings, is initially recognised at cost with changes in fair values in subsequent periods
recognised in the consolidated income statement. Operating leasehold land relating to investment properties is reclassified from ‘other assets’ to ‘investment properties’ accordingly on the consolidated statement of financial position. The revised accounting
policy will be applied retrospectively.
The Group believes measuring property held for own use and investment property in accordance with the revised accounting policies
(based on guidance in IAS 16 Property, Plant and Equipment and IAS 40 Investment Property, respectively) provide reliable and more
relevant information to the users of the financial statements than that measured based on cost model under the current accounting
policy.
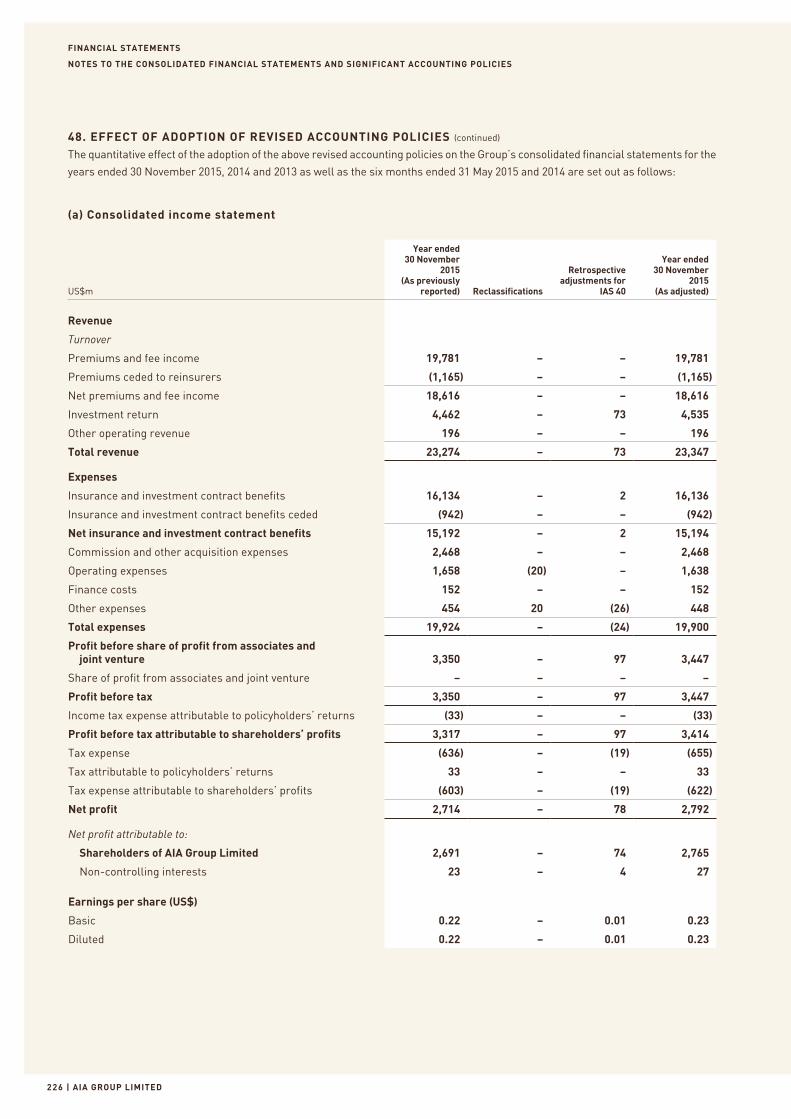
FINANCIAL STATEMENTS
| AIA GROUP LIMITED226
NOTES TO THE CONSOLIDATED FINANCIAL STATEMENTS AND SIGNIFICANT ACCOUNTING POLICIES
48. EFFECT OF ADOPTION OF REVISED ACCOUNTING POLICIES (continued)
The quantitative effect of the adoption of the above revised accounting policies on the Group’s consolidated financial statements for the
years ended 30 November 2015, 2014 and 2013 as well as the six months ended 31 May 2015 and 2014 are set out as follows:
(a) Consolidated income statement
US$m
Year ended 30 November
2015 (As previously
reported) Reclassifications
Retrospective adjustments for
IAS 40
Year ended 30 November
2015 (As adjusted)
Revenue
Turnover
Premiums and fee income 19,781 – – 19,781
Premiums ceded to reinsurers (1,165) – – (1,165)
Net premiums and fee income 18,616 – – 18,616
Investment return 4,462 – 73 4,535
Other operating revenue 196 – – 196
Total revenue 23,274 – 73 23,347
Expenses
Insurance and investment contract benefits 16,134 – 2 16,136
Insurance and investment contract benefits ceded (942) – – (942)
Net insurance and investment contract benefits 15,192 – 2 15,194
Commission and other acquisition expenses 2,468 – – 2,468
Operating expenses 1,658 (20) – 1,638
Finance costs 152 – – 152
Other expenses 454 20 (26) 448
Total expenses 19,924 – (24) 19,900
Profit before share of profit from associates and joint venture 3,350 – 97 3,447
Share of profit from associates and joint venture – – – –
Profit before tax 3,350 – 97 3,447
Income tax expense attributable to policyholders’ returns (33) – – (33)
Profit before tax attributable to shareholders’ profits 3,317 – 97 3,414
Tax expense (636) – (19) (655)
Tax attributable to policyholders’ returns 33 – – 33
Tax expense attributable to shareholders’ profits (603) – (19) (622)
Net profit 2,714 – 78 2,792
Net profit attributable to:
Shareholders of AIA Group Limited 2,691 – 74 2,765
Non-controlling interests 23 – 4 27
Earnings per share (US$)
Basic 0.22 – 0.01 0.23
Diluted 0.22 – 0.01 0.23
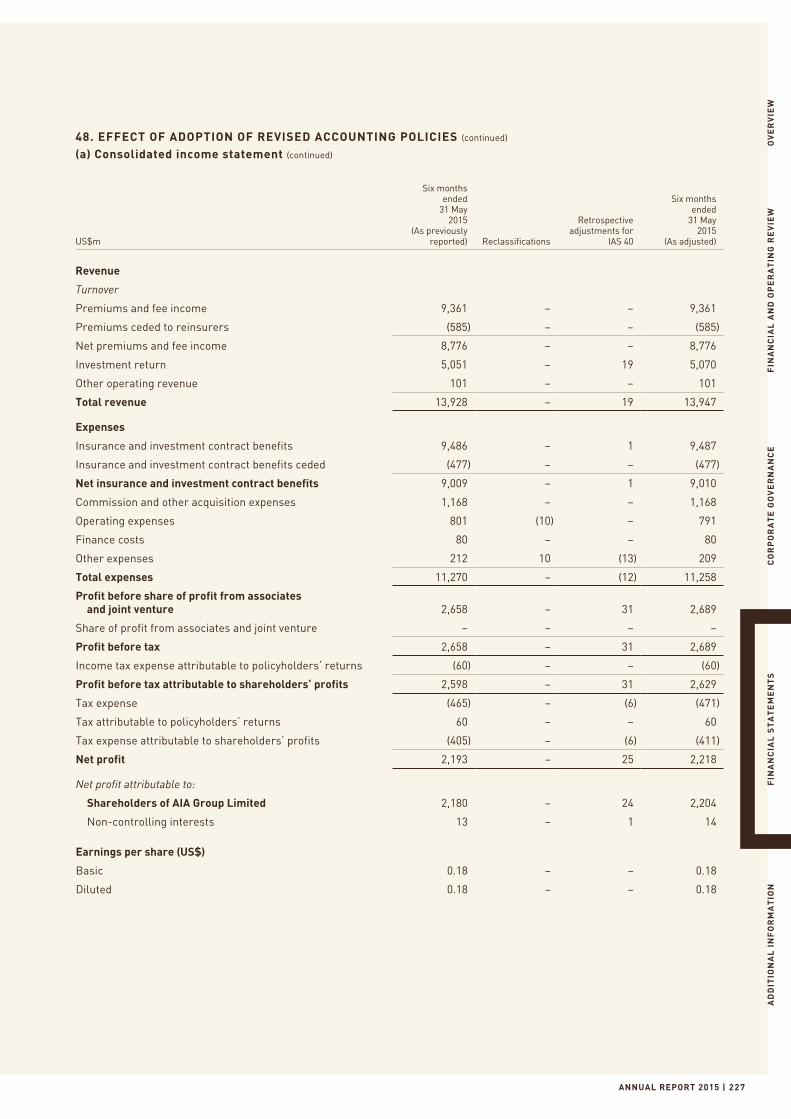
ANNUAL REPORT 2015 | 227
OV
ER
VIE
WF
INA
NC
IAL
AN
D O
PE
RA
TIN
G R
EV
IEW
CO
RP
OR
AT
E G
OV
ER
NA
NC
EF
INA
NC
IAL
ST
AT
EM
EN
TS
AD
DIT
ION
AL
IN
FO
RM
AT
ION
48. EFFECT OF ADOPTION OF REVISED ACCOUNTING POLICIES (continued)
(a) Consolidated income statement (continued)
US$m
Six months ended
31 May 2015
(As previously reported) Reclassifications
Retrospective adjustments for
IAS 40
Six months ended
31 May 2015
(As adjusted)
Revenue
Turnover
Premiums and fee income 9,361 – – 9,361
Premiums ceded to reinsurers (585) – – (585)
Net premiums and fee income 8,776 – – 8,776
Investment return 5,051 – 19 5,070
Other operating revenue 101 – – 101
Total revenue 13,928 – 19 13,947
Expenses
Insurance and investment contract benefits 9,486 – 1 9,487
Insurance and investment contract benefits ceded (477) – – (477)
Net insurance and investment contract benefits 9,009 – 1 9,010
Commission and other acquisition expenses 1,168 – – 1,168
Operating expenses 801 (10) – 791
Finance costs 80 – – 80
Other expenses 212 10 (13) 209
Total expenses 11,270 – (12) 11,258
Profit before share of profit from associates and joint venture 2,658 – 31 2,689
Share of profit from associates and joint venture – – – –
Profit before tax 2,658 – 31 2,689
Income tax expense attributable to policyholders’ returns (60) – – (60)
Profit before tax attributable to shareholders’ profits 2,598 – 31 2,629
Tax expense (465) – (6) (471)
Tax attributable to policyholders’ returns 60 – – 60
Tax expense attributable to shareholders’ profits (405) – (6) (411)
Net profit 2,193 – 25 2,218
Net profit attributable to:
Shareholders of AIA Group Limited 2,180 – 24 2,204
Non-controlling interests 13 – 1 14
Earnings per share (US$)
Basic 0.18 – – 0.18
Diluted 0.18 – – 0.18
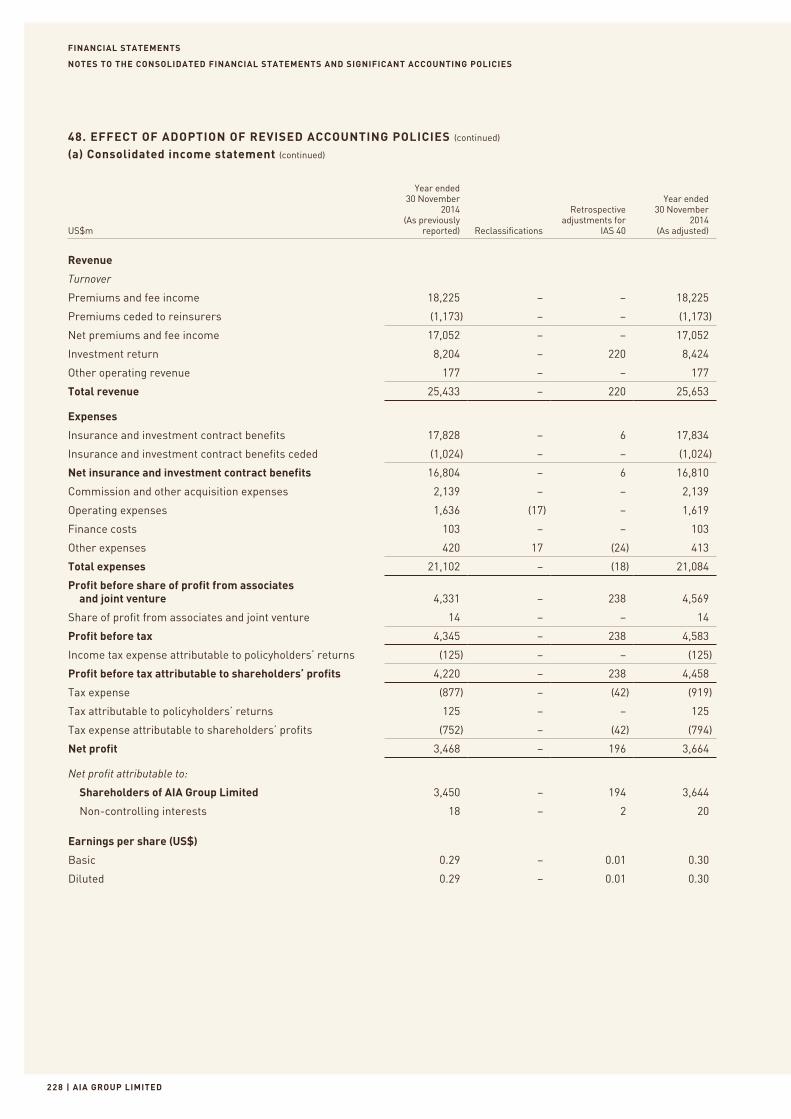
FINANCIAL STATEMENTS
| AIA GROUP LIMITED228
NOTES TO THE CONSOLIDATED FINANCIAL STATEMENTS AND SIGNIFICANT ACCOUNTING POLICIES
48. EFFECT OF ADOPTION OF REVISED ACCOUNTING POLICIES (continued)
(a) Consolidated income statement (continued)
US$m
Year ended 30 November
2014(As previously
reported) Reclassifications
Retrospective adjustments for
IAS 40
Year ended 30 November
2014 (As adjusted)
Revenue
Turnover
Premiums and fee income 18,225 – – 18,225
Premiums ceded to reinsurers (1,173) – – (1,173)
Net premiums and fee income 17,052 – – 17,052
Investment return 8,204 – 220 8,424
Other operating revenue 177 – – 177
Total revenue 25,433 – 220 25,653
Expenses
Insurance and investment contract benefits 17,828 – 6 17,834
Insurance and investment contract benefits ceded (1,024) – – (1,024)
Net insurance and investment contract benefits 16,804 – 6 16,810
Commission and other acquisition expenses 2,139 – – 2,139
Operating expenses 1,636 (17) – 1,619
Finance costs 103 – – 103
Other expenses 420 17 (24) 413
Total expenses 21,102 – (18) 21,084
Profit before share of profit from associates and joint venture 4,331 – 238 4,569
Share of profit from associates and joint venture 14 – – 14
Profit before tax 4,345 – 238 4,583
Income tax expense attributable to policyholders’ returns (125) – – (125)
Profit before tax attributable to shareholders’ profits 4,220 – 238 4,458
Tax expense (877) – (42) (919)
Tax attributable to policyholders’ returns 125 – – 125
Tax expense attributable to shareholders’ profits (752) – (42) (794)
Net profit 3,468 – 196 3,664
Net profit attributable to:
Shareholders of AIA Group Limited 3,450 – 194 3,644
Non-controlling interests 18 – 2 20
Earnings per share (US$)
Basic 0.29 – 0.01 0.30
Diluted 0.29 – 0.01 0.30
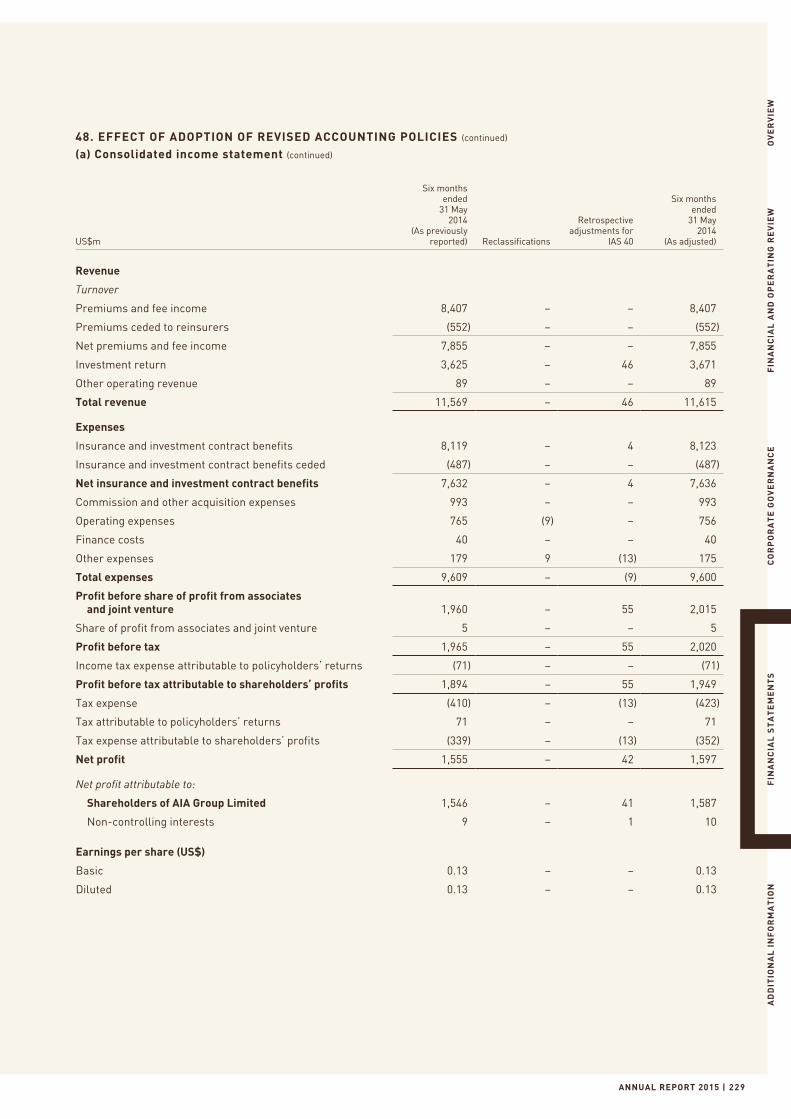
ANNUAL REPORT 2015 | 229
OV
ER
VIE
WF
INA
NC
IAL
AN
D O
PE
RA
TIN
G R
EV
IEW
CO
RP
OR
AT
E G
OV
ER
NA
NC
EF
INA
NC
IAL
ST
AT
EM
EN
TS
AD
DIT
ION
AL
IN
FO
RM
AT
ION
48. EFFECT OF ADOPTION OF REVISED ACCOUNTING POLICIES (continued)
(a) Consolidated income statement (continued)
US$m
Six months ended31 May
2014 (As previously
reported) Reclassifications
Retrospective adjustments for
IAS 40
Six months ended
31 May 2014
(As adjusted)
Revenue
Turnover
Premiums and fee income 8,407 – – 8,407
Premiums ceded to reinsurers (552) – – (552)
Net premiums and fee income 7,855 – – 7,855
Investment return 3,625 – 46 3,671
Other operating revenue 89 – – 89
Total revenue 11,569 – 46 11,615
Expenses
Insurance and investment contract benefits 8,119 – 4 8,123
Insurance and investment contract benefits ceded (487) – – (487)
Net insurance and investment contract benefits 7,632 – 4 7,636
Commission and other acquisition expenses 993 – – 993
Operating expenses 765 (9) – 756
Finance costs 40 – – 40
Other expenses 179 9 (13) 175
Total expenses 9,609 – (9) 9,600
Profit before share of profit from associates and joint venture 1,960 – 55 2,015
Share of profit from associates and joint venture 5 – – 5
Profit before tax 1,965 – 55 2,020
Income tax expense attributable to policyholders’ returns (71) – – (71)
Profit before tax attributable to shareholders’ profits 1,894 – 55 1,949
Tax expense (410) – (13) (423)
Tax attributable to policyholders’ returns 71 – – 71
Tax expense attributable to shareholders’ profits (339) – (13) (352)
Net profit 1,555 – 42 1,597
Net profit attributable to:
Shareholders of AIA Group Limited 1,546 – 41 1,587
Non-controlling interests 9 – 1 10
Earnings per share (US$)
Basic 0.13 – – 0.13
Diluted 0.13 – – 0.13
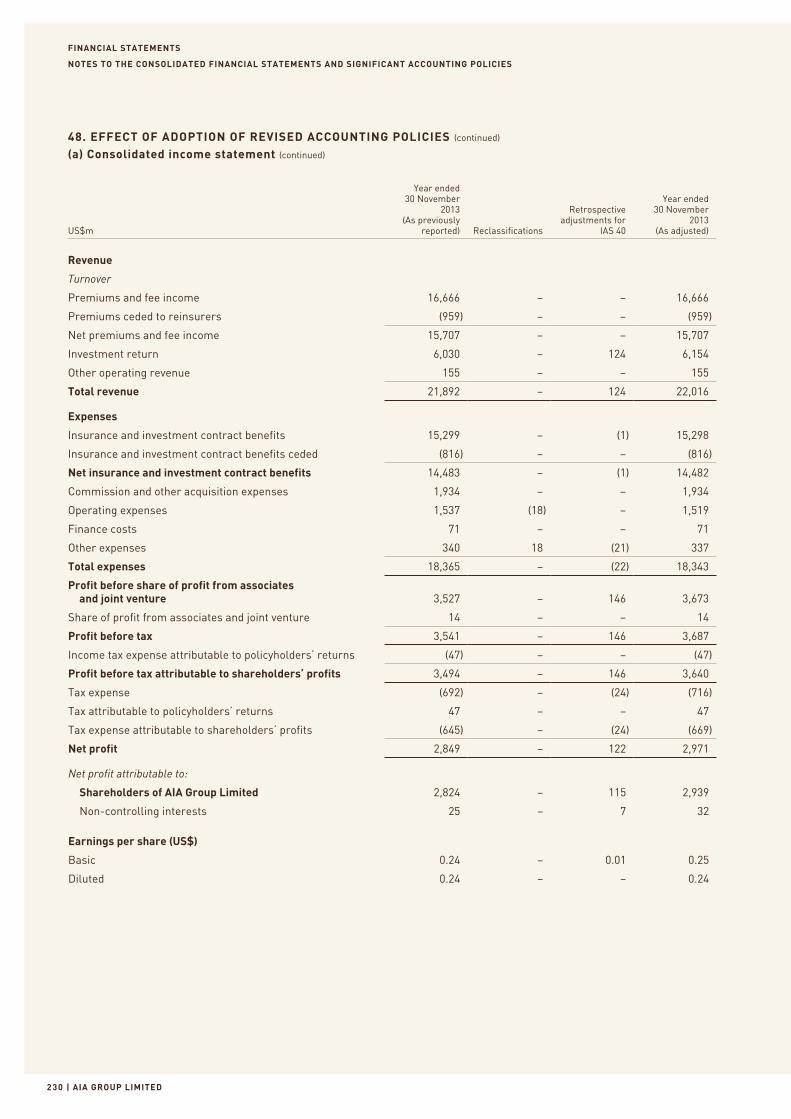
FINANCIAL STATEMENTS
| AIA GROUP LIMITED230
NOTES TO THE CONSOLIDATED FINANCIAL STATEMENTS AND SIGNIFICANT ACCOUNTING POLICIES
48. EFFECT OF ADOPTION OF REVISED ACCOUNTING POLICIES (continued)
(a) Consolidated income statement (continued)
US$m
Year ended 30 November
2013 (As previously
reported) Reclassifications
Retrospective adjustments for
IAS 40
Year ended 30 November
2013 (As adjusted)
Revenue
Turnover
Premiums and fee income 16,666 – – 16,666
Premiums ceded to reinsurers (959) – – (959)
Net premiums and fee income 15,707 – – 15,707
Investment return 6,030 – 124 6,154
Other operating revenue 155 – – 155
Total revenue 21,892 – 124 22,016
Expenses
Insurance and investment contract benefits 15,299 – (1) 15,298
Insurance and investment contract benefits ceded (816) – – (816)
Net insurance and investment contract benefits 14,483 – (1) 14,482
Commission and other acquisition expenses 1,934 – – 1,934
Operating expenses 1,537 (18) – 1,519
Finance costs 71 – – 71
Other expenses 340 18 (21) 337
Total expenses 18,365 – (22) 18,343
Profit before share of profit from associates and joint venture 3,527 – 146 3,673
Share of profit from associates and joint venture 14 – – 14
Profit before tax 3,541 – 146 3,687
Income tax expense attributable to policyholders’ returns (47) – – (47)
Profit before tax attributable to shareholders’ profits 3,494 – 146 3,640
Tax expense (692) – (24) (716)
Tax attributable to policyholders’ returns 47 – – 47
Tax expense attributable to shareholders’ profits (645) – (24) (669)
Net profit 2,849 – 122 2,971
Net profit attributable to:
Shareholders of AIA Group Limited 2,824 – 115 2,939
Non-controlling interests 25 – 7 32
Earnings per share (US$)
Basic 0.24 – 0.01 0.25
Diluted 0.24 – – 0.24
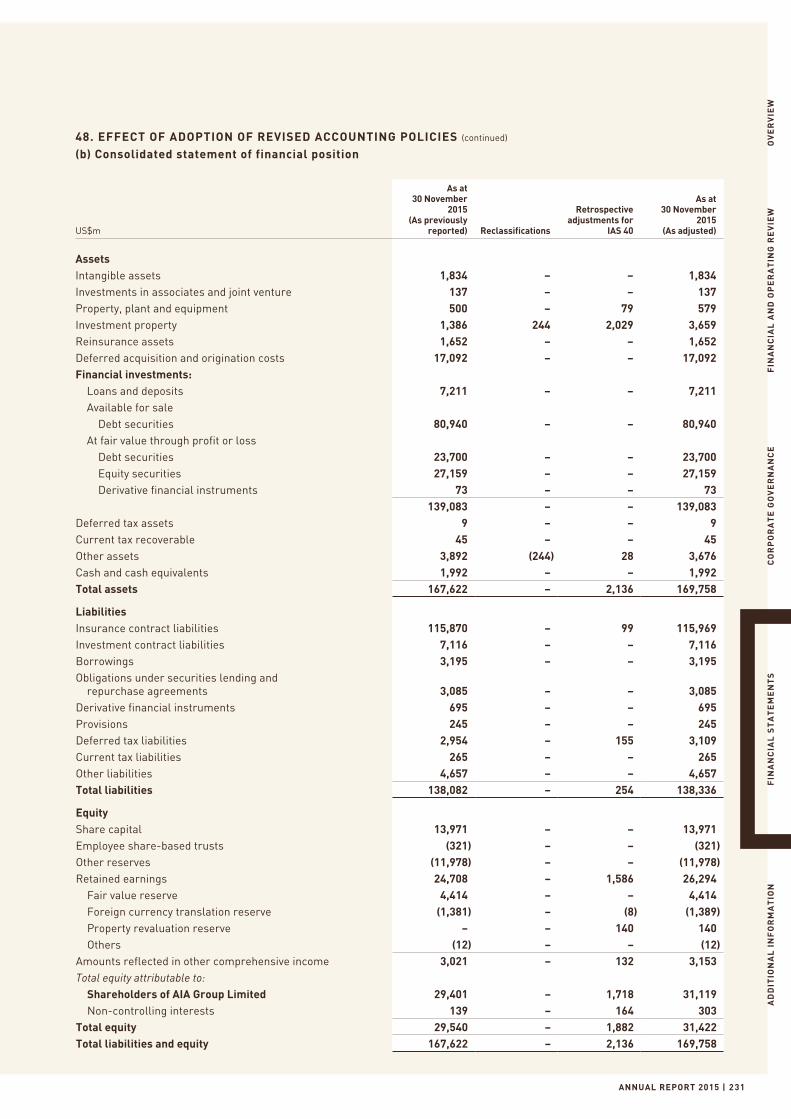
ANNUAL REPORT 2015 | 231
OV
ER
VIE
WF
INA
NC
IAL
AN
D O
PE
RA
TIN
G R
EV
IEW
CO
RP
OR
AT
E G
OV
ER
NA
NC
EF
INA
NC
IAL
ST
AT
EM
EN
TS
AD
DIT
ION
AL
IN
FO
RM
AT
ION
48. EFFECT OF ADOPTION OF REVISED ACCOUNTING POLICIES (continued)
(b) Consolidated statement of financial position
US$m
As at 30 November
2015 (As previously
reported) Reclassifications
Retrospective adjustments for
IAS 40
As at 30 November
2015 (As adjusted)
AssetsIntangible assets 1,834 – – 1,834Investments in associates and joint venture 137 – – 137Property, plant and equipment 500 – 79 579Investment property 1,386 244 2,029 3,659Reinsurance assets 1,652 – – 1,652Deferred acquisition and origination costs 17,092 – – 17,092Financial investments: Loans and deposits 7,211 – – 7,211 Available for sale Debt securities 80,940 – – 80,940 At fair value through profit or loss Debt securities 23,700 – – 23,700 Equity securities 27,159 – – 27,159 Derivative financial instruments 73 – – 73
139,083 – – 139,083Deferred tax assets 9 – – 9Current tax recoverable 45 – – 45Other assets 3,892 (244) 28 3,676Cash and cash equivalents 1,992 – – 1,992Total assets 167,622 – 2,136 169,758
LiabilitiesInsurance contract liabilities 115,870 – 99 115,969Investment contract liabilities 7,116 – – 7,116Borrowings 3,195 – – 3,195Obligations under securities lending and repurchase agreements 3,085 – – 3,085Derivative financial instruments 695 – – 695Provisions 245 – – 245Deferred tax liabilities 2,954 – 155 3,109Current tax liabilities 265 – – 265Other liabilities 4,657 – – 4,657Total liabilities 138,082 – 254 138,336
EquityShare capital 13,971 – – 13,971Employee share-based trusts (321) – – (321)Other reserves (11,978) – – (11,978)Retained earnings 24,708 – 1,586 26,294 Fair value reserve 4,414 – – 4,414 Foreign currency translation reserve (1,381) – (8) (1,389) Property revaluation reserve – – 140 140 Others (12) – – (12)Amounts reflected in other comprehensive income 3,021 – 132 3,153Total equity attributable to: Shareholders of AIA Group Limited 29,401 – 1,718 31,119 Non-controlling interests 139 – 164 303Total equity 29,540 – 1,882 31,422Total liabilities and equity 167,622 – 2,136 169,758
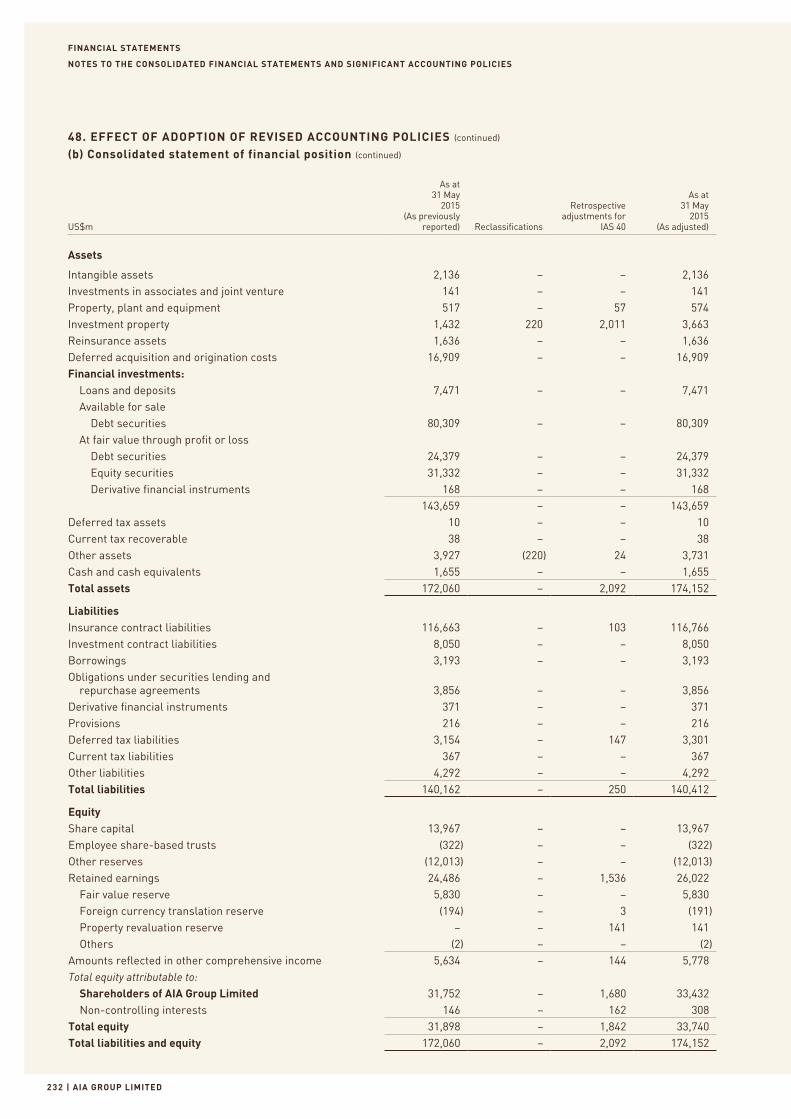
FINANCIAL STATEMENTS
| AIA GROUP LIMITED232
NOTES TO THE CONSOLIDATED FINANCIAL STATEMENTS AND SIGNIFICANT ACCOUNTING POLICIES
48. EFFECT OF ADOPTION OF REVISED ACCOUNTING POLICIES (continued)
(b) Consolidated statement of financial position (continued)
US$m
As at 31 May
2015 (As previously
reported) Reclassifications
Retrospective adjustments for
IAS 40
As at 31 May
2015(As adjusted)
Assets
Intangible assets 2,136 – – 2,136Investments in associates and joint venture 141 – – 141Property, plant and equipment 517 – 57 574Investment property 1,432 220 2,011 3,663Reinsurance assets 1,636 – – 1,636Deferred acquisition and origination costs 16,909 – – 16,909Financial investments: Loans and deposits 7,471 – – 7,471 Available for sale Debt securities 80,309 – – 80,309 At fair value through profit or loss Debt securities 24,379 – – 24,379 Equity securities 31,332 – – 31,332 Derivative financial instruments 168 – – 168
143,659 – – 143,659Deferred tax assets 10 – – 10Current tax recoverable 38 – – 38Other assets 3,927 (220) 24 3,731Cash and cash equivalents 1,655 – – 1,655Total assets 172,060 – 2,092 174,152
LiabilitiesInsurance contract liabilities 116,663 – 103 116,766Investment contract liabilities 8,050 – – 8,050Borrowings 3,193 – – 3,193Obligations under securities lending and repurchase agreements 3,856 – – 3,856Derivative financial instruments 371 – – 371Provisions 216 – – 216Deferred tax liabilities 3,154 – 147 3,301Current tax liabilities 367 – – 367Other liabilities 4,292 – – 4,292Total liabilities 140,162 – 250 140,412
EquityShare capital 13,967 – – 13,967Employee share-based trusts (322) – – (322)Other reserves (12,013) – – (12,013)Retained earnings 24,486 – 1,536 26,022 Fair value reserve 5,830 – – 5,830 Foreign currency translation reserve (194) – 3 (191) Property revaluation reserve – – 141 141 Others (2) – – (2)Amounts reflected in other comprehensive income 5,634 – 144 5,778Total equity attributable to: Shareholders of AIA Group Limited 31,752 – 1,680 33,432 Non-controlling interests 146 – 162 308Total equity 31,898 – 1,842 33,740Total liabilities and equity 172,060 – 2,092 174,152
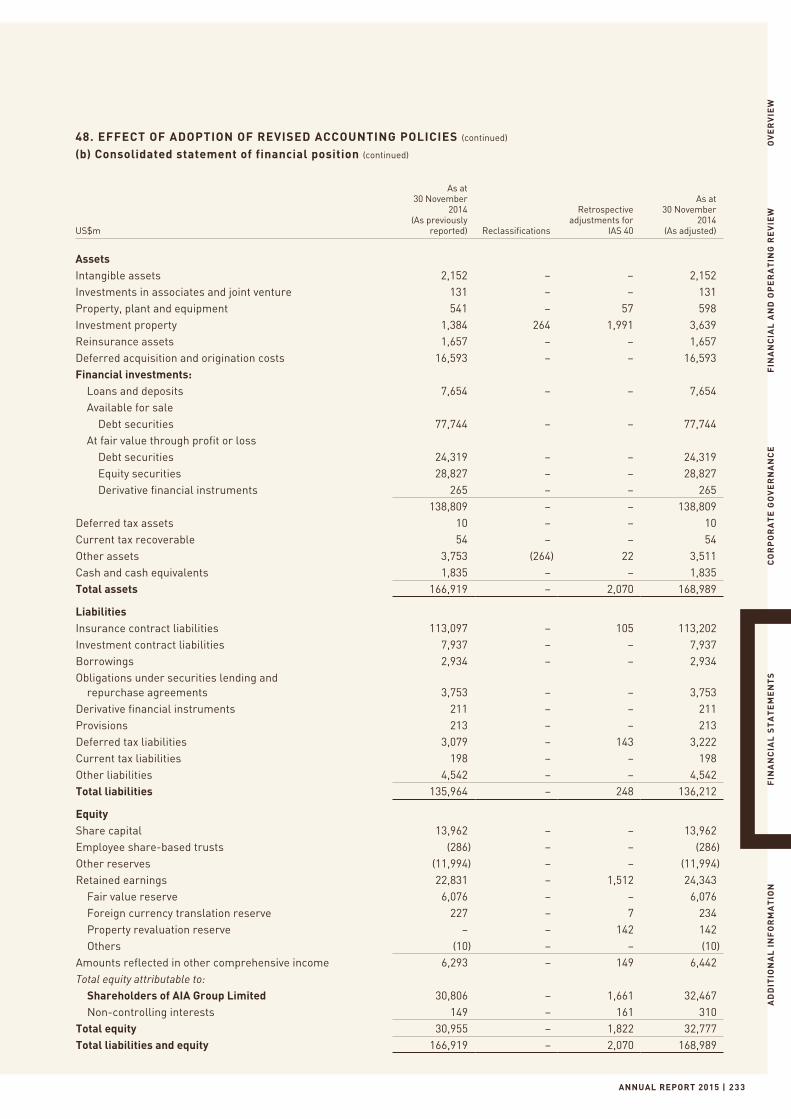
ANNUAL REPORT 2015 | 233
OV
ER
VIE
WF
INA
NC
IAL
AN
D O
PE
RA
TIN
G R
EV
IEW
CO
RP
OR
AT
E G
OV
ER
NA
NC
EF
INA
NC
IAL
ST
AT
EM
EN
TS
AD
DIT
ION
AL
IN
FO
RM
AT
ION
48. EFFECT OF ADOPTION OF REVISED ACCOUNTING POLICIES (continued)
(b) Consolidated statement of financial position (continued)
US$m
As at 30 November
2014 (As previously
reported) Reclassifications
Retrospective adjustments for
IAS 40
As at 30 November
2014 (As adjusted)
AssetsIntangible assets 2,152 – – 2,152Investments in associates and joint venture 131 – – 131Property, plant and equipment 541 – 57 598Investment property 1,384 264 1,991 3,639Reinsurance assets 1,657 – – 1,657Deferred acquisition and origination costs 16,593 – – 16,593Financial investments: Loans and deposits 7,654 – – 7,654 Available for sale Debt securities 77,744 – – 77,744 At fair value through profit or loss Debt securities 24,319 – – 24,319 Equity securities 28,827 – – 28,827 Derivative financial instruments 265 – – 265
138,809 – – 138,809Deferred tax assets 10 – – 10Current tax recoverable 54 – – 54Other assets 3,753 (264) 22 3,511Cash and cash equivalents 1,835 – – 1,835Total assets 166,919 – 2,070 168,989
LiabilitiesInsurance contract liabilities 113,097 – 105 113,202Investment contract liabilities 7,937 – – 7,937Borrowings 2,934 – – 2,934Obligations under securities lending and repurchase agreements 3,753 – – 3,753Derivative financial instruments 211 – – 211Provisions 213 – – 213Deferred tax liabilities 3,079 – 143 3,222Current tax liabilities 198 – – 198Other liabilities 4,542 – – 4,542Total liabilities 135,964 – 248 136,212
EquityShare capital 13,962 – – 13,962Employee share-based trusts (286) – – (286)Other reserves (11,994) – – (11,994)Retained earnings 22,831 – 1,512 24,343 Fair value reserve 6,076 – – 6,076 Foreign currency translation reserve 227 – 7 234 Property revaluation reserve – – 142 142 Others (10) – – (10)Amounts reflected in other comprehensive income 6,293 – 149 6,442Total equity attributable to: Shareholders of AIA Group Limited 30,806 – 1,661 32,467 Non-controlling interests 149 – 161 310Total equity 30,955 – 1,822 32,777Total liabilities and equity 166,919 – 2,070 168,989
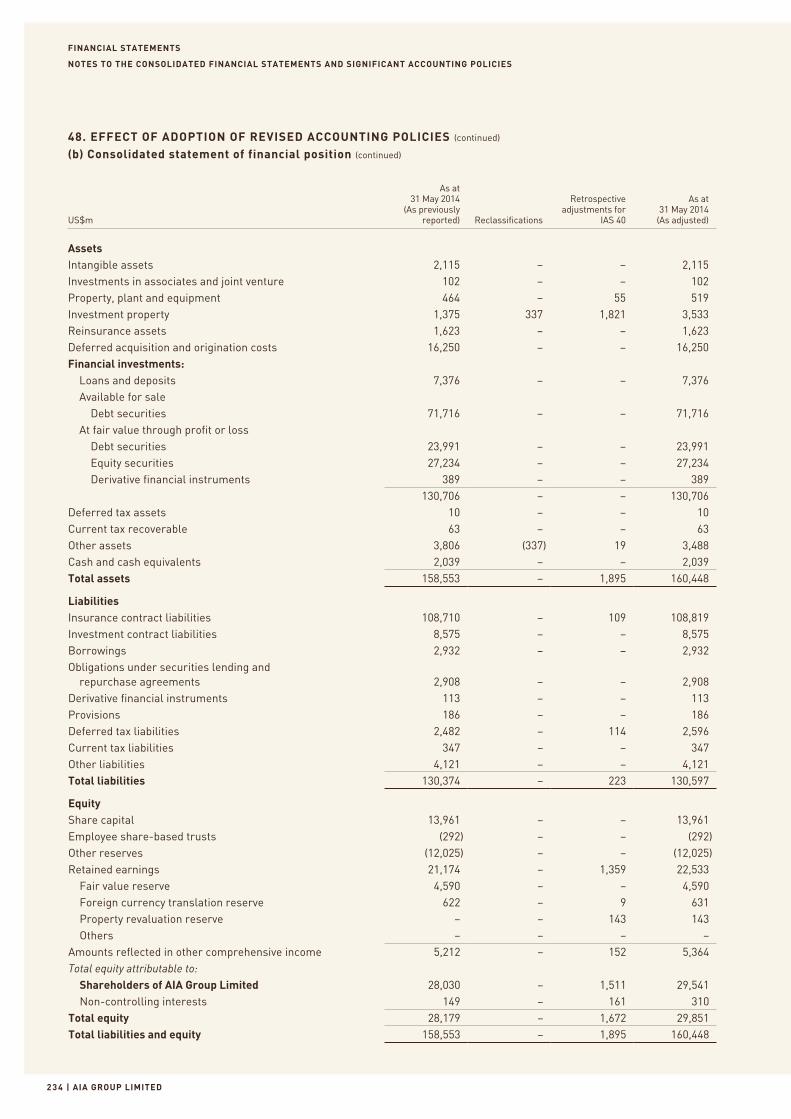
FINANCIAL STATEMENTS
| AIA GROUP LIMITED23 4
NOTES TO THE CONSOLIDATED FINANCIAL STATEMENTS AND SIGNIFICANT ACCOUNTING POLICIES
48. EFFECT OF ADOPTION OF REVISED ACCOUNTING POLICIES (continued)
(b) Consolidated statement of financial position (continued)
US$m
As at 31 May 2014
(As previously reported) Reclassifications
Retrospective adjustments for
IAS 40
As at 31 May 2014 (As adjusted)
AssetsIntangible assets 2,115 – – 2,115Investments in associates and joint venture 102 – – 102Property, plant and equipment 464 – 55 519Investment property 1,375 337 1,821 3,533Reinsurance assets 1,623 – – 1,623Deferred acquisition and origination costs 16,250 – – 16,250Financial investments: Loans and deposits 7,376 – – 7,376 Available for sale Debt securities 71,716 – – 71,716 At fair value through profit or loss Debt securities 23,991 – – 23,991 Equity securities 27,234 – – 27,234 Derivative financial instruments 389 – – 389
130,706 – – 130,706Deferred tax assets 10 – – 10Current tax recoverable 63 – – 63Other assets 3,806 (337) 19 3,488Cash and cash equivalents 2,039 – – 2,039Total assets 158,553 – 1,895 160,448
LiabilitiesInsurance contract liabilities 108,710 – 109 108,819Investment contract liabilities 8,575 – – 8,575Borrowings 2,932 – – 2,932Obligations under securities lending and repurchase agreements 2,908 – – 2,908Derivative financial instruments 113 – – 113Provisions 186 – – 186Deferred tax liabilities 2,482 – 114 2,596Current tax liabilities 347 – – 347Other liabilities 4,121 – – 4,121Total liabilities 130,374 – 223 130,597
EquityShare capital 13,961 – – 13,961Employee share-based trusts (292) – – (292)Other reserves (12,025) – – (12,025)Retained earnings 21,174 – 1,359 22,533 Fair value reserve 4,590 – – 4,590 Foreign currency translation reserve 622 – 9 631 Property revaluation reserve – – 143 143 Others – – – –Amounts reflected in other comprehensive income 5,212 – 152 5,364Total equity attributable to: Shareholders of AIA Group Limited 28,030 – 1,511 29,541 Non-controlling interests 149 – 161 310Total equity 28,179 – 1,672 29,851Total liabilities and equity 158,553 – 1,895 160,448
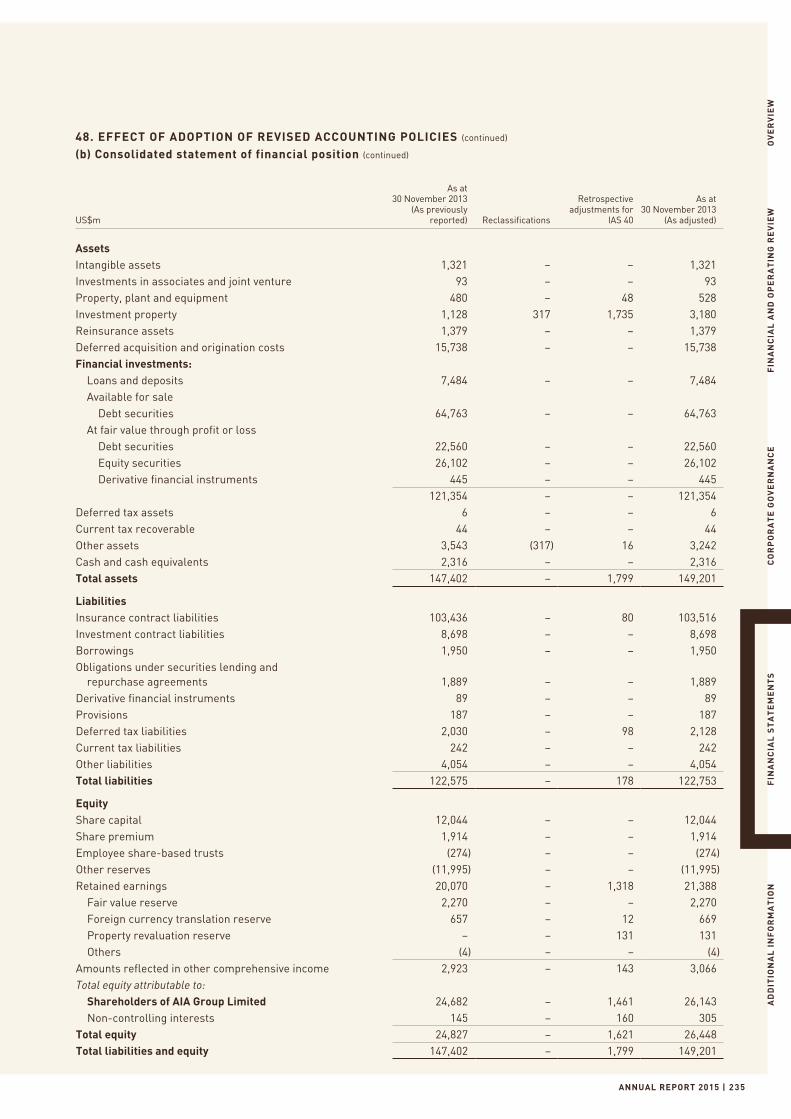
ANNUAL REPORT 2015 | 235
OV
ER
VIE
WF
INA
NC
IAL
AN
D O
PE
RA
TIN
G R
EV
IEW
CO
RP
OR
AT
E G
OV
ER
NA
NC
EF
INA
NC
IAL
ST
AT
EM
EN
TS
AD
DIT
ION
AL
IN
FO
RM
AT
ION
48. EFFECT OF ADOPTION OF REVISED ACCOUNTING POLICIES (continued)
(b) Consolidated statement of financial position (continued)
US$m
As at 30 November 2013
(As previously reported) Reclassifications
Retrospective adjustments for
IAS 40
As at 30 November 2013
(As adjusted)
AssetsIntangible assets 1,321 – – 1,321Investments in associates and joint venture 93 – – 93Property, plant and equipment 480 – 48 528Investment property 1,128 317 1,735 3,180Reinsurance assets 1,379 – – 1,379Deferred acquisition and origination costs 15,738 – – 15,738Financial investments: Loans and deposits 7,484 – – 7,484 Available for sale Debt securities 64,763 – – 64,763 At fair value through profit or loss Debt securities 22,560 – – 22,560 Equity securities 26,102 – – 26,102 Derivative financial instruments 445 – – 445
121,354 – – 121,354Deferred tax assets 6 – – 6Current tax recoverable 44 – – 44Other assets 3,543 (317) 16 3,242Cash and cash equivalents 2,316 – – 2,316Total assets 147,402 – 1,799 149,201
LiabilitiesInsurance contract liabilities 103,436 – 80 103,516Investment contract liabilities 8,698 – – 8,698Borrowings 1,950 – – 1,950Obligations under securities lending and repurchase agreements 1,889 – – 1,889Derivative financial instruments 89 – – 89Provisions 187 – – 187Deferred tax liabilities 2,030 – 98 2,128Current tax liabilities 242 – – 242Other liabilities 4,054 – – 4,054Total liabilities 122,575 – 178 122,753
EquityShare capital 12,044 – – 12,044Share premium 1,914 – – 1,914Employee share-based trusts (274) – – (274)Other reserves (11,995) – – (11,995)Retained earnings 20,070 – 1,318 21,388 Fair value reserve 2,270 – – 2,270 Foreign currency translation reserve 657 – 12 669 Property revaluation reserve – – 131 131 Others (4) – – (4)Amounts reflected in other comprehensive income 2,923 – 143 3,066Total equity attributable to: Shareholders of AIA Group Limited 24,682 – 1,461 26,143 Non-controlling interests 145 – 160 305Total equity 24,827 – 1,621 26,448Total liabilities and equity 147,402 – 1,799 149,201
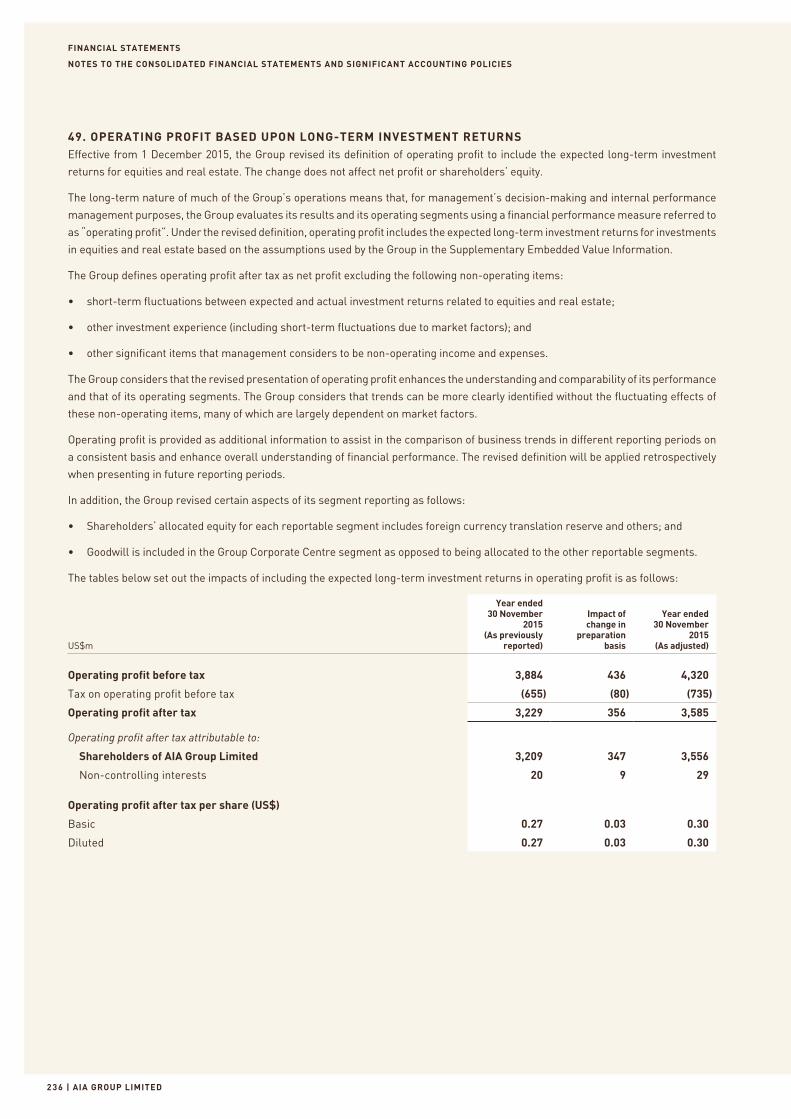
FINANCIAL STATEMENTS
| AIA GROUP LIMITED236
NOTES TO THE CONSOLIDATED FINANCIAL STATEMENTS AND SIGNIFICANT ACCOUNTING POLICIES
49. OPERATING PROFIT BASED UPON LONG-TERM INVESTMENT RETURNSEffective from 1 December 2015, the Group revised its definition of operating profit to include the expected long-term investment
returns for equities and real estate. The change does not affect net profit or shareholders’ equity.
The long-term nature of much of the Group’s operations means that, for management’s decision-making and internal performance
management purposes, the Group evaluates its results and its operating segments using a financial performance measure referred to
as “operating profit”. Under the revised definition, operating profit includes the expected long-term investment returns for investments
in equities and real estate based on the assumptions used by the Group in the Supplementary Embedded Value Information.
The Group defines operating profit after tax as net profit excluding the following non-operating items:
• short-term fluctuations between expected and actual investment returns related to equities and real estate;
• other investment experience (including short-term fluctuations due to market factors); and
• other significant items that management considers to be non-operating income and expenses.
The Group considers that the revised presentation of operating profit enhances the understanding and comparability of its performance
and that of its operating segments. The Group considers that trends can be more clearly identified without the fluctuating effects of
these non-operating items, many of which are largely dependent on market factors.
Operating profit is provided as additional information to assist in the comparison of business trends in different reporting periods on
a consistent basis and enhance overall understanding of financial performance. The revised definition will be applied retrospectively
when presenting in future reporting periods.
In addition, the Group revised certain aspects of its segment reporting as follows:
• Shareholders’ allocated equity for each reportable segment includes foreign currency translation reserve and others; and
• Goodwill is included in the Group Corporate Centre segment as opposed to being allocated to the other reportable segments.
The tables below set out the impacts of including the expected long-term investment returns in operating profit is as follows:
US$m
Year ended 30 November
2015 (As previously
reported)
Impact ofchange in
preparationbasis
Year ended30 November
2015(As adjusted)
Operating profit before tax 3,884 436 4,320
Tax on operating profit before tax (655) (80) (735)
Operating profit after tax 3,229 356 3,585
Operating profit after tax attributable to:
Shareholders of AIA Group Limited 3,209 347 3,556
Non-controlling interests 20 9 29
Operating profit after tax per share (US$)
Basic 0.27 0.03 0.30
Diluted 0.27 0.03 0.30
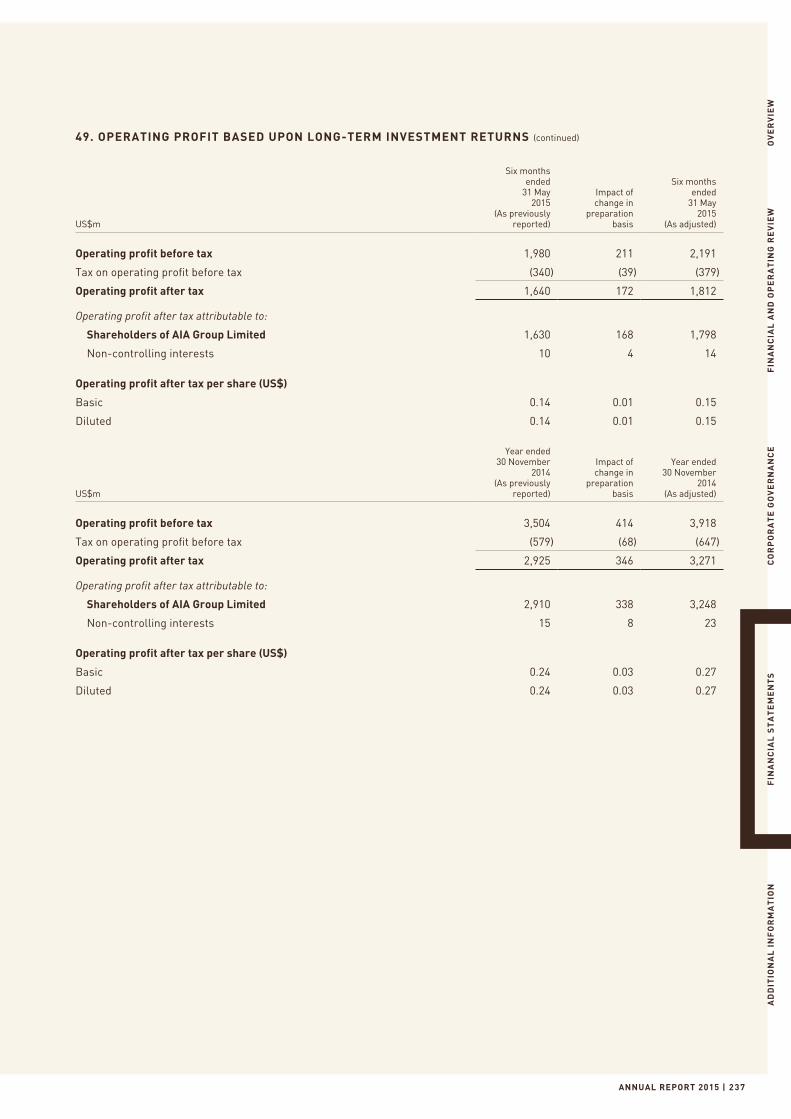
ANNUAL REPORT 2015 | 237
OV
ER
VIE
WF
INA
NC
IAL
AN
D O
PE
RA
TIN
G R
EV
IEW
CO
RP
OR
AT
E G
OV
ER
NA
NC
EF
INA
NC
IAL
ST
AT
EM
EN
TS
AD
DIT
ION
AL
IN
FO
RM
AT
ION
49. OPERATING PROFIT BASED UPON LONG-TERM INVESTMENT RETURNS (continued)
US$m
Six monthsended
31 May2015
(As previouslyreported)
Impact ofchange in
preparationbasis
Six monthsended
31 May2015
(As adjusted)
Operating profit before tax 1,980 211 2,191
Tax on operating profit before tax (340) (39) (379)
Operating profit after tax 1,640 172 1,812
Operating profit after tax attributable to:
Shareholders of AIA Group Limited 1,630 168 1,798
Non-controlling interests 10 4 14
Operating profit after tax per share (US$)
Basic 0.14 0.01 0.15
Diluted 0.14 0.01 0.15
US$m
Year ended30 November
2014(As previously
reported)
Impact ofchange in
preparationbasis
Year ended30 November
2014(As adjusted)
Operating profit before tax 3,504 414 3,918
Tax on operating profit before tax (579) (68) (647)
Operating profit after tax 2,925 346 3,271
Operating profit after tax attributable to:
Shareholders of AIA Group Limited 2,910 338 3,248
Non-controlling interests 15 8 23
Operating profit after tax per share (US$)
Basic 0.24 0.03 0.27
Diluted 0.24 0.03 0.27
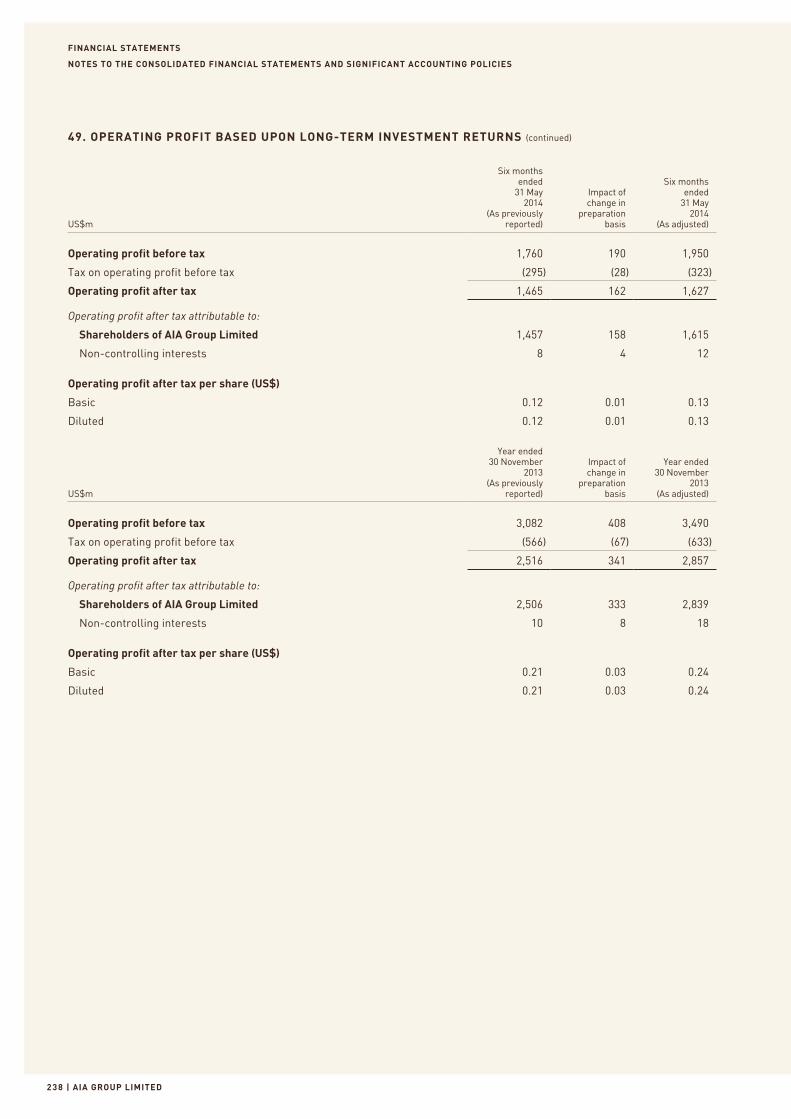
FINANCIAL STATEMENTS
| AIA GROUP LIMITED238
NOTES TO THE CONSOLIDATED FINANCIAL STATEMENTS AND SIGNIFICANT ACCOUNTING POLICIES
49. OPERATING PROFIT BASED UPON LONG-TERM INVESTMENT RETURNS (continued)
US$m
Six monthsended
31 May2014
(As previouslyreported)
Impact ofchange in
preparationbasis
Six monthsended
31 May2014
(As adjusted)
Operating profit before tax 1,760 190 1,950
Tax on operating profit before tax (295) (28) (323)
Operating profit after tax 1,465 162 1,627
Operating profit after tax attributable to:
Shareholders of AIA Group Limited 1,457 158 1,615
Non-controlling interests 8 4 12
Operating profit after tax per share (US$)
Basic 0.12 0.01 0.13
Diluted 0.12 0.01 0.13
US$m
Year ended30 November
2013(As previously
reported)
Impact ofchange in
preparationbasis
Year ended30 November
2013(As adjusted)
Operating profit before tax 3,082 408 3,490
Tax on operating profit before tax (566) (67) (633)
Operating profit after tax 2,516 341 2,857
Operating profit after tax attributable to:
Shareholders of AIA Group Limited 2,506 333 2,839
Non-controlling interests 10 8 18
Operating profit after tax per share (US$)
Basic 0.21 0.03 0.24
Diluted 0.21 0.03 0.24
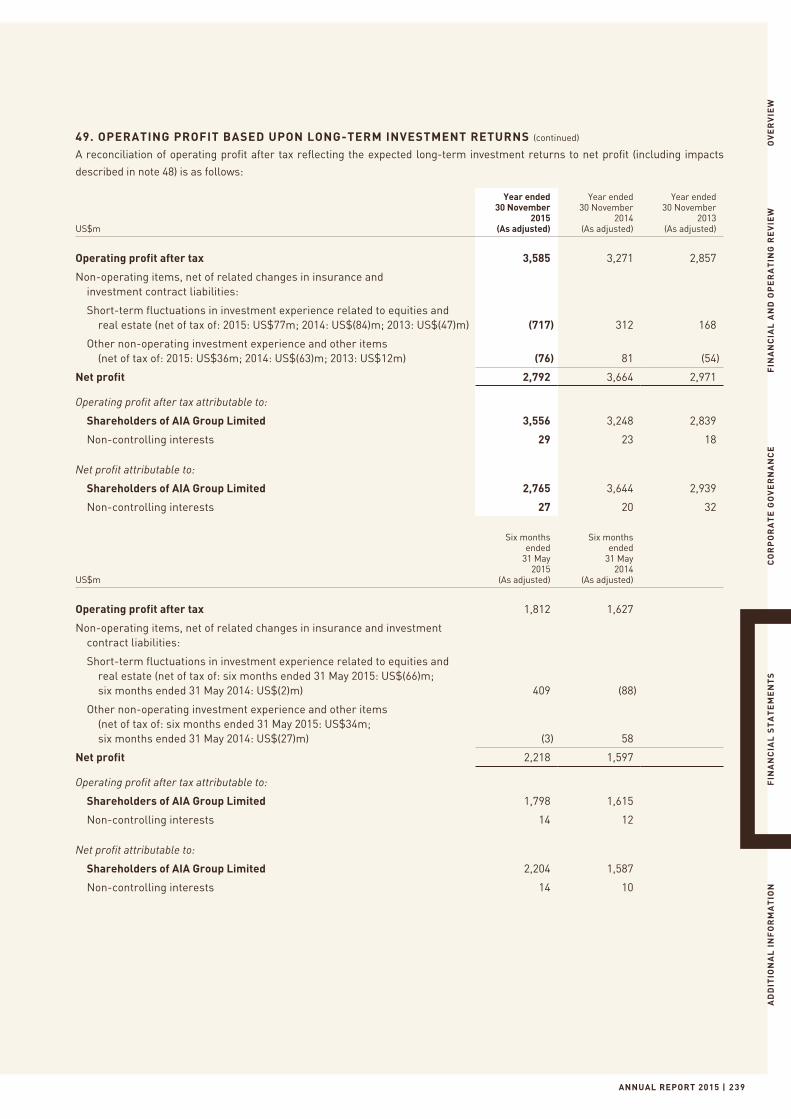
ANNUAL REPORT 2015 | 239
OV
ER
VIE
WF
INA
NC
IAL
AN
D O
PE
RA
TIN
G R
EV
IEW
CO
RP
OR
AT
E G
OV
ER
NA
NC
EF
INA
NC
IAL
ST
AT
EM
EN
TS
AD
DIT
ION
AL
IN
FO
RM
AT
ION
49. OPERATING PROFIT BASED UPON LONG-TERM INVESTMENT RETURNS (continued)
A reconciliation of operating profit after tax reflecting the expected long-term investment returns to net profit (including impacts
described in note 48) is as follows:
US$m
Year ended 30 November
2015 (As adjusted)
Year ended 30 November
2014 (As adjusted)
Year ended 30 November
2013 (As adjusted)
Operating profit after tax 3,585 3,271 2,857
Non-operating items, net of related changes in insurance and investment contract liabilities:
Short-term fluctuations in investment experience related to equities and real estate (net of tax of: 2015: US$77m; 2014: US$(84)m; 2013: US$(47)m) (717) 312 168
Other non-operating investment experience and other items (net of tax of: 2015: US$36m; 2014: US$(63)m; 2013: US$12m) (76) 81 (54)
Net profit 2,792 3,664 2,971
Operating profit after tax attributable to:
Shareholders of AIA Group Limited 3,556 3,248 2,839
Non-controlling interests 29 23 18
Net profit attributable to:
Shareholders of AIA Group Limited 2,765 3,644 2,939
Non-controlling interests 27 20 32
US$m
Six months ended
31 May 2015
(As adjusted)
Six months ended
31 May 2014
(As adjusted)
Operating profit after tax 1,812 1,627
Non-operating items, net of related changes in insurance and investment contract liabilities:
Short-term fluctuations in investment experience related to equities and real estate (net of tax of: six months ended 31 May 2015: US$(66)m; six months ended 31 May 2014: US$(2)m) 409 (88)
Other non-operating investment experience and other items (net of tax of: six months ended 31 May 2015: US$34m; six months ended 31 May 2014: US$(27)m) (3) 58
Net profit 2,218 1,597
Operating profit after tax attributable to:
Shareholders of AIA Group Limited 1,798 1,615
Non-controlling interests 14 12
Net profit attributable to:
Shareholders of AIA Group Limited 2,204 1,587
Non-controlling interests 14 10
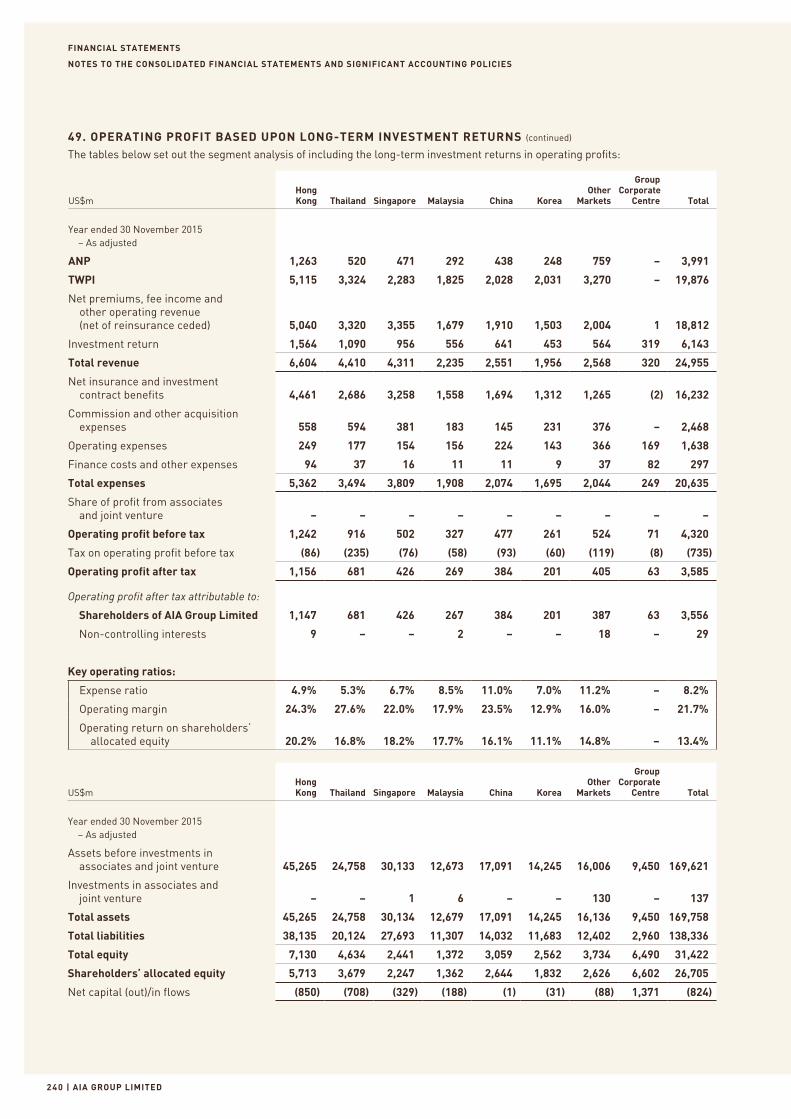
FINANCIAL STATEMENTS
| AIA GROUP LIMITED2 40
NOTES TO THE CONSOLIDATED FINANCIAL STATEMENTS AND SIGNIFICANT ACCOUNTING POLICIES
49. OPERATING PROFIT BASED UPON LONG-TERM INVESTMENT RETURNS (continued)
The tables below set out the segment analysis of including the long-term investment returns in operating profits:
US$mHong Kong Thailand Singapore Malaysia China Korea
Other Markets
Group Corporate
Centre Total
Year ended 30 November 2015 – As adjusted
ANP 1,263 520 471 292 438 248 759 – 3,991
TWPI 5,115 3,324 2,283 1,825 2,028 2,031 3,270 – 19,876
Net premiums, fee income and other operating revenue (net of reinsurance ceded) 5,040 3,320 3,355 1,679 1,910 1,503 2,004 1 18,812
Investment return 1,564 1,090 956 556 641 453 564 319 6,143
Total revenue 6,604 4,410 4,311 2,235 2,551 1,956 2,568 320 24,955
Net insurance and investment contract benefits 4,461 2,686 3,258 1,558 1,694 1,312 1,265 (2) 16,232
Commission and other acquisition expenses 558 594 381 183 145 231 376 – 2,468
Operating expenses 249 177 154 156 224 143 366 169 1,638
Finance costs and other expenses 94 37 16 11 11 9 37 82 297
Total expenses 5,362 3,494 3,809 1,908 2,074 1,695 2,044 249 20,635
Share of profit from associates and joint venture – – – – – – – – –
Operating profit before tax 1,242 916 502 327 477 261 524 71 4,320
Tax on operating profit before tax (86) (235) (76) (58) (93) (60) (119) (8) (735)
Operating profit after tax 1,156 681 426 269 384 201 405 63 3,585
Operating profit after tax attributable to:
Shareholders of AIA Group Limited 1,147 681 426 267 384 201 387 63 3,556
Non-controlling interests 9 – – 2 – – 18 – 29
Key operating ratios:
Expense ratio 4.9% 5.3% 6.7% 8.5% 11.0% 7.0% 11.2% – 8.2%
Operating margin 24.3% 27.6% 22.0% 17.9% 23.5% 12.9% 16.0% – 21.7%
Operating return on shareholders’ allocated equity 20.2% 16.8% 18.2% 17.7% 16.1% 11.1% 14.8% – 13.4%
US$mHong Kong Thailand Singapore Malaysia China Korea
Other Markets
Group Corporate
Centre Total
Year ended 30 November 2015 – As adjusted
Assets before investments in associates and joint venture 45,265 24,758 30,133 12,673 17,091 14,245 16,006 9,450 169,621
Investments in associates and joint venture – – 1 6 – – 130 – 137
Total assets 45,265 24,758 30,134 12,679 17,091 14,245 16,136 9,450 169,758
Total liabilities 38,135 20,124 27,693 11,307 14,032 11,683 12,402 2,960 138,336
Total equity 7,130 4,634 2,441 1,372 3,059 2,562 3,734 6,490 31,422
Shareholders’ allocated equity 5,713 3,679 2,247 1,362 2,644 1,832 2,626 6,602 26,705
Net capital (out)/in flows (850) (708) (329) (188) (1) (31) (88) 1,371 (824)
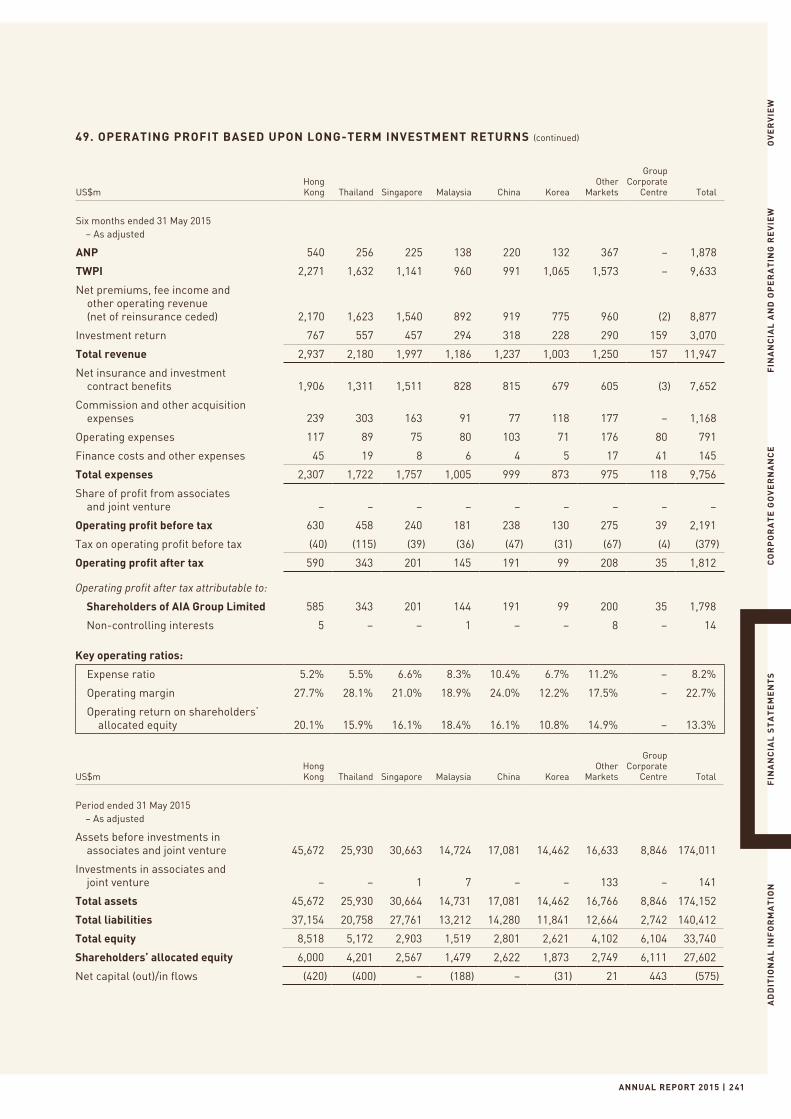
ANNUAL REPORT 2015 | 2 41
OV
ER
VIE
WF
INA
NC
IAL
AN
D O
PE
RA
TIN
G R
EV
IEW
CO
RP
OR
AT
E G
OV
ER
NA
NC
EF
INA
NC
IAL
ST
AT
EM
EN
TS
AD
DIT
ION
AL
IN
FO
RM
AT
ION
49. OPERATING PROFIT BASED UPON LONG-TERM INVESTMENT RETURNS (continued)
US$mHong Kong Thailand Singapore Malaysia China Korea
Other Markets
Group Corporate
Centre Total
Six months ended 31 May 2015 – As adjusted
ANP 540 256 225 138 220 132 367 – 1,878
TWPI 2,271 1,632 1,141 960 991 1,065 1,573 – 9,633
Net premiums, fee income and other operating revenue (net of reinsurance ceded) 2,170 1,623 1,540 892 919 775 960 (2) 8,877
Investment return 767 557 457 294 318 228 290 159 3,070
Total revenue 2,937 2,180 1,997 1,186 1,237 1,003 1,250 157 11,947
Net insurance and investment contract benefits 1,906 1,311 1,511 828 815 679 605 (3) 7,652
Commission and other acquisition expenses 239 303 163 91 77 118 177 – 1,168
Operating expenses 117 89 75 80 103 71 176 80 791
Finance costs and other expenses 45 19 8 6 4 5 17 41 145
Total expenses 2,307 1,722 1,757 1,005 999 873 975 118 9,756
Share of profit from associates and joint venture – – – – – – – – –
Operating profit before tax 630 458 240 181 238 130 275 39 2,191
Tax on operating profit before tax (40) (115) (39) (36) (47) (31) (67) (4) (379)
Operating profit after tax 590 343 201 145 191 99 208 35 1,812
Operating profit after tax attributable to:
Shareholders of AIA Group Limited 585 343 201 144 191 99 200 35 1,798
Non-controlling interests 5 – – 1 – – 8 – 14
Key operating ratios:
Expense ratio 5.2% 5.5% 6.6% 8.3% 10.4% 6.7% 11.2% – 8.2%
Operating margin 27.7% 28.1% 21.0% 18.9% 24.0% 12.2% 17.5% – 22.7%
Operating return on shareholders’ allocated equity 20.1% 15.9% 16.1% 18.4% 16.1% 10.8% 14.9% – 13.3%
US$mHong Kong Thailand Singapore Malaysia China Korea
Other Markets
Group Corporate
Centre Total
Period ended 31 May 2015 – As adjusted
Assets before investments in associates and joint venture 45,672 25,930 30,663 14,724 17,081 14,462 16,633 8,846 174,011
Investments in associates and joint venture – – 1 7 – – 133 – 141
Total assets 45,672 25,930 30,664 14,731 17,081 14,462 16,766 8,846 174,152
Total liabilities 37,154 20,758 27,761 13,212 14,280 11,841 12,664 2,742 140,412
Total equity 8,518 5,172 2,903 1,519 2,801 2,621 4,102 6,104 33,740
Shareholders’ allocated equity 6,000 4,201 2,567 1,479 2,622 1,873 2,749 6,111 27,602
Net capital (out)/in flows (420) (400) – (188) – (31) 21 443 (575)
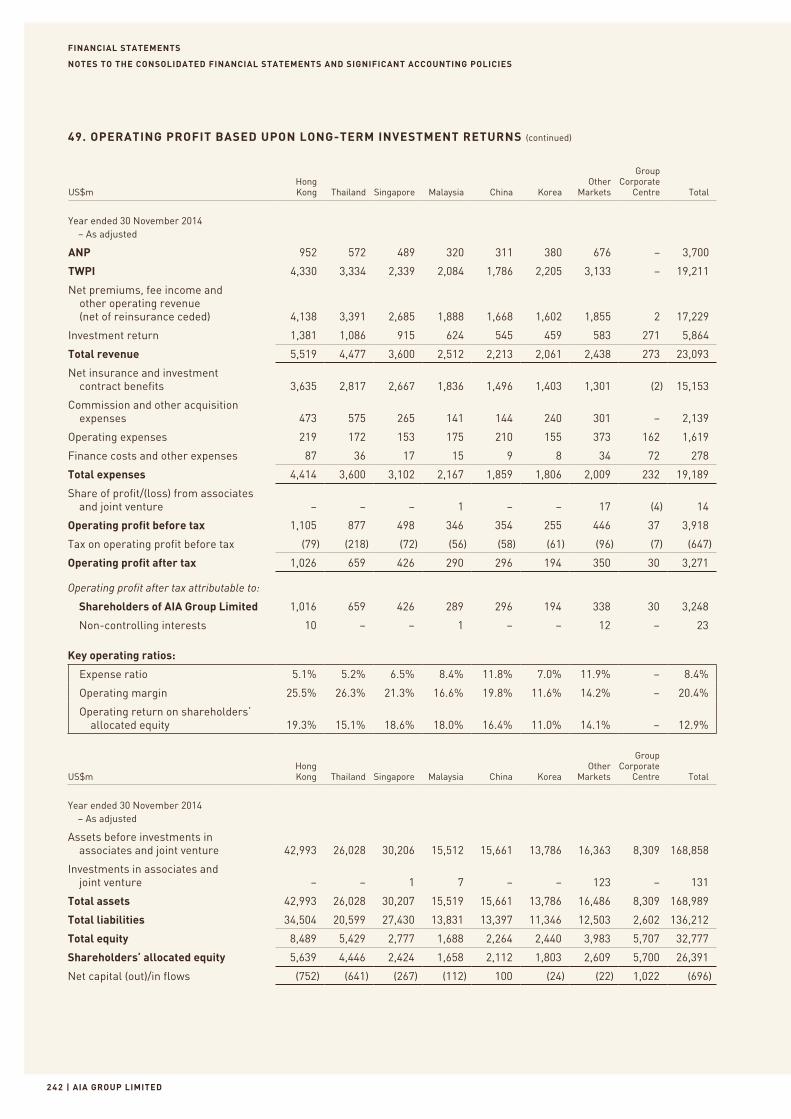
FINANCIAL STATEMENTS
| AIA GROUP LIMITED2 42
NOTES TO THE CONSOLIDATED FINANCIAL STATEMENTS AND SIGNIFICANT ACCOUNTING POLICIES
49. OPERATING PROFIT BASED UPON LONG-TERM INVESTMENT RETURNS (continued)
US$mHong Kong Thailand Singapore Malaysia China Korea
Other Markets
Group Corporate
Centre Total
Year ended 30 November 2014 – As adjusted
ANP 952 572 489 320 311 380 676 – 3,700
TWPI 4,330 3,334 2,339 2,084 1,786 2,205 3,133 – 19,211
Net premiums, fee income and other operating revenue (net of reinsurance ceded) 4,138 3,391 2,685 1,888 1,668 1,602 1,855 2 17,229
Investment return 1,381 1,086 915 624 545 459 583 271 5,864
Total revenue 5,519 4,477 3,600 2,512 2,213 2,061 2,438 273 23,093
Net insurance and investment contract benefits 3,635 2,817 2,667 1,836 1,496 1,403 1,301 (2) 15,153
Commission and other acquisition expenses 473 575 265 141 144 240 301 – 2,139
Operating expenses 219 172 153 175 210 155 373 162 1,619
Finance costs and other expenses 87 36 17 15 9 8 34 72 278
Total expenses 4,414 3,600 3,102 2,167 1,859 1,806 2,009 232 19,189
Share of profit/(loss) from associates and joint venture – – – 1 – – 17 (4) 14
Operating profit before tax 1,105 877 498 346 354 255 446 37 3,918
Tax on operating profit before tax (79) (218) (72) (56) (58) (61) (96) (7) (647)
Operating profit after tax 1,026 659 426 290 296 194 350 30 3,271
Operating profit after tax attributable to:
Shareholders of AIA Group Limited 1,016 659 426 289 296 194 338 30 3,248
Non-controlling interests 10 – – 1 – – 12 – 23
Key operating ratios:
Expense ratio 5.1% 5.2% 6.5% 8.4% 11.8% 7.0% 11.9% – 8.4%
Operating margin 25.5% 26.3% 21.3% 16.6% 19.8% 11.6% 14.2% – 20.4%
Operating return on shareholders’ allocated equity 19.3% 15.1% 18.6% 18.0% 16.4% 11.0% 14.1% – 12.9%
US$mHong Kong Thailand Singapore Malaysia China Korea
Other Markets
Group Corporate
Centre Total
Year ended 30 November 2014 – As adjusted
Assets before investments in associates and joint venture 42,993 26,028 30,206 15,512 15,661 13,786 16,363 8,309 168,858
Investments in associates and joint venture – – 1 7 – – 123 – 131
Total assets 42,993 26,028 30,207 15,519 15,661 13,786 16,486 8,309 168,989
Total liabilities 34,504 20,599 27,430 13,831 13,397 11,346 12,503 2,602 136,212
Total equity 8,489 5,429 2,777 1,688 2,264 2,440 3,983 5,707 32,777
Shareholders’ allocated equity 5,639 4,446 2,424 1,658 2,112 1,803 2,609 5,700 26,391
Net capital (out)/in flows (752) (641) (267) (112) 100 (24) (22) 1,022 (696)
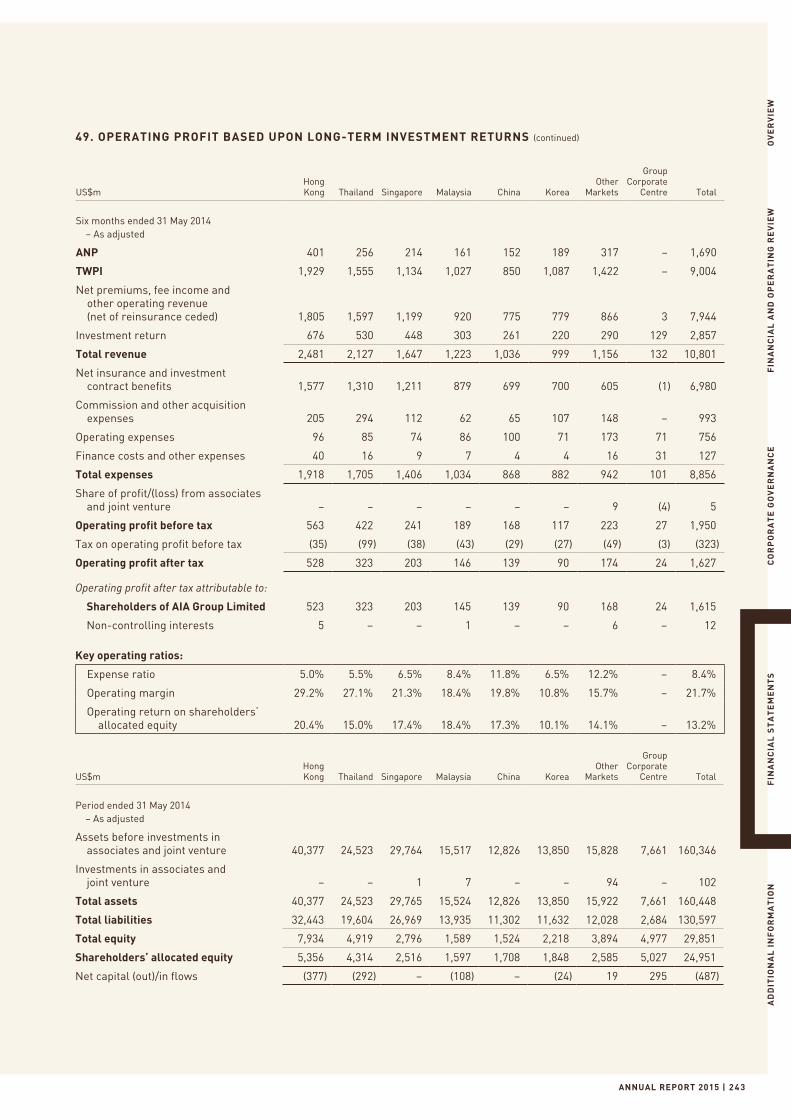
ANNUAL REPORT 2015 | 2 4 3
OV
ER
VIE
WF
INA
NC
IAL
AN
D O
PE
RA
TIN
G R
EV
IEW
CO
RP
OR
AT
E G
OV
ER
NA
NC
EF
INA
NC
IAL
ST
AT
EM
EN
TS
AD
DIT
ION
AL
IN
FO
RM
AT
ION
49. OPERATING PROFIT BASED UPON LONG-TERM INVESTMENT RETURNS (continued)
US$mHong Kong Thailand Singapore Malaysia China Korea
Other Markets
Group Corporate
Centre Total
Six months ended 31 May 2014 – As adjusted
ANP 401 256 214 161 152 189 317 – 1,690
TWPI 1,929 1,555 1,134 1,027 850 1,087 1,422 – 9,004
Net premiums, fee income and other operating revenue (net of reinsurance ceded) 1,805 1,597 1,199 920 775 779 866 3 7,944
Investment return 676 530 448 303 261 220 290 129 2,857
Total revenue 2,481 2,127 1,647 1,223 1,036 999 1,156 132 10,801
Net insurance and investment contract benefits 1,577 1,310 1,211 879 699 700 605 (1) 6,980
Commission and other acquisition expenses 205 294 112 62 65 107 148 – 993
Operating expenses 96 85 74 86 100 71 173 71 756
Finance costs and other expenses 40 16 9 7 4 4 16 31 127
Total expenses 1,918 1,705 1,406 1,034 868 882 942 101 8,856
Share of profit/(loss) from associates and joint venture – – – – – – 9 (4) 5
Operating profit before tax 563 422 241 189 168 117 223 27 1,950
Tax on operating profit before tax (35) (99) (38) (43) (29) (27) (49) (3) (323)
Operating profit after tax 528 323 203 146 139 90 174 24 1,627
Operating profit after tax attributable to:
Shareholders of AIA Group Limited 523 323 203 145 139 90 168 24 1,615
Non-controlling interests 5 – – 1 – – 6 – 12
Key operating ratios:
Expense ratio 5.0% 5.5% 6.5% 8.4% 11.8% 6.5% 12.2% – 8.4%
Operating margin 29.2% 27.1% 21.3% 18.4% 19.8% 10.8% 15.7% – 21.7%
Operating return on shareholders’ allocated equity 20.4% 15.0% 17.4% 18.4% 17.3% 10.1% 14.1% – 13.2%
US$mHong Kong Thailand Singapore Malaysia China Korea
Other Markets
Group Corporate
Centre Total
Period ended 31 May 2014 – As adjusted
Assets before investments in associates and joint venture 40,377 24,523 29,764 15,517 12,826 13,850 15,828 7,661 160,346
Investments in associates and joint venture – – 1 7 – – 94 – 102
Total assets 40,377 24,523 29,765 15,524 12,826 13,850 15,922 7,661 160,448
Total liabilities 32,443 19,604 26,969 13,935 11,302 11,632 12,028 2,684 130,597
Total equity 7,934 4,919 2,796 1,589 1,524 2,218 3,894 4,977 29,851
Shareholders’ allocated equity 5,356 4,314 2,516 1,597 1,708 1,848 2,585 5,027 24,951
Net capital (out)/in flows (377) (292) – (108) – (24) 19 295 (487)
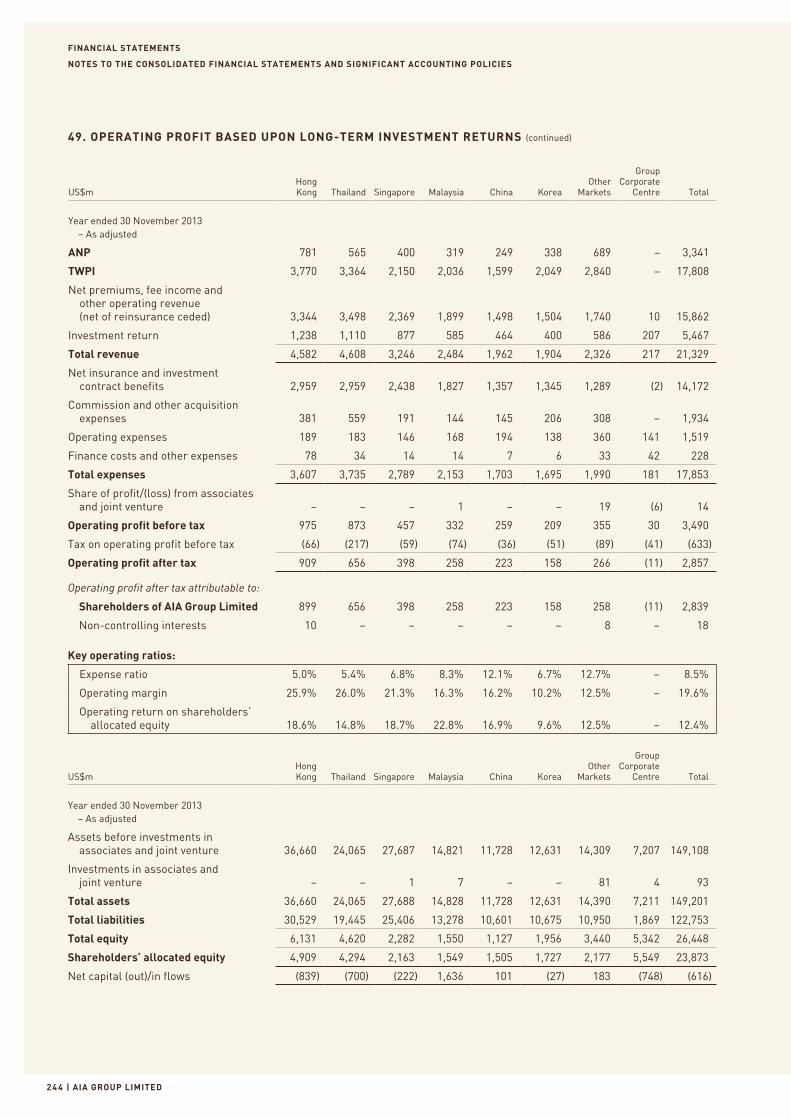
FINANCIAL STATEMENTS
| AIA GROUP LIMITED2 4 4
NOTES TO THE CONSOLIDATED FINANCIAL STATEMENTS AND SIGNIFICANT ACCOUNTING POLICIES
49. OPERATING PROFIT BASED UPON LONG-TERM INVESTMENT RETURNS (continued)
US$mHong Kong Thailand Singapore Malaysia China Korea
Other Markets
Group Corporate
Centre Total
Year ended 30 November 2013 – As adjusted
ANP 781 565 400 319 249 338 689 – 3,341
TWPI 3,770 3,364 2,150 2,036 1,599 2,049 2,840 – 17,808
Net premiums, fee income and other operating revenue (net of reinsurance ceded) 3,344 3,498 2,369 1,899 1,498 1,504 1,740 10 15,862
Investment return 1,238 1,110 877 585 464 400 586 207 5,467
Total revenue 4,582 4,608 3,246 2,484 1,962 1,904 2,326 217 21,329
Net insurance and investment contract benefits 2,959 2,959 2,438 1,827 1,357 1,345 1,289 (2) 14,172
Commission and other acquisition expenses 381 559 191 144 145 206 308 – 1,934
Operating expenses 189 183 146 168 194 138 360 141 1,519
Finance costs and other expenses 78 34 14 14 7 6 33 42 228
Total expenses 3,607 3,735 2,789 2,153 1,703 1,695 1,990 181 17,853
Share of profit/(loss) from associates and joint venture – – – 1 – – 19 (6) 14
Operating profit before tax 975 873 457 332 259 209 355 30 3,490
Tax on operating profit before tax (66) (217) (59) (74) (36) (51) (89) (41) (633)
Operating profit after tax 909 656 398 258 223 158 266 (11) 2,857
Operating profit after tax attributable to:
Shareholders of AIA Group Limited 899 656 398 258 223 158 258 (11) 2,839
Non-controlling interests 10 – – – – – 8 – 18
Key operating ratios:
Expense ratio 5.0% 5.4% 6.8% 8.3% 12.1% 6.7% 12.7% – 8.5%
Operating margin 25.9% 26.0% 21.3% 16.3% 16.2% 10.2% 12.5% – 19.6%
Operating return on shareholders’ allocated equity 18.6% 14.8% 18.7% 22.8% 16.9% 9.6% 12.5% – 12.4%
US$mHong Kong Thailand Singapore Malaysia China Korea
Other Markets
Group Corporate
Centre Total
Year ended 30 November 2013 – As adjusted
Assets before investments in associates and joint venture 36,660 24,065 27,687 14,821 11,728 12,631 14,309 7,207 149,108
Investments in associates and joint venture – – 1 7 – – 81 4 93
Total assets 36,660 24,065 27,688 14,828 11,728 12,631 14,390 7,211 149,201
Total liabilities 30,529 19,445 25,406 13,278 10,601 10,675 10,950 1,869 122,753
Total equity 6,131 4,620 2,282 1,550 1,127 1,956 3,440 5,342 26,448
Shareholders’ allocated equity 4,909 4,294 2,163 1,549 1,505 1,727 2,177 5,549 23,873
Net capital (out)/in flows (839) (700) (222) 1,636 101 (27) 183 (748) (616)
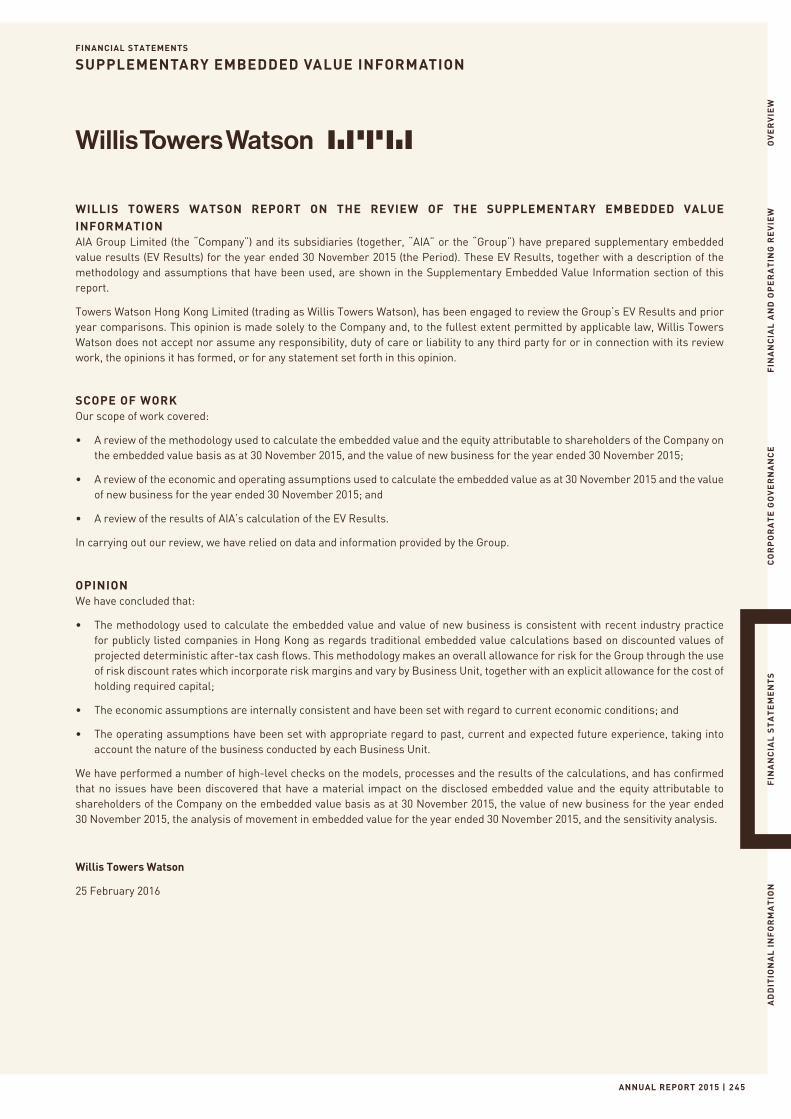
FINANCIAL STATEMENTS
ANNUAL REPORT 2015 | 2 45
SUPPLEMENTARY EMBEDDED VALUE INFORMATION
OV
ER
VIE
WF
INA
NC
IAL
AN
D O
PE
RA
TIN
G R
EV
IEW
CO
RP
OR
AT
E G
OV
ER
NA
NC
EF
INA
NC
IAL
ST
AT
EM
EN
TS
AD
DIT
ION
AL
IN
FO
RM
AT
ION
WILLIS TOWERS WATSON REPORT ON THE REVIEW OF THE SUPPLEMENTARY EMBEDDED VALUE INFORMATIONAIA Group Limited (the “Company”) and its subsidiaries (together, “AIA” or the “Group”) have prepared supplementary embedded value results (EV Results) for the year ended 30 November 2015 (the Period). These EV Results, together with a description of the methodology and assumptions that have been used, are shown in the Supplementary Embedded Value Information section of this report.
Towers Watson Hong Kong Limited (trading as Willis Towers Watson), has been engaged to review the Group’s EV Results and prior year comparisons. This opinion is made solely to the Company and, to the fullest extent permitted by applicable law, Willis Towers Watson does not accept nor assume any responsibility, duty of care or liability to any third party for or in connection with its review work, the opinions it has formed, or for any statement set forth in this opinion.
SCOPE OF WORKOur scope of work covered:
• A review of the methodology used to calculate the embedded value and the equity attributable to shareholders of the Company on the embedded value basis as at 30 November 2015, and the value of new business for the year ended 30 November 2015;
• A review of the economic and operating assumptions used to calculate the embedded value as at 30 November 2015 and the value of new business for the year ended 30 November 2015; and
• A review of the results of AIA’s calculation of the EV Results.
In carrying out our review, we have relied on data and information provided by the Group.
OPINIONWe have concluded that:
• The methodology used to calculate the embedded value and value of new business is consistent with recent industry practice for publicly listed companies in Hong Kong as regards traditional embedded value calculations based on discounted values of projected deterministic after-tax cash flows. This methodology makes an overall allowance for risk for the Group through the use of risk discount rates which incorporate risk margins and vary by Business Unit, together with an explicit allowance for the cost of holding required capital;
• The economic assumptions are internally consistent and have been set with regard to current economic conditions; and
• The operating assumptions have been set with appropriate regard to past, current and expected future experience, taking into account the nature of the business conducted by each Business Unit.
We have performed a number of high-level checks on the models, processes and the results of the calculations, and has confirmed that no issues have been discovered that have a material impact on the disclosed embedded value and the equity attributable to shareholders of the Company on the embedded value basis as at 30 November 2015, the value of new business for the year ended 30 November 2015, the analysis of movement in embedded value for the year ended 30 November 2015, and the sensitivity analysis.
Willis Towers Watson
25 February 2016

FINANCIAL STATEMENTS
| AIA GROUP LIMITED2 4 6
SUPPLEMENTARY EMBEDDED VALUE INFORMATION
CAUTIONARY STATEMENTS CONCERNING SUPPLEMENTARY EMBEDDED VALUE INFORMATIONThis report includes non-IFRS financial measures and should not be viewed as a substitute for IFRS financial measures.
The results shown in this report are not intended to represent an opinion of market value and should not be interpreted in that manner.
This report does not purport to encompass all of the many factors that may bear upon a market value.
The results shown in this report are based on a series of assumptions as to the future. It should be recognised that actual future
results may differ from those shown, on account of changes in the operating and economic environments and natural variations in
experience. The results shown are presented at the valuation dates stated in this report and no warranty is given by the Group that
future experience after these valuation dates will be in line with the assumptions made.
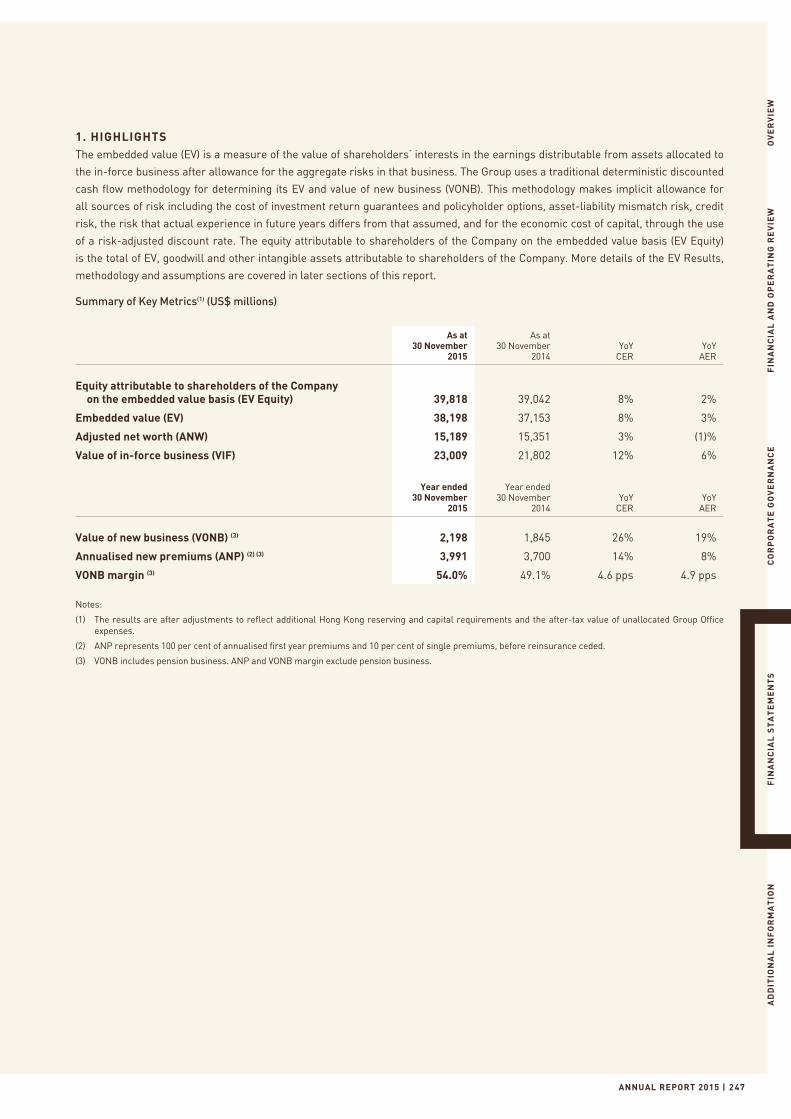
ANNUAL REPORT 2015 | 2 47
OV
ER
VIE
WF
INA
NC
IAL
AN
D O
PE
RA
TIN
G R
EV
IEW
CO
RP
OR
AT
E G
OV
ER
NA
NC
EF
INA
NC
IAL
ST
AT
EM
EN
TS
AD
DIT
ION
AL
IN
FO
RM
AT
ION
1. HIGHLIGHTSThe embedded value (EV) is a measure of the value of shareholders’ interests in the earnings distributable from assets allocated to
the in-force business after allowance for the aggregate risks in that business. The Group uses a traditional deterministic discounted
cash flow methodology for determining its EV and value of new business (VONB). This methodology makes implicit allowance for
all sources of risk including the cost of investment return guarantees and policyholder options, asset-liability mismatch risk, credit
risk, the risk that actual experience in future years differs from that assumed, and for the economic cost of capital, through the use
of a risk-adjusted discount rate. The equity attributable to shareholders of the Company on the embedded value basis (EV Equity)
is the total of EV, goodwill and other intangible assets attributable to shareholders of the Company. More details of the EV Results,
methodology and assumptions are covered in later sections of this report.
Summary of Key Metrics(1) (US$ millions)
As at 30 November
2015
As at 30 November
2014YoY
CERYoY
AER
Equity attributable to shareholders of the Company on the embedded value basis (EV Equity) 39,818 39,042 8% 2%
Embedded value (EV) 38,198 37,153 8% 3%
Adjusted net worth (ANW) 15,189 15,351 3% (1)%
Value of in-force business (VIF) 23,009 21,802 12% 6%
Year ended 30 November
2015
Year ended 30 November
2014YoY
CERYoY
AER
Value of new business (VONB) (3) 2,198 1,845 26% 19%
Annualised new premiums (ANP) (2) (3) 3,991 3,700 14% 8%
VONB margin (3) 54.0% 49.1% 4.6 pps 4.9 pps
Notes:
(1) The results are after adjustments to reflect additional Hong Kong reserving and capital requirements and the after-tax value of unallocated Group Office expenses.
(2) ANP represents 100 per cent of annualised first year premiums and 10 per cent of single premiums, before reinsurance ceded.
(3) VONB includes pension business. ANP and VONB margin exclude pension business.
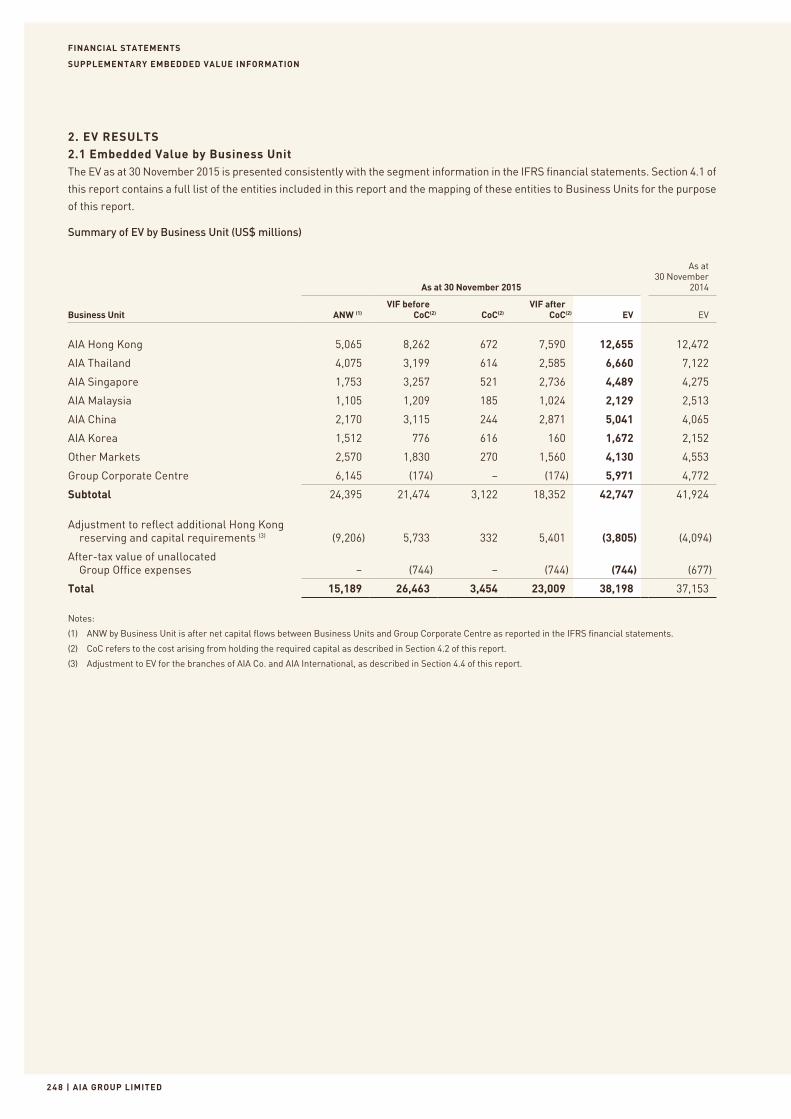
FINANCIAL STATEMENTS
| AIA GROUP LIMITED2 4 8
SUPPLEMENTARY EMBEDDED VALUE INFORMATION
2. EV RESULTS2.1 Embedded Value by Business UnitThe EV as at 30 November 2015 is presented consistently with the segment information in the IFRS financial statements. Section 4.1 of
this report contains a full list of the entities included in this report and the mapping of these entities to Business Units for the purpose
of this report.
Summary of EV by Business Unit (US$ millions)
As at 30 November 2015
As at 30 November
2014
Business Unit ANW (1)VIF before
CoC(2) CoC(2)VIF after
CoC(2) EV EV
AIA Hong Kong 5,065 8,262 672 7,590 12,655 12,472
AIA Thailand 4,075 3,199 614 2,585 6,660 7,122
AIA Singapore 1,753 3,257 521 2,736 4,489 4,275
AIA Malaysia 1,105 1,209 185 1,024 2,129 2,513
AIA China 2,170 3,115 244 2,871 5,041 4,065
AIA Korea 1,512 776 616 160 1,672 2,152
Other Markets 2,570 1,830 270 1,560 4,130 4,553
Group Corporate Centre 6,145 (174) – (174) 5,971 4,772
Subtotal 24,395 21,474 3,122 18,352 42,747 41,924
Adjustment to reflect additional Hong Kong reserving and capital requirements (3) (9,206) 5,733 332 5,401 (3,805) (4,094)
After-tax value of unallocated Group Office expenses – (744) – (744) (744) (677)
Total 15,189 26,463 3,454 23,009 38,198 37,153
Notes:
(1) ANW by Business Unit is after net capital flows between Business Units and Group Corporate Centre as reported in the IFRS financial statements.
(2) CoC refers to the cost arising from holding the required capital as described in Section 4.2 of this report.
(3) Adjustment to EV for the branches of AIA Co. and AIA International, as described in Section 4.4 of this report.
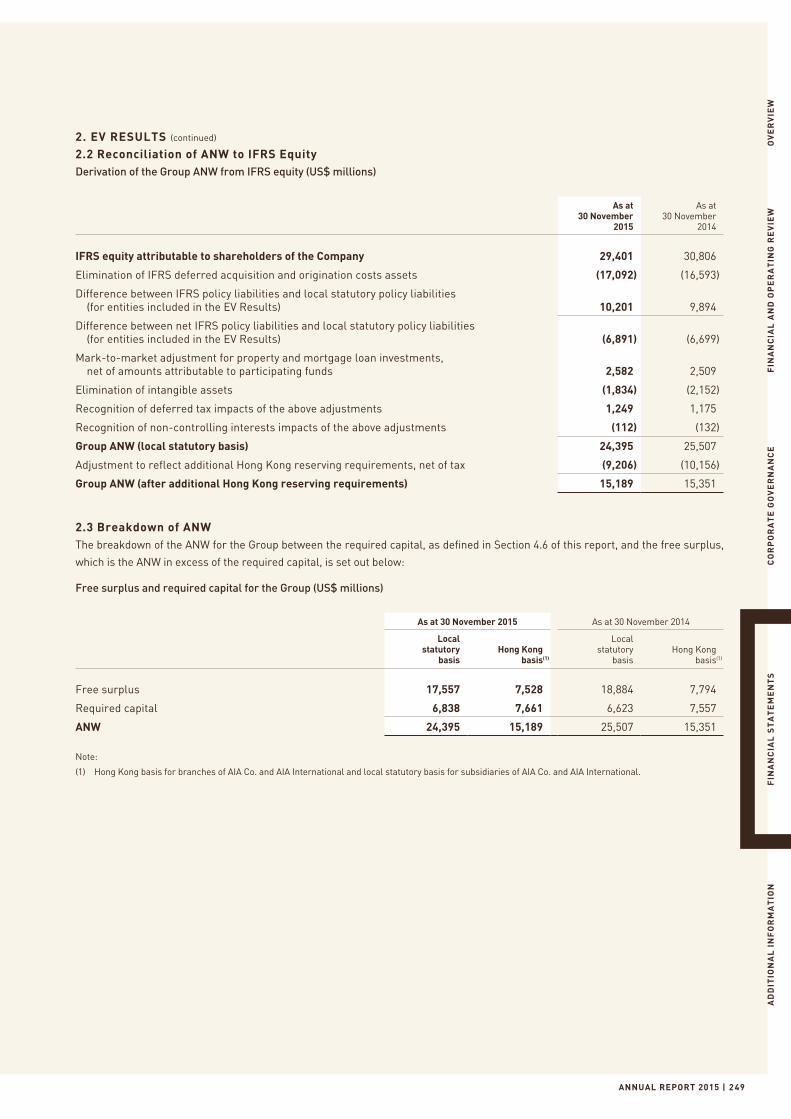
ANNUAL REPORT 2015 | 2 49
OV
ER
VIE
WF
INA
NC
IAL
AN
D O
PE
RA
TIN
G R
EV
IEW
CO
RP
OR
AT
E G
OV
ER
NA
NC
EF
INA
NC
IAL
ST
AT
EM
EN
TS
AD
DIT
ION
AL
IN
FO
RM
AT
ION
2. EV RESULTS (continued)
2.2 Reconciliation of ANW to IFRS EquityDerivation of the Group ANW from IFRS equity (US$ millions)
As at 30 November
2015
As at 30 November
2014
IFRS equity attributable to shareholders of the Company 29,401 30,806
Elimination of IFRS deferred acquisition and origination costs assets (17,092) (16,593)
Difference between IFRS policy liabilities and local statutory policy liabilities (for entities included in the EV Results) 10,201 9,894
Difference between net IFRS policy liabilities and local statutory policy liabilities (for entities included in the EV Results) (6,891) (6,699)
Mark-to-market adjustment for property and mortgage loan investments, net of amounts attributable to participating funds 2,582 2,509
Elimination of intangible assets (1,834) (2,152)
Recognition of deferred tax impacts of the above adjustments 1,249 1,175
Recognition of non-controlling interests impacts of the above adjustments (112) (132)
Group ANW (local statutory basis) 24,395 25,507
Adjustment to reflect additional Hong Kong reserving requirements, net of tax (9,206) (10,156)
Group ANW (after additional Hong Kong reserving requirements) 15,189 15,351
2.3 Breakdown of ANWThe breakdown of the ANW for the Group between the required capital, as defined in Section 4.6 of this report, and the free surplus,
which is the ANW in excess of the required capital, is set out below:
Free surplus and required capital for the Group (US$ millions)
As at 30 November 2015 As at 30 November 2014
Local statutory
basisHong Kong
basis(1)
Local statutory
basisHong Kong
basis(1)
Free surplus 17,557 7,528 18,884 7,794
Required capital 6,838 7,661 6,623 7,557
ANW 24,395 15,189 25,507 15,351
Note:
(1) Hong Kong basis for branches of AIA Co. and AIA International and local statutory basis for subsidiaries of AIA Co. and AIA International.
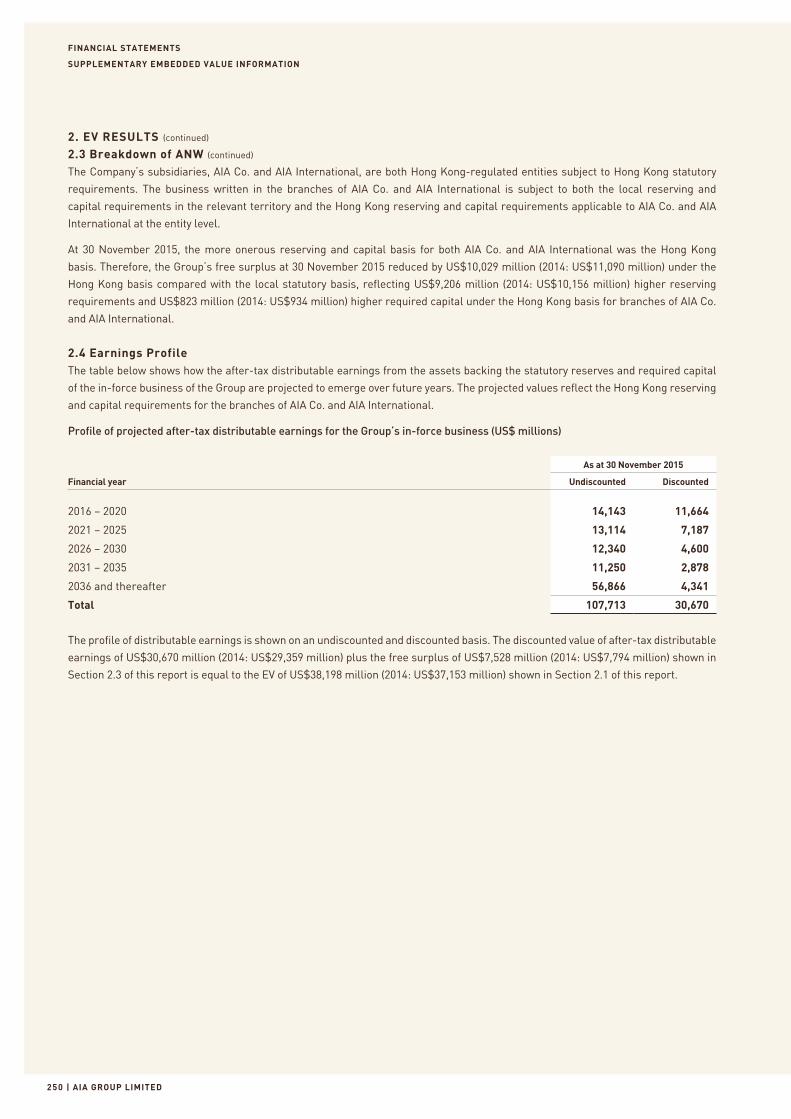
FINANCIAL STATEMENTS
| AIA GROUP LIMITED250
SUPPLEMENTARY EMBEDDED VALUE INFORMATION
2. EV RESULTS (continued)
2.3 Breakdown of ANW (continued)
The Company’s subsidiaries, AIA Co. and AIA International, are both Hong Kong-regulated entities subject to Hong Kong statutory
requirements. The business written in the branches of AIA Co. and AIA International is subject to both the local reserving and
capital requirements in the relevant territory and the Hong Kong reserving and capital requirements applicable to AIA Co. and AIA
International at the entity level.
At 30 November 2015, the more onerous reserving and capital basis for both AIA Co. and AIA International was the Hong Kong
basis. Therefore, the Group’s free surplus at 30 November 2015 reduced by US$10,029 million (2014: US$11,090 million) under the
Hong Kong basis compared with the local statutory basis, reflecting US$9,206 million (2014: US$10,156 million) higher reserving
requirements and US$823 million (2014: US$934 million) higher required capital under the Hong Kong basis for branches of AIA Co.
and AIA International.
2.4 Earnings ProfileThe table below shows how the after-tax distributable earnings from the assets backing the statutory reserves and required capital
of the in-force business of the Group are projected to emerge over future years. The projected values reflect the Hong Kong reserving
and capital requirements for the branches of AIA Co. and AIA International.
Profile of projected after-tax distributable earnings for the Group’s in-force business (US$ millions)
As at 30 November 2015
Financial year Undiscounted Discounted
2016 – 2020 14,143 11,664
2021 – 2025 13,114 7,187
2026 – 2030 12,340 4,600
2031 – 2035 11,250 2,878
2036 and thereafter 56,866 4,341
Total 107,713 30,670
The profile of distributable earnings is shown on an undiscounted and discounted basis. The discounted value of after-tax distributable
earnings of US$30,670 million (2014: US$29,359 million) plus the free surplus of US$7,528 million (2014: US$7,794 million) shown in
Section 2.3 of this report is equal to the EV of US$38,198 million (2014: US$37,153 million) shown in Section 2.1 of this report.
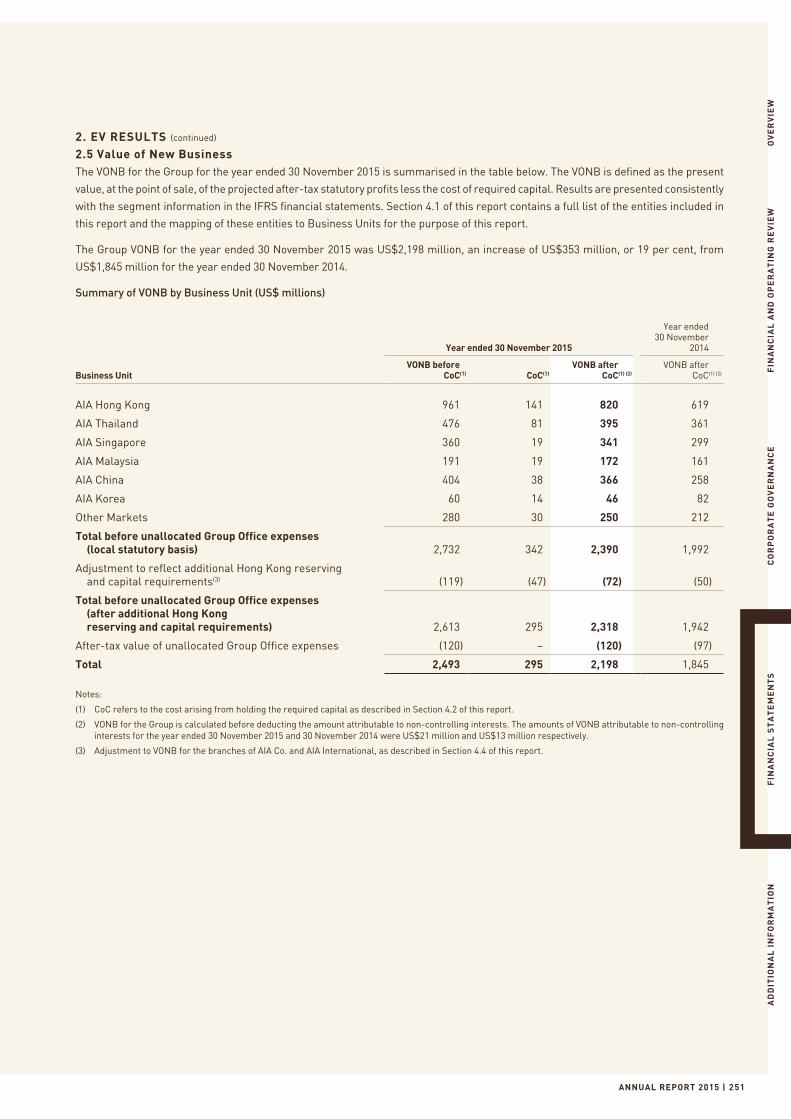
ANNUAL REPORT 2015 | 251
OV
ER
VIE
WF
INA
NC
IAL
AN
D O
PE
RA
TIN
G R
EV
IEW
CO
RP
OR
AT
E G
OV
ER
NA
NC
EF
INA
NC
IAL
ST
AT
EM
EN
TS
AD
DIT
ION
AL
IN
FO
RM
AT
ION
2. EV RESULTS (continued)
2.5 Value of New BusinessThe VONB for the Group for the year ended 30 November 2015 is summarised in the table below. The VONB is defined as the present
value, at the point of sale, of the projected after-tax statutory profits less the cost of required capital. Results are presented consistently
with the segment information in the IFRS financial statements. Section 4.1 of this report contains a full list of the entities included in
this report and the mapping of these entities to Business Units for the purpose of this report.
The Group VONB for the year ended 30 November 2015 was US$2,198 million, an increase of US$353 million, or 19 per cent, from
US$1,845 million for the year ended 30 November 2014.
Summary of VONB by Business Unit (US$ millions)
Year ended 30 November 2015
Year ended 30 November
2014
Business UnitVONB before
CoC(1) CoC(1)VONB after
CoC(1) (2)VONB after
CoC(1) (2)
AIA Hong Kong 961 141 820 619
AIA Thailand 476 81 395 361
AIA Singapore 360 19 341 299
AIA Malaysia 191 19 172 161
AIA China 404 38 366 258
AIA Korea 60 14 46 82
Other Markets 280 30 250 212
Total before unallocated Group Office expenses (local statutory basis) 2,732 342 2,390 1,992
Adjustment to reflect additional Hong Kong reserving and capital requirements(3) (119) (47) (72) (50)
Total before unallocated Group Office expenses (after additional Hong Kong reserving and capital requirements) 2,613 295 2,318 1,942
After-tax value of unallocated Group Office expenses (120) – (120) (97)
Total 2,493 295 2,198 1,845
Notes:
(1) CoC refers to the cost arising from holding the required capital as described in Section 4.2 of this report.
(2) VONB for the Group is calculated before deducting the amount attributable to non-controlling interests. The amounts of VONB attributable to non-controlling interests for the year ended 30 November 2015 and 30 November 2014 were US$21 million and US$13 million respectively.
(3) Adjustment to VONB for the branches of AIA Co. and AIA International, as described in Section 4.4 of this report.
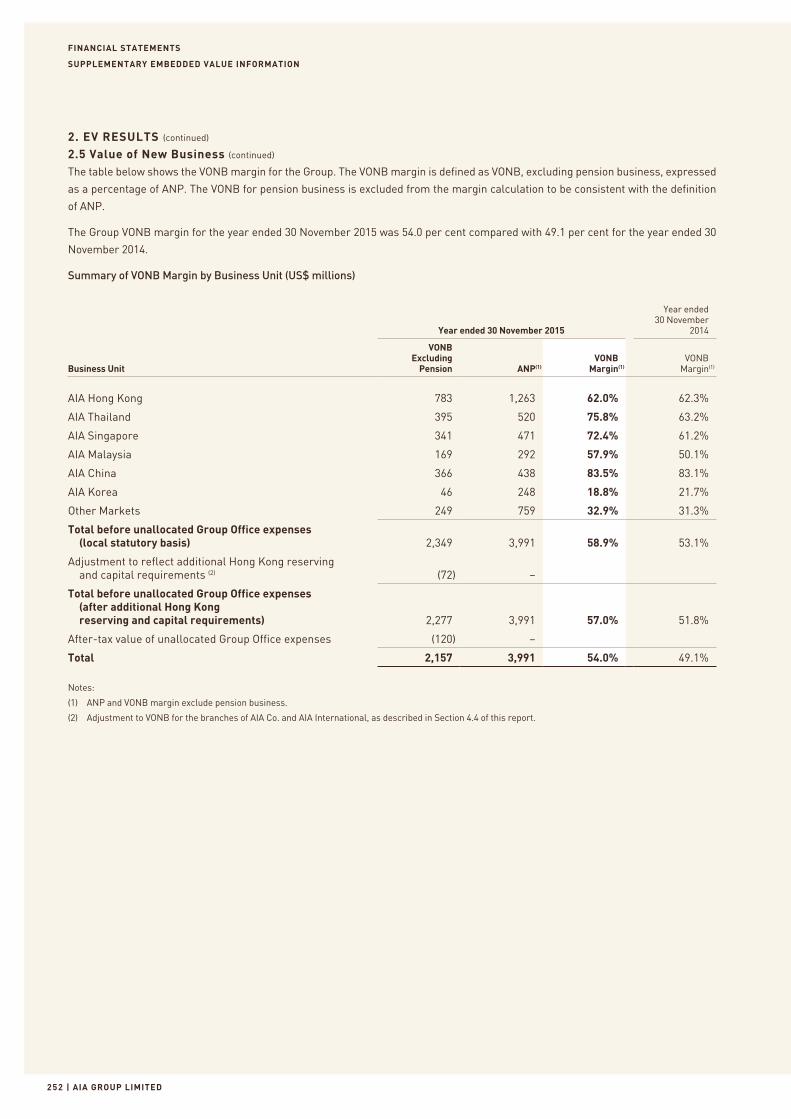
FINANCIAL STATEMENTS
| AIA GROUP LIMITED252
SUPPLEMENTARY EMBEDDED VALUE INFORMATION
2. EV RESULTS (continued)
2.5 Value of New Business (continued)
The table below shows the VONB margin for the Group. The VONB margin is defined as VONB, excluding pension business, expressed
as a percentage of ANP. The VONB for pension business is excluded from the margin calculation to be consistent with the definition
of ANP.
The Group VONB margin for the year ended 30 November 2015 was 54.0 per cent compared with 49.1 per cent for the year ended 30
November 2014.
Summary of VONB Margin by Business Unit (US$ millions)
Year ended 30 November 2015
Year ended 30 November
2014
Business Unit
VONB Excluding
Pension ANP(1)VONB
Margin(1)VONB
Margin(1)
AIA Hong Kong 783 1,263 62.0% 62.3%
AIA Thailand 395 520 75.8% 63.2%
AIA Singapore 341 471 72.4% 61.2%
AIA Malaysia 169 292 57.9% 50.1%
AIA China 366 438 83.5% 83.1%
AIA Korea 46 248 18.8% 21.7%
Other Markets 249 759 32.9% 31.3%
Total before unallocated Group Office expenses (local statutory basis) 2,349 3,991 58.9% 53.1%
Adjustment to reflect additional Hong Kong reserving and capital requirements (2) (72) –
Total before unallocated Group Office expenses (after additional Hong Kong reserving and capital requirements) 2,277 3,991 57.0% 51.8%
After-tax value of unallocated Group Office expenses (120) –
Total 2,157 3,991 54.0% 49.1%
Notes:
(1) ANP and VONB margin exclude pension business.
(2) Adjustment to VONB for the branches of AIA Co. and AIA International, as described in Section 4.4 of this report.
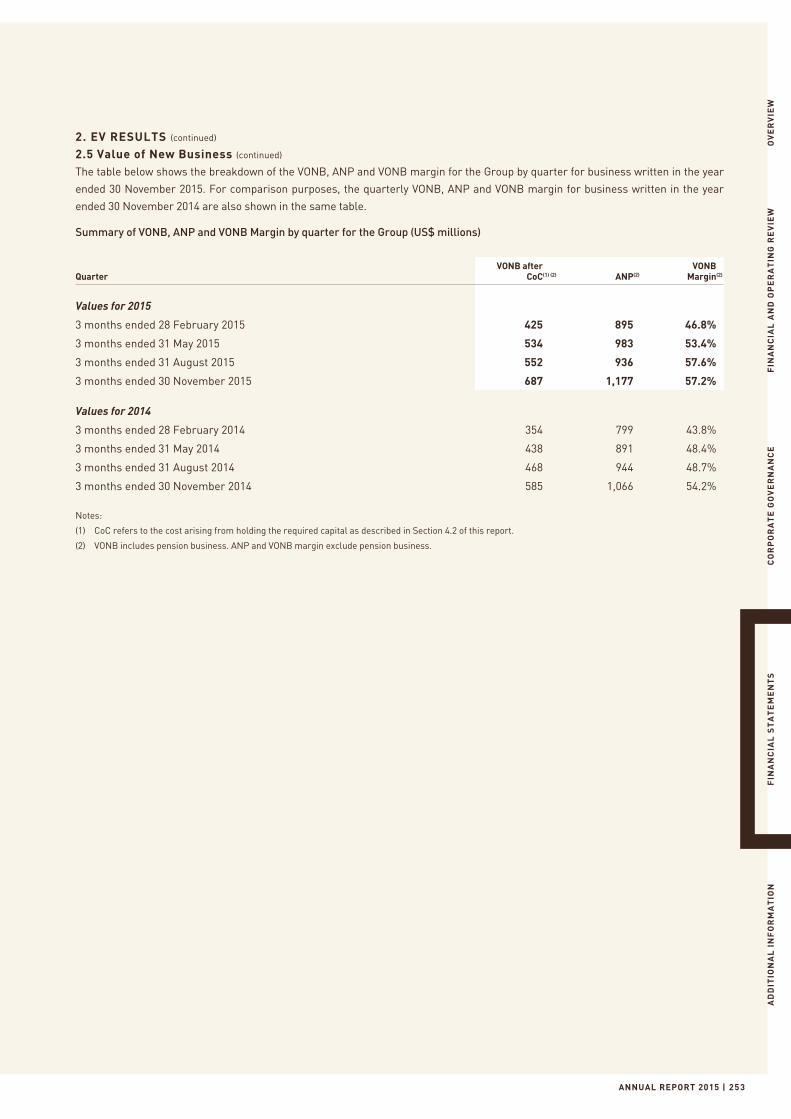
ANNUAL REPORT 2015 | 253
OV
ER
VIE
WF
INA
NC
IAL
AN
D O
PE
RA
TIN
G R
EV
IEW
CO
RP
OR
AT
E G
OV
ER
NA
NC
EF
INA
NC
IAL
ST
AT
EM
EN
TS
AD
DIT
ION
AL
IN
FO
RM
AT
ION
2. EV RESULTS (continued)
2.5 Value of New Business (continued)
The table below shows the breakdown of the VONB, ANP and VONB margin for the Group by quarter for business written in the year
ended 30 November 2015. For comparison purposes, the quarterly VONB, ANP and VONB margin for business written in the year
ended 30 November 2014 are also shown in the same table.
Summary of VONB, ANP and VONB Margin by quarter for the Group (US$ millions)
QuarterVONB after
CoC(1) (2) ANP(2)VONB
Margin(2)
Values for 2015
3 months ended 28 February 2015 425 895 46.8%
3 months ended 31 May 2015 534 983 53.4%
3 months ended 31 August 2015 552 936 57.6%
3 months ended 30 November 2015 687 1,177 57.2%
Values for 2014
3 months ended 28 February 2014 354 799 43.8%
3 months ended 31 May 2014 438 891 48.4%
3 months ended 31 August 2014 468 944 48.7%
3 months ended 30 November 2014 585 1,066 54.2%
Notes:
(1) CoC refers to the cost arising from holding the required capital as described in Section 4.2 of this report.
(2) VONB includes pension business. ANP and VONB margin exclude pension business.
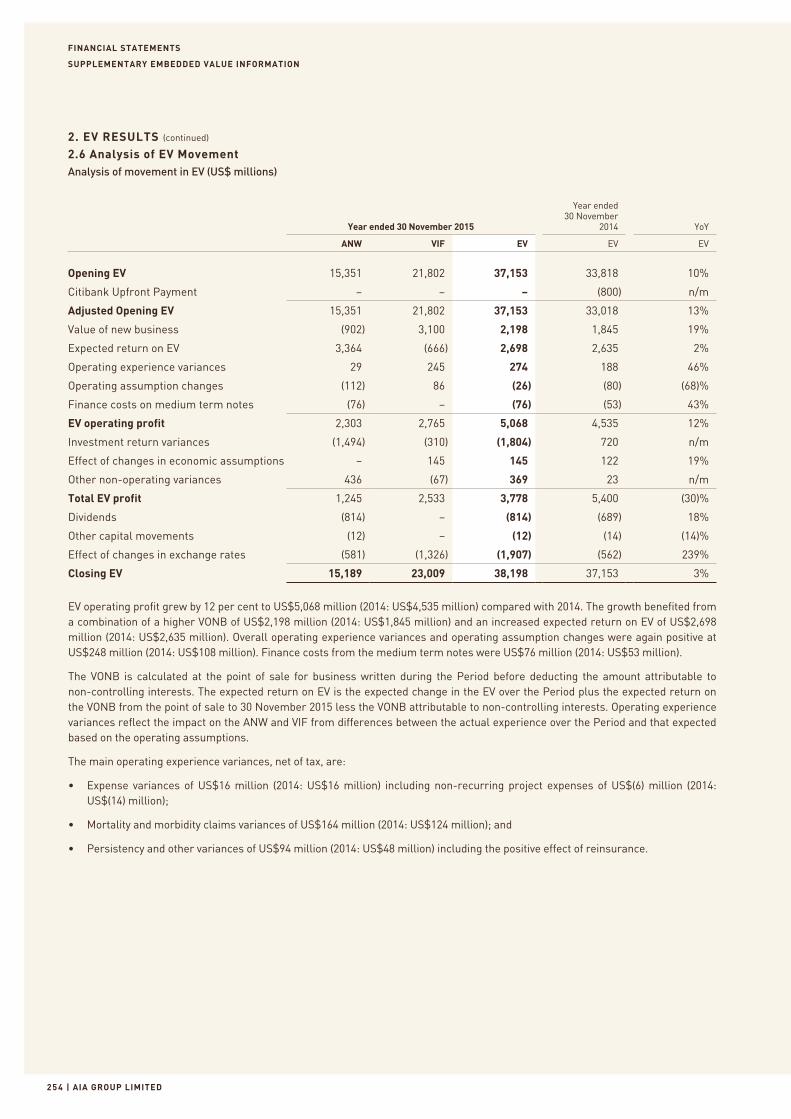
FINANCIAL STATEMENTS
| AIA GROUP LIMITED25 4
SUPPLEMENTARY EMBEDDED VALUE INFORMATION
2. EV RESULTS (continued)
2.6 Analysis of EV MovementAnalysis of movement in EV (US$ millions)
Year ended 30 November 2015
Year ended 30 November
2014 YoY
ANW VIF EV EV EV
Opening EV 15,351 21,802 37,153 33,818 10%
Citibank Upfront Payment – – – (800) n/m
Adjusted Opening EV 15,351 21,802 37,153 33,018 13%
Value of new business (902) 3,100 2,198 1,845 19%
Expected return on EV 3,364 (666) 2,698 2,635 2%
Operating experience variances 29 245 274 188 46%
Operating assumption changes (112) 86 (26) (80) (68)%
Finance costs on medium term notes (76) – (76) (53) 43%
EV operating profit 2,303 2,765 5,068 4,535 12%
Investment return variances (1,494) (310) (1,804) 720 n/m
Effect of changes in economic assumptions – 145 145 122 19%
Other non-operating variances 436 (67) 369 23 n/m
Total EV profit 1,245 2,533 3,778 5,400 (30)%
Dividends (814) – (814) (689) 18%
Other capital movements (12) – (12) (14) (14)%
Effect of changes in exchange rates (581) (1,326) (1,907) (562) 239%
Closing EV 15,189 23,009 38,198 37,153 3%
EV operating profit grew by 12 per cent to US$5,068 million (2014: US$4,535 million) compared with 2014. The growth benefited from a combination of a higher VONB of US$2,198 million (2014: US$1,845 million) and an increased expected return on EV of US$2,698 million (2014: US$2,635 million). Overall operating experience variances and operating assumption changes were again positive at US$248 million (2014: US$108 million). Finance costs from the medium term notes were US$76 million (2014: US$53 million).
The VONB is calculated at the point of sale for business written during the Period before deducting the amount attributable to non-controlling interests. The expected return on EV is the expected change in the EV over the Period plus the expected return on the VONB from the point of sale to 30 November 2015 less the VONB attributable to non-controlling interests. Operating experience variances reflect the impact on the ANW and VIF from differences between the actual experience over the Period and that expected based on the operating assumptions.
The main operating experience variances, net of tax, are:
• Expense variances of US$16 million (2014: US$16 million) including non-recurring project expenses of US$(6) million (2014: US$(14) million);
• Mortality and morbidity claims variances of US$164 million (2014: US$124 million); and
• Persistency and other variances of US$94 million (2014: US$48 million) including the positive effect of reinsurance.
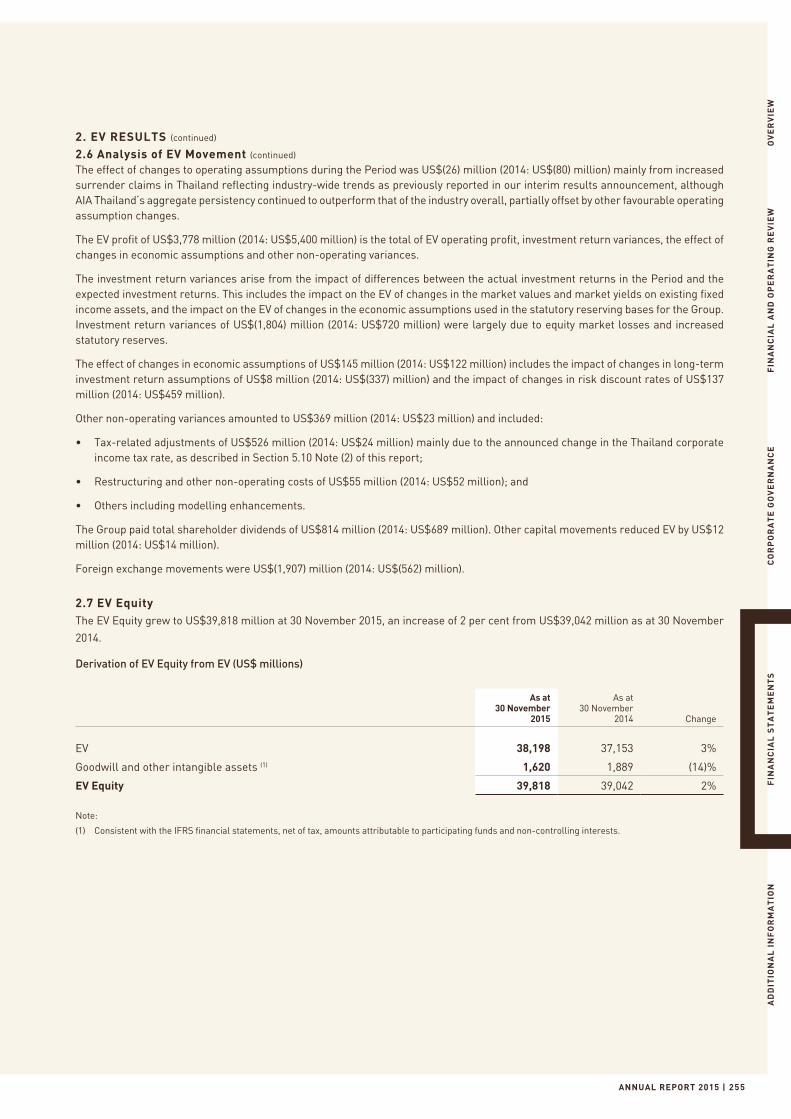
ANNUAL REPORT 2015 | 255
OV
ER
VIE
WF
INA
NC
IAL
AN
D O
PE
RA
TIN
G R
EV
IEW
CO
RP
OR
AT
E G
OV
ER
NA
NC
EF
INA
NC
IAL
ST
AT
EM
EN
TS
AD
DIT
ION
AL
IN
FO
RM
AT
ION
2. EV RESULTS (continued)
2.6 Analysis of EV Movement (continued)
The effect of changes to operating assumptions during the Period was US$(26) million (2014: US$(80) million) mainly from increased surrender claims in Thailand reflecting industry-wide trends as previously reported in our interim results announcement, although AIA Thailand’s aggregate persistency continued to outperform that of the industry overall, partially offset by other favourable operating assumption changes.
The EV profit of US$3,778 million (2014: US$5,400 million) is the total of EV operating profit, investment return variances, the effect of changes in economic assumptions and other non-operating variances.
The investment return variances arise from the impact of differences between the actual investment returns in the Period and the expected investment returns. This includes the impact on the EV of changes in the market values and market yields on existing fixed income assets, and the impact on the EV of changes in the economic assumptions used in the statutory reserving bases for the Group. Investment return variances of US$(1,804) million (2014: US$720 million) were largely due to equity market losses and increased statutory reserves.
The effect of changes in economic assumptions of US$145 million (2014: US$122 million) includes the impact of changes in long-term investment return assumptions of US$8 million (2014: US$(337) million) and the impact of changes in risk discount rates of US$137 million (2014: US$459 million).
Other non-operating variances amounted to US$369 million (2014: US$23 million) and included:
• Tax-related adjustments of US$526 million (2014: US$24 million) mainly due to the announced change in the Thailand corporate income tax rate, as described in Section 5.10 Note (2) of this report;
• Restructuring and other non-operating costs of US$55 million (2014: US$52 million); and
• Others including modelling enhancements.
The Group paid total shareholder dividends of US$814 million (2014: US$689 million). Other capital movements reduced EV by US$12 million (2014: US$14 million).
Foreign exchange movements were US$(1,907) million (2014: US$(562) million).
2.7 EV EquityThe EV Equity grew to US$39,818 million at 30 November 2015, an increase of 2 per cent from US$39,042 million as at 30 November
2014.
Derivation of EV Equity from EV (US$ millions)
As at 30 November
2015
As at 30 November
2014 Change
EV 38,198 37,153 3%
Goodwill and other intangible assets (1) 1,620 1,889 (14)%
EV Equity 39,818 39,042 2%
Note:
(1) Consistent with the IFRS financial statements, net of tax, amounts attributable to participating funds and non-controlling interests.
FINANCIAL STATEMENTS
| AIA GROUP LIMITED256
SUPPLEMENTARY EMBEDDED VALUE INFORMATION
3. SENSITIVITY ANALYSISThe EV as at 30 November 2015 and the VONB for the year ended 30 November 2015 have been recalculated to illustrate the sensitivity
of the results to changes in certain central assumptions discussed in Section 5 of this report.
The sensitivities analysed were:
• Risk discount rates 200 basis points per annum higher than the central assumptions;
• Risk discount rates 200 basis points per annum lower than the central assumptions;
• Interest rates 50 basis points per annum higher than the central assumptions;
• Interest rates 50 basis points per annum lower than the central assumptions;
• The presentation currency (as explained below) appreciated by 5 per cent;
• The presentation currency depreciated by 5 per cent;
• Lapse and premium discontinuance rates increased proportionally by 10 per cent (i.e. 110 per cent of the central assumptions);
• Lapse and premium discontinuance rates decreased proportionally by 10 per cent (i.e. 90 per cent of the central assumptions);
• Mortality/morbidity rates increased proportionally by 10 per cent (i.e. 110 per cent of the central assumptions);
• Mortality/morbidity rates decreased proportionally by 10 per cent (i.e. 90 per cent of the central assumptions);
• Maintenance expenses 10 per cent lower (i.e. 90 per cent of the central assumptions); and
• Expense inflation set to 0 per cent.
The EV as at 30 November 2015 has been further analysed for the following sensitivities:
• Equity prices increased proportionally by 10 per cent (i.e. 110 per cent of the prices at 30 November 2015); and
• Equity prices decreased proportionally by 10 per cent (i.e. 90 per cent of the prices at 30 November 2015).
For the interest rate sensitivities, the investment return assumptions and the risk discount rates were changed by 50 basis points per
annum; the projected bonus rates on participating business, the statutory reserving bases at 30 November 2015 and the values of debt
instruments held at 30 November 2015 were changed to be consistent with the interest rate assumptions in the sensitivity analysis,
while all the other assumptions were unchanged.
The EV Results of each entity in Section 4.1 of this report are measured in the currency of the primary economic environment in which
that entity operates (the functional currency) and presented in US dollars (the presentation currency). In order to provide sensitivity
results for EV and VONB of the impact of foreign currency movements to the translation from functional currencies, a change of 5 per
cent to the presentation currency is included. This sensitivity does not include the impact of currency movements on the translation of
transactions denominated in a foreign currency of an entity into its functional currency (including any impacts on VIF).
For the equity price sensitivities, the projected bonus rates on participating business and the values of equity securities and equity
funds held at 30 November 2015 were changed to be consistent with the equity price assumptions in the sensitivity analysis, while all
the other assumptions were unchanged.
For each of the remaining sensitivity analyses, the statutory reserving bases as at 30 November 2015 and the projected bonus rates
on participating business were changed to be consistent with the sensitivity analysis assumptions, while all the other assumptions
remain unchanged.
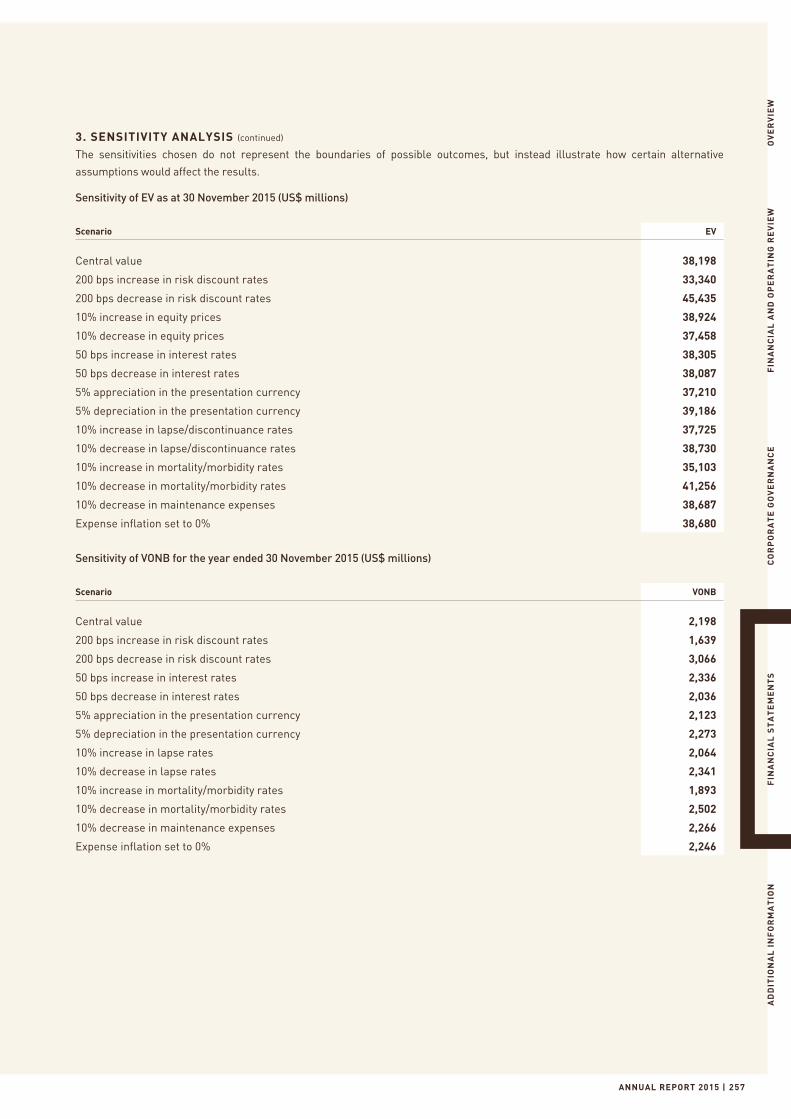
ANNUAL REPORT 2015 | 257
OV
ER
VIE
WF
INA
NC
IAL
AN
D O
PE
RA
TIN
G R
EV
IEW
CO
RP
OR
AT
E G
OV
ER
NA
NC
EF
INA
NC
IAL
ST
AT
EM
EN
TS
AD
DIT
ION
AL
IN
FO
RM
AT
ION
3. SENSITIVITY ANALYSIS (continued)
The sensitivities chosen do not represent the boundaries of possible outcomes, but instead illustrate how certain alternative
assumptions would affect the results.
Sensitivity of EV as at 30 November 2015 (US$ millions)
Scenario EV
Central value 38,198
200 bps increase in risk discount rates 33,340
200 bps decrease in risk discount rates 45,435
10% increase in equity prices 38,924
10% decrease in equity prices 37,458
50 bps increase in interest rates 38,305
50 bps decrease in interest rates 38,087
5% appreciation in the presentation currency 37,210
5% depreciation in the presentation currency 39,186
10% increase in lapse/discontinuance rates 37,725
10% decrease in lapse/discontinuance rates 38,730
10% increase in mortality/morbidity rates 35,103
10% decrease in mortality/morbidity rates 41,256
10% decrease in maintenance expenses 38,687
Expense inflation set to 0% 38,680
Sensitivity of VONB for the year ended 30 November 2015 (US$ millions)
Scenario VONB
Central value 2,198
200 bps increase in risk discount rates 1,639
200 bps decrease in risk discount rates 3,066
50 bps increase in interest rates 2,336
50 bps decrease in interest rates 2,036
5% appreciation in the presentation currency 2,123
5% depreciation in the presentation currency 2,273
10% increase in lapse rates 2,064
10% decrease in lapse rates 2,341
10% increase in mortality/morbidity rates 1,893
10% decrease in mortality/morbidity rates 2,502
10% decrease in maintenance expenses 2,266
Expense inflation set to 0% 2,246
FINANCIAL STATEMENTS
| AIA GROUP LIMITED258
SUPPLEMENTARY EMBEDDED VALUE INFORMATION
4. METHODOLOGY4.1 Entities Included in This ReportThe Group operates through a number of subsidiaries and branches. Its two main operating subsidiaries are AIA Company Limited
(AIA Co.), a subsidiary of the Company, and AIA International Limited (AIA International), a subsidiary of AIA Co. Furthermore, AIA Co.
has branches located in Brunei, China and Thailand and AIA International has branches located in Hong Kong, Korea, Macau, New
Zealand and Taiwan.
The following is a full list of the entities and their mapping to Business Units for the purpose of this report.
• AIA Australia refers to AIA Australia Limited, a subsidiary of AIA Co.;
• AIA China refers to the China branches of AIA Co.;
• AIA Hong Kong refers to the total of the following three entities:
• the Hong Kong and Macau branches of AIA International;
• the Hong Kong and Macau business written by AIA Co.; and
• AIA Pension and Trustee Co. Ltd., a subsidiary of AIA Co.
• AIA Indonesia refers to PT. AIA Financial, a subsidiary of AIA International;
• AIA Korea refers to the Korea branch of AIA International;
• AIA Malaysia refers to AIA Bhd., a subsidiary of AIA Co., its subsidiary Green Health Certification Berhad and AIA PUBLIC Takaful
Bhd., a 70 per cent owned subsidiary of AIA Co.;
• AIA New Zealand refers to the New Zealand branch of AIA International;
• Philam Life refers to The Philippine American Life and General Insurance (PHILAM LIFE) Company, a subsidiary of AIA Co. and its
51 per cent owned subsidiary BPI-Philam Life Assurance Corporation;
• AIA Singapore refers to AIA Singapore Private Limited, a subsidiary of AIA Co., and the Brunei branch of AIA Co.;
• AIA Sri Lanka refers to AIA Insurance Lanka PLC, a 97.16 per cent owned subsidiary of AIA Co.;
• AIA Taiwan refers to the Taiwan branch of AIA International;
• AIA Thailand refers to the Thailand branches of AIA Co.; and
• AIA Vietnam refers to AIA (Vietnam) Life Insurance Company Limited, a subsidiary of AIA International.
In addition, the entity Tata AIA Life Insurance Company Limited, which is 26 per cent owned by AIA International, has been included in
the Group ANW presented in this report on an equity method accounting basis.
Results are presented consistently with the segment information in the IFRS financial statements. The summary of the EV of the Group
by Business Unit in this report also includes a segment for “Group Corporate Centre” results. The results shown for this segment
consist of the ANW for the Group’s corporate functions and the present value of remittance taxes payable on distributable profits
to Hong Kong. The ANW has been derived as the IFRS equity for this segment plus mark-to-market adjustments less the value of
excluded intangible assets. For the VONB, “Other Markets” includes the present value of allowance for remittance taxes payable on
distributable profits to Hong Kong.
ANNUAL REPORT 2015 | 259
OV
ER
VIE
WF
INA
NC
IAL
AN
D O
PE
RA
TIN
G R
EV
IEW
CO
RP
OR
AT
E G
OV
ER
NA
NC
EF
INA
NC
IAL
ST
AT
EM
EN
TS
AD
DIT
ION
AL
IN
FO
RM
AT
ION
4. METHODOLOGY (continued)
4.2 Embedded Value and Value of New BusinessThe Group uses a traditional deterministic discounted cash flow methodology for determining its EV and VONB. This methodology makes
implicit allowance for all sources of risk including the cost of investment return guarantees and policyholder options, asset-liability
mismatch risk, credit risk, the risk that actual experience in future years differs from that assumed, and for the economic cost of
capital, through the use of a risk-adjusted discount rate. Typically, the higher the risk discount rate, the greater the allowance for
these factors. This is a common methodology used by life insurance companies in Asia currently. Alternative valuation methodologies
and approaches continue to emerge and may be considered by AIA.
The business included in the VIF and VONB calculations includes all life business written by the Business Units of the Group, plus
other lines of business which may not be classified as life business but have similar characteristics. These include accident and health,
group and pension businesses. The projected in-force business included in the VIF also incorporates expected renewals on short-term
business with a term of one year or less.
The EV is the sum of the ANW and VIF. The ANW is the market value of assets in excess of the assets backing the policy reserves and
other liabilities of the life (and similar) business of the Group, plus the IFRS equity value of other activities, such as general insurance
business, less the value of intangible assets. It excludes any amounts not attributable to shareholders of the Company. The market
value of investment property and property held for own use that is used to determine the ANW is based on the fair value disclosed in
the Group’s IFRS financial statements as at the valuation date. It is the Group’s policy to obtain external property valuations annually
except in the case of a discrete event occurring in the interim that has a significant impact on the fair value of the properties.
The VIF is the present value of projected after-tax statutory profits emerging in the future from the current in-force business less
the cost arising from holding the required capital (CoC) to support the in-force business. CoC is calculated as the face value of the
required capital as at the valuation date less the present value of the net-of-tax investment return on the shareholder assets backing
required capital and the present value of projected releases from the assets backing the required capital. Where the required capital
may be covered by policyholder assets such as surplus assets in a participating fund, there is no associated cost of capital included
in the VIF or VONB.
EV Equity is the total of EV, goodwill and other intangible assets attributable to shareholders of the Company.
The VONB is the present value, measured at the point of sale, of projected after-tax statutory profits emerging in the future from new
business sold in the period less the cost of holding required capital in excess of regulatory reserves to support this business. The
VONB for the Group is calculated based on assumptions applicable at the point of measurement and before deducting the amount
attributable to non-controlling interests. The VONB attributable to non-controlling interests was US$21 million for the year ended 30
November 2015 (2014: US$13 million).
A deduction has been made from the EV and VONB for the present value of future after-tax unallocated Group Office expenses,
representing the expenses incurred by the Group Office which are not allocated to the Business Units. These unallocated Group Office
expenses have been allocated to acquisition and maintenance activities, and a deduction made from the VONB and VIF respectively.
FINANCIAL STATEMENTS
| AIA GROUP LIMITED260
SUPPLEMENTARY EMBEDDED VALUE INFORMATION
4. METHODOLOGY (continued)
4.3 Definition of New BusinessNew business includes the sale of new contracts during the period, additional single premium payments on recurrent single premium contracts and increments to existing contracts where these are not variations allowed for in the calculation of the VIF. The VONB also includes the present value of cash flows associated with new policies written during the reporting period but subsequently terminated before the valuation date.
For group renewable business including group yearly renewable term business, new business is composed of new schemes set up during the period plus any premium payable on existing schemes that exceeds the prior year’s premiums. For individually significant group cases, the VONB is calculated over each premium rate guarantee period entered upon contract inception or renewal.
For short-term accident and health business with a term of one year or less, renewals of existing contracts are not considered new business, and the value of expected renewals on this business is included in the VIF.
For pension business, sales of new contracts during the period and any new contributions, including assets transferred in, are considered as new business for the calculation of the VONB.
New business volumes shown in this report are measured using annualised new premiums (ANP), which is an internal measure of new business sales. This represents 100 per cent of annualised first year premiums and 10 per cent of single premiums, before reinsurance ceded.
4.4 Consolidation of Branches of AIA Co. and AIA InternationalThe Group’s subsidiaries, AIA Co. and AIA International, are both Hong Kong-regulated entities. AIA operates in a number of
territories as branches of these entities. Therefore, the business written in these branches is subject to the local reserving and
capital requirements in the relevant territory and the Hong Kong reserving and capital requirements applicable to AIA Co. and AIA
International at the entity level.
For these branches, the EV Results shown in Section 2 of this report have been calculated reflecting the more onerous of the Hong
Kong and branch level local regulatory reserving and capital requirements. This was done because the ultimate distribution of profits
to shareholders of the Company from AIA Co. and AIA International will depend on both the Hong Kong and the local regulatory
reserving and capital requirements. At the end of November 2015, the more onerous reserving and capital basis for both AIA Co. and
AIA International was the Hong Kong regulatory basis. This impact is shown as a Group-level adjustment to the EV and VONB. The EV
and VONB for each Business Unit reflect only the local reserving and capital requirements, as discussed in Section 4.6 of this report.
4.5 Valuation of Future Statutory LossesFor certain lines of business, projected future statutory profits are negative due to the local statutory reserves being insufficient to
meet the value of future policyholder cash flows. Within a traditional embedded value framework, there are a number of acceptable
methods for determining the value of a combination of positive and negative statutory profits for different lines of business.
For the purposes of this valuation, future projected statutory losses have been valued by discounting them at the risk discount rate
for the relevant Business Unit, with any negative VIF eliminated for each reported segment by reducing the ANW and EV. This has
been done because the allowance for risk in the range of selected risk discount rates for each Business Unit has been set taking
into account the presence of any such business lines with projected statutory losses. Also, the currently more onerous Hong Kong
regulatory reserving and capital requirements for the branches of AIA Co. and AIA International have the effect of reducing the level
of any future projected statutory losses for these Business Units. Based on the assumptions described in Section 5 of this report, and
allowing for the Hong Kong statutory reserving and capital requirements for the branches of AIA Co. and AIA International, the overall
projected annual distributable profits from the current in-force business and the assets backing the required capital of the Group are
positive over the remaining lifetime of the business. Therefore, it is not considered necessary to change the discounting approach
described above.
ANNUAL REPORT 2015 | 261
OV
ER
VIE
WF
INA
NC
IAL
AN
D O
PE
RA
TIN
G R
EV
IEW
CO
RP
OR
AT
E G
OV
ER
NA
NC
EF
INA
NC
IAL
ST
AT
EM
EN
TS
AD
DIT
ION
AL
IN
FO
RM
AT
ION
4. METHODOLOGY (continued)
4.6 Required CapitalEach of the Business Units has a regulatory requirement to hold shareholder capital in addition to the assets backing the insurance
liabilities. The Group’s assumed levels of required capital for each Business Unit are set out in the table below. Further, the
consolidated EV Results for the Group have been calculated reflecting the more onerous of the Hong Kong and branch level local
regulatory reserving and capital requirements for AIA Co. and AIA International.
Required Capital by Business Unit
Business Unit Required Capital
AIA Australia 100% of regulatory capital adequacy requirement
AIA China 100% of required minimum solvency margin(1)
AIA Hong Kong 150% of required minimum solvency margin(2)
AIA Indonesia 120% of regulatory Risk-Based Capital requirement
AIA Korea 150% of regulatory Risk-Based Capital requirement
AIA Malaysia 170% of regulatory Risk-Based Capital requirement
AIA New Zealand 100% of local regulatory requirement
Philam Life 100% of regulatory Risk-Based Capital requirement
AIA Singapore 180% of regulatory Risk-Based Capital requirement
AIA Sri Lanka 120% of proposed Risk-Based Capital requirement
AIA Taiwan 250% of regulatory Risk-Based Capital requirement
AIA Thailand 140% of regulatory Risk-Based Capital requirement
AIA Vietnam 100% of required minimum solvency margin
Notes:
(1) The China Risk Oriented Solvency System which was not implemented at the valuation date has not been applied.
(2) The assumed level of required capital for AIA Hong Kong is also used for the branches of AIA Co. and AIA International in the calculation of the consolidated EV Results.
FINANCIAL STATEMENTS
| AIA GROUP LIMITED262
SUPPLEMENTARY EMBEDDED VALUE INFORMATION
5. ASSUMPTIONS5.1 IntroductionThis section summarises the assumptions used by the Group to determine the EV as at 30 November 2015 and the VONB for the year
ended 30 November 2015 and highlights certain differences in assumptions between the EV as at 30 November 2014 and the EV as at
30 November 2015.
5.2 Economic AssumptionsInvestment returns
The Group has set the assumed long-term future returns for fixed income assets to reflect its view of expected returns having regard
to historical returns, estimates of long-term forward rates from yields available on government bonds and current bond yields. In
determining returns on fixed income assets the Group allows for the risk of default, and this allowance varies by the credit rating of
the underlying asset.
Where long-term views of investment return assumptions differ from current market yields on existing fixed income assets such that
there would be a significant impact on value, an adjustment was made to make some allowance for the current market yields. In these
cases, in calculating the VIF, adjustments have been made to the investment return assumptions such that the investment returns on
existing fixed income assets were set consistently with the current market yield on these assets for their full remaining term, to be
consistent with the valuation of the assets backing the policy liabilities.
The Group has set the equity return assumptions by reference to the return on 10-year government bonds, allowing for an internal
assessment of equity risk premia that vary by territory.
For each Business Unit, the non-linked portfolio is divided into a number of distinct product groups, and the returns for each of these
product groups have been derived by considering current and future targeted asset allocations and associated investment returns for
major asset classes.
For unit-linked business, fund growth assumptions have been determined based on actual fund mixes at the valuation date and
expected long-term returns for major asset classes.
Risk discount rates
The risk discount rates for each Business Unit can be considered as the sum of the appropriate risk-free interest rate, to reflect the
time value of money, and a risk margin to make allowance for the risk profile of the business.
The Group has generally set the risk discount rates to be equal to the estimated cost of equity capital for each Business Unit within the
Group. The cost of equity capital is derived using an estimated long-term risk-free interest rate, an equity risk premium and a market
risk factor. In some cases, adjustments have been made to reflect territorial or Business Unit-specific factors.
The table below summarises the risk discount rates and assumed long-term investment returns for the major asset classes for each
Business Unit as at 30 November 2015. The investment returns on existing fixed income assets were set consistently with the market
yields on these assets. Note that VONB results were calculated based on start-of-quarter economic assumptions consistent with
the measurement at the point of sale. The same risk discount rates were used for all the EV Results shown in Section 1 and Section
2 of this report. In particular, for the branches of AIA Co. and AIA International, the consolidated EV Results reflecting the Hong
Kong reserving and capital requirements were calculated using the branch-specific risk discount rates shown in the table below.
The present value of unallocated Group Office expenses was calculated using the AIA Hong Kong risk discount rate. The investment
returns shown are gross of tax and investment expenses.
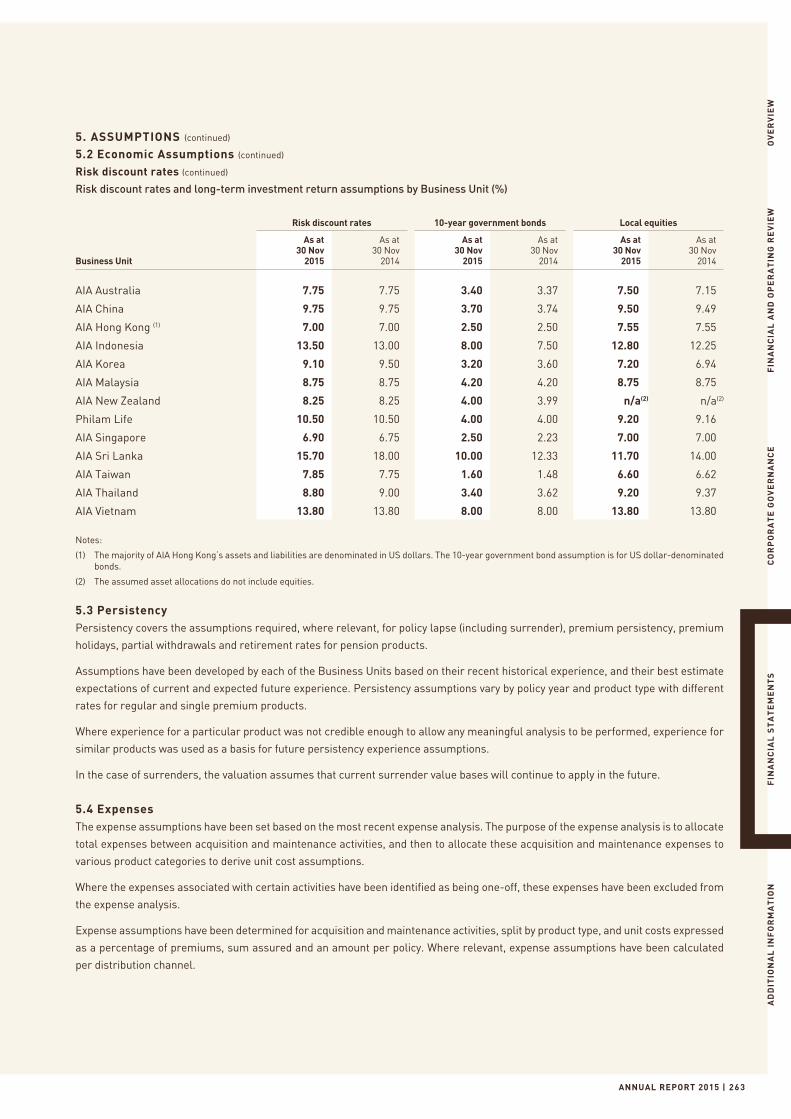
ANNUAL REPORT 2015 | 263
OV
ER
VIE
WF
INA
NC
IAL
AN
D O
PE
RA
TIN
G R
EV
IEW
CO
RP
OR
AT
E G
OV
ER
NA
NC
EF
INA
NC
IAL
ST
AT
EM
EN
TS
AD
DIT
ION
AL
IN
FO
RM
AT
ION
5. ASSUMPTIONS (continued)
5.2 Economic Assumptions (continued)
Risk discount rates (continued)
Risk discount rates and long-term investment return assumptions by Business Unit (%)
Risk discount rates 10-year government bonds Local equities
Business Unit
As at 30 Nov
2015
As at 30 Nov
2014
As at 30 Nov
2015
As at 30 Nov
2014
As at 30 Nov
2015
As at 30 Nov
2014
AIA Australia 7.75 7.75 3.40 3.37 7.50 7.15
AIA China 9.75 9.75 3.70 3.74 9.50 9.49
AIA Hong Kong (1) 7.00 7.00 2.50 2.50 7.55 7.55
AIA Indonesia 13.50 13.00 8.00 7.50 12.80 12.25
AIA Korea 9.10 9.50 3.20 3.60 7.20 6.94
AIA Malaysia 8.75 8.75 4.20 4.20 8.75 8.75
AIA New Zealand 8.25 8.25 4.00 3.99 n/a(2) n/a(2)
Philam Life 10.50 10.50 4.00 4.00 9.20 9.16
AIA Singapore 6.90 6.75 2.50 2.23 7.00 7.00
AIA Sri Lanka 15.70 18.00 10.00 12.33 11.70 14.00
AIA Taiwan 7.85 7.75 1.60 1.48 6.60 6.62
AIA Thailand 8.80 9.00 3.40 3.62 9.20 9.37
AIA Vietnam 13.80 13.80 8.00 8.00 13.80 13.80
Notes:
(1) The majority of AIA Hong Kong’s assets and liabilities are denominated in US dollars. The 10-year government bond assumption is for US dollar-denominated bonds.
(2) The assumed asset allocations do not include equities.
5.3 PersistencyPersistency covers the assumptions required, where relevant, for policy lapse (including surrender), premium persistency, premium
holidays, partial withdrawals and retirement rates for pension products.
Assumptions have been developed by each of the Business Units based on their recent historical experience, and their best estimate
expectations of current and expected future experience. Persistency assumptions vary by policy year and product type with different
rates for regular and single premium products.
Where experience for a particular product was not credible enough to allow any meaningful analysis to be performed, experience for
similar products was used as a basis for future persistency experience assumptions.
In the case of surrenders, the valuation assumes that current surrender value bases will continue to apply in the future.
5.4 ExpensesThe expense assumptions have been set based on the most recent expense analysis. The purpose of the expense analysis is to allocate
total expenses between acquisition and maintenance activities, and then to allocate these acquisition and maintenance expenses to
various product categories to derive unit cost assumptions.
Where the expenses associated with certain activities have been identified as being one-off, these expenses have been excluded from
the expense analysis.
Expense assumptions have been determined for acquisition and maintenance activities, split by product type, and unit costs expressed
as a percentage of premiums, sum assured and an amount per policy. Where relevant, expense assumptions have been calculated
per distribution channel.
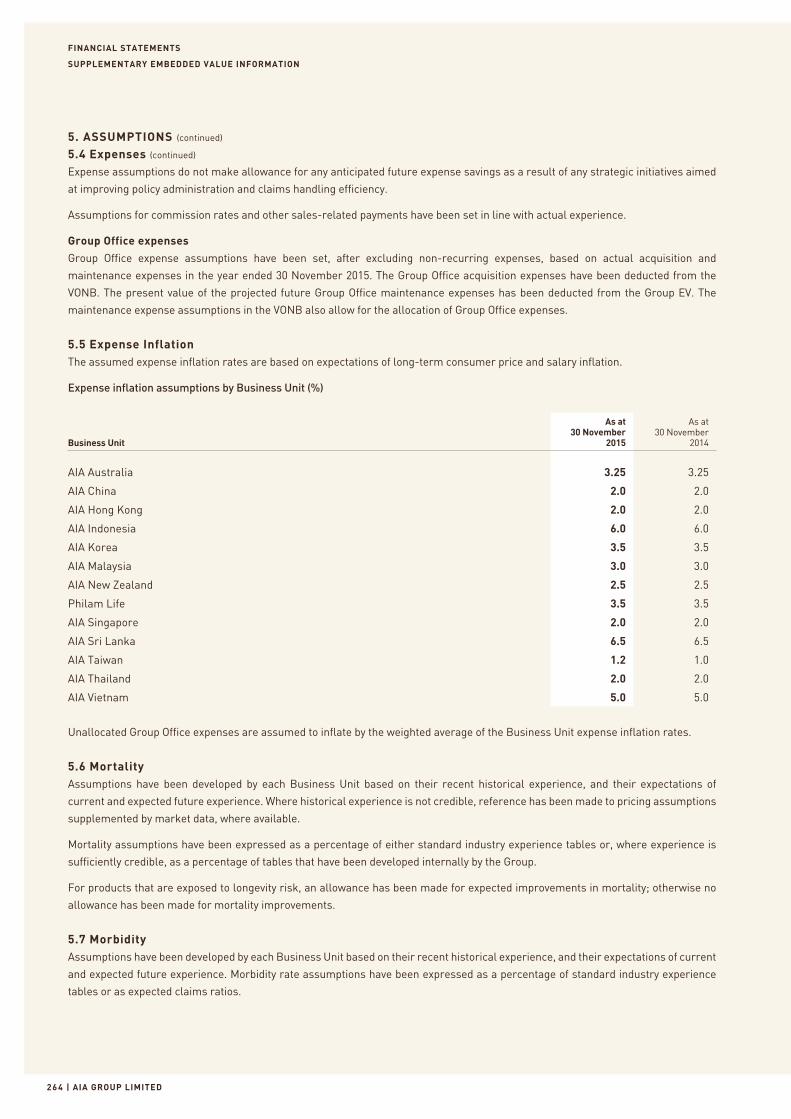
FINANCIAL STATEMENTS
| AIA GROUP LIMITED26 4
SUPPLEMENTARY EMBEDDED VALUE INFORMATION
5. ASSUMPTIONS (continued)
5.4 Expenses (continued)
Expense assumptions do not make allowance for any anticipated future expense savings as a result of any strategic initiatives aimed
at improving policy administration and claims handling efficiency.
Assumptions for commission rates and other sales-related payments have been set in line with actual experience.
Group Office expenses
Group Office expense assumptions have been set, after excluding non-recurring expenses, based on actual acquisition and
maintenance expenses in the year ended 30 November 2015. The Group Office acquisition expenses have been deducted from the
VONB. The present value of the projected future Group Office maintenance expenses has been deducted from the Group EV. The
maintenance expense assumptions in the VONB also allow for the allocation of Group Office expenses.
5.5 Expense InflationThe assumed expense inflation rates are based on expectations of long-term consumer price and salary inflation.
Expense inflation assumptions by Business Unit (%)
Business Unit
As at 30 November
2015
As at 30 November
2014
AIA Australia 3.25 3.25
AIA China 2.0 2.0
AIA Hong Kong 2.0 2.0
AIA Indonesia 6.0 6.0
AIA Korea 3.5 3.5
AIA Malaysia 3.0 3.0
AIA New Zealand 2.5 2.5
Philam Life 3.5 3.5
AIA Singapore 2.0 2.0
AIA Sri Lanka 6.5 6.5
AIA Taiwan 1.2 1.0
AIA Thailand 2.0 2.0
AIA Vietnam 5.0 5.0
Unallocated Group Office expenses are assumed to inflate by the weighted average of the Business Unit expense inflation rates.
5.6 MortalityAssumptions have been developed by each Business Unit based on their recent historical experience, and their expectations of
current and expected future experience. Where historical experience is not credible, reference has been made to pricing assumptions
supplemented by market data, where available.
Mortality assumptions have been expressed as a percentage of either standard industry experience tables or, where experience is
sufficiently credible, as a percentage of tables that have been developed internally by the Group.
For products that are exposed to longevity risk, an allowance has been made for expected improvements in mortality; otherwise no
allowance has been made for mortality improvements.
5.7 MorbidityAssumptions have been developed by each Business Unit based on their recent historical experience, and their expectations of current
and expected future experience. Morbidity rate assumptions have been expressed as a percentage of standard industry experience
tables or as expected claims ratios.
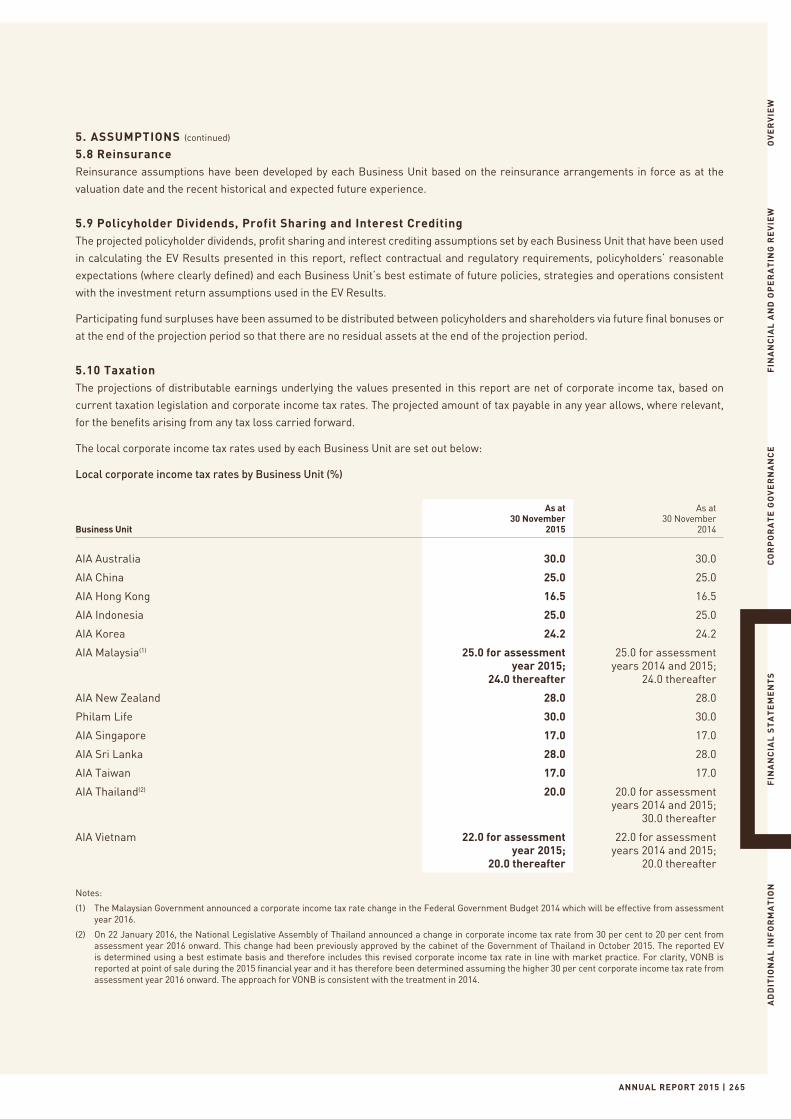
ANNUAL REPORT 2015 | 265
OV
ER
VIE
WF
INA
NC
IAL
AN
D O
PE
RA
TIN
G R
EV
IEW
CO
RP
OR
AT
E G
OV
ER
NA
NC
EF
INA
NC
IAL
ST
AT
EM
EN
TS
AD
DIT
ION
AL
IN
FO
RM
AT
ION
5. ASSUMPTIONS (continued)
5.8 ReinsuranceReinsurance assumptions have been developed by each Business Unit based on the reinsurance arrangements in force as at the
valuation date and the recent historical and expected future experience.
5.9 Policyholder Dividends, Profit Sharing and Interest CreditingThe projected policyholder dividends, profit sharing and interest crediting assumptions set by each Business Unit that have been used
in calculating the EV Results presented in this report, reflect contractual and regulatory requirements, policyholders’ reasonable
expectations (where clearly defined) and each Business Unit’s best estimate of future policies, strategies and operations consistent
with the investment return assumptions used in the EV Results.
Participating fund surpluses have been assumed to be distributed between policyholders and shareholders via future final bonuses or
at the end of the projection period so that there are no residual assets at the end of the projection period.
5.10 TaxationThe projections of distributable earnings underlying the values presented in this report are net of corporate income tax, based on
current taxation legislation and corporate income tax rates. The projected amount of tax payable in any year allows, where relevant,
for the benefits arising from any tax loss carried forward.
The local corporate income tax rates used by each Business Unit are set out below:
Local corporate income tax rates by Business Unit (%)
Business Unit
As at 30 November
2015
As at 30 November
2014
AIA Australia 30.0 30.0
AIA China 25.0 25.0
AIA Hong Kong 16.5 16.5
AIA Indonesia 25.0 25.0
AIA Korea 24.2 24.2
AIA Malaysia(1) 25.0 for assessmentyear 2015;
24.0 thereafter
25.0 for assessmentyears 2014 and 2015;
24.0 thereafter
AIA New Zealand 28.0 28.0
Philam Life 30.0 30.0
AIA Singapore 17.0 17.0
AIA Sri Lanka 28.0 28.0
AIA Taiwan 17.0 17.0
AIA Thailand(2) 20.0 20.0 for assessmentyears 2014 and 2015;
30.0 thereafter
AIA Vietnam 22.0 for assessmentyear 2015;
20.0 thereafter
22.0 for assessmentyears 2014 and 2015;
20.0 thereafter
Notes:
(1) The Malaysian Government announced a corporate income tax rate change in the Federal Government Budget 2014 which will be effective from assessment year 2016.
(2) On 22 January 2016, the National Legislative Assembly of Thailand announced a change in corporate income tax rate from 30 per cent to 20 per cent from assessment year 2016 onward. This change had been previously approved by the cabinet of the Government of Thailand in October 2015. The reported EV is determined using a best estimate basis and therefore includes this revised corporate income tax rate in line with market practice. For clarity, VONB is reported at point of sale during the 2015 financial year and it has therefore been determined assuming the higher 30 per cent corporate income tax rate from assessment year 2016 onward. The approach for VONB is consistent with the treatment in 2014.

FINANCIAL STATEMENTS
| AIA GROUP LIMITED266
SUPPLEMENTARY EMBEDDED VALUE INFORMATION
5. ASSUMPTIONS (continued)
5.10 Taxation (continued)
The tax assumptions used in the valuation reflect the local corporate income tax rates set out above. Where applicable, tax payable on
investment income has been reflected in projected investment returns.
The EV of the Group as at 30 November 2015 is calculated after deducting any remittance taxes payable on the anticipated distribution
of both the ANW and VIF.
Where territories have an imputation credit system in place, e.g. Australia, no allowance has been made for the value of the imputation
credits in the results shown in this report.
5.11 Statutory Valuation BasesThe projection of regulatory liabilities at future points in time assumes the continuation of the reserving methodologies used to value
policyholder liabilities as at the valuation date.
The reserving basis under the China Risk Oriented Solvency System which was not implemented at the valuation date has not been
applied.
On 10 June 2015, the Insurance Commission of the Republic of the Philippines issued a circular letter to the insurance industry
announcing changes to the reserving basis which has been reflected in the EV of Philam Life as at 30 November 2015.
5.12 Product ChargesManagement fees and product charges reflected in the VIF and VONB have been assumed to follow existing scales.
5.13 Foreign ExchangeThe EV as at 30 November 2015 and 30 November 2014 have been translated into US dollars using exchange rates as at each valuation
date. The VONB results shown in this report have been translated into US dollars using the corresponding average exchange rates
for each quarter. The other components of the EV profit shown in the analysis of movement in EV have been translated using average
exchange rates for the period.
6. EVENTS AFTER THE REPORTING PERIODOn 3 December 2015, the Financial Supervisory Commission of Taiwan announced changes to the Risk-Based Capital requirement.
These changes are effective 31 December 2015. The impact is not expected to be significant.
On 7 December 2015, the Group announced an agreement, under which the Group will increase its shareholding in Tata AIA Life
Insurance Company Limited from the current level of 26 per cent to 49 per cent. The completion of the transaction is subject to
securing all necessary regulatory and governmental approvals.
On 15 December 2015, the Insurance Board of Sri Lanka announced the implementation of the Risk-Based Capital requirement,
effective 1 January 2016. The impact is not expected to be significant.
On 25 January 2016, the China Insurance Regulatory Commission announced the implementation of the China Risk Oriented Solvency
System, effective 1 January 2016.
On 25 February 2016, the Board of Directors proposed a final dividend of 51.00 Hong Kong cents per share (2014: 34.00 Hong Kong
cents per share).
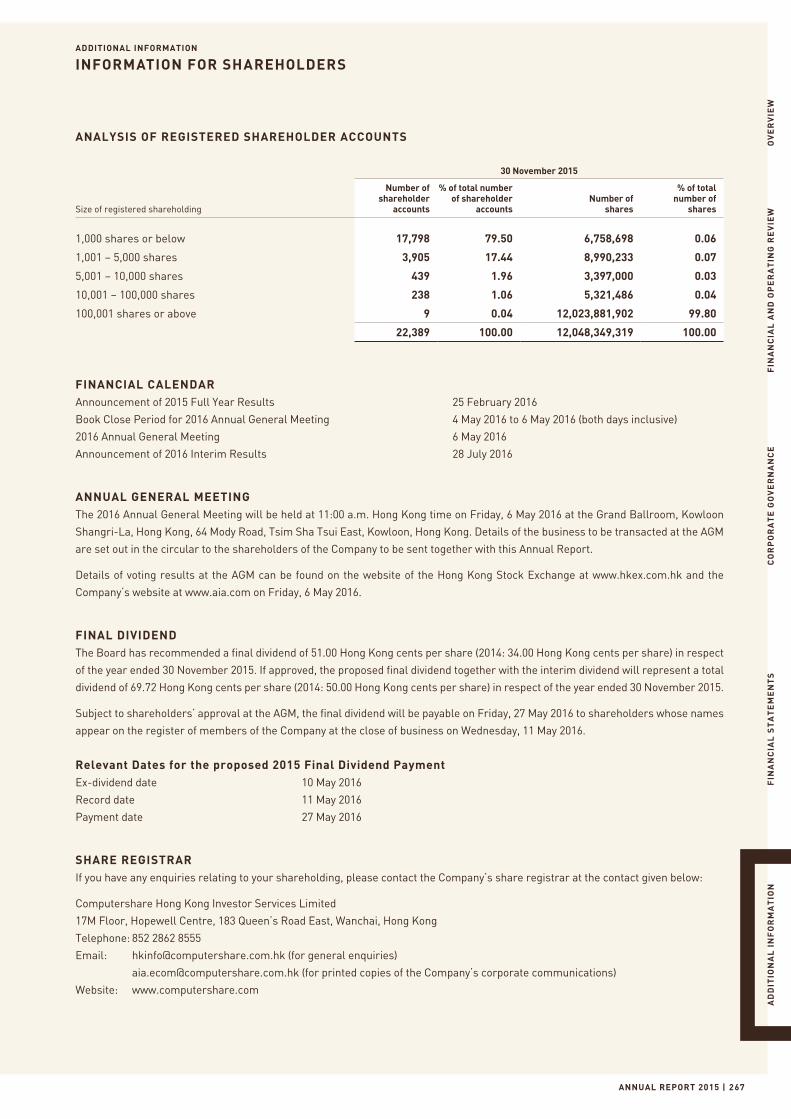
ADDITIONAL INFORMATION
ANNUAL REPORT 2015 | 267
INFORMATION FOR SHAREHOLDERS
OV
ER
VIE
WF
INA
NC
IAL
AN
D O
PE
RA
TIN
G R
EV
IEW
CO
RP
OR
AT
E G
OV
ER
NA
NC
EF
INA
NC
IAL
ST
AT
EM
EN
TS
AD
DIT
ION
AL
IN
FO
RM
AT
ION
ANALYSIS OF REGISTERED SHAREHOLDER ACCOUNTS
30 November 2015
Size of registered shareholding
Number ofshareholder
accounts
% of total numberof shareholder
accountsNumber of
shares
% of totalnumber of
shares
1,000 shares or below 17,798 79.50 6,758,698 0.06
1,001 – 5,000 shares 3,905 17.44 8,990,233 0.07
5,001 – 10,000 shares 439 1.96 3,397,000 0.03
10,001 – 100,000 shares 238 1.06 5,321,486 0.04
100,001 shares or above 9 0.04 12,023,881,902 99.80
22,389 100.00 12,048,349,319 100.00
FINANCIAL CALENDARAnnouncement of 2015 Full Year Results 25 February 2016
Book Close Period for 2016 Annual General Meeting 4 May 2016 to 6 May 2016 (both days inclusive)
2016 Annual General Meeting 6 May 2016
Announcement of 2016 Interim Results 28 July 2016
ANNUAL GENERAL MEETINGThe 2016 Annual General Meeting will be held at 11:00 a.m. Hong Kong time on Friday, 6 May 2016 at the Grand Ballroom, Kowloon
Shangri-La, Hong Kong, 64 Mody Road, Tsim Sha Tsui East, Kowloon, Hong Kong. Details of the business to be transacted at the AGM
are set out in the circular to the shareholders of the Company to be sent together with this Annual Report.
Details of voting results at the AGM can be found on the website of the Hong Kong Stock Exchange at www.hkex.com.hk and the
Company’s website at www.aia.com on Friday, 6 May 2016.
FINAL DIVIDENDThe Board has recommended a final dividend of 51.00 Hong Kong cents per share (2014: 34.00 Hong Kong cents per share) in respect
of the year ended 30 November 2015. If approved, the proposed final dividend together with the interim dividend will represent a total
dividend of 69.72 Hong Kong cents per share (2014: 50.00 Hong Kong cents per share) in respect of the year ended 30 November 2015.
Subject to shareholders’ approval at the AGM, the final dividend will be payable on Friday, 27 May 2016 to shareholders whose names
appear on the register of members of the Company at the close of business on Wednesday, 11 May 2016.
Relevant Dates for the proposed 2015 Final Dividend PaymentEx-dividend date 10 May 2016
Record date 11 May 2016
Payment date 27 May 2016
SHARE REGISTRARIf you have any enquiries relating to your shareholding, please contact the Company’s share registrar at the contact given below:
Computershare Hong Kong Investor Services Limited
17M Floor, Hopewell Centre, 183 Queen’s Road East, Wanchai, Hong Kong
Telephone: 852 2862 8555
Email: [email protected] (for general enquiries)
[email protected] (for printed copies of the Company’s corporate communications)
Website: www.computershare.com
ADDITIONAL INFORMATION
| AIA GROUP LIMITED268
INFORMATION FOR SHAREHOLDERS
ANNUAL REPORT AND ELECTRONIC COMMUNICATIONSThis Annual Report is printed in English and Chinese and is available on the website of the Company. If you would like to have a printed
version of this Annual Report, please contact the Company’s share registrar using the contact details given above.
The Company makes every effort to ensure consistency between the Chinese and English version of this Annual Report. However, in
the event of any inconsistency, the English version shall prevail.
For environmental and cost reasons, shareholders are encouraged to elect to receive shareholder documents electronically. You may
at any time send written notice to the Company c/o the Company’s share registrar or via email at [email protected]
specifying your name, address and request to change your choice of language or means of receipt of all shareholder documents.
INVESTMENT COMMUNITY AND NEWS MEDIAEnquiries may be directed to:
Investment Community News Media
Paul Lloyd +852 2832 6160 Stephen Thomas +852 2832 6178
Yan Guo +852 2832 1878 Emerald Ng +852 2832 4720
Feon Lee +852 2832 4704
Joel Lieginger +852 2832 4703
FORWARD-LOOKING STATEMENTSThis document contains certain forward-looking statements relating to the Group that are based on the beliefs of the Group’s
management as well as assumptions made by and information currently available to the Group’s management. These forward-looking
statements are, by their nature, subject to significant risks and uncertainties. These forward-looking statements include, without
limitation, statements relating to the Group’s business prospects, future developments, trends and conditions in the industry and
geographical markets in which the Group operates, its strategies, plans, objectives and goals, its ability to control costs, statements
relating to prices, volumes, operations, margins, overall market trends, risk management and exchange rates.
When used in this document, the words “anticipate”, “believe”, “could”, “estimate”, “expect”, “going forward”, “intend”, “may”, “ought
to”, “plan”, “project”, “seek”, “should”, “will”, “would” and similar expressions, as they relate to the Group or the Group’s management,
are intended to identify forward-looking statements. These forward-looking statements reflect the Group’s views as of the date hereof
with respect to future events and are not a guarantee of future performance or developments. You are strongly cautioned that reliance
on any forward-looking statements involves known and unknown risks and uncertainties. Actual results and events may differ
materially from information contained in the forward-looking statements as a result of a number of factors, including any changes in
the laws, rules and regulations relating to any aspects of the Group’s business operations, general economic, market and business
conditions, including capital market developments, changes or volatility in interest rates, foreign exchange rates, equity prices or
other rates or prices, the actions and developments of the Group’s competitors and the effects of competition in the insurance industry
on the demand for, and price of, the Group’s products and services, various business opportunities that the Group may or may not
pursue, changes in population growth and other demographic trends, including mortality, morbidity and longevity rates, persistency
levels, the Group’s ability to identify, measure, monitor and control risks in the Group’s business, including its ability to manage and
adapt its overall risk profile and risk management practices, its ability to properly price its products and services and establish
reserves for future policy benefits and claims, seasonal fluctuations and factors beyond the Group’s control. Subject to the requirements
of the Listing Rules, the Group does not intend to update or otherwise revise the forward-looking statements in this document,
whether as a result of new information, future events or otherwise. As a result of these and other risks, uncertainties and assumptions,
the forward-looking events and circumstances discussed in this document might not occur in the way the Group expects, or at all.
Accordingly, you should not place undue reliance on any forward-looking information or statements. All forward-looking statements
in this document are qualified by reference to the cautionary statements set forth in this section.
ADDITIONAL INFORMATION
ANNUAL REPORT 2015 | 269
CORPORATE INFORMATION
OV
ER
VIE
WF
INA
NC
IAL
AN
D O
PE
RA
TIN
G R
EV
IEW
CO
RP
OR
AT
E G
OV
ER
NA
NC
EF
INA
NC
IAL
ST
AT
EM
EN
TS
AD
DIT
ION
AL
IN
FO
RM
AT
ION
BOARD OF DIRECTORS
Non-executive Chairman and Non-executive DirectorMr. Edmund Sze-Wing Tse
Executive Director, Group Chief Executive and PresidentMr. Mark Edward Tucker
Independent Non-executive DirectorsMr. Jack Chak-Kwong So
Mr. Chung-Kong Chow
Mr. John Barrie Harrison
Mr. George Yong-Boon Yeo
Mr. Mohamed Azman Yahya
Professor Lawrence Juen-Yee Lau
Ms. Swee-Lian Teo
Dr. Narongchai Akrasanee
Audit CommitteeMr. John Barrie Harrison (Chairman)
Mr. Jack Chak-Kwong So
Mr. George Yong-Boon Yeo
Dr. Narongchai Akrasanee
Nomination CommitteeMr. Edmund Sze-Wing Tse (Chairman)
Mr. Jack Chak-Kwong So
Mr. Chung-Kong Chow
Mr. John Barrie Harrison
Mr. George Yong-Boon Yeo
Mr. Mohamed Azman Yahya
Professor Lawrence Juen-Yee Lau
Ms. Swee-Lian Teo
Dr. Narongchai Akrasanee
Remuneration CommitteeMr. Jack Chak-Kwong So (Chairman)
Mr. George Yong-Boon Yeo
Mr. Mohamed Azman Yahya
Mr. Edmund Sze-Wing Tse
Risk CommitteeMr. Chung-Kong Chow (Chairman)
Mr. John Barrie Harrison
Professor Lawrence Juen-Yee Lau
Ms. Swee-Lian Teo
Mr. Edmund Sze-Wing Tse
Mr. Mark Edward Tucker
Registered Office35/F, AIA Central
No. 1 Connaught Road Central
Hong Kong
Websitewww.aia.com
Company SecretaryMr. Mitchell New
Authorised RepresentativesMr. Mark Edward Tucker
Mr. Mitchell New
Share RegistrarComputershare Hong Kong Investor Services Limited
17M Floor
Hopewell Centre
183 Queen’s Road East, Wanchai
Hong Kong
Principal BankersThe Hongkong and Shanghai Banking Corporation Limited
Citibank, N.A.
Standard Chartered Bank
AuditorPricewaterhouseCoopers
Certified Public Accountants
ADDITIONAL INFORMATION
| AIA GROUP LIMITED270
GLOSSARY
Accident and health (A&H) insurance products
A&H insurance products provide morbidity or sickness benefits and include health, disability, critical illness and accident cover. A&H insurance products are sold both as stand-alone policies and as riders that can be attached to our individual life insurance policies.
Acquisition cost (of a financial instrument)
The amount of cash or cash equivalents paid or the fair value of other consideration provided, in order to acquire an asset at the date of its acquisition.
Active agent An agent who sells at least one policy per month.
Active market A market in which all the following conditions exist:
• the items traded within the market are homogeneous;
• willing buyers and sellers can normally be found at any time; and
• prices are available to the public.
A financial instrument is regarded as quoted in an active market if quoted prices are readily and regularly available from an exchange, dealer, broker, industry group, pricing service or regulatory agency, and those prices represent actual and regularly occurring market transactions on an arm’s length basis.
Adjusted net worth (ANW) ANW is the market value of assets in excess of the assets backing the policy reserves and other liabilities of the life (and similar) business of AIA, plus the IFRS equity value of other activities, such as general insurance business, less the value of intangible assets. It excludes any amounts not attributable to shareholders of AIA Group Limited. The market value of investment property and property held for own use that is used to determine the ANW is based on the fair value disclosed in AIA’s IFRS financial statements as at the valuation date. It is AIA’s policy to obtain external property valuations annually except in the case of a discrete event occurring in the interim that has a significant impact on the fair value of the properties.
AER Actual exchange rates.
AGM 2016 Annual General Meeting of the Company to be held at 11:00 a.m. Hong Kong time on Friday, 6 May 2016.
AIA or the Group AIA Group Limited and its subsidiaries.
AIA Co. AIA Company Limited, a subsidiary of the Company.
AIA International AIA International Limited, a subsidiary of AIA Co.
AIA Vitality A science-backed wellness programme that provides participants with the knowledge, tools and motivation to help them achieve their personal health goals. The programme is a partnership between AIA and Discovery Limited, a specialist insurer headquartered in South Africa.
AIG American International Group, Inc.
ALICO American Life Insurance Company.
Amortised cost The amount at which the financial asset or financial liability is measured at initial recognition minus principal repayments, plus or minus the cumulative amortisation using the effective interest method of any difference between the initial amount and the maturity amount, and minus any reduction for impairment or uncollectibility.
ANNUAL REPORT 2015 | 271
OV
ER
VIE
WF
INA
NC
IAL
AN
D O
PE
RA
TIN
G R
EV
IEW
CO
RP
OR
AT
E G
OV
ER
NA
NC
EF
INA
NC
IAL
ST
AT
EM
EN
TS
AD
DIT
ION
AL
IN
FO
RM
AT
ION
Annualised new premiums (ANP) ANP represents 100 per cent of annualised first year premiums and 10 per cent of single premiums, before reinsurance ceded. It is an internally used measure of new business sales or activity for all entities within AIA. ANP excludes new business of pension business, personal lines and motor insurance.
Annuity A savings product where the accumulated amount can be paid out to the customer in a variety of income streams.
ASPP Agency Share Purchase Plan.
Asset-liability management (ALM)
ALM is the management of the relative risk profiles of assets and liabilities.
Available for sale (AFS) financial assets
Financial assets that may be sold before maturity and that are used to back insurance and investment contract liabilities and shareholders’ equity, and which are not managed on a fair value basis. Non-derivative financial assets that are designated as available for sale or are not classified as loans and receivables or as at fair value through profit or loss. Available for sale financial instruments are measured at fair value, with movements in fair value recorded in other comprehensive income.
Bancassurance The distribution of insurance products through banks or other financial institutions.
CER Constant exchange rates. Change on constant exchange rates is calculated using constant average exchange rates for current year and prior year.
Common control A business combination involving entities under common control is a business combination in which all of the combining entities or businesses are ultimately controlled by the same party or parties both before and after the business combination.
Consolidated investment funds Investment funds in which the Group has interests and power to direct their relevant activities that affect the return of the funds.
Corporate Governance Code Corporate Governance Code set out in Appendix 14 to the Listing Rules.
Cost of capital (CoC) CoC is calculated as the face value of the required capital as at the valuation date less the present value of the net-of-tax investment return on the shareholder assets backing the required capital and the present value of projected releases from the assets backing the required capital. Where the required capital may be covered by policyholder assets such as surplus assets in participating funds, there is no associated cost of capital included in the VIF or VONB.
Credit risk The risk that third parties fail to meet their obligations to the Group when they fall due.
Deferred acquisition costs (DAC)
DAC are expenses of an insurer which are incurred in connection with the acquisition of new insurance contracts or the renewal of existing insurance contracts. They include commissions and other variable sales inducements and the direct costs of issuing the policy, such as underwriting and other policy issue expenses. These costs are deferred and expensed to the consolidated income statement on a systematic basis over the life of the policy. DAC assets are tested for recoverability at least annually.
Deferred origination costs (DOC)
Origination costs are expenses which are incurred in connection with the origination of new investment contracts or the renewal of existing investment contracts. For contracts that involve the provision of investment management services, these include commissions and other incremental expenses directly related to the issue of each new contract. Origination costs on contracts with investment management services are deferred and recognised as an asset in the consolidated statement of financial position and expensed to the consolidated income statement on a systematic basis in line with the revenue generated by the investment management services provided. Such assets are tested for recoverability.
ADDITIONAL INFORMATION
| AIA GROUP LIMITED272
GLOSSARY
Defined benefit plans Post-employment benefit plans under which amounts to be paid or services to be provided as post-retirement benefits are determined by reference to a formula usually based on employees’ earnings and/or years of service.
Defined contribution plans Post-employment benefit plans under which amounts to be paid as post-retirement benefits are determined by contributions to a fund together with earnings thereon. The Group has no legal or constructive obligation to pay further contributions if the fund does not hold sufficient assets to pay the post-retirement benefits.
Discretionary participation features (DPF)
A contractual right to receive, as a supplement to guaranteed benefits, additional benefits or bonuses:
• that are likely to be a significant portion of the total contractual benefits;
• whose amount or timing is contractually at the discretion of the Group; and
• that are contractually based on:
– the performance of a specified pool of contracts or a specified type of contract;
– realised and/or unrealised investment returns on a specified pool of assets held by the issuer; or
– the profit or loss of the Company, fund or other entity that issues the contract.
Effective interest method A method of calculating the amortised cost of a financial asset or financial liability and of allocating the interest income or expense over the relevant period. The effective interest rate is the rate that exactly discounts future cash payments or receipts through the expected life of the financial instrument, or when appropriate, a shorter period, to the net carrying value of the financial asset or financial liability.
Embedded value (EV) An actuarially determined estimate of the economic value of a life insurance business based on a particular set of assumptions as to future experience, excluding any economic value attributable to future new business.
EPS Earnings per share.
Equity attributable to shareholders of the Company on the embedded value basis (EV Equity)
EV Equity is the total of embedded value, goodwill and other intangible assets attributable to shareholders of the Company.
ESPP Employee Share Purchase Plan.
ExCo The Executive Committee of the Group.
Fair value The amount for which an asset could be exchanged, or a liability settled, between knowledgeable, willing parties in an arm’s length transaction.
Fair value through profit or loss (FVTPL)
Financial assets that are held to back unit-linked contracts and participating funds or financial assets and liabilities that are held for trading. A financial asset or financial liability that is measured at fair value in the statement of financial position with gains and losses arising from movements in fair value being presented in the consolidated income statement as a component of the profit or loss for the year.
Financial liquidity risk The risk that insufficient cash is available to meet payment obligations to counterparties as they fall due.
First year premiums First year premiums are premiums received in the first year of a recurring premium policy, and include the amount of premiums that is expected to be required to provide insurance coverage until maturity.
ANNUAL REPORT 2015 | 273
OV
ER
VIE
WF
INA
NC
IAL
AN
D O
PE
RA
TIN
G R
EV
IEW
CO
RP
OR
AT
E G
OV
ER
NA
NC
EF
INA
NC
IAL
ST
AT
EM
EN
TS
AD
DIT
ION
AL
IN
FO
RM
AT
ION
Foreign exchange rate risk The risk that the Company’s value may be affected by changes in exchange rates.
FRC Financial Risk Committee.
Free surplus ANW in excess of the required capital.
Functional currency The currency of the primary economic environment in which the entity operates.
GAMA International A worldwide association serving the professional development needs of field leaders in the insurance, investment and financial services industry.
Goodwill Goodwill represents the excess of the purchase price of an acquisition over the fair value of the Group’s share of the net identifiable assets including VOBA of the acquired subsidiary, associate or joint venture at the date of acquisition.
Group insurance An insurance scheme whereby individual participants are covered by a master contract held by a single group or entity on their behalf.
Group Office Group Office includes the activities of the Group Corporate Centre segment consisting of the Group’s corporate functions, shared services and eliminations of intragroup transactions.
HIBOR Hong Kong Interbank Offered Rate.
HKFRS Hong Kong Financial Reporting Standards.
HKOCI Hong Kong Office of the Commissioner of Insurance.
Hong Kong The Hong Kong Special Administrative Region of the PRC; in the context of our reportable segments, Hong Kong includes Macau.
Hong Kong Companies Ordinance A substantial part of the Companies Ordinance (Laws of Hong Kong, Chapter 622) which came into force on 3 March 2014.
Hong Kong Insurance Companies Ordinance (HKICO)
The Insurance Companies Ordinance (Laws of Hong Kong, Chapter 41) (HKICO) provides a legislative framework for the prudential supervision of the insurance industry in Hong Kong. The objectives of the HKICO are to protect the interests of the insuring public and to promote the general stability of the insurance industry.
Hong Kong Stock Exchange (HKSE)
The Stock Exchange of Hong Kong Limited.
IAS International Accounting Standards.
IASB International Accounting Standards Board.
IFA Independent financial adviser.
ADDITIONAL INFORMATION
| AIA GROUP LIMITED274
GLOSSARY
IFRS Standards and interpretations adopted by the International Accounting Standards Board (IASB) comprising:
• International Financial Reporting Standards;
• International Accounting Standards; and
• Interpretations developed by the IFRS Interpretations Committee (IFRS IC) or the former Standing Interpretations Committee (SIC).
ING Malaysia ING Management Holdings (Malaysia) Sdn. Bhd.
Insurance contract A contract under which the insurer accepts significant insurance risk from the policyholder by agreeing to compensate the policyholder if specified uncertain future events adversely affect the policyholder.
Insurance risk The potential loss resulting from mortality, morbidity, persistency, longevity and adverse expense experiences. Under IFRS, insurance risk means risk, other than financial risk, transferred from the holder of a contract to the issuer.
Interactive Mobile Office (iMO) iMO is a mobile office platform with a comprehensive suite of applications that allow agents and agency leaders to manage their daily activities from lead generation, sales productivity and recruitment activity through to development training and customer analytics.
Interactive Point of Sale (iPoS) iPoS is a secure, mobile point-of-sale technology that features a paperless sales process from the completion of the customer’s financial-needs analysis to proposal generation with electronic biometric signature of life insurance applications on tablet devices.
Investment contract An investment contract is an insurance policy that, whilst structured and regulated as a contract of insurance, does not meet the accounting definition of an insurance contract because it does not transfer significant insurance risk.
Investment experience Realised and unrealised investment gains and losses recognised in the consolidated income statement.
Investment income Investment income comprises interest income, dividend income and rental income.
Investment liquidity risk The risk that the Group will be unable to buy and sell securities. This is a function of the size of the Group’s holdings relative to the availability of counterparties willing to buy or sell these holdings at any given time. In times of stress, market losses will generally be compounded by forced sellers seeking unwilling buyers.
Investment property Property (land and/or a building or part of a building) held to earn rentals or for capital appreciation or both rather than for own use by AIA.
Investment return Investment return consists of investment income plus investment experience.
IPO Initial public offering.
Lapse risk The risk that, having purchased an insurance policy from AIA, customers either surrender the policy or cease paying premiums on it and so the expected stream of future premiums ceases. Lapse risk is taken into account in formulating projections of future premium revenues, for example when testing for liability adequacy and the recoverability of deferred acquisition and origination costs.
ANNUAL REPORT 2015 | 275
OV
ER
VIE
WF
INA
NC
IAL
AN
D O
PE
RA
TIN
G R
EV
IEW
CO
RP
OR
AT
E G
OV
ER
NA
NC
EF
INA
NC
IAL
ST
AT
EM
EN
TS
AD
DIT
ION
AL
IN
FO
RM
AT
ION
Liability adequacy testing An assessment of whether the carrying amount of an insurance liability needs to be increased or the carrying amount of related deferred acquisition and origination costs or related intangible assets decreased based on a review of future cash flows.
Life Insurance and Market Research Association (LIMRA)
A worldwide research, consulting and professional development organisation, established to help its member companies from life insurance and financial services industries improve their marketing and distribution effectiveness.
Liquidity risk A general term for the risks that companies may be unable to meet their obligations to counterparties as they fall due or to buy and sell securities as required. See also financial liquidity risk and investment liquidity risk.
Listing Rules Rules Governing the Listing of Securities on The Stock Exchange of Hong Kong Limited.
Market risk The risk of financial loss from adverse movements in the value of assets owing to market factors, including changes in interest and foreign exchange rates, as well as movements in the spread of credit instruments to corresponding government bonds, or credit spread risk, and in equity and property prices.
Million Dollar Round Table (MDRT)
MDRT is a global professional trade association of life insurance and financial services professionals that recognises significant sales achievements and high service standards.
Model Code Model Code for Securities Transactions by Directors of Listed Issuers set out in Appendix 10 to the Listing Rules.
Monetary items Units of currency held and assets and liabilities to be received or paid in a fixed or determinable number of units of currency.
Net book value The net value of an asset. Equal to its original cost (its book value) minus depreciation and amortisation.
Net funds to Group Corporate Centre
In presenting net capital in/(out) flows to reportable segments, capital outflows consist of dividends and profit distributions to the Group Corporate Centre segment and capital inflows consist of capital injections into reportable segments by the Group Corporate Centre segment. For the Group, net capital in/(out) flows reflect the net amount received from shareholders by way of capital contributions less amounts distributed by way of dividends.
Net profit Net profit is calculated by subtracting a company’s total expenses from total revenue, including share of profit/(loss) from associates and joint venture and after tax.
Non-controlling interests The equity in a subsidiary not attributable, directly or indirectly, to a parent. Also referred to as “minority interests”.
Non-participating life assurance Contracts of insurance with no DPF.
n/a Not available.
n/m Not meaningful.
OPAT Operating profit after tax attributable to shareholders of AIA Group Limited.
ADDITIONAL INFORMATION
| AIA GROUP LIMITED276
GLOSSARY
Operating profit before tax and after tax
The Group defines operating profit before and after tax as profit excluding investment experience; investment income and investment management expenses related to unit-linked contracts; corresponding changes in insurance and investment contract liabilities in respect of unit-linked contracts and participating funds; changes in third-party interests in consolidated investment funds; policyholders’ share of tax relating to changes in insurance and investment contract liabilities and other significant items of non-operating income and expenses.
Operating return on shareholders’ allocated equity
Operating return on shareholders’ allocated equity is calculated as operating profit after tax attributable to shareholders of the Company, expressed as a percentage of the simple average of opening and closing shareholders’ allocated equity.
Operating segment A component of an entity that:
• engages in business activities from which it may earn revenues and incur expenses;
• whose operating results are regularly reviewed by the entity’s chief operating decision-maker to make decisions about resources to be allocated to the segment and assess its performance; and
• for which discrete financial information is available.
Operational risk The risk of direct or indirect loss resulting from inadequate or failed internal processes, personnel and systems or from external events.
ORC Operational Risk Committee.
OTC Over-the-counter.
Other comprehensive income Items of income and expense that form part of total comprehensive income but, as required or permitted by IFRS, do not form part of profit or loss for the year, such as fair value gains and losses on available for sale financial assets.
Participating funds Participating funds are distinct portfolios where the policyholders have a contractual right to receive at the discretion of the insurer additional benefits based on factors such as the performance of a pool of assets held within the fund, as a supplement to any guaranteed benefits. The Group may either have discretion as to the timing of the allocation of those benefits to participating policyholders or may have discretion as to the timing and the amount of the additional benefits.
Participating policies Participating policies are contracts with DPF. Participating policies may either be written within participating funds or may be written within the Company’s general account, whereby the investment performance is determined for a group of assets or contracts, or by reference to the Company’s overall investment performance and other factors. The latter is referred to by the Group as “other participating business”. Whether participating policies are written within a separate participating fund or not largely depends on matters of local practice and regulation.
Persistency The percentage of insurance policies remaining in force from month to month in the past 12 months, as measured by premiums.
Philam Life The Philippine American Life and General Insurance (PHILAM LIFE) Company, a subsidiary of AIA Co.; in the context of the Supplementary Embedded Value Information, Philam Life includes BPI-Philam Life Assurance Corporation.
Policyholder and shareholder investments
Investments other than those held to back unit-linked contracts as well as assets from consolidated investment funds.
ANNUAL REPORT 2015 | 277
OV
ER
VIE
WF
INA
NC
IAL
AN
D O
PE
RA
TIN
G R
EV
IEW
CO
RP
OR
AT
E G
OV
ER
NA
NC
EF
INA
NC
IAL
ST
AT
EM
EN
TS
AD
DIT
ION
AL
IN
FO
RM
AT
ION
Policyholder dividends Policyholder dividends are the means of participating policyholders receiving the non-guaranteed element of the discretionary benefits, through which they participate in the investment return of the reference portfolio or pool of assets.
pps Percentage points.
PRC The People’s Republic of China.
Property held for own use Property held for own use in AIA’s business.
Protection gap The difference between the resources needed and resources available to maintain dependants’ living standards after the death of the primary wage-earner.
Puttable liabilities A puttable financial instrument is one in which the holder of the instrument has the right to put the instrument back to the issuer for cash (or another financial asset). Units in investment funds such as mutual funds and open-ended investment companies are typically puttable instruments. As these can be put back to the issuer for cash, the non-controlling interests in any such funds which have to be consolidated by AIA are treated as financial liabilities.
RAS Risk Appetite Statement.
Regulatory minimum capital Net assets held to meet the minimum solvency margin requirement set by the HKICO that an insurer must meet in order to be authorised to carry on insurance business in or from Hong Kong.
Related parties Related parties may be related to AIA for any of the following reasons:
• they are directly or indirectly controlled by an AIA entity;
• an AIA entity has significant influence on the party;
• they are in a joint venture arrangement with an AIA entity;
• they are part of AIA’s key management or a close member of the family of any key management or any entity that is controlled by these persons; or
• they are a post-retirement benefit plan for the employees of AIA.
Renewal premiums Premiums receivable in subsequent years of a recurring premium policy.
Repurchase agreements (repos)
A repurchase transaction involves the sale of financial investments by AIA to a counterparty, subject to a simultaneous agreement to repurchase those securities at a later date at an agreed price. Accordingly, for accounting purposes, the securities are retained on AIA’s consolidated statement of financial position for the life of the transaction, valued in accordance with AIA’s policy for assets of that nature. The proceeds of the transaction are reported in the caption “Obligations under securities lending and repurchase agreements”. Interest expense from repo transactions is reported within finance costs in the consolidated income statement.
Reverse repurchase agreements (reverse repos)
A reverse repurchase transaction (reverse repo) involves the purchase of financial investments with a simultaneous obligation to sell the assets at a future date, at an agreed price. Such transactions are reported within “Loans and deposits” in the consolidated statement of financial position. The interest income from reverse repo transactions is reported within investment return in the consolidated income statement.
Rider A supplemental plan that can be attached to a basic insurance policy, typically with payment of additional premiums.
ADDITIONAL INFORMATION
| AIA GROUP LIMITED278
GLOSSARY
Risk-adjusted return The return produced by an investment after accounting for the risks involved in producing that return.
Risk appetite Risk appetite is the amount of risk that companies are willing to take in order to achieve their business objectives.
Risk-Based Capital (RBC) RBC represents an amount of capital based on an assessment of risks that a company should hold to protect customers against adverse developments.
RMF Risk Management Framework.
RSU Scheme Restricted Share Unit Scheme.
RSUs Restricted share units.
Securities lending Securities lending consists of the loan of certain securities within the Group’s financial investments to third parties on a short-term basis. The loaned securities continue to be recognised within the appropriate financial investment classifications in the Group’s consolidated statement of financial position.
SFO The Securities and Futures Ordinance (Laws of Hong Kong, Chapter 571), as amended from time to time.
Shadow accounting Investment experience (realised and unrealised investment gains and losses) has a direct effect on the measurement of insurance contract liabilities and related deferred acquisition costs and intangible assets, such as VOBA (see below). Shadow accounting permits adjustments to insurance contract liabilities and the related assets to be reflected in other comprehensive income to match the extent to which unrealised investment gains and losses are recognised in other comprehensive income.
Shareholders’ allocated equity Shareholders’ allocated equity is total equity attributable to shareholders of the Company, less the fair value reserve and foreign currency translation reserve and others.
Singapore The Republic of Singapore; in the context of our reportable segments, Singapore includes Brunei.
Single premiums Single premiums are the lump sum payments from a policyholder, excluding first year premiums and renewal premiums.
SME Small-and-medium sized enterprise.
SO Scheme Share Option Scheme.
Solvency The ability of an insurance company to satisfy its policyholder benefits and claims obligations.
Solvency ratio The ratio of the total available capital to the regulatory minimum capital applicable to the insurer pursuant to relevant regulations.
Statement of financial position Formerly referred to as the balance sheet.
ANNUAL REPORT 2015 | 279
OV
ER
VIE
WF
INA
NC
IAL
AN
D O
PE
RA
TIN
G R
EV
IEW
CO
RP
OR
AT
E G
OV
ER
NA
NC
EF
INA
NC
IAL
ST
AT
EM
EN
TS
AD
DIT
ION
AL
IN
FO
RM
AT
ION
Strategic asset allocation (SAA) SAA is the setting of strategic asset allocation targets, based on long-term capital market assumptions, to meet long-term requirements of the insurance business and shareholders.
Strategic risk The adverse impacts from unexpected changes to the Group’s operating and market environment.
Stress tests The application of shocks to the assumptions underlying valuations. Stress tests are used to observe the resilience of the Company to stress events and the volatility of those valuations.
Takaful Islamic insurance which is based on the principles of mutual assistance and risk sharing.
The Company AIA Group Limited.
Total weighted premium income (TWPI)
TWPI consists of 100 per cent of renewal premiums, 100 per cent of first year premiums and 10 per cent of single premiums, before reinsurance ceded. As such it provides an indication of AIA’s longer-term business volumes as it smoothes the peaks and troughs in single premiums.
Underwriting The process of examining, accepting or rejecting insurance risks, and classifying those accepted, in order to charge an appropriate premium for each accepted risk.
Unit-linked investments Financial investments held to back unit-linked contracts.
Unit-linked products Unit-linked products are insurance products where the policy value is linked to the value of underlying investments (such as collective investment schemes, internal investment pools or other property) or fluctuations in the value of underlying investment or indices. Investment risk associated with the product is usually borne by the policyholder. Insurance coverage, investment and administration services are provided for which the charges are deducted from the investment fund assets. Benefits payable will depend on the price of the units prevailing at the time of death of the insured or surrender or maturity of the policy, subject to surrender charges.
Universal life A type of insurance product where the customer pays flexible premiums, subject to specified limits, which are accumulated in an account balance which are credited with interest at a rate either set by the insurer or reflecting returns on a pool of matching assets. The customer may vary the death benefit and the contract may permit the policyholder to withdraw the account balance, typically subject to a surrender charge.
Value of business acquired (VOBA)
VOBA in respect of a portfolio of long-term insurance and investment contracts acquired is recognised as an asset, calculated using discounted cash flow techniques, reflecting all future cash flows expected to be realised from the portfolio. VOBA is amortised over the estimated life of the contracts in the acquired portfolio on a systematic basis. The rate of amortisation reflects the profile of the additional value of the business acquired. The carrying value of VOBA is reviewed annually for impairment and any impairment is charged to the consolidated income statement.
Value of in-force business (VIF) VIF is the present value of projected after-tax statutory profits emerging in the future from the current in-force business less the cost arising from holding the required capital (CoC) to support the in-force business.

ADDITIONAL INFORMATION
| AIA GROUP LIMITED280
GLOSSARY
Value of new business (VONB) VONB is the present value, measured at the point of sale, of projected after-tax statutory profits emerging in the future from new business sold in the period less the cost of holding the required capital in excess of regulatory reserves to support this business. VONB for AIA is stated after adjustments to reflect additional Hong Kong reserving and capital requirements and the after-tax value of unallocated Group Office expenses. VONB by market is stated before adjustments to reflect additional Hong Kong reserving and capital requirements and unallocated Group Office expenses, and presented on a local statutory basis.
VONB margin VONB excluding pension business, expressed as a percentage of ANP. VONB margin for AIA is stated after adjustments to reflect additional Hong Kong reserving and capital requirements and the after-tax value of unallocated Group Office expenses. VONB margin by market is stated before adjustments to reflect additional Hong Kong reserving and capital requirements and unallocated Group Office expenses, and presented on a local statutory basis.
Withholding tax When a payment is made to a party in another country, the laws of the payer’s country may require withholding tax to be applied to the payment. International withholding tax may be required for payments of dividends or interest. A double tax treaty may reduce the amount of withholding tax required, depending upon the jurisdiction in which the recipient is tax resident.
Working capital Working capital comprises debt and equity securities, deposits and cash and cash equivalents held at the Group Corporate Centre. These liquid assets are available to invest in building the Group’s business operations.

AIA.COM STOCK CODE : 1299
ANNUAL REPORT 2015
REAL LIFEREAL IMPACT
AIA GROUP LIMITED友邦保險控股有限公司
VISION & PURPOSE
Our Vision is to be the pre-eminent life insurance provider in the Asia-Pacific region. That is our service to our customers and our shareholders.
Our Purpose is to play a leadership role in driving economic and social development across the region. That is our service to societies and their people.
ABOUT AIA
AIA Group Limited and its subsidiaries (collectively “AIA” or the “Group”) comprise the largest independent publicly listed pan-Asian life insurance group. It has a presence in 18 markets in Asia-Pacific – wholly-owned branches and subsidiaries in Hong Kong, Thailand, Singapore, Malaysia, China, Korea, the Philippines, Australia, Indonesia, Taiwan, Vietnam, New Zealand, Macau, Brunei, a 97 per cent subsidiary in Sri Lanka, a 26 per cent joint venture in India and a representative office in Myanmar and Cambodia.
The business that is now AIA was first established in Shanghai almost a century ago. It is a market leader in the Asia-Pacific region (ex-Japan) based on life insurance premiums and holds leading positions across the majority of its markets. It had total assets of US$168 billion as of 30 November 2015.
AIA meets the long-term savings and protection needs of individuals by offering a range of products and services including life insurance, accident and health insurance and savings plans. The Group also provides employee benefits, credit life and pension services to corporate clients. Through an extensive network of agents, partners and employees across Asia-Pacific, AIA serves the holders of more than 29 million individual policies and over 16 million participating members of group insurance schemes.
AIA Group Limited is listed on the Main Board of The Stock Exchange of Hong Kong Limited under the stock code “1299” with American Depositary Receipts (Level 1) traded on the over-the-counter market (ticker symbol: “AAGIY”).
Notes:(1) Explanations of certain terms and abbreviations used in this report are set
forth in the Glossary.
(2) Unless otherwise specified, 2014 and 2015 refer to the financial year of the Group, which ends on 30 November of the year indicated.
AN
NU
AL
RE
PO
RT
20
15A
IA G
RO
UP
LIM
ITE
D 友邦保險控股有限公司


![[Magisterarbeit] Life Settlements - Alexander Becker ... · “Life insurance settlements, or life settlements, are life insurance policies owned by investor beneficiaries on the](https://img.pdfslide.tips/doc/110x75/5edb01f009ac2c67fa68a90f/magisterarbeit-life-settlements-alexander-becker-aoelife-insurance-settlements.jpg)