Embed Size (px)
Citation preview

第 40 卷 增刊 2:253-259 高电压技术 Vol.40, Supplement 2: 253-259 2014 年 8 月 31 日 High Voltage Engineering August 31, 2014 DOI: 10.13336/j.1003-6520.hve.2014.S2.048
Real-time Temperature Monitoring System Using FBG Sensors on an
Oil-immersed Power Transformer
ZHANG Xin1, HUANG Ronghui1, HUANG Weizhao1, YAO Shenjing1, HOU Dan2, ZHENG Min2 (1. Shenzhen Power Supply Co. Ltd., Shenzhen 518000, China;
2. Shenzhen T & S Communication Co. Ltd., Shenzhen 518000, China)
Abstract: Over-heating issues will affect the safe operation and life-time of an oil-immersed transformer; therefore, it is necessary to monitor the temperature of the windings and oil during a transformer’s operation. Fiber Bragg Grating (FBG) temperature sensors are installed to measure the temperature of windings, cores, and busbars, as well as oil temperature at the top and bottom. An online-monitoring system is used to collect and analyze temperature data over time. Analysis shows that, by using the fiber optic Bragg grating temperature sensors, the internal temperature of an oil-immersed trans-former is accurately monitored in real-time. Additionally, the result can be used as good evidence to evaluate the service life and operational state of a transformer. Key words: oil-immersed transformer; Fiber Bragg Grating temperature sensor; temperature measurement; healthy eval-uation; service life evaluation; winding temperate measurement
0 Introduction
Oil immersed transformers play an important role in the power grid, which directly determines its safe, efficient, and economical operation. Therefore, it is very practical to evaluate the operation state and ser-vice life of a transformer.
Heat is generated by winding current during transformer operation, and dissipated by oil. The insu-lating capability will be affected when over-heated [1-2]. The transformer insulator life time is generally con-sidered to follow the 6℃-rule: operation at the annual average temperature should be 98℃ nominally, but when the temperature more than or less than 98℃, every increase or decrease of 6℃ causes the life of the transformer to reduce by half or increase double, respectively[3].
Winding hot-spot temperature is the major limit-ing factor of transformer load, and needs to be accurately measured [4]. As stated in the national stan-dard [5], “because the precise location of hot-spot is not generally known beforehand, local temperature may vary from point to point, and also with time, depend-ing on random variation of oil flow. Therefore it is
advisable to utilize several sensors at the same time. ” There are two major methods to measure the
winding temperature: direct and indirect methods. By the indirect method winding temperature is measured by thermal simulation, or estimated by indirect calcu-lation [6], where measurement results are determined by temperature modelling. Since the actual trans-former parameters and oil duct are often different from designed situations, the simulated result always con-tains a large error. The French Power grid has already stopped using this approach[7].
The direct method can be carried out by electrical signal, infrared signal, and optical signal approaches. The electrical approaches, such as thermocouple, thermal resistance, and others, are vulnerable to elec-tromagnetic interference, and are limited by the sensor’s life time. Infrared temperature measurement method is normally used for inspection purpose, due to its convenient operation, but it is not appropriate for online monitoring, and furthermore tends to be af-fected by background noise and electromagnetic interference. The optical fiber approaches can be based on fiber Raman scattering, Brillouin scattering, and fluorescence temperature sensing[8], semiconductor [9]

254 高电压技术 2014, 40(S2)
or the optical fiber grating temperature sensing[10-11]. Optical fiber has excellent insulating performance, with the sensing element and sensing signal transmis-sion are both based on light and thus not affected by electromagnetic interference. Raman scattering and Brillouin scattering approaches are limited by the fiber sensor arrangement and spatial resolution, therefore difficult to perform accurate measurements[12-13]; fluo-rescence and semiconductor thermometer approaches are based on absorption, limited by the fact that only one single sensor can be implemented on a fiber, which makes it difficult to perform multi-point moni-toring; furthermore, the fluorescence method tends to be affected by optical power, and fiber bending, con-nector loss, and cable loss combine to the measurement error.
By writing multiple FBGs (Fibre Bragg Grating) with different wavelengths, multiple sensors can be integrated on one single fiber, and using the WDM (wavelength division multiplex) technique, the tem-perature distribution inside a transformer can be monitored. The sensing signal processing is carried out by wavelength spectrum analysis, which is only affected by received optical power. By proper spatial arrangement of the sensors which are directly installed at the measured position, quasi-distributed temperature monitoring inside a transformer can be achieved.
So far, the applications of FBG based temperature measurement of a transformer are rarely reported in China. One application by China Electric Power Re-search Institute is embedding FBG sensors into a winding when it was fabricated; however, this ap-proach hasstrict requirements on fabrication and site construction [14]. In this paper, a more convenient method is introduced: FBG sensors could be installed during transformer maintenance or manufacturing. Transformers installed with sensors have been put into field service, and so far are in stable and accurate op-eration. A new option for oil-immersed transformer internal temperature measurement is thus provided.
1 Principle of FBG Sensing
FBG is written on an optical fiber by a laser with
phase masks. As shown in Fig.1, when a broad-band light travels in the fiber, a particular central wave-length would be reflected by FBG.
The central wavelength linearly shifts with tem-perature, which makes FBG a perfect temperature measuring element. By measuring the central wave-length, the measured temperature can be calculated using the relationship between temperature and wave-length.
λ
0λ
Fig.1 FBG structure and spectrum response
The central wavelength of FBG can be described as the equation below [15-16]: Λ= n2λ (1) Whereλ is the central wavelength, n is the effective refractive index, and Λ is the grating period. n and Λ will change with temperature. As in temper-ature sensor applications, the relative change in wavelength is θζαλλ Δ+=Δ )(/ (2) Where α is the thermal expansion coefficient of the fiber, which will change the grating period; ζ is the thermal optical coefficient, which will change the re-fractive index; θΔ is the change in temperature, and λΔ is the change in wavelength.
If we define )( ζαλα +=T as the sensitivity coefficient of FBG, then the relationship between change in wavelength and temperature can be de-scribed when temperature is the only variable. In this paper, FBG temperature coefficient is 10 pm/℃, and linear coefficient can reach 0.9999.
The transmitted light keeps on travelling along the fiber, and different central wavelengths are re-flected by different gratings. By measuring these reflected wavelengths, serial temperature sensors are achieved on one single fiber.
2 Transformer Winding Temperature Measuring System
A diagram of temperature monitoring system is
ZHANG Xin, et al.: Real-time Temperature Monitoring System Using FBG Sensors on an Oil-immersed Power Transformer 255
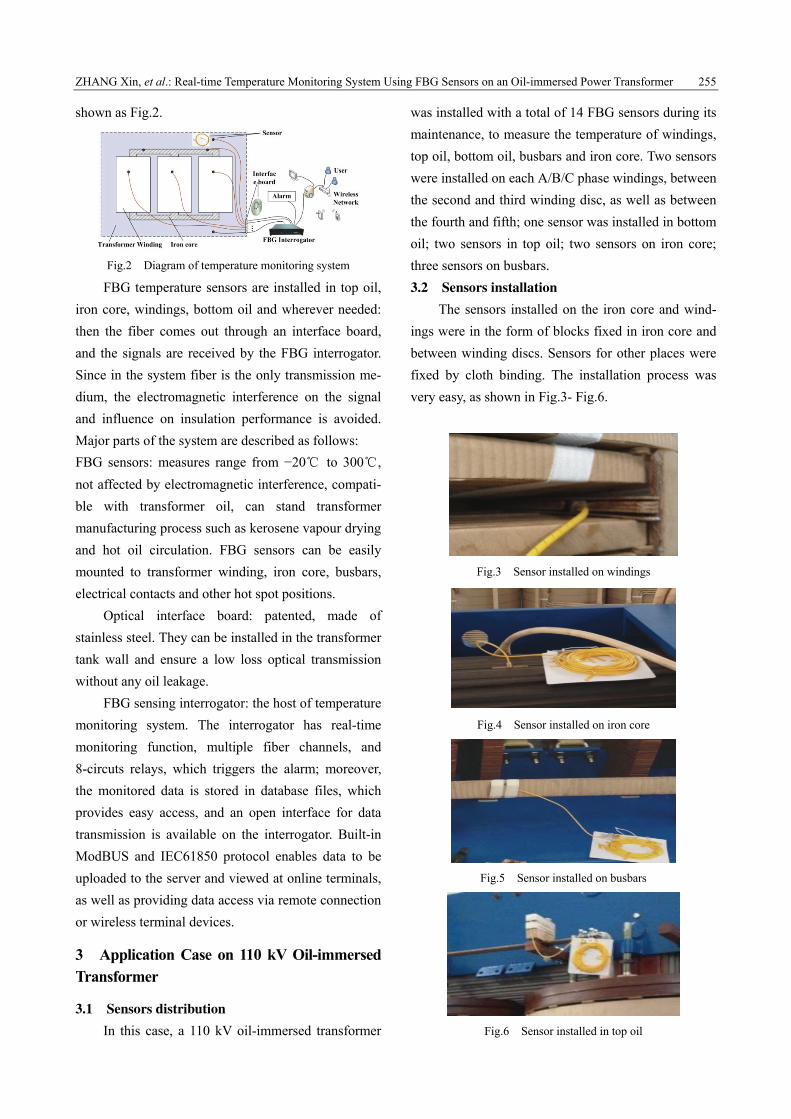
shown as Fig.2.
Fig.2 Diagram of temperature monitoring system
FBG temperature sensors are installed in top oil, iron core, windings, bottom oil and wherever needed: then the fiber comes out through an interface board, and the signals are received by the FBG interrogator. Since in the system fiber is the only transmission me-dium, the electromagnetic interference on the signal and influence on insulation performance is avoided. Major parts of the system are described as follows: FBG sensors: measures range from −20℃ to 300℃, not affected by electromagnetic interference, compati-ble with transformer oil, can stand transformer manufacturing process such as kerosene vapour drying and hot oil circulation. FBG sensors can be easily mounted to transformer winding, iron core, busbars, electrical contacts and other hot spot positions.
Optical interface board: patented, made of stainless steel. They can be installed in the transformer tank wall and ensure a low loss optical transmission without any oil leakage.
FBG sensing interrogator: the host of temperature monitoring system. The interrogator has real-time monitoring function, multiple fiber channels, and 8-circuts relays, which triggers the alarm; moreover, the monitored data is stored in database files, which provides easy access, and an open interface for data transmission is available on the interrogator. Built-in ModBUS and IEC61850 protocol enables data to be uploaded to the server and viewed at online terminals, as well as providing data access via remote connection or wireless terminal devices.
3 Application Case on 110 kV Oil-immersed Transformer
3.1 Sensors distribution
In this case, a 110 kV oil-immersed transformer
was installed with a total of 14 FBG sensors during its maintenance, to measure the temperature of windings, top oil, bottom oil, busbars and iron core. Two sensors were installed on each A/B/C phase windings, between the second and third winding disc, as well as between the fourth and fifth; one sensor was installed in bottom oil; two sensors in top oil; two sensors on iron core; three sensors on busbars. 3.2 Sensors installation
The sensors installed on the iron core and wind-ings were in the form of blocks fixed in iron core and between winding discs. Sensors for other places were fixed by cloth binding. The installation process was very easy, as shown in Fig.3- Fig.6.
Fig.3 Sensor installed on windings
Fig.4 Sensor installed on iron core
Fig.5 Sensor installed on busbars
Fig.6 Sensor installed in top oil
256 高电压技术 2014, 40(S2)
4 Results and Analysis
The temperature rise test was performed after the sensors were installed. Continuous internal tempera-ture monitoring had been performed for about 4 month until the current time. 4.1 Temperature rise test and results
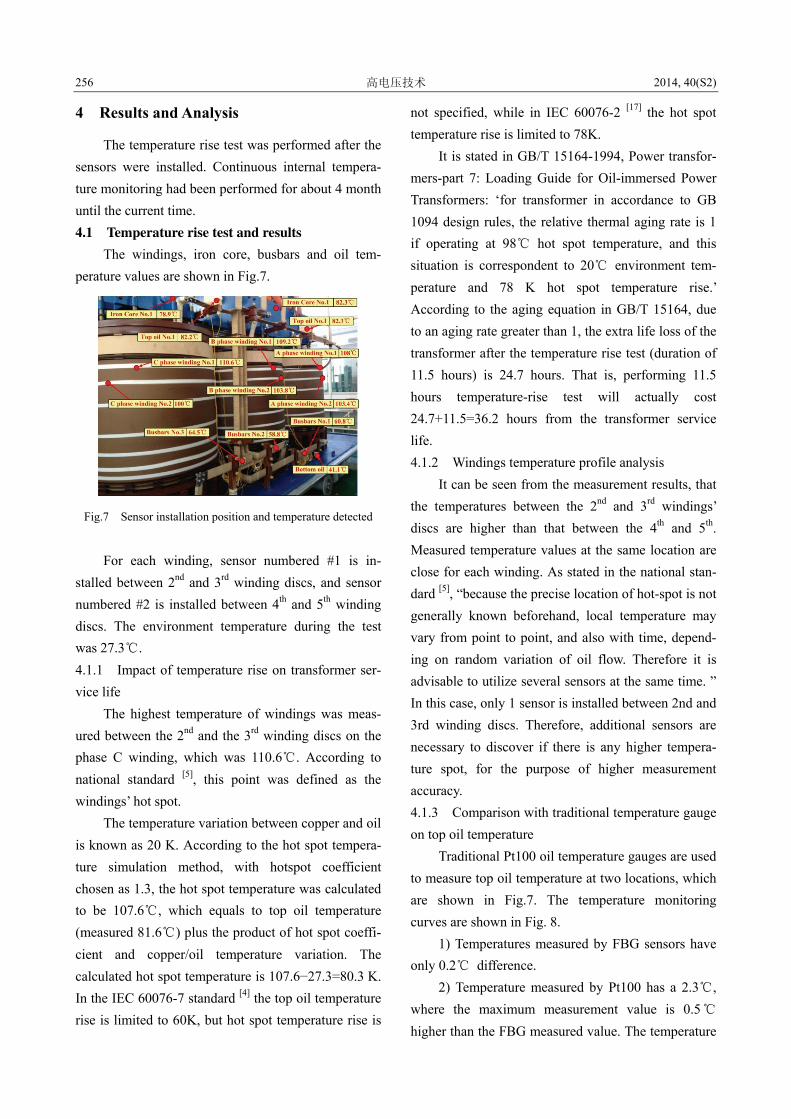
The windings, iron core, busbars and oil tem-perature values are shown in Fig.7.
Fig.7 Sensor installation position and temperature detected
For each winding, sensor numbered #1 is in-
stalled between 2nd and 3rd winding discs, and sensor numbered #2 is installed between 4th and 5th winding discs. The environment temperature during the test was 27.3℃. 4.1.1 Impact of temperature rise on transformer ser-vice life
The highest temperature of windings was meas-ured between the 2nd and the 3rd winding discs on the phase C winding, which was 110.6℃. According to national standard [5], this point was defined as the windings’ hot spot.
The temperature variation between copper and oil is known as 20 K. According to the hot spot tempera-ture simulation method, with hotspot coefficient chosen as 1.3, the hot spot temperature was calculated to be 107.6℃, which equals to top oil temperature (measured 81.6℃) plus the product of hot spot coeffi-cient and copper/oil temperature variation. The calculated hot spot temperature is 107.6−27.3=80.3 K. In the IEC 60076-7 standard [4] the top oil temperature rise is limited to 60K, but hot spot temperature rise is
not specified, while in IEC 60076-2 [17] the hot spot temperature rise is limited to 78K.
It is stated in GB/T 15164-1994, Power transfor-mers-part 7: Loading Guide for Oil-immersed Power Transformers: ‘for transformer in accordance to GB 1094 design rules, the relative thermal aging rate is 1 if operating at 98℃ hot spot temperature, and this situation is correspondent to 20℃ environment tem-perature and 78 K hot spot temperature rise.’ According to the aging equation in GB/T 15164, due to an aging rate greater than 1, the extra life loss of the transformer after the temperature rise test (duration of 11.5 hours) is 24.7 hours. That is, performing 11.5 hours temperature-rise test will actually cost 24.7+11.5=36.2 hours from the transformer service life. 4.1.2 Windings temperature profile analysis
It can be seen from the measurement results, that the temperatures between the 2nd and 3rd windings’ discs are higher than that between the 4th and 5th. Measured temperature values at the same location are close for each winding. As stated in the national stan-dard [5], “because the precise location of hot-spot is not generally known beforehand, local temperature may vary from point to point, and also with time, depend-ing on random variation of oil flow. Therefore it is advisable to utilize several sensors at the same time. ” In this case, only 1 sensor is installed between 2nd and 3rd winding discs. Therefore, additional sensors are necessary to discover if there is any higher tempera-ture spot, for the purpose of higher measurement accuracy. 4.1.3 Comparison with traditional temperature gauge on top oil temperature
Traditional Pt100 oil temperature gauges are used to measure top oil temperature at two locations, which are shown in Fig.7. The temperature monitoring curves are shown in Fig. 8.
1) Temperatures measured by FBG sensors have only 0.2℃ difference.
2) Temperature measured by Pt100 has a 2.3℃, where the maximum measurement value is 0.5℃ higher than the FBG measured value. The temperature

ZHANG Xin, et al.: Real-time Temperature Monitoring System Using FBG Sensors on an Oil-immersed Power Transformer 257
measured by Pt100 gauge #2 jumped for 9.4℃ during 5:00-5:30, implying that a fault may have occurred on gauge #2. Soon after the field operation gauge #2 was found broken and subsequently replaced.
Fig.8 Top oil temperature data
4.1.4 Measurement stability analysis As shown in Fig.9, temperature of the windings,
iron core, busbars and oil rose smoothly during the temperature-rise test, indicating that the FBG sensor temperature monitoring system of oil-immersed transformer works stably and accurately in this appli-cation.
0
20
40
60
80
100
120
0 20 40 60Samples
Tem
prat
ure Top oil
bottom oiliron coreWinding AWinding CWinding BBusbars
Fig.9 Temperature-rise record curves of FBG sensors
4.2 Long-term operation monitoring data analy-
sis
4.2.1 Long-term monitoring data A long term online monitoring was performed
over 4 months, and the recorded temperatures are shown in Fig.10-Fig.16.
0
10
20
30
40
50
60
70
6/15 7/5 7/25 8/14 9/3 9/23 10/13 11/2Time
Tem
pera
ture
No.1 Sensor No.2 Sensor No.3 Sensor
Fig.10 Busbars temperature
0
10
20
30
40
50
60
6/15 7/5 7/25 8/14 9/3 9/23 10/13 11/2Time
Tem
pera
ture
Fig.11 Bottom oil temperature
0
10
20
30
40
50
60
70
80
6/15 7/5 7/25 8/14 9/3 9/23 10/13 11/2Time
Tem
pera
ture
No.1 Sensor No.2 Sensor
Fig.12 Top oil temperature
0
10
20
30
40
50
60
70
80
90
6/15 7/5 7/25 8/14 9/3 9/23 10/13 11/2Time
Tem
pera
ture
No.1 Sensor No.2 Sensor
Fig.13 Iron core temperature
010
20304050607080
90100
6/15 7/5 7/25 8/14 9/3 9/23 10/13 11/2Time
Tem
pera
ture
No.1 Sensor No.2 Sensor
Fig.14 Temperature of phase A high-voltage windings
0
20
40
60
80
100
120
6/15 7/5 7/25 8/14 9/3 9/23 10/13 11/2Time
Tem
prat
ure
No.1 Sensor No.2 Sensor
Fig.15 Temperature of phase B high-voltage windings

258 高电压技术 2014, 40(S2)
0
10
20
30
40
50
60
70
80
90
100
6/15 7/5 7/25 8/14 9/3 9/23 10/13 11/2Time
Tem
prat
ure
No.1 Sensor No.2 Sensor
Fig.16 Temperature of phase C high-voltage windings
It can be seen from the recorded monitoring data: 1) The measured temperature shows a trend of
changing with changing transformer load,indicating that the consistency of all FBG sensors is good.
2) As verified by this monitor record, the practi-cal internal thermal profile can be described as: low at busbars and bottom oil, higher at top oil, and highest at iron core and windings.
3) The hottest temperature occurs at the B phase windings, which is 96.1℃; however, the highest aver-age temperature over long-term monitoring occurs at the iron core. This is because when transformer load is low, heat is mostly generated by eddy current rather than windings heat.
4) The change in temperature shows a weekly pe-riod. This is due to transformer load changing with the power consumption: lower electrical loads for con-sumption occur on weekends and holidays, and so transformer temperatures are lower. The peak value of temperature often occurs on Tuesday or Wednesday 4.2.2 Relationship between measured temperature and winding current
Figure 17 is a transformer temperature curve during 6 days of continuous operation, showing the relationships between the temperatures measured by winding thermometer, hot spot temperatures measured by FBG sensors, and the corresponding current load. Figure 18 shows the oil temperature curve measured by oil temperature gauge and FBG sensors respec-tively over different current loads.
Fig.17 shows the temperatures measured by winding thermometer and FBG sensor, plotted with the winding current data.
303438424650545862667074
13/6/24 13/6/25 13/6/26 13/6/27 13/6/28 13/6/29 13/6/30 Time
Tem
pera
ture
50
100
150
200
250
300
350
400
Cur
rent
Thermometerfiber hot spotiron temperaturehigh voltage winding current
Fig.17 Hot spot temperature on windings
30
35
40
45
50
55
60
13/6/24 13/6/25 13/6/26 13/6/27 13/6/28 13/6/29 13/6/30 Time
Tem
pera
ture
50
100
150
200
250
300
350
400
Cur
rent
PT100 top oil tempraturefiber top oil tempraturehigh voltage winding current
Fig.18 Oil temperature versus winding current
It can be summarized from Fig.17 and Fig. 18 that:
1) Temperatures measured by FBG sensors vary with the winding current, accurately following the change of load, while the temperature change on iron core shows a slight hysteresis effect.
2) The hot spot temperature of the windings changes with current, and is 0~8 K higher than the oil temperature measured by winding thermometer.
5 Conclusions
Online temperature monitoring system of trans-former with FBG sensors can provide a real-time, accurate monitoring solution for a transformer’s inter-nal components’ temperatures. As a direct contacting measurement, the result is more accurate than simula-tion and theoretical calculation. Long-term monitoring has been performed, and proven that the monitoring system is safe, reliable, and stable. The system can replace winding thermometers and oil thermometers, as well as manual inspection. Moreover, by monitor-ing the temperature, the life loss of transformer can be evaluated. This is an effective solution for on-line temperature monitoring of a transformer.
References
[1] GB/T 1094.7—2008 Power transformers-part 7: loading guide for oil-immersed power transformers[S], 2008.

ZHANG Xin, et al.: Real-time Temperature Monitoring System Using FBG Sensors on an Oil-immersed Power Transformer 259
[2] Pradhan M K, Ramu T S. Estimation of the hottest spot tempera-ture(HST) in power transformers considering thermal in homogeneity of the windings[J]. IEEE Transactions on Power Delivery, 2004, 19(4): 1704-1712.
[3] IEEE Standard C57.100—1999 Test procedure for thermal evaluation of liquid-immersed distribution and power transformers[S], 1999.
[4] IEC 60076-7 Loading guide for oil-immersed power transformer, revision of publication[S], 2005.
[5] GB 1094.2—1996 Power Transformers, part 2: temperature rise[S], 1996.
[6] CAO Weidong. Measurement and error analysis of large power trans-former winding temperature[J]. Xinjiang Electric Power, 2010(1): 39-40.
[7] LU Wanlie. “Thermal Simulation” error in winding temperature mea-surement of transformer[J]. Transformer, 1999, 36(10): 15-17
[8] CHEN Jun. Application of optical fiber temperature measurement technology to transformer[J]. Transformer, 2008, 45(1): 38-41.
[9] SONG Wei. Temperature measurement using fiber optic sensor: theory and Installation[C]∥Conference on Chongqing Society of Electrical Engineering, 2012.
[10] Alessandra F P, Manuel L B, Paul C R. Bragg system for temperature monitoring in distribution transformers[J]. Electric Power System Re-search, 2010, 80(1): 77-83.
[11] Feng Yuebo, A method used for measuring temperature of transformer windings[J]. Transformer, 2001, 38(5): 13-15.
[12] LIU Yuan, ZHANG Yong, Lei Tao, et al. The application of distribute optical temperature sensing technology in the surveillance of electrical cable temperature[J]. Shan Dong Science, 2008, 21(6): 50-54.
[13] LI Xiuqi, HOU Sizu, SU Guibo, Distributed optical fiber temperature sensors system based on Raman scattering applied in electric power system[J]. 2008, 24(8): 37-40.
[14] DENG Jiangang, GUO Tao. Design and performance test for fiber bragg grating sensors of transformer winding temperature measure-ment[J]. High Voltage Engineering, 2012, 38(6): 1348-1355.
[15] Meltz G. Formation of bragg gratings in optical fibers by a transversal holographic method[J]. Optics Letters, 1989, 15(14): 8236-8250.
[16] Kersey A D, Davis T S H, Patrick H J, et al. Fiber bragg grating sen-sors[J]. Journal of Lightwave Technology, 1997, 15(8): 1442-1462.
[17] IEC 60076-2 Power transformers, part 2: temperature rise for liq-uid-immersed transformers, Edition 3.0[S], 2011.
ZHANG Xin 1984—, Male, Bachelor, engineer, technician. His research field mainly focus on power transmission and transformation equipment state monitoring, data analysis and supervision. E-mail: [email protected]
Received date 2014-06-05 Editor Zeng Wenjun