Embed Size (px)
Citation preview
Masaki Yamashita
Recent results from XMASS
Masaki Yamashita Kamioka observatory, ICRR, the Univ. Of Tokyo
Kavli IPMU, the Univ. Of Tokyo On behalf of XMASS collaboration
UCLA Dark Matter 2016 symposium , 19th/Feb/2016
Masaki Yamashita
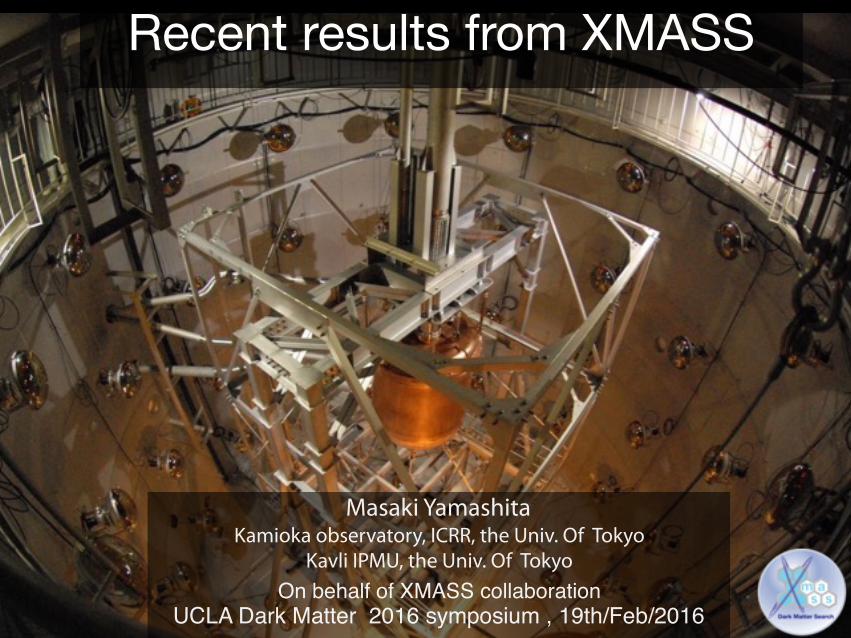
XMASS Experiment
Xenon MASSive detector for Solar neutrino (pp/7Be) Xenon neutrino MASS detector (double beta decay) Xenon detector for Weakly Interacting MASSive Particles (DM)
Multi purpose low-background experiment with single phase LXe.
XMASSI(FV:100kg、Total 1ton)
XMASSII(FV:10ton、24Ton)
Dark Matter
Solar Neutrino Dark Matter
DBB2007: Project was funded. 2013〜: Data taking
XMASS1.5(FV:3ton、Total 6ton)
3inch dome shape PMT
Dark Matter
Masaki Yamashita
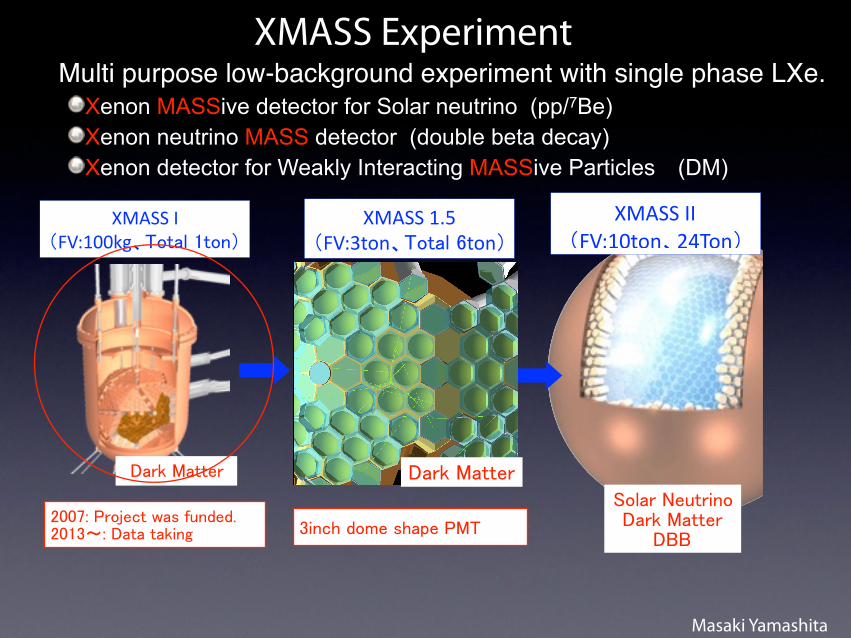
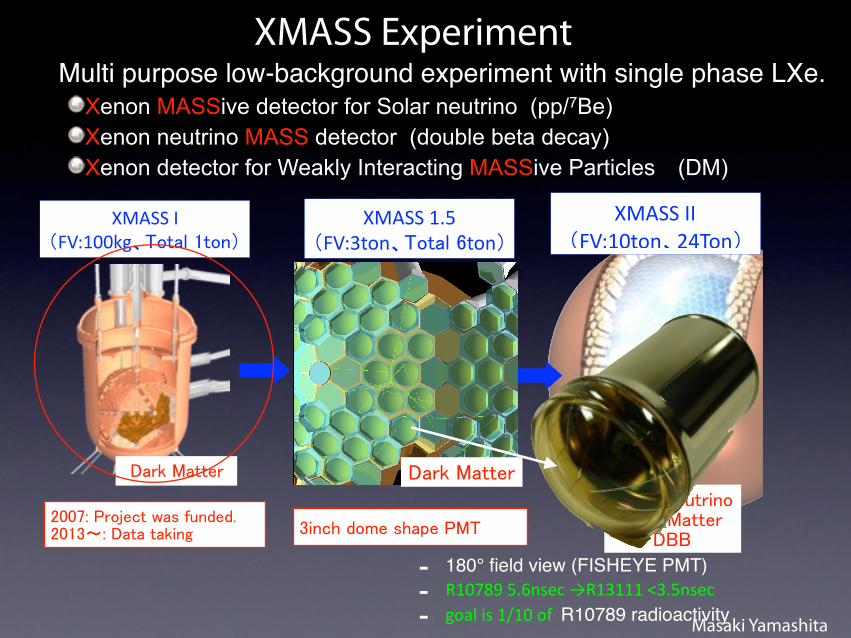
XMASS Experiment
Xenon MASSive detector for Solar neutrino (pp/7Be) Xenon neutrino MASS detector (double beta decay) Xenon detector for Weakly Interacting MASSive Particles (DM)
Multi purpose low-background experiment with single phase LXe.
XMASSI(FV:100kg、Total 1ton)
XMASSII(FV:10ton、24Ton)
Dark Matter
Solar Neutrino Dark Matter
DBB2007: Project was funded. 2013〜: Data taking
XMASS1.5(FV:3ton、Total 6ton)
3inch dome shape PMT
Dark Matter
- 180° field view (FISHEYE PMT) - R107895.6nsec→R13111<3.5nsec
- goalis1/10ofR10789 radioactivity

Masaki Yamashita
The XMASS collaboration:KamiokaObservatory,ICRR,theUniversityofTokyo:K.Abe,K.Hiraide,K.Ichimura,Y.Kishimoto,K.Kobayashi,M.Kobayashi,S.Moriyama,M.Nakahata,T.Norita,H.Ogawa,H.Sekiya,S.Tasaka,O.Takachio,A.Takeda,M.Yamashita,B.YangKavliIPMU,theUniversityofTokyo:J.Liu,K.Martens,Y.Suzuki,X.BendaKobeUniversity:R.Fujita,K.Hosokawa,K.Miuchi,Y.Ohnishi,N.Oka,Y.TakeuchiTokaiUniversity:K.Nishijima
11 institutes 41 researchers.
YokohamaNationalUniversity:S.NakamuraMiyagiUniversityofEducation:Y.FukudaSTEL,NagoyaUniversity:Y.Itow,R.Kegasa,K.Kobayashi,K.Masuda,H.TakiyaSejongUniversity:N.Y.Kim,Y.D.KimKRISS:Y.H.Kim,M.K.Lee,K.B.Lee,J.S.LeeTokushimaUniversity:K.Fushimi

Masaki YamashitaMasaki Yamashita
super Kamiokande
Kamioka mineGifu, Hida city, Ikenoyama
Kamland
•1000munderamountain=2700mwaterequiv.
•360mabovethesea•Horizontalaccess•Experiment
•Super-K•KamLAND(TohokuU.)•KAGRA•NEWAGE
Masaki Yamashita
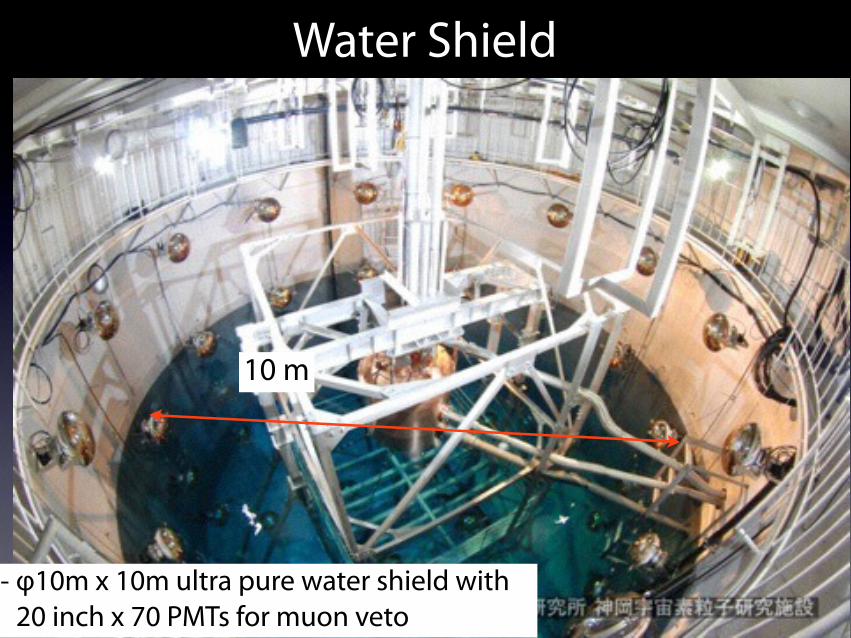
Water Shield
- φ10m x 10m ultra pure water shield with 20 inch x 70 PMTs for muon veto
10 m
Masaki Yamashita
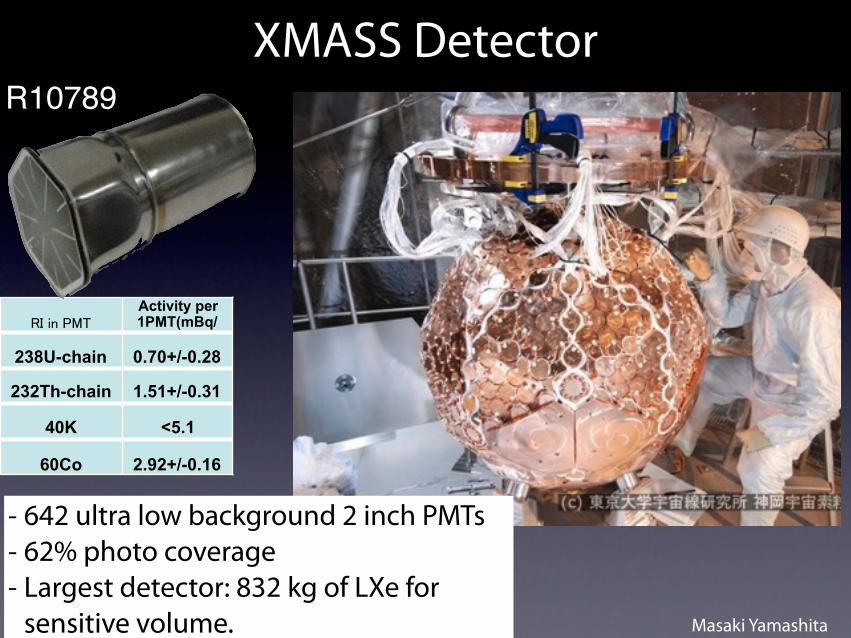
XMASS Detector
- 642 ultra low background 2 inch PMTs - 62% photo coverage - Largest detector: 832 kg of LXe for
sensitive volume.
RI in PMTActivity per 1PMT(mBq/
238U-chain 0.70+/-0.28
232Th-chain 1.51+/-0.31
40K <5.1
60Co 2.92+/-0.16
R10789
Masaki Yamashita
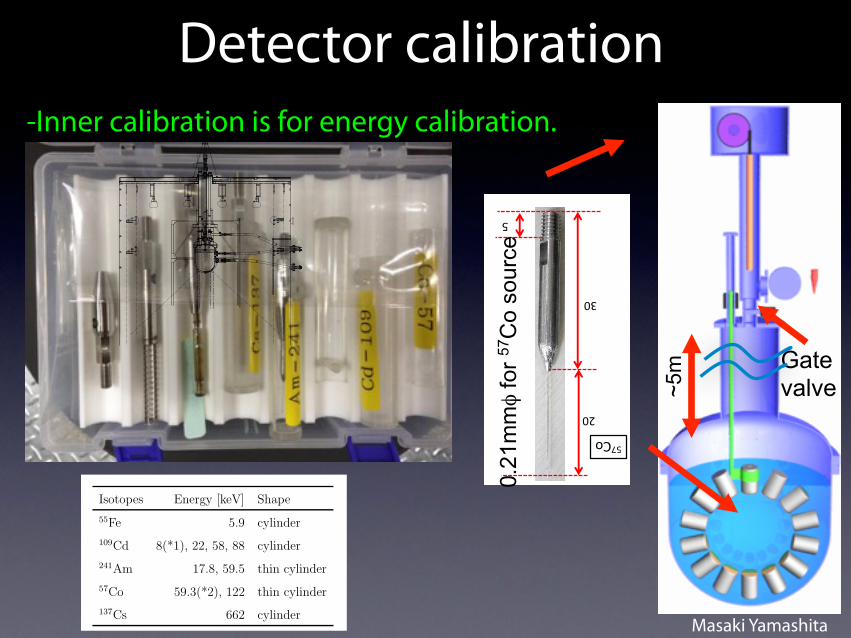
Detector calibration
Gate valve~5
m
•-Inner calibration is for energy calibration. 3. Sources
57Co
241Am
5 5
energy [keV] Intensity [Hz] Dia. [mm] Outer material
(1) Fe-55 5.9 350 5 brass
(2) Cd-109 22, 25, 88 800 5 brass
(3) Am-241 59.5 485 0.17 SUS
(4) Co-57 122 68 (KRISS side) 0.21 SUS 2012/12/21 26
Theses sources were made by KRISS
13 20
30 30
0.21
mmφ
for 57
Co
sour
ce
OFHC copper rod and source
gate valve
source exchange
OFHC copper rod
stepping motor
Flange for
movedalong z−axis
guide pipe
Calibration systemon the tank top
ID
Figure 5: Calibration system on top of the tank. Source placed on the edge of the copper
rod is inserted into the ID and can be moved along the z axis.
Table 7: Calibration sources and energies. The 8 keV (*1) in the 109Cd and 59.3 keV (*2)
in the 57Co source are Kα X-rays from the copper and tungsten, respectively, used for
source housing.
Isotopes Energy [keV] Shape
55Fe 5.9 cylinder
109Cd 8(*1), 22, 58, 88 cylinder
241Am 17.8, 59.5 thin cylinder
57Co 59.3(*2), 122 thin cylinder
137Cs 662 cylinder
21
Masaki Yamashita
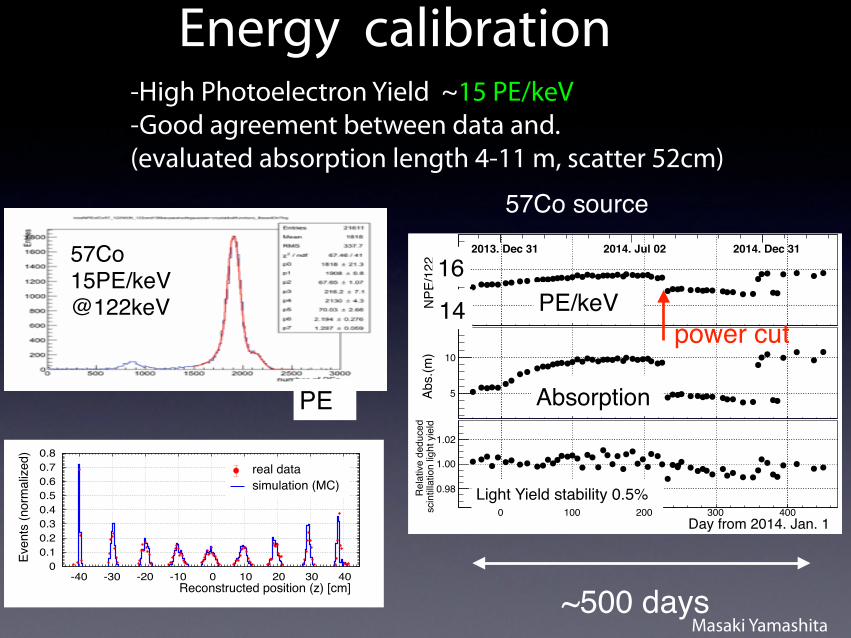
Energy calibration
0
0.2
0.4
0.6
0.8
1
0 20 40 60 80 100 120 140
Even
ts (n
orm
alize
d)
reconstructed energy [keVee]
0 0.1 0.2 0.3 0.4 0.5 0.6 0.7 0.8
-40 -30 -20 -10 0 10 20 30 40
Norm
alize
d
reconstructed z [cm]
real datasimulation (MC)
real datasimulation (MC)
Even
ts (n
orm
aliz
ed)
Even
ts (n
orm
aliz
ed)
Reconstructed position (z) [cm]
Reconstructed energy [keVee]
Figure 9: Energy spectra reconstructed using the 57Co source at z = 0 cm (upper) and ver-
tex distributions reconstructed using the same source at z = −40, −30, ..., 40 cm (lower).
26
Total PE
•-High Photoelectron Yield ~15 PE/keV •-Good agreement between data and. •(evaluated absorption length 4-11 m, scatter 52cm)
57Co15PE/keV@122keV N
PE/1
22
14
16
2013. Dec 31 2014. Jul 02 2014. Dec 31
Abs.
(m)
5
10
Day from 2014. Jan. 10 100 200 300 400sc
intil
latio
n lig
ht y
ield
Rel
ativ
e de
duce
d
0.98
1.00
1.02
PE
PE/keV
Absorption
Light Yield stability 0.5%
~500 days
57Co source
power cut1416
Masaki Yamashita
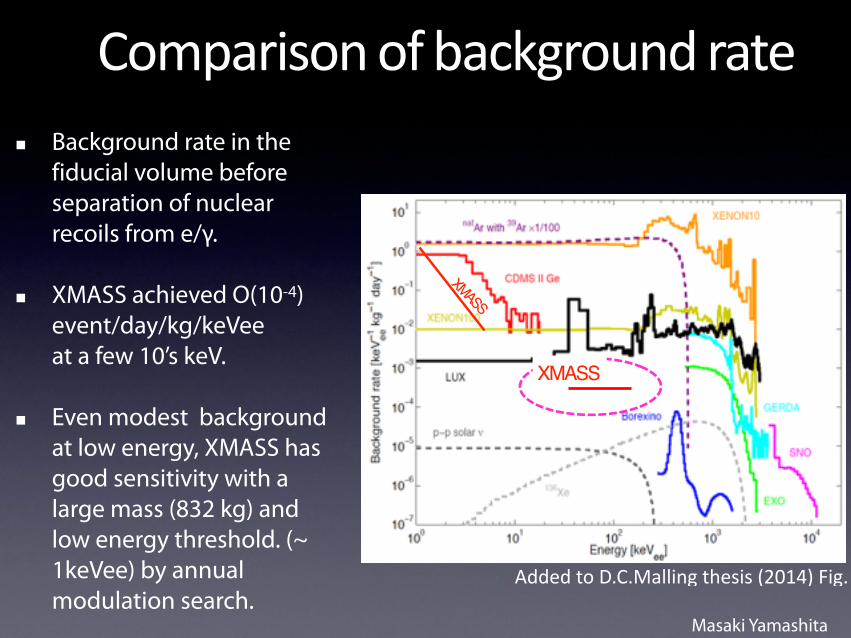
Comparisonofbackgroundrate■ Background rate in the
fiducial volume before separation of nuclear recoils from e/γ.
■ XMASS achieved O(10-4) event/day/kg/keVeeat a few 10’s keV.
■ Even modest background at low energy, XMASS has good sensitivity with a large mass (832 kg) and low energy threshold. (~ 1keVee) by annual modulation search.
XMASS
AddedtoD.C.Mallingthesis(2014)Fig.
XMASS
XMASS
Masaki Yamashita, ICRR, Univ of Tokyo
PTEP 2014, 063C01 H. Uchida et al.
Table 1. Signal efficiencies with their systematic errors for deriving the limitshown in Figs. 4 and 7. The row starting from (a) is based on Ref. [29], and theone starting from (b) on Ref. [33].
WIMP mass (GeV) 20 50 100 300 1000 3000 5000
(a) signal efficiency (%) 23±76 29±4
5 26±24 19±1
3 16±13 15±1
3 15±13
(b) signal efficiency (%) 24±76 30±2
5 29±24 26±2
5 25±25 25±2
5 25±25
used in Ref. [29], it can be seen in Fig. 1 that the shape of this distribution for a 50 GeV WIMPdoes not change much with the use of the more modern form factors. These cut values and the signalwindow optimized for the 50 GeV WIMPs were also used to obtain the limits for the other WIMPmasses. Our signal efficiency is defined as the ratio between the number of simulated events remain-ing after all cuts in the 36–48 keV signal region and the number of simulated events generated withinthe fiducial volume (radius less than 15 cm, containing 41 kg of LXe). As shown in Table 1, sig-nal efficiency ranges from 29% for 50 GeV WIMPs to 15% for 5 TeV WIMPs for the nuclear formfactors given in Ref. [29].
5. Results and discussion
As clearly visible in Fig. 3, the cuts discussed in the previous section almost eliminate all backgroundin and around the signal window. After all cuts, 5 events remain in our 36–48 keV signal region. Themain contribution to the remaining background in this energy region stems from the 222Rn daughter214Pb. From our simulation we estimate this background alone to contribute 2.0 ± 0.6 events. Asother background contributions are smaller but less certain, we do not subtract background whencalculating our limits. Our detector’s low background allows us to directly use the event count inthe signal region to extract our limit on the inelastic scattering cross section of WIMPs on 129Xenuclei. Using Eq. 6 and taking into account the nuclear form factor and our signal efficiency wederive a 90% C.L. upper limit for this cross section, which in Fig. 4 is compared to the result fromRefs. [12,13]. The gray band reflects our systematic uncertainties. The systematic uncertainty on
WIMP mass [GeV]10
) [p
b]Ias σ
Asy
mpt
otic
cro
ss s
ectio
n (
1
10
210
10 32
Fig. 4. The black solid line is our 90% C.L. upper limit on the asymptotic cross section σ asI for inelastic scat-
tering on 129Xe using the same form factors as DAMA. The gray band covers its variation with our systematicuncertainty. The dotted line is the limit obtained by the DAMA group [12,13]. It was derived after statisti-cally subtracting background. Our low background allows us to derive this limit without such backgroundsubtraction.
7/11
at Kokusai H
oken Keikakugaku (U
NIV
OF TO
KY
O) on June 6, 2014
http://ptep.oxfordjournals.org/D
ownloaded from
χ+129Xeà χ+129Xe* 129Xe*à 129Xe+γ
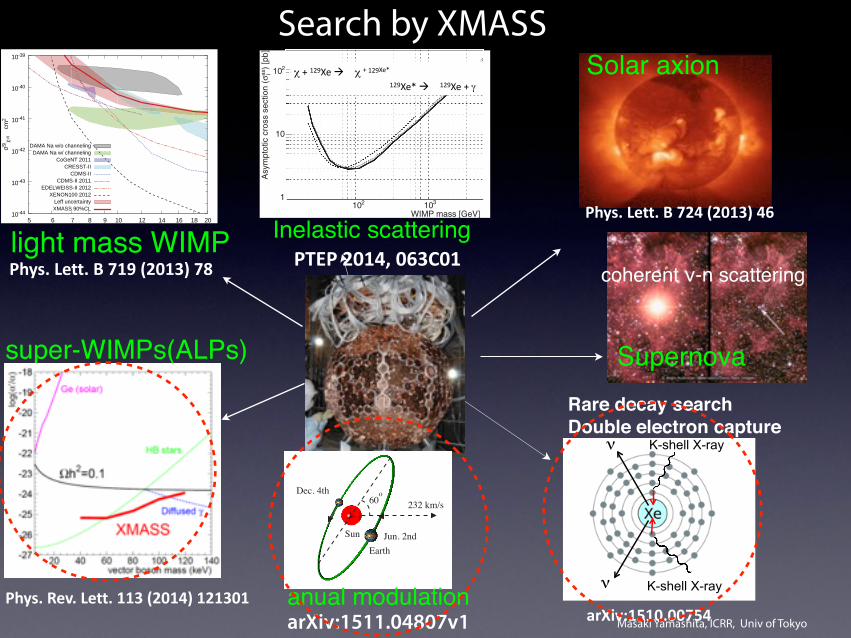
Search by XMASS
Low Mass
light mass WIMP
super-WIMPs(ALPs)
K. Abe et al. / Physics Letters B 719 (2013) 78–82 81
Fig. 6. WIMP signal acceptance efficiency after data reduction for the analysis.
select these events a time-of-flight correction is made to the tim-ing distribution of each event assuming the event vertex is onthe surface of the PMT closest to the charge-weighted center ofgravity of the event. After this correction the timing distributionof Cherenkov-like events is found to be narrower than that forscintillation-like events. Events with more than 60% of their PMThits occurring within the first 20 ns of the event window are re-moved as Cherenkov-like. The ratio of the number of PMT hitswithin the first 20 ns relative to the total number of hits in theevent window for all events (head-to-total ratio) is shown in Fig. 4.Each step of the data reduction is shown in Fig. 5.
The expected WIMP acceptance efficiency of these cuts wasestimated with the detector simulation. In the simulation WIMPrecoil energy spectra were generated for each WIMP mass and MCevents were distributed uniformly throughout the detector volumeusing a liquid scintillation decay constant of 25 ns [16]. Fig. 6shows the resulting signal acceptance efficiency at energies be-low 1 keVee. The size of the error bars comes primarily from thesystematic uncertainty in the xenon scintillation decay constant,25 ± 1 ns, which is estimated based on the difference between theXMASS model [16] and the NEST model [17] based on [18]. A sys-tematic error on the selection efficiency is determined based onthe error resulting from a linear fit to the points in the figure. Atthe 0.3 keVee analysis threshold this error is 6.1%.
4. Results and discussion
Fig. 7 shows simulated WIMPs energy spectra overlaid on theobserved spectrum after the data reduction was applied. WIMPsare assumed to be distributed in an isothermal halo with vo =220 km/s, a galactic escape velocity of vesc = 650 km/s, and anaverage density of 0.3 GeV/cm3. In order to set a conservativeupper bound on the spin-independent WIMP-nucleon cross sec-tion, the cross section is adjusted until the expected event ratein XMASS does not exceed the observed one in any energy binabove 0.3 keVee. Implementing the systematic errors discussed inthe text above, the resulting 90% confidence level (C.L.) limit de-rived from this procedure is shown in Fig. 8. The impact of theuncertainty from Leff is large in this analysis, so its effect on thelimit is shown separately in the figure.
After careful study of the events surviving the analysis cuts,their origins are not completely understood. Contamination of 14Cin the GORE-TEX® sheets between the PMTs and the support struc-ture may explain a fraction of the events. Light leaks through thismaterial are also suspect. Nonetheless, the possible existence of aWIMP signal hidden under these and other backgrounds cannotbe excluded. Although no discrimination has been made between
Fig. 7. Simulated WIMP energy spectra in the XMASS detector assuming the maxi-mum cross section that provides a signal rate no larger than the observation in anybin above 0.3 keVee.
Fig. 8. Spin-independent elastic WIMP-nucleon cross section as a function of WIMPmass. All systematic uncertainties except that from Leff are taken into account inthe XMASS 90% C.L. limit line. The effect of the Leff uncertainty on the limit isshown in the band. Limits from other experiments and favored regions are alsoshown [4–9].
nuclear-recoil and electronic events, and many events remain inthe analysis sample, the present result excludes part of the param-eter space favored by other measurements [4–6] when those dataare interpreted as a signal for light mass WIMPs. Finally, we areworking on modifications to the inner surface of XMASS, especiallyaround the PMTs, to improve the detector performance.
Acknowledgements
We gratefully acknowledge the cooperation of Kamioka Miningand Smelting Company. This work was supported by the JapaneseMinistry of Education, Culture, Sports, Science and Technology,Grant-in-Aid for Scientific Research, and partially by the NationalResearch Foundation of Korea Grant funded by the Korean Govern-ment (NRF-2011-220-C00006).
Inelastic scatteringPhys.Lett.B719(2013)78
Solar axion
Phys.Lett.B724(2013)46
PTEP2014,063C01
Phys.Rev.Lett.113(2014)121301arXiv:1511.04807v1
Supernova
coherent ν-n scattering
3.7 Annual modulationThe annual modulation of the WIMP rate on a target detector is induced by the Earth’smotion around the Sun[47]. The expected nuclear recoil energy spectrum depends on theWIMP velocity distribution and on the Earth’s velocity in the galactic frame, vr(t). Itvaries along the year due to the expression,
vE(t) =Vsun+Vearth cosγ cosω(t− t0), (3.39)
where Vsun = 232 km/s is the Sun’s velocity with respect to the halo, Vearth = 30 km/s isthe Earth’s orbital velocity around the Sun on a plane with inclination γ = 60◦ respect tothe galactic one, ω = 2π/T with T = 1 year and t0 � 2nd June. Fig.3.5 illustrates themotion of the Earth relative to the Galactic coordinates. The annual modulation signatureis the one of the most strong evidence of WIMPs, but the total event variation is only ∼ 3%, a large mass detector is needed for statistics.
Fig.3.6 shows the expected spectrum in Jun 2nd, Dec 4th and their rate difference. Inthis calculation, the following value were used.
• Cross section to WIMP for SI case is 1.0×10⁻⁵pb.
• WIMP mass is 50 GeV.
• VE in Jun 2nd is 247 km/s.
• VE in Dec 4th is 217 km/s.
Dec. 4th
EarthJun. 2ndSun
232 km/s60 oo
Figure 3.5: The motion of the Earth relative to the Galactic coordinates.
27
anual modulation
K-shell X-ray�
K-shell X-ray�
ν�
ν�
Rare decay searchDouble electron capture
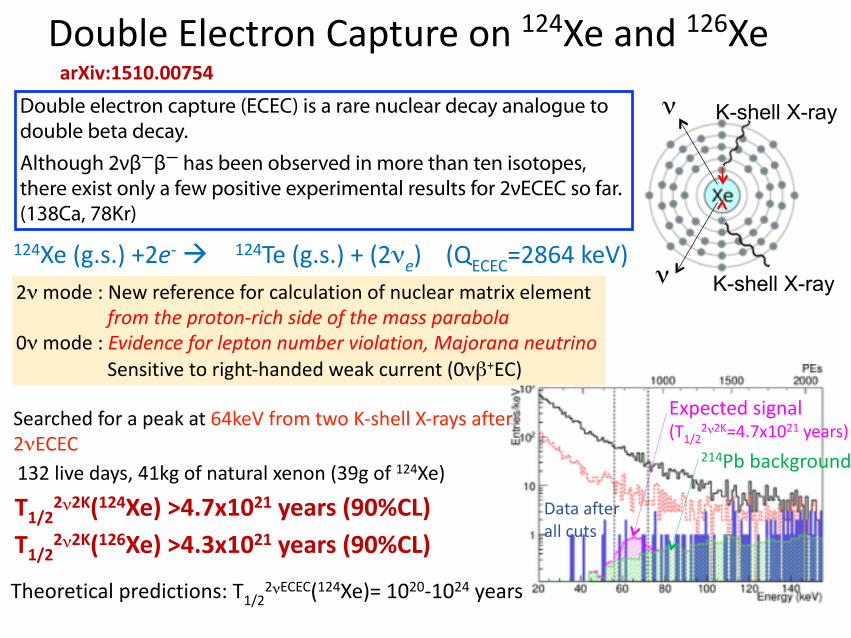
arXiv:1510.00754
Masaki Yamashita
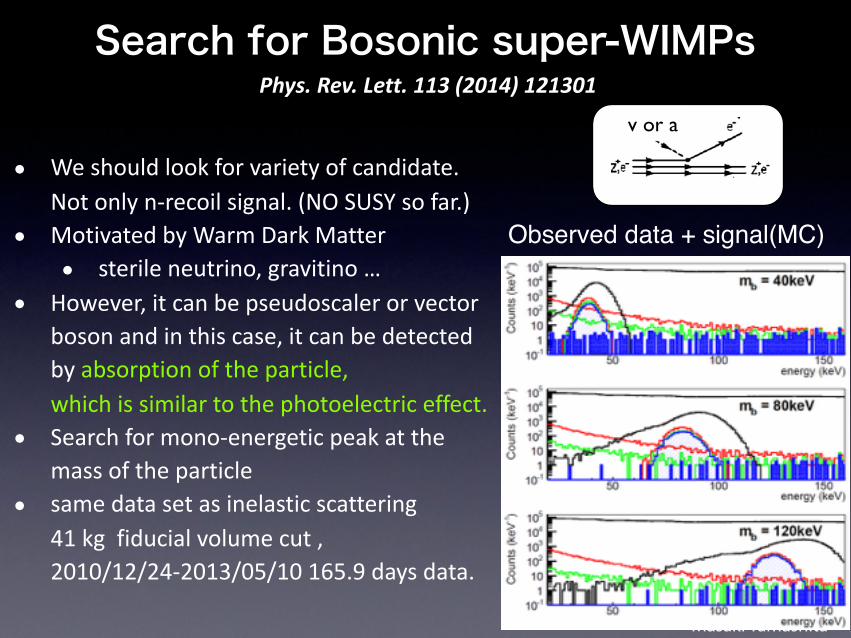
Search for Bosonic super-WIMPsPhys.Rev.Lett.113(2014)121301
v or a
Observed data + signal(MC)
• Weshouldlookforvarietyofcandidate.Notonlyn-recoilsignal.(NOSUSYsofar.)
• MotivatedbyWarmDarkMatter• sterileneutrino,gravitino…
• However,itcanbepseudoscalerorvectorbosonandinthiscase,itcanbedetectedbyabsorptionoftheparticle,whichissimilartothephotoelectriceffect.
• Searchformono-energeticpeakatthemassoftheparticle
• samedatasetasinelasticscattering41kgfiducialvolumecut,2010/12/24-2013/05/10165.9daysdata.
Masaki Yamashita
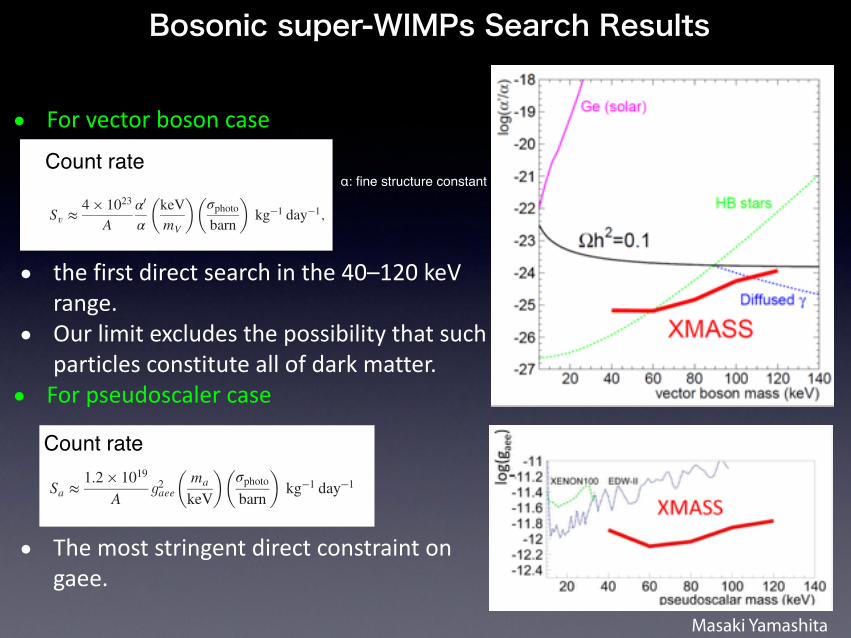
Bosonic super-WIMPs Search Results
• Forvectorbosoncase
• thefirstdirectsearchinthe40–120keVrange.
• Ourlimitexcludesthepossibilitythatsuchparticlesconstituteallofdarkmatter.
• Forpseudoscalercase
• Themoststringentdirectconstraintongaee.
pseudoscalar case. For the vector super-WIMPs search, thisis the first direct detection experiment. The mass rangeof this study is restricted to 40–120 keV. At the low massend, we are limited by increasing background, and at highmasses, the calculations in Ref. [1] are limited to the massof the boson less than 100 keV.The absorption of a vector boson is very similar to
the photoelectric effect when the photon energy ω isreplaced by the vector boson mass mV and the couplingconstant is scaled appropriately. The cross section, there-fore, becomes [1]
σabsvσphotoðω ¼ mVÞc
≈α0
α; ð1Þ
where σabs is the absorption cross section of the vectorbosons on an atom, v is the velocity of the incoming vectorboson, σphoto is the cross section for the photoelectric effect,α is the fine structure constant, and α0 is the vector bosonanalogue to the fine structure constant. For a single atomicspecies of atomic mass A, the counting rate Sv in thedetector becomes [1]
Sv ≈4 × 10²³
Aα0
α
!keVmV
"!σphotobarn
"kg−1 day−1; ð2Þ
where the standard local dark matter density of0.3 GeV=cm3 [4] is used. Valid ranges for the couplingsand masses of thermally produced super-WIMPs arecalculated in Refs. [1,2].The cross section of the axioelectric effect for the
pseudoscalar on the other hand is
σabsvσphotoðω ¼ maÞc
≈3m2
a
4παf2a; ð3Þ
where ma is the mass of the pseudoscalar particle, and fais a dimensionful coupling constant. The counting rate Sanow becomes [1]
Sa ≈1.2 × 10¹⁹
Ag2aee
!ma
keV
"!σphotobarn
"kg−1 day−1; ð4Þ
where gaee ¼ 2me=fa, with me being the electron mass.XMASS-I is a large single-phase liquid-xenon detector
[5] located underground (2700 m water equivalent) at theKamioka Observatory in Japan. An active target of 835 kgof liquid xenon is held inside of a pentakis-dodecahedralcopper structure that holds 642 inward-looking photo-multiplier tubes (PMTs) on its approximately sphericalinner surface. The detector is calibrated regularly byinserting 57Co and 241Am sources along the central verticalaxis of the detector. Measuring with the 57Co source fromthe center of the detector volume the photoelectron yieldis determined to be 13.9 photoelectrons ðp:e:Þ=keVee [6],
where the subscript ee refers to the customary electronequivalent energy deposit. This large photoelectron yield isrealized since the photocathode area covers > 62% of theinner wall with a large quantum efficiency of ∼30% [5].Data acquisition is triggered if 10 or more PMTs havesignals larger than 0.2 p.e. within 200 ns. Each PMT signalis digitized with charge and timing resolution of 0.05 p.e.and 0.4 ns, respectively [7]. The liquid-xenon detector islocated at the center of a water Cherenkov veto counter,which is 11 m high and has a 10 m diameter. The vetocounter is equipped with seventy-two 50 cm PMTs. Dataacquisition for the veto counter is triggered if eight or moreof its PMTs register a signal within 200 ns. XMASS-I is thefirst direct detection dark matter experiment equipped withsuch an active water Cherenkov shield.For both, vector and pseudoscalar type super-WIMPs,
Monte Carlo (MC) signals are generated by injectinggamma rays uniformly over the entire active volume witha gamma energy corresponding to the rest mass of theboson [8]. This procedure exploits the experimentallyrelevant aspect that all the energy of a boson includingits mass given to an electron is identical to that for gammarays at these low energies, albeit with different couplingconstants in Eqs. (1) and (3).In the present analysis, we scale the observed number of
photoelectrons by 1=13.9 to obtain an event energy E inkeVee, without applying the nonlinearity correction ofscintillation light efficiency. The MC simulation includesthis nonlinearity of the scintillation response [5] as wellas corrections derived from the detector calibrations. Theabsolute energy scale of the MC simulation is adjusted at122 keV. The systematic difference of the energy scalebetween data and MC simulation due to imperfect model-ing of the nonlinearity in MC simulation is estimated as3.5% by comparing 241Am data to MC simulation. Thedecay constants of scintillation light and the timingresponse of PMTs are modeled to reproduce the timedistribution observed with the 57Co (122 keV) and 241Am(60 keV) gamma ray sources [9]. The group velocity of thescintillation light in liquid xenon is calculated from therefractive index (∼11 cm=ns for 175 nm) [10].Data taken in the commission phase between December
24, 2010 and May 10, 2012 were used for the presentanalysis. We selected the periods of operation under whatwe designate normal data taking conditions with a stabletemperature (174$ 1.2 K) and pressure (0.160–0.164 MPaabsolute). We have further removed the periods of oper-ation with excessive PMT noise, unstable pedestal levels, orabnormal trigger rates. Total live time is 165.9 day.Event selection proceeds in four stages that we refer to as
cut-1 through cut-4. Cut-1 requires that no outer detectortrigger is associated with the events, that they are separatedfrom the nearest event in time by at least 10 ms, and that therms spread of the inner detector hit timings contributing tothe trigger is less than 100 ns. These criteria eliminate
PRL 113, 121301 (2014) P HY S I CA L R EV I EW LE T T ER Sweek ending
19 SEPTEMBER 2014
121301-2
event rate
Count rate
pseudoscalar case. For the vector super-WIMPs search, thisis the first direct detection experiment. The mass rangeof this study is restricted to 40–120 keV. At the low massend, we are limited by increasing background, and at highmasses, the calculations in Ref. [1] are limited to the massof the boson less than 100 keV.The absorption of a vector boson is very similar to
the photoelectric effect when the photon energy ω isreplaced by the vector boson mass mV and the couplingconstant is scaled appropriately. The cross section, there-fore, becomes [1]
σabsvσphotoðω ¼ mVÞc
≈α0
α; ð1Þ
where σabs is the absorption cross section of the vectorbosons on an atom, v is the velocity of the incoming vectorboson, σphoto is the cross section for the photoelectric effect,α is the fine structure constant, and α0 is the vector bosonanalogue to the fine structure constant. For a single atomicspecies of atomic mass A, the counting rate Sv in thedetector becomes [1]
Sv ≈4 × 10²³
Aα0
α
!keVmV
"!σphotobarn
"kg−1 day−1; ð2Þ
where the standard local dark matter density of0.3 GeV=cm3 [4] is used. Valid ranges for the couplingsand masses of thermally produced super-WIMPs arecalculated in Refs. [1,2].The cross section of the axioelectric effect for the
pseudoscalar on the other hand is
σabsvσphotoðω ¼ maÞc
≈3m2
a
4παf2a; ð3Þ
where ma is the mass of the pseudoscalar particle, and fais a dimensionful coupling constant. The counting rate Sanow becomes [1]
Sa ≈1.2 × 10¹⁹
Ag2aee
!ma
keV
"!σphotobarn
"kg−1 day−1; ð4Þ
where gaee ¼ 2me=fa, with me being the electron mass.XMASS-I is a large single-phase liquid-xenon detector
[5] located underground (2700 m water equivalent) at theKamioka Observatory in Japan. An active target of 835 kgof liquid xenon is held inside of a pentakis-dodecahedralcopper structure that holds 642 inward-looking photo-multiplier tubes (PMTs) on its approximately sphericalinner surface. The detector is calibrated regularly byinserting 57Co and 241Am sources along the central verticalaxis of the detector. Measuring with the 57Co source fromthe center of the detector volume the photoelectron yieldis determined to be 13.9 photoelectrons ðp:e:Þ=keVee [6],
where the subscript ee refers to the customary electronequivalent energy deposit. This large photoelectron yield isrealized since the photocathode area covers > 62% of theinner wall with a large quantum efficiency of ∼30% [5].Data acquisition is triggered if 10 or more PMTs havesignals larger than 0.2 p.e. within 200 ns. Each PMT signalis digitized with charge and timing resolution of 0.05 p.e.and 0.4 ns, respectively [7]. The liquid-xenon detector islocated at the center of a water Cherenkov veto counter,which is 11 m high and has a 10 m diameter. The vetocounter is equipped with seventy-two 50 cm PMTs. Dataacquisition for the veto counter is triggered if eight or moreof its PMTs register a signal within 200 ns. XMASS-I is thefirst direct detection dark matter experiment equipped withsuch an active water Cherenkov shield.For both, vector and pseudoscalar type super-WIMPs,
Monte Carlo (MC) signals are generated by injectinggamma rays uniformly over the entire active volume witha gamma energy corresponding to the rest mass of theboson [8]. This procedure exploits the experimentallyrelevant aspect that all the energy of a boson includingits mass given to an electron is identical to that for gammarays at these low energies, albeit with different couplingconstants in Eqs. (1) and (3).In the present analysis, we scale the observed number of
photoelectrons by 1=13.9 to obtain an event energy E inkeVee, without applying the nonlinearity correction ofscintillation light efficiency. The MC simulation includesthis nonlinearity of the scintillation response [5] as wellas corrections derived from the detector calibrations. Theabsolute energy scale of the MC simulation is adjusted at122 keV. The systematic difference of the energy scalebetween data and MC simulation due to imperfect model-ing of the nonlinearity in MC simulation is estimated as3.5% by comparing 241Am data to MC simulation. Thedecay constants of scintillation light and the timingresponse of PMTs are modeled to reproduce the timedistribution observed with the 57Co (122 keV) and 241Am(60 keV) gamma ray sources [9]. The group velocity of thescintillation light in liquid xenon is calculated from therefractive index (∼11 cm=ns for 175 nm) [10].Data taken in the commission phase between December
24, 2010 and May 10, 2012 were used for the presentanalysis. We selected the periods of operation under whatwe designate normal data taking conditions with a stabletemperature (174$ 1.2 K) and pressure (0.160–0.164 MPaabsolute). We have further removed the periods of oper-ation with excessive PMT noise, unstable pedestal levels, orabnormal trigger rates. Total live time is 165.9 day.Event selection proceeds in four stages that we refer to as
cut-1 through cut-4. Cut-1 requires that no outer detectortrigger is associated with the events, that they are separatedfrom the nearest event in time by at least 10 ms, and that therms spread of the inner detector hit timings contributing tothe trigger is less than 100 ns. These criteria eliminate
PRL 113, 121301 (2014) P HY S I CA L R EV I EW LE T T ER Sweek ending
19 SEPTEMBER 2014
121301-2
Count rate
α: fine structure constant
Expectedsignal (T1/22ν2K=4.7x1021years)
214Pbbackground
Dataafterallcuts
DoubleElectronCaptureon124Xeand126Xe
2νmode:Newreferenceforcalculationofnuclearmatrixelementfromtheproton-richsideofthemassparabola0νmode:Evidenceforleptonnumberviolation,MajorananeutrinoSensitivetoright-handedweakcurrent(0νβ+EC)
124Xe(g.s.)+2e-à 124Te(g.s.)+(2νe)(QECEC=2864keV)
T1/22ν2K(124Xe)>4.7x1021years(90%CL)T1/22ν2K(126Xe)>4.3x1021years(90%CL)
132livedays,41kgofnaturalxenon(39gof124Xe)
Theoreticalpredictions:T1/22νECEC(124Xe)=1020-1024years
K-shell X-ray
K-shell X-ray
ν
ν
Double electron capture (ECEC) is a rare nuclear decay analogue to double beta decay. Although 2νβ−β− has been observed in more than ten isotopes, there exist only a few positive experimental results for 2νECEC so far. (138Ca, 78Kr)
Searchedforapeakat64keVfromtwoK-shellX-raysafter2νECEC
arXiv:1510.00754
Masaki Yamashita
Annual Modulation searchWIMP signal efficiency
]Co57Energy [keV0 0.5 1 1.5 2 2.5 3 3.5 4 4.5 5
Cut
effi
cien
cy
00.10.20.30.40.50.60.70.80.9
1 WIMP220 GeV/c
WIMP210 GeV/c
WIMP28 GeV/c
WIMP26 GeV/c
]Co57Energy [keV
0 1 2 3 4 5
]C
o57
Rat
e [c
ount
s/da
y/kg
/keV
-310
-210
-110
1
10
210
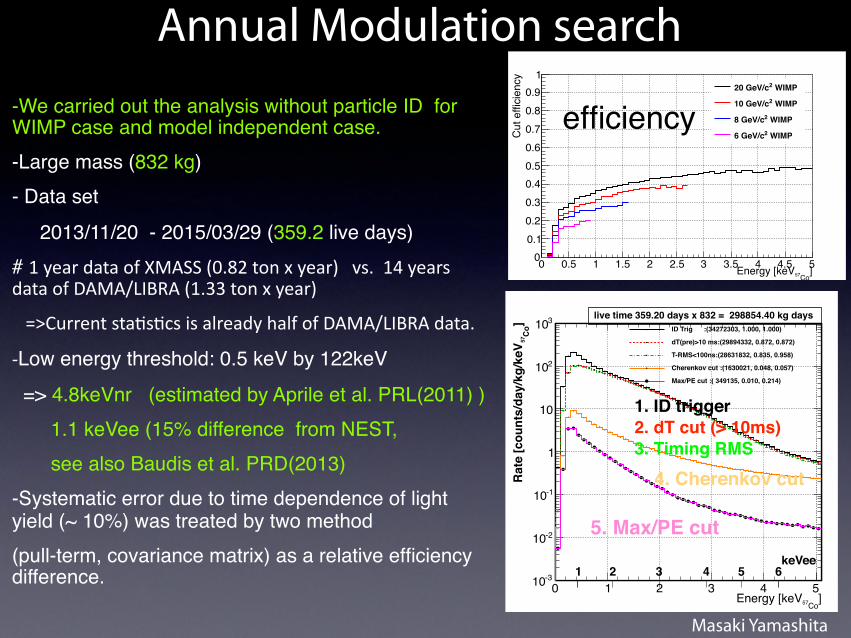
310 ID Trig :(34272303, 1.000, 1.000)
dT(pre)>10 ms:(29894332, 0.872, 0.872)
T-RMS<100ns:(28631832, 0.835, 0.958)
Cherenkov cut :(1630021, 0.048, 0.057)
Max/PE cut :( 349135, 0.010, 0.214)
keVee1 2 3 4 5 6
live time 359.20 days x 832 = 298854.40 kg days
1. ID trigger2. dT cut (> 10ms)3. Timing RMS
4. Cherenkov cut
5. Max/PE cut
-We carried out the analysis without particle ID for WIMP case and model independent case.-Large mass (832 kg)- Data set
2013/11/20 - 2015/03/29 (359.2 live days)# 1yeardataofXMASS(0.82tonxyear)vs.14yearsdataofDAMA/LIBRA(1.33tonxyear)
=>CurrentstaosocsisalreadyhalfofDAMA/LIBRAdata.
-Low energy threshold: 0.5 keV by 122keV
=> 4.8keVnr (estimated by Aprile et al. PRL(2011) ) 1.1 keVee (15% difference from NEST, see also Baudis et al. PRD(2013)-Systematic error due to time dependence of light yield (~ 10%) was treated by two method (pull-term, covariance matrix) as a relative efficiency difference.
efficiency
Masaki Yamashita
WIMP case
Light Yield of LXe
w/o
10GeV,
XMASS Day from 2014.Jan.1
0 100 200 300 400 500
]C
o57
Rat
e [e
vent
s/da
y/kg
/keV
1.15
1.2
1.25
1.3
1.35
1.4
Co570.5-1.0 keV 0.5-1.0 keV(= 4.8-8.0 keVr)
stat errorsystematic error
±1 σ expected±2 σ expected
XMASSXENON100(2012)LUX(2014)
XENON10-S2(2011)
CDMS-Si (2014)CoGeNT (2013)
DAMA/LIBRA(2009 Savage)
XMASS(2013)
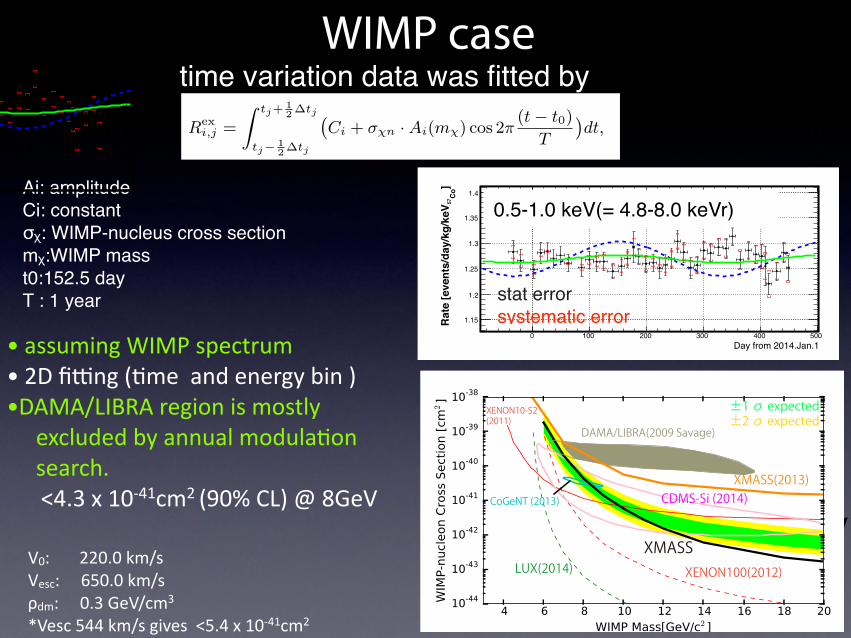
•assumingWIMPspectrum•2Dfiqng(omeandenergybin)•DAMA/LIBRAregionismostly
excludedbyannualmodulaoonsearch.
<4.3x10-41cm2(90%CL)@8GeV
V0:220.0km/sVesc:650.0km/sρdm:0.3GeV/cm3*Vesc544km/sgives<5.4x10-41cm2
time variation data was fitted by
Ai: amplitude Ci: constantσχ: WIMP-nucleus cross sectionmχ:WIMP masst0:152.5 dayT : 1 year
3
tillation light as well as the intrinsic light yield of theliquid xenon scintillator are extracted from the 57Co cal-ibration data the Monte Carlo simulation [17]. With thatwe found that we can trace the observed photoelectronchange in the calibration data as a change as the absorp-tion length, while the scattering length remains stableat 52 cm with a standard deviation of ±0.6%. We thenre-evaluate the absorption length and the relative intrin-sic light yield to see the stability of the scintillation lightresponse by fixing the scattering length at 52 cm. Theabsolute absorption length varied from about 4 m to 11m, but the relative change in the intrinsic light yield stay-ing within ±0.6% over the entire data taking period.
The time dependence of the photoelectron yield a↵ectsthe e�ciency of the cuts. Therefore, we evaluate the ab-sorption length dependence of the relative cut e�cien-cies through Monte Carlo simulation. If we normalizethe overall e�ciency at an absorption length of 8 m, thise�ciency changes from �4% to +2% over the relevantabsorption range. The position dependence of the e�-ciency was taken into account as a correlated system-atic error (⇠ ±2.5%). This is the dominant systematicuncertainty in the present analysis. The second largestcontribution comes from a gain instability of the wave-form digitizer (CAEN V1751) between April 2014 andSeptember 2014 due to a di↵erent textcolorredoperationmethod used in that period. This e↵ect contributes anuncertainty of 0.3% to the energy scale. Other e↵ectsfrom LED calibration, trigger threshold stability, timingcalibration were negligible. The observed count rate aftercuts as a function of time in the energy region between1.1 and 1.6 keV
ee
is shown in Fig. 2. The systematic er-rors caused by the relative cut e�ciencies are also shown.
Day from 2014.Jan.10 100 200 300 400 500
]ee
Rat
e [e
vent
s/da
y/kg
/keV
0.85
0.9
0.95
1
1.05 (4.8 - 6.8 keVnr)ee1.1-1.6 keV
FIG. 2. (color online) Observed count rate as a function oftime in the 1.1 - 1.6 keV
ee
(= 4.8 - 6.8 keVnr
) energy range.The black error bars show the statistical uncertainty of thecount rate. Square brackets indicate the 1� systematic er-ror for each time bin. The solid and dashed curves indicatethe expected count rates assuming 7 and 8 GeV/c2 WIMPsrespectively with a cross section of 2⇥10�40cm2 where theWIMP search sensitivity closed to DAMA/LIBRA.
To retrieve the annual modulation amplitude from thedata, the least squares method for the time-binned data
was used. The data set was divided into 40 time-bins(tbins) with roughly 10 days of live time each. The datain each time-bin were then further divided into energy-bins (Ebins) with a width of 0.5 keV
ee
. Two fitting meth-ods were performed independently. Both of them fit allenergy- and time-bins simultaneously. Method 1 used a‘pull term’ ↵ with �2 defined as:
�2 =EbinsX
i
tbinsX
j
(Rdata
i,j �Rex
i,j � ↵Ki,j)2
�(stat)2i,j + �(sys)2i,j
!+ ↵2, (1)
where Rdata
i,j , Rex
i,j , �(stat)i,j and �(sys)
i,j are data, ex-pected event rate, statistical and systematic error, re-spectively, of the (i-th energy- and j-th time-) bin. Thetime is denoted as the number of days from January 1,2014. Ki,j represents the 1� correlated systematic erroron the expected event rate based on the relative cut ef-ficiency in that bin. Method 2 used a covariance matrixto propagate the e↵ects of the systematic error. Its �2
was defined as:
�2 =NbinsX
k,l
(Rdata
k �Rex
k )(Vstat
+Vsys
)�1
kl (Rdata
l �Rex
l ), (2)
where Nbins
(= Ebins⇥tbins) was the total number of bins
and Rdata(ex)
k is the event rate where k = i · tbins+j. Thematrix V
stat
contains the statistical uncertainties of thebins, and V
sys
is the covariance matrix of the systematicuncertainties as derived from the relative cut e�ciency.
We performed two analyses, one assumed WIMP in-teractions, the other one was independent of any specificdark matter model. Hereafter we call the former case asa WIMP model and the latter case for a model indepen-dent analysis.
In the case of the WIMP model, the expected modu-lation amplitudes become a function of the WIMP massAi(m�) as the WIMP mass m� determines the recoil en-ergy spectrum. The expected rate in a bin then becomes:
Rex
i,j =
Z tj+12�tj
tj� 12�tj
�Ci + ��n ·Ai(m�) cos 2⇡
(t� t0
)
T
�dt, (3)
where ��n is the WIMP-nucleon cross section. To ob-tain the WIMP-nucleon cross section the data was fittedin the energy range of 1.1-15 keV
ee
. We assume a stan-dard spherical isothermal galactic halo model with themost probable speed of v
0
=220 km/s, the Earth’s ve-locity relative to the dark matter distribution of vE =232+ 15 sin2⇡(t� t
0
)/T km/s, and a galactic escape ve-locity of vesc = 650 km/s, a local dark matter densityof 0.3 GeV/cm3, following [18]. In the analysis, the sig-nal e�ciencies for each WIMP mass are estimated fromMonte Carlo simulation of uniformly distributed nuclearrecoil events in the liquid xenon volume. The system-atic error of the e�ciencies comes from the uncertaintyof liquid xenon scintillation decay time of 25±1 ns [5]
Masaki Yamashita, ICRR, Univ of Tokyo]
Co57Energy[keV0 0.5 1 1.5 2 2.5 3 3.5 4 4.5 5
]Co
57Am
plitu
de[e
vent
s/da
y/kg
/keV
-0.15
-0.1
-0.05
0
0.05
0.1
0.15
σ 1±Expected
σ 2±Expected
Electron Equivalent Energy [keVee]1 2 3 4 5 6
Nuclear Recoil Energy [keVnr]5 10 15 20 25
σ 1±Expected
σ 2±Expected
method 1method 2
]Co57Energy[keV0 1 2 3 4 5
Effic
ienc
y
0.2
0.4
0.6
0.8
Model Independent Case3
tillation light as well as the intrinsic light yield of theliquid xenon scintillator are extracted from the 57Co cal-ibration data the Monte Carlo simulation [17]. With thatwe found that we can trace the observed photoelectronchange in the calibration data as a change as the absorp-tion length, while the scattering length remains stableat 52 cm with a standard deviation of ±0.6%. We thenre-evaluate the absorption length and the relative intrin-sic light yield to see the stability of the scintillation lightresponse by fixing the scattering length at 52 cm. Theabsolute absorption length varied from about 4 m to 11m, but the relative change in the intrinsic light yield stay-ing within ±0.6% over the entire data taking period.
The time dependence of the photoelectron yield a↵ectsthe e�ciency of the cuts. Therefore, we evaluate the ab-sorption length dependence of the relative cut e�cien-cies through Monte Carlo simulation. If we normalizethe overall e�ciency at an absorption length of 8 m, thise�ciency changes from �4% to +2% over the relevantabsorption range. The position dependence of the e�-ciency was taken into account as a correlated system-atic error (⇠ ±2.5%). This is the dominant systematicuncertainty in the present analysis. The second largestcontribution comes from a gain instability of the wave-form digitizer (CAEN V1751) between April 2014 andSeptember 2014 due to a di↵erent textcolorredoperationmethod used in that period. This e↵ect contributes anuncertainty of 0.3% to the energy scale. Other e↵ectsfrom LED calibration, trigger threshold stability, timingcalibration were negligible. The observed count rate aftercuts as a function of time in the energy region between1.1 and 1.6 keV
ee
is shown in Fig. 2. The systematic er-rors caused by the relative cut e�ciencies are also shown.
Day from 2014.Jan.10 100 200 300 400 500
]ee
Rat
e [e
vent
s/da
y/kg
/keV
0.85
0.9
0.95
1
1.05 (4.8 - 6.8 keVnr)ee1.1-1.6 keV
FIG. 2. (color online) Observed count rate as a function oftime in the 1.1 - 1.6 keV
ee
(= 4.8 - 6.8 keVnr
) energy range.The black error bars show the statistical uncertainty of thecount rate. Square brackets indicate the 1� systematic er-ror for each time bin. The solid and dashed curves indicatethe expected count rates assuming 7 and 8 GeV/c2 WIMPsrespectively with a cross section of 2⇥10�40cm2 where theWIMP search sensitivity closed to DAMA/LIBRA.
To retrieve the annual modulation amplitude from thedata, the least squares method for the time-binned data
was used. The data set was divided into 40 time-bins(tbins) with roughly 10 days of live time each. The datain each time-bin were then further divided into energy-bins (Ebins) with a width of 0.5 keV
ee
. Two fitting meth-ods were performed independently. Both of them fit allenergy- and time-bins simultaneously. Method 1 used a‘pull term’ ↵ with �2 defined as:
�2 =EbinsX
i
tbinsX
j
(Rdata
i,j �Rex
i,j � ↵Ki,j)2
�(stat)2i,j + �(sys)2i,j
!+ ↵2, (1)
where Rdata
i,j , Rex
i,j , �(stat)i,j and �(sys)
i,j are data, ex-pected event rate, statistical and systematic error, re-spectively, of the (i-th energy- and j-th time-) bin. Thetime is denoted as the number of days from January 1,2014. Ki,j represents the 1� correlated systematic erroron the expected event rate based on the relative cut ef-ficiency in that bin. Method 2 used a covariance matrixto propagate the e↵ects of the systematic error. Its �2
was defined as:
�2 =NbinsX
k,l
(Rdata
k �Rex
k )(Vstat
+Vsys
)�1
kl (Rdata
l �Rex
l ), (2)
where Nbins
(= Ebins⇥tbins) was the total number of bins
and Rdata(ex)
k is the event rate where k = i · tbins+j. Thematrix V
stat
contains the statistical uncertainties of thebins, and V
sys
is the covariance matrix of the systematicuncertainties as derived from the relative cut e�ciency.
We performed two analyses, one assumed WIMP in-teractions, the other one was independent of any specificdark matter model. Hereafter we call the former case asa WIMP model and the latter case for a model indepen-dent analysis.
In the case of the WIMP model, the expected modu-lation amplitudes become a function of the WIMP massAi(m�) as the WIMP mass m� determines the recoil en-ergy spectrum. The expected rate in a bin then becomes:
Rex
i,j =
Z tj+12�tj
tj� 12�tj
�Ci + ��n ·Ai(m�) cos 2⇡
(t� t0
)
T
�dt, (3)
where ��n is the WIMP-nucleon cross section. To ob-tain the WIMP-nucleon cross section the data was fittedin the energy range of 1.1-15 keV
ee
. We assume a stan-dard spherical isothermal galactic halo model with themost probable speed of v
0
=220 km/s, the Earth’s ve-locity relative to the dark matter distribution of vE =232+ 15 sin2⇡(t� t
0
)/T km/s, and a galactic escape ve-locity of vesc = 650 km/s, a local dark matter densityof 0.3 GeV/cm3, following [18]. In the analysis, the sig-nal e�ciencies for each WIMP mass are estimated fromMonte Carlo simulation of uniformly distributed nuclearrecoil events in the liquid xenon volume. The system-atic error of the e�ciencies comes from the uncertaintyof liquid xenon scintillation decay time of 25±1 ns [5]
3
tillation light as well as the intrinsic light yield of theliquid xenon scintillator are extracted from the 57Co cal-ibration data the Monte Carlo simulation [17]. With thatwe found that we can trace the observed photoelectronchange in the calibration data as a change as the absorp-tion length, while the scattering length remains stableat 52 cm with a standard deviation of ±0.6%. We thenre-evaluate the absorption length and the relative intrin-sic light yield to see the stability of the scintillation lightresponse by fixing the scattering length at 52 cm. Theabsolute absorption length varied from about 4 m to 11m, but the relative change in the intrinsic light yield stay-ing within ±0.6% over the entire data taking period.
The time dependence of the photoelectron yield a↵ectsthe e�ciency of the cuts. Therefore, we evaluate the ab-sorption length dependence of the relative cut e�cien-cies through Monte Carlo simulation. If we normalizethe overall e�ciency at an absorption length of 8 m, thise�ciency changes from �4% to +2% over the relevantabsorption range. The position dependence of the e�-ciency was taken into account as a correlated system-atic error (⇠ ±2.5%). This is the dominant systematicuncertainty in the present analysis. The second largestcontribution comes from a gain instability of the wave-form digitizer (CAEN V1751) between April 2014 andSeptember 2014 due to a di↵erent textcolorredoperationmethod used in that period. This e↵ect contributes anuncertainty of 0.3% to the energy scale. Other e↵ectsfrom LED calibration, trigger threshold stability, timingcalibration were negligible. The observed count rate aftercuts as a function of time in the energy region between1.1 and 1.6 keV
ee
is shown in Fig. 2. The systematic er-rors caused by the relative cut e�ciencies are also shown.
Day from 2014.Jan.10 100 200 300 400 500
]ee
Rat
e [e
vent
s/da
y/kg
/keV
0.85
0.9
0.95
1
1.05 (4.8 - 6.8 keVnr)ee1.1-1.6 keV
FIG. 2. (color online) Observed count rate as a function oftime in the 1.1 - 1.6 keV
ee
(= 4.8 - 6.8 keVnr
) energy range.The black error bars show the statistical uncertainty of thecount rate. Square brackets indicate the 1� systematic er-ror for each time bin. The solid and dashed curves indicatethe expected count rates assuming 7 and 8 GeV/c2 WIMPsrespectively with a cross section of 2⇥10�40cm2 where theWIMP search sensitivity closed to DAMA/LIBRA.
To retrieve the annual modulation amplitude from thedata, the least squares method for the time-binned data
was used. The data set was divided into 40 time-bins(tbins) with roughly 10 days of live time each. The datain each time-bin were then further divided into energy-bins (Ebins) with a width of 0.5 keV
ee
. Two fitting meth-ods were performed independently. Both of them fit allenergy- and time-bins simultaneously. Method 1 used a‘pull term’ ↵ with �2 defined as:
�2 =EbinsX
i
tbinsX
j
(Rdata
i,j �Rex
i,j � ↵Ki,j)2
�(stat)2i,j + �(sys)2i,j
!+ ↵2, (1)
where Rdata
i,j , Rex
i,j , �(stat)i,j and �(sys)
i,j are data, ex-pected event rate, statistical and systematic error, re-spectively, of the (i-th energy- and j-th time-) bin. Thetime is denoted as the number of days from January 1,2014. Ki,j represents the 1� correlated systematic erroron the expected event rate based on the relative cut ef-ficiency in that bin. Method 2 used a covariance matrixto propagate the e↵ects of the systematic error. Its �2
was defined as:
�2 =NbinsX
k,l
(Rdata
k �Rex
k )(Vstat
+Vsys
)�1
kl (Rdata
l �Rex
l ), (2)
where Nbins
(= Ebins⇥tbins) was the total number of bins
and Rdata(ex)
k is the event rate where k = i · tbins+j. Thematrix V
stat
contains the statistical uncertainties of thebins, and V
sys
is the covariance matrix of the systematicuncertainties as derived from the relative cut e�ciency.
We performed two analyses, one assumed WIMP in-teractions, the other one was independent of any specificdark matter model. Hereafter we call the former case asa WIMP model and the latter case for a model indepen-dent analysis.
In the case of the WIMP model, the expected modu-lation amplitudes become a function of the WIMP massAi(m�) as the WIMP mass m� determines the recoil en-ergy spectrum. The expected rate in a bin then becomes:
Rex
i,j =
Z tj+12�tj
tj� 12�tj
�Ci + ��n ·Ai(m�) cos 2⇡
(t� t0
)
T
�dt, (3)
where ��n is the WIMP-nucleon cross section. To ob-tain the WIMP-nucleon cross section the data was fittedin the energy range of 1.1-15 keV
ee
. We assume a stan-dard spherical isothermal galactic halo model with themost probable speed of v
0
=220 km/s, the Earth’s ve-locity relative to the dark matter distribution of vE =232+ 15 sin2⇡(t� t
0
)/T km/s, and a galactic escape ve-locity of vesc = 650 km/s, a local dark matter densityof 0.3 GeV/cm3, following [18]. In the analysis, the sig-nal e�ciencies for each WIMP mass are estimated fromMonte Carlo simulation of uniformly distributed nuclearrecoil events in the liquid xenon volume. The system-atic error of the e�ciencies comes from the uncertaintyof liquid xenon scintillation decay time of 25±1 ns [5]
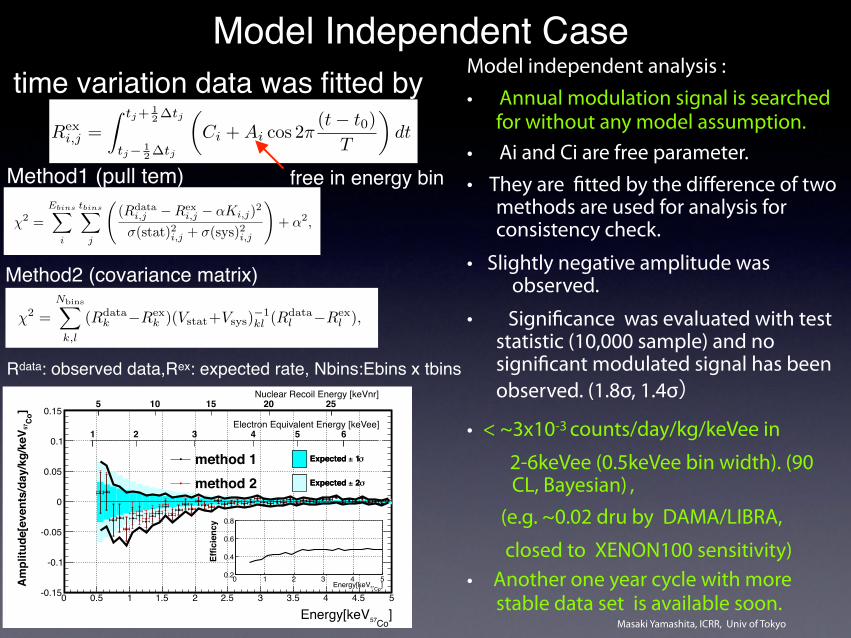
Method1 (pull tem)
Method2 (covariance matrix)
Rdata: observed data,Rex: expected rate, Nbins:Ebins x tbins
Model independent analysis :
• Annual modulation signal is searched for without any model assumption.
• Ai and Ci are free parameter. • They are fitted by the difference of two
methods are used for analysis for consistency check.
• Slightly negative amplitude was observed.
• Significance was evaluated with test statistic (10,000 sample) and no significant modulated signal has been observed. (1.8σ, 1.4σ)
• < ~3x10⁻³ counts/day/kg/keVee in
2-6keVee (0.5keVee bin width). (90 CL, Bayesian) ,
(e.g. ~0.02 dru by DAMA/LIBRA,
closed to XENON100 sensitivity)
• Another one year cycle with more stable data set is available soon.
4
and is estimated as about 5% in this analysis. The ex-pected count rate for WIMP masses of 7 and 8 GeV/c2
with a cross section of 2⇥10�40 cm2 for the spin indepen-dent case are shown in Fig. 2 as a function of time afterall cuts. This demonstrates the high sensitivity of theXMASS detector to modulation. As both methods foundno significant signal, the 90% C.L. upper limit by method1 on the WIMP-nucleon cross section is shown in Fig. 3.The exclusion upper limit of 4.3⇥10�41cm2 at 8 GeV/c2
was obtained. The �1� scintillation e�ciency of [22] wasused to obtain a conservative limit. To evaluate the sen-sitivity of WIMP-nucleon cross section, we carried out astatistical test by applying the same analysis to 10,000dummy samples with the same statistical and systematicerrors as data but without modulation by the following aprocedure. At first, time-averaged energy spectrum wasobtained from the observed data. Then, we performeda toy Monte Carlo simulation to simulate time variationof event rate of background at each energy bin assum-ing the same live time as data and including systematicuncertainties. The ±1� and ±2� bands in Fig. 3 out-line the expected 90% C.L. upper limit band for the no-modulation hypothesis using the dummy samples. Theresult excludes the DAMA/LIBRA allowed region as in-terpreted in [8] for WIMP masses higher than 8 GeV/c2.This limit is consistent between two di↵erence of anal-ysis methods (less than 10% for the cross section) andstill excludes in di↵erent astrophysical assumptions (up-per limit of 5.4⇥10�41cm2 in the case of vesc = 544 km/s[24]). The best fit parameters in a wider mass range isa cross section of 3.2⇥10�42 cm2 for a WIMP mass of140 GeV/c2. This yields a statistical significance of 2.7�,however, in this case, the expected unmodulated eventrate exceeds the total observed event rate by a factor of2, therefore these parameters were deemed unphysical.
For the model independent case, the expected eventrate was estimated as:
Rex
i,j =
Z tj+ 12�tj
tj� 12�tj
✓Ci +Ai cos 2⇡
(t� t0
)
T
◆dt, (4)
where the free parameters Ci and Ai were the unmodu-lated event rate and the modulation amplitude, respec-tively. t
0
and T were the phase and period of the mod-ulation, and tj and �tj was the time-bin’s center andwidth, respectively. In the fitting procedure, the 1.1–7.6keVee energy range was used and the modulation pe-riod T was fixed to one year and the phase t
0
to 152.5days (⇠2nd of June) when the Earth’s velocity relativeto the dark matter distribution is expected to be maxi-mal. Figure 4 shows the best fit amplitudes as a func-tion of energy for method 1 after correcting for the ef-ficiency. The e�ciency was evaluated from gamma rayMonte Carlo simulation with a flat energy spectrum uni-formly distributed in the sensitive volume (Fig. 4 inset).Both methods are in good agreement and find a nega-tive amplitude below 4 keV
ee
. The ±1� and ±2� bands
±1 σ expected±2 σ expected
XMASSXENON100(2012)LUX(2014)
XENON10-S2(2011)
CDMS-Si (2014)CoGeNT (2013)
DAMA/LIBRA(2009 Savage)
XMASS(2013)
FIG. 3. (color online) Limits on the spin-independent elasticWIMP-nucleon cross section as a function of WIMP mass.The solid line shows the XMASS 90% C.L. exclusion fromthe annual modulation analysis. The ±1� and ±2� bandsrepresent the expected 90% exclusion distributions. Limits aswell as allowed regions from other searches based on countingmethod are also shown [2, 3, 5, 8–10, 23].
in Fig. 4 represent expected amplitude coverage derivedfrom same dummy sample above by method 1. This testgave a p-value of 0.014 (2.5�) for method 1 and of 0.068(1.8�) for method 2. For both methods the model in-dependent amplitudes found in the data are consistentwith background fluctuations. To be able to test anymodel of dark matter, we evaluated the constraints onthe positive and negative amplitude separately in Fig. 4.The upper limits on the amplitudes in each energy binwere calculated by considering only regions of positive ornegative amplitude. They were calculated by integratingGaussian distributions based on the mean and sigma ofdata (=G(a)) from zero. The positive or negative upperlimits are satisfied with 0.9 for
R aup
0
G(a)da/R10
G(a)da
orR0
aupG(a)da/
R0
�1 G(a)da, where a and aup are the
amplitude and its 90% C.L. upper limit, respectively.Method 1 obtained positive (negative) upper limit of2.1(�2.1) ⇥ 10�2 events/day/kg/keV
ee
between 1.1 and1.6 keV
ee
and the limits become stricter at higher en-ergy. The energy resolution (�/E) at 1.0 (5.0) keV
ee
isestimated to be 36% (19%) comparing gamma ray cal-ibrations and its Monte Carlo simulation. As a guide-line, we make direct comparisons with other experi-ments not by considering a specific dark matter modelbut only count rate. The maximum amplitude of ⇠2.5 ⇥ 10�2 events/day/kg/keV
ee
between 2.5 and 3.0keV
ee
was obtained by DAMA/LIBRA in [11] whileXMASS obtains a positive upper limit of 3.0 ⇥ 10�3
events/day/kg/keVee
and this limit is lower than theircount rate. XENON100[16] obtained annual modu-lation amplitude (2.7±0.8)⇥10�3 counts/day/kg/keVee
(2.0–5.8 keVee) while XMASS gives (�4.0 ± 1.3)⇥10�3
counts/day/kg/keVee
(2.0–6.0 keVee
) with p-value of
time variation data was fitted by
free in energy bin
Masaki Yamashita
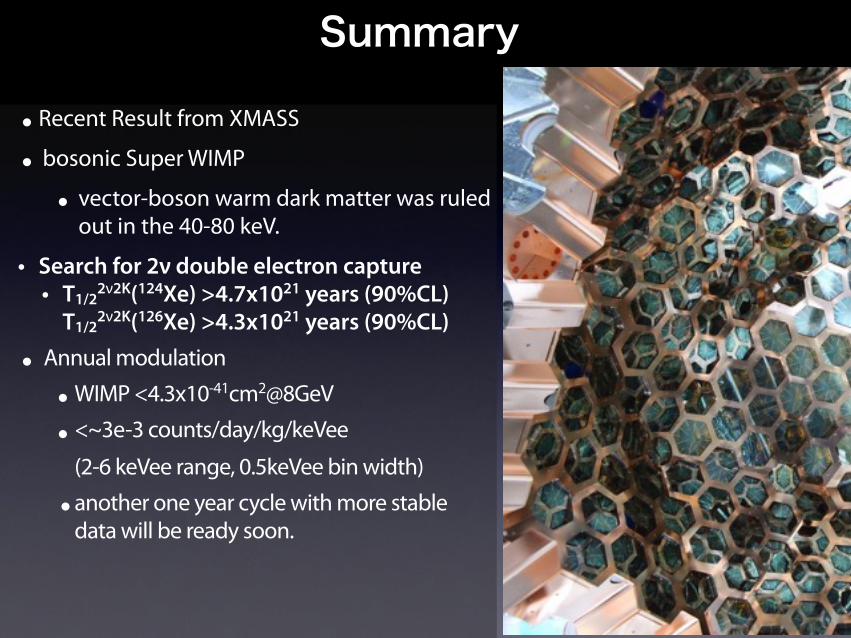
Summary
• Recent Result from XMASS
• bosonic Super WIMP
• vector-boson warm dark matter was ruled out in the 40-80 keV.
• Search for 2ν double electron capture • T1/2
2ν2K(124Xe) >4.7x10²¹ years (90%CL) T1/2
2ν2K(126Xe) >4.3x10²¹ years (90%CL)
• Annual modulation
•WIMP <4.3x10-41cm2@8GeV
• <~3e-3 counts/day/kg/keVee
(2-6 keVee range, 0.5keVee bin width)
•another one year cycle with more stable data will be ready soon.