Embed Size (px)
Citation preview
OPER 576 Project Management
Reducing Project Duration or Project Crashing
Greg Magnan, Ph.D.
May 20, 2004

Project Life Cycle Stages

Recall Pert/CPM Estimates
TaskImmediate
Predecesors Optimistic Most Likely PessimisticA None 3 6 15B None 2 4 14C A 6 12 30D A 2 5 8E C 5 11 17F D 3 6 15G B 3 9 27H E,F 1 4 7I G,H 4 19 28

More PERT/CPM Estimates
64)( cbajET ++
=
22
6⎟⎠⎞
⎜⎝⎛ −
=ac
jσ
• Activity Time Estimates for beta distribution– a: optimistic time, usually about 1 percent chance
activity can be completed within a– b: most likely time– c: pessimistic time, usually about 1 percent chance that
activity will take longer than c.
• Activity j’s expected time (b distribution)
• Activity j’s variance (b distribution)

PERT Notation
D -- the desired project duration
Te -- expected project duration ∑ ∈=
pathcriticalanyje jETT one
)(
Critical path variance = ∑ ∈ pathcriticaloneanyj j 2σ
Z = number of standard normal deviates from mean = VariancePath Critical
eTD −

Project Completion ProbabilityWhat is the probability of finishing this project in less than 53 days?
p(t < D)
TE = 54
Z = D - TE
cp2σ∑
tD=53
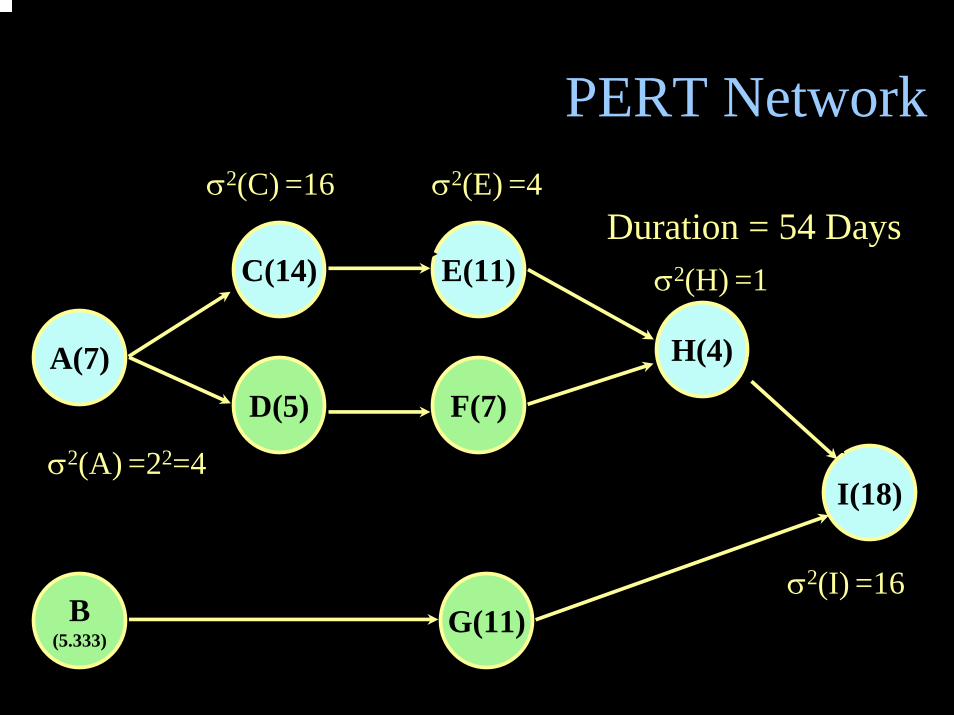
PERT Network
A(7)
B(5.333)
C(14)
D(5)
E(11)
F(7)
H(4)
G(11)
I(18)
Duration = 54 Days
σ2(A) =22=4
σ2(C) =16 σ2(E) =4
σ2(H) =1
σ2(I) =16

22
6Optim(j) - Pessim(j). = ⎟
⎠⎞
⎜⎝⎛
jσ
Task Optimistic Most Likely Pessimistic VarianceA 3 6 15 4B 2 4 14C 6 12 30 16D 2 5 8E 5 11 17 4F 3 6 15G 3 9 27H 1 4 7 1I 4 19 28 16
(Sum the variance along the critical path.) σ 2∑ = 41= 41
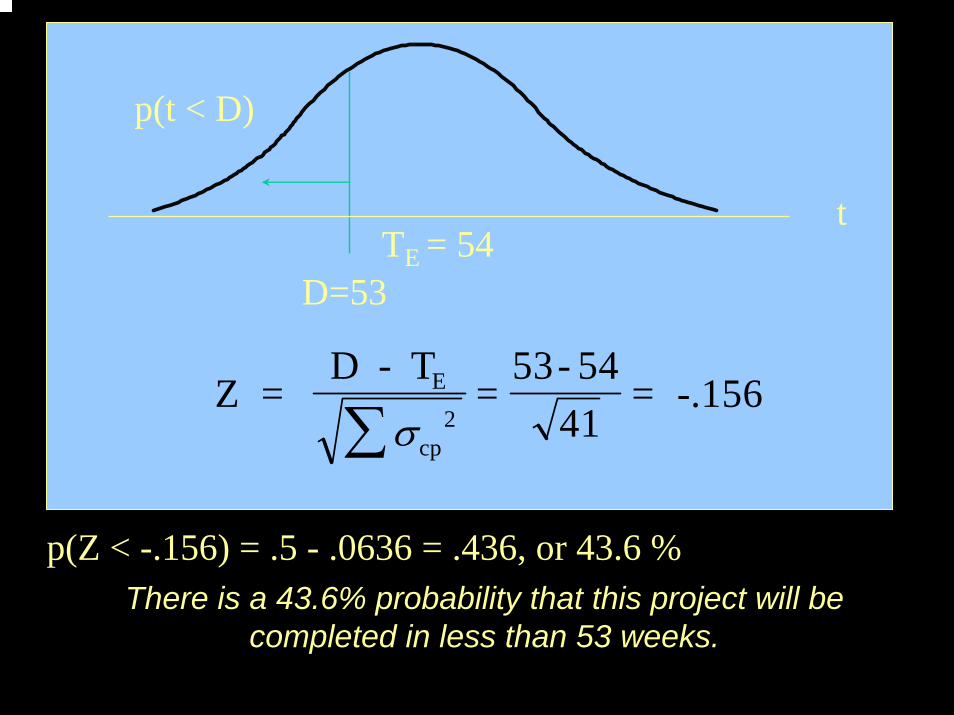
Z = D - T
=53- 54
41= -.156E
cp2σ∑
TE = 54
p(t < D)
t
D=53
There is a 43.6% probability that this project will be completed in less than 53 weeks.
p(Z < -.156) = .5 - .0636 = .436, or 43.6 %

Crashing Activities• Activity & project duration may be influenced by resource
allocation decisions…more resources—less time needed• Sometimes, we can expedite completion of a task by assigning
more people or equipment. Thus, total direct costs tend to vary inversely with project duration. Indirect costs, however, tend to increase with overall project completion time.
TotalCosts
IndirectCosts
DirectCosts
Project duration
Expe
nse
Time-Cost Tradeoffs in CPM• Basic Assumption: Some activities can be
expedited, at a cost• Why accelerate an activity?
– Complete the task in a shorter duration, thereby reducing the duration of the critical path, thereby reducing the length of the project• Avoid late penalties• Earn early completion incentive payments
• Time Cost Problem: Determine the optimum project duration based on time-cost tradeoffs
Project & Activity Costs• PROJECT DIRECT COSTS: Directly assigned to
work package or activity– “Normal” costs for “normal” time
• Direct labor expenses• Materials• Equipment• Subcontractors
• INDIRECT EXPENSES: Cannot be associated with any work package or activity– Overhead expenses
• including supervisory expenses• administration• contractual penalties or early completion incentives
– Consulting

Time & Costs: Normal vs. Crash• For the time-only CPM project schedule, we
typically assume that activity duration is fixed at its NORMAL TIME, or the duration with the lowest direct activity cost (i.e., NORMAL COST).
• However, some activities may be expedited if higher resource levels are available. The shortest activity duration is called CRASH TIME. The cost to complete an activity in that amount of time is called CRASH COST.

Linear Time-Cost TradeoffIn theory, the normal or expected duration of a task can be reduced by assigning additional resources to the task
Cost
Crash Point
Normal Point
Slope (bj) = Increase in cost by reducing task by one time unit
Normal cost
Crash cost Cj
c
CjN
TimeNormal time tjCrash timetj
c N
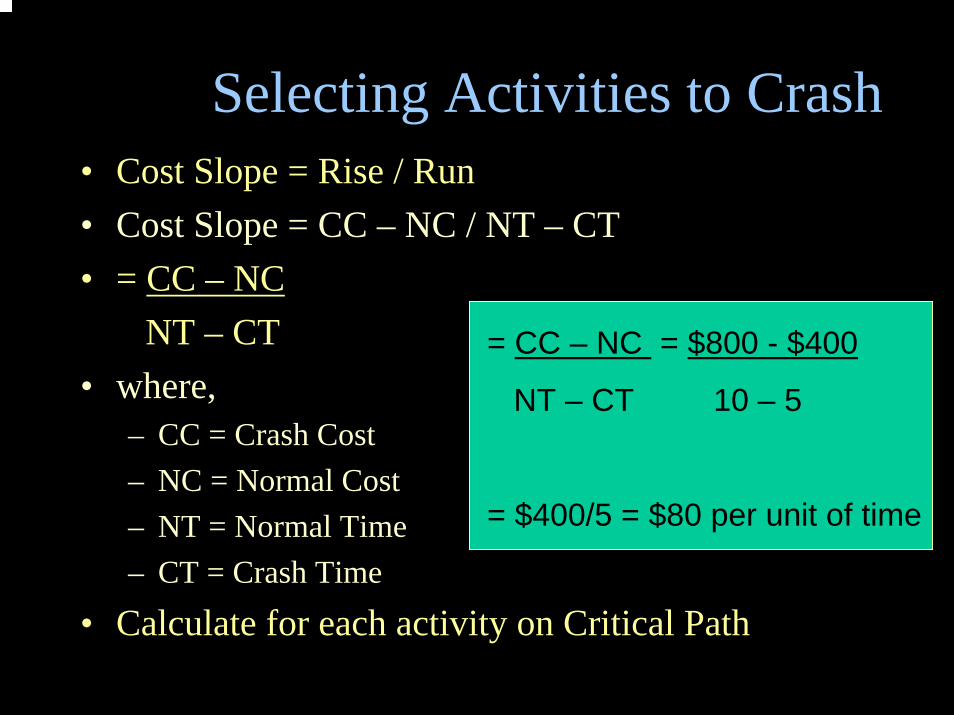
Selecting Activities to Crash• Cost Slope = Rise / Run• Cost Slope = CC – NC / NT – CT• = CC – NC
NT – CT• where,
– CC = Crash Cost– NC = Normal Cost– NT = Normal Time– CT = Crash Time
• Calculate for each activity on Critical Path
= CC – NC = $800 - $400
NT – CT 10 – 5
= $400/5 = $80 per unit of time

Balancing Overhead & Direct Costs
Project Duration
Cost
Indirect (overhead)
Costs
Direct Costs
Total Cost
Crash Time
Normal TimeMinimum Cost Solution

Software Project Schedules“Observe that for the programmer, as for the chef, the urgency of the patron may govern the scheduled completion of the task, but it cannot govern the actual completion. An omelet, promised in ten minutes, may appear to be progressing nicely. But when it has not set in ten minutes, the customer has two choices--wait or eat it raw. Software customers have the same choices.
The cook has another choice; he can turn up the heat. The result is often an omelet nothing can save--burned in one part, raw in another.”
F.P. Brooks, “The Mythical Man-Month”, Datamation, Vol. 20, No 12 (Dec, 1974), pp. 44-52.
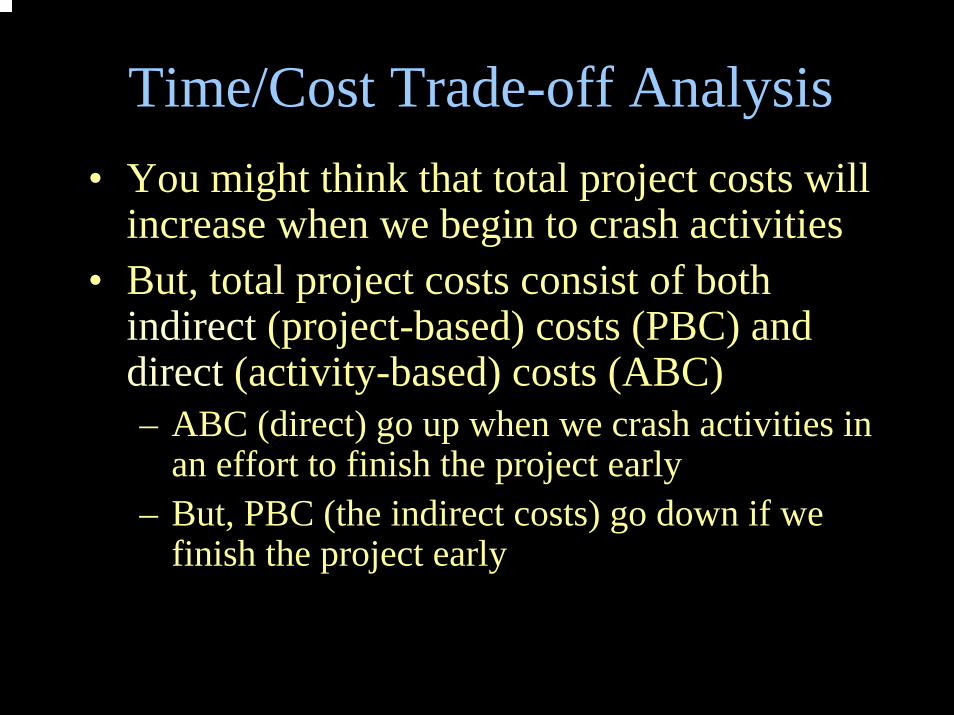
Time/Cost Trade-off Analysis• You might think that total project costs will
increase when we begin to crash activities• But, total project costs consist of both
indirect (project-based) costs (PBC) and direct (activity-based) costs (ABC)– ABC (direct) go up when we crash activities in
an effort to finish the project early– But, PBC (the indirect costs) go down if we
finish the project early

Which Activities are the Best Candidates for Crashing?
• Any activity that is on the critical path• Activities with relatively long durations• Bottleneck activities (that appear on multiple
critical paths)• Activities with relatively low costs to crash• Activities that are not likely to cause quality
problems if crashed• Activities that occur relatively early in the
schedule and are labor intensive

Options for Crashing Activities• Adding Resources• Outsourcing Project Work• Overtime• Establishing Core Project Team• Temporary Fixes• Fast-Tracking• Critical Chain PM• Brainstorming• Reducing Scope• Phasing Project Deliverables

Potential Problems with Crashing • Reduced flexibility and less margin for
error increased risk of failure to complete project on time
• Raises potential for poor quality• Increases potential for staff burnout, stress, and
turnover (from what Yourdon calls Death March projects)
• Raises activity-based costs• May negatively affect other projects• May create unrealistic expectations for future
projects• Hard to know true indirect costs
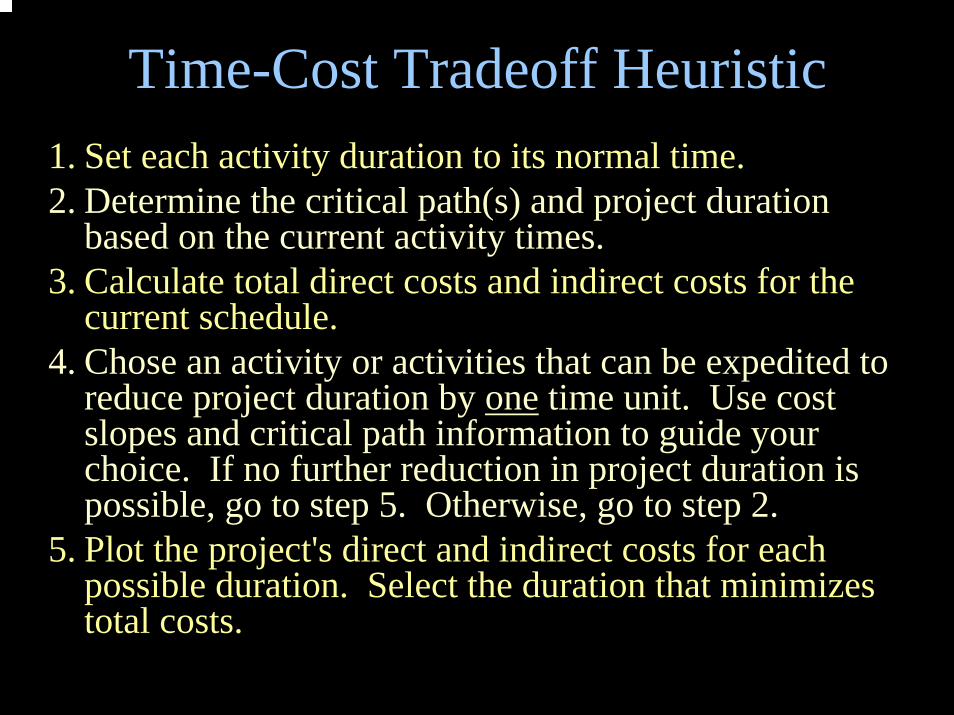
Time-Cost Tradeoff Heuristic1. Set each activity duration to its normal time.2. Determine the critical path(s) and project duration
based on the current activity times.3. Calculate total direct costs and indirect costs for the
current schedule.4. Chose an activity or activities that can be expedited to
reduce project duration by one time unit. Use cost slopes and critical path information to guide your choice. If no further reduction in project duration is possible, go to step 5. Otherwise, go to step 2.
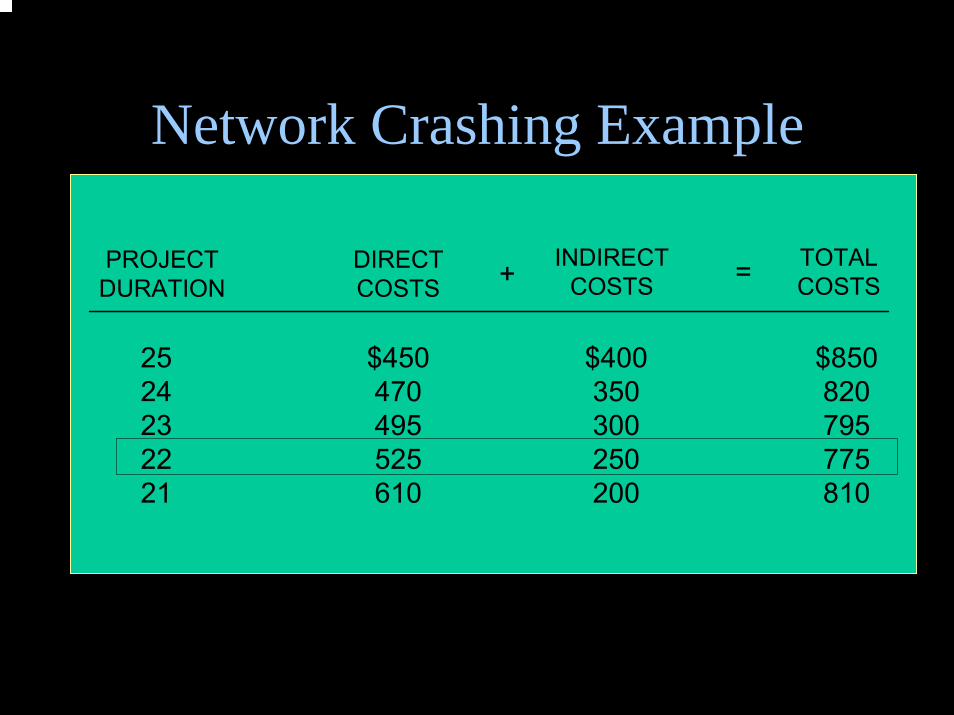
5. Plot the project's direct and indirect costs for each possible duration. Select the duration that minimizes total costs.

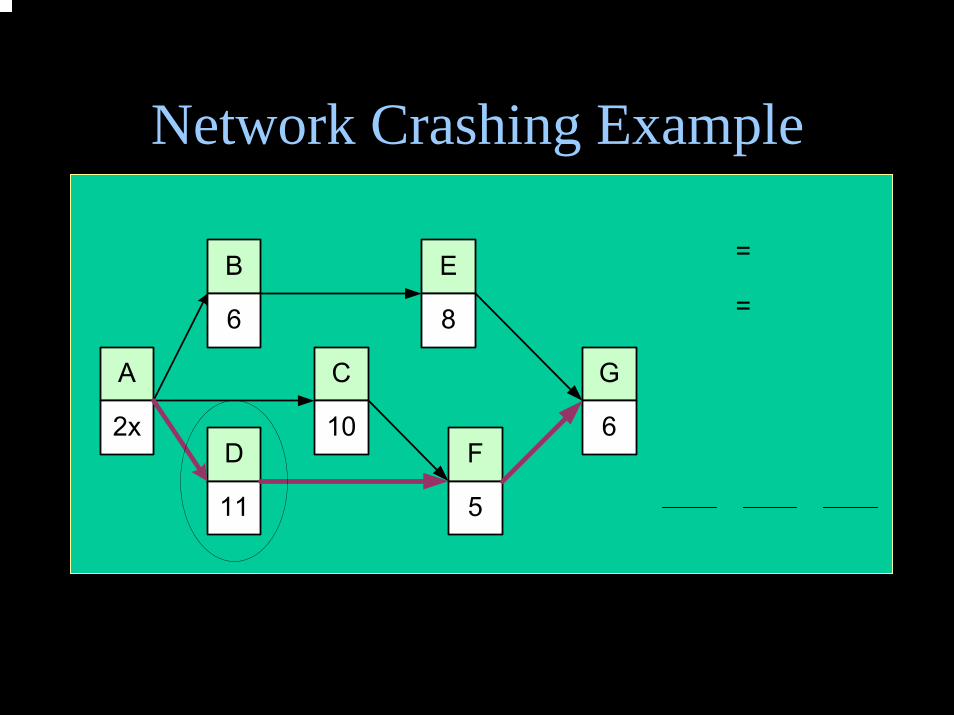
Network Crashing Example

Network Crashing Example
Network Crashing Example

Network Crashing ExampleTotal
Direct Cost $495
TotalDuration 23 units
Activities Changed
D$25
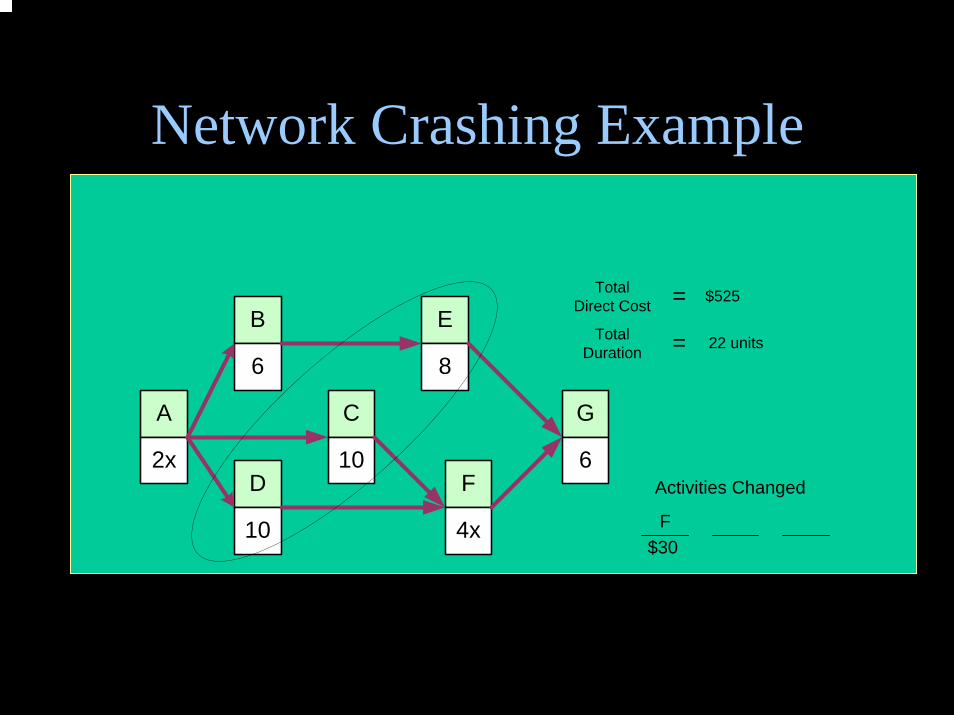
Network Crashing Example
A
2x
B
6
D
10
C
10
E
8
F
4x
G
6
TotalDirect Cost = $525
TotalDuration = 22 units
Activities Changed
F$30

Network Crashing Example
Network Crashing Example
Crashing Summary
• In planning, crashing can pull your project into the delivery window
• Once started, a late project can get pulled back in to schedule compliance
• Crashing can increase the size of the “critical core,” thereby reducing flexibility
• Capability in MS Project